Submitted:
17 October 2024
Posted:
18 October 2024
You are already at the latest version
Abstract
Background/Objectives: Mesenchymal Stem Cells (MSCs) possess the remarkable ability to dif-ferentiate into various cell types, including osteoblasts. Understanding the molecular mecha-nisms governing MSC osteogenic differentiation is crucial for advancing clinical applications and our comprehension of complex disease processes. However, the key biological molecules regu-lating this process remain incompletely understood, necessitating further investigation. Methods: In this study, we employed high-throughput transcriptomic sequencing to identify and validate key biological molecules that dynamically regulate MSC osteogenic differentiation. Our approach involved comprehensive analysis of gene expression patterns across human tissues, followed by rigorous experimental validation of identified candidates. Results: Through our integrated analytical and experimental approach, we pinpointed four critical regulators of MSC osteogenic differentiation: PTBP1, H2AFZ, BCL6, and TTPAL (C20ORF121). Notably, this study represents the first instance of utilizing high-throughput transcriptomics to uncover regulatory factors involved in MSC osteogenesis, marking a significant advancement in the field. Conclusions: Our findings substantially enhance our understanding of the molecular mechanisms determining MSC differentiation fate. This research holds significant implications for clinical ap-plications involving MSCs and provides valuable insights into complex disease processes. The identification of these key regulators opens new avenues for targeted interventions and therapies in bone-related disorders and regenerative medicine. Furthermore, this study establishes a robust framework for future investigations in stem cell biology, potentially leading to innovative ap-proaches in regenerative medicine.
Keywords:
1. Introduction
2. Materials and Methods
3. Results
3.1. Subsection
- 1.
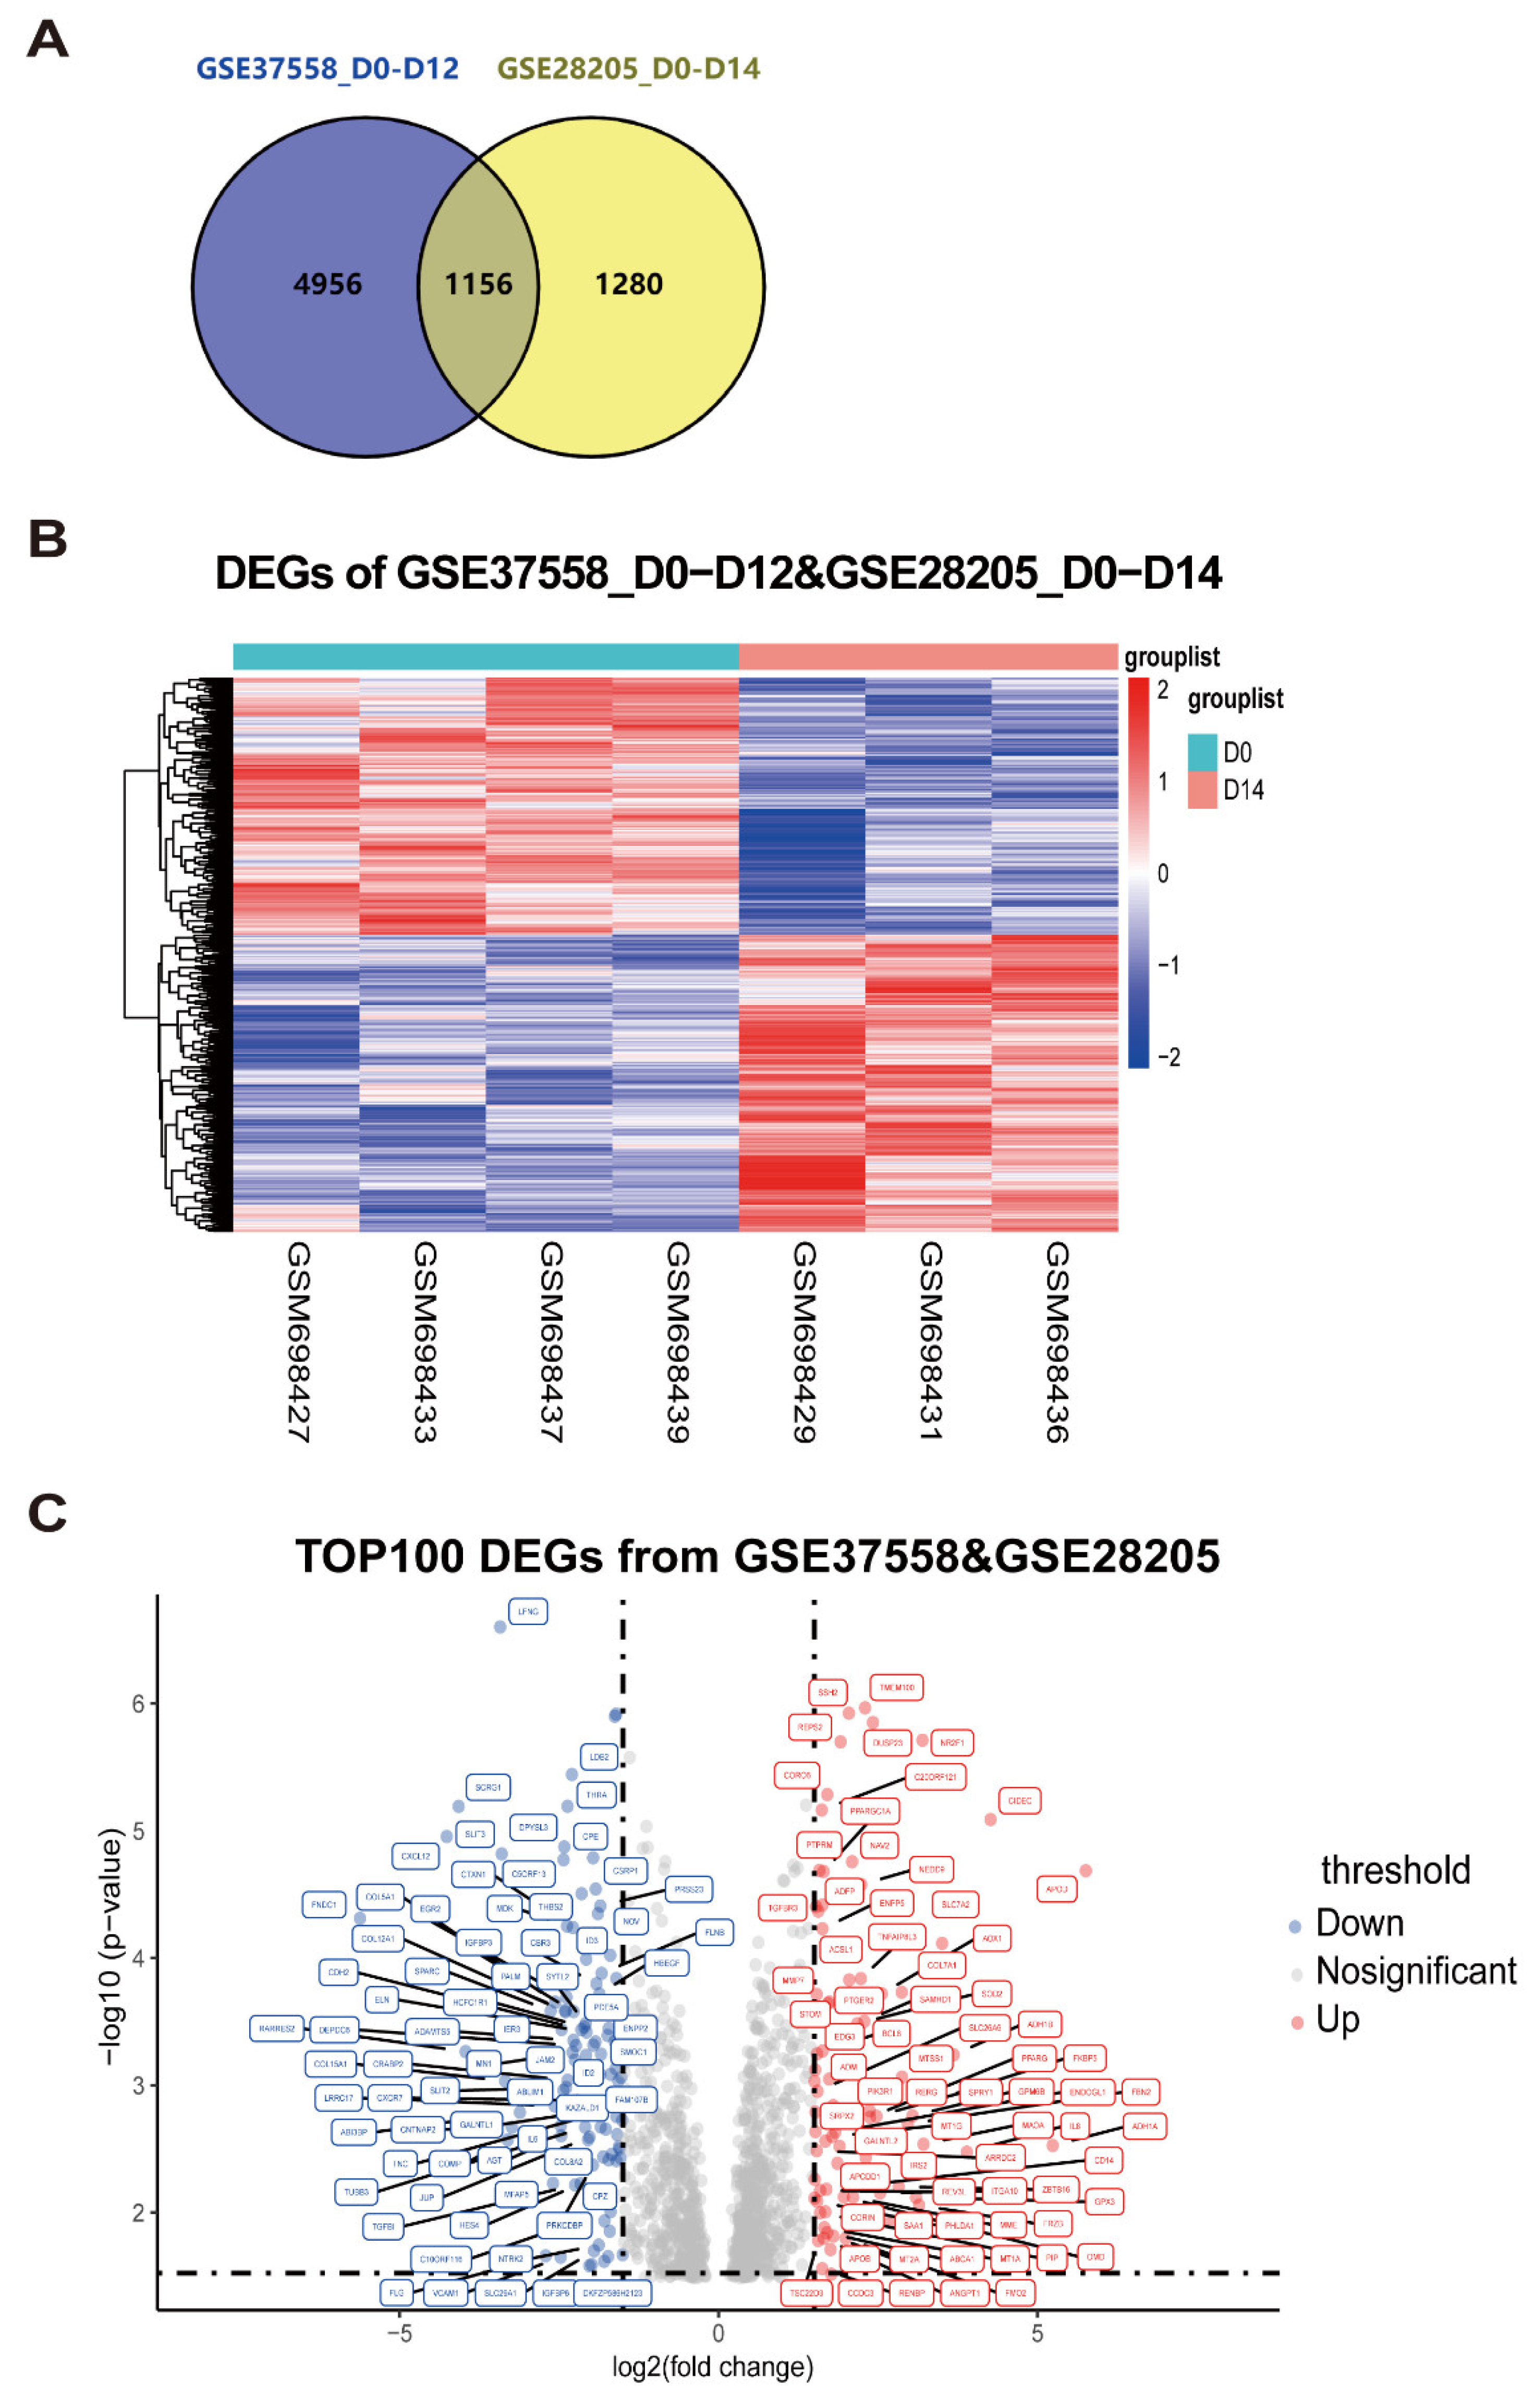
- Integration analysis of microarray datasets to identify differentially expressed genes in MSC osteogenic differentiation
- 2.
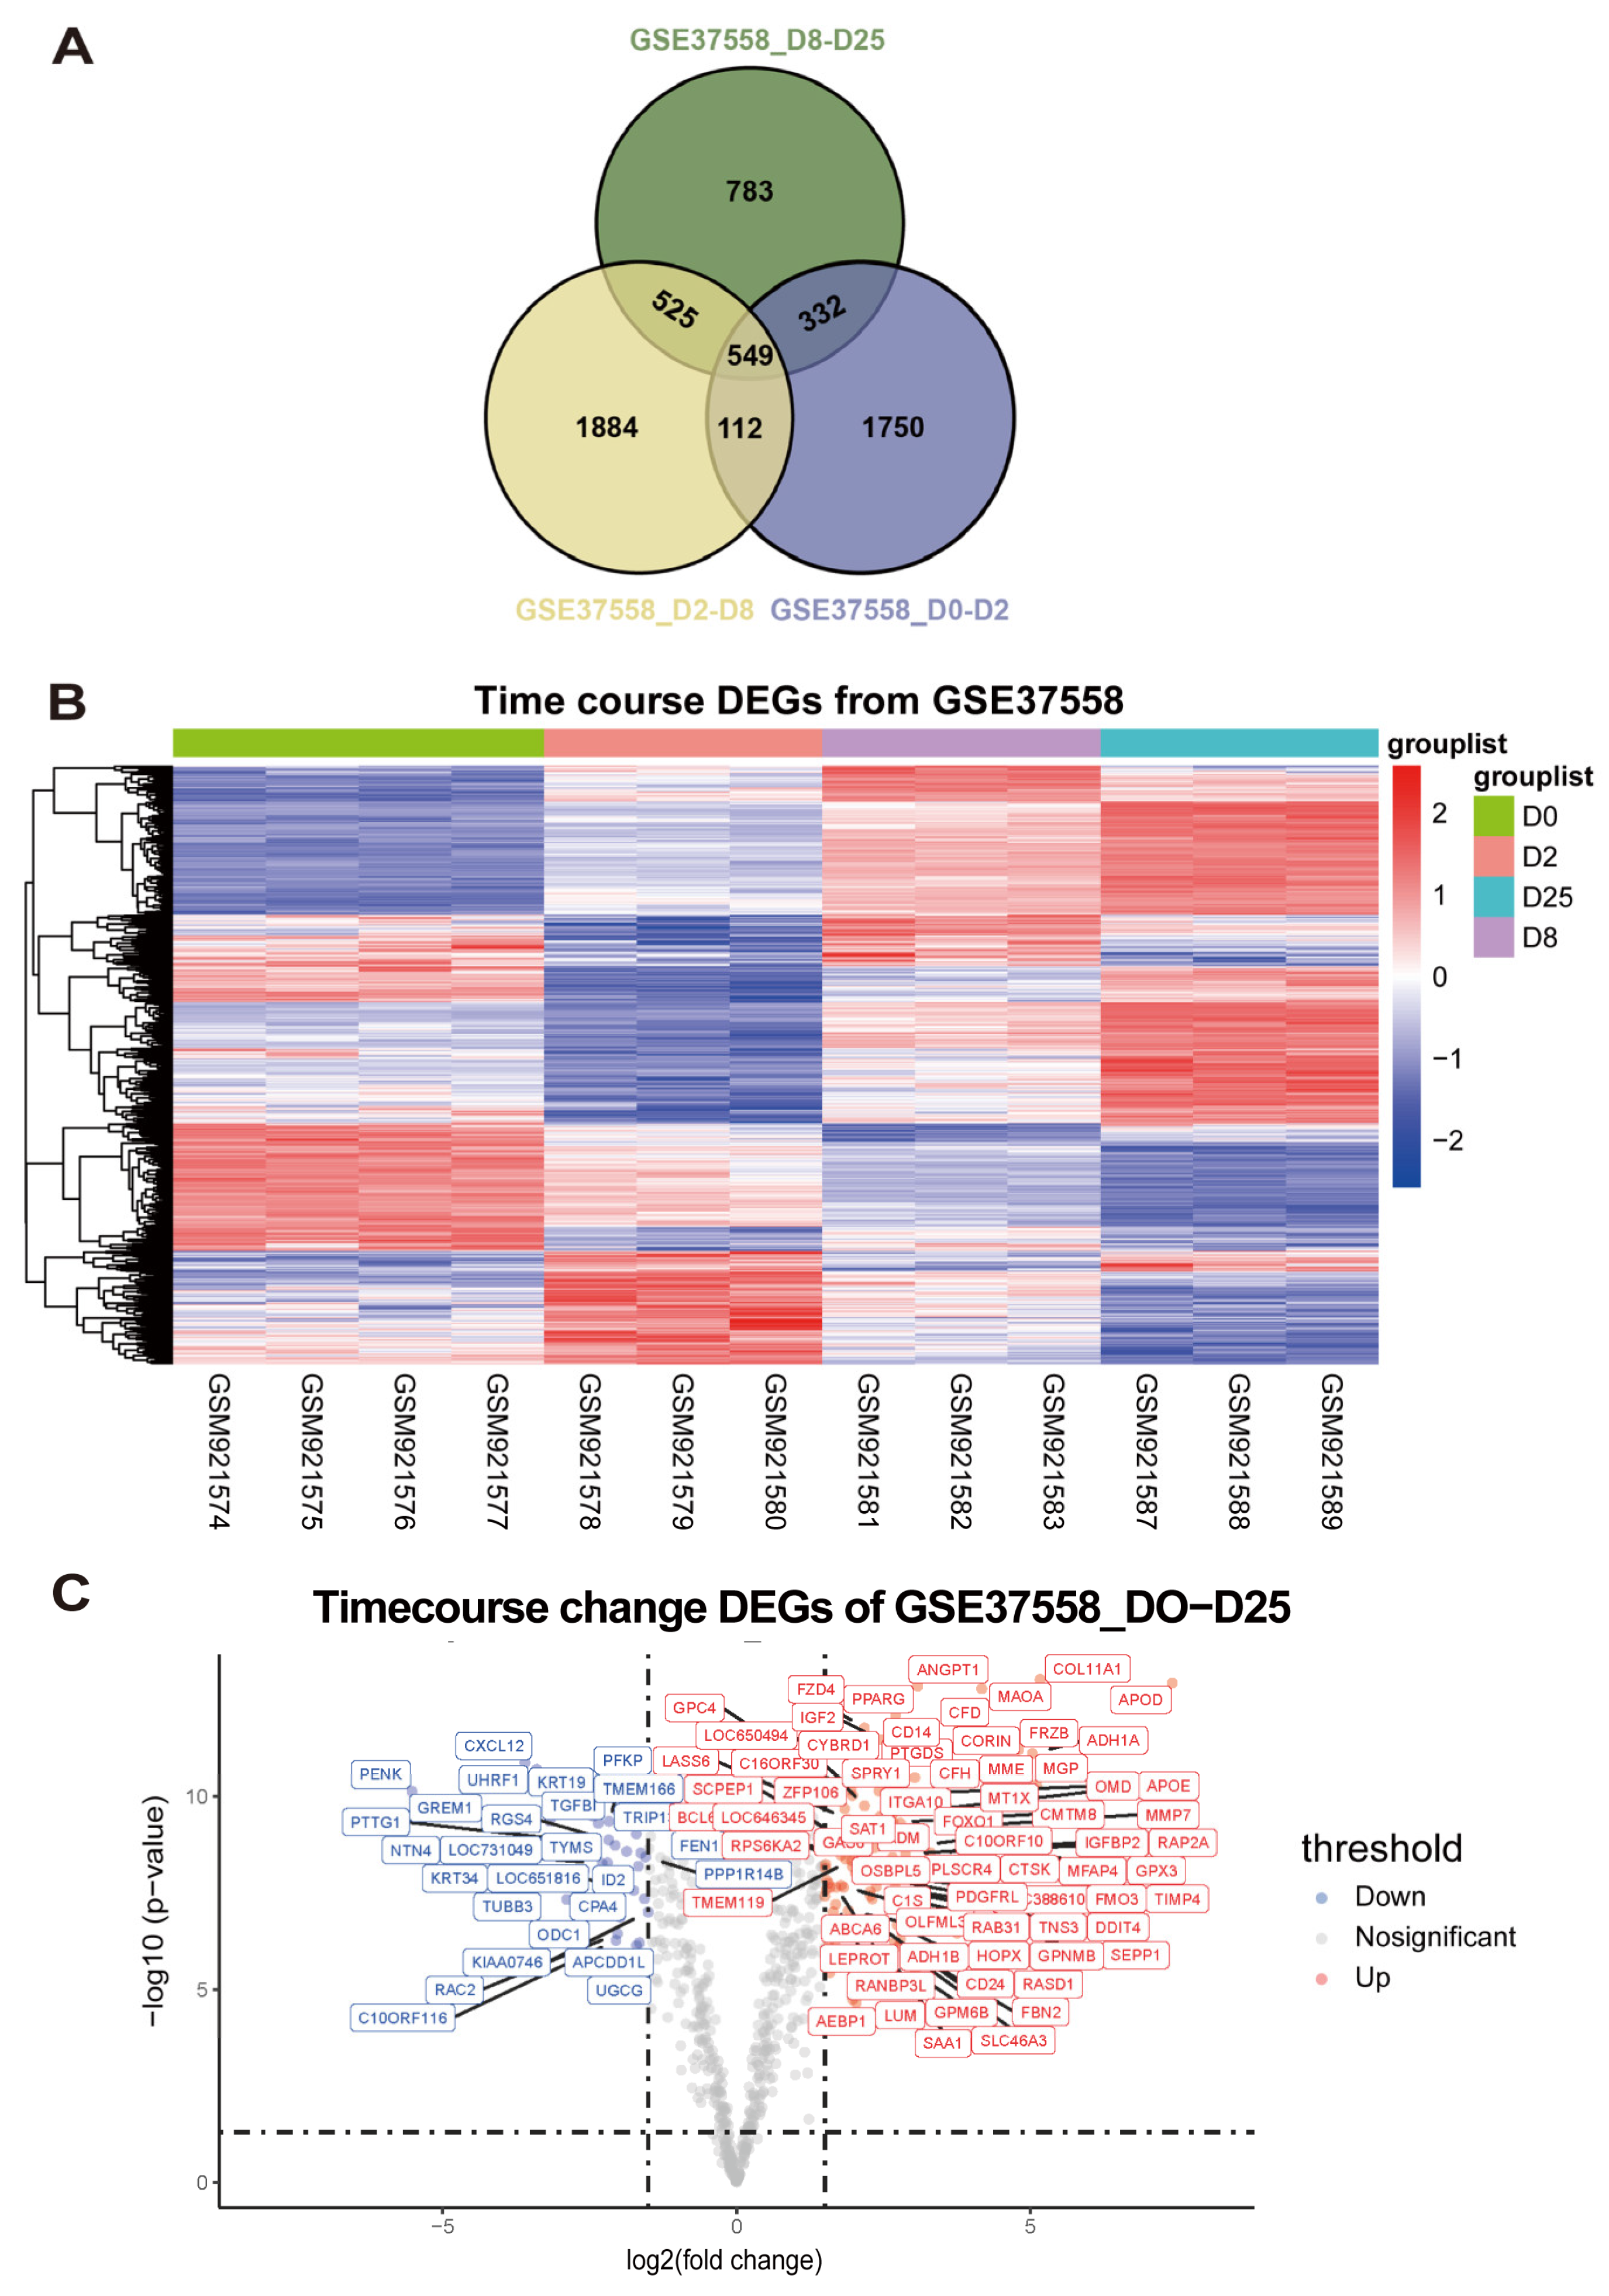
- Exploration of continuously differentially expressed genes during MSC osteogenic induction from GSE37558 dataset
- 3.
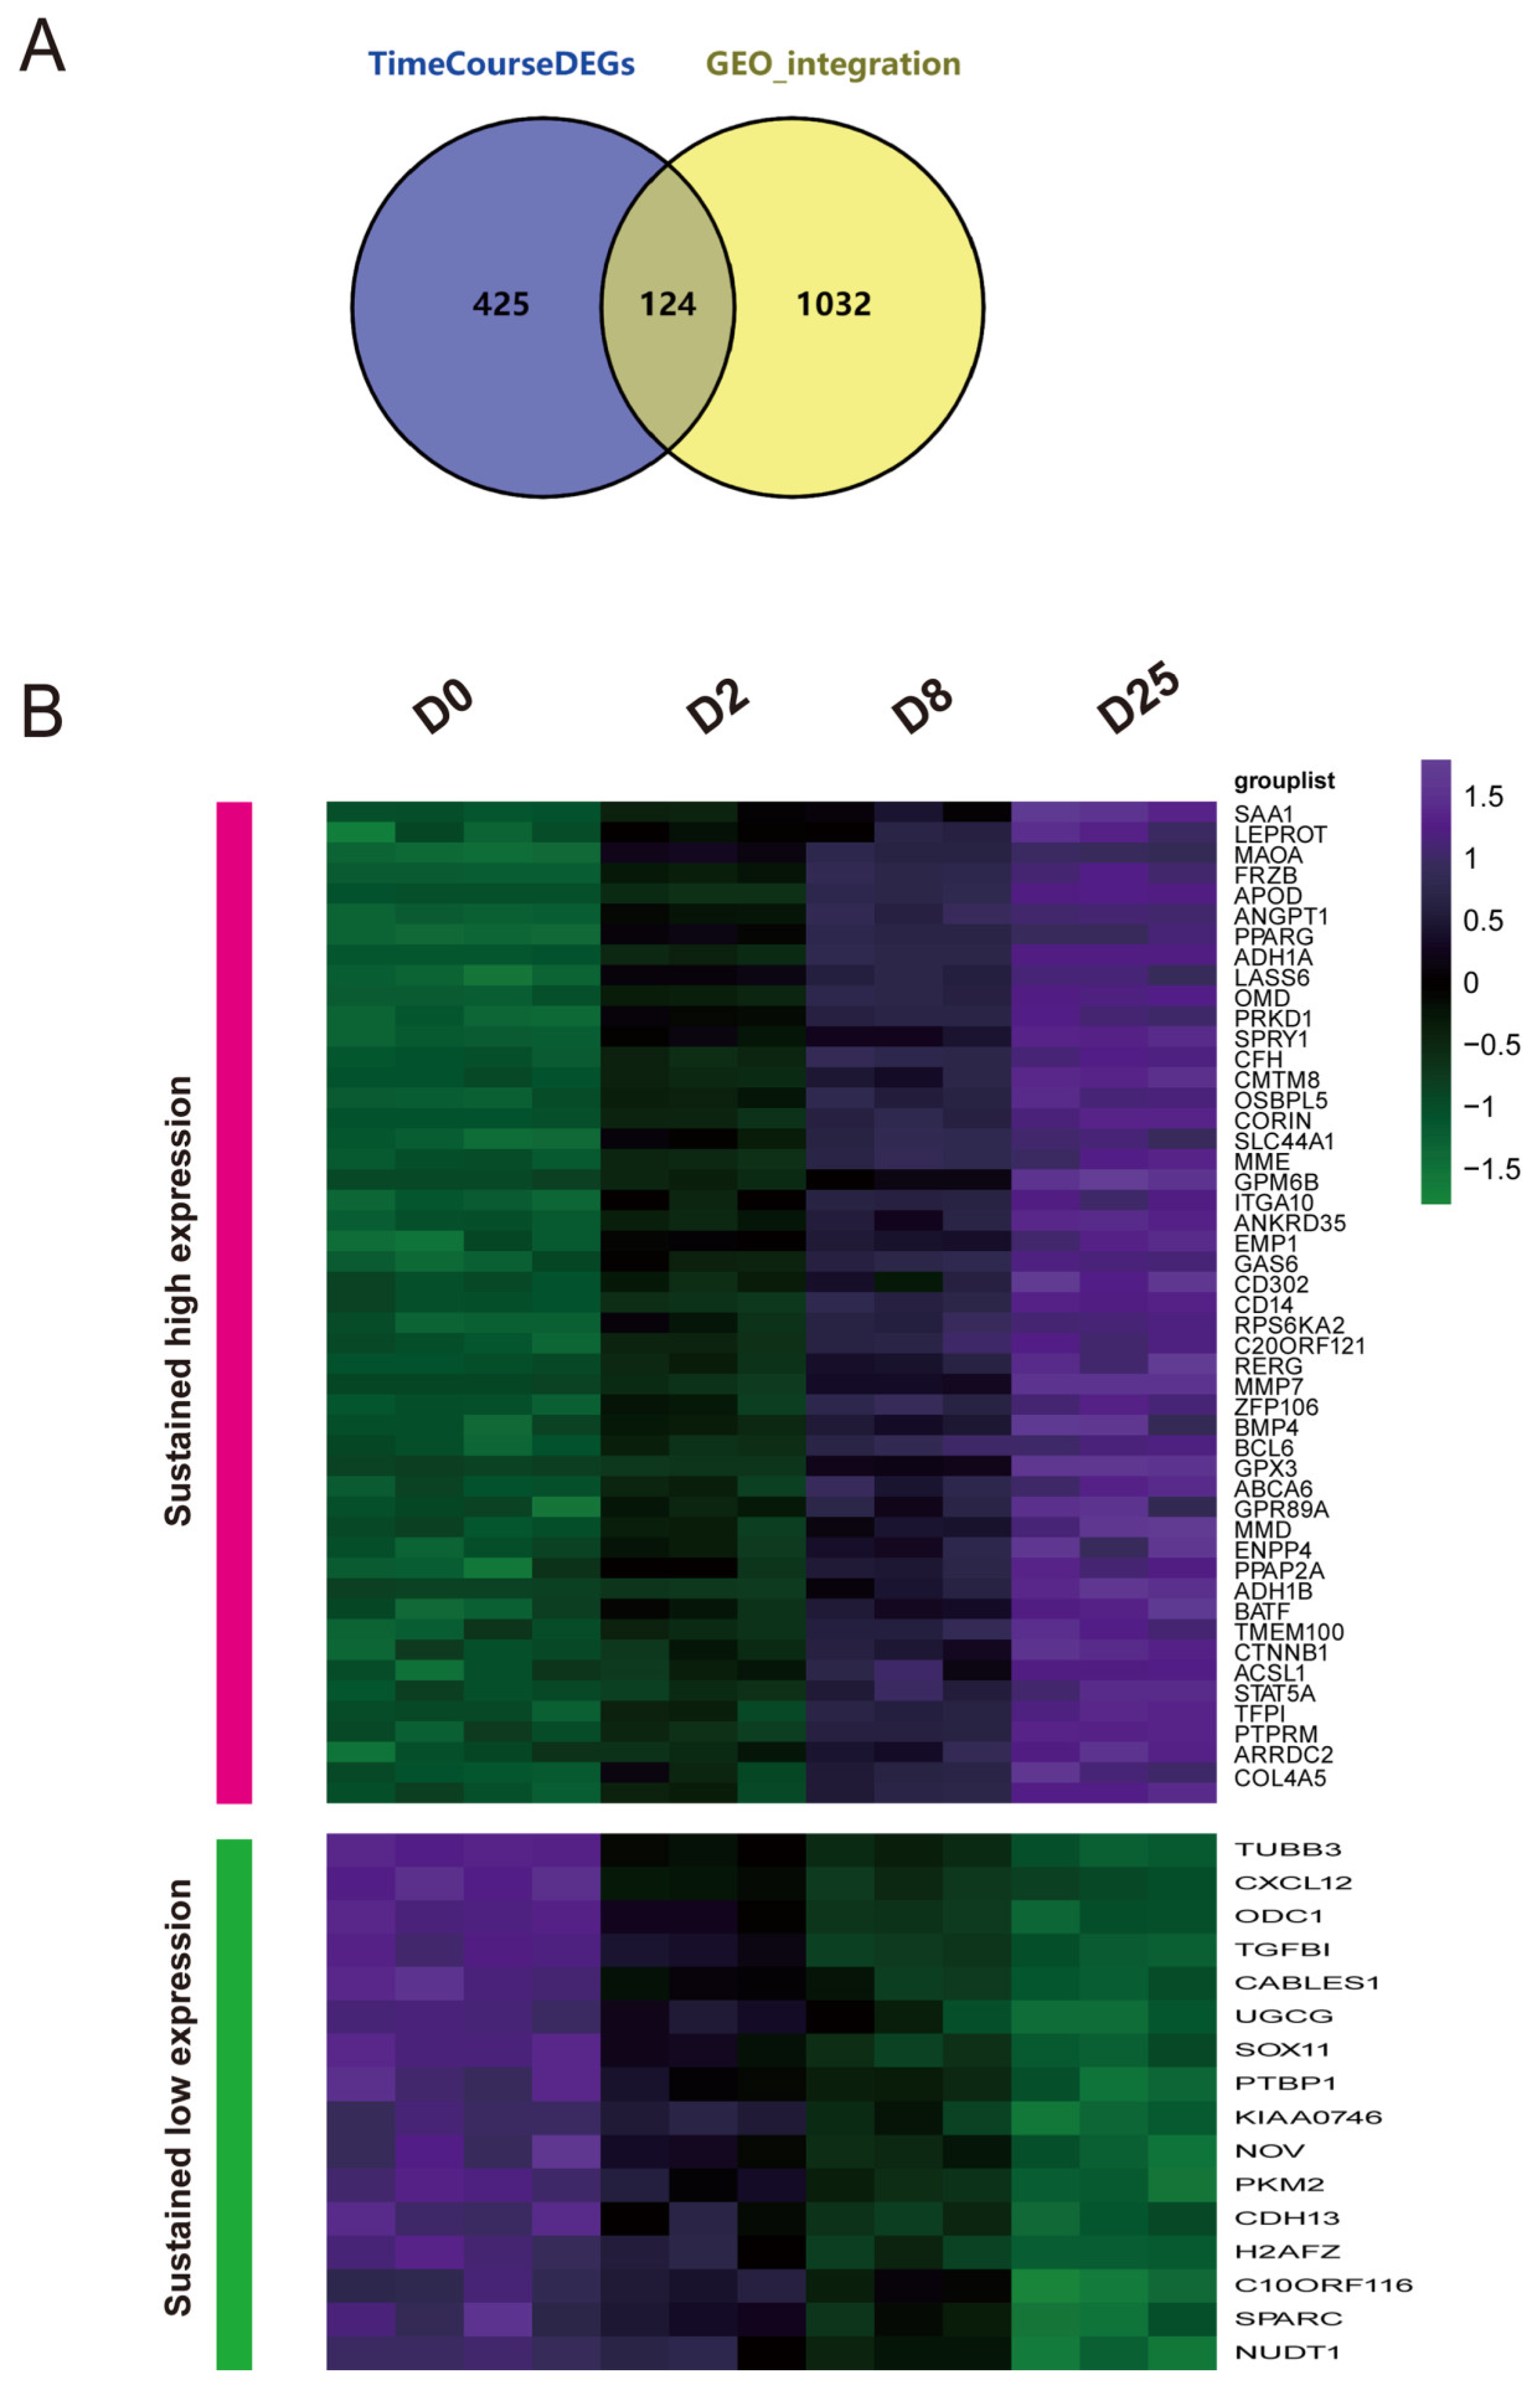
- Integrated time-course analysis of differentially expressed genes during MSC osteogenic induction
- 4.
- Identification of key regulators governing MSC osteogenic differentiation through the HUMAN PROTEIN ATLAS database
| Gene Name | Blood and immune system | Protein expressed in the database of THE HUMAN PROTEIN ALTAS | |||
| Bone marrow | Lymph node | Tonsil | Spleen | ||
| CXCL12 | High | Low | Low | Low | Bone marrow poietic cells showed strong nuclear positivity. |
| PTBP1 | High | High | High | medium | Most normal tissues displayed strong nuclear positivity. |
| PKM2 | Low | High | High | High | Cytoplasmic expression in most tissues, hepatocytes, neurons and most soft tissues were negative. |
| H2AFZ | High | High | medium | High | Ubiquitous nuclear expression. |
| NUDT1 | medium | High | High | medium | Most normal tissues showed moderate to strong cytoplasmic staining. |
| ANGPT1 | High | medium | medium | medium | Ubiquitous cytoplasmic expression. |
| PPAGR | low | not detected | High | low | Squamous epithelia, glandular cells in gastrointestinal tract, gall bladder, urinary bladder, placenta,epididymis showed moderate to strong nuclear positivity |
| MME | medium | Low | medium | High | B-lymphocytes, myoepithelium, stromal cells and some glandular epithelia displayed strong cytoplasmic positivity. |
| RPS6KA2 | medium | Low | High | medium | Most of the normal tissues displayed moderate nuclear and cytoplasmic positivity. |
| TTPAL | medium | High | High | High | Most normal tissues displayed moderate to strong cytoplasmic staining with a granular pattern. |
| BCL6 | High | High | High | medium | Nuclear expression, mainly in lymphoid tissues. |
| CTNNB1 | Low | not detected | High | not detected | Membranous expression was observed in most tissues. |
| STAT5A | medium | High | High | Low | Cytoplasmic and nuclear expression in a few tissues, most abundant in subsets of lymphoid cells. |
| Primer information | Primer sequence |
| Gapdh qPCR Forward Primer | TGGCCTTCCGTGTTCCTAC |
| Gapdh qPCR Reverse Primer | GAGTTGCTGTTGAAGTCGCA |
| Alpl qPCR Forward Primer | GGCTGGAGATGGACAAATTCC |
| Alpl qPCR Reverse Primer | CCGAGTGGTAGTCACAATGCC |
| Bglap qPCR Forward Primer | CTGACCTCACAGATGCCAAGC |
| Bglap qPCR Reverse Primer | TGGTCTGATAGCTCGTCACAAG |
| H2afz qPCR Forward Primer | CCAAGACAAAGGCGGTTTCC |
| H2afz qPCR Reverse Primer | TTTCAGGTGTCGATGAATACGG |
| Bcl6 qPCR Forward Primer | CCGGCACGCTAGTGATGTT |
| Bcl6 qPCR Reverse Primer | GCACTGTCTTATGGGCTCTAAAC |
| Ttpal qPCR Forward Primer | GGCCTCACTCTCCGAAAATGA |
| Ttpal qPCR Reverse Primer | CAGGTATGGGTACTCCTTCCG |
| Ptbp1 qPCR Forward Primer | GCAGGCTGTAAACTCCGTCC |
| Ptbp1 qPCR Reverse Primer | GGGTCACTGGGTAGAAAAGGTT |
- 5.
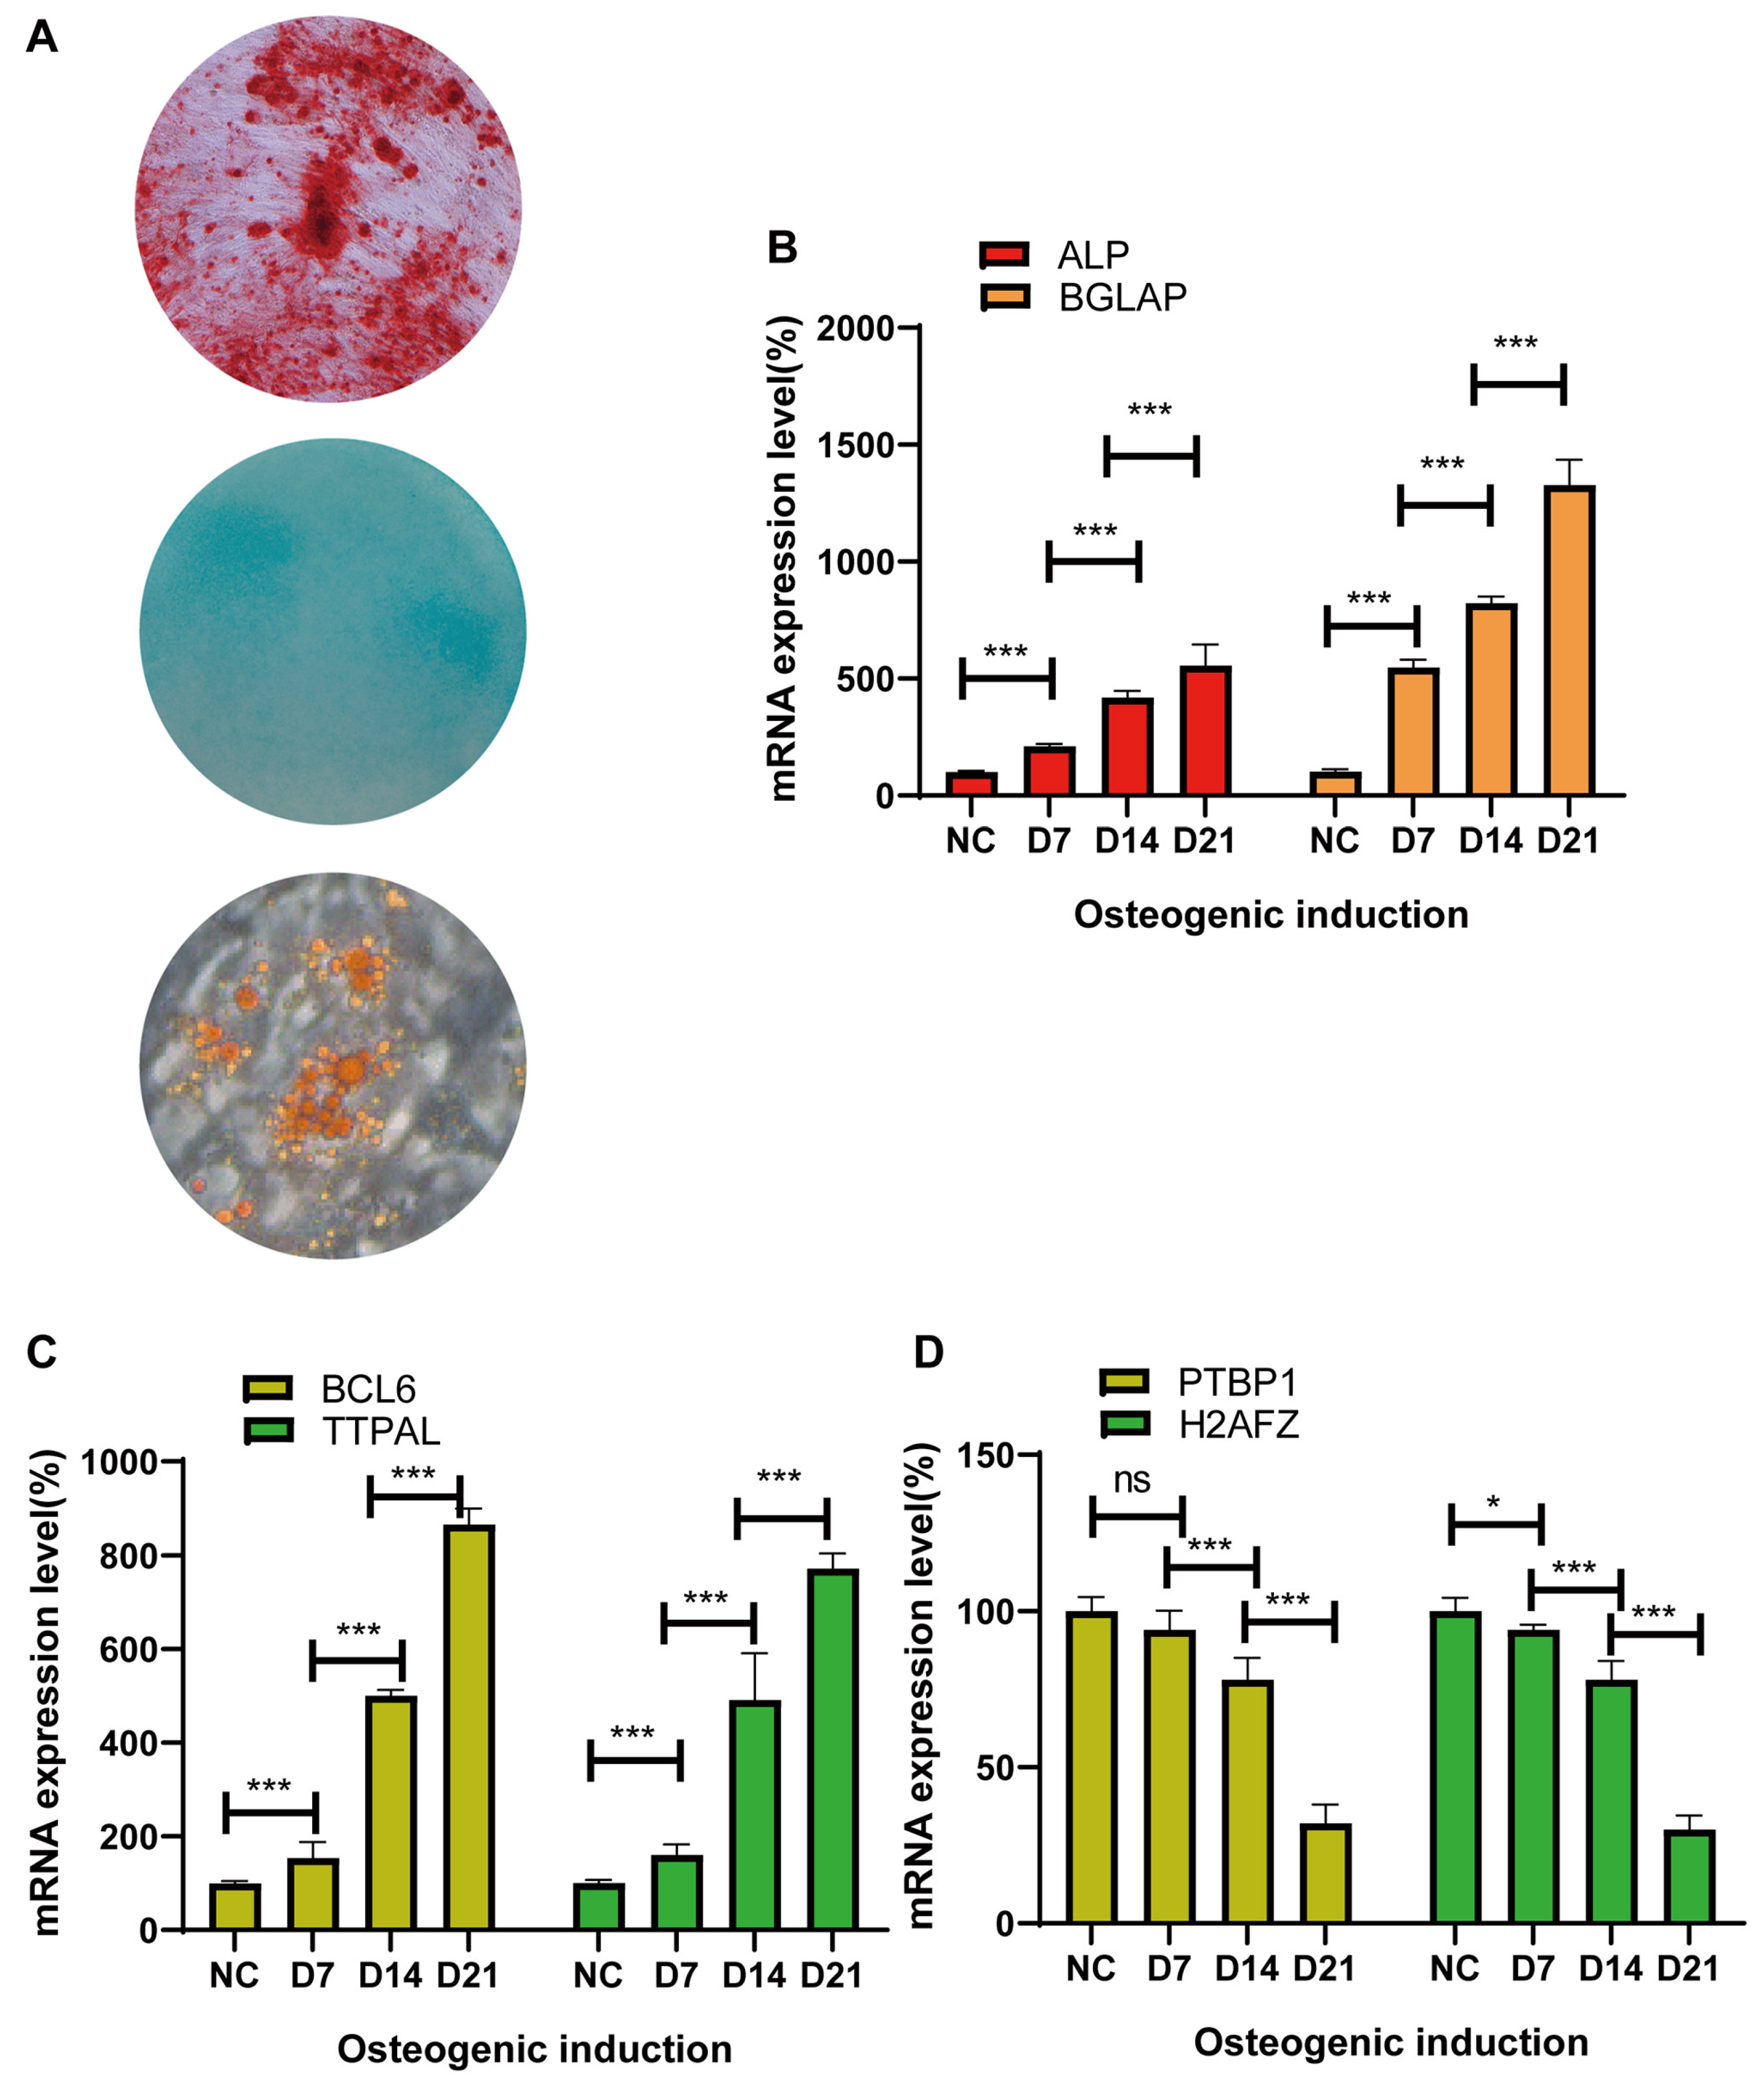
- Isolation of bone mesenchymal stem cells and qRT‒PCR identification of candidate genes during osteogenic induction
- 6.
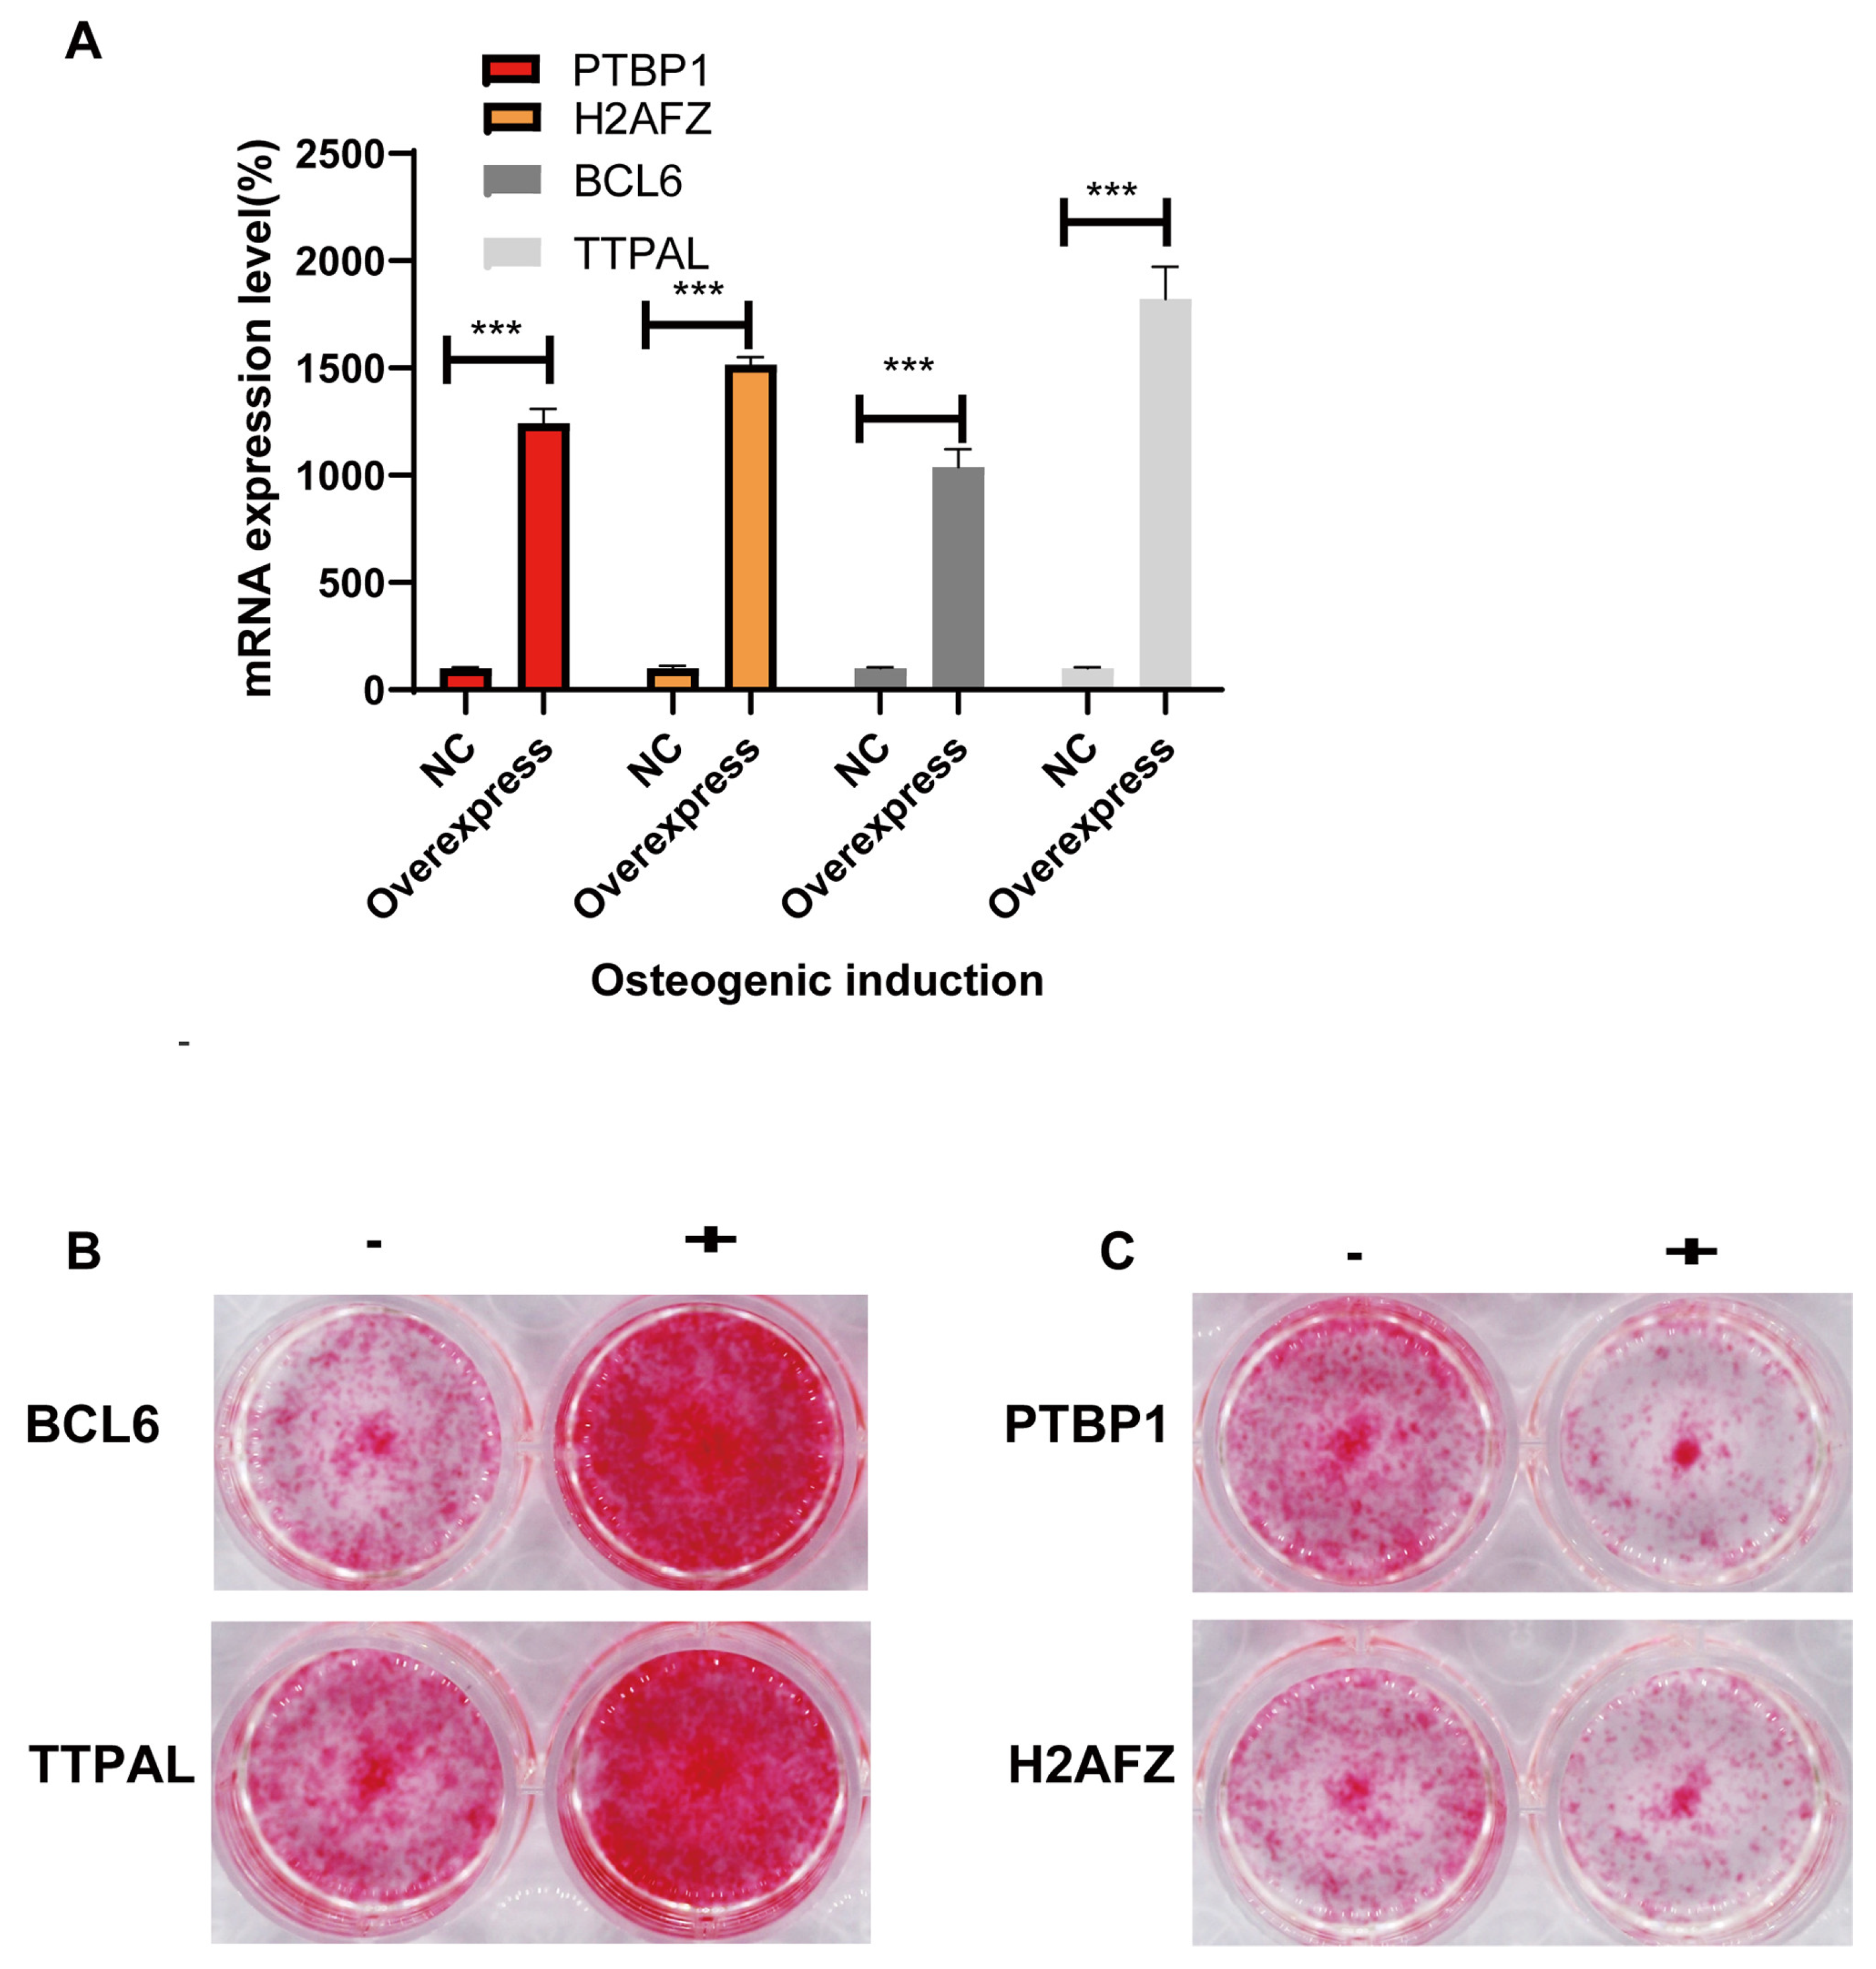
- Identifying the molecular function of osteogenic regulators in MSCs via lentiviral overexpression of candidate genes
4. Discussion
Supplementary Materials
Author Contributions
Funding
Institutional Review Board Statement
Informed Consent Statement
Data Availability Statement
Acknowledgments
Conflicts of Interest
Appendix A
Appendix B
References
- Yu H, Huang Y, Yang L. Research progress in the use of mesenchymal stem cells and their derived exosomes in the treatment of osteoarthritis. Ageing Res Rev. 2022;80:101684. [CrossRef]
- Zhang H, Xu R, Li B, Xin Z, Ling Z, Zhu W, et al. LncRNA NEAT1 controls the lineage fates of BMSCs during skeletal aging by impairing mitochondrial function and pluripotency maintenance. Cell Death Differ. 2022;29(2):351-65. [CrossRef]
- Han Y, Yang J, Fang J, Zhou Y, Candi E, Wang J, et al. The secretion profile of mesenchymal stem cells and potential applications in treating human diseases. Signal Transduct Target Ther. 2022;7(1):92. [CrossRef]
- Wang Y, Fang J, Liu B, Shao C, Shi Y. Reciprocal regulation of mesenchymal stem cells and immune responses. Cell Stem Cell. 2022;29(11):1515-30. [CrossRef]
- Jiang Z, Li N, Shao Q, Zhu D, Feng Y, Wang Y, et al. Light-controlled scaffold- and serum-free hard palatal-derived mesenchymal stem cell aggregates for bone regeneration. Bioeng Transl Med. 2023;8(1):e10334.
- Li P, Gong Z, Shultz LD, Ren G. Mesenchymal stem cells: From regeneration to cancer. Pharmacol Ther. 2019;200:42-54. [CrossRef]
- Hoang DM, Pham PT, Bach TQ, Ngo ATL, Nguyen QT, Phan TTK, et al. Stem cell-based therapy for human diseases. Signal Transduct Target Ther. 2022;7(1):272. [CrossRef]
- Zhang L, Ma XJ, Fei YY, Han HT, Xu J, Cheng L, et al. Stem cell therapy in liver regeneration: Focus on mesenchymal stem cells and induced pluripotent stem cells. Pharmacol Ther. 2022;232:108004. [CrossRef]
- Song N, Scholtemeijer M, Shah K. Mesenchymal Stem Cell Immunomodulation: Mechanisms and Therapeutic Potential. Trends Pharmacol Sci. 2020;41(9):653-64. [CrossRef]
- Kim P, Park J, Lee DJ, Mizuno S, Shinohara M, Hong CP, et al. Mast4 determines the cell fate of MSCs for bone and cartilage development. Nat Commun. 2022;13(1):3960. [CrossRef]
- Deng P, Yuan Q, Cheng Y, Li J, Liu Z, Liu Y, et al. Loss of KDM4B exacerbates bone-fat imbalance and mesenchymal stem cell exhaustion in skeletal aging. Cell Stem Cell. 2021;28(6):1057-73.e7.
- Liu F, Yuan Y, Bai L, Yuan L, Li L, Liu J, et al. LRRc17 controls BMSC senescence via mitophagy and inhibits the therapeutic effect of BMSCs on ovariectomy-induced bone loss. Redox Biol. 2021;43:101963. [CrossRef]
- Li CJ, Xiao Y, Yang M, Su T, Sun X, Guo Q, et al. Long noncoding RNA Bmncr regulates mesenchymal stem cell fate during skeletal aging. J Clin Invest. 2018;128(12):5251-66. [CrossRef]
- Li W, Feng W, Su X, Luo D, Li Z, Zhou Y, et al. SIRT6 protects vascular smooth muscle cells from osteogenic transdifferentiation via Runx2 in chronic kidney disease. J Clin Invest. 2022;132(1). [CrossRef]
- Xing W, Godwin C, Pourteymoor S, Mohan S. Conditional disruption of the osterix gene in chondrocytes during early postnatal growth impairs secondary ossification in the mouse tibial epiphysis. Bone Res. 2019;7:24. [CrossRef]
- Yoshida G, Kawabata T, Takamatsu H, Saita S, Nakamura S, Nishikawa K, et al. Degradation of the NOTCH intracellular domain by elevated autophagy in osteoblasts promotes osteoblast differentiation and alleviates osteoporosis. Autophagy. 2022;18(10):2323-32. [CrossRef]
- Liu ZZ, Hong CG, Hu WB, Chen ML, Duan R, Li HM, et al. Autophagy receptor OPTN (optineurin) regulates mesenchymal stem cell fate and bone-fat balance during aging by clearing FABP3. Autophagy. 2021;17(10):2766-82. [CrossRef]
- Zhang Y, Lin D, Zheng Y, Chen Y, Yu M, Cui D, et al. MiR-9-1 controls osteoblastic regulation of lymphopoiesis. Leukemia. 2023.
- Lee KS, Lee J, Kim HK, Yeom SH, Woo CH, Jung YJ, et al. Extracellular vesicles from adipose tissue-derived stem cells alleviate osteoporosis through osteoprotegerin and miR-21-5p. J Extracell Vesicles. 2021;10(12):e12152. [CrossRef]
- Lim J, Heo J, Ju H, Shin JW, Kim Y, Lee S, et al. Glutathione dynamics determine the therapeutic efficacy of mesenchymal stem cells for graft-versus-host disease via CREB1-NRF2 pathway. Sci Adv. 2020;6(16):eaba1334. [CrossRef]
- Soliman H, Theret M, Scott W, Hill L, Underhill TM, Hinz B, et al. Multipotent stem cells: One name, multiple identities. Cell Stem Cell. 2021;28(10):1690-707.
- Zong C, Meng Y, Ye F, Yang X, Li R, Jiang J, et al. AIF1 + CSF1R + MSCs, induced by TNF-α, act to generate an inflammatory microenvironment and promote hepatocarcinogenesis. Hepatology. 2023;78(2):434-51. [CrossRef]
- Tsai JN, Lee H, David NL, Eastell R, Leder BZ. Combination denosumab and high dose teriparatide for postmenopausal osteoporosis (DATA-HD): a randomised, controlled phase 4 trial. Lancet Diabetes Endocrinol. 2019;7(10):767-75. [CrossRef]
- Wang Y, Deng P, Liu Y, Wu Y, Chen Y, Guo Y, et al. Alpha-ketoglutarate ameliorates age-related osteoporosis via regulating histone methylations. Nat Commun. 2020;11(1):5596. [CrossRef]
- Cai W, Zhang J, Yu Y, Ni Y, Wei Y, Cheng Y, et al. Mitochondrial Transfer Regulates Cell Fate Through Metabolic Remodeling in Osteoporosis. Adv Sci (Weinh). 2023;10(4):e2204871. [CrossRef]
- Gong Y, Li Z, Zou S, Deng D, Lai P, Hu H, et al. Vangl2 limits chaperone-mediated autophagy to balance osteogenic differentiation in mesenchymal stem cells. Dev Cell. 2021;56(14):2103-20.e9. [CrossRef]
- Tsukasaki M, Takayanagi H. Osteoimmunology: evolving concepts in bone-immune interactions in health and disease. Nat Rev Immunol. 2019;19(10):626-42. [CrossRef]
- Hochmann S, Ou K, Poupardin R, Mittermeir M, Textor M, Ali S, et al. The enhancer landscape predetermines the skeletal regeneration capacity of stromal cells. Sci Transl Med. 2023;15(688):eabm7477. [CrossRef]
- Mo C, Guo J, Qin J, Zhang X, Sun Y, Wei H, et al. Single-cell transcriptomics of LepR-positive skeletal cells reveals heterogeneous stress-dependent stem and progenitor pools. Embo j. 2022;41(4):e108415.
- Guo Y, Jia X, Cui Y, Song Y, Wang S, Geng Y, et al. Sirt3-mediated mitophagy regulates AGEs-induced BMSCs senescence and senile osteoporosis. Redox Biol. 2021;41:101915. [CrossRef]
- Jiao D, Zheng A, Liu Y, Zhang X, Wang X, Wu J, et al. Bidirectional differentiation of BMSCs induced by a biomimetic procallus based on a gelatin-reduced graphene oxide reinforced hydrogel for rapid bone regeneration. Bioact Mater. 2021;6(7):2011-28. [CrossRef]
- Zhang P, Dong J, Fan X, Yong J, Yang M, Liu Y, et al. Characterization of mesenchymal stem cells in human fetal bone marrow by single-cell transcriptomic and functional analysis. Signal Transduct Target Ther. 2023;8(1):126. [CrossRef]
- Cui J, Shibata Y, Zhu T, Zhou J, Zhang J. Osteocytes in bone aging: Advances, challenges, and future perspectives. Ageing Res Rev. 2022;77:101608. [CrossRef]
- Delgado-Calle J, Bellido T. The osteocyte as a signaling cell. Physiol Rev. 2022;102(1):379-410. [CrossRef]
- Sjöstedt E, Zhong W, Fagerberg L, Karlsson M, Mitsios N, Adori C, et al. An atlas of the protein-coding genes in the human, pig, and mouse brain. Science. 2020;367(6482).
- Cherubini A, Barilani M, Rossi RL, Jalal MMK, Rusconi F, Buono G, et al. FOXP1 circular RNA sustains mesenchymal stem cell identity via microRNA inhibition. Nucleic Acids Res. 2019;47(10):5325-40. [CrossRef]
- Yang M, Miao YR, Xie GY, Luo M, Hu H, Kwok HF, et al. ICBatlas: A Comprehensive Resource for Depicting Immune Checkpoint Blockade Therapy Characteristics from Transcriptome Profiles. Cancer Immunol Res. 2022;10(11):1398-406.
- Ma Q, Xu D. Deep learning shapes single-cell data analysis. Nat Rev Mol Cell Biol. 2022;23(5):303-4. [CrossRef]
- Gao Y, Chi Y, Chen Y, Wang W, Li H, Zheng W, et al. Multi-omics analysis of human mesenchymal stem cells shows cell aging that alters immunomodulatory activity through the downregulation of PD-L1. Nat Commun. 2023;14(1):4373. [CrossRef]
- Deng C, Dong K, Liu Y, Chen K, Min C, Cao Z, et al. Hypoxic mesenchymal stem cell-derived exosomes promote the survival of skin flaps after ischaemia-reperfusion injury via mTOR/ULK1/FUNDC1 pathways. J Nanobiotechnology. 2023;21(1):340.
Disclaimer/Publisher’s Note: The statements, opinions and data contained in all publications are solely those of the individual author(s) and contributor(s) and not of MDPI and/or the editor(s). MDPI and/or the editor(s) disclaim responsibility for any injury to people or property resulting from any ideas, methods, instructions or products referred to in the content. |
© 2024 by the authors. Licensee MDPI, Basel, Switzerland. This article is an open access article distributed under the terms and conditions of the Creative Commons Attribution (CC BY) license (http://creativecommons.org/licenses/by/4.0/).


