Submitted:
17 October 2024
Posted:
21 October 2024
You are already at the latest version
Abstract
Keywords:
1. Introduction
- Performing a rigorous comparative analysis of the critical previous studies and surveys in Non-Destructive Testing (NDT) of welds while presenting the current landscape and highlighting the advancements in the NDT.
- Presenting an in-depth examination of a novel paradigm about incorporating artificial intelligence (AI) assistive X-ray imaging in the NDT of welds. Establishing a solid research foundation through exploring X-ray imaging of weld defects datasets and investigating image processing, feature extraction, and AI techniques provides a comprehensive understanding of available data and processing methods.
- Summarizing the practical exploration of AI-Assistive X-ray imaging in various industrial sectors, going beyond theoretical discussions.
2. Welds Defects and Non-Destructive Testing
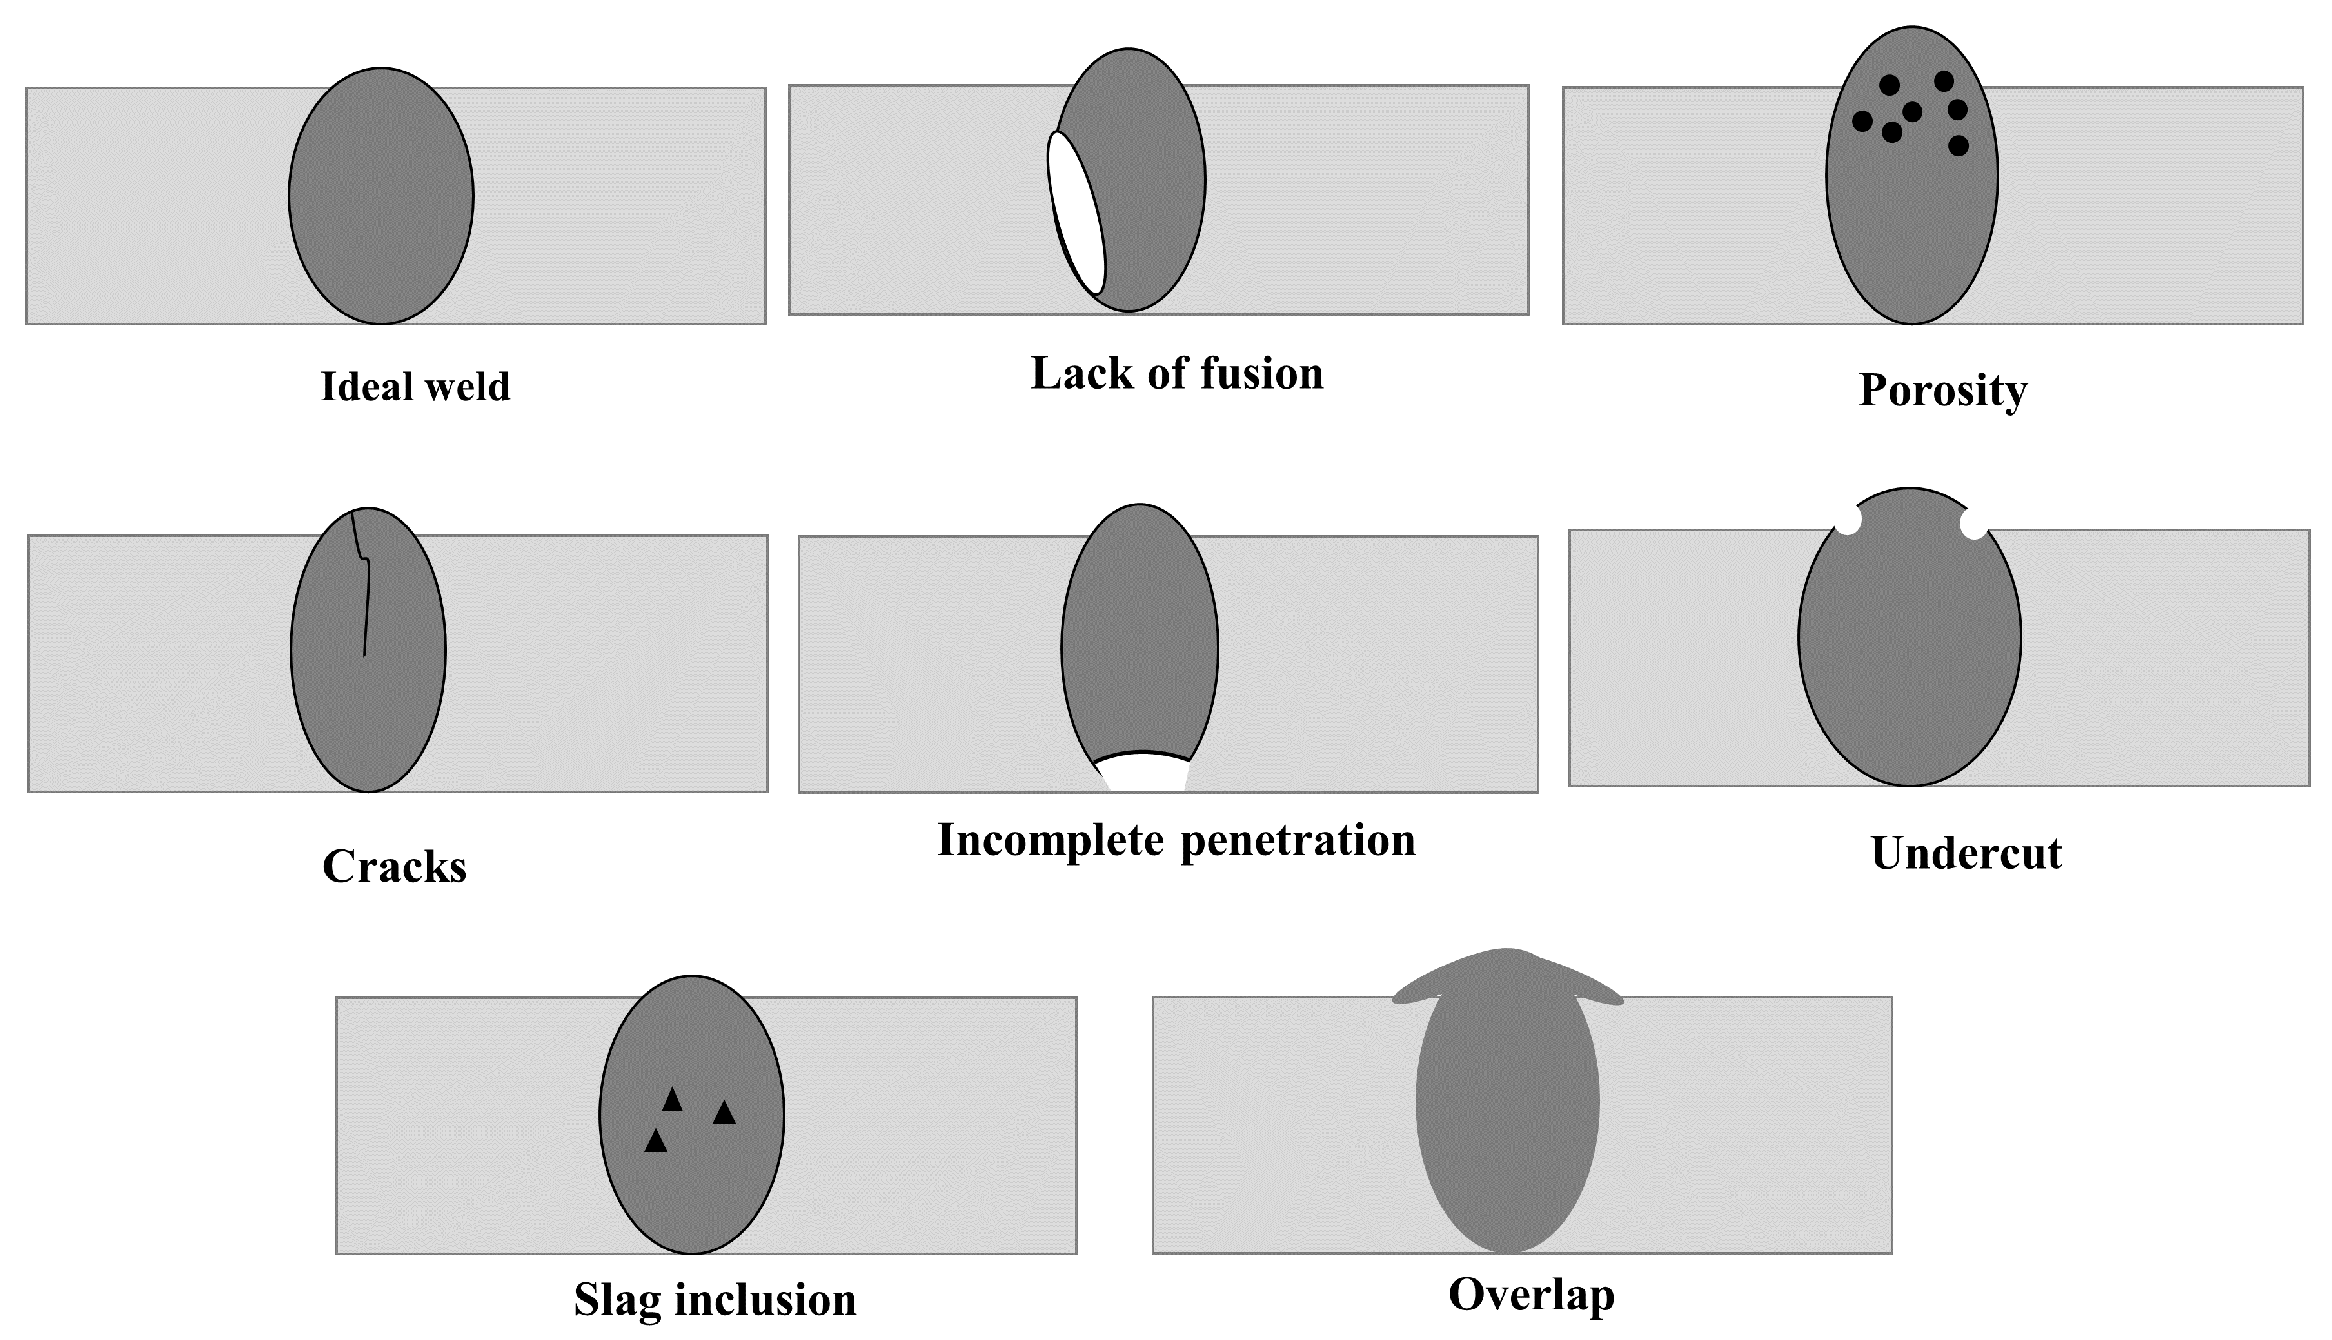
2.1. Welds Defects Categories
2.2. Non-Destructive Testing Methods
-
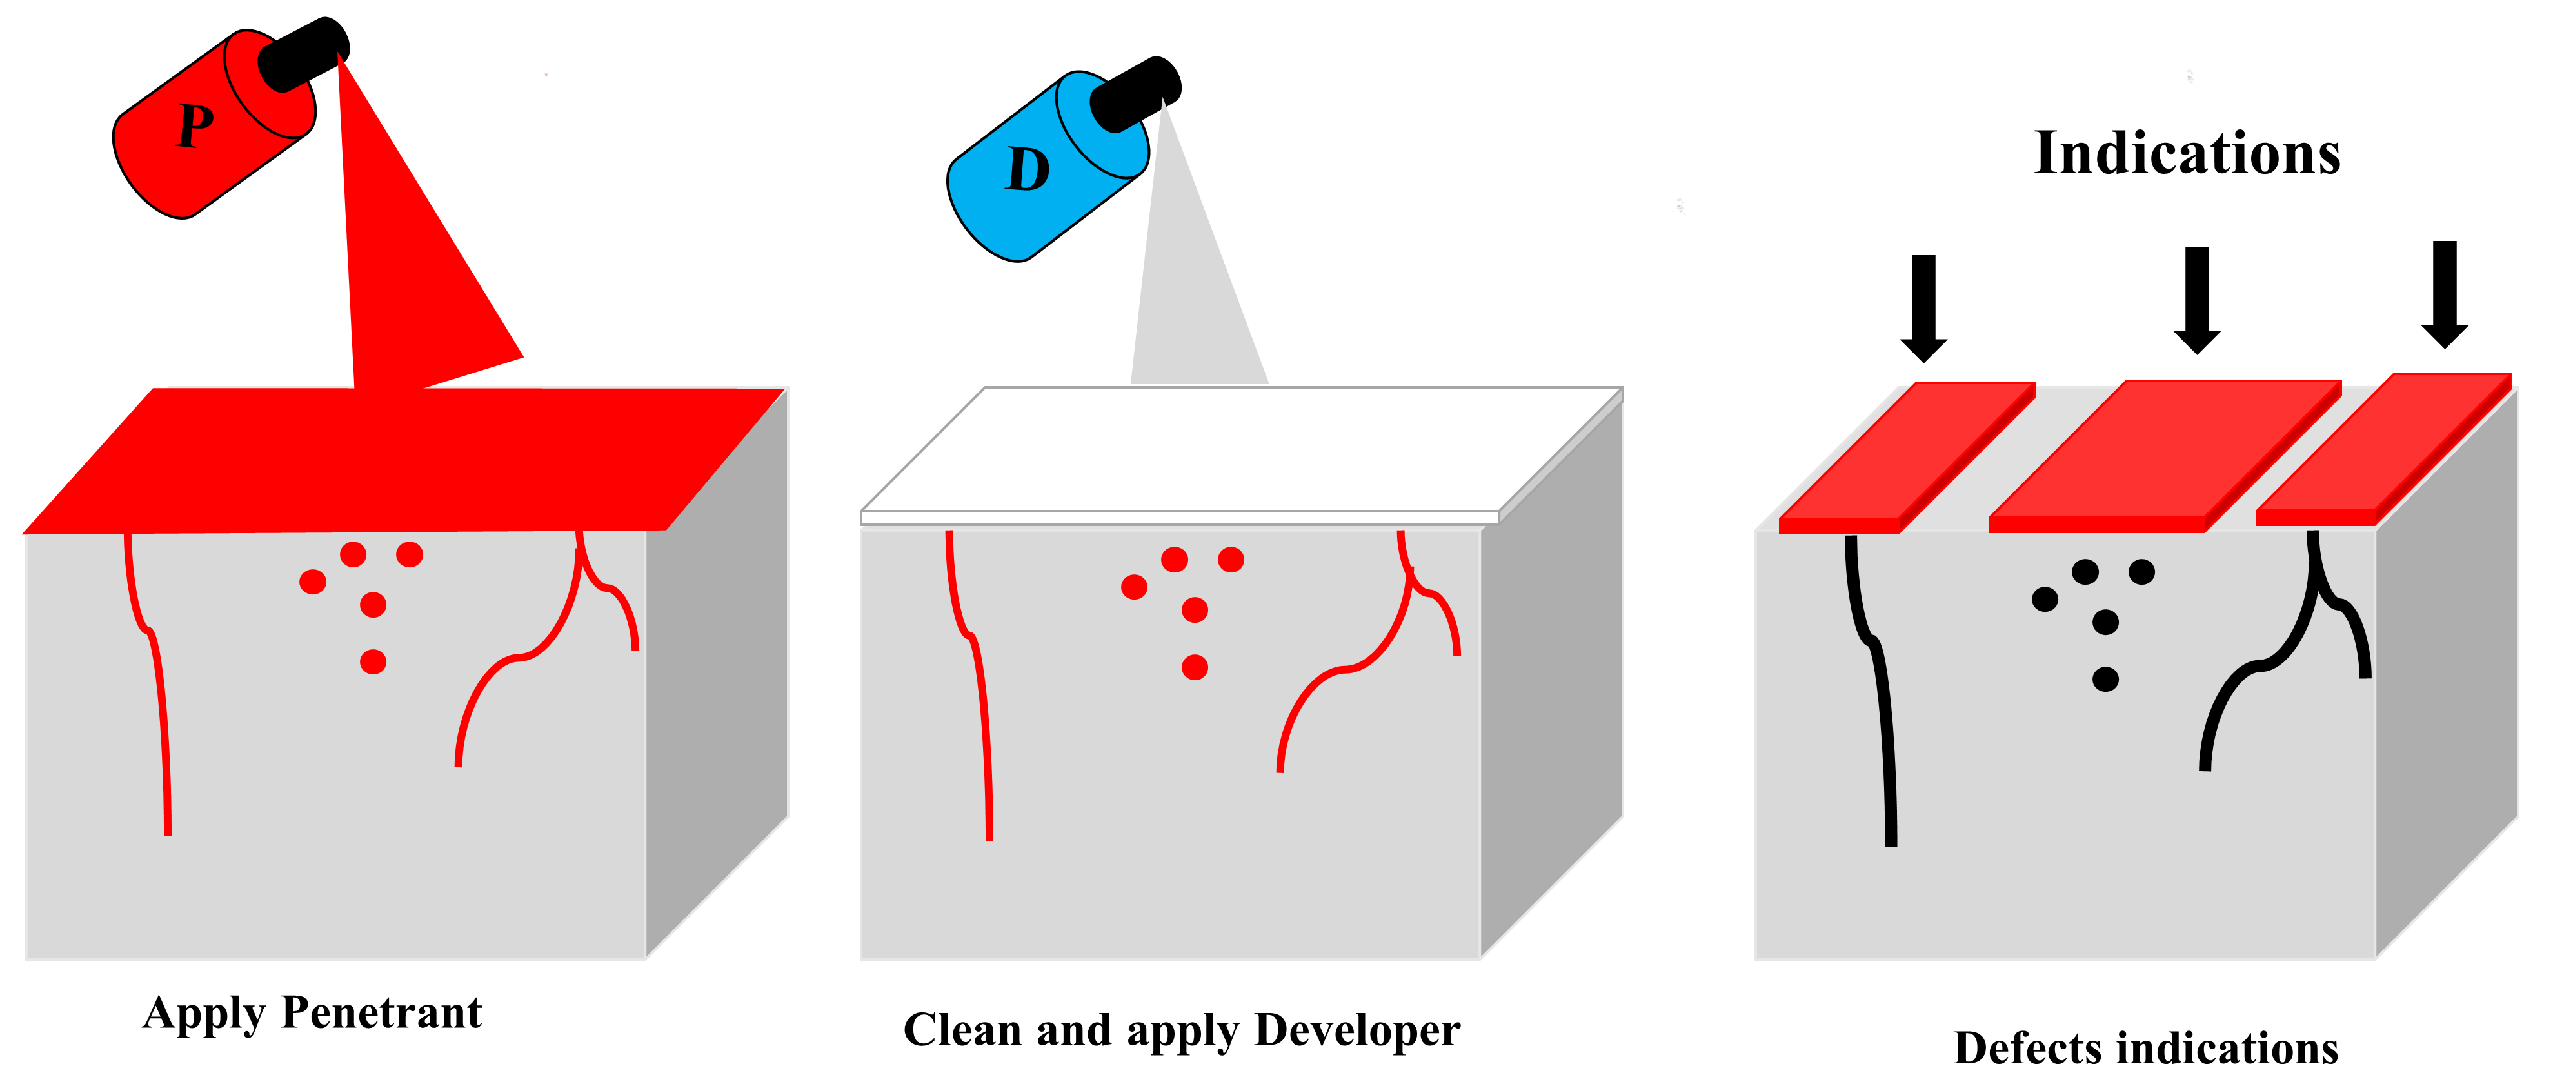
Visual inspection method: Visual inspection (VT) identifies visible defects such as undercuts, slag inclusions, blowholes, surface cracks, and porosity. Conducted systematically by experienced inspectors, the process is enhanced with visible or fluorescent liquid penetrants for rapid, non-destructive defect identification [26]. Implemented through a methodical three-step process, it contributes significantly to comprehensive quality assurance across multiple industries, the results of which are compared to standards to ensure compliance with quality and safety benchmarks:
- -
- Penetrant Application: Penetrant is applied evenly to the entire surface to be inspected, ensuring complete coverage.
- -
- Cleaning: Excess penetrant is meticulously cleaned from the surface to prevent misleading indications during the inspection.
- -
- Developer Application: involves a developer’s application that pulls the penetrant out of potential defects and creates visible indications. During inspection, the surface is thoroughly examined for these indications, allowing the size, shape, and location to be assessed. The methodology is illustrated in Figure 2.
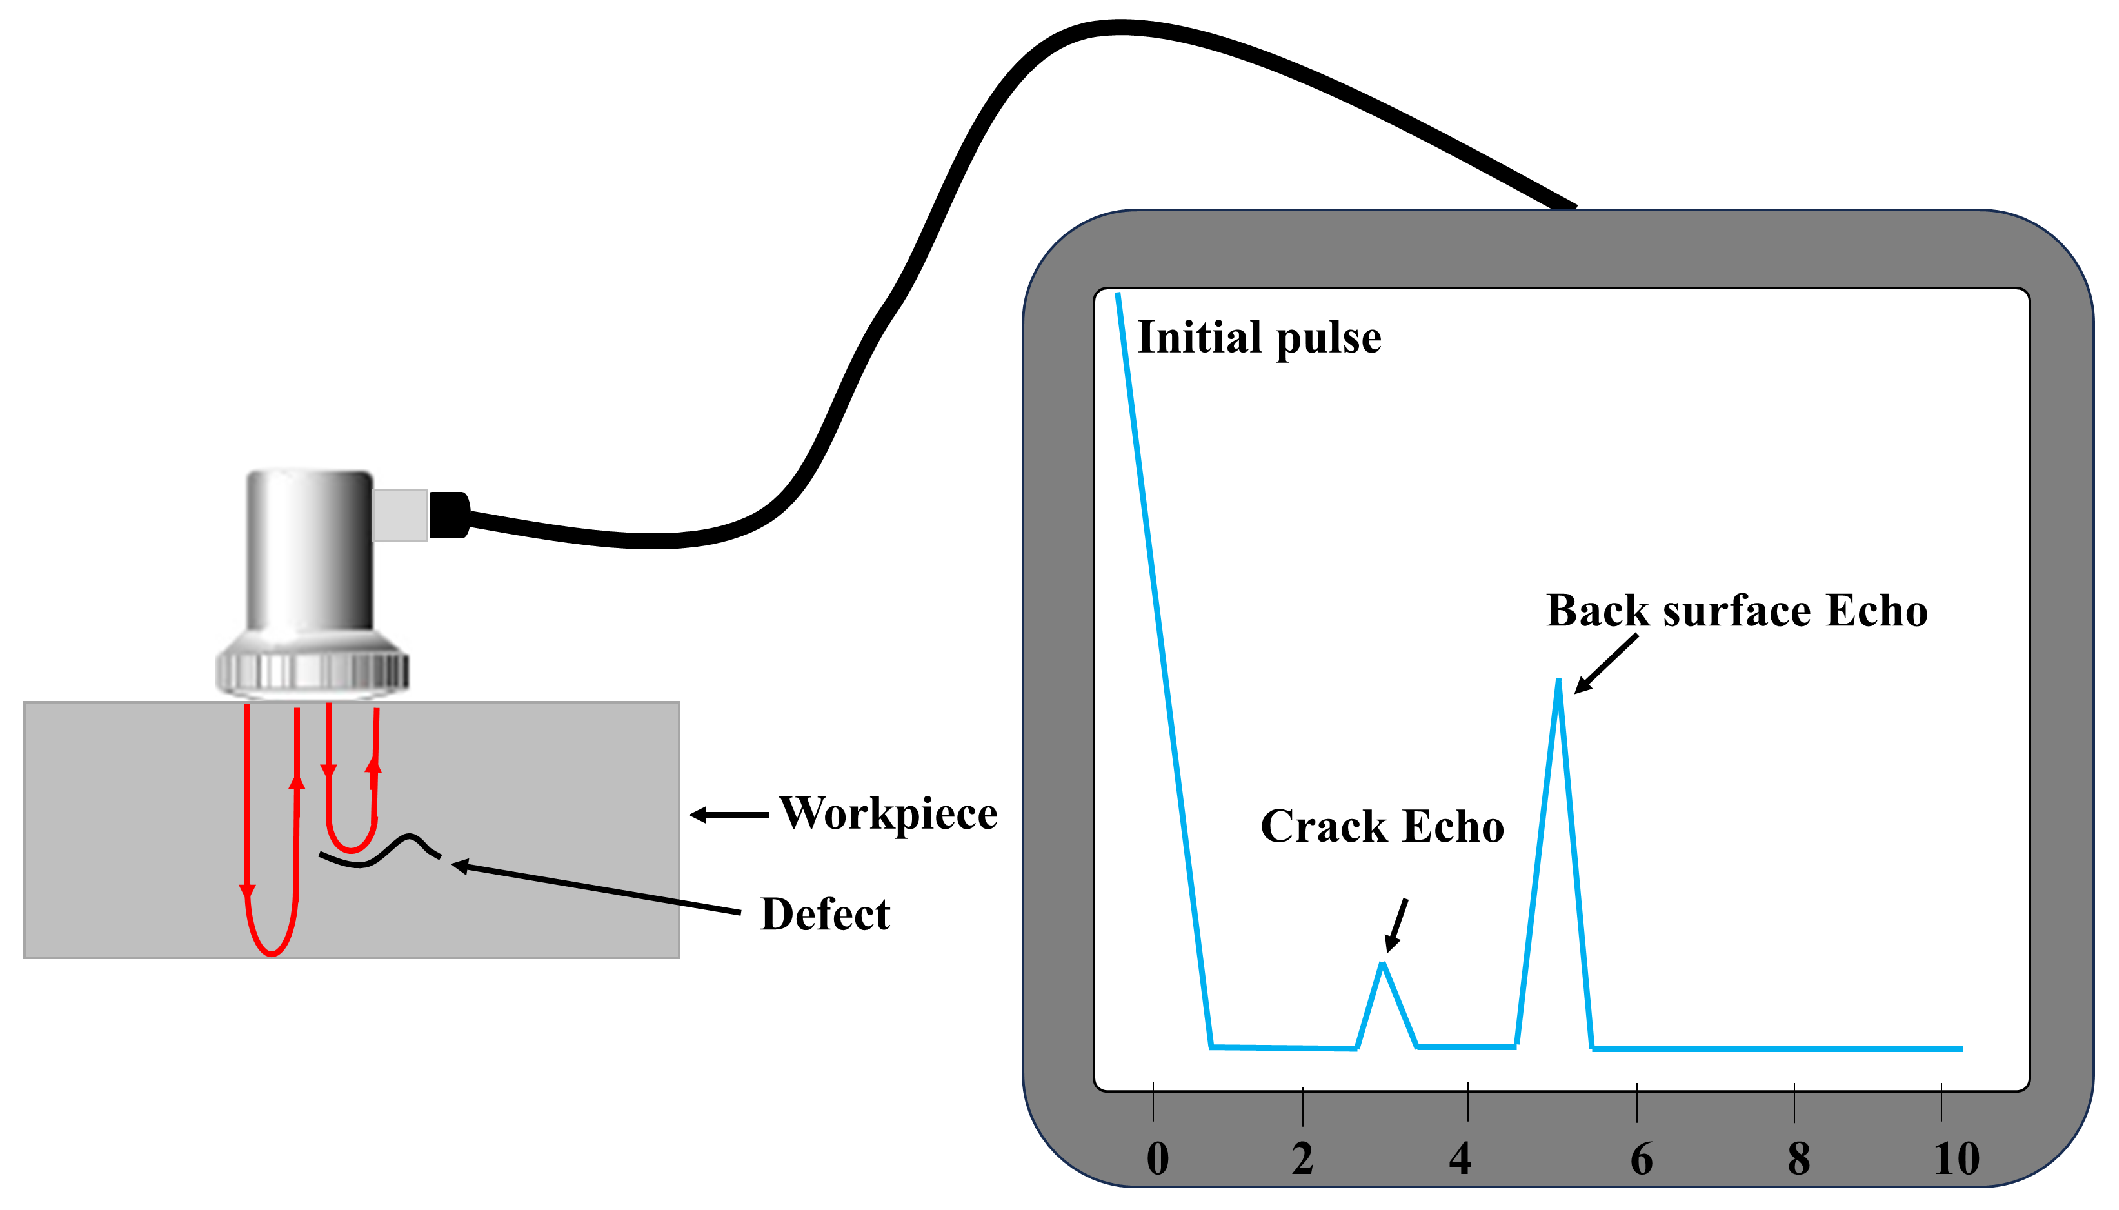
- Ultrasonic testing: Ultrasonic testing (UT), an NDT, employs high-frequency sound waves to inspect material internal structures for defects. This method, using specialized equipment like ultrasonic transducers, provides detailed information about defect size, shape, and location, making it a valuable tool for quality assessment across industries [27]. Figure 3 delineates the methodology.
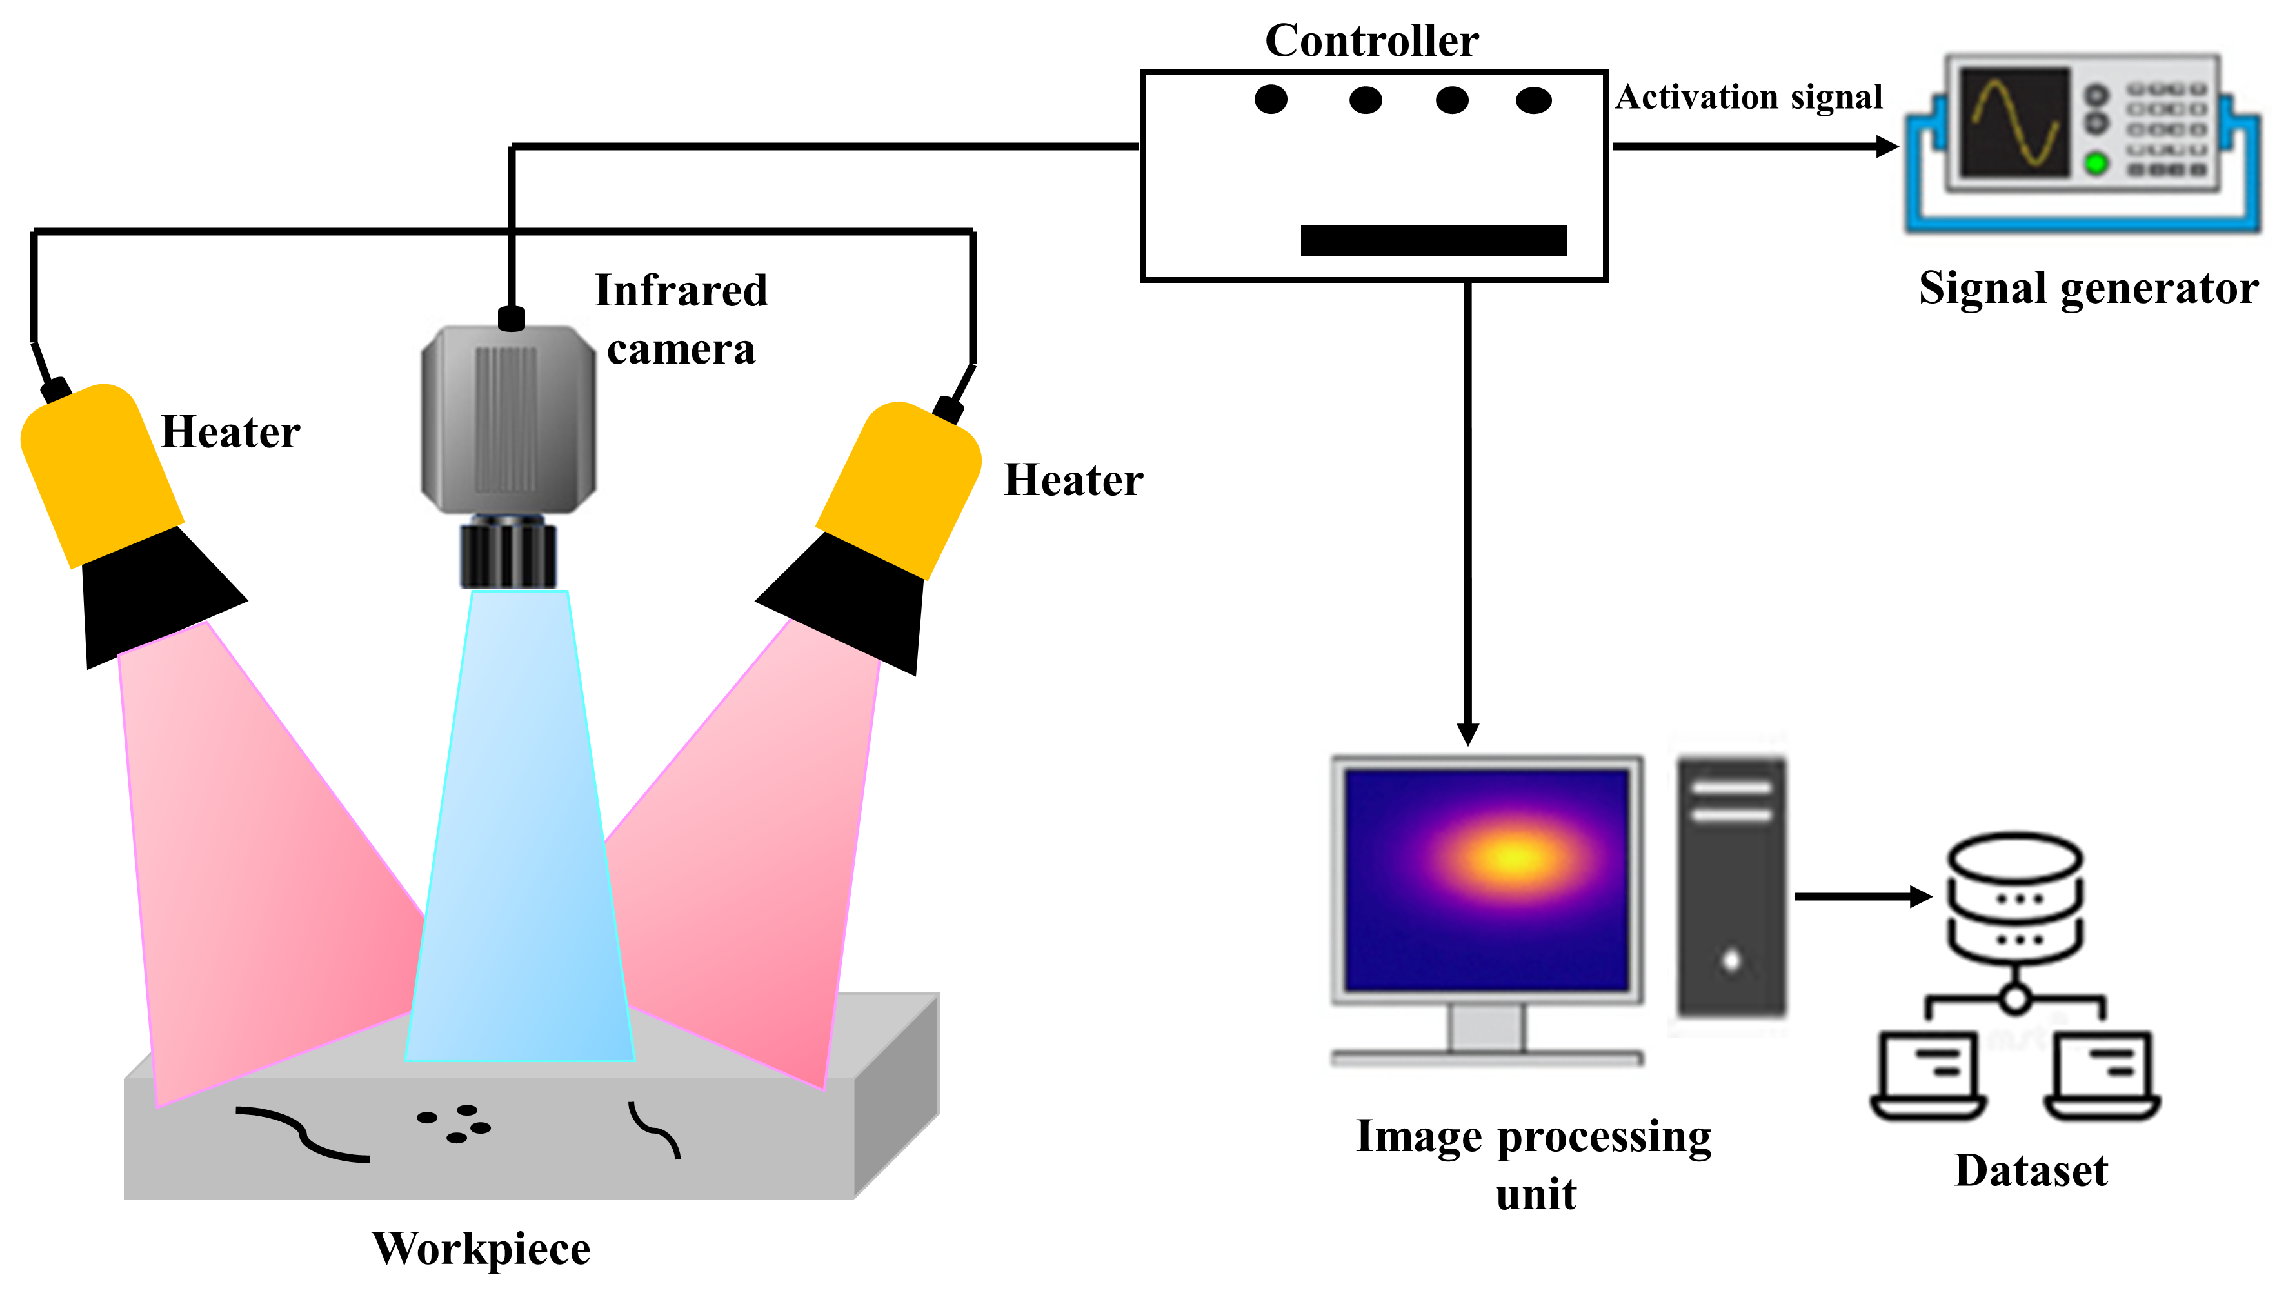
- Infrared thermography method: Infrared thermography(IRT), a non-intrusive NDT technique, detects weld flaws by applying a heat source to the weld, which creates distinctive thermal patterns based on different heat absorption properties. Captured by an infrared camera, these patterns enable real-time identification and localization of various weld defects. Widely used in critical industries such as aerospace and manufacturing, IR thermography is essential for rapid on-site inspection and provides valuable insight into weld integrity [28]. Figure 4 elucidates the Infrared Thermography (IRT) methodology.
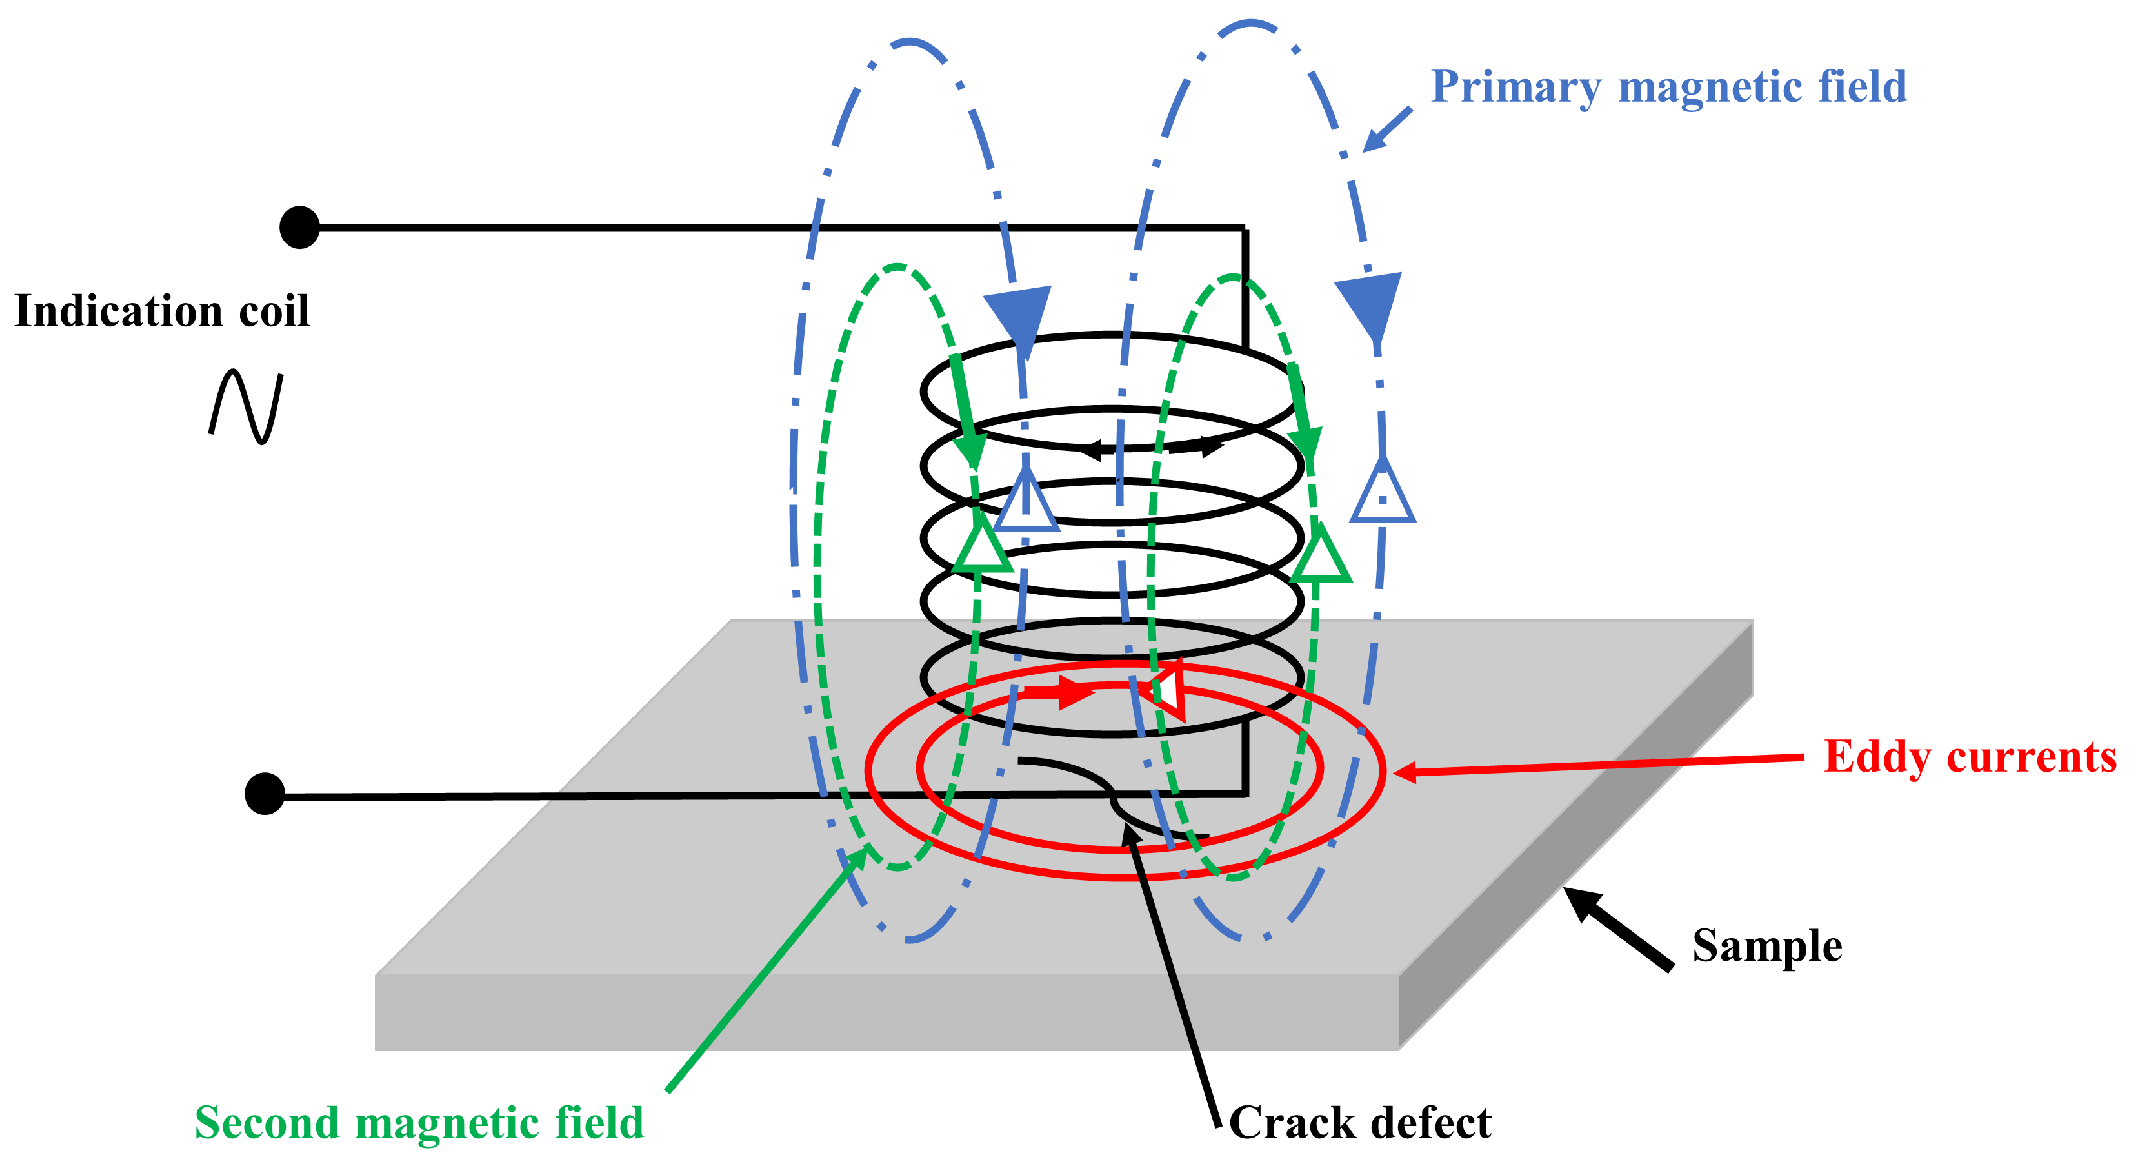
- Eddy current technique: Eddy current testing (ECT), a non-destructive technique, uses electromagnetic induction to detect surface and subsurface irregularities in conductive materials. Using an alternating current (AC) coil, eddy currents induced in the material reveal defects by changing the impedance of the coil. This enables fast and effective flaw detection in components such as tubes and pipes, eliminating the need for direct material contact [29]. Figure 5 illustrates the methodology.
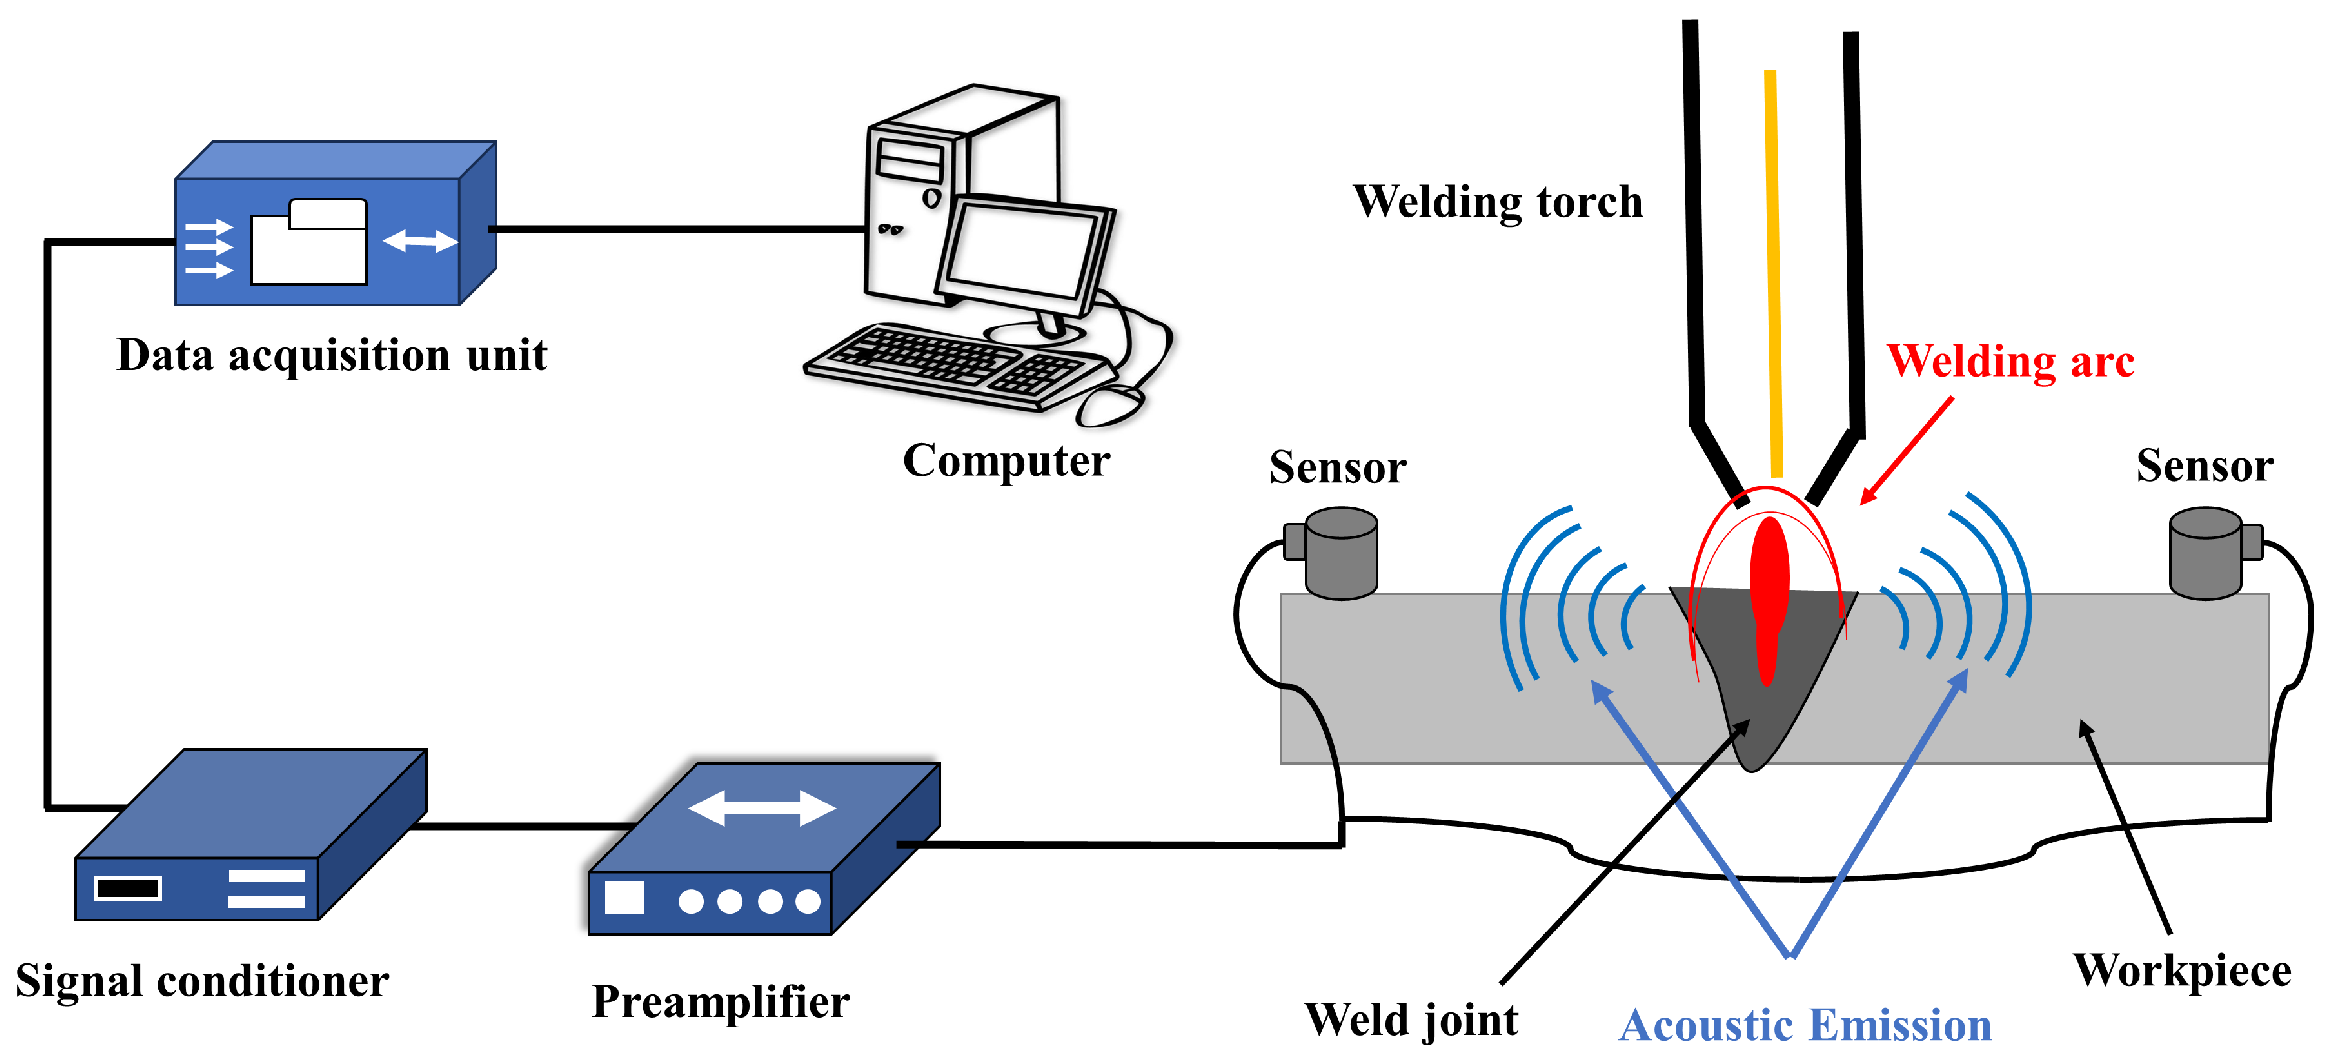
- Acoustic emission method: Acoustic emission (AE) testing is essential for monitoring weld integrity by detecting defects such as cracks and delaminations through transient stress waves. In real-time analysis, AE signals identify potential problems immediately, making it widely used in design and manufacturing for continuous monitoring and timely insight into the reliability and integrity of welded components [30]. Figure 6 depicts the process.
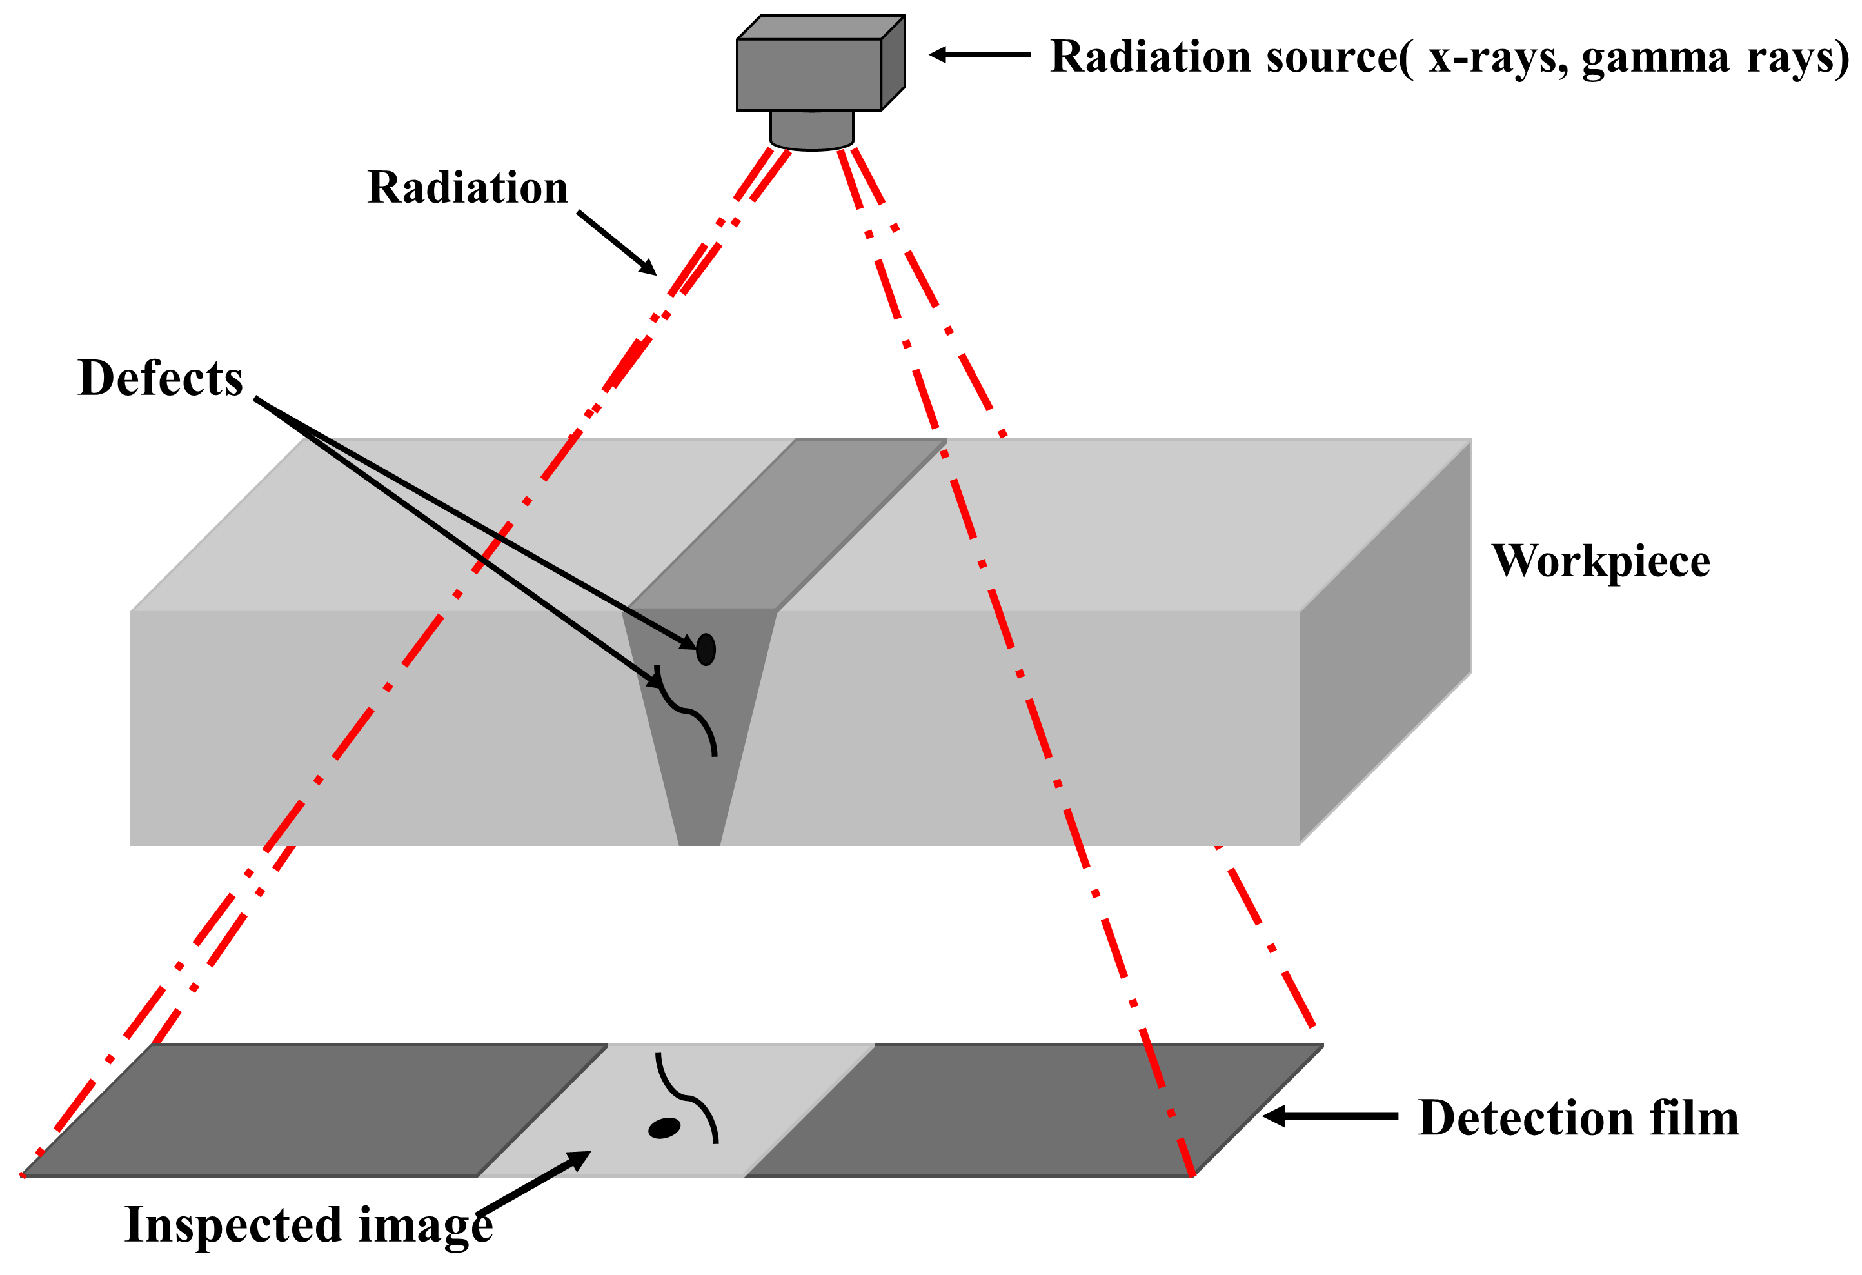
- The radiographic technique: radiographic testing ((RT) uses high-energy X-rays to identify and evaluate weld defects, ensuring structural integrity without causing damage. Particularly adept at detecting internal flaws, radiography captures transmitted radiation to form detailed images on a radiographic film. Widely used in manufacturing, construction, and aerospace applications, this method provides a comprehensive insight into weld quality by accurately characterizing the size, location, and nature of defects [31]. Figure 8 illustrates the approach.
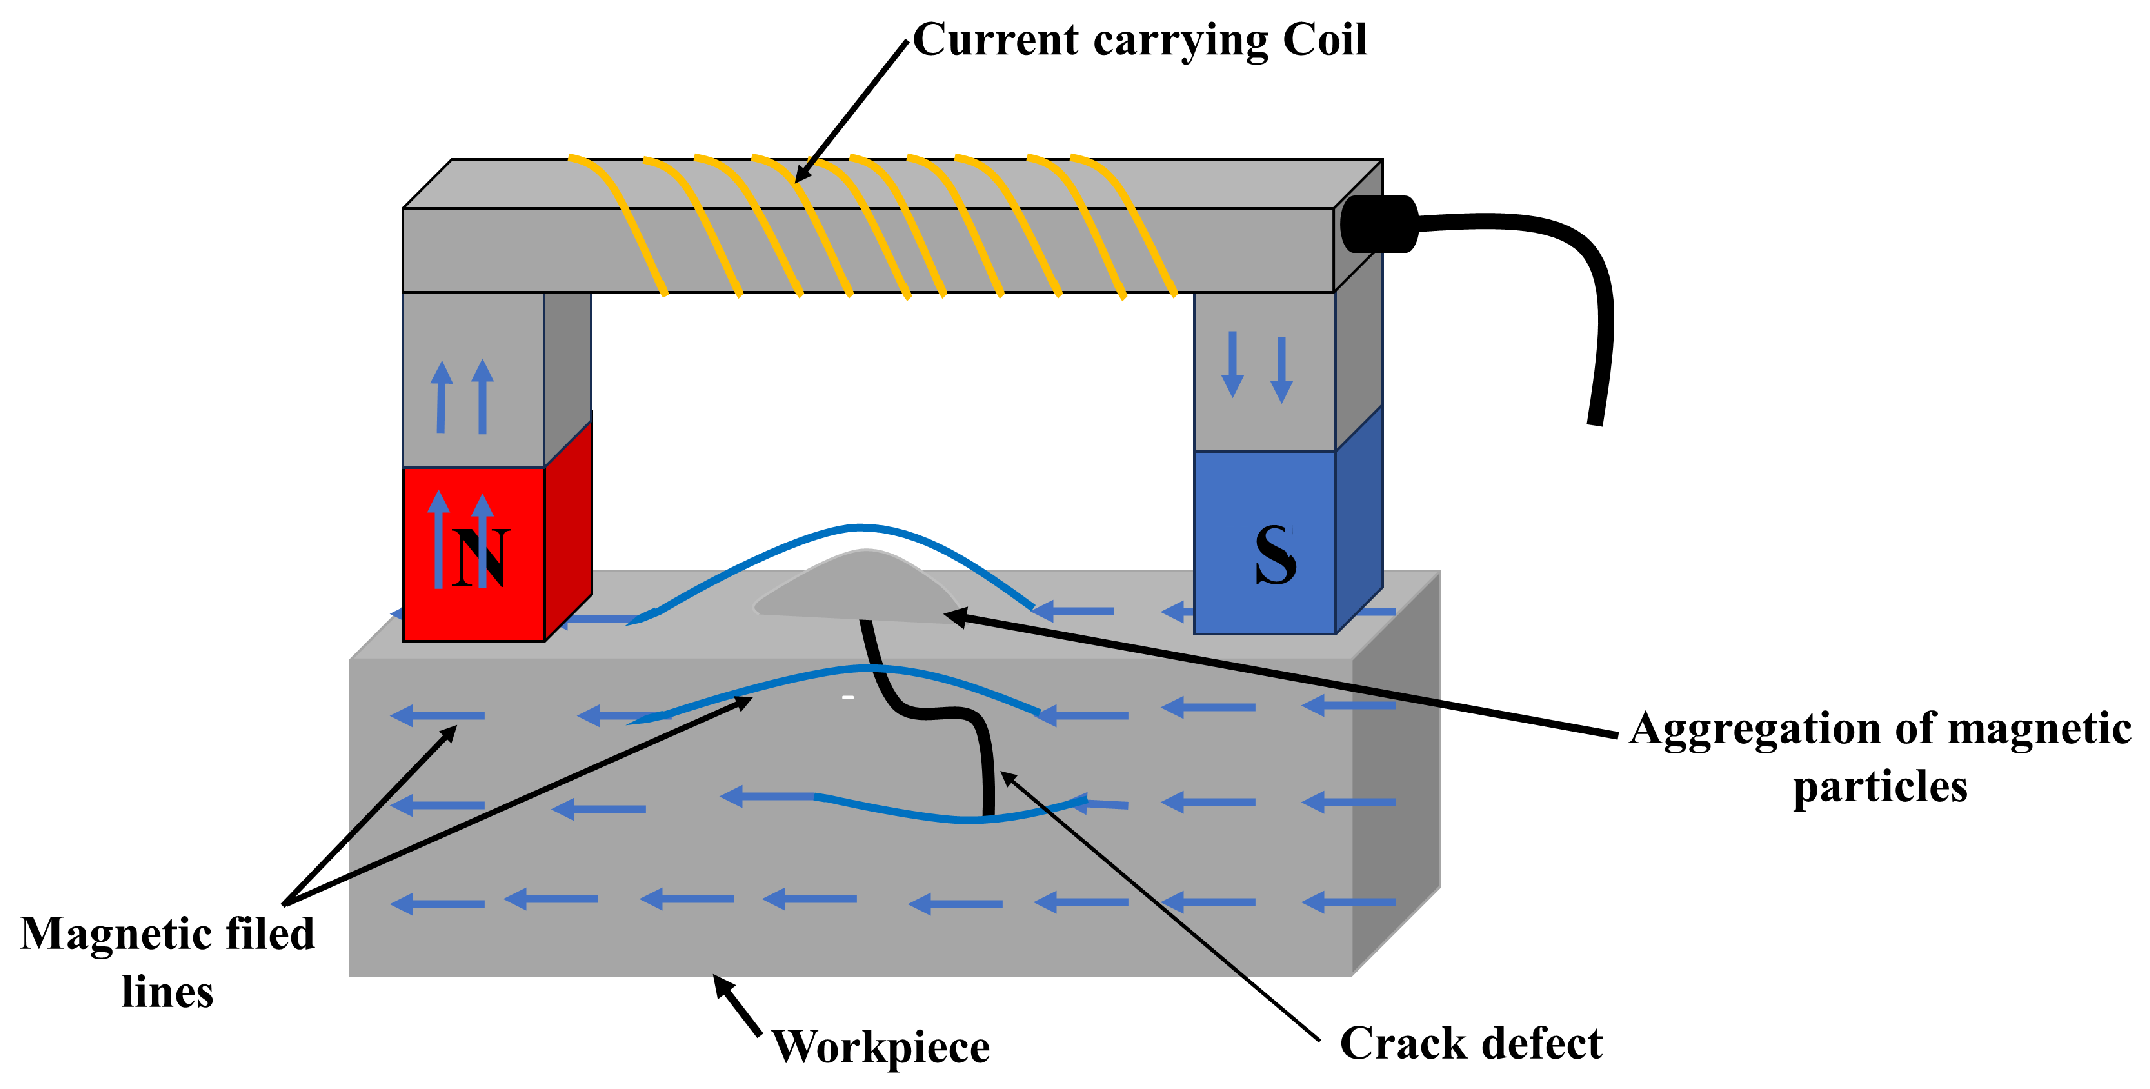
- Magnetic particle inspection( MT): is a non-destructive method to detect surface and near-surface weld defects. By inducing a magnetic field in the material and applying ferrous particles, defects disrupt the magnetic field, causing particles to accumulate around them [32]. Figure 7 describes the magnetic testing method.
3. Comparative Analysis of the Non-Destructive Testing(NDT) Techniques
4. X-ray Images Datasets for Welding Joints
5. X-ray Image Processing for Welding Defects Enhancement
6. Feature Extraction and Selection Techniques
7. AI Based Classifiers
7.1. Machine Learning Algorithms
7.2. Deep Learning Algorithms
7.3. Ensemble Learning Techniques
8. Applications of the X-ray Image-Based NDT of Welds
8.1. Automotive
8.2. Maritime Sector
8.3. Aerospace Sector
8.4. Oil and Gas
8.5. Railway Sector
8.6. Construction and Infrastructure
8.7. Battery Packs Inspection
8.8. Power Generation
9. Opportunities and Challenges
9.1. Opportunities
- Enhanced Defect Detection: AI enhances the analysis of X-ray imaging data, significantly improving the accuracy of defect detection and allowing the identification of subtle anomalies that may be missed by traditional methods. AI algorithms can process large amounts of data, identify complex patterns, and provide more reliable and consistent defect detection compared to manual inspection.
- Predictive Maintenance: The development of predictive maintenance models enables the prediction of potential problems based on historical data and facilitates proactive intervention to extend the life of critical structures. By analyzing trends and anomalies in X-ray imaging data, AI can forecast when maintenance or repairs will be needed, optimizing resource allocation and minimizing unexpected downtime.
- Real-time Decision-making: Real-time decision-making during inspections becomes possible, reducing the need for post-inspection analysis and enabling immediate action. AI systems can provide instantaneous feedback on the condition of welds, allowing for rapid decision-making and timely interventions to address any issues.
- Customizable Inspection Solutions: The adaptability of AI allows the creation of customized inspection solutions tailored to specific industry requirements, optimizing the inspection process for different applications and materials. AI models can be trained on diverse datasets and adjusted to handle varying X-ray imaging techniques, work-piece geometries, and inspection environments.
- Streamlined Workflows: AI-assistive X-ray image analysis streamlines workflows, increasing efficiency and accelerating overall inspection times, leading to significant cost savings, especially in industries where downtime results in financial losses. Automated inspection systems can perform repetitive tasks consistently and quickly, reducing the need for manual labor and minimizing the potential for human error.
9.2. Challenges
- Data Quality and Diversity: Ensuring the quality and diversity of training data for AI models, which impacts the robustness and generalization of AI applications. Obtaining comprehensive and representative datasets for weld defects and other inspection-relevant features is crucial for developing accurate and reliable AI models.
- Explainability and Transparency: Developing explicable AI methodologies to build trust in automated systems, involving unraveling the complex decision-making processes of AI models, ensuring algorithmic transparency, and elucidating the correlation between AI results and the underlying scientific principles of X-ray imaging based NDT. Providing clear explanations of how AI systems arrive at their conclusions is essential for gaining the confidence of industry stakeholders.
- Integration and Interoperability: Achieving seamless integration of AI technologies into existing X-ray imaging based NDT workflows and infrastructure, requiring the development of interoperable standards, data fusion techniques, and adaptive algorithms tuned to dynamic environmental conditions. Integrating AI-powered tools with existing X-ray imaging based NDT equipment and software can be technically challenging, necessitating the development of robust integration strategies.
- Ethical Considerations: Addressing ethical considerations in AI algorithms, requiring scientific rigor in identifying and mitigating biases, involving interdisciplinary collaboration among computer scientists, ethicists, and domain experts. Ensuring that AI-driven inspection systems do not perpetuate or amplify biases, and that they adhere to ethical principles, is a critical concern.
- Cost and Cybersecurity: Addressing the preliminary costs associated with implementing AI technologies and cybersecurity concerns, driving the development of robust encryption methods, secure communication protocols, and resilient AI architectures. The initial investment required for AI integration and the need for robust data security measures can be significant barriers to adoption.
- Workforce Development: Developing a skilled workforce capable of navigating this complex scientific landscape, requires continuous education and training initiatives that address the evolving nature of the X-ray imaging based automated welds inspection, including machine learning, robotics, and materials science. Upgrading the existing workforce and attracting new talent with interdisciplinary expertise is essential for the successful implementation of AI-powered X-ray imaging based welding quality verification solutions.
10. Conclusions
References
- Abdelkader, R.; Ramou, N.; Khorchef, M. Welding Defects Detection in Radiographic Images Using an Improved Denoising Technique Combined with an Enhanced Chan-Vese Model. International Journal of Engineering Research in Africa 2022, 60, 155–172. [Google Scholar] [CrossRef]
- Vishal, V.; Ramya, R.; Srinivas, P.V.; Samsingh, R.V. A review of implementation of Artificial Intelligence systems for weld defect classification. Materials Today: Proceedings 2019, 16, 579–583. [Google Scholar] [CrossRef]
- Gupta, M.; Khan, M.A.; Butola, R.; Singari, R.M. Advances in applications of Non-Destructive Testing (NDT): A review. Advances in Materials and Processing Technologies 2022, 8, 2286–2307. [Google Scholar] [CrossRef]
- Nsengiyumva, W.; Zhong, S.; Luo, M.; Zhang, Q.; Lin, J. Critical insights into the state-of-the-art NDE data fusion techniques for the inspection of structural systems. Structural Control and Health Monitoring 2022, 29, e2857. [Google Scholar] [CrossRef]
- Artagan, S.S.; Bianchini Ciampoli, L.; D’Amico, F.; Calvi, A.; Tosti, F. Non-destructive assessment and health monitoring of railway infrastructures. Surveys in Geophysics 2020, 41, 447–483. [Google Scholar] [CrossRef]
- ARUNMUTHU, K.; SARAVANAN, T.; MAHADEVAN, S.; MUKHOPADHYAY, C. Application of X-ray Computed Tomography for Characterization of Weld Defects in Tubes.
- Zhao, Y.; Zhao, P.; Li, X.; Zhai, J. Fast Welding Defect Inspection on Digital Radiography Images Using Saliency Detection. 2021 4th International Conference on Artificial Intelligence and Big Data (ICAIBD). IEEE, 2021, pp. 480–484.
- Naddaf-Sh, M.M.; Naddaf-Sh, S.; Zargarzadeh, H.; Zahiri, S.M.; Dalton, M.; Elpers, G.; Kashani, A.R. Defect detection and classification in welding using deep learning and digital radiography. In Fault diagnosis and prognosis techniques for complex engineering systems; Elsevier, 2021; pp. 327–352.
- Yang, L.; Wang, H.; Huo, B.; Li, F.; Liu, Y. An automatic welding defect location algorithm based on deep learning. Ndt & E International 2021, 120, 102435. [Google Scholar]
- Hu, A.; Wu, L.; Huang, J.; Fan, D.; Xu, Z. Recognition of weld defects from X-ray images based on improved convolutional neural network. Multimedia Tools and Applications 2022, 81, 15085–15102. [Google Scholar] [CrossRef]
- Liu, Y.; Yuan, K.; Li, T.; Li, S. NDT Method for Weld Defects Based on FMPVit Transformer Model. IEEE Access 2023. [Google Scholar] [CrossRef]
- Deepak, J.; Raja, V.B.; Srikanth, D.; Surendran, H.; Nickolas, M. Non-destructive testing (NDT) techniques for low carbon steel welded joints: A review and experimental study. Materials Today: Proceedings 2021, 44, 3732–3737. [Google Scholar] [CrossRef]
- Madhvacharyula, A.S.; Pavan, A.V.S.; Gorthi, S.; Chitral, S.; Venkaiah, N.; Kiran, D.V. In situ detection of welding defects: A review. Welding in the World 2022, 66, 611–628. [Google Scholar] [CrossRef]
- AlShareef, A.M.; Alnowaimi, M.; Siddig, M. CNN-Based Detection Of Welding Crack Defects In Radiographic Non-Destructive Testing. Proceedings of SCOPE 2023, 13, 15. [Google Scholar]
- Gholizadeh, S. Deep Learning and Machine learning Techniques in Advanced Non-Destructive Testing. Journal of Harbin Engineering University 2023, 44. [Google Scholar]
- Yan, Z.; Chen, S.; Jiang, F.; Zhang, W.; Huang, N.; Chen, R. Control of gravity effects on weld porosity distribution during variable polarity plasma arc welding of aluminum alloys. Journal of Materials Processing Technology 2020, 282, 116693. [Google Scholar] [CrossRef]
- Kim, C.J.; Seo, B.W.; Son, H.J.; Kim, S.; Kim, D.; Cho, Y.T. Slag inclusion-free flux cored wire arc directed energy deposition process. Materials & Design, 2024; 112669. [Google Scholar]
- Kim, K.; Kim, K.S.; Park, H.J. Multi-branch deep fusion network-based automatic detection of weld defects using non-destructive ultrasonic test. IEEE Access 2023. [Google Scholar] [CrossRef]
- Sun, J.; Li, C.; Wu, X.J.; Palade, V.; Fang, W. An effective method of weld defect detection and classification based on machine vision. IEEE Transactions on Industrial Informatics 2019, 15, 6322–6333. [Google Scholar] [CrossRef]
- Yang, L.; Jiang, H. Weld defect classification in radiographic images using unified deep neural network with multi-level features. Journal of Intelligent Manufacturing 2021, 32, 459–469. [Google Scholar] [CrossRef]
- Ji, Y.; Dong, C.; Chen, L.; Xiao, K.; Li, X. High-throughput computing for screening the potential alloying elements of a 7xxx aluminum alloy for increasing the alloy resistance to stress corrosion cracking. Corrosion Science 2021, 183, 109304. [Google Scholar] [CrossRef]
- Nguyen, A.; Wu, D.; Tashiro, S.; Tanaka, M. Undercut formation mechanism in keyhole plasma arc welding. Welding journal 2019, 98, 204–212. [Google Scholar]
- Yang, L.; Wang, H.; Huo, B.; Li, F.; Liu, Y. An automatic welding defect location algorithm based on deep learning. Ndt & E International 2021, 120, 102435. [Google Scholar]
- Cardellicchio, A.; Nitti, M.; Patruno, C.; Mosca, N.; di Summa, M.; Stella, E.; Renò, V. Automatic quality control of aluminium parts welds based on 3D data and artificial intelligence. Journal of Intelligent Manufacturing, 2023; 1–20. [Google Scholar]
- MacLeod, C.; Javadi, Y. Advanced nondestructive evaluation for welded joints. In Welding of Metallic Materials; Elsevier, 2023; pp. 431–461.
- Ji, C.; Wang, H.; Li, H. Defects detection in weld joints based on visual attention and deep learning. NDT & E International 2023, 133, 102764. [Google Scholar]
- Towsyfyan, H.; Biguri, A.; Boardman, R.; Blumensath, T. Successes and challenges in non-destructive testing of aircraft composite structures. Chinese Journal of Aeronautics 2020, 33, 771–791. [Google Scholar] [CrossRef]
- Wang, B.; Zhong, S.; Lee, T.L.; Fancey, K.S.; Mi, J. Non-destructive testing and evaluation of composite materials/structures: A state-of-the-art review. Advances in mechanical engineering 2020, 12, 1687814020913761. [Google Scholar] [CrossRef]
- Kong, Y.; Bennett, C.; Hyde, C. A review of non-destructive testing techniques for the in-situ investigation of fretting fatigue cracks. Materials & Design 2020, 196, 109093. [Google Scholar]
- Chauveau, D. Review of NDT and process monitoring techniques usable to produce high-quality parts by welding or additive manufacturing. Welding in the World 2018, 62, 1097–1118. [Google Scholar] [CrossRef]
- Rafiei, M.; Raitoharju, J.; Iosifidis, A. Computer vision on x-ray data in industrial production and security applications: A comprehensive survey. Ieee Access 2023, 11, 2445–2477. [Google Scholar] [CrossRef]
- Liu, Q.; Ye, G.; Gao, X.; Zhang, Y.; Gao, P.P. Magneto-optical imaging nondestructive testing of welding defects based on image fusion. NDT & E International, 2023; 102887. [Google Scholar]
- Shaloo, M.; Schnall, M.; Klein, T.; Huber, N.; Reitinger, B. A Review of Non-Destructive Testing (NDT) Techniques for Defect Detection: Application to Fusion Welding and Future Wire Arc Additive Manufacturing Processes. Materials 2022, 15, 3697. [Google Scholar] [CrossRef]
- Rao, J.; Leong Sing, S.; Liu, P.; Wang, J.; Sohn, H. Non-destructive testing of metal-based additively manufactured parts and processes: a review. Virtual and Physical Prototyping 2023, 18, e2266658. [Google Scholar] [CrossRef]
- Shen, X.; Lu, X.; Guo, J.; Liu, Y.; Qi, J.; Lv, Z. Nondestructive Testing of Metal Cracks: Contemporary Methods and Emerging Challenges. Crystals 2023, 14, 54. [Google Scholar] [CrossRef]
- Ramírez, I.S.; Márquez, F.P.G.; Papaelias, M. Review on additive manufacturing and non-destructive testing. Journal of Manufacturing Systems 2023, 66, 260–286. [Google Scholar] [CrossRef]
- Cai, W.; Wang, J.; Jiang, P.; Cao, L.; Mi, G.; Zhou, Q. Application of sensing techniques and artificial intelligence-based methods to laser welding real-time monitoring: A critical review of recent literature. Journal of Manufacturing systems 2020, 57, 1–18. [Google Scholar] [CrossRef]
- Lavadiya, D.N.; Dorafshan, S. Deep learning models for analysis of non-destructive evaluation data to evaluate reinforced concrete bridge decks: A survey. Engineering Reports, 2022; e12608. [Google Scholar]
- Amarnath, M.; Sudharshan, N.; Srinivas, P. Automatic detection of defects in welding using deep learning-a systematic review. Materials Today: Proceedings, 2023. [Google Scholar]
- Saberironaghi, A.; Ren, J.; El-Gindy, M. Defect detection methods for industrial products using deep learning techniques: A review. Algorithms 2023, 16, 95. [Google Scholar] [CrossRef]
- Liu, T.; Zheng, P.; Bao, J.; Chen, H. A state-of-the-art survey of welding radiographic image analysis: challenges, technologies and applications. Measurement, 2023; 112821. [Google Scholar]
- Zhao, Z. Review of non-destructive testing methods for defect detection of ceramics. Ceramics International 2021, 47, 4389–4397. [Google Scholar] [CrossRef]
- Ramalho, A.; Santos, T.G.; Bevans, B.; Smoqi, Z.; Rao, P.; Oliveira, J. Effect of contaminations on the acoustic emissions during wire and arc additive manufacturing of 316L stainless steel. Additive Manufacturing 2022, 51, 102585. [Google Scholar] [CrossRef]
- Luo, Y.; Zhu, L.; Han, J.; Xie, X.; Wan, R.; Zhu, Y. Study on the acoustic emission effect of plasma plume in pulsed laser welding. Mechanical Systems and Signal Processing 2019, 124, 715–723. [Google Scholar] [CrossRef]
- Zhang, L.; Basantes-Defaz, A.C.; Ozevin, D.; Indacochea, E. Real-time monitoring of welding process using air-coupled ultrasonics and acoustic emission. The International Journal of Advanced Manufacturing Technology 2019, 101, 1623–1634. [Google Scholar] [CrossRef]
- Elkihel, A.; Bakdid, A.; Jeffali, F.; Gziri, H. Evaluation of thermal losses for welded structures. Materials Today: Proceedings 2020, 31, S78–S82. [Google Scholar] [CrossRef]
- Massaro, A.; Panarese, A.; Dipierro, G.; Cannella, E.; Galiano, A. Infrared Thermography and Image Processing applied on Weldings Quality Monitoring. 2020 IEEE International Workshop on Metrology for Industry 4.0 & IoT. IEEE, 2020, pp. 559–564.
- Ziegler, M.; Thiel, E.; Ahmadi, S. Lock-in thermography using high-power laser sources. Proceedings of the 12th European Conference on Non-destructive Testing 2018, 2018, pp. ECNDT–0139.
- Sun, X.; Guo, C.; Yuan, L.; Kong, Q.; Ni, Y. Diffuse ultrasonic wave-based damage detection of railway tracks using PZT/FBG hybrid sensing system. Sensors 2022, 22, 2504. [Google Scholar] [CrossRef]
- Chakraborty, J.; Wang, X.; Stolinski, M. Analysis of Sensitivity of Distance between Embedded Ultrasonic Sensors and Signal Processing on Damage Detectability in Concrete Structures. acoustics. MDPI, 2022, Vol. 4, pp. 89–110.
- Chakraborty, J.; Wang, X.; Stolinski, M. Damage detection in multiple RC structures based on embedded ultrasonic sensors and wavelet transform. Buildings 2021, 11, 56. [Google Scholar] [CrossRef]
- Xie, F.; Wu, X.; Zhang, H.; Zhang, X. Research on pulsed eddy current automatic detection technology for weld defects of pressure vessel cylinder. Measurement 2021, 176, 109081. [Google Scholar] [CrossRef]
- Alvarenga, T.A.; Carvalho, A.L.; Honorio, L.M.; Cerqueira, A.S.; Filho, L.M.; Nobrega, R.A. Detection and classification system for rail surface defects based on Eddy current. Sensors 2021, 21, 7937. [Google Scholar] [CrossRef] [PubMed]
- Gansel, R.; Maier, H.J.; Barton, S. Detection and characterization of fatigue cracks in butt welds of offshore structures using the eddy current method. Journal of Nondestructive Evaluation, Diagnostics and Prognostics of Engineering Systems 2023, 6, 021001. [Google Scholar] [CrossRef]
- Brauchle, F.; Grimsmann, F.; von Kessel, O.; Birke, K.P. Defect detection in lithium ion cells by magnetic field imaging and current reconstruction. Journal of Power Sources 2023, 558, 232587. [Google Scholar] [CrossRef]
- Ai, J.; Zhou, Q.; Zhang, X.; Li, S.; Long, B.; Bai, L. Improving Magnetic Field Response of Eddy Current Magneto-Optical Imaging for Defect Detection in Carbon Fiber Reinforced Polymers. Applied Sciences 2023, 13, 4541. [Google Scholar] [CrossRef]
- Yaping, L.; Weixin, G. Research on X-ray welding image defect detection based on convolution neural network. Journal of Physics: Conference Series. IOP Publishing, 2019, Vol. 1237, p. 032005.
- Sudhagar, S.; Sakthivel, M.; Daniel, S.A.A. Application of image processing to radiographic image for quantitative assessment of friction stir welding quality of aluminium 2024 alloy. Measurement 2020, 152, 107294. [Google Scholar] [CrossRef]
- Kastner, J.; Heinzl, C. X-ray computed tomography for non-destructive testing and materials characterization. Integrated Imaging and Vision Techniques for Industrial Inspection: Advances and Applications, 2015; 227, 250. [Google Scholar]
- Bansal, A.; Vettivel, S.; Kumar, M.; Agarwal, M. Weld defect identification and characterization in radiographic images using deep learning. Engineering Research Express 2023. [Google Scholar] [CrossRef]
- Dwivedi, S.K.; Vishwakarma, M.; Soni, A. Advances and researches on non destructive testing: A review. Materials Today: Proceedings 2018, 5, 3690–3698. [Google Scholar] [CrossRef]
- Campbell, L.E.; Connor, R.J.; Whitehead, J.M.; Washer, G.A. Benchmark for evaluating performance in visual inspection of fatigue cracking in steel bridges. Journal of Bridge Engineering 2020, 25, 04019128. [Google Scholar] [CrossRef]
- Farhangdoust, S.; Mehrabi, A. Health monitoring of closure joints in accelerated bridge construction: A review of non-destructive testing application. Journal of Advanced Concrete Technology 2019, 17, 381–404. [Google Scholar] [CrossRef]
- Mehrabi, A.; Farhangdoust, S.; others. NDT methods applicable to health monitoring of ABC closure joints. Technical report, Accelerated Bridge Construction University Transportation Center (ABC-UTC), 2019.
- Qu, Z.; Jiang, P.; Zhang, W. Development and application of infrared thermography non-destructive testing techniques. Sensors 2020, 20, 3851. [Google Scholar] [CrossRef]
- Wimsatt, A.J.; Scullion, T.; Fernando, E.; Hurlebaus, S.; Lytton, R.; Zollinger, D.; Walker, R. A Plan for Developing High-Speed, Nondestructive Testing Procedures for Both Design Evaluation and Construction Inspection. Strategic Highway Research Program 2009, 2. [Google Scholar]
- Sophian, A.; Tian, G.; Fan, M. Pulsed eddy current non-destructive testing and evaluation: A review. Chinese Journal of Mechanical Engineering 2017, 30, 500–514. [Google Scholar] [CrossRef]
- García-Martín, J.; Gómez-Gil, J.; Vázquez-Sánchez, E. Non-destructive techniques based on eddy current testing. Sensors 2011, 11, 2525–2565. [Google Scholar] [CrossRef] [PubMed]
- Khedmatgozar Dolati, S.S.; Caluk, N.; Mehrabi, A.; Khedmatgozar Dolati, S.S. Non-destructive testing applications for steel bridges. Applied Sciences 2021, 11, 9757. [Google Scholar] [CrossRef]
- Menaria, T.; Kumar, M. Review on radiographic imaging modalities for non-destructive testing and evaluation (NDT & E). Proceedings of International Conference on Sustainable Computing in Science, Technology and Management (SUSCOM), Amity University Rajasthan, Jaipur-India, 2019.
- Vraj, P.; Ayush, J.; Yash, P.; Hardik, P.; VOHRA, M. Detection of Weld Metal Defects using DT and NDT-A Review 2020.
- Hopwood, I.; Goff, C.; Fairchild, J.; Palle, S. ; others. Nondestructive Evaluation of Steel Bridges: Methods and Applications. Technical report, University of Kentucky Transportation Center, 2016.
- Totino, B.; Spagnolo, F.; Perri, S. RIAWELC: A Novel Dataset of Radiographic Images for Automatic Weld Defects Classification. International Journal of Electrical and Computer Engineering Research 2023, 3, 13–17. [Google Scholar] [CrossRef]
- Perri, S.; Spagnolo, F.; Frustaci, F.; Corsonello, P. Welding defects classification through a Convolutional Neural Network. Manufacturing Letters 2023, 35, 29–32. [Google Scholar] [CrossRef]
- Mery, D.; Riffo, V.; Zscherpel, U.; Mondragón, G.; Lillo, I.; Zuccar, I.; Lobel, H.; Carrasco, M. GDXray: The database of X-ray images for nondestructive testing. Journal of Nondestructive Evaluation 2015, 34, 42. [Google Scholar] [CrossRef]
- Say, D.; Zidi, S.; Qaisar, S.M.; Krichen, M. Automated Categorization of Multiclass Welding Defects Using the X-ray Image Augmentation and Convolutional Neural Network. Sensors 2023, 23, 6422. [Google Scholar] [CrossRef]
- Movafeghi, A.; Mirzapour, M.; Yahaghi, E. Defect detection enhancement using Gaussian Sparse Models. Applied Radiation and Isotopes 2024, 204, 111142. [Google Scholar] [CrossRef]
- Kumaresan, S.; Aultrin, K.J.; Kumar, S.; Anand, M.D. Deep learning-based weld defect classification using VGG16 transfer learning adaptive fine-tuning. International Journal on Interactive Design and Manufacturing (IJIDeM), 2023; 1–12. [Google Scholar]
- Guo, W.; Qu, H.; Liang, L. WDXI: The dataset of X-ray image for weld defects. 2018 14th International Conference on Natural Computation, Fuzzy Systems and Knowledge Discovery (ICNC-FSKD). IEEE, 2018, pp. 1051–1055.
- Mohana Sundari, L.; Sivakumar, P. Detection and segmentation of cracks in weld images using ANFIS classification method. Russian Journal of Nondestructive Testing 2021, 57, 72–82. [Google Scholar] [CrossRef]
- Zhang, J.; Guo, M.; Chu, P.; Liu, Y.; Chen, J.; Liu, H. Weld Defect Segmentation in X-ray Image with Boundary Label Smoothing. Applied Sciences 2022, 12, 12818. [Google Scholar] [CrossRef]
- Ajmi, C.; Zapata, J.; Elferchichi, S.; Laabidi, K. Advanced Faster-RCNN Model for Automated Recognition and Detection of Weld Defects on Limited X-Ray Image Dataset. Journal of Nondestructive Evaluation 2024, 43, 14. [Google Scholar] [CrossRef]
- Naddaf-Sh, M.M.; Naddaf-Sh, S.; Zargaradeh, H.; Zahiri, S.M.; Dalton, M.; Elpers, G.; Kashani, A.R. Next-generation of weld quality assessment using deep learning and digital radiography. Proceedings of the 2020 AAAI Spring Symposium, Palo Alto, CA, USA, 2020, pp. 11–12.
- Al-Hameed, W. Segmentation of radiographic images of weld defect. Journal of Global Research in Computer Science 2013, 4, 1–4. [Google Scholar]
- Mishra, A. Contrast limited adaptive histogram equalization (CLAHE) approach for enhancement of the microstructures of friction stir welded joints. arXiv preprint arXiv:2109.00886 2021.
- Lin, Z.; Yingjie, Z.; Bochao, D.; Bo, C.; Yangfan, L. Welding defect detection based on local image enhancement. IET Image Processing 2019, 13, 2647–2658. [Google Scholar] [CrossRef]
- Halidou, A.; Mohamadou, Y.; Ari, A.A.A.; Zacko, E.J.G. Review of wavelet denoising algorithms. Multimedia Tools and Applications, 2023; 1–31. [Google Scholar]
- You, N.; Han, L.; Zhu, D.; Song, W. Research on image denoising in edge detection based on wavelet transform. Applied Sciences 2023, 13, 1837. [Google Scholar] [CrossRef]
- Zhao, F.; Chao, Y.; Li, L. A Crack Segmentation Model Combining Morphological Network and Multiple Loss Mechanism. Sensors 2023, 23, 1127. [Google Scholar] [CrossRef]
- Abualigah, L.; Almotairi, K.H.; Elaziz, M.A. Multilevel thresholding image segmentation using meta-heuristic optimization algorithms: Comparative analysis, open challenges and new trends. Applied Intelligence 2023, 53, 11654–11704. [Google Scholar] [CrossRef]
- Gupta, V.; Mittal, M.; Mittal, V.; Saxena, N.K. A critical review of feature extraction techniques for ECG signal analysis. Journal of The Institution of Engineers (India): Series B 2021, 102, 1049–1060. [Google Scholar] [CrossRef]
- Tzouanas, C.N.; Sherman, M.S.; Shay, J.E.; Rubin, A.J.; Mead, B.E.; Dao, T.T.; Butzlaff, T.; Mana, M.D.; Kolb, K.E.; Walesky, C.; others. Chronic metabolic stress drives developmental programs and loss of tissue functions in non-transformed liver that mirror tumor states and stratify survival. Biorxiv 2023, pp. 2023–11.
- Chaudhary, P.K.; Gupta, V.; Pachori, R.B. Fourier-Bessel representation for signal processing: A review. Digital Signal Processing, 2023; 103938. [Google Scholar]
- Salem, B.; others. Principal Component Analysis (PCA). La Tunisie Medicale 2021, 99, 383–389.
- Wang, Y.; Mukherjee, D. The Discrete Cosine Transform and Its Impact on Visual Compression: Fifty Years From Its Invention [Perspectives]. IEEE Signal Processing Magazine 2023, 40, 14–17. [Google Scholar] [CrossRef]
- Bardi, A.B.; Daković, M.; Yazdanpanah, T.; Zarei, F.; Stanković, L. The Schur decomposition of discrete Sine and Cosine transformations of type IV. Digital Signal Processing 2024, 144, 104260. [Google Scholar] [CrossRef]
- Guan, K.; Sun, Y.; Yang, G.; Yang, X. Knowledge Acquisition and Reasoning Model for Welding Information Integration Based on CNN and Knowledge Graph. Electronics 2023, 12, 1275. [Google Scholar] [CrossRef]
- Gorokhovatskyi, V.; Tvoroshenko, I.; Kobylin, O.; Vlasenko, N. Search for visual objects by request in the form of a cluster representation for the structural image description. Advances in Electrical and Electronic Engineering 2023, 21, 19–27. [Google Scholar] [CrossRef]
- Arya, R.; Vimina, E. Local triangular coded pattern: a texture descriptor for image classification. IETE Journal of Research 2023, 69, 3267–3278. [Google Scholar] [CrossRef]
- Cao, J.; Jiang, Z.; Gao, L.; Liu, Y.; Bao, C. Continuous crack detection using the combination of dynamic mode decomposition and connected component-based filtering method. Structures. Elsevier, 2023, Vol. 49, pp. 640–654.
- Yasar, A. Wrapper and hybrid feature selection methods using metaheuristic algorithm for chest x-ray images classification: COVID-19 as a case study. Tehnički glasnik 2023, 17, 313–323. [Google Scholar] [CrossRef]
- Zhao, T.; Zheng, Y.; Wu, Z. Feature selection-based machine learning modeling for distributed model predictive control of nonlinear processes. Computers & Chemical Engineering 2023, 169, 108074. [Google Scholar]
- Ghojogh, B.; Crowley, M.; Karray, F.; Ghodsi, A. Elements of dimensionality reduction and manifold learning; Springer Nature, 2023.
- Taheri, H.; Gonzalez Bocanegra, M.; Taheri, M. Artificial Intelligence, Machine Learning and Smart Technologies for Nondestructive Evaluation. Sensors 2022, 22, 4055. [Google Scholar] [CrossRef]
- Pal, A.; Kundu, T.; Datta, A.K. Assessing the Influence of Welded Joint on Health Monitoring of Rail Sections: An Experimental Study Employing SVM and ANN Models. Journal of Nondestructive Evaluation 2023, 42, 102. [Google Scholar] [CrossRef]
- Chen, Y.; Liang, S.; Wang, Z.; Ma, H.; Dong, M.; Liu, D.; Wan, X. Automatic classification of weld defects from ultrasonic signals using WPEE-KPCA feature extraction and an ABC-SVM approach. Insight-Non-Destructive Testing and Condition Monitoring 2023, 65, 262–269. [Google Scholar] [CrossRef]
- Melakhsou, A.A.; Batton-Hubert, M.; Casoetto, N. Welding fault detection and diagnosis using one-class SVM with distance substitution kernels and random convolutional kernel transform. The International Journal of Advanced Manufacturing Technology 2023, 128, 459–477. [Google Scholar] [CrossRef]
- de Beurs, Z.L.; Islam, N.; Gopalan, G.; Vrtilek, S. A Comparative Study of Machine-learning Methods for X-Ray Binary Classification. The Astrophysical Journal 2022, 933, 116. [Google Scholar] [CrossRef]
- Patil, R.V.; Reddy, Y.P. Multiform weld joint flaws detection and classification by sagacious artificial neural network technique. The International Journal of Advanced Manufacturing Technology 2023, 125, 913–943. [Google Scholar] [CrossRef]
- PEKŞİN, S.; SERTTAŞ, S. Evaluation Of The Resistance Spot Welding Process With KNN and CART Machine Learning Techniques. Afyon Kocatepe Üniversitesi Uluslararası Mühendislik Teknolojileri ve Uygulamalı Bilimler Dergisi, 6, 132–145.
- Grochowalski, J.M.; Chady, T. Rapid identification of material defects based on pulsed multifrequency eddy current testing and the k-nearest neighbor method. Materials 2023, 16, 6650. [Google Scholar] [CrossRef] [PubMed]
- Alzubaidi, L.; Zhang, J.; Humaidi, A.J.; Al-Dujaili, A.; Duan, Y.; Al-Shamma, O.; Santamaría, J.; Fadhel, M.A.; Al-Amidie, M.; Farhan, L. Review of deep learning: Concepts, CNN architectures, challenges, applications, future directions. Journal of big Data 2021, 8, 1–74. [Google Scholar] [CrossRef]
- Wang, H.; Fan, Z.; Chen, X.; Cheng, J.; Chen, W.; Wang, Z.; Bu, Y. Defect Recognition and Classification From Ultrasonic Phased Array Total Focusing Method Imaging Based on Random Forest. Pressure Vessels and Piping Conference. American Society of Mechanical Engineers, 2023, Vol. 87455, p. V002T02A017.
- Wang, S.; Cui, Y.; Song, Y.; Ding, C.; Ding, W.; Yin, J. A novel surface temperature sensor and random forest-based welding quality prediction model. Journal of Intelligent Manufacturing, 2023; 1–24. [Google Scholar]
- Ganaie, M.A.; Hu, M.; Malik, A.; Tanveer, M.; Suganthan, P. Ensemble deep learning: A review. Engineering Applications of Artificial Intelligence 2022, 115, 105151. [Google Scholar] [CrossRef]
- Shrestha, A.; Mahmood, A. Review of deep learning algorithms and architectures. IEEE access 2019, 7, 53040–53065. [Google Scholar] [CrossRef]
- Gupta, J.; Pathak, S.; Kumar, G. Deep learning (CNN) and transfer learning: a review. Journal of Physics: Conference Series. IOP Publishing, 2022, Vol. 2273, p. 012029.
- Guo, B.; Wang, Y.; Li, X.; Zhou, Y.; Li, J.; Rao, L. Welding Defect Classification Based on Lightweight CNN. International Journal of Pattern Recognition and Artificial Intelligence 2023, 37, 2350026. [Google Scholar] [CrossRef]
- Mathew, A.; Amudha, P.; Sivakumari, S. Deep learning techniques: an overview. Advanced Machine Learning Technologies and Applications: Proceedings of AMLTA 2020 2021, pp. 599–608.
- Hu, C.; Duan, Y.; Liu, S.; Yan, Y.; Tao, N.; Osman, A.; Ibarra-Castanedo, C.; Sfarra, S.; Chen, D.; Zhang, C. LSTM-RNN-based defect classification in honeycomb structures using infrared thermography. Infrared Physics & Technology 2019, 102, 103032. [Google Scholar]
- Wang, B.; Li, Y.; Luo, Y.; Li, X.; Freiheit, T. Early event detection in a deep-learning driven quality prediction model for ultrasonic welding. Journal of Manufacturing Systems 2021, 60, 325–336. [Google Scholar] [CrossRef]
- Kumar, A.; Kumar, N.; Kuriakose, J.; Kumar, Y. A review of deep learning-based approaches for detection and diagnosis of diverse classes of drugs. Archives of Computational Methods in Engineering 2023, pp. 1–23.
- Liu, T.; Zheng, P.; Bao, J. Deep learning-based welding image recognition: A comprehensive review. Journal of Manufacturing Systems 2023, 68, 601–625. [Google Scholar] [CrossRef]
- Mutinda, J.; Mwangi, W.; Okeyo, G. Sentiment analysis of text reviews using lexicon-enhanced bert embedding (LeBERT) model with convolutional neural network. Applied Sciences 2023, 13, 1445. [Google Scholar] [CrossRef]
- Choudhary, C.; Singh, I.; Kumar, M. SARWAS: Deep ensemble learning techniques for sentiment based recommendation system. Expert Systems with Applications 2023, 216, 119420. [Google Scholar] [CrossRef]
- Jin, C.; Kong, X.; Chang, J.; Cheng, H.; Liu, X. Internal crack detection of castings: a study based on relief algorithm and Adaboost-SVM. The International Journal of Advanced Manufacturing Technology 2020, 108, 3313–3322. [Google Scholar] [CrossRef]
- Nhat-Duc, H.; Van-Duc, T. Comparison of histogram-based gradient boosting classification machine, random Forest, and deep convolutional neural network for pavement raveling severity classification. Automation in Construction 2023, 148, 104767. [Google Scholar] [CrossRef]
- Nakach, F.Z.; Idri, A.; Zerouaoui, H. Deep Hybrid Bagging Ensembles for Classifying Histopathological Breast Cancer Images. ICAART (2), 2023, pp. 289–300.
- Li, H.; Li, L.; Chen, X.; Zhou, Y.; Li, Z.; Zhao, Z. Addressing the inspection selection challenges of in-service pipeline girth weld using ensemble tree models. Engineering Failure Analysis 2024, 156, 107852. [Google Scholar] [CrossRef]
- Lv, G.; Guo, S.; Chen, D.; Feng, H.; Zhang, K.; Liu, Y.; Feng, W. Laser ultrasonics and machine learning for automatic defect detection in metallic components. NDT & E International 2023, 133, 102752. [Google Scholar]
- Liu, Y.; Chen, K.; Kumar, A.; Patnaik, P. Principles of Machine Learning and Its Application to Thermal Barrier Coatings. Coatings 2023, 13, 1140. [Google Scholar] [CrossRef]
- Xu, W.; Liu, G.; Wang, M. A Deep Neural Network-Based Intelligent Detection Model for Manufacturing Defects of Automobile Parts. Journal of Circuits, Systems and Computers 2023, p. 2350236.
- El Hachem, C.; Perrot, G.; Painvin, L.; Ernst-Desmulier, J.B.; Couturier, R. Welding seam classification in the automotive industry using deep learning algorithms. 2021 IEEE International Conference on Industry 4.0, Artificial Intelligence, and Communications Technology (IAICT). IEEE, 2021, pp. 235–240.
- Liu, X.; Guo, Z.; Bai, D.; Yuan, C. Study on the mechanical properties and defect detection of low alloy steel weldments for large cruise ships. Ocean Engineering 2022, 258, 111815. [Google Scholar] [CrossRef]
- Oh, S.j.; Jung, M.j.; Lim, C.; Shin, S.c. Automatic detection of welding defects using faster R-CNN. Applied Sciences 2020, 10, 8629. [Google Scholar] [CrossRef]
- Tyystjärvi, T.; Virkkunen, I.; Fridolf, P.; Rosell, A.; Barsoum, Z. Automated defect detection in digital radiography of aerospace welds using deep learning. Welding in the World 2022, 66, 643–671. [Google Scholar] [CrossRef]
- Dong, X.; Taylor, C.J.; Cootes, T.F. Automatic aerospace weld inspection using unsupervised local deep feature learning. Knowledge-Based Systems 2021, 221, 106892. [Google Scholar] [CrossRef]
- Dong, S.; Sun, X.; Xie, S.; Wang, M. Automatic defect identification technology of digital image of pipeline weld. Natural Gas Industry B 2019, 6, 399–403. [Google Scholar] [CrossRef]
- Shang, J.; An, W.; Liu, Y.; Han, B.; Guo, Y. Oil Pipeline Weld Defect Identification System Based on Convolutional Neural Network. KSII Transactions on Internet & Information Systems 2020, 14. [Google Scholar]
- Molefe, M.; Tapamo, J.R. Classification of Rail Welding Defects Based on the Bag of Visual Words Approach. Mexican Conference on Pattern Recognition. Springer, 2021, pp. 207–218.
- Sresakoolchai, J.; Kaewunruen, S. Railway defect detection based on track geometry using supervised and unsupervised machine learning. Structural health monitoring 2022, 21, 1757–1767. [Google Scholar] [CrossRef]
- Zheng, Y.; Wang, S.; Zhang, P.; Xu, T.; Zhuo, J. Application of nondestructive testing technology in quality evaluation of plain concrete and RC structures in bridge engineering: A review. Buildings 2022, 12, 843. [Google Scholar] [CrossRef]
- Akgul, F. Inspection and evaluation of a network of concrete bridges based on multiple NDT techniques. Structure and Infrastructure Engineering 2021, 17, 1076–1095. [Google Scholar] [CrossRef]
- Qiu, Q. Imaging techniques for defect detection of fiber reinforced polymer-bonded civil infrastructures. Structural Control and Health Monitoring 2020, 27, e2555. [Google Scholar] [CrossRef]
- Sresakoolchai, J.; Kaewunruen, S. Integration of building information modeling (BIM) and artificial intelligence (AI) to detect combined defects of infrastructure in the railway system. In Resilient Infrastructure: Select Proceedings of VCDRR 2021; Springer, 2021; pp. 377–386.
- Villarraga-Gómez, H.; Begun, D.L.; Bhattad, P.; Mo, K.; Norouzi Rad, M.; White, R.T.; Kelly, S.T. Assessing rechargeable batteries with 3D X-ray microscopy, computed tomography, and nanotomography. Nondestructive Testing and Evaluation 2022, 37, 519–535. [Google Scholar] [CrossRef]
- Panwar, N.G.; Singh, S.; Garg, A.; Gupta, A.K.; Gao, L. Recent advancements in battery management system for Li-ion batteries of electric vehicles: future role of digital twin, cyber-physical systems, battery swapping technology, and nondestructive testing. Energy Technology 2021, 9, 2000984. [Google Scholar] [CrossRef]
- Racewicz, S.; Fijałkowski, R. Quality Analysis of Welds Made with an Automatic Battery Pack Spot Welding Machine. Elektronika ir Elektrotechnika 2023, 29, 19–25. [Google Scholar] [CrossRef]
- Huang, Y. Analysis of the Causes of Fire of Lithium Batteries and Improvement Measures. Highlights in Science, Engineering and Technology 2023, 33, 1–6. [Google Scholar] [CrossRef]
- Wu, M.; Hu, S. Progress in Recovery and Utilization Technology of traction batteries for New Energy Vehicles and Analysis on Tendency. International Journal of Energy 2023, 3, 31–35. [Google Scholar] [CrossRef]
- Zhang, J.; Li, W.; Wang, Y.; Yang, J. Phased Array Detection Technology in Artificial Intelligence and Its Application in Power Industry. Journal of Physics: Conference Series. IOP Publishing, 2021, Vol. 1915, p. 042028.
- Surin, V.; Alwaheba, A.; Beketov, V.; Gazal, A. Alternative method of non-destructive testing for nuclear power plant. EPJ Web of Conferences. EDP Sciences, 2021, Vol. 247, p. 11002.
- Sarp, S.; Kuzlu, M.; Cali, U.; Elma, O.; Guler, O. An interpretable solar photovoltaic power generation forecasting approach using an explainable artificial intelligence tool. 2021 IEEE Power & Energy Society Innovative Smart Grid Technologies Conference (ISGT). IEEE, 2021, pp. 1–5.
- Geng, Z.; Shi, C.; Han, Y. Intelligent small sample defect detection of water walls in power plants using novel deep learning integrating deep convolutional gan. IEEE Transactions on Industrial Informatics 2022. [Google Scholar] [CrossRef]
- Kovshov, E.; Kuvshinnikov, V.; Dolgov, N. Process virtualization for X-ray images obtaining in industrial radiography during nuclear power plant NDT specialists training. E3S Web of Conferences. EDP Sciences, 2023, Vol. 371.
- Hamade, R.; Baydoun, A. Nondestructive detection of defects in friction stir welded lap joints using computed tomography. Materials & Design 2019, 162, 10–23. [Google Scholar]
- Li, H.; Wang, X.; Liu, Y.; Liu, G.; Zhai, Z.; Yan, X.; Wang, H.; Zhang, Y. A novel robotic-vision-based defect inspection system for bracket weldments in a cloud–edge coordination environment. Sustainability 2023, 15, 10783. [Google Scholar] [CrossRef]
- Khan, M.N.; Rahman, H.U.; Hussain, T.; Yang, B.; Qaisar, S.M. Enabling Trust in Automotive IoT: Lightweight Mutual Authentication Scheme for Electronic Connected Devices in Internet of Things. IEEE Transactions on Consumer Electronics 2024. [Google Scholar] [CrossRef]
- Qaisar, S.M. Efficient mobile systems based on adaptive rate signal processing. Computers & Electrical Engineering 2019, 79, 106462. [Google Scholar]
- Mian Qaisar, S. Signal-piloted processing and machine learning based efficient power quality disturbances recognition. PloS one 2021, 16, e0252104. [Google Scholar] [CrossRef]
- Mian Qaisar, S. Event-driven coulomb counting for effective online approximation of Li-ion battery state of charge. Energies 2020, 13, 5600. [Google Scholar] [CrossRef]
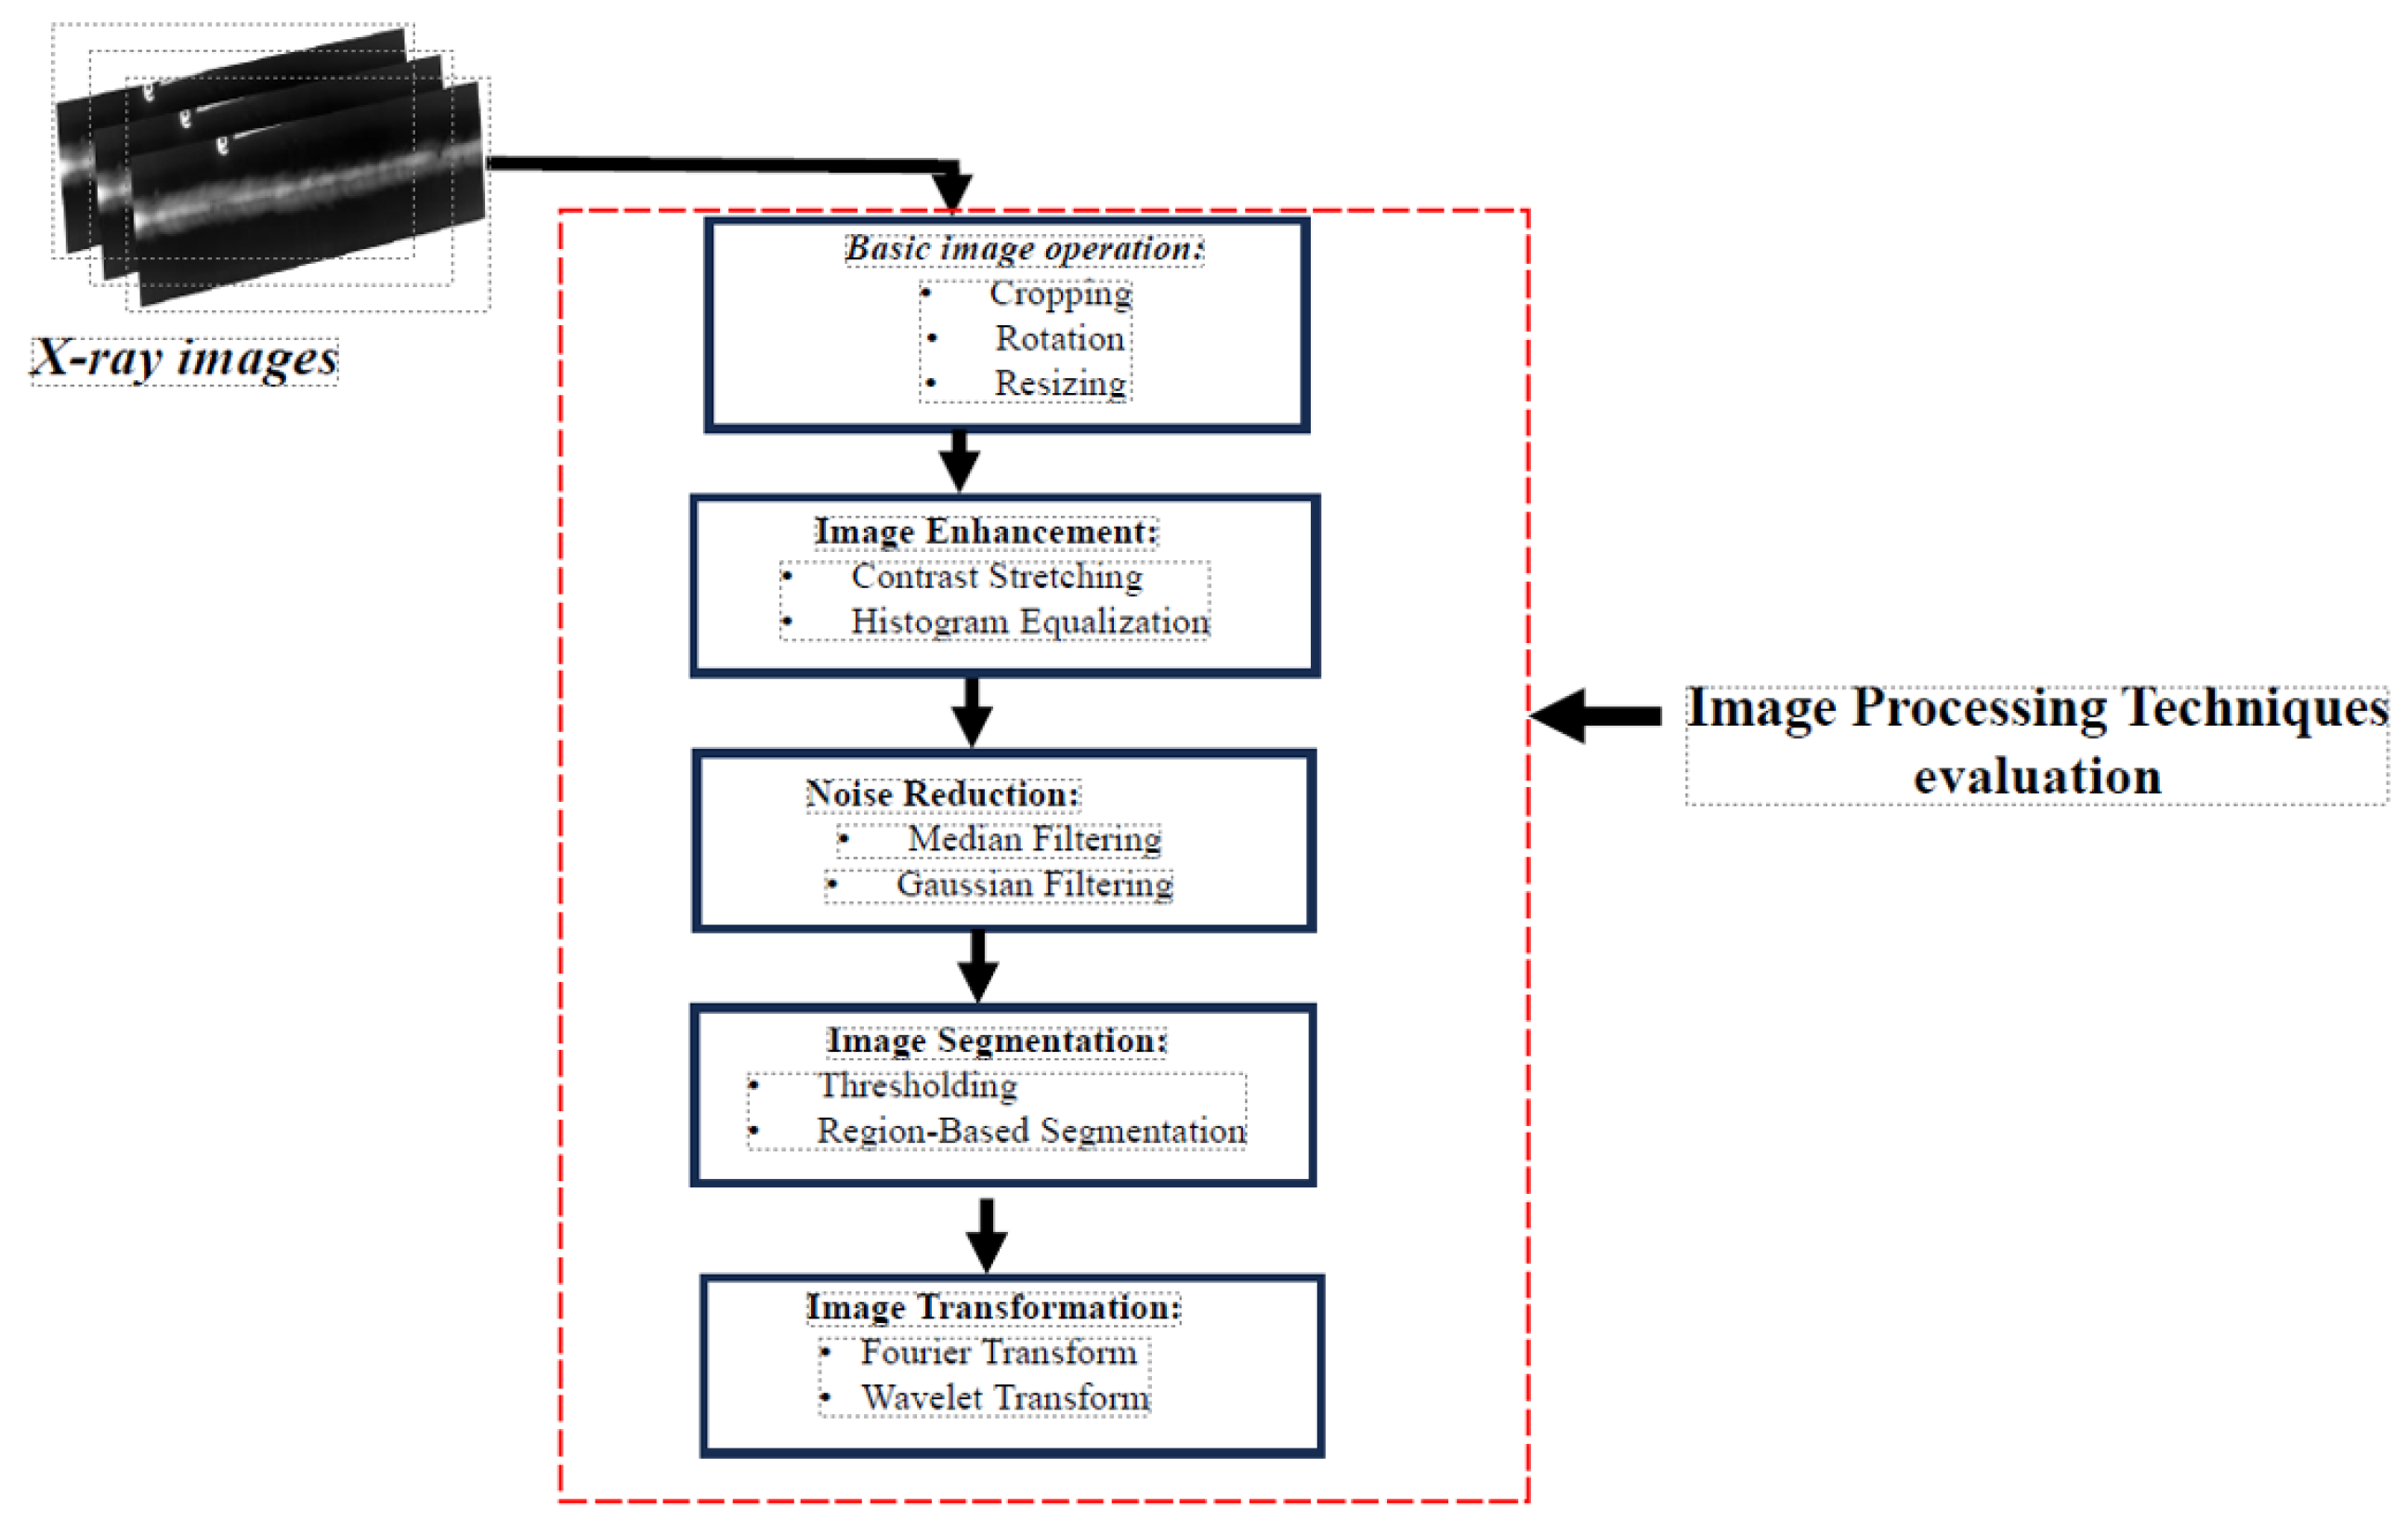
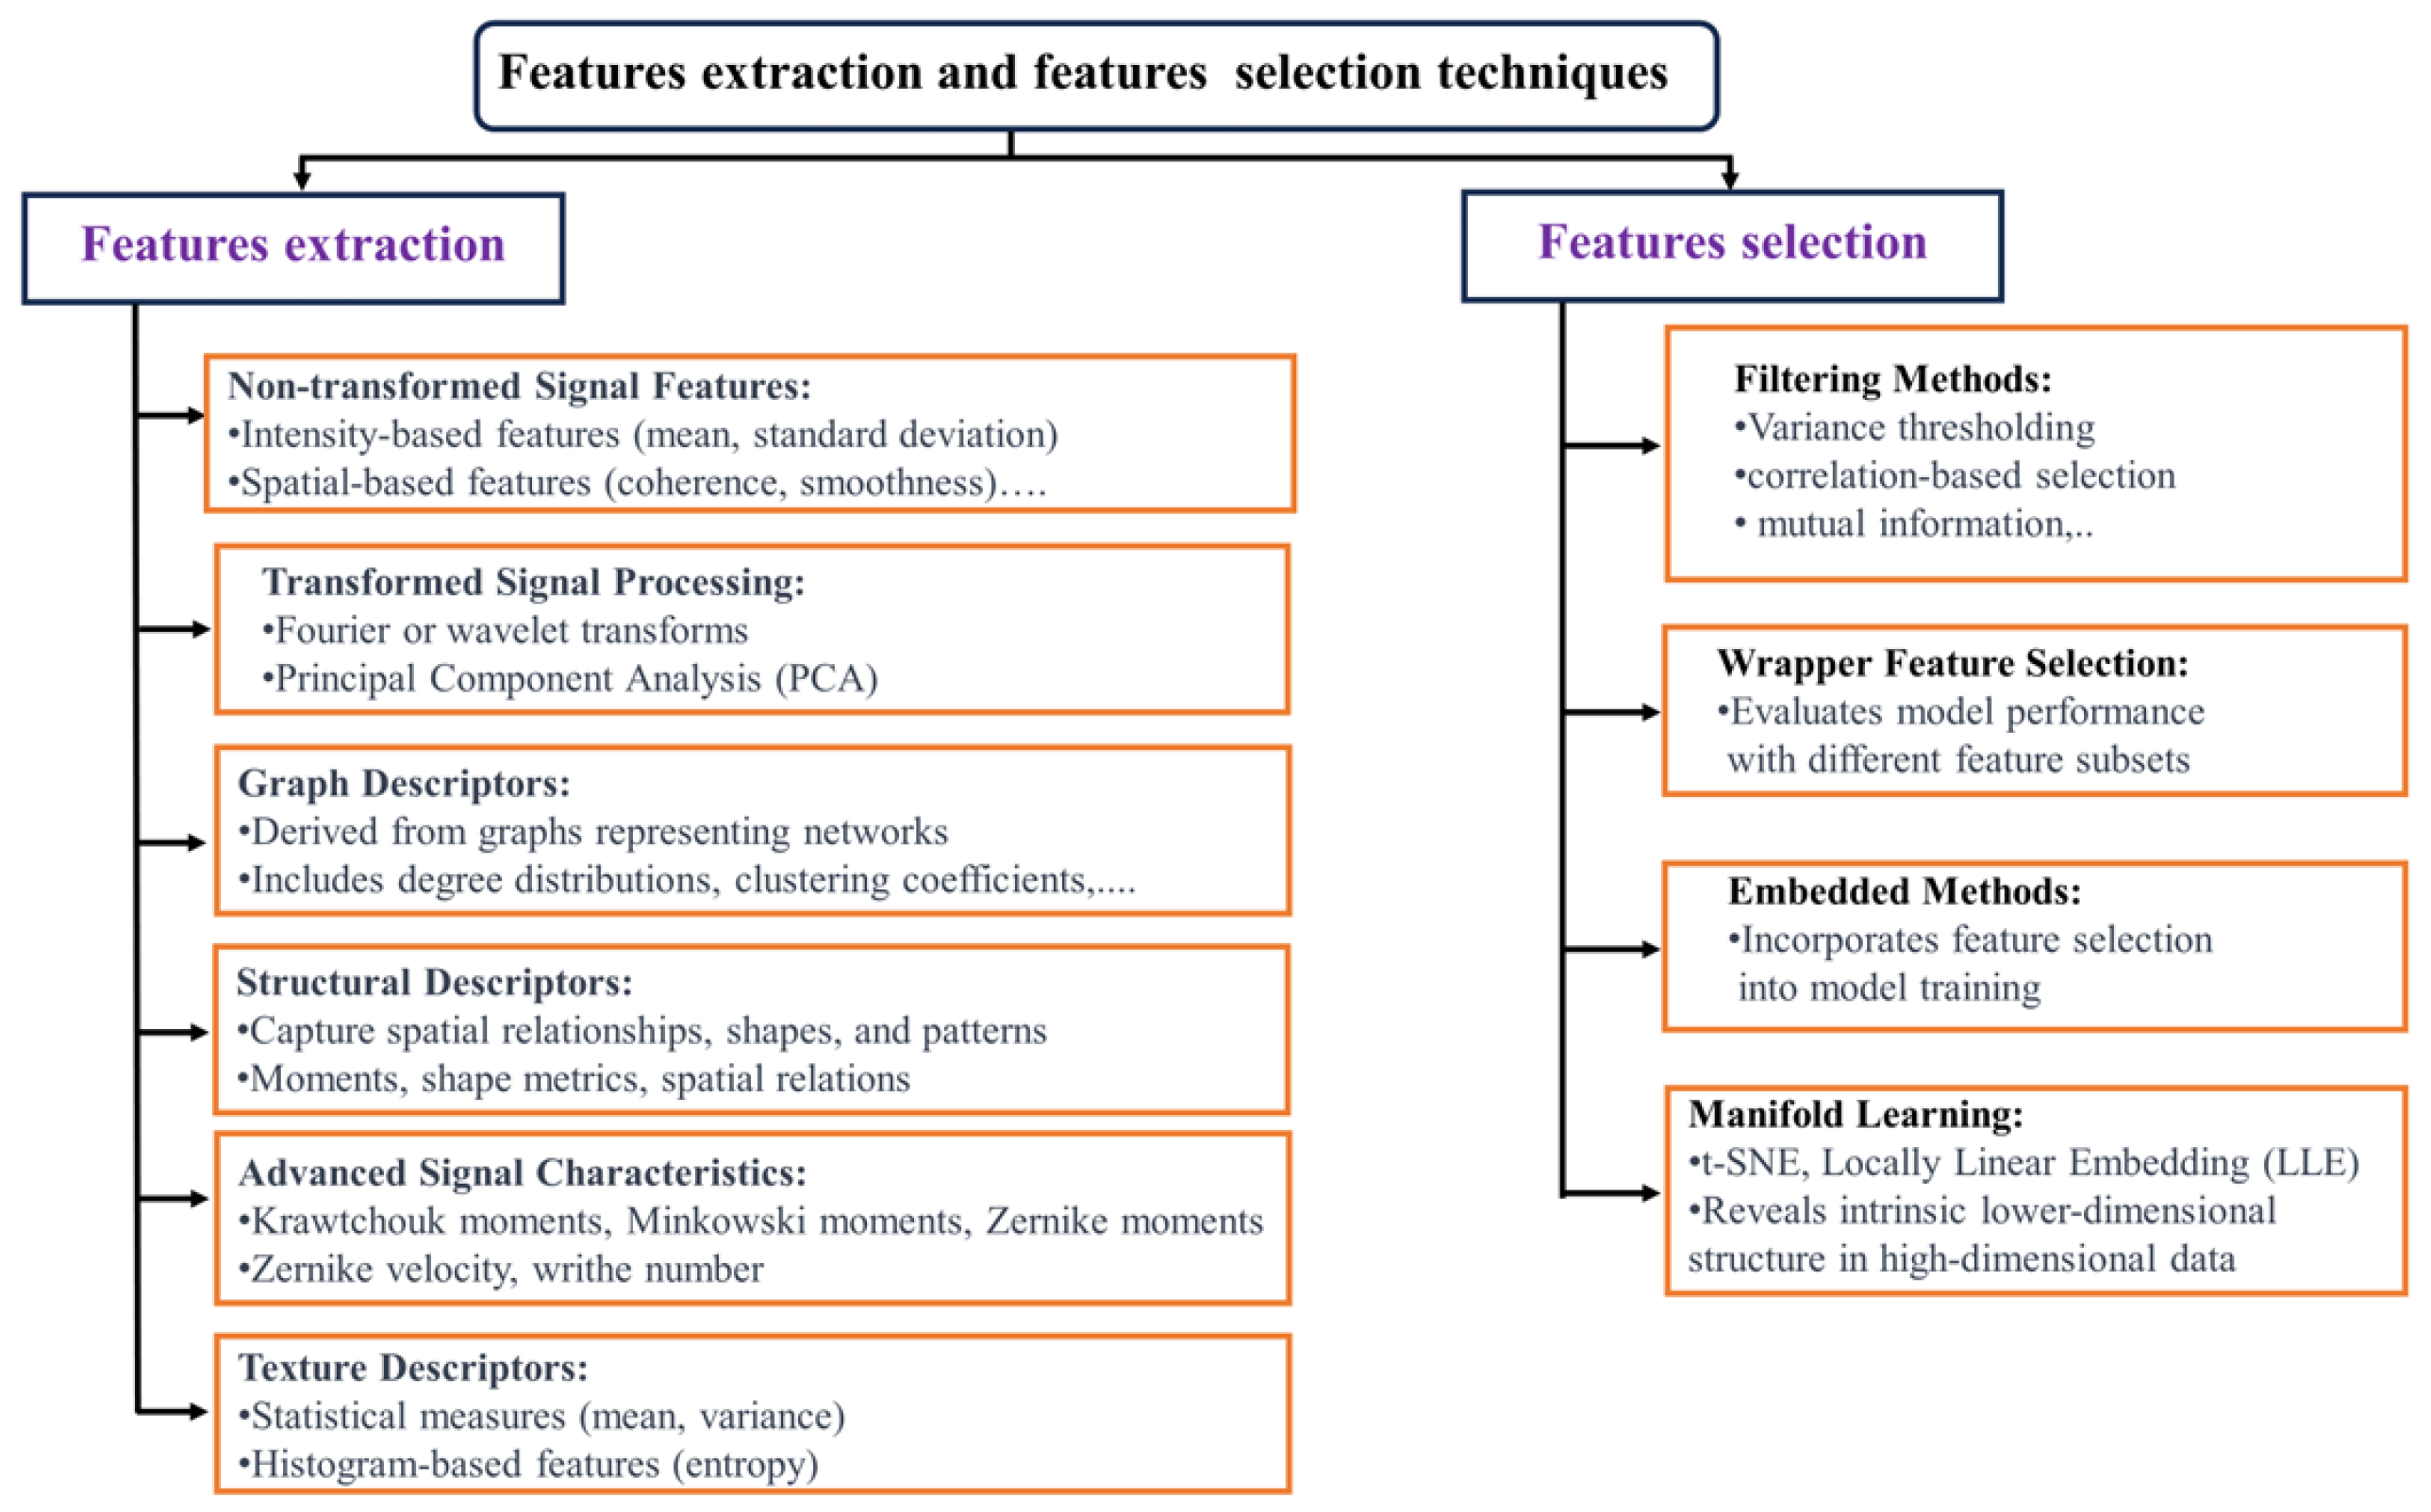
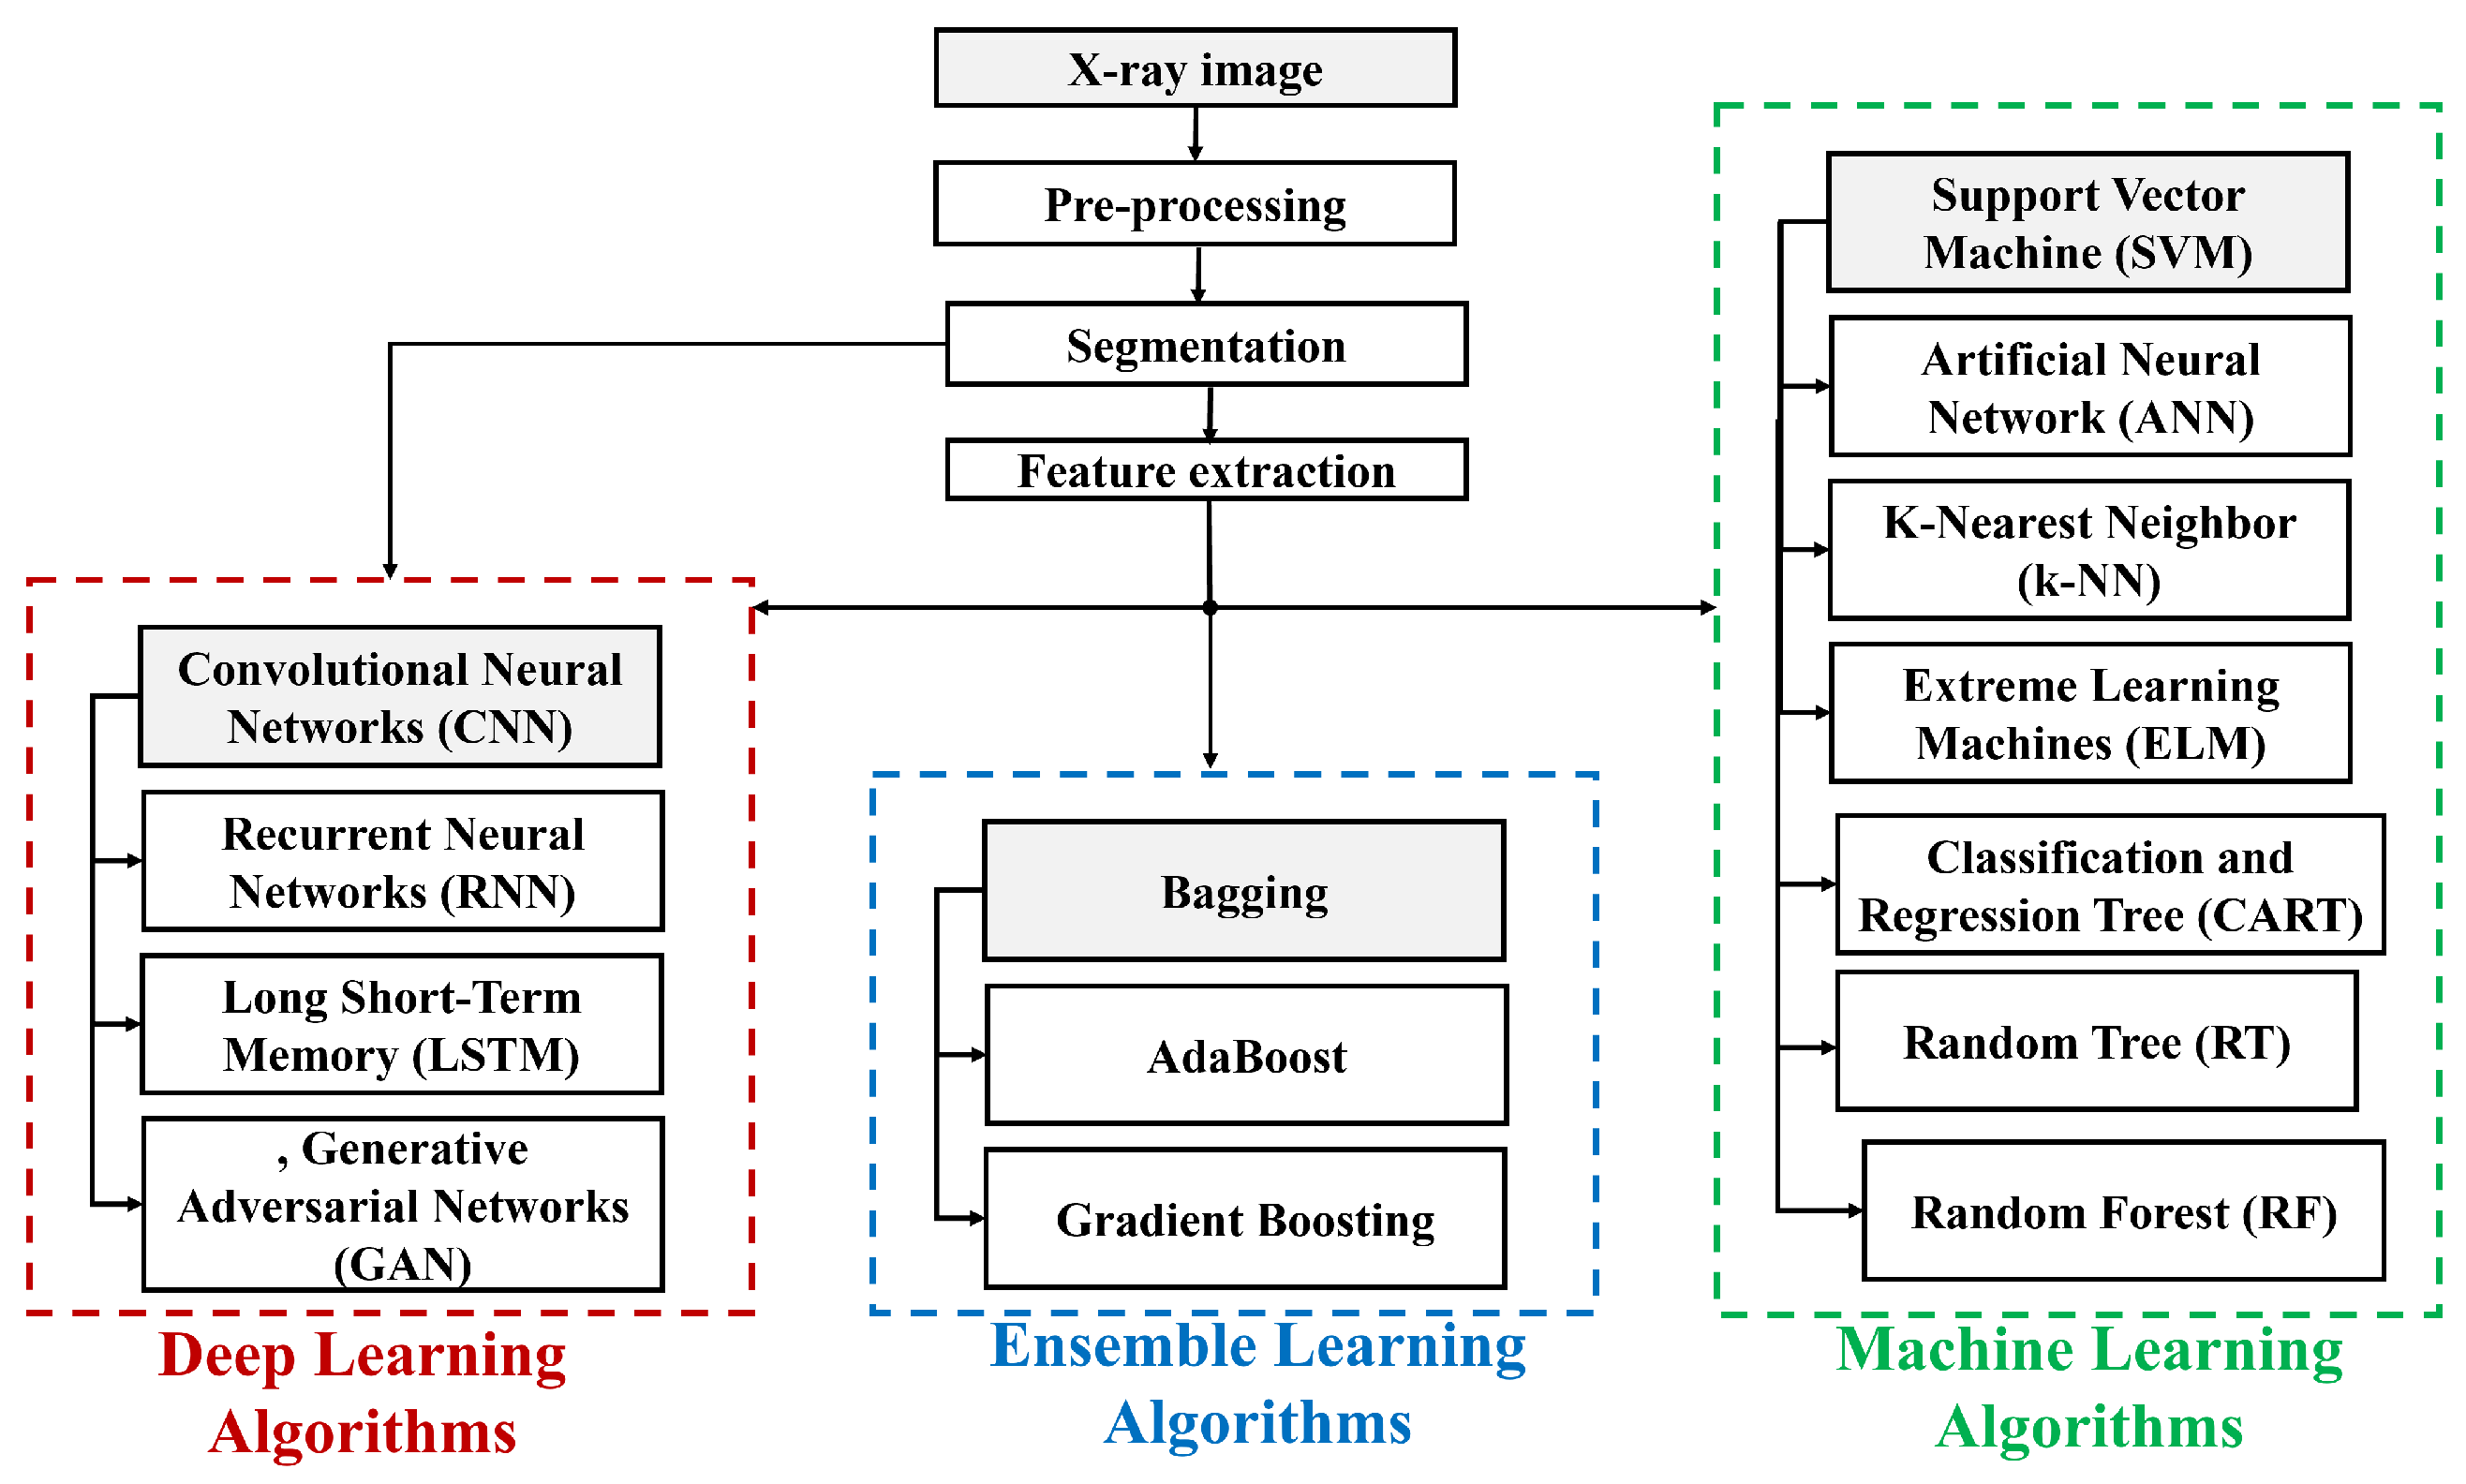
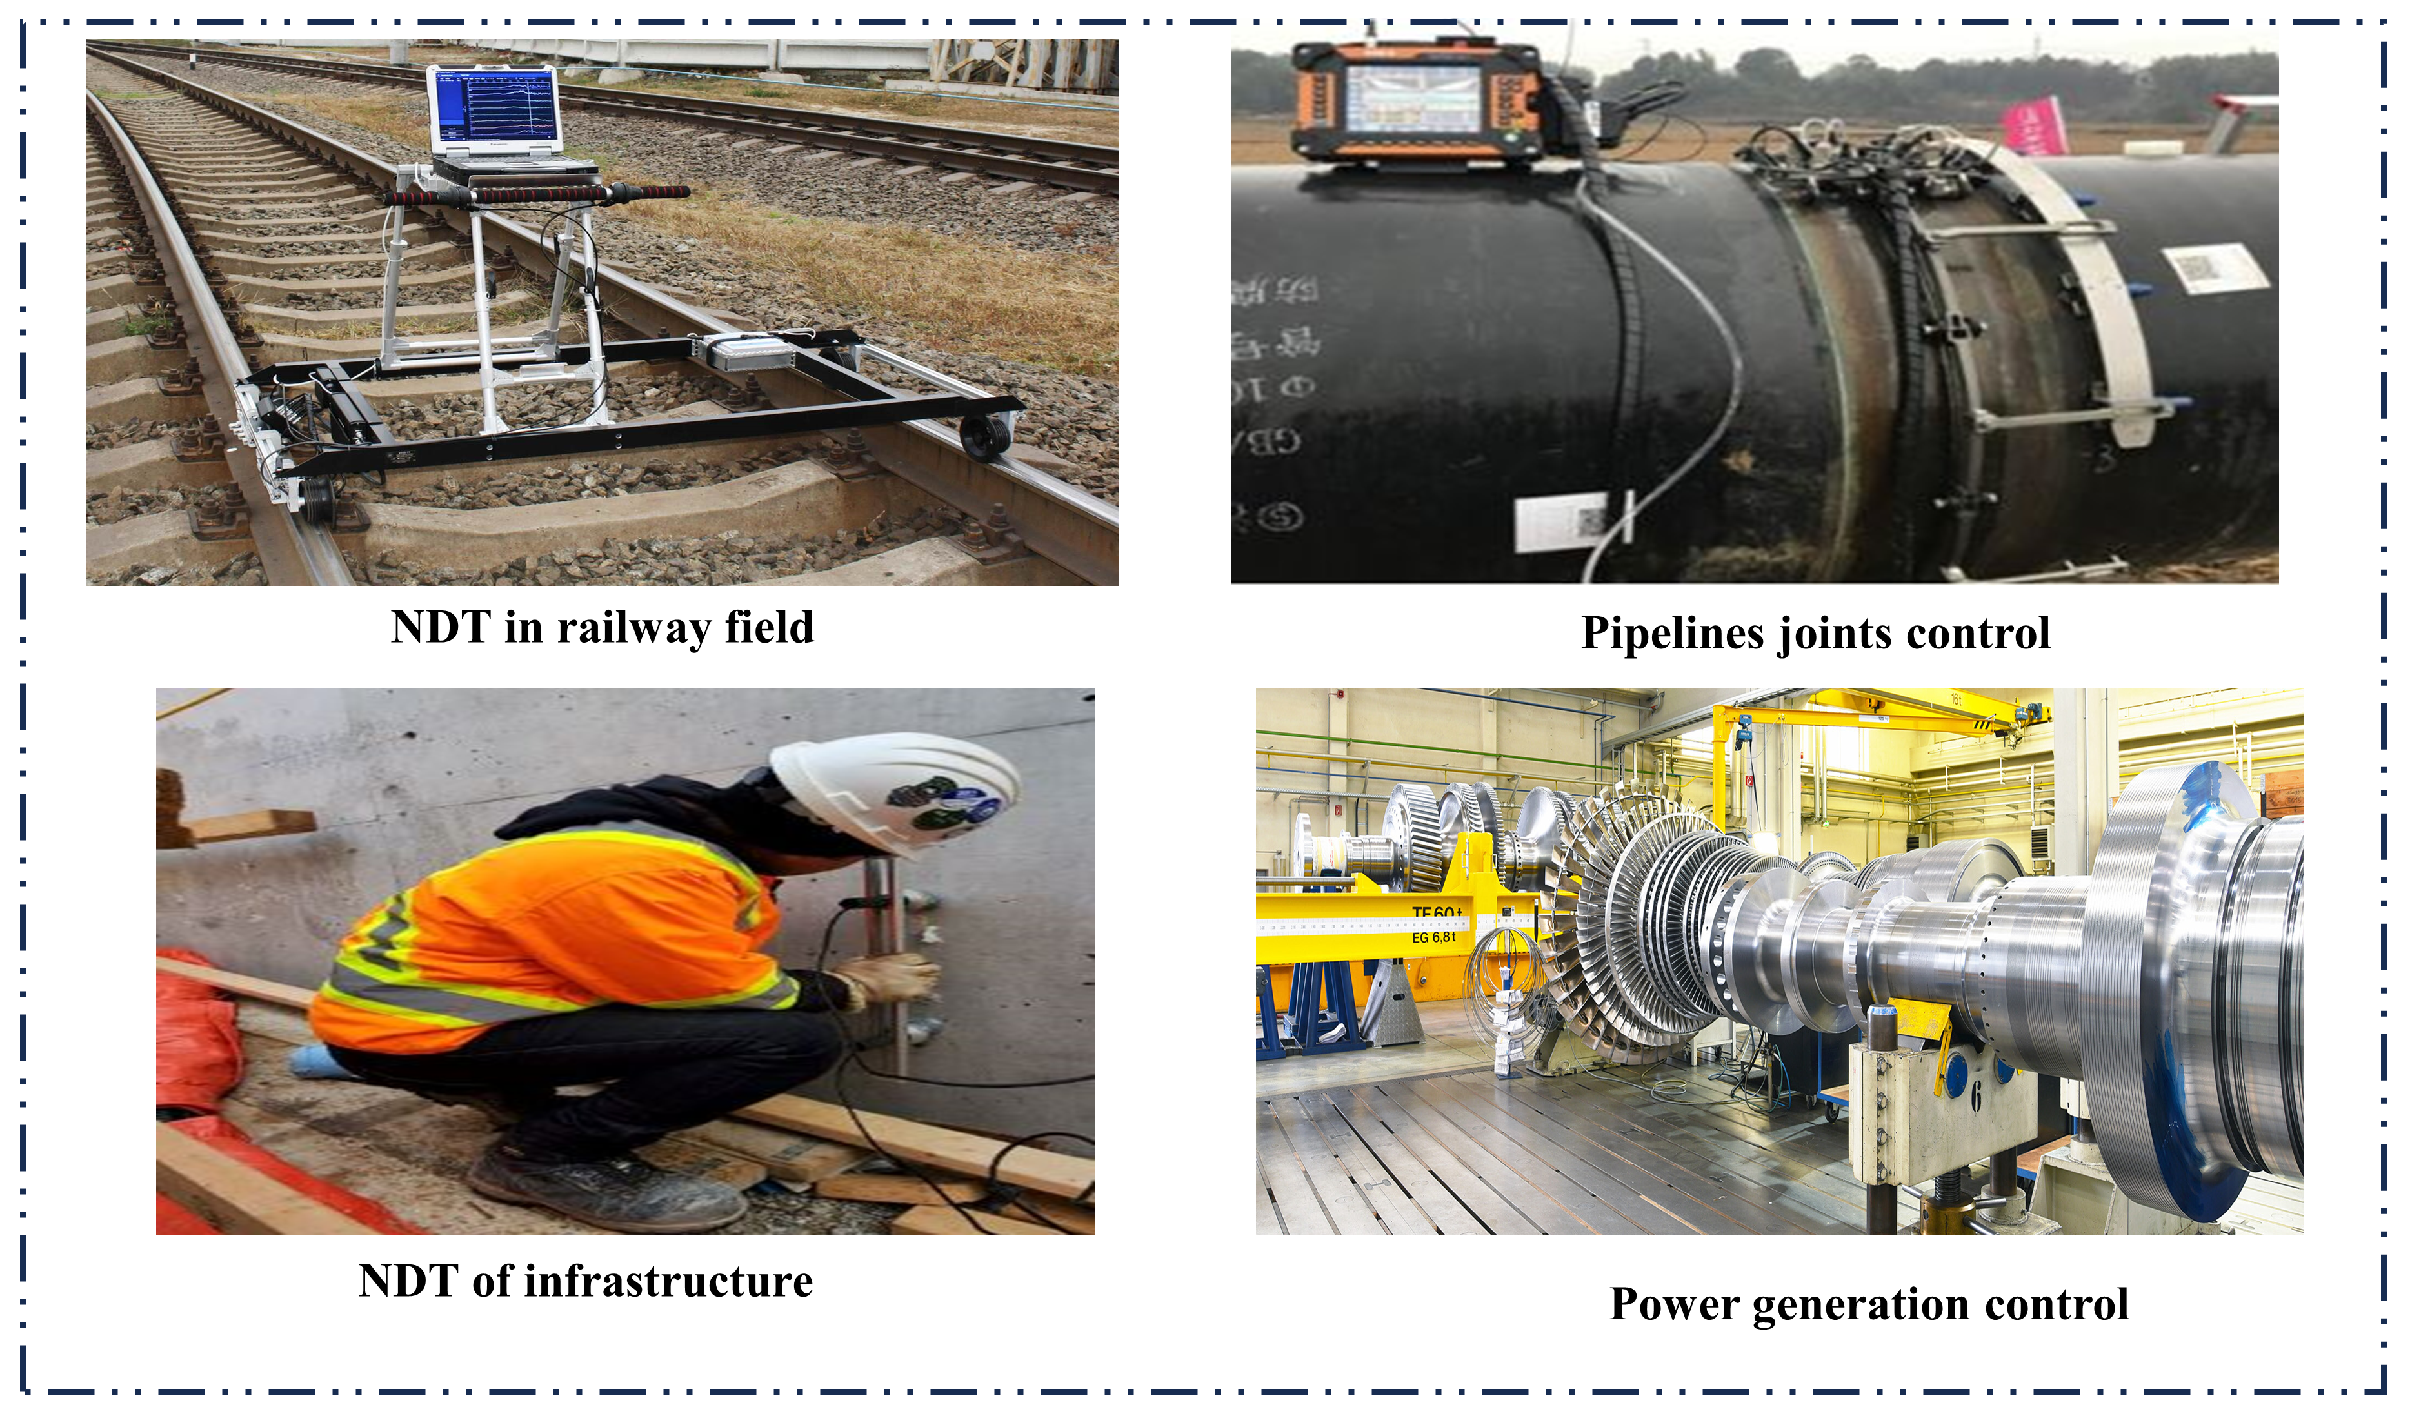
| references | contributions | limitations |
|---|---|---|
| A.madhvacharyula et al.(2022)[13] | highlight the real-time, in-situ approaches and provide valuable insight into weld defect detection methods. |
Oversimplify the complex algorithms and lack exhaustive coverage. |
| M.shaloo et al. (2022) [33] | The importance of non-destructive testing (NDT) for defect detection in wire and arc additive manufacturing and fusion welding, providing insights into various techniques and their practical implications. | Detecting defects by relying on existing research and industry testing. |
| J.rao et al. (2023)[34] | The transformative impact of additive manufacturing (AM), particularly in the nuclear, energy, and aerospace industries, emphasizing the role of non-destructive testing (NDT) techniques, | The integration of advanced artificial intelligence and machine learning techniques in non-destructive testing |
| X.Shen et al. (2023)[35] | The identification of metal elements in safety-critical structures using non-destructive testing (NDT), with a focus on early crack detection and the integration of advanced methods such as machine learning and artificial intelligence. | The use of artificial intelligence and X-ray image processing methods for non-destructive testing of welds. |
| I.ramirez et al. (2023)[36] | the importance of additive manufacturing in the Fourth Industrial Revolution, underscores the need for efficient non-destructive testing (NDT) inspection methods, and takes an in-depth exploration of approaches and standards for quality control and defect detection. | The use of X-ray technology and the integration of artificial intelligence to detect welding defects. The focus is on improving the accuracy and efficiency of defect detection through specialized methodologies. |
| W.cai et al. (2020)[37] | Real-time, multi-sensor, artificial intelligence-based laser welding monitoring is important for optimizing efficiency and ensuring quality in many industries.. | highlight the essential role of real-time monitoring supported by advanced technologies such as X-ray and AI. |
| DN.lavadiya et al.(2022)[38] | Applying deep learning to assess the condition of bridge decks, with a focus on identifying surface and subsurface defects. | Exploration of deep learning methods for bridge deck condition assessment, specifically to improve the identification and categorization of surface and subsurface defects. |
| M.amarnath et al. (2023)[39] | Defect detection in industrial automation, especially in TIG welding, using deep learning, with a focus on demonstrating the potential of convolutional neural networks (CNN) and vision transformers. | The focus on advancing defect detection through the innovative integration of X-ray technology |
| A. Saberironaghi et al. (2023) [40] | Applying deep learning techniques to detect surface defects in industrial products and X-ray images | The move to deep learning for surface defect detection, expanding the field through in-depth investigations and proposing practical solutions to address the challenges identified. |
| Li, Yaping, et al. (2019)[57] | The implementation of a deep learning network to detect defects in welds from X-ray images, with a focus on efficient detection of these defects. | Detection of weld defects in pipelines with a tailored approach to the challenges of pipeline weld inspection. |
| S.Sudhagar et al. (2020)[58] | Proposes a quantitative evaluation of the friction stir welding process using X-ray images. The aim is to reveal the optimal process parameters for this welding technique. | The advancement of artificial intelligence algorithms in X-ray-based weld inspection to overcome limitations associated with assumptions about the relationship between defect area and mechanical properties. |
| Liu et al. (2023)[41] | Examine the analysis of radiographic images in welding, providing key insights and identifying pertinent challenges in the field. | Represents an evolution by introducing a more technologically sophisticated approach to addressing challenges in the field. |
| Chen, Ji et al. (2023)[26] | Integration of the Feature Pyramid Network (FPN) and a novel visual attention mechanism (SPAM) for weld defect detection. | Precise parameter tuning and the potential for bias in the dataset |
| J. Kastner al. (2015)[59] | The study of flat-panel matrix X-ray computed tomography for non-destructive scanning, which provides valuable insight into heterogeneities. | Analysis and visualization of the generated XCT data requires advanced 3D image processing techniques.. |
| A. Bansal et al. (2023)[60] | The effectiveness of computer-based processing to potentially automate defect detection using a unique image-based approach. | Recognizes the difficulties associated with weld defect detection, including dependence on external factors and variations in defect characteristics |
| Zhao et al. (2021)[42] | The use of ceramic materials and their susceptibility to imperceptible defects underscores the critical importance of non-destructive testing methods. | The timely detection and prevention of these defects, with the study examining the related issues in non-destructive testing for ceramics.. |
| Gupta et al. (2022)[3] | highlight the technological advances that have expanded the use of NDT beyond traditional industries. | Integrate artificial intelligence or automation to improve accuracy and reduce the need for manual inspection. |
| Ramalho et al. [43] | The effect of defects on sound waves in Wire Arc Additive Manufacturing, successfully identified using Power Spectral Density and STFT analysis. | A broader and potentially more comprehensive approach that considers visual and structural aspects in addition to acoustic signals. |
| Luo et al. [44] | Analyze the acoustic emission signals during pulsed YAG laser welding, revealing the effect of the plasma plume on acoustic parameter. | Involves investigating a wider range of welding conditions and incorporating additional factors to improve the applicability of acoustic emission analysis in detecting welding defects. |
| Zhang et al. [45] | Acoustic emission and air-coupled ultrasonic testing for real-time monitoring of burn-through events in gas tungsten arc welding (GTAW). | Expand the scope to include various weld defects beyond burn-through events. |
| Elkihel et al. [46] | Investigate heat propagation in a weld using active thermography and find significantly greater heat loss in the weld zone compared to the flawed area. | Explore different temperatures, heating methods, and defect types to understand the broader implications of heat propagation in welds. |
| Massaro et al. [47] | Developed a method combining infrared thermography and image processing for real-time identification and classification of weld defects on a steel tank, demonstrating the effectiveness of techniques such as the Long Short Term Memory (LSTM) artificial neural network. | Optimize and fine-tune the combination of vision and thermography techniques to detect and classify a wider range of weld defects. |
| Ziegler et al. [48] | The use of high-power lasers in lock-in thermography, suggesting their minimal impact on thermal emission, allows effective application in one-sided transient thermography. | Experimental validations and comparisons of the effectiveness of high-power lasers in lock-in thermography across different materials, welding scenarios, and defect types. |
| Sun et al. [49] | Present a hybrid ultrasonic sensing system, diffuse ultrasonic wave (DUW), using PZT actuators and FBG sensors for damage detection in railroad tracks. | Focus on validating the DUW system on different track materials and configurations, assessing its sensitivity to different types of damage. |
| Chakraborty et al. [50] | Introduction of a crack detection method using an advanced signal processing algorithm. | Explore the incorporation of advanced machine learning for automated crack detection and classification based on signal processing results. |
| Chakraborty et al. [51] | Propose an active approach to damage detection in multiple structures using embedded ultrasonic sensors. | The adaptability of the proposed damage detection approach to different types of structures and materials. |
| F.xie et al. [52] | Use pulsed eddy current (PEC) testing to detect weld flaws in large pressure vessel cylinders. | Validation by radiographic testing confirming its ability to detect subsurface defects in welds. |
| T.alvarenga et al. [53] | Present an embedded system for real-time rail anomaly detection using eddy current, wavelet transforms, and a convolutional neural network. | Integrate other advanced signal processing techniques or machine learning algorithms |
| R.M. Gansel et al. [54] | The effectiveness of eddy currents in discriminating groove depths and detecting actual fatigue cracks, providing critical information for assessing the structural integrity of wind turbines. | Explore advanced signal processing, machine learning integration, real-world application studies, comparative analysis, parameter optimization, and cost-benefit analysis to further advance this inspection approach. |
| G.Y. Liu et al. [32] | Improve weld flaw detection using magneto-optical imaging, applying finite element analysis and proposing an image fusion method based on pixel standard deviation for improved visual effects in nondestructive welding flaw inspection. | Use fast guided filtering and pixel standard deviation to merge multi-frame magneto-optic images |
| F.brauchle et al. [55] | Detect production defects in lithium-ion cell manufacturing using an enhanced Magnetic Field Imaging (MFI) setup and current reconstruction. | Exploration of advanced signal processing techniques or integration of complementary technologies to address specific challenges in detecting subtle defects could be areas of focus. |
| J. Ai et al. [56] | The effectiveness of eddy current magneto-optical imaging for defect detection in carbon fiber reinforced polymers (CFRP) | Optimization of the scanning eddy current magneto-optical imaging device, and exploration of variations in the inspection method parameters. |
| Method | Advantages | Disadvantages |
|---|---|---|
| VT | An affordable and uncomplicated solution, perfect for surface flaws, ensures immediate improvement [61]. | The effectiveness of this method heavily relies on the inspector’s expertise, making it imperative for experienced professionals to ensure accuracy. While proficient in identifying surface defects, its scope is restricted, rendering it unsuitable for internal or subsurface inspections [62]. |
| UT | This method boasts remarkable precision in identifying internal flaws across various materials, showcasing its versatility. Its capability to provide real-time results adds to its appeal, making it a valuable asset in numerous applications [63]. | This process demands skilled operators for effective execution, as its outcomes can be influenced by the properties of the materials involved. Moreover, its application is restricted to surfaces that are readily accessible [64]. |
| IRT | Utilizing a non-contact and non-intrusive approach, this method swiftly inspects expansive areas while adeptly identifying subsurface defects [65]. | This method’s effectiveness hinges on environmental conditions and is primarily tailored for surface defects, albeit constrained by equipment costs [66]. |
| ECT | This technique exhibits a high sensitivity to surface flaws, delivering immediate results [67]. | This method’s penetration is limited, and its results can be influenced by the conductivity of the material being tested. A qualified operator is necessary for accurate implementation [68]. |
| AE | This technique excels in detecting active defects, offering real-time monitoring capabilities while effectively identifying faults even under load conditions [69]. | This method may face interference from background noise and is most suitable for high-stress applications. Expert analysis is necessary for accurate interpretation of results [69]. |
| RT | Utilizing high-resolution capabilities and a non-contact methodology, this approach accurately exposes internal defects, supplying ample data for thorough analysis [70]. | This approach presents challenges due to intricate procedures, rigorous security measures, and the use of costly equipment that exposes individuals to radiation [70]. |
| MT | This method provides real-time results for immediate assessment and is particularly effective for ferrous materials, it offers a cost-effective and time-efficient solution [71]. | This method is vulnerable to environmental influences and demands meticulous surface preparation. Additionally, its ability to detect deeper defects is constrained by limited penetration [72]. |
|
Dataset Name |
Description | Access Link |
|---|---|---|
| GDX-ray[75] | - Benchmark dataset for evaluating deep learning models in weld inspection. -Focuses on weld defect evaluation using meticulously curated X-ray images. |
https://Demery.ing.puc.cl/index.php/ material/gdxray |
| RIAWELC[73] | -Curated collection of X-ray images for weld defect classification tasks. -Essential for developing and refining deep learning models in NDT. |
https://github.com/stefyste/RIAWELC |
| WDXI[79] | -Dedicated resource for research in weld defect detection using X-ray imaging. -Provides a variety of X-ray images to improve the accuracy of weld defect identification algorithms. |
https://www.researchgate.net/publication/332376907 _WDXI_The_Dataset_of_X-Ray_Image_for_Weld_Defects |
Disclaimer/Publisher’s Note: The statements, opinions and data contained in all publications are solely those of the individual author(s) and contributor(s) and not of MDPI and/or the editor(s). MDPI and/or the editor(s) disclaim responsibility for any injury to people or property resulting from any ideas, methods, instructions or products referred to in the content. |
© 2024 by the authors. Licensee MDPI, Basel, Switzerland. This article is an open access article distributed under the terms and conditions of the Creative Commons Attribution (CC BY) license (http://creativecommons.org/licenses/by/4.0/).


