1. Introduction
In geothermal power plants, geothermal scale such as carbonate and silica compounds are formed in the piping due to the supersaturation of inorganic salts in the geothermal fluid because of pressure and temperature changes. This scale accumulation is a problem because it interferes with the stable operation of geothermal power plants. Scale control measures include pH adjustment, high-temperature reinjection, and removal of excess silica of geothermal brine [
1,
2,
3,
4,
5,
6]. Therefore, a scale formation evaluation method is required. So, our laboratory has developed several fiber optics, “scale sensor”, that can evaluate scale formation on-site in a short time and real-time by taking advantage of the characteristics of optical fiber, such as pressure and heat resistance, which are suitable for measurement in geothermal fluids (Real-time type method) [
7,
8,
9,
10,
11,
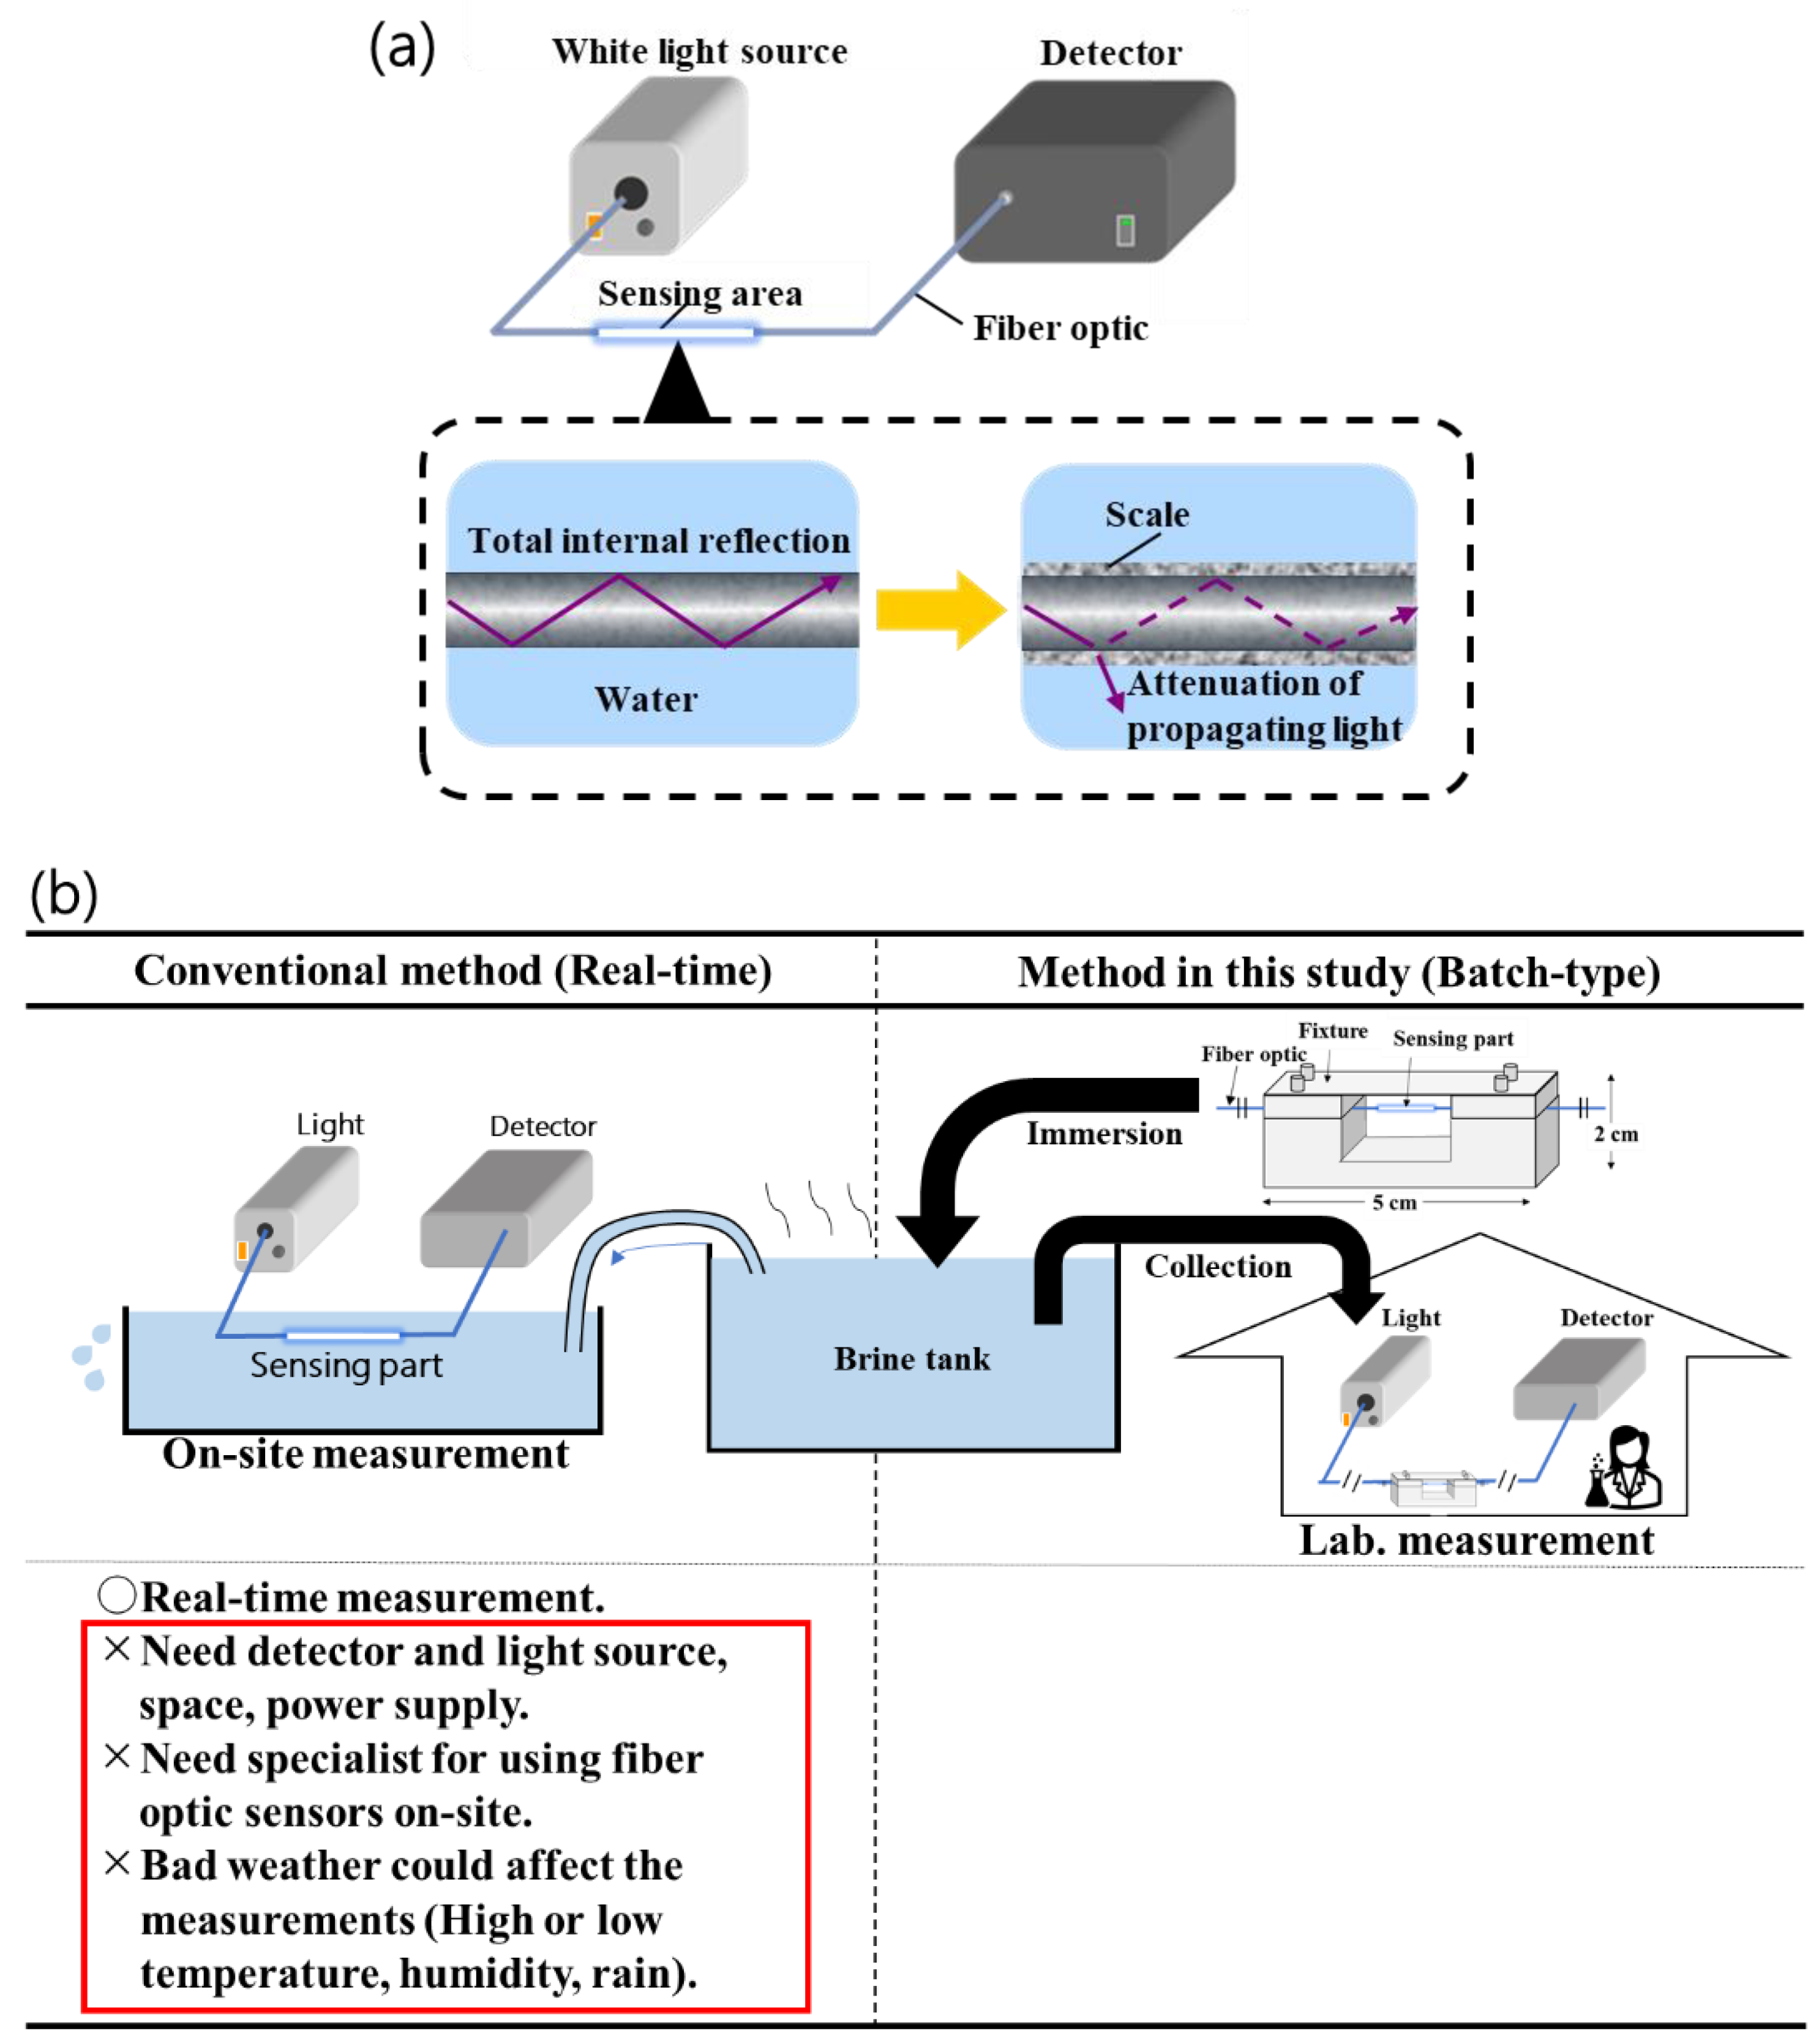
12]. In this method, one end of a fiber optic sensor is connected to a light source and the other end is connected to a spectrometer to measure scale generation while monitoring it in real time (
Figure 1a). In this sensing system, inorganic salts with a refractive index higher than that of the sensing part adhere to the sensing part, preventing total reflection of light propagating in the sensor and attenuating the amount of light propagation, thus allowing evaluation of scale generation. To confirm the effectiveness of the sensor, various tests were also conducted in geothermal water utilization facilities like
Sumikawa geothermal power plant [
7,
8,
10,
12]. This method is suitable for short-term measurements, but technically difficult to measure for long-term and at high-temperature and high-pressure environments in real-time. In addition, the current method requires specialized knowledge to manipulate the sensors and technicians at geothermal power plants or other sites cannot be used. Also, when applied in the field, power supplies for devices like PC are also needed, but in some sites power supplies may not be available. Since the scale sensor is intended for use at geothermal water utilization facilities and other sites, it is necessary to have a measurement method that can be used by anyone, that can be easily used at sites where it is difficult to secure a power source and space for measurement, and that can be used even under sudden weather changes (high temperature, low temperature, humidity, and heat).
In this study, we propose a method based batch-process sensing for scale formation in geothermal brine to evaluate easily for everyone on-site (Batch-type method,
Figure 1b). In this method, a section of an optical fiber sensor is immersed in geothermal brine, and the optical fiber section collected in certain time is connected to a measuring instrument to evaluate inorganic salt precipitation based on the propagating light intensity of the optical fiber before and after the reaction. This novel measurement method reduces the amount of on-site work and measuring equipment, is not affected by weather conditions, and is a simple measurement method that solves the problems of the real-time type. In this time, we verified whether it can be manufactured stably, whether it has the same sensitivity and response as a conventional real-time type of method, and whether it can be used under high temperatures.
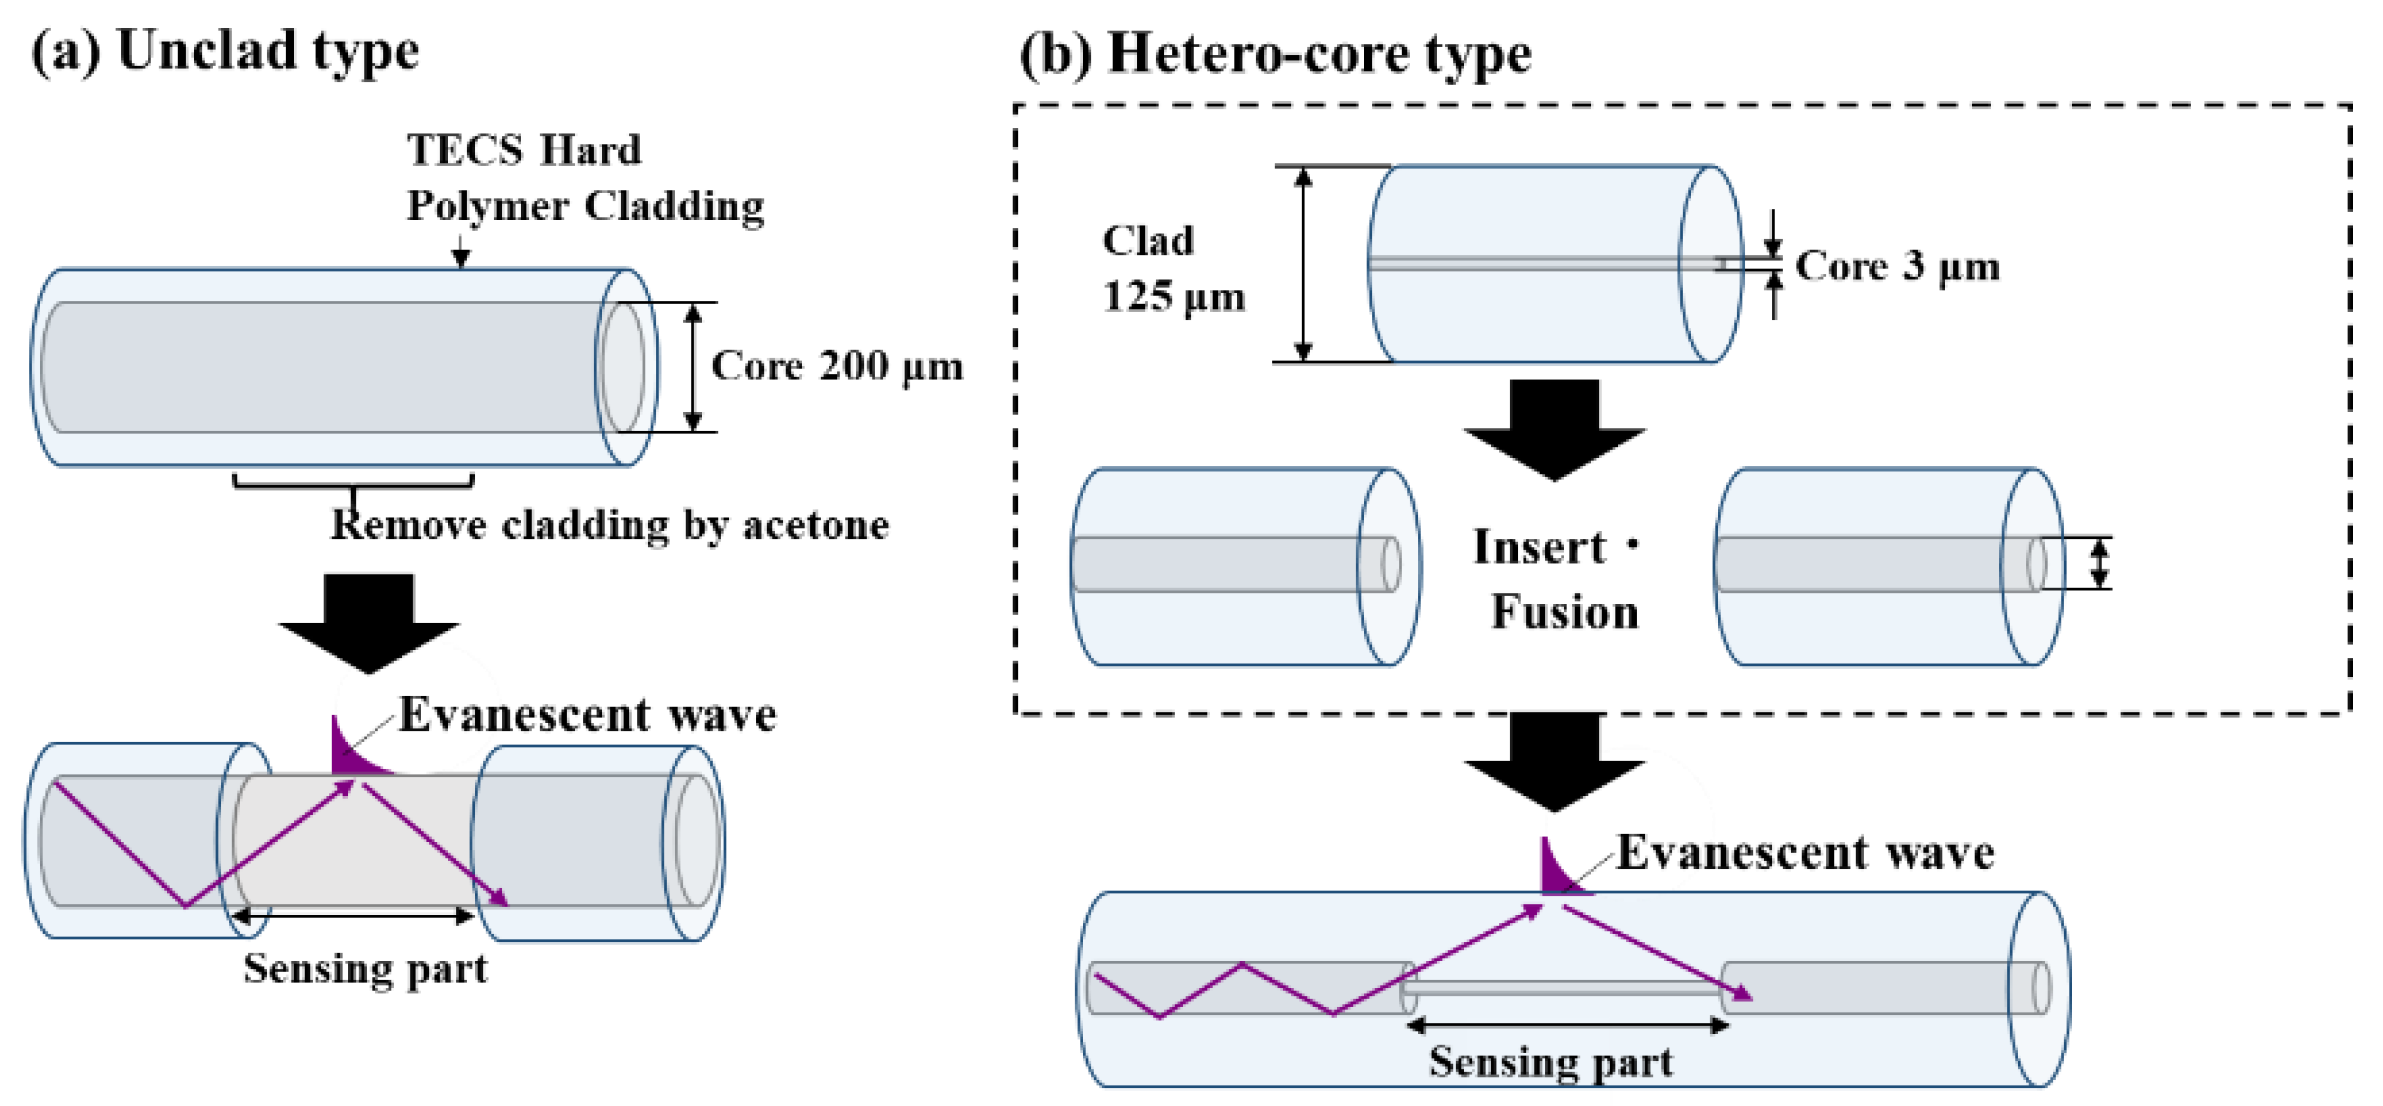
Moreover, the sensor structure was also investigated. Until now, optic fiber scale sensor was an unclad optic fiber sensor and be fabricated by removing the coating and cladding of a 200 µm core diameter step-index multimode optic fiber to expose its core (
Figure 2a; hereinafter referred to as “unclad sensor”) [
7,
8,
9,
10,
11,
12]. In this study, for batch-type methods, in addition to the unclad-type sensor, the hetero-core optic fiber sensor was investigated. Hetero-core sensor was developed by Watanabe et al. (
Figure 2b; hereinafter referred to as the hetero-core sensor) [
13,
14,
15,
16,
17]. This hetero-core fiber sensor has an easily fabricated simple structure with no need of cladding removal and be fabricated by using fiber optic for general telecommunications (core diameters of 50 μm and 62.5 μm) are extremely flexible and easier to handle. In this structure, the cladding surface could work as a sensing region because transmitted light is largely leaked into the cladding layer due to the core diameter difference between the transmission and inserted fibers. The hetero-core sensor has been applied as a sensor to measure acidity, humidity, liquid concentration, and hydrogen gas, and be fabricated by using two types of optical fibers [
13,
14]. Conventional unclad-type fiber optic scale sensors have large core diameters, such as 200 μm, which makes them inflexible, but hetero-core sensor could be more thin and better handling. In this study, we evaluated the difference between hetero-core and unclad sensors, and which sensor is better for the batch-type method.
Batch-type method must be used efficiently in other than geothermal facilities. Currently, carbon dioxide capture and storage (CCS) technology is attracting attention as a means of preventing global warming. In the CCS field, supercritical CO
2 is injected into sedimentary formations and oil reservoirs at temperatures below 100°C [
18,
19,
20]. The rate at which CO
2 injected underground is immobilized as carbonate minerals has not been measured on the sites. In Iceland, Carbfix project is conducted to inject CO
2-water into geothermal area, and 72% of it is estimated to be mineralized to calcite [
21]. In this innovative technology, determining efficient and effective CO
2 concentrations and fixation rates/mechanisms for carbonate mineralization plays an important role in promoting decarbonization. For evaluation CO
2 mineralization, various batch-type test of CO
2-H
2O-rock interaction is conducted [
22,
23,
24]. So, a batch-type scale sensor method in this study must be applied to those experiments easily and useful in the CCS field to evaluate carbonate mineral formation phenomena.
2. Materials and Methods
2.1. Chemical Reagents and Materials
Sodium hydrogen carbonate and calcium chloride were purchased from FUJIFILM Wako Pure Chemicals Industries (Osaka, Japan). All reagents were of analytical grade, and solutions of these compounds were prepared by distilled water.
2.2. Sensor Fabrication
For unclad fiber optic sensor showed in Fig.2a, a step-index multimode optical fiber (FT200EMT; Thorlabs, Newton, NJ, USA) with a 200 μm diameter fused silica core was used. The refractive index of fiber optic was 1.451, and it is surrounded by TEQSTM polymer cladding with a refractive index of 1.392 at 1020 nm. The fiber cladding was carefully removed from the middle of the fiber by rubbing and using acetone to expose the fiber core.
A hetero-core fiber optic scale sensor was fabricated by inserting and fusing a 15 mm single-mode fiber optic (SMF) with a 3.1 µm core diameter into a multimode fiber (MMF) with a 50 µm core diameter using a fiber cleaver (CT-32, Fujikura Ltd., Tokyo, Japan) and a thermal fusion splicer (FSM-100P+, Fujikura Ltd.) (Fig.2b). This fabrication method is relatively well-established technologies used in the maintenance and operation of fiber optic communication networks and serve as simpler methods.
2.3. Laboratory Study
For the real-time method, the optic fiber was passed through a metal U-shaped tube so that the optic fiber sensing was perpendicular to the ground and immersed in a 100 ml graduated cylinder containing a mixture (
Figure 3a) with equal amounts of 5 mM, 10 mM, 50 mM, and 100 mM in NaHCO
3 and CaCl
2 solutions. Both ends of the sensor were fused to patch cables (Patch cable, Thorlabs) and connected to a light source (Tungsten Halogen Light Sources, Ocean Insight) at one end and spectrometer (MV-3000 series, JASCO Corp., Tokyo, Japan) at the opposite end to continuously measure the change in transmittance response. The measuring cylinder and sensor portion were placed in a constant-temperature dryer maintained at 25°C and 95°C for 3 h.
For the batch-type evaluation method, a piece of the fabricated fiber optic sensor was placed in a Teflon cup (
Figure 3b). Then, the test solution was added. This solution has the same formula as that used in the real-time method. Next, the Teflon cup was placed in a high-temperature, high-pressure container made of SUS316 (nozzle-type stainless steel inner tube, Sanai-Kagaku, Nagoya, Japan) and reacted in a constant-temperature dryer at 25°C to 150°C. After the reaction was completed, the high-temperature, high-pressure container was removed from the constant-temperature dryer, cooled with water, and the sensor was collected. The collected sensor was then fused to a patch cord using a fusion tool, and light intensity was measured by connecting it to a light source and spectrometer. In addition, to prevent loss due to bending of the sensor portion during measurement, the sensor was straightened.
In those methods, transmittance (%) was calculated in wavelength of 560 nm as
where I
0 is the initial transmitted light intensity and I
t is the transmitted light intensity by time after immersion, respectively.
3. Results and Discussion
3.1. Comparison by Sensor Structure
In this part, the differences in sensitivity between sensor structures were compared to investigate which sensor structure is suitable for the novel batch-type evaluation method. Unclad and hetero-core sensors were used to measure the sensor response in a mixture of aqueous NaHCO
3 (100 mM) and CaCl
2 (100 mM) solutions in which CaCO
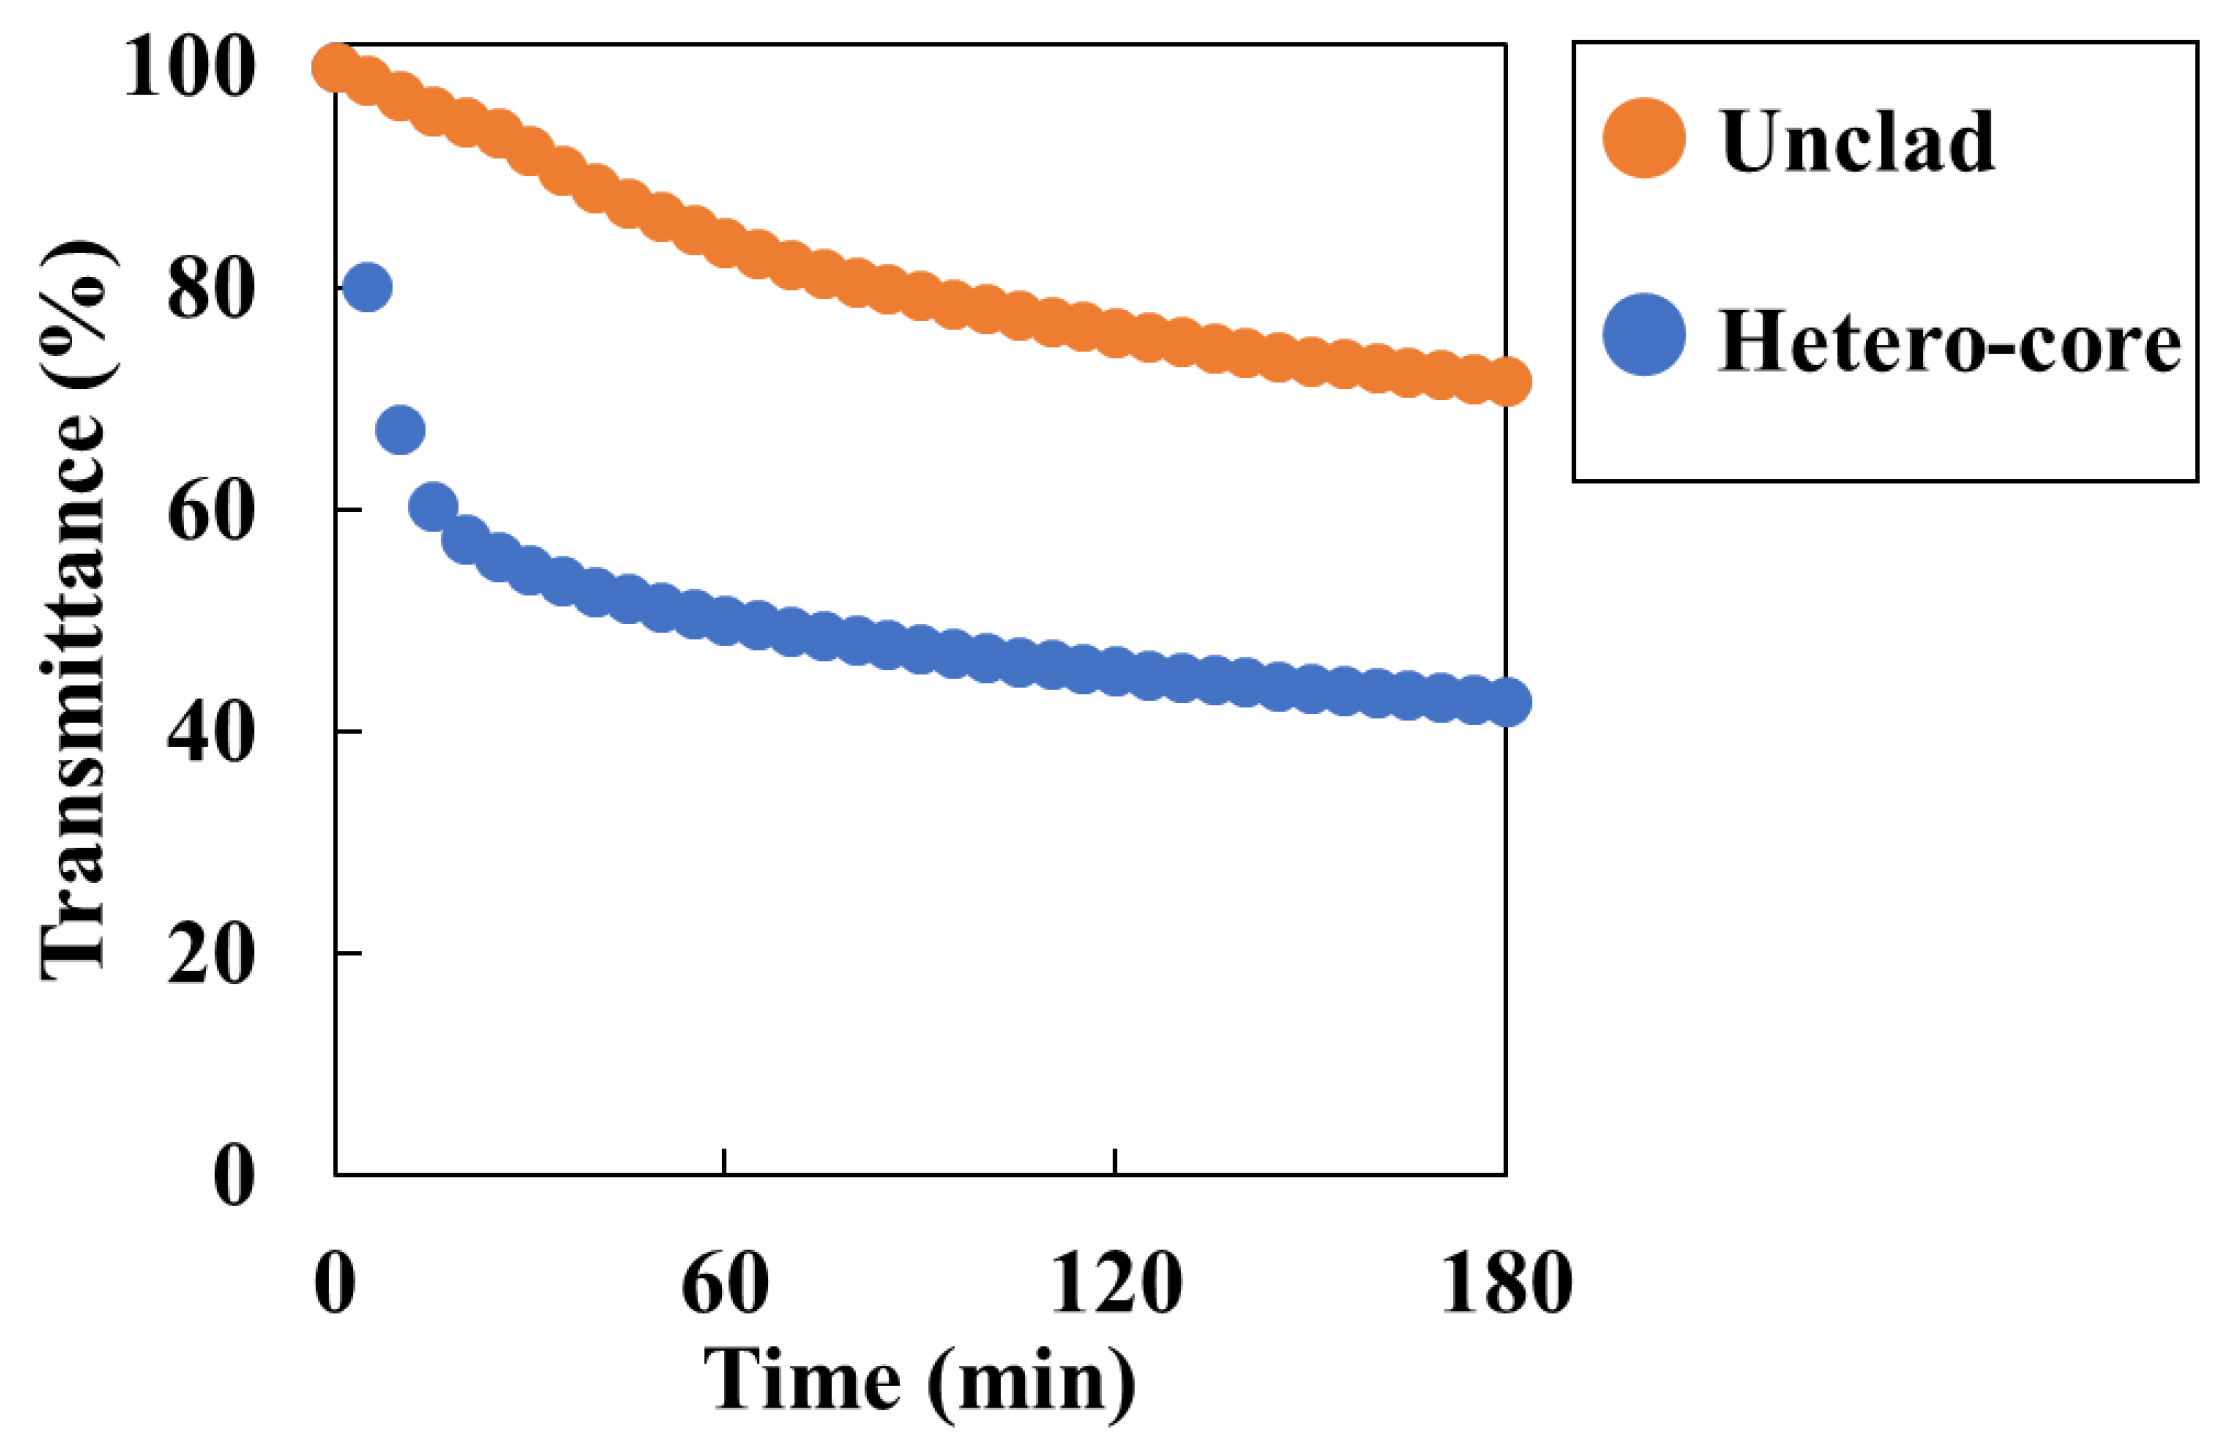
3 precipitates. The sensing area of both sensors was standardized to 15 mm. For the unclad sensor, transmittance decreased to approximately 70% after 3 h (
Figure 4). On the other hand, the hetero-core sensor’s transmittance decreased to approximately 40% and was more sensitive than the unclad sensor. The sensitivity depends on the number of reflections within the waveguide [
7,
25] and can be improved even in the unclad sensor if the core diameter can be further reduced. However, in optic fibers with smaller diameters, the cladding is made of silica material, which cannot be easily removed. Therefore, it becomes difficult to fabricate reproducible sensors. In this study, a hetero-core optic fiber, which has a shorter sensing length and higher sensitivity, and be good at handling was used and concluded as good for batch-type method.
3.2. Reproducibility of Optic Fiber Sensors
The batch-type method requires reproducibility with respect to sensor fabrication and connection to a light source and spectrometer due to compare the light intensity of the optical fiber sensors before and after scale formation. Therefore, the light intensity propagating between individual sensors must be the same. Until now, it was usual to manually polish the sensor end faces or connect them to a terminator (SMA905 and BFT1, Thorlabs), which introduced errors when connecting them to the measurement device. In this research, instead of manual operation, a thermal fusion splicer was used to mechanically connect the sensor to the measurement device, making it possible to apply to batch-type sensors. So, the light intensity could be comparable. The measurement reproducibility of optic fiber sensors was investigated for unclad and hetero-core sensors. For each sensor, three optic fibers were fabricated, and the measurement reproducibility was evaluated based on the light intensity propagating error in the fiber optic. As a result, it was possible to measure light intensity with a coefficient variation of 0.06 for the unclad type. The hetero-core type could also be measured with a coefficient variation of 0.03 (
Table 1). Fabrication is made by fusing the sensor to the patch cord when connecting the sensor to the light source and spectrometer. Therefore, the sensor can be used as an evaluation method regardless of whether it is of the hetero-core or unclad-type.
3.3. Real-Time and Batch-Types Method
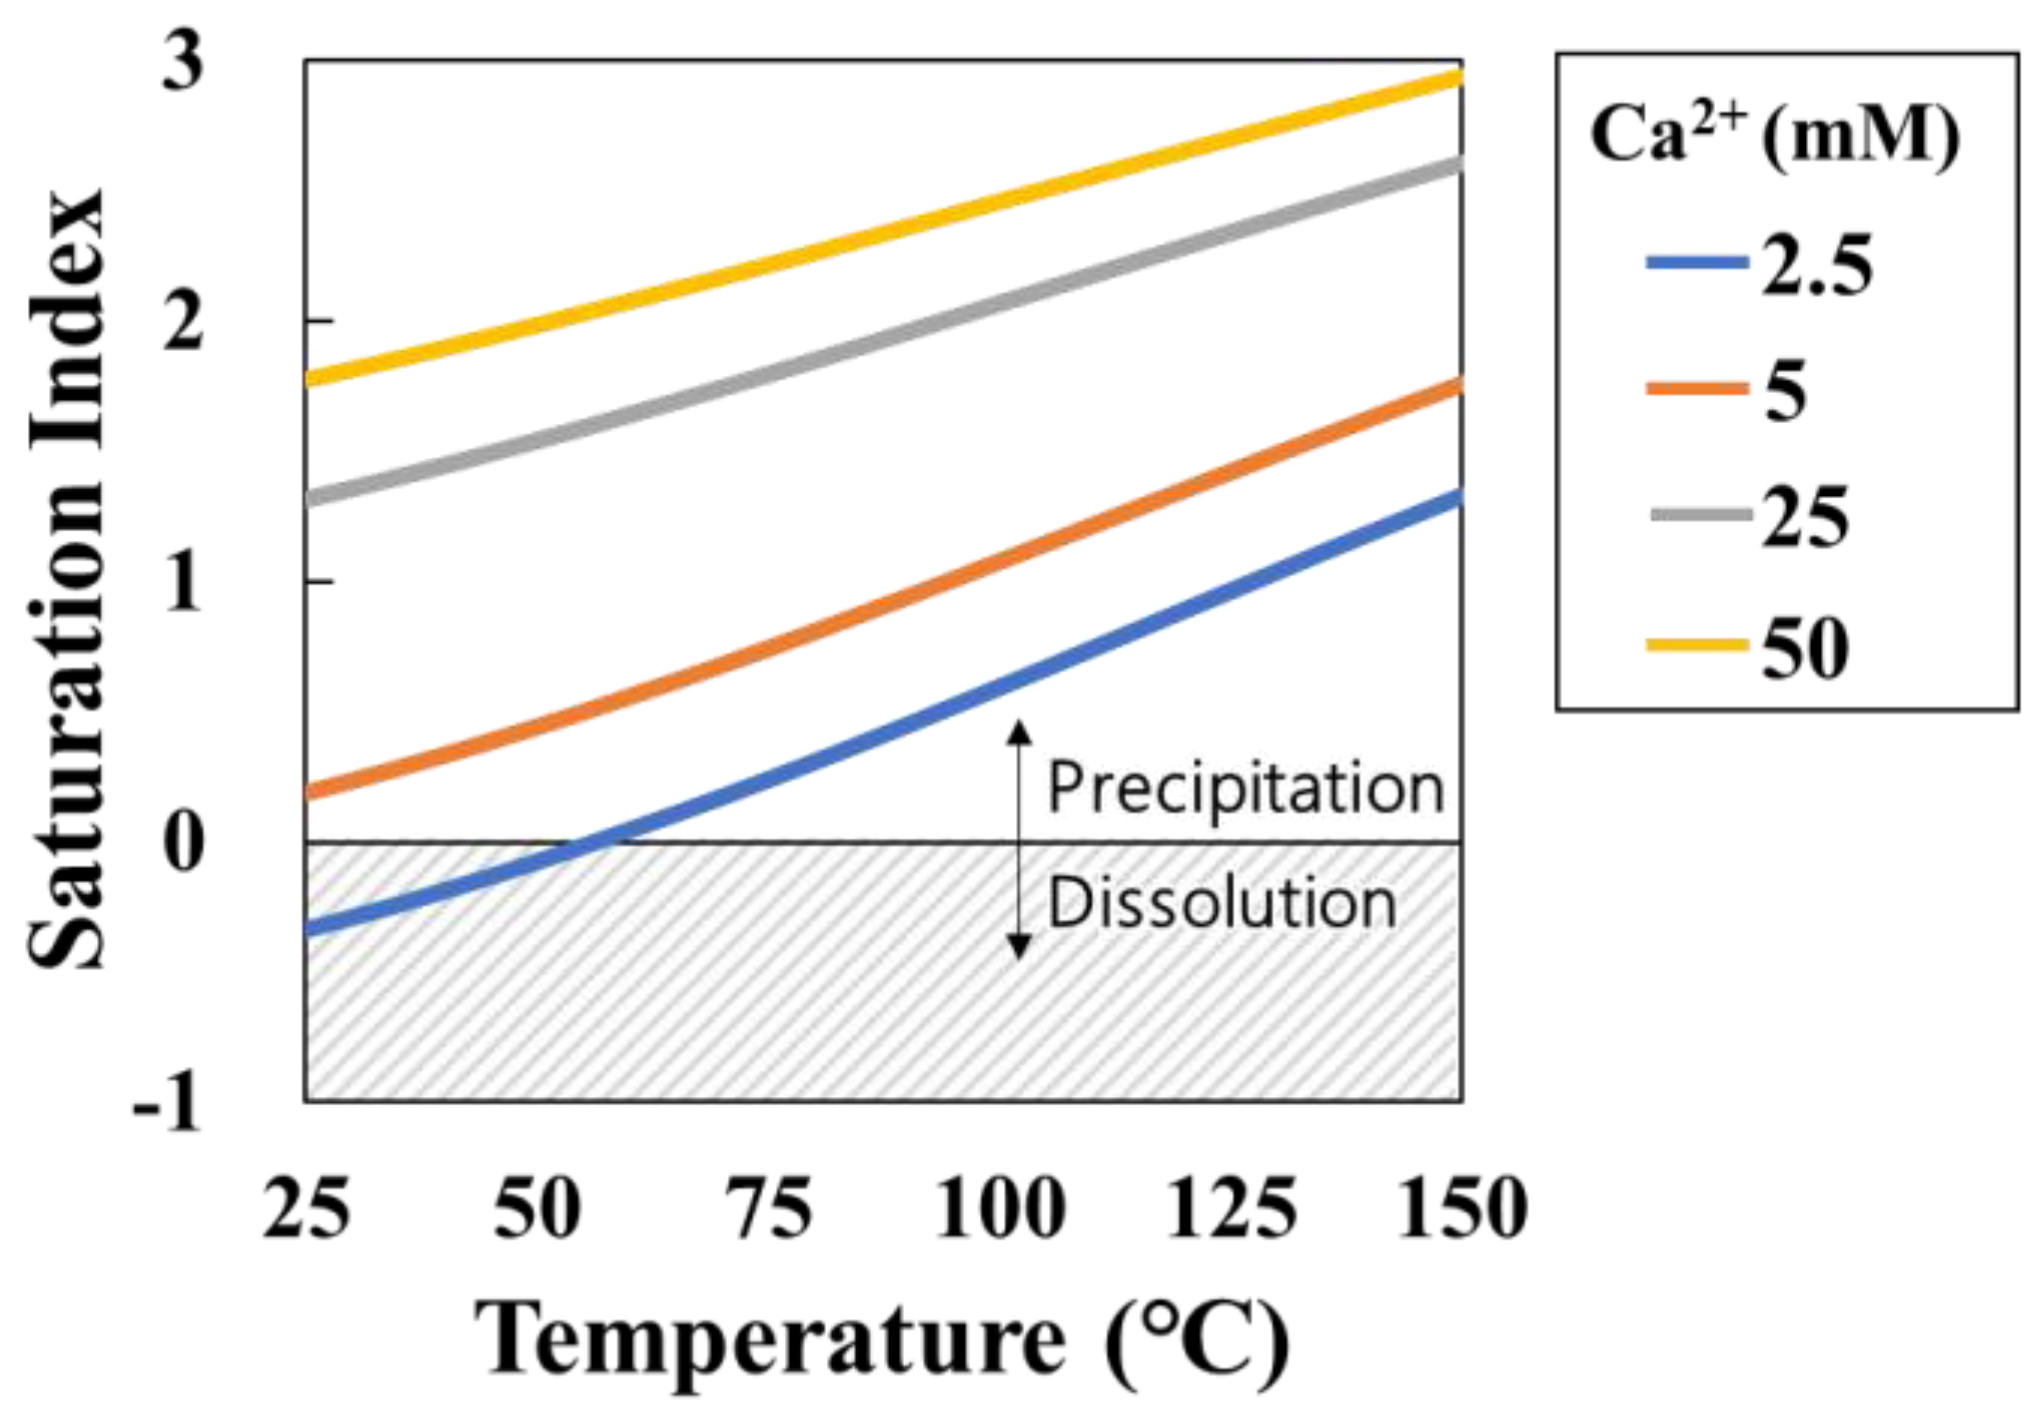
To examine the batch-type method’s effectiveness, a comparison was made between the real-time type and batch-type result. Before the experiments, the geochemical calculation code PHREEQC [
26] was used to calculate the saturation index (SI) variation of calcite with various Ca
2+ concentrations and reaction temperatures for NaHCO
3 and CaCl
2 solutions (
Figure 5). The SI increases with temperature and Ca
2+ concentration. In a solution with a Ca
2+ concentration of 2.5 mM, the SI is unsaturated at −0.34 at 25°C, but becomes supersaturated at 0.52 at 95°C. Therefore, as the temperature and Ca
2+ concentration increase, the produced amount of CaCO
3 increases, and the resulting transmittance response is expected to increase.
Real-time method was performed using a hetero-core sensor at Ca
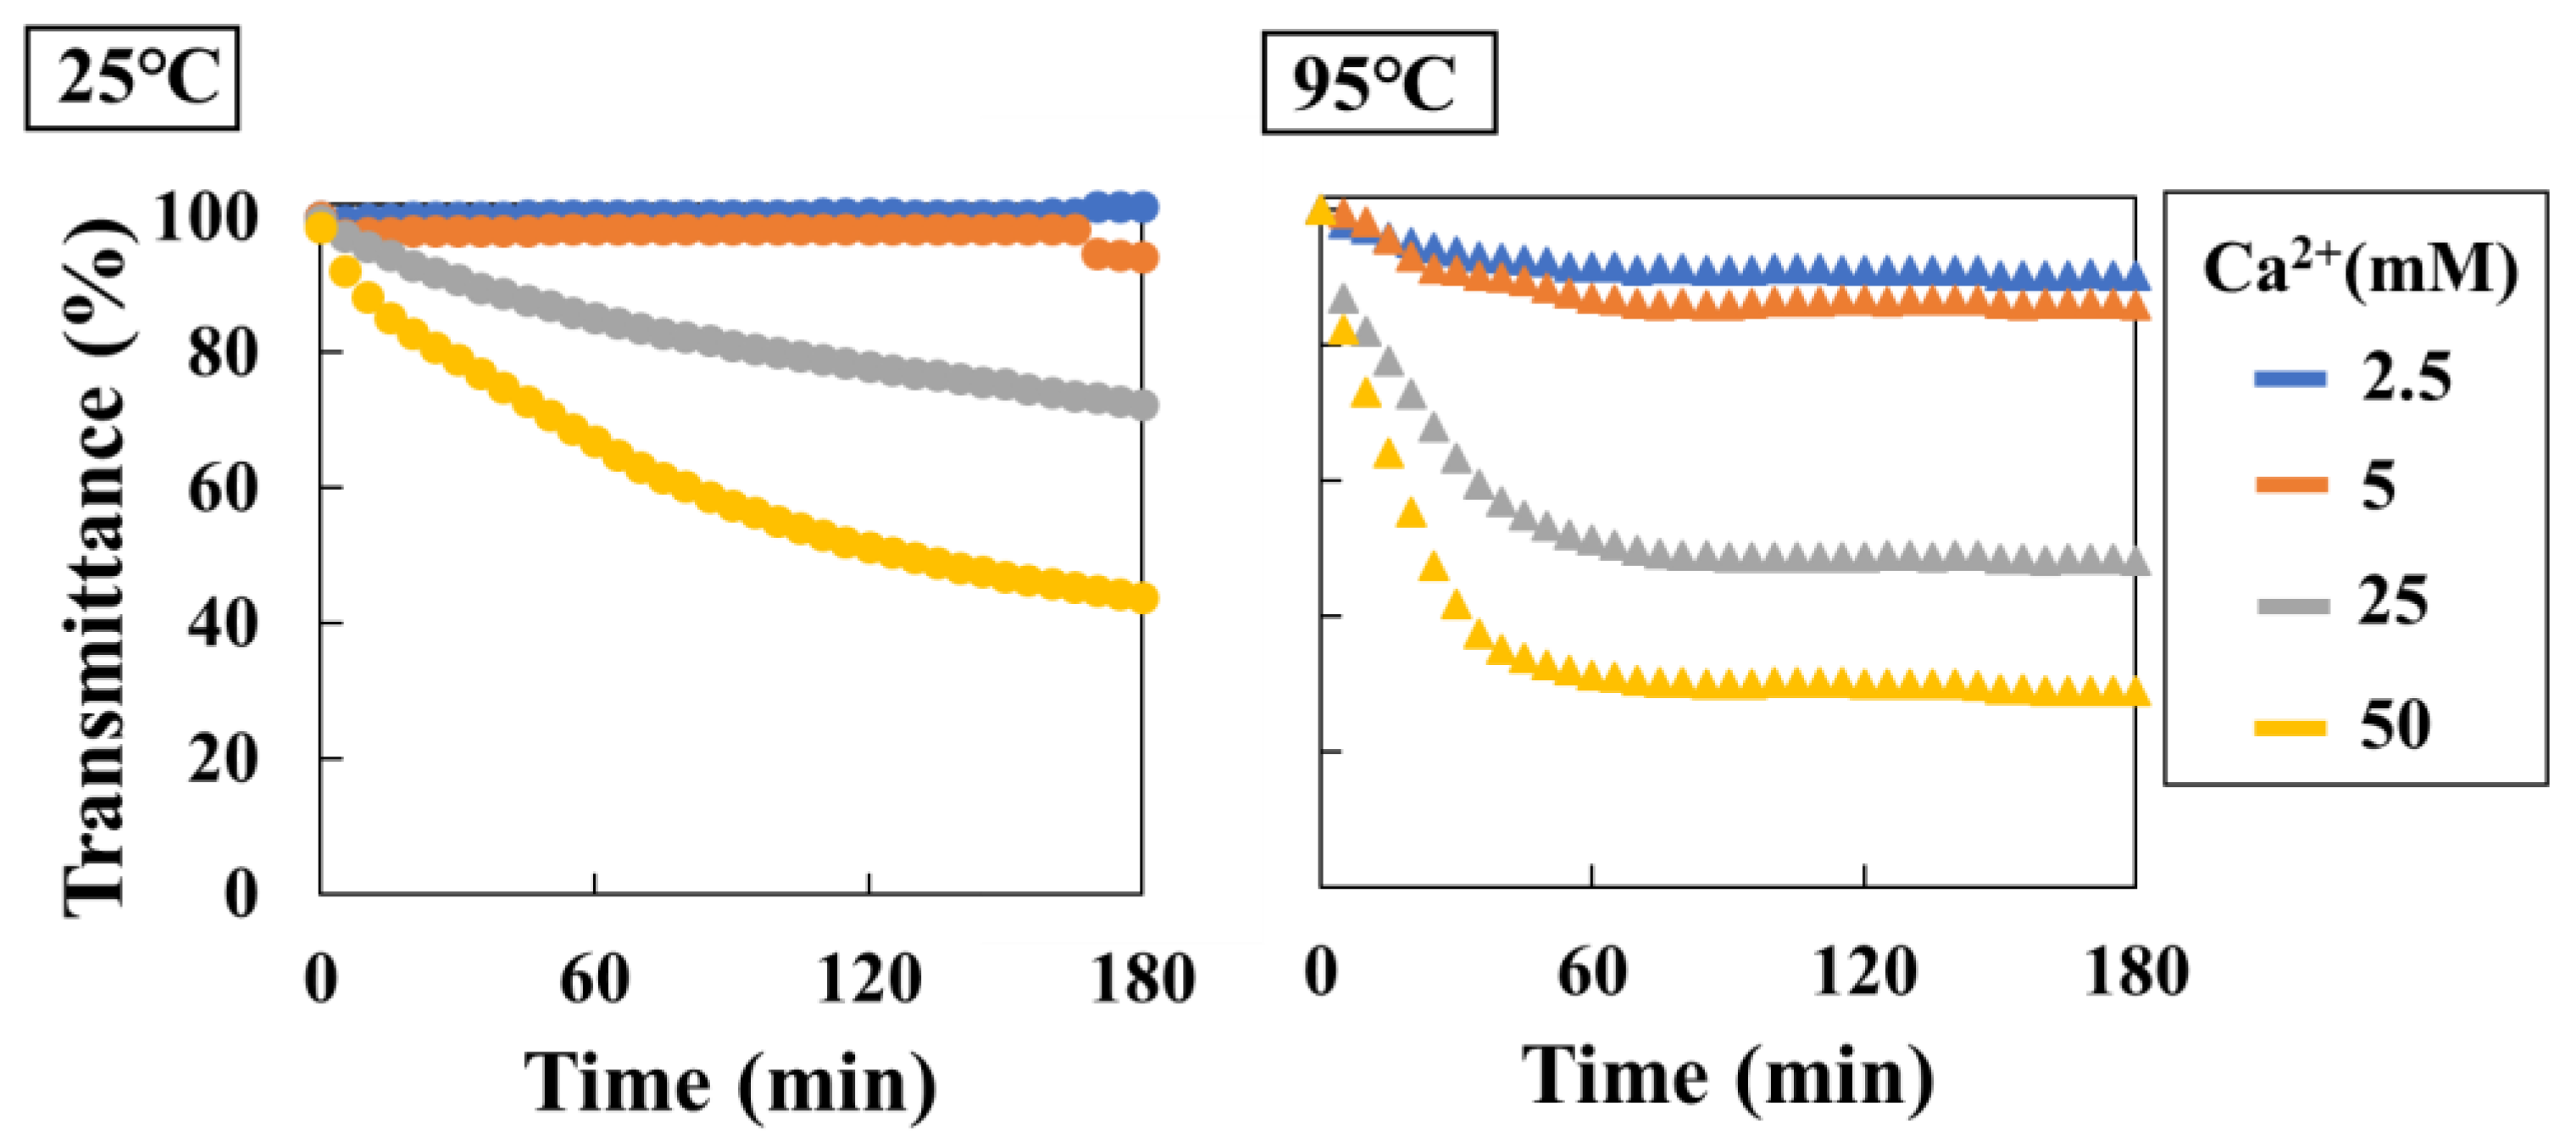
2+ solution concentrations ranging from 2.5 mM to 50 mM at temperatures of 25°C and 95°C (
Figure 6). A decrease in transmittance with increasing Ca
2+ concentration was observed at 25°C and 95°C. In particular, at a Ca
2+ concentration of 2.5 mM, no transmittance response was obtained at 25°C because of undersaturation. Meanwhile, at 95°C, supersaturation occurred and a decrease in transmittance of approximately 10% was observed. Furthermore, as the degree of supersaturation increased, the initial rate of transmittance decreased (%/min) also increased (
Table 2).
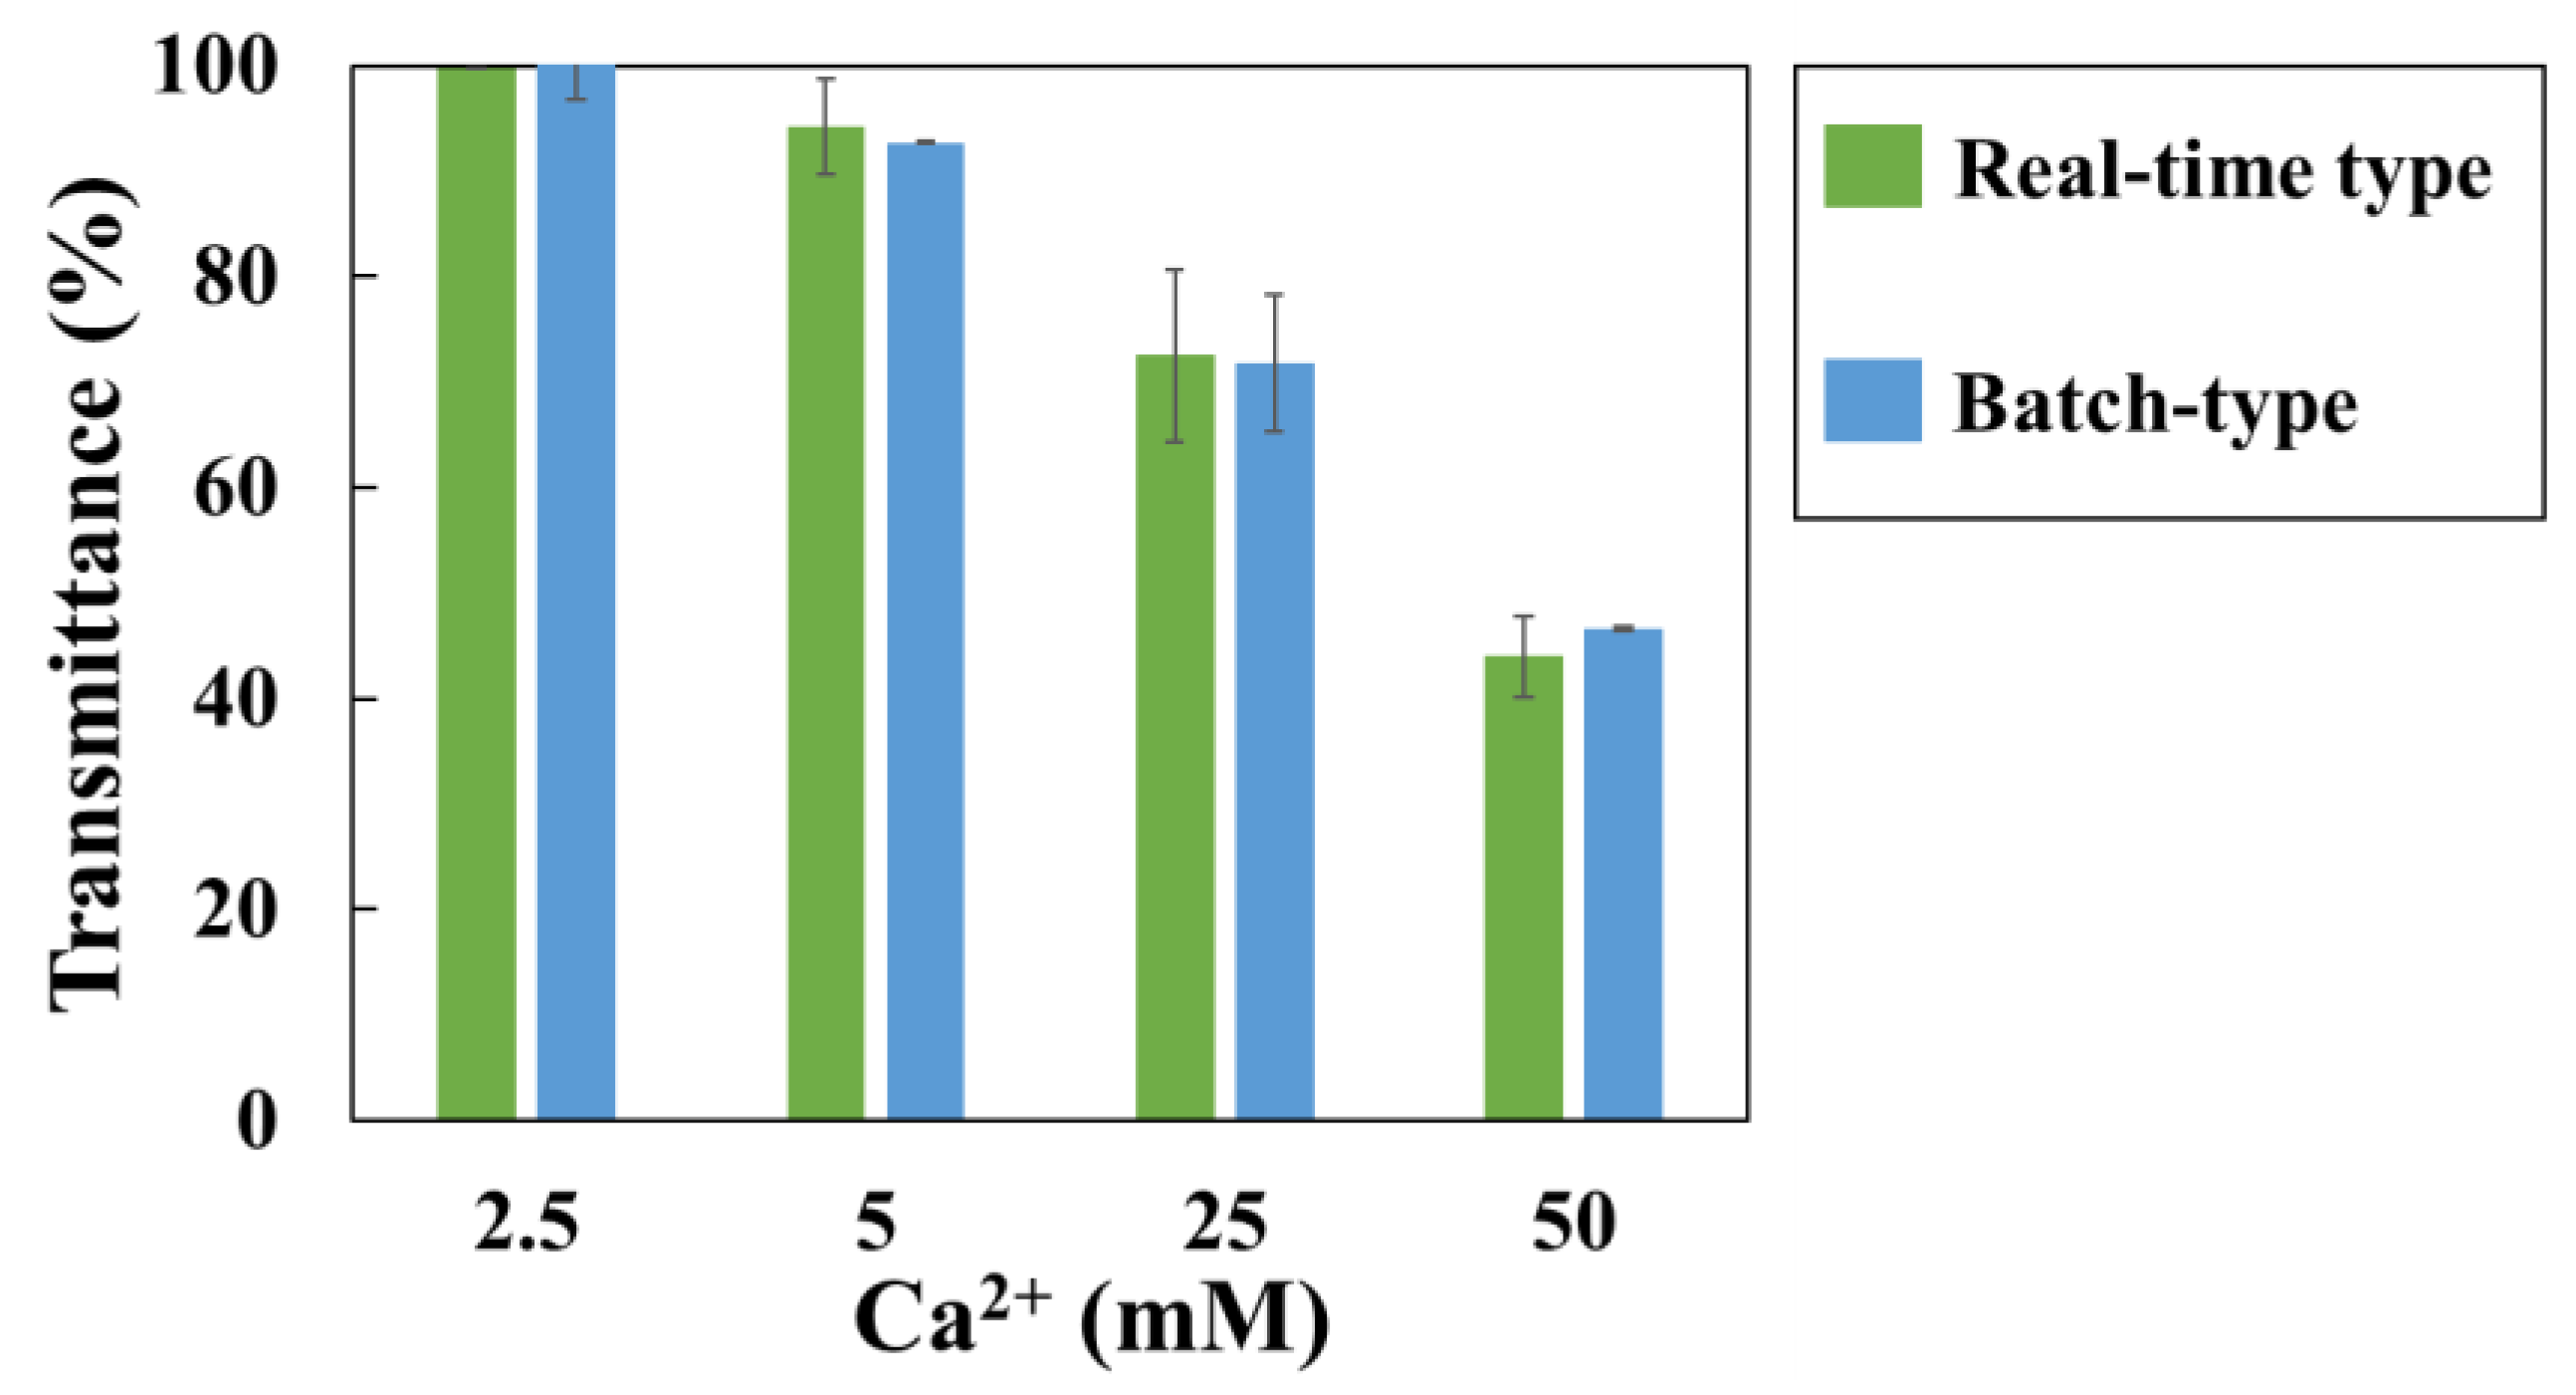
Batch-type method was also performed using a hetero-core. The light intensity transmitted through the optical fiber after 3 hours of immersion in the solution was compared (
Figure 7). Between both methods, increased Ca
2+ concentration and SI, the transmittance (%) were decreased. The discrepancy in measurements between the two measurement methods was within 5%. As results, the difference between the two methods was within the error range, indicating that the batch-type method was effective.
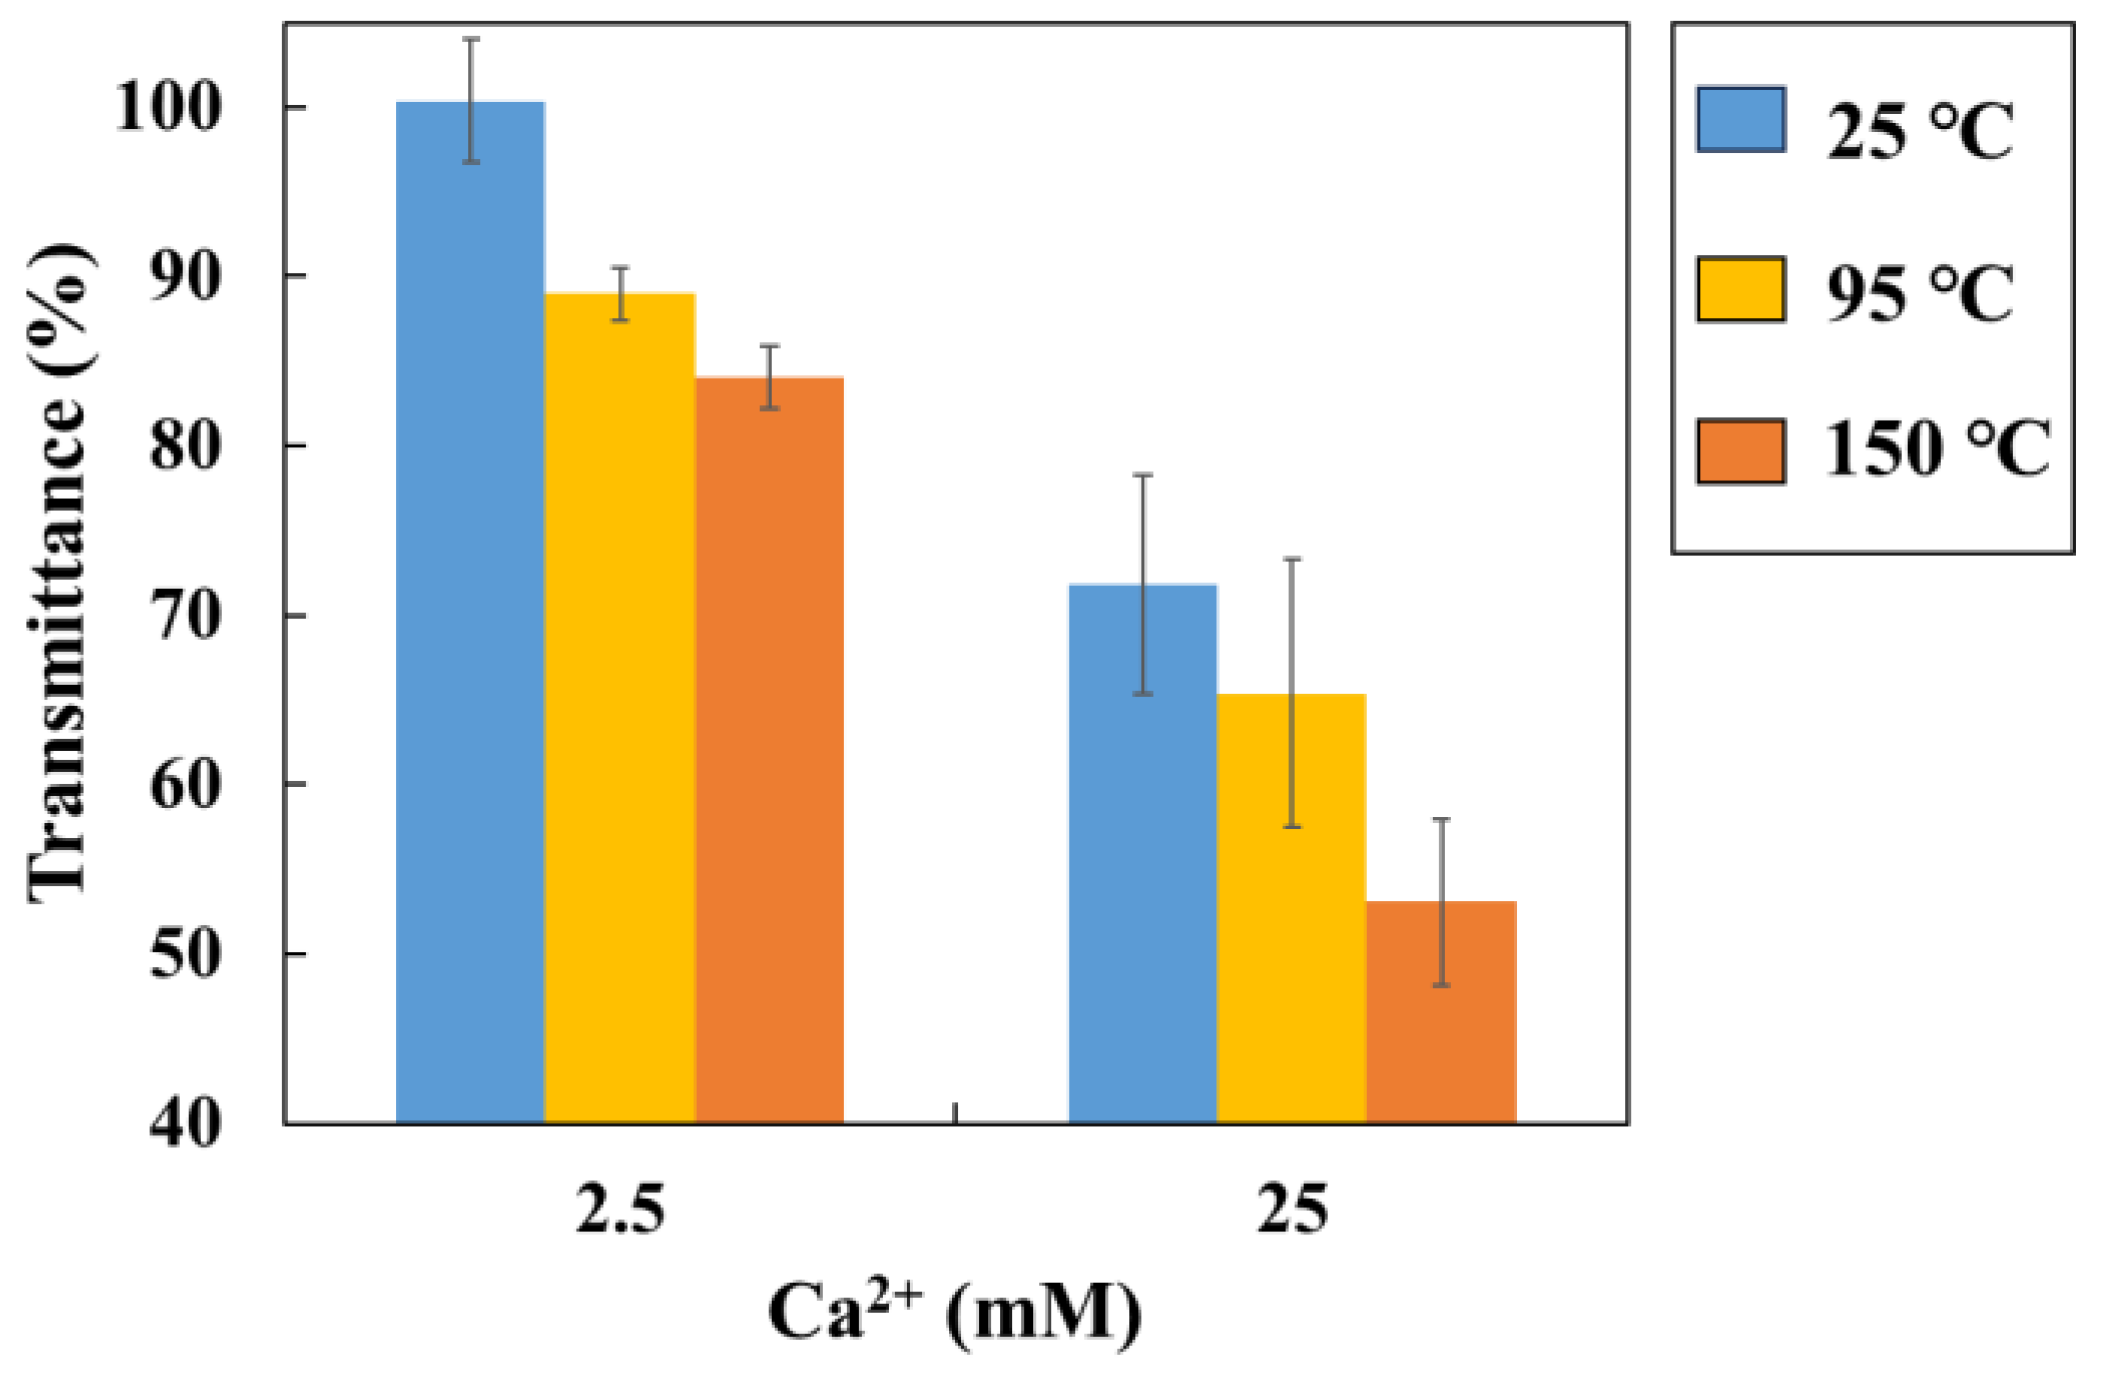
The batch-type method results in different temperature (25–150°C) are shown in
Figure 8 (Reaction time is 3 hours). A decrease in transmittance with increasing Ca
2+ concentration and temperature were observed. So, in the high temperature conditions, this batch-type method makes easy to measure transmittance changes in differences of SI.
4. Conclusions
The objective of this study was to develop a technique for monitoring scale formation in geothermal brine applying batch process based fiber optic sensor to enhance the convenience usage in a geothermal power plant and carbon dioxide (CO₂) mineralisation fields. Conventional real-time monitoring techniques present significant challenges in field applications, necessitating a power supply, specialized expertise, and vulnerability to environmental factors such as weather. In contrast, the batch-type sensor method offers a straightforward, user-friendly approach that maintains high reproducibility and exhibits sensitivity comparable to that of real-time methods.
In the course of the experiments, the sensitivity of the hetero-core sensor proved to be more responsive than the traditional unclad sensor. Furthermore, the reproducibility of the proposed method was evaluated, demonstrating that the hetero-core sensor yielded consistent and reliable measurements with minimal variation. A comparison of the batch-type and real-time methods revealed a strong correlation, thereby further validating the effectiveness of the batch-type sensor in a range of environmental conditions.
The batch-type sensor has the potential to be employed not only for the evaluation of scale formation in geothermal power plants, but also for the quantitative assessment of carbonate mineralisation in CO₂ sequestration processes. In light of the pivotal role of CO₂ mineralisation in mitigating climate change, this innovative sensor method has the potential to become a pivotal tool in advancing carbon reduction strategies. The findings indicate that the batch process based hetero-core fiber optic sensor will play an instrumental role in ensuring the stability of geothermal operations and enhancing the evaluation of CO2 mineralisation.
Author Contributions
Conceptualization, S.S., H.K. and A.U.; methodology, S.S. and A.H.; validation, S.S., A.H. and H.K.; formal analysis, S.S.; investigation, S.S. and A.U.; A.U. and H.K.; data curation, S.S. and H.K.; writing—original draft preparation, S.S and A.U.; writing—review and editing, A.H. and H.K.; visualization, S.S.; supervision, A.H, A.U. and H.K.; project administration, A.U. and H.K.; funding acquisition, A.U. and H.K. All authors have read and agreed to the published version of the manuscript.
Funding
This research was supported by the Japan Society for the Promotion of Science (JSPS) via a Grant-in-Aid for Scientific Research (Grant 23K22894).
Data Availability Statement
The data are contained within the article.
Acknowledgments
The authors wish to thank the members of the Faculty of Science at the University of Toyama for their support and discussion during the laboratory work.
Conflicts of Interest
The authors declare no conflicts of interest.
References
- Brown, K. L. & McDowell, G. D. pH control of silica scaling. Proceedings 5th New Zealand Geothermal Workshop, 157–161 (1983).
- Gallup, D. L. Brine pH modification scale control technology. Geothermal Resources Council Transactions, 20, 749–755 (1996).
- Gallup, D. L. The interaction of silicic acid with sulfurous acid scale inhibitor. Geothermal Resources Council Transactions, 21, 49–53 (1997).
- Hanajima, E. & Ueda, A. Recovery of oversaturated silica from Takigami and Sumikawa geothermal brines with cationic polymer flocculants to prevent silica scale deposition. Geothermics, 70, 271–280 (2017). [CrossRef]
- Hirowatari, K. Scale prevention method by brine acidification with biochemical reactors. Geothermics, 25, 259–270 (1996). [CrossRef]
- Ikeda, R. & Ueda, A. Experimental field investigations of inhibitors for controlling silica scale in geothermal brine at the Sumikawa geothermal plant, Akita Prefecture, Japan. Geothermics, 70, 305–313 (2017). [CrossRef]
- Okazaki, T. et al. Fundamental study on the development of fiber optic sensor for real-time sensing of CaCO3 scale formation in geothermal water. Anal. Sci. 31, 177–183 (2015). [CrossRef]
- Okazaki, T. et al. Fiber optic sensor for real-time sensing of silica scale formation in geothermal water. Sci. Rep. 7, 3387 (2017a). [CrossRef]
- Okazaki, T. et al. Fiber optic sensor with an optically transparent electrode for monitoring CaCO3 scale formation in geothermal water. IEEE Sensors Lett., 1, 1–4 (2017b). [CrossRef]
- Okazaki, T. et al. Investigation of the effects of electromagnetic field treatment of hot spring water for scale inhibition using a fiber optic sensor. Sci. Rep. 9, 10719 (2019). [CrossRef]
- Okazaki, T. et al. U-shaped polymer cladding and hetero-core fiber optic sensors for monitoring scale formation in geothermal brine. Analytical Letters, 53, 2160–2169 (2020). [CrossRef]
- Okazaki, T. et al. Scale sensor: Rapid monitoring of scale deposition and inhibition using fiber optics in a geothermal system and comparison with other monitoring devices. Geothermics, 93, 102069 (2021). [CrossRef]
- Watanabe, K. et al. Macrobending characteristics of a hetero-core splice fiber optic sensor for displacement and liquid detection. IEICE Trans. Electron 83, 309–314 (2000).
- Iga, M. et al. Acidity measurements based on a hetero-sore structured fiber optic sensor. Sens. Actuators B 96, 234–238 (2003). [CrossRef]
- Seki, A. et. al. A hetero-core structured fiber optic pH sensor. Analytica Chimica Acta 582, 154–157 (2007). [CrossRef]
- Kadokura, M. et al. Triaxial accelerometer based on a semicircular hetero-core fiber-optic sensor. IEEE Sensors J. 23, 6638–6648 (2023). [CrossRef]
- Hosoki, A. et al. Lipid-coated hetero-core optical fiber sensor for wide-range chemical detection. Optics and Laser Technology, 169, 110045 (2024). [CrossRef]
- Holloway, S. An overview of the Joule II project “The underground disposal of carbon dioxide”, Energy Conversion and Management, 37, 1149–1154 (1996).
- Gale, J. Geological storage of CO2: What do we know, where are the gaps and what more needs to be done? Energy, 29, 1329–1338 (2004). [CrossRef]
- Metz, B. et al. ed. “Carbon dioxide capture and storage”. Cambridge Univ. Press, 431pp (2005).
- Pogge von Strandmann, P. A. E. et al. Rapid CO2 mineralization into calcite at the CarbFix storage site quantified using calcium isotopes. Nature Communications, 10, 1983 (2019). [CrossRef]
- Gysi, A.P. & Stefansson, A., Mineralogical aspects of CO2 sequestration during hydrothermal basalt alteration – An experimental study at 75 to 250 °C and elevated pCO2. Chem. Geol., 306–307, 146–159 (2012). [CrossRef]
- Marieni, C. et al. Experimental study on mafic rock dissolution rates within CO2-seawater-rock systems. Geochimica et Cosmochimica Acta, 272, 259-275 (2020). [CrossRef]
- Voigt, M. et al. An experimental study of basalt–seawater–CO2 interaction at 130 °C. Geochimica et Cosmochimica Acta, 308, 21-41 (2021). [CrossRef]
- Potyrailo, R. A. et al. Near-ultraviolet evanescent-wave absorption sensor based on a multimode optic fiber. Anal. Chem. 70, 1639–1645 (1998). [CrossRef]
- Parkhurst, D. L. & Appelo, C. A. J. Users guide to PHREEQC (Version2)–A Computer program for speciation, batch-reaction, one-dimensional transport, and inverse geochemical calculations. Water-Resources Investigations Report, U.S. Department of the Interior, U.S. Geological Survey, 99-4259 (1999).
Figure 1.
(a) Scale sensor conceptual diagram. Transmittance decrease due to deposition of scale on a sensor. (b) Conceptual diagram of batch-type method. In conventional method (Real-time), there is some problem. For example, it needs devices like detector, and specialist for using sensors on-site, and it could be affected by bad weather. Batch-type method could solve this problem. It’s not need specialist and a lot of devices. Moreover, this method allows for easy on-site operation and implementation of a lot of test conditions.
Figure 2.
(a) Unclad type fiber optic sensor. In this structure, the sensing area is made by removing clad to expose the core part. (b) Hetero-core type fiber optic sensor. Sensor is made from two different type of fiber optics in core diameter.
Figure 2.
(a) Unclad type fiber optic sensor. In this structure, the sensing area is made by removing clad to expose the core part. (b) Hetero-core type fiber optic sensor. Sensor is made from two different type of fiber optics in core diameter.
Figure 3.
(a) Real-time type method. Fiber optic sensor is connected to a light source and detector throughout the measurement period. (b) Batch-type method. First, the fiber optic is immersed in the test solution. After a certain period of time, it is collected and subsequently connected for evaluation.
Figure 4.
Transmittance response for 50 mM (Ca2+) solution in 180 min by sensor structures. Orange plots are transmittance changes of unclad sensor, blue plots are transmittance changes of hetero-core sensor.
Figure 4.
Transmittance response for 50 mM (Ca2+) solution in 180 min by sensor structures. Orange plots are transmittance changes of unclad sensor, blue plots are transmittance changes of hetero-core sensor.
Figure 5.
Saturation index (SI) changes as functions of temperature and solution concentration (mixture of same concentration of NaHCO3 and CaCl2) (Blue line: 2.5 mM (Ca2+), Orange line: 5.0 mM (Ca2+), Glay line: 25 mM (Ca2+), Yellow line: 50 mM (Ca2+)).
Figure 5.
Saturation index (SI) changes as functions of temperature and solution concentration (mixture of same concentration of NaHCO3 and CaCl2) (Blue line: 2.5 mM (Ca2+), Orange line: 5.0 mM (Ca2+), Glay line: 25 mM (Ca2+), Yellow line: 50 mM (Ca2+)).
Figure 6.
Transmittance changes for CaCO3 precipitation in 180 min (left: 25°C, right: 95°C, Blue plots: 2.5 mM (Ca2+), Orange plots: 5.0 mM (Ca2+), Glay plots: 25 mM (Ca2+), Yellow plots: 50 mM (Ca2+)).
Figure 6.
Transmittance changes for CaCO3 precipitation in 180 min (left: 25°C, right: 95°C, Blue plots: 2.5 mM (Ca2+), Orange plots: 5.0 mM (Ca2+), Glay plots: 25 mM (Ca2+), Yellow plots: 50 mM (Ca2+)).
Figure 7.
Transmittance changes for different concentration of Ca2+ in 180 min by two methods. Green bar is change of real-time type method; blue bar is change of batch-type method. Each error bar is standard deviation.
Figure 7.
Transmittance changes for different concentration of Ca2+ in 180 min by two methods. Green bar is change of real-time type method; blue bar is change of batch-type method. Each error bar is standard deviation.
Figure 8.
Transmittance change at different temperatures and Ca2+ concentration by batch-type sensor (Blue bar: 25°C, Yellow bar: 95°C, Orange bar: 150°C, Error bar: standard deviation).
Figure 8.
Transmittance change at different temperatures and Ca2+ concentration by batch-type sensor (Blue bar: 25°C, Yellow bar: 95°C, Orange bar: 150°C, Error bar: standard deviation).
Table 1.
Reproducibility of sensor fabrication for unclad sensor and hetero-core sensor.
Table 1.
Reproducibility of sensor fabrication for unclad sensor and hetero-core sensor.
| |
Wavelength (nm) |
Number of samples |
Average |
Standard
deviation |
Coefficient of Variation |
| Unclad |
560 |
3 |
46947 |
2904 |
0.06 |
| Hetero core |
560 |
3 |
48797 |
1273 |
0.03 |
Table 2.
Initial response time up to 30 minutes (%/min) for hetero-core sensor in different Ca2+ concentration solution (2.5-50 mM (Ca2+)).
Table 2.
Initial response time up to 30 minutes (%/min) for hetero-core sensor in different Ca2+ concentration solution (2.5-50 mM (Ca2+)).
| Reaction temperature (°C) |
Ca2+(mM) |
| |
2.5 |
5 |
25 |
50 |
| 25°C |
- |
0.07 |
0.29 |
0.66 |
| 95°C |
0.20 |
0.30 |
1.22 |
1.94 |
|
Disclaimer/Publisher’s Note: The statements, opinions and data contained in all publications are solely those of the individual author(s) and contributor(s) and not of MDPI and/or the editor(s). MDPI and/or the editor(s) disclaim responsibility for any injury to people or property resulting from any ideas, methods, instructions or products referred to in the content. |
© 2024 by the authors. Licensee MDPI, Basel, Switzerland. This article is an open access article distributed under the terms and conditions of the Creative Commons Attribution (CC BY) license (http://creativecommons.org/licenses/by/4.0/).
