1. Introduction
With global increased energy demand and the deterioration of fossil fuel resources, the world has been mandated to move into renewable energy generation [
1]. China, USA, Germany and India are the leading wind energy-producing countries. This was further confirmed by the Global Wind Energy Council in 2018 [
2,
3]. Based on the wind energy density at a given location, wind power generation capacity can be increased by increasing the number of wind turbines in a wind farm and the power rating of individual wind turbines [
4]. In some instances, wind turbines are installed within, or close to, densely populated areas [
5]. Although wind energy generation is considered to be environmentally friendly, there are significant consequences that negatively affect humans and, ultimately, the environment [
6]. For instance, noise generation from wind farms is a significant problem for human health [
7]. Researchers and manufacturers have been working on controlling noise generation from wind turbines [
8]. Hence, it is important to develop strategies to assess the potential risk to health, safety and the environment (HSE) caused by wind turbine noise.
The noise produced by wind turbines can be classified as mechanical and aerodynamic noise, which is produced by the gearbox, generator, cooling fans, and other moving parts of the turbine, according to earlier research that analysed wind turbine noise [
6]. The mechanical noise generated by a wind turbine is tonal and peaks around certain frequencies which are harsh to human ears [
6,
7]. However the total wind turbine sound pressure level increases by a minor level due to mechanical noise near the nacelle [
9]. Mechanical noise can be reduced to a certain extent, by properly shielding the nacelle using sound insulation material. However, this reduction causes aerodynamic noise to predominate [
2,
6]. Natural habitat is concerned, wind turbines badly affect wild birds, in two ways. Birds collide directly with wind turbines and the situation gets worse when wind farms are located in migration paths. The disturbance caused by a turbine may lead to a reduction in habitat [
5,
8].
In addition to the aerodynamic noise produced by the turbine's six separate areas, flow-induced noise is also created when flow structures interact with the blade wall [
11].Trailing edge noise is the major contributor for aerodynamic noise which most of the energy is cantered at 465Hz [
5,
11].Sharp trailing edges can eliminate the strong peaks in a typical wind turbine noise spectrum that are brought on by blunt trailing edge noise [
2,
3].Recently, research carried out in Europe has contributed to improving wind turbine blade design, especially the design of the trailing edge and tip [
3,
12]. The noise generated from the gearbox and generator is controlled and the tonal noise is critical, when commissioning a wind turbine [
13]. Additionally, the measurement method described in IEC standard 61400-11 has been updated to improve wind turbine noise measurements [
13]. Several studies are being conducted to find out how low-frequency noises cause sleeping disturbances and annoyance. Other than annoyance, studies have been carried out to investigate the effects of myocardial infraction (MI) and it was concluded that there is a casual association between long term exposure to outdoor wind turbine noise and myocardial in fraction. The study was conducted by selecting a Danish Nurse Cohort of 28,731 female nurses and obtaining data on the incidence of MI in the Danish National Patient and Causes of Death Registries until 2013. Wind turbine noise levels at residential addresses between 1982 and 2013, were estimated using the Nord 2000 noise propagation model [
14]. To get prominent results from a study, the selection of a sample group is important. Hence it is recommended that a community living near a wind farm is selected. A representative data set is also recommended, to capture data for a reasonable period and study the health changes within the selected sample.
By identifying the specific noise sources, the noises can be reduced to a certain level. Inflow turbulence noise is mainly created when airflow interacts with a blade surface. The contribution of inflow turbulence to total wind turbine noise has still not been investigated completely and studies are still in progress [
2,
3].However, in order to investigate trailing edge noise generation in a wind turbine, a microphone array was placed upwind from the turbine and used to measure the noise distribution from an individual blade. A total of 100 measurements were recorded with wind speed variation of 6-10m/s. The array results revealed that all noise emitted towards the ground was produced during the downwards movement of the blades [
14,
15].
The Environmental Impact Assessment (EIA) report's baseline noise assessment states that the measured background noise level for the wind farm on Mannar Island is between 42 and 46 dB(A). As a result, the planned site is viewed as being in a serene and quiet setting [
17]. The aerodynamic and mechanical noise generated by the facility has caused the aforementioned levels to rise, though, while the wind turbines on the wind farm are in operation.
This manuscript uses noise data captured from two wind farms in north central province in Sri Lanka to develop noise risk level assessment to evaluate noise risk levels to human health in residential locations in close proximity to onshore wind turbines. Furthermore, the paper demonstrates how to use a fuzzy logic based expert system to perform noise risk assessments quantitatively to identify health risk due to noise exposure. The noise risk assessment approach presented in this study is useful for practitioners, as well as researchers, in expediting the necessary actions to mitigate the noise caused by on shore wind turbines.
2. Background and Industrial Challenge
In Sri Lanka, wind power generation has increased from 3MW (in 2010) to 233MW (in 2021), which is a 7600% increase in 10 years. Many locations across the world have both onshore and offshore wind farms. However, to facilitate this study, only the onshore wind farms commissioned in Sri Lanka were selected [
3].Sri Lanka has a total land area of around 65,000 square kilometres, yet some areas have a relatively high population density. Therefore, most industrial activity is limited to specific areas. However, in order to establish an industry, a detailed environmental impact study is performed and, depending on the outcome of the study, approval is then granted. Wind power generation in Sri Lanka is considered to be an industrial activity; as a result, the industrial noise regulations are applicable for the compliance testing of wind farm operations [
18]. Therefore, wind farm premises are defined as industrial zones which consist of approximate 200m X 200m land area for one wind turbine. To comply with the environmental regulations, the asset owners have to maintain noise levels within the limits specified by the regulations. Some wind farms are close to residential areas where people are exposed to the noise produced by the wind turbines, which raises the possibility of negative health effects. Land use patterns and population density were taken into account while identifying noise zones/areas and assigning noise levels for the zones [
3]. According to existing noise regulation, the noise levels shown in
Table 1 applies for different areas/zones. The chosen wind farms in the chosen study area are situated in a low-noise area [
18]. Therefore, the asset owners have to maintain an overall noise level of 55dB in day time and 45dB in night time.
Globally, studies have been carried out to investigate low-frequency inconvenience and negative health impacts, due to wind powered power plants. The sound from wind farms is sometimes both audible and inaudible in character; some people are more sensitive to this situation and are severely affected, whereas other people may not be affected. This effect can be described as ‘intrusive noise’ [
19].
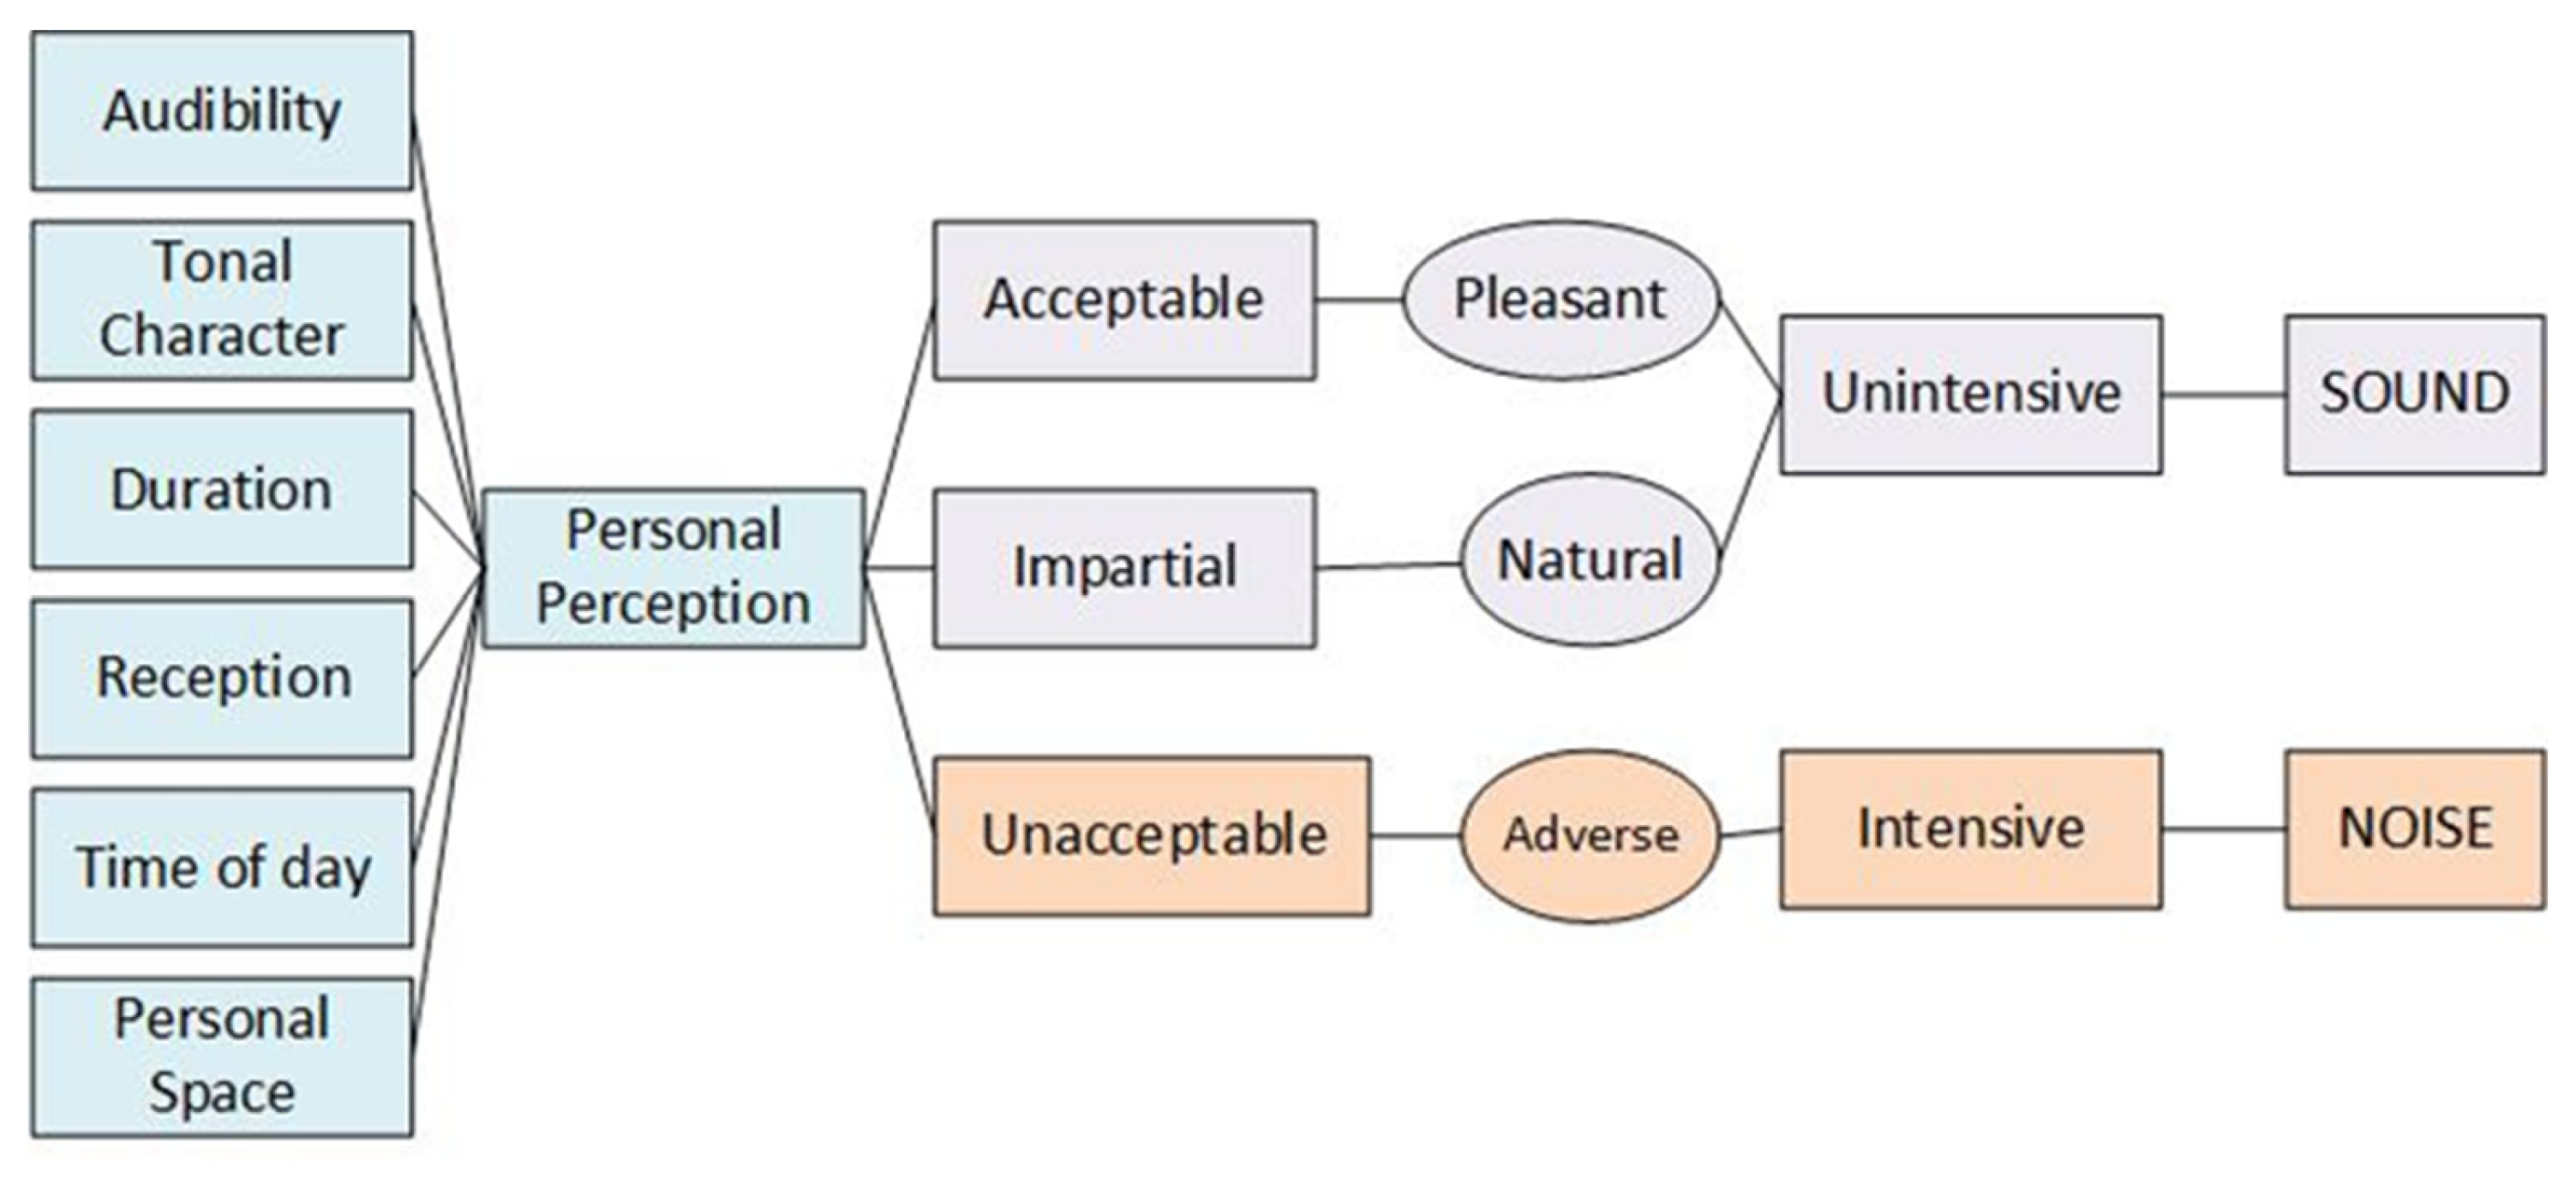
Figure 1 describes the subjective decision process between noise and sound.
However, in the UK there is a separate guideline to maintain the noise levels from wind farms to control the noise levels [
11]. The allowable night time noise level is 42 dBA, which is 5 dBA above ambient noise, according to UK ETSU-R-97 rules that were issued in 1997. In addition, depending on the topography and the type of the turbine, it is advised that a turbine be placed back from habitation at a minimum distance of 350 to 500 metres [
20]. The Sri Lankan industrial noise regulation was created based on BS4142-1997, however it has to be revised to reflect the most recent version, BS4142-2014. British Standards outline the location selection criteria for noise measurement, the measurement instruments to be used, the background corrections necessary for measuring residual noise level, etc. for accurate and reliable noise measurement in the filled [
18].
Amplitude modulation (AM) is one of the controversial issues in evaluating community responses to wind turbine noise. By applying separate azimuthally pitch control to each blade, a study has been done to remove or mitigate normal amplitude modulation at a listener's position close to the proximity of a three-bladed horizontal axis wind turbine. The focus of the experiment was on normal AM (NAM) in close proximity to the turbine. Through a noise modelling study, the impacts of listener position, input shear rate, and blade flexibility were investigated. Around a wind turbine is where normal amplitude modulation is most common. Other impacts like air propagation may be more significant at greater distances (i.e., at homes) [
26]. To date, offshore wind farms have not reported any adverse health effects. A study carried out in Denmark, revealed the fact that offshore wind farms do not have a significant enough impact to cause inconvenience to the settlements on the nearest beach [
10].There is substantial ambiguity on the relationship between noise levels and the effects on aquatic species, however, noise from offshore wind turbines has an impact on the marine ecology. Due to the intricacy of the animal responses to noise pollution, underwater noise assessment is still relatively new, and the uncertainties when measuring the harm to marine life are substantial [
27]. The aerodynamic noise generated from the rotor blades is transferred to the seabed through the structure of the tower, which ultimately travels along the seabed and ‘leaks’ upwards to the water, causing marine life to hear the noise [
27,
28].A study was conducted to investigate whether the renewable energy strategy hinders the EU’s marine protection strategy. The study aimed to build up and evaluate a preliminary hypothesis on the effects of underwater noise from offshore wind power on marine life as the first step of a biological risk assessment. Several actions were proposed to mitigate the noise from the turbines. Studies have been undertaken to reduce the fluctuation in sound and it has been suggested that random variation in the pitch angle of the blade be added while rotating the turbine [
32]
3. Methodology
In this study the noise measured from 18 wind turbines belongs to two wind farms located in costal region on north central province were considered. Houses are close by and located in the chosen study area and these houses are not properly built with firm sound proofing capabilities. Some houses are positioned by covering to vegetation lands, while others are located less than 100 metres from a wind turbine. The vegetation on the land absorbs high frequency sounds (frequencies above 4 kHz). As a result, certain recipients nearby may not be affected by the risk associated with mechanical noise caused by the turbine gear box and other moving elements [
25].
Usually the cut-off wind speed for the wind turbine was selected as 12m/s [
23],where turbines are designed to withstand a wind speed of 70m/s [
23]. The power produced by the turbine varies depending on the daytime and night-time variations in wind speed. The wind direction in coastal regions varies throughout the day and night, therefore the turbine adjusts its yaw to maximise energy output. Also, the wind's air density might fluctuate at night compared to during the day, which has an impact on the noise produced by the turbine blades because the change in wind density has an impact on power output. [
24].
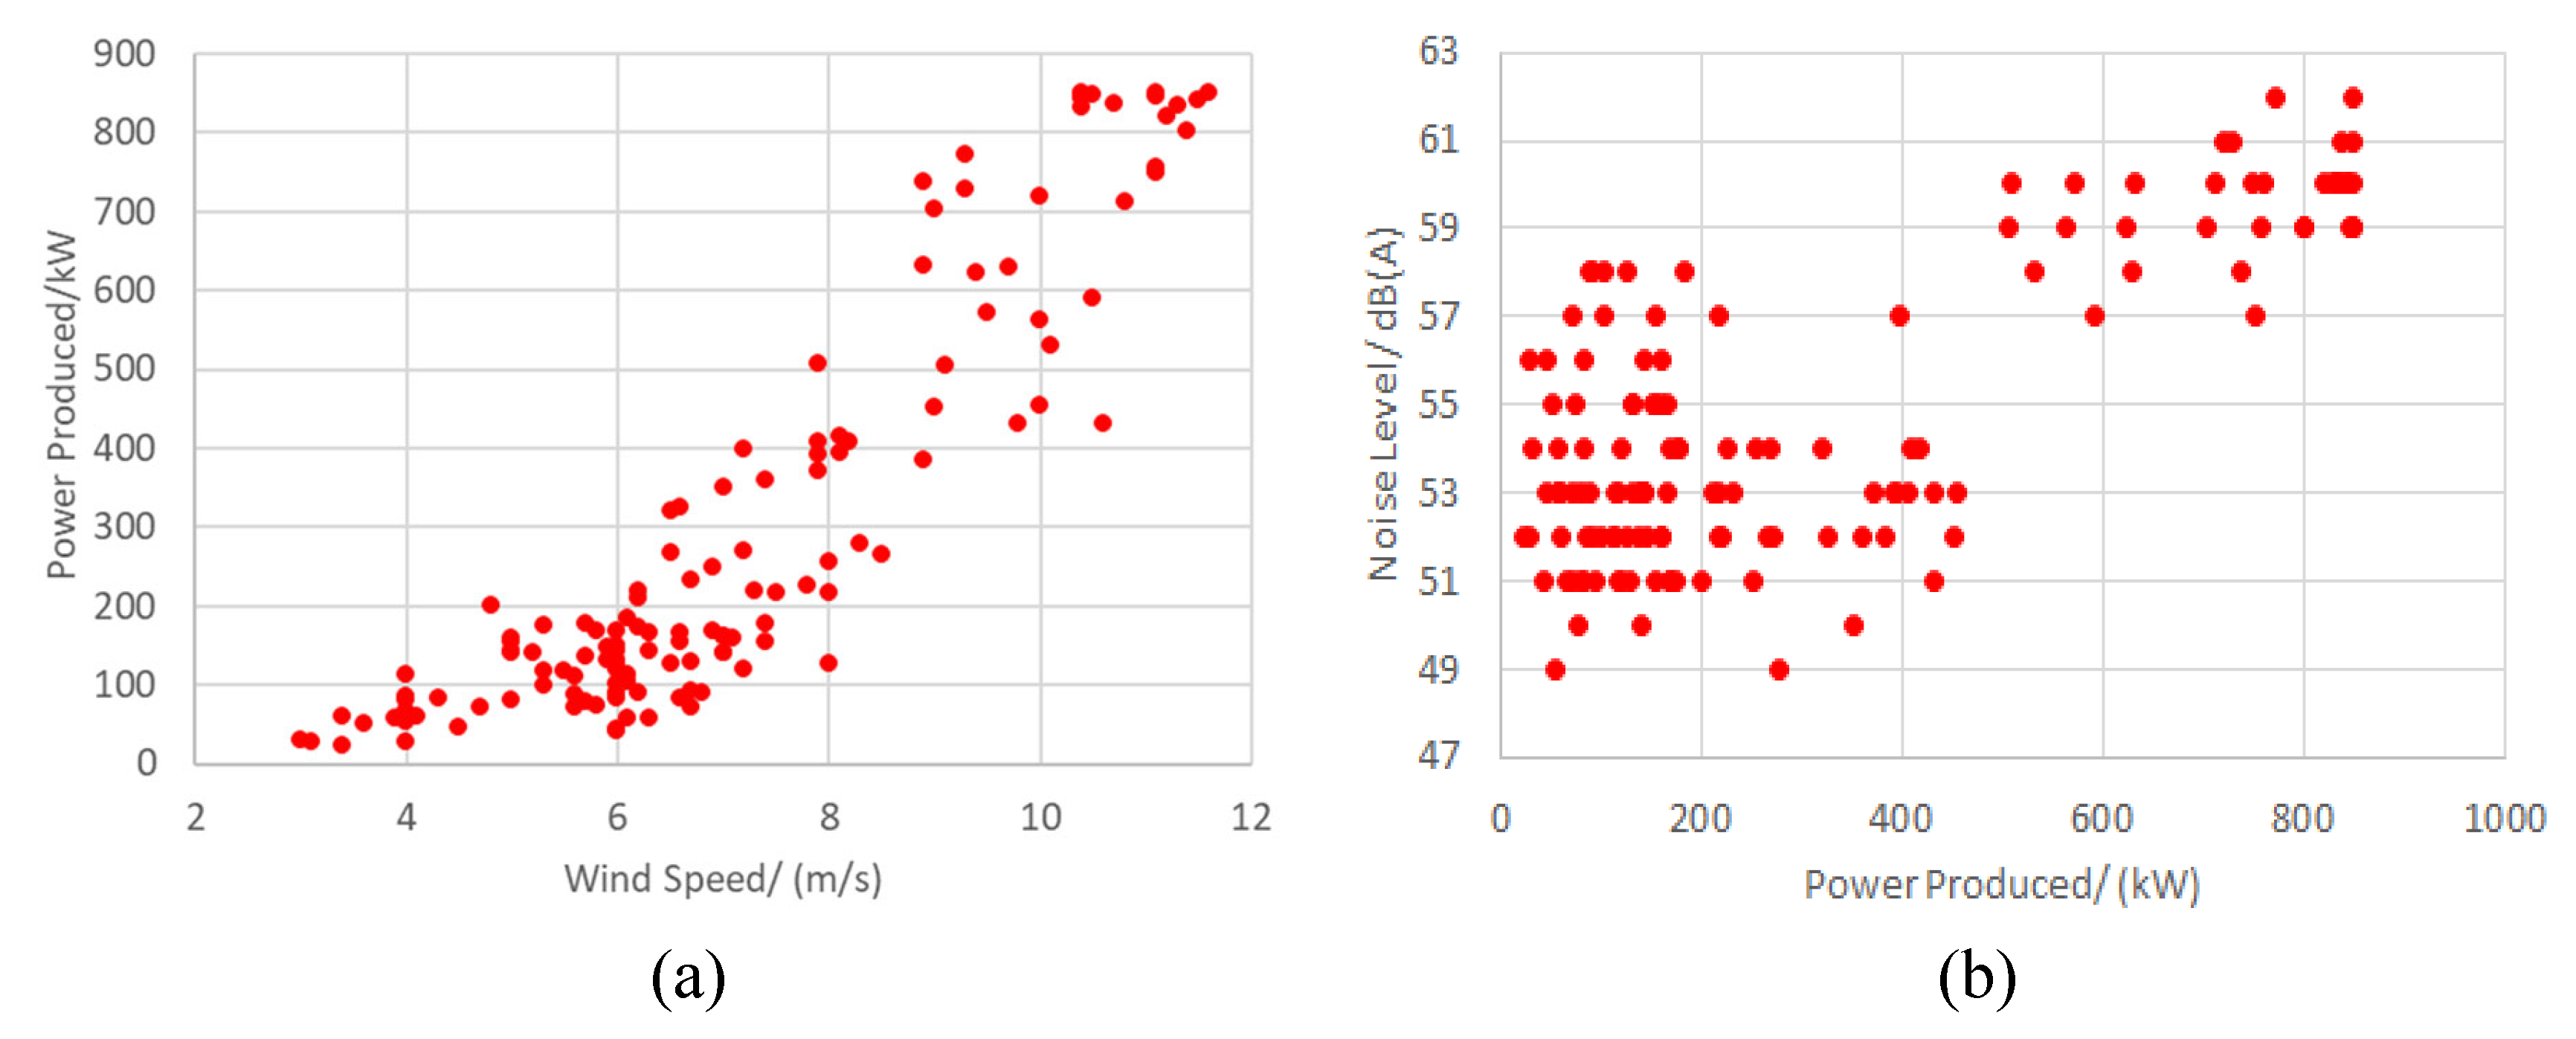
Figure 5(a) represents the power produced by wind power generators with changing wind speed whereas,
Figure 5(b) represents the noise generation from the turbines with power output from a wind power generator.
Figure 5(a) and
Figure 5(b) further confirm that the increased wind speed increased the noise generation from the wind turbine. According to
Figure 5(a) it is clear that increased wind speed increases the power generation.
Figure 5(b) represents that, when power generation from the turbine increased the noise from the turbine increased above 57dB(A). As the turbines are functioning continuously during the windy season, the above noise creates a noticeable inconvenience to the people living in the vicinity.
3.1. Noise Risk Analysis and Assessment
Several categories of risk, such as technological risk, manufacturing risk, and commercial risk are pertinent to the risk assessment and risk management of wind turbines. A study was done to evaluate the aforementioned risks efficiently at every stage of the technical lifetime, from designing floating wind turbines through decommissioning them [
30]. The traditional risk assessment techniques basically rely on linear cause and effect analysis, which has some limitations, when incorporating to efficient risk models. To address these limitations, a study was conducted to review the existing approaches to risk assessment for wind turbines and it proposed an integrated risk assessment framework for the complex technological system, through a Bayesian network [
31]. A research study was done to assess the risk connected with the novel construction projects including onshore wind farm projects and to offer a unique framework for risk detection as there was limited historical data related to risk assessment [
33].
The houses in the study area were more likely to be exposed to noise than the houses far from the wind farm, and the houses close to the wind farm also reported more inconvenience than the houses distant from the wind farm. To determine the probability of exposure (PoE) the distance to the house from the wind turbine, the noise level and the power produced by the turbine, exposure time and the wind speed was considered. The consequence of health damage (CoHD) was estimated considering the potential severity of the health effect. Based on the probability of exposure (PoE) and the consequences of health damage (CoHD) the potential noise risk rank value can be calculated, from Eq.(2). Extremely Low, Low, Medium, High, and Very High-risk levels were defined in the risk ranking. The risk ranking procedure should, however, follow a valid and reliable methodology. Hence, to minimise the variability in risk ranking, fuzzy Inference system (FIS) was used for risk ranking. The FIS was developed using membership functions (MFs) and a rule base, using the MATLAB fuzzy toolbox [
32,
33]. Membership along different ranges (i.e. VL, L, H, and VH) of the PoE, CoHD and Risk were modelled using the Gaussian membership function (MF). Equation (3) provides the mathematical formula, in which "c" stands for the Gaussian MF's centre, and "
" specifies its width [
35].
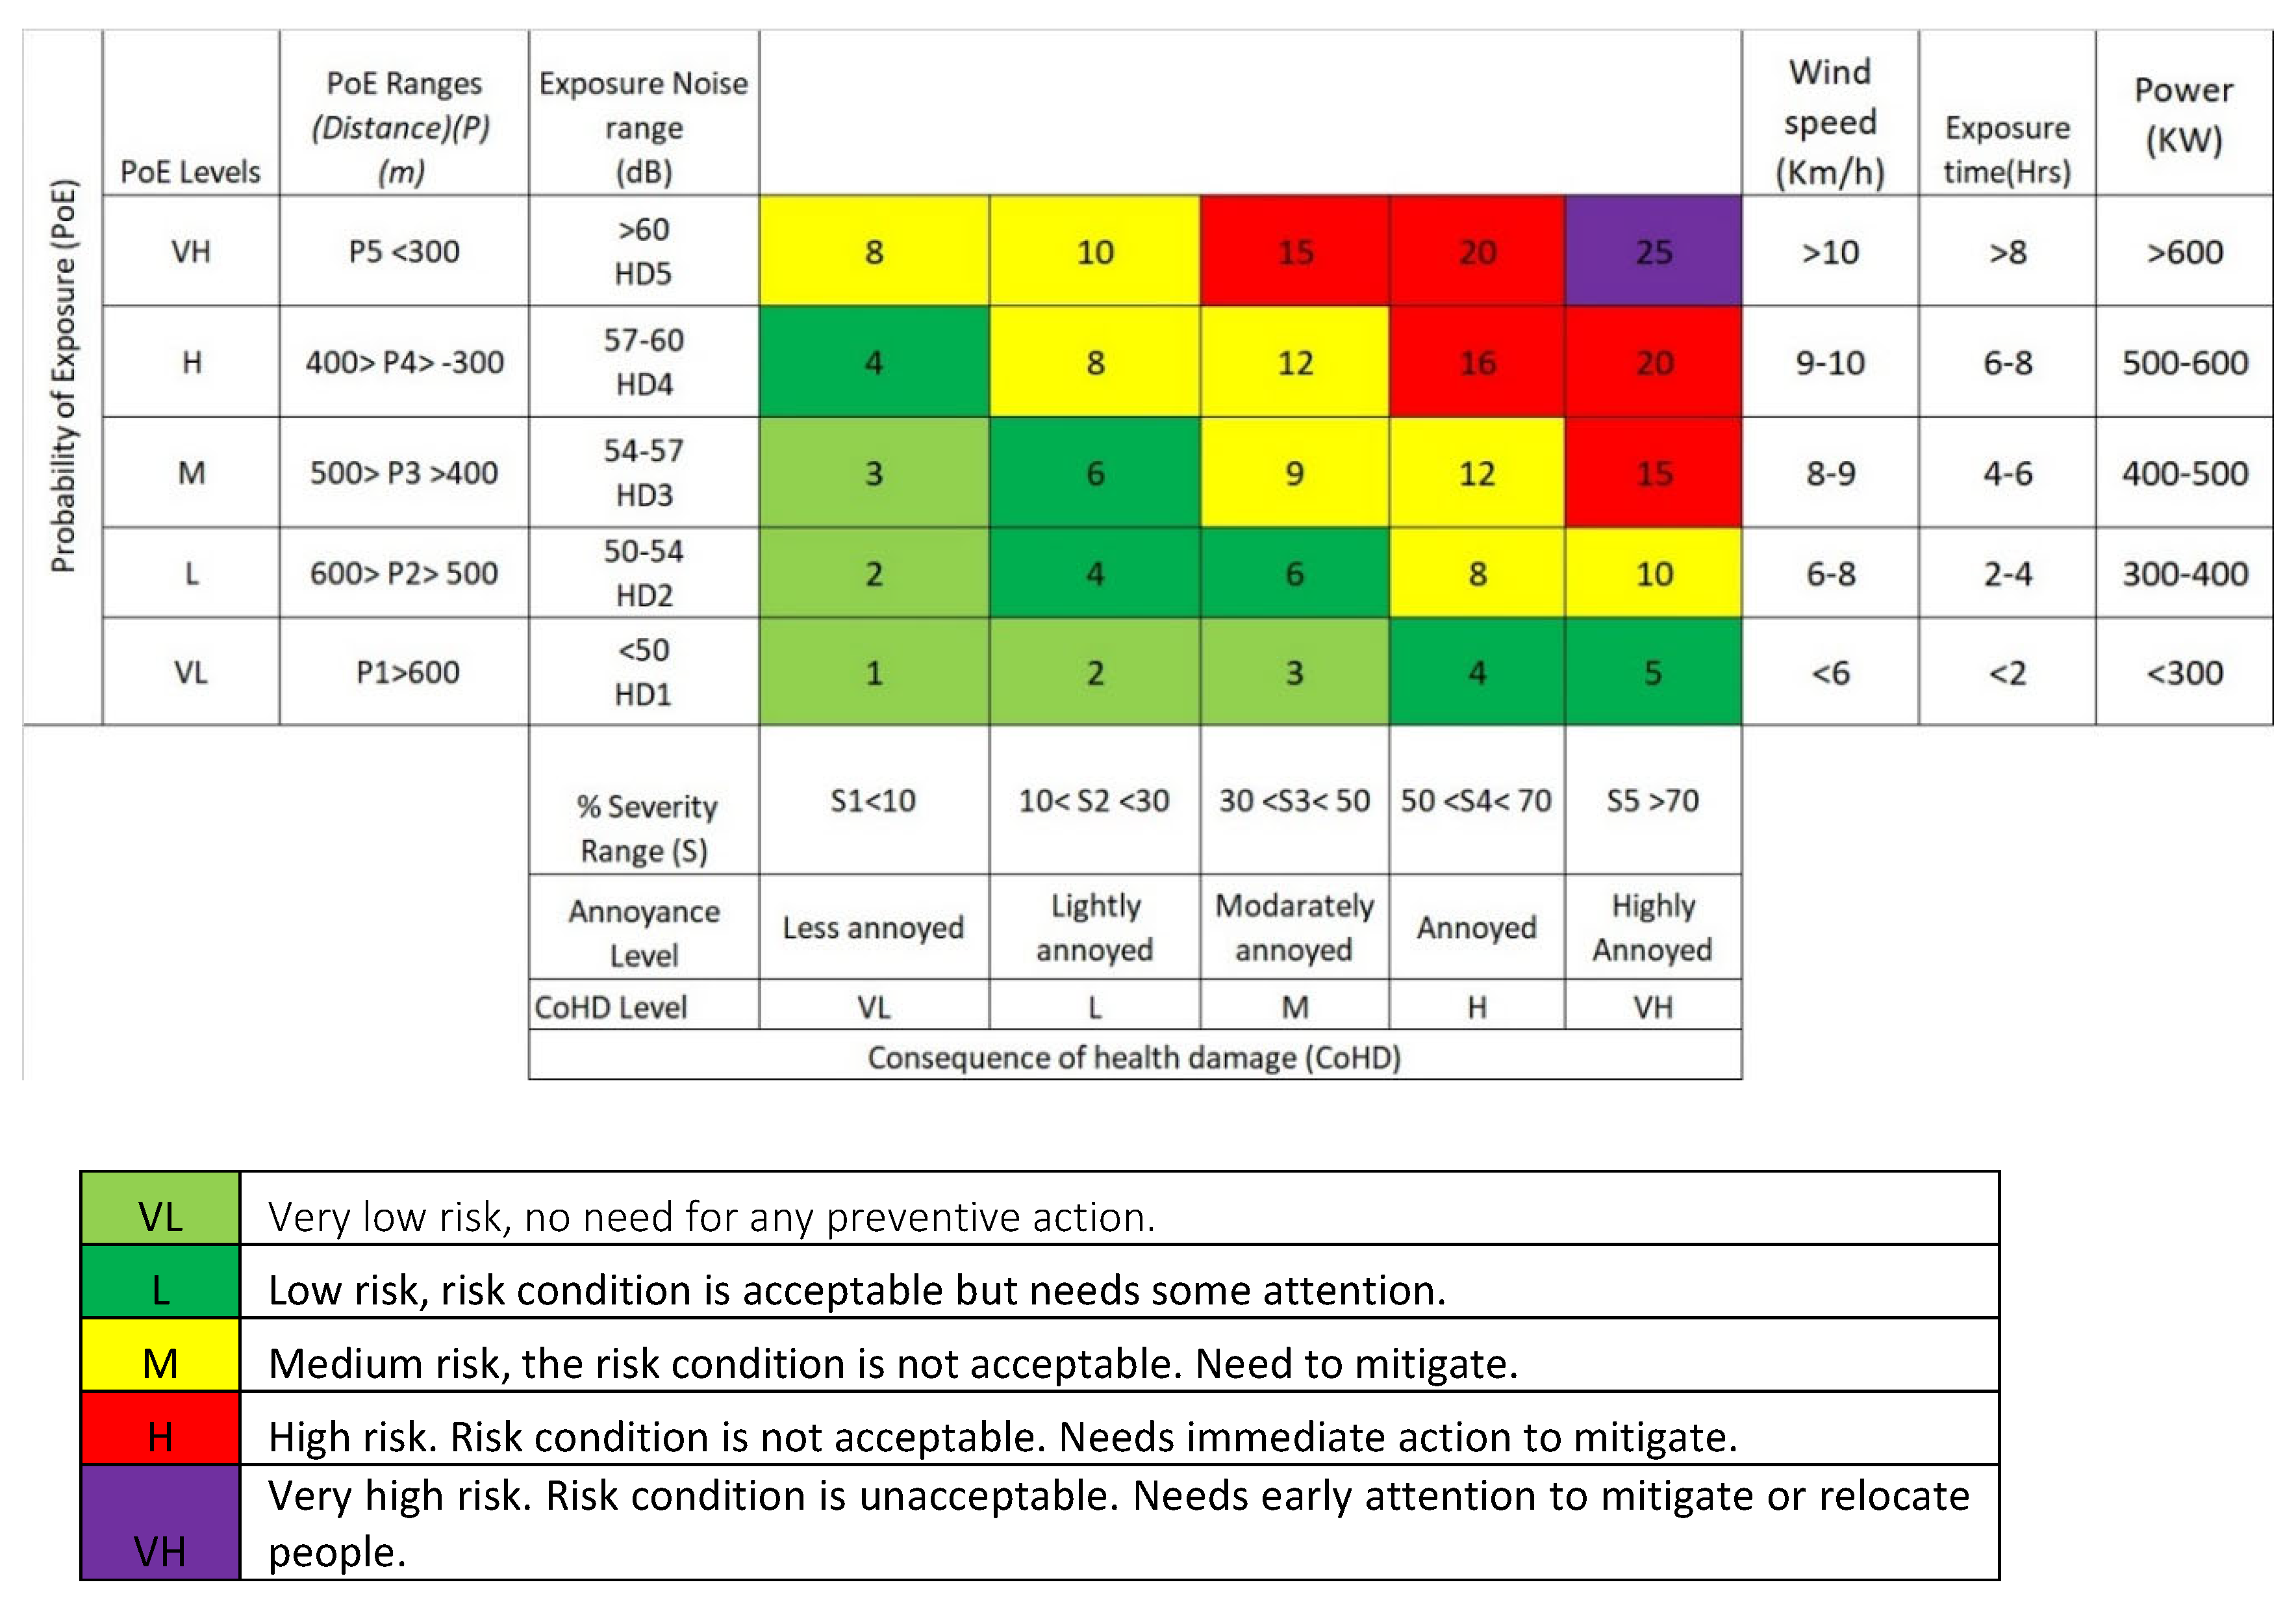
The rule base was developed using a table look up approach, see
Figure 2. Moreover, to simulate the range boundaries, the Gaussian combination MFs (GCMFs) (also known as "gauss2mf") were chosen, to model the range values that have no change taking place on their representative level (i.e. VL, L, H, and VH) [
35]. The PoE ranges, based on distance and exposure noise ranges, were decided based on the noise measurement results presented in Figure 6. The severity ranges were determined as in
Table 4.
Figure 6 summarise the day and night time noise distribution graphically. From this analysis it is clear that night time has a high noise level distribution in the range of 52-60dB compared to day time. This will cause inconvenience to the nearby residential locations. Although European countries, and Australia, have stipulated separate guidelines to maintain the noise generation from wind turbines and reduce inconvenience to the public Sri Lanka uses the existing industrial noise regulation to regulate the noise generated from wind turbines which is not appropriate. According to Australian noise criteria, the wind farm noise levels should not exceed 35 dB(A) in rural areas where, according to the world health organization (WHO) guidelines, the noise levels should be 43 dB(A) in L
A90,10min [
37,
38,39,40].
A. Noise Risk Assessment through Fuzzy Logic Based Expert System
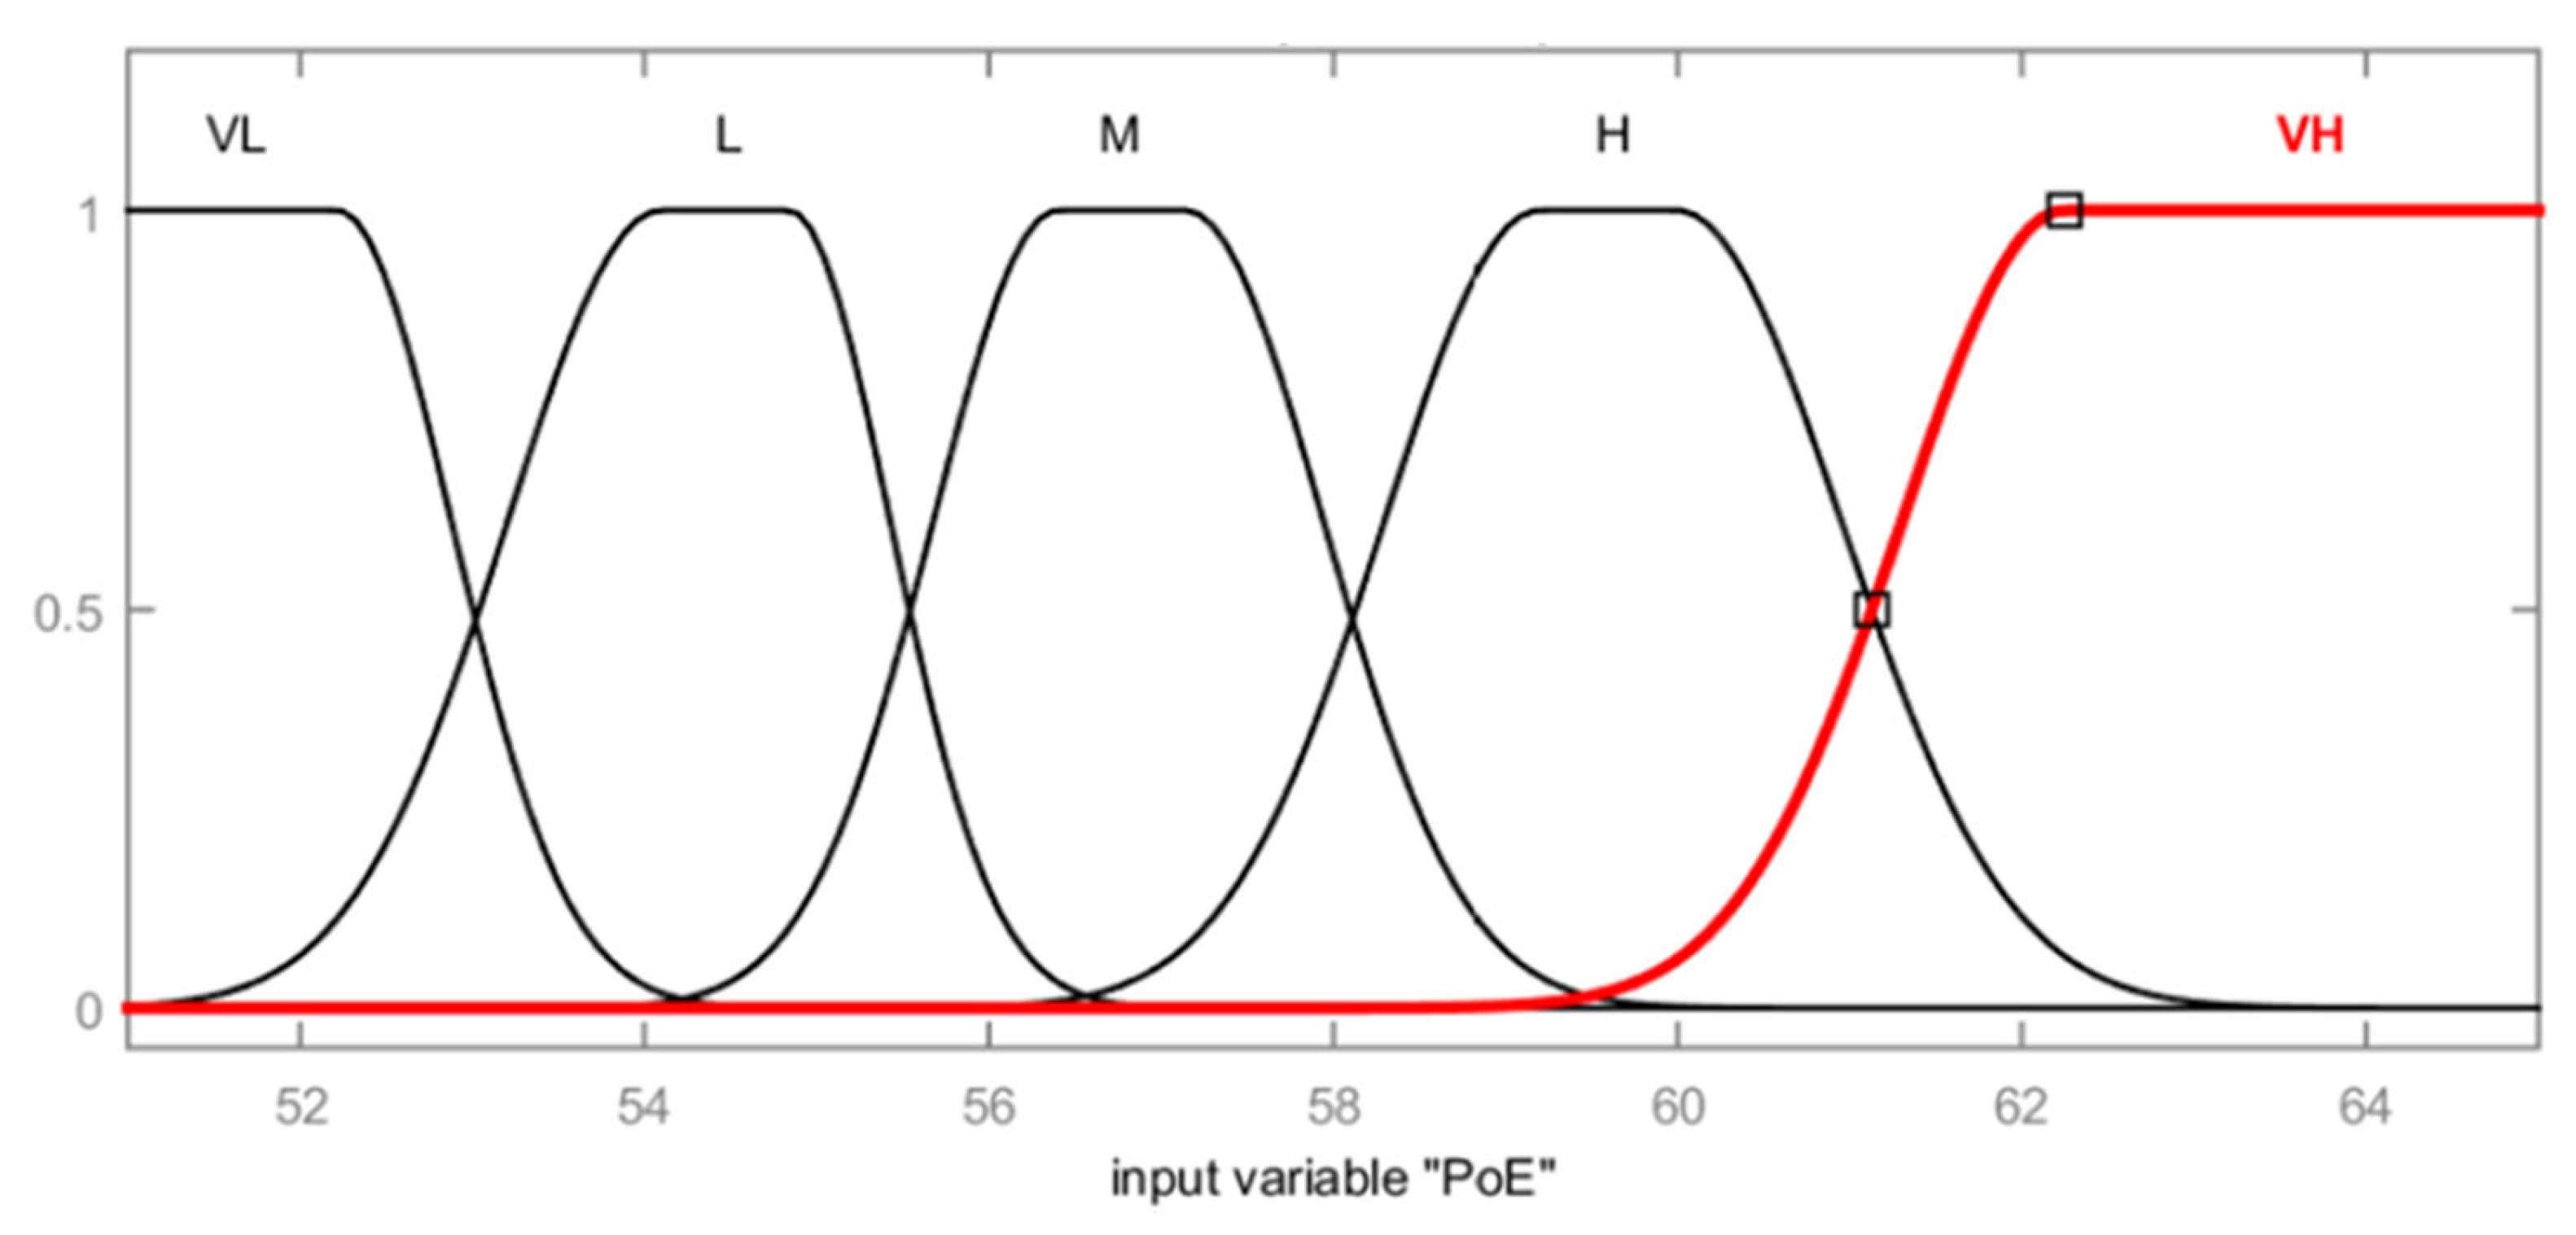
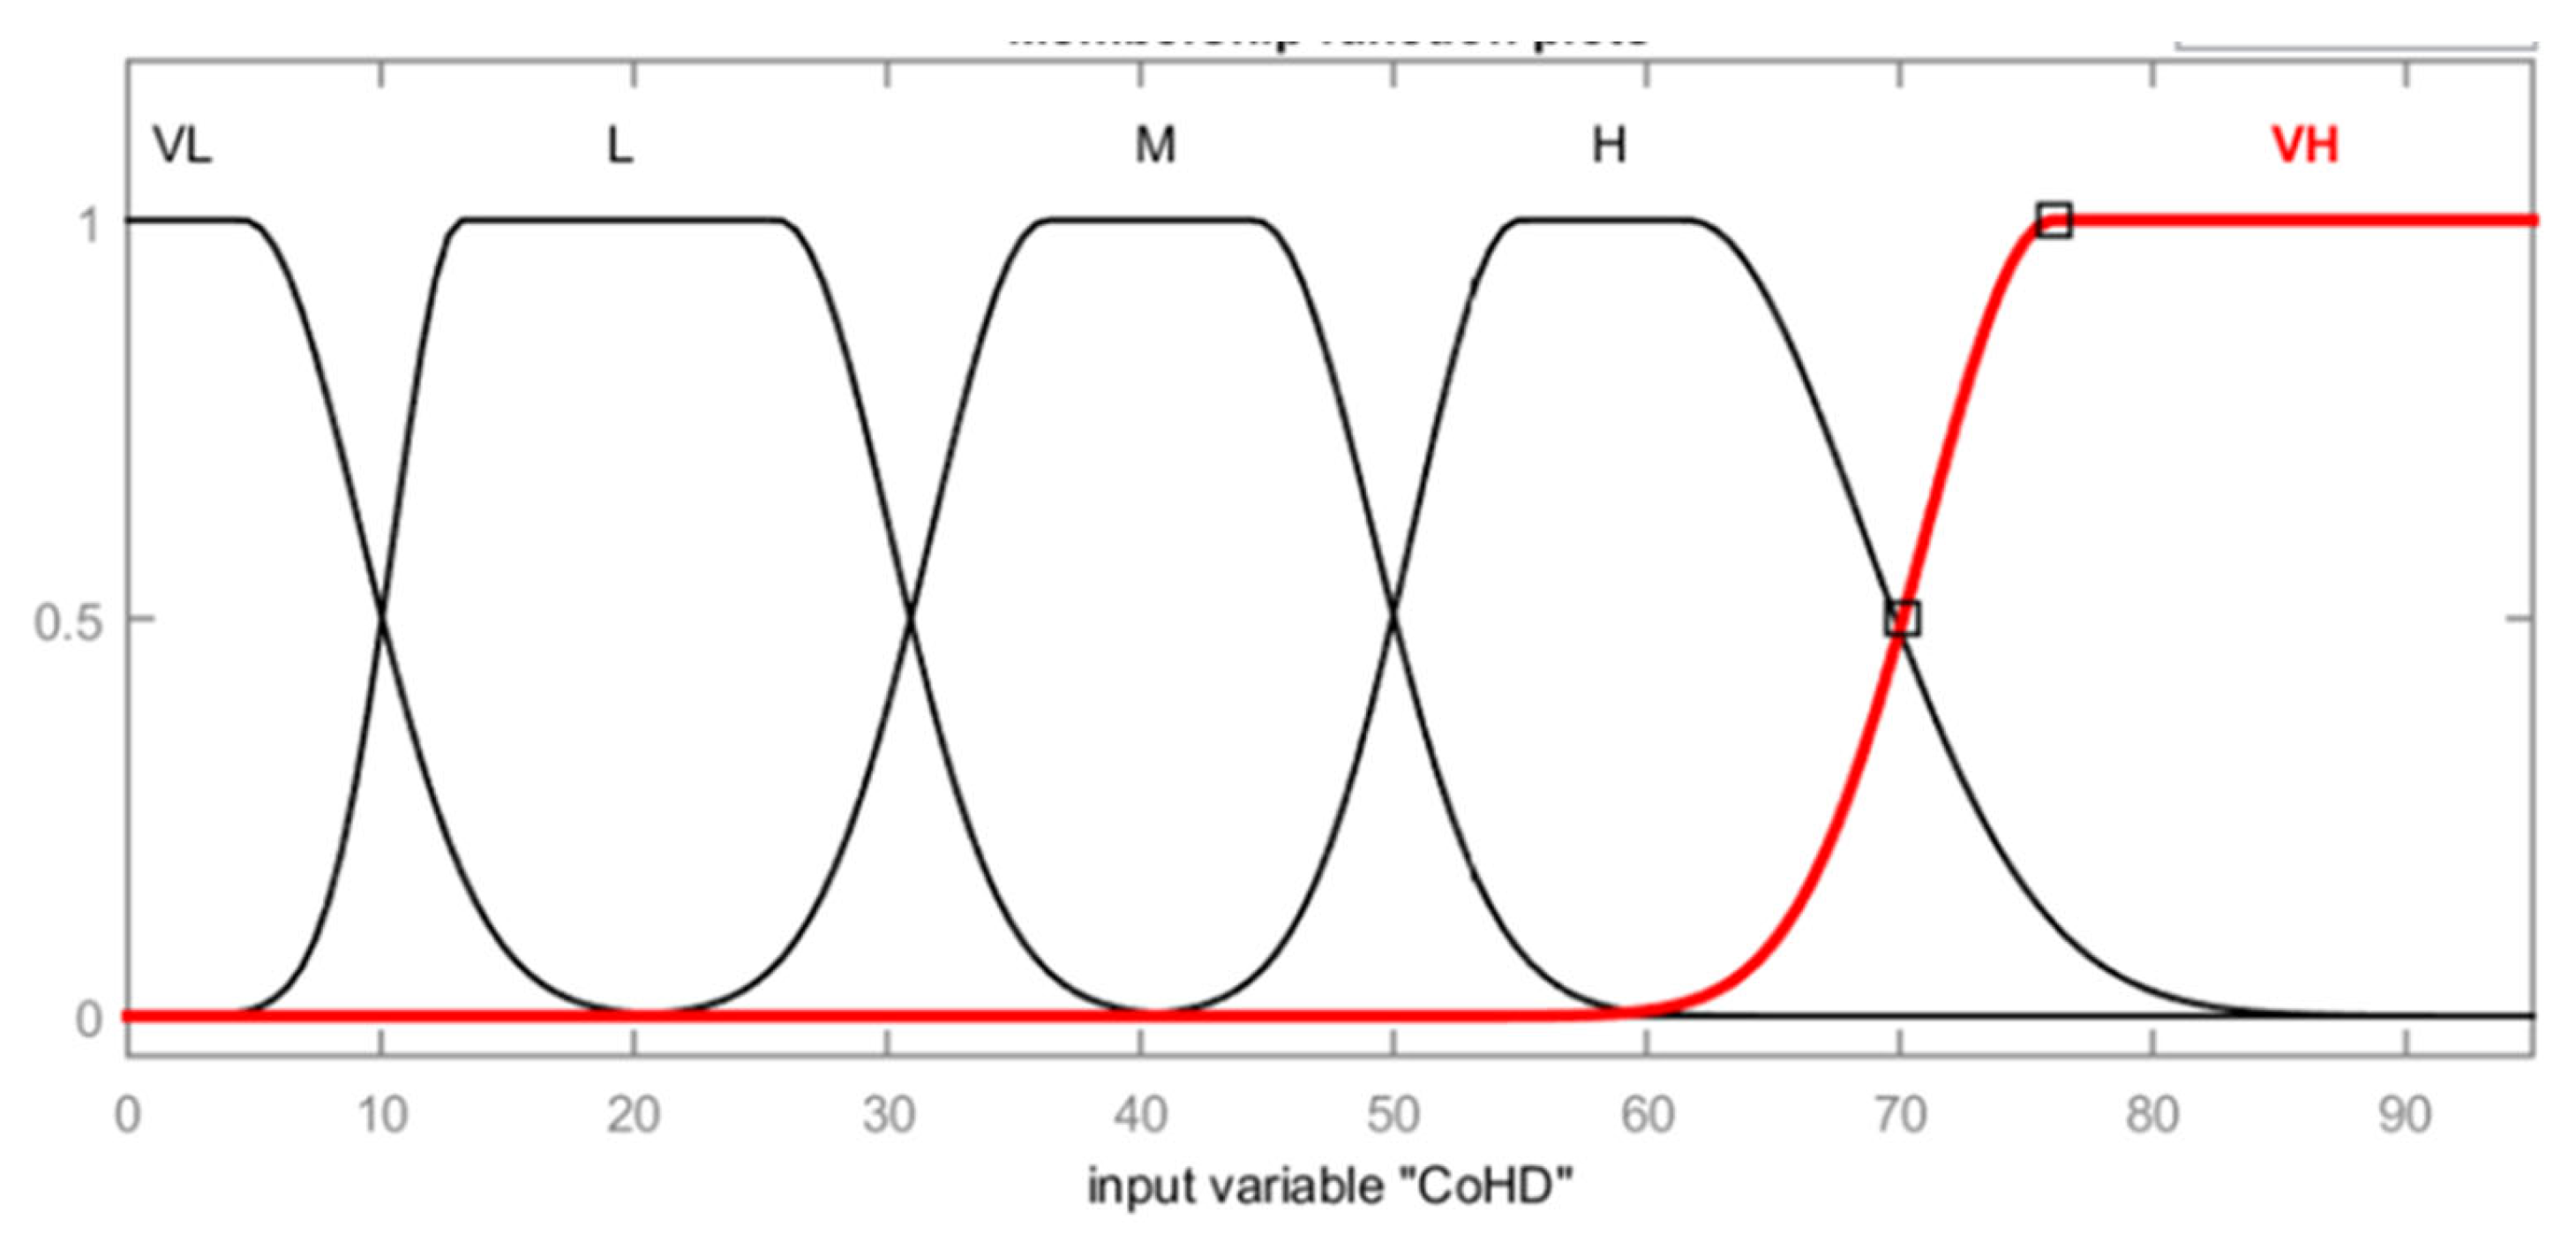
The input variables PoE and CoHD were modelled using the Gaussian MF method. The parameters that were used to construct the Gaussian MFs are summarised in
Table 7.
Figure 7 shows the MF plot for the PoE. The fuzzification aids in the computation of PoE values based on a standard for determining the risks associated with exposure to wind turbine noise.
Figure 8 illustrates the second input for the membership function (MF2). Here, the severity percentage was taken to calculate the CoHD through the fuzzification MF2, instead of using an ad hoc or approximate assessment.
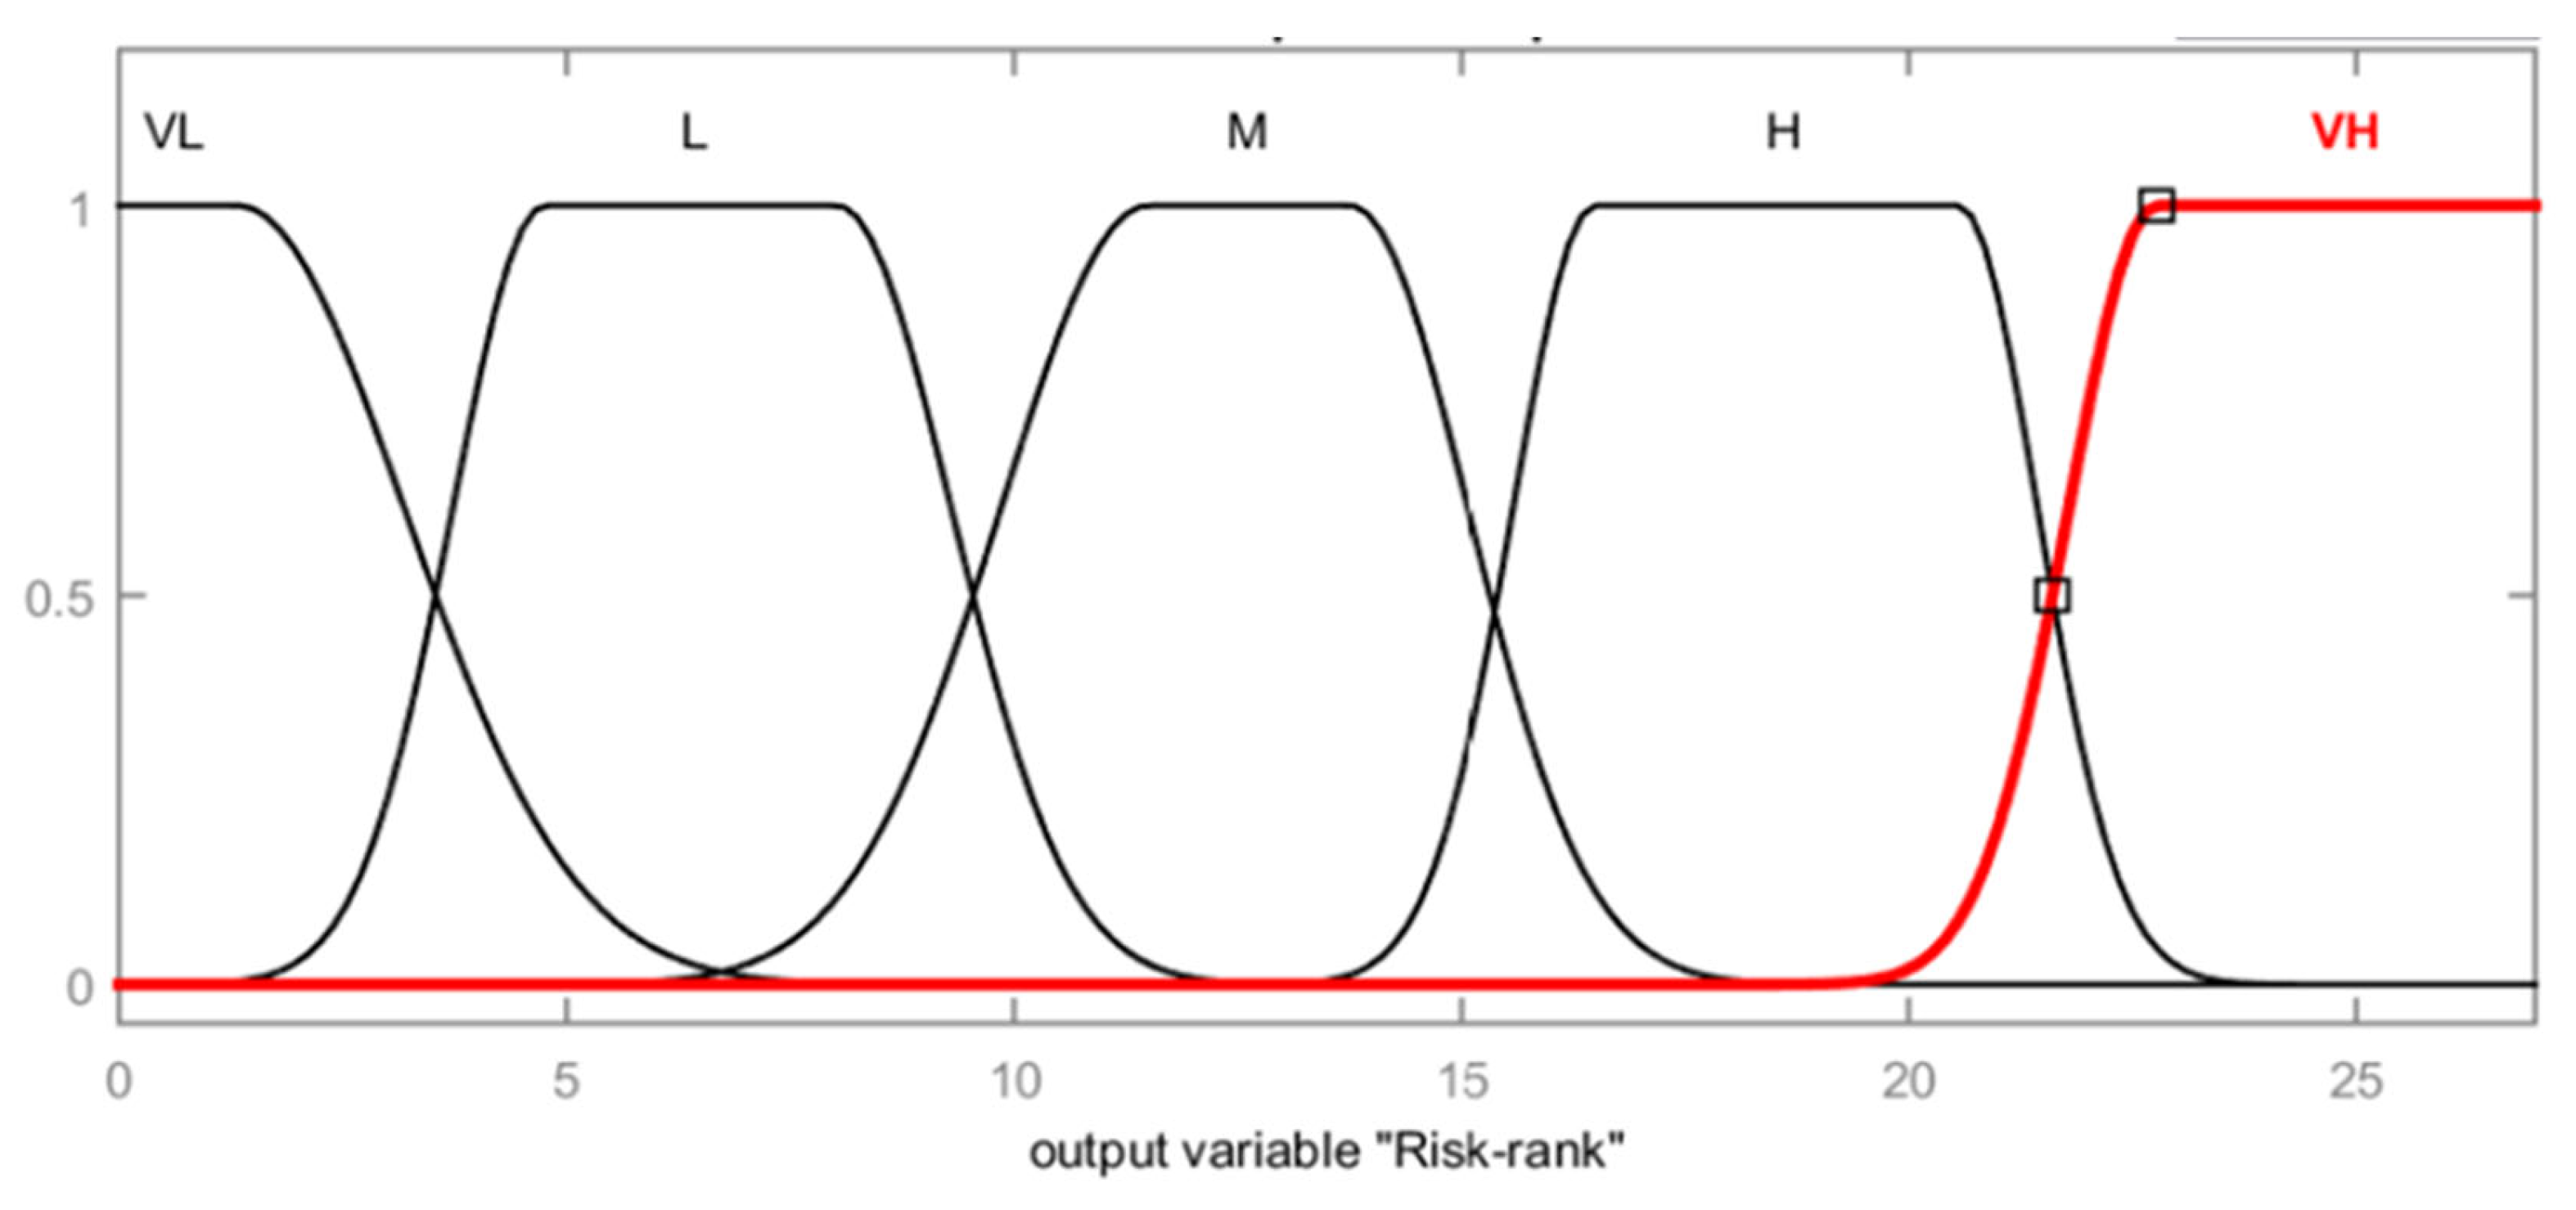
The MF plot of noise risk is shown in
Figure 9. In order to evaluate the risk rank based on the supplied MF values, fuzzy ranks were produced.
The risk matrix in figure 4 was used to generate the fuzzy rule base shown in table 8 using the table look up method.
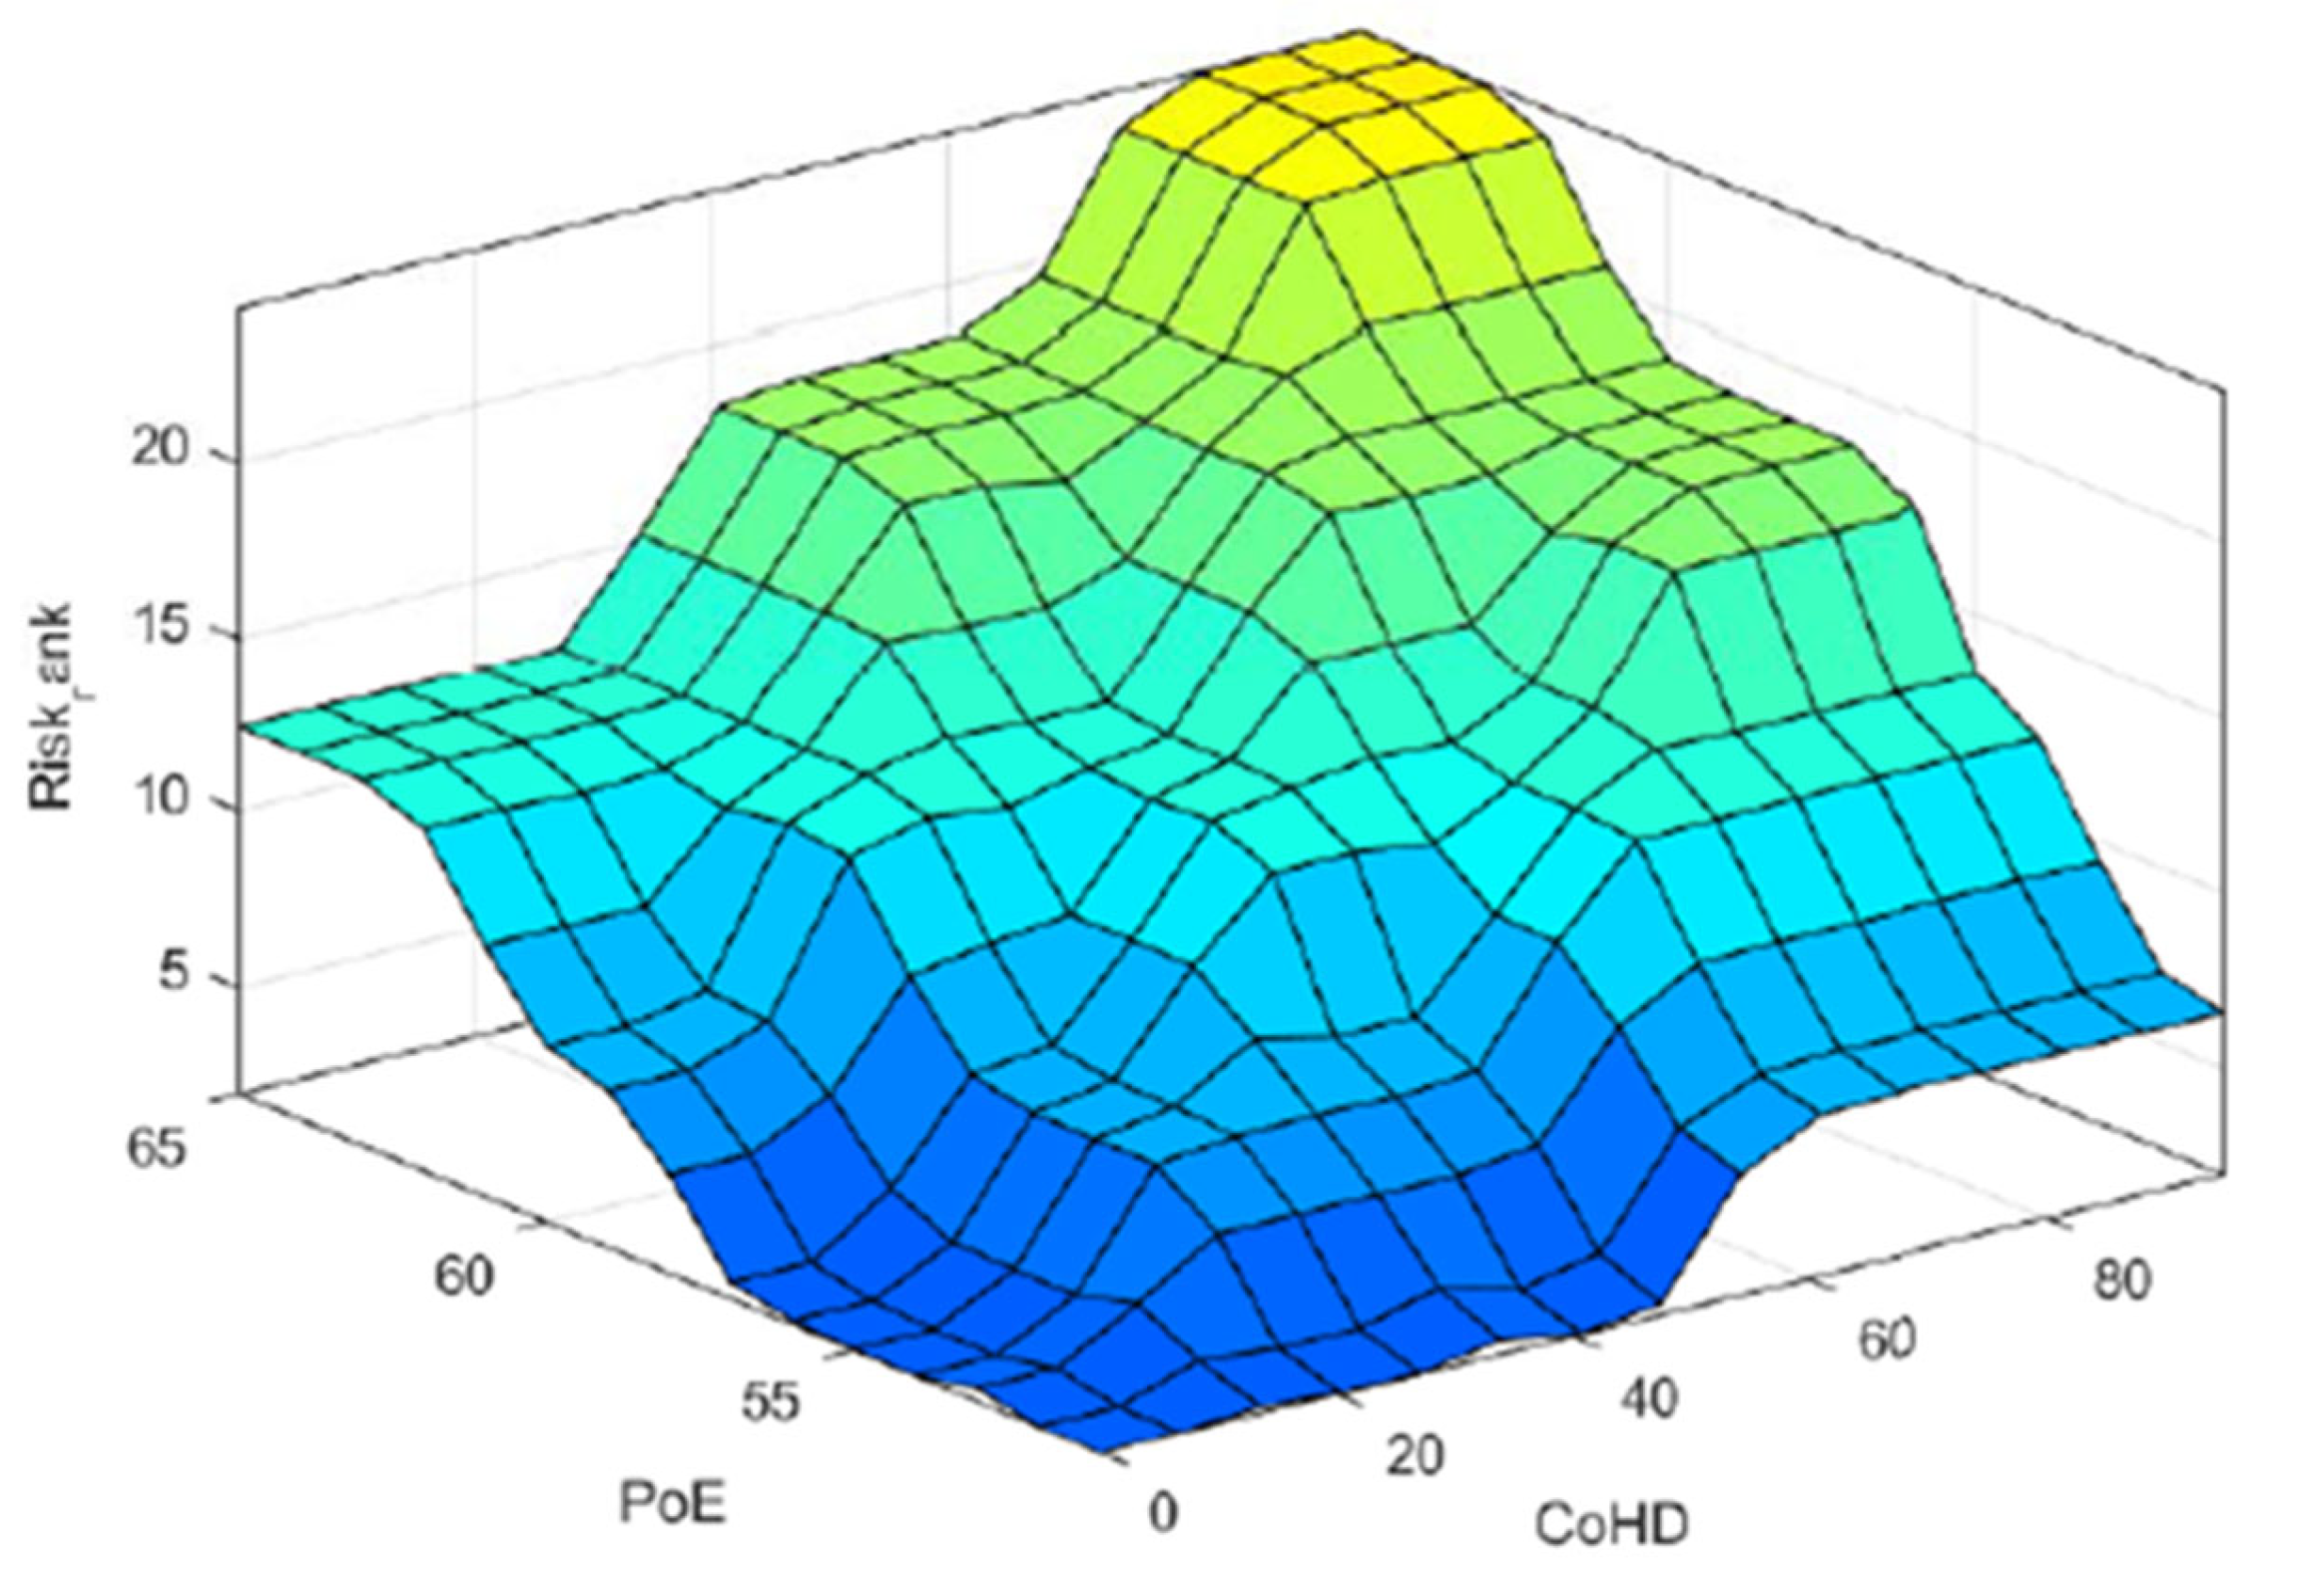
Figure 10 illustrates the risk profile that was generated using the membership functions and the rule base. The risk profile is uniformly distributed within the ranges of PoE vs CoHD. To obtain a smooth profile the input MF’s were optimised.
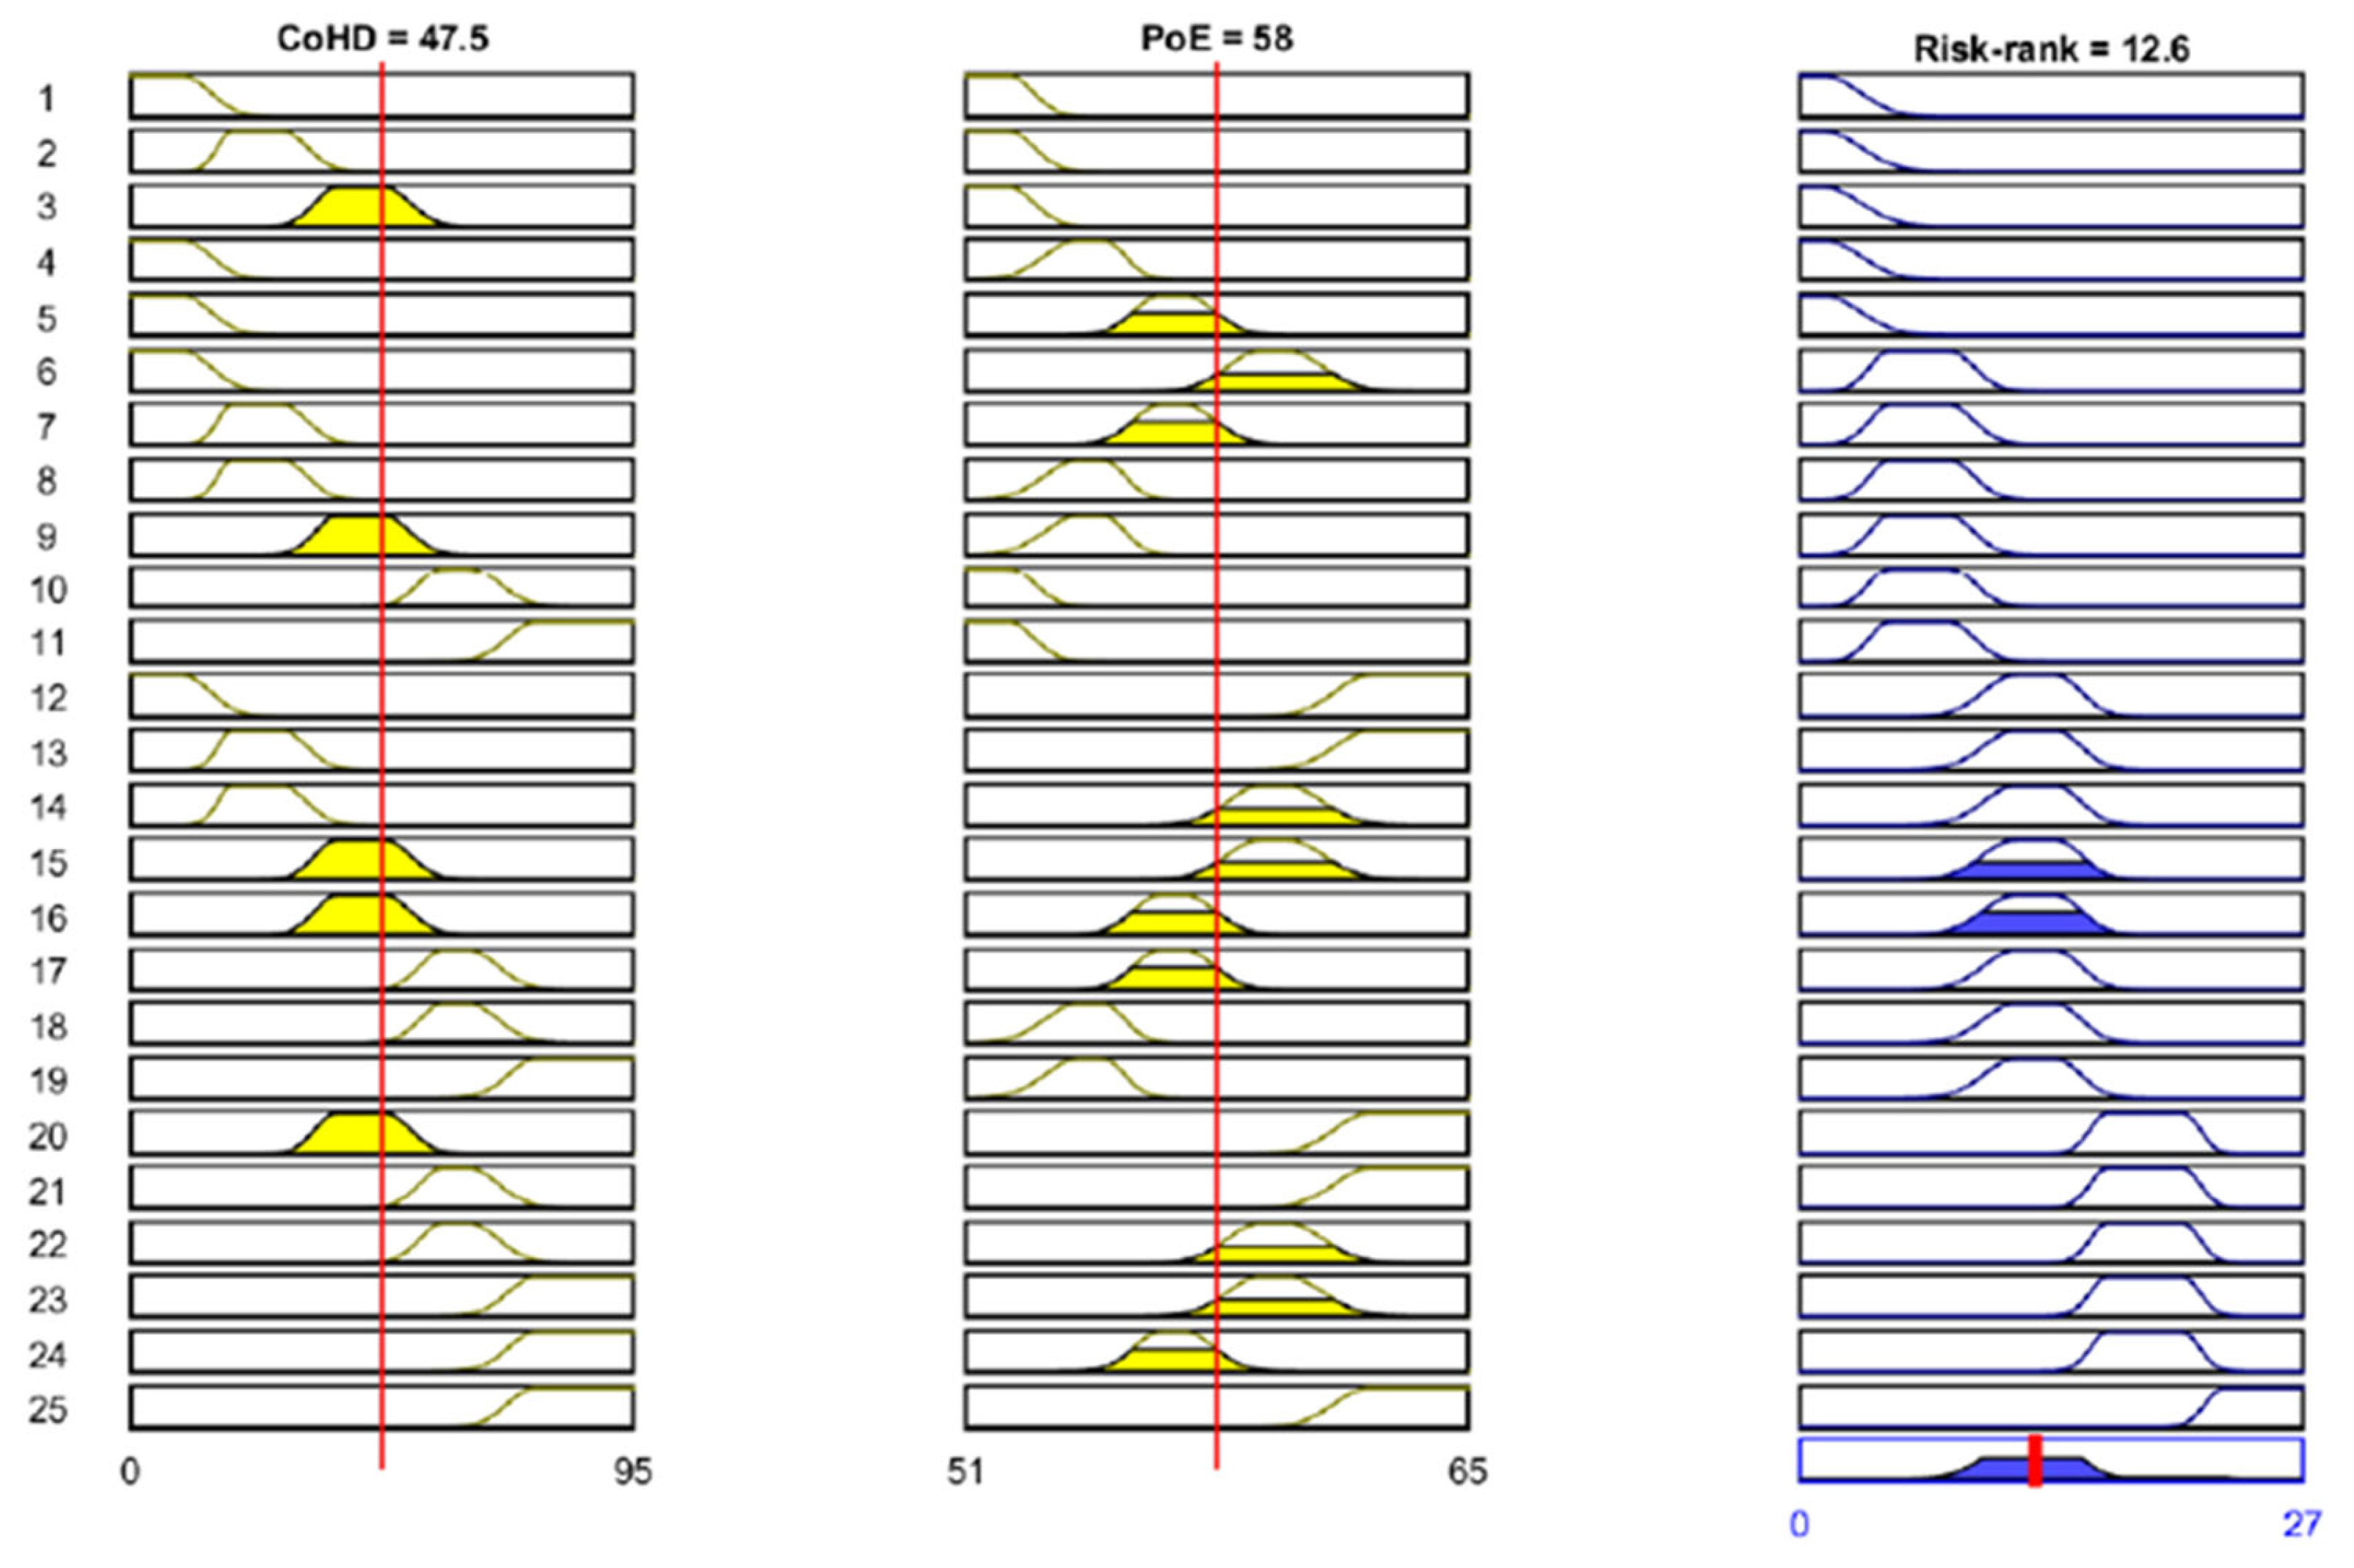
Figure 11 demonstrates an example of calculating the risk rank when PoE =58 and CoHD =47.5; the risk rank is estimated as 12.6 and the level of the risk is classified as Medium (see Figure 4 and
Figure 11).
When the exposure risk is ‘Medium’(M), this indicates that the high noise levels need to be mitigated (see the legend in Figure 4).
Table 9 summarise the necessary preventive action derived from the calculated risk rank for the selected PoE and the CoHD levels and the legend in the figure 4.
This describes noise risk level assessment based on the input parameters. Once the input parameters are well established though expert judgement, the noise risk level can be analysed based on the changing input parameters (PoE and CoHD). On the basis of this study, the ideal input conditions to reduce risk levels can be identified. This analysis can be further enhanced to alert the asset owners to take necessary preventive actions to minimise the noise risk levels based on changing input parameters.
4. Conclusions
The analysis in this paper shows that when a wind farm's power production is higher, the turbine produces more aerodynamic noise throughout operation, but when the power output is lower, the turbine produces less aerodynamic noise. Hence, we can conclude that when increasing the amount of power generation with increased wind speed, the aerodynamic noise also increases causing inconvenience to the public. With future energy crises looming, the usage of renewable energy sources will be the main option and so harvesting wind energy is of prime importance. As a result, countries like Sri Lanka and other developing countries should pay attention to developing there quired guidelines for maintaining noise levels from wind farms, to minimise public inconvenience.
To support the above requirements, the noise risk level analysis methodology developed using afuzzy logic based expert system can be proactively used to detect the noise risk levels, based on input parameters (PoE and CoHD). As the risk matrix has already been developed, it is not necessary to consider the ranges of the input MF. The risk level will be directly available, based on the input variables [
35]. This enables the development of a fully digitised online risk assessment system to investigate remedial actions and minimise the noise risk to society and other living beings in proximity to the area.
To perform in-depth analysis, in future research, it is important to record the frequency spectrums for different atmospheric conditions, accounting for the variation of temperature and humidity. Also, further studies are required to investigate noise risk mitigation approaches (to society and living beings), based on the recorded noise risk data presented in this study.
