
Submitted:
19 October 2024
Posted:
21 October 2024
You are already at the latest version
Abstract
The Balanced Scorecard (BSC) is a widely recognized strategic performance metric that has been extensively studied in large corporations but remains underexplored in the context of Small and Medium-sized Enterprises (SMEs). Understanding the effectiveness of BSC in aligning performance metrics with strategic goals and enhancing performance management in SMEs is critical for fostering growth and competitive advantage. This systematic review aims to evaluate the effectiveness of the Balanced Scorecard in measuring performance and strategy execution within SMEs, particularly focusing on financial and non-financial outcomes such as employee motivation, customer satisfaction, and business sustainability. A systematic review was conducted following the PRISMA framework, incorporating 136 studies sourced from Google Scholar, Web of Science, and SCOPUS. Eligibility criteria focused on publications from the last ten years that address the implementation of BSC in SMEs. Quantitative, qualitative, and mixed-method studies were included, with 49.63% of studies using quantitative methods, 26.67% qualitative, and 23.70% mixed-methods. Risk of bias was assessed using the Chrohane tool, revealing high risks in 90 studies due to incomplete outcome data and selective reporting. The review found that 74% of studies adopted a holistic approach by focusing on all four BSC perspectives (Financial, Customer, Internal Processes, and Learning and Growth). ROI emerged as the most frequently discussed key performance indicator, addressed in 36.84% of publications, while customer satisfaction and employee engagement were covered in 26.32% each. Geographic disparities were observed, with most of the research concentrated in Asia and Europe (40%) and only 8% in Africa. Despite positive outcomes such as improved business sustainability and competitive advantage (38.52% of studies), challenges persisted, including poor strategy execution and limited resources, necessitating careful customization of BSC to SME-specific contexts. The Balanced Scorecard demonstrates significant potential in enhancing performance management and strategic execution within SMEs, particularly when tailored to address unique constraints such as resource limitations. This review highlights the need for further research to standardize key performance indicators and explore sector-specific applications. By addressing these gaps, the BSC can be more effectively utilized to drive growth, agility, and long-term competitive advantage in SMEs.
Keywords:
Balanced Scorecard
; performance measurement
; SMEs
; strategy execution
; sustainability
; competitive advantage
; systematic review
1. Introduction
The Balanced Scorecard (BSC) is a renowned strategic management framework that offers a holistic view of organizational performance by incorporating a blend of financial and non-financial measures [,2]. Originally conceptualized by Kaplan and Norton, the BSC seeks to align business activities with an organization's overarching vision and strategy, thereby facilitating enhanced monitoring of performance and more effective strategy execution [3,4]. Although the BSC is widely implemented and rigorously studied within large corporations, its adoption and efficacy in the context of Small and Medium Enterprises (SMEs) remain relatively underexplored [5,6]. SMEs, which are generally defined by the number of employees and annual revenue, vary in size across different countries and sectors [7,8]. Despite their pivotal role in driving economic growth, fostering innovation, and generating employment, SMEs often face distinct challenges that differ significantly from those of larger enterprises [9]. These challenges typically encompass resource limitations, difficulties in strategic execution, and constraints in tracking and managing performance [10,11].
Research focusing on the BSC's application within SMEs is notably limited, particularly concerning its practical implementation and its impact on organizational performance metrics and strategic outcomes [12]. Given the resource constraints that characterize SMEs, there is a tendency to prioritize financial indicators, frequently overlooking the non-financial dimensions that the BSC framework emphasizes [13,14]. This systematic review seeks to bridge this research gap by evaluating the effectiveness of the BSC methodology specifically in SMEs, with an emphasis on how the framework’s four perspectives—financial, customer, internal business processes, and learning and growth—can address the unique challenges SMEs face [15,16]. The motivation for conducting this systematic review arises from the need to deepen the understanding of how SMEs can harness the BSC to enhance strategic execution, improve performance management practices, and achieve long-term sustainability [17,18]. By thoroughly analyzing the existing literature, this paper aims to elucidate both the limitations and advantages of employing the BSC in the SME sector, providing valuable insights into the factors contributing to its successful implementation and identifying potential obstacles to its adoption [19,20]. This focused evaluation contributes to advancing theoretical perspectives and practical applications, thereby enriching the discourse on the role of the BSC in driving SMEs' strategic and operational success.
The comparative analysis of previous literature reviews on the Balanced Scorecard (BSC) implementation in SMEs reveals several gaps and research opportunities, as shown in Table 1. While some studies emphasize the lack of focus on SME-specific BSC applications or cover sustainability integration, others are limited by regional scope or lack of empirical data. The proposed systematic review aims to address these gaps by offering a more comprehensive evaluation of BSC trends in SMEs, with a focus on performance measurement evolution, regional diversity, and sustainability practices. This expanded scope will provide deeper insights into BSC's practical implications for SMEs and contribute to addressing the identified research limitations as shown in Table 1.
Identified gaps suggest the need for further investigation into BSC's role in developing economies, new empirical studies to substantiate theoretical findings, and an expansion of the scope to incorporate diverse industries. The proposed systematic review aims to address these limitations by providing a comprehensive evaluation of BSC applications in SMEs, focusing on trends in performance measurement, integration with sustainability frameworks, and contextual adaptations across various regions.
1.1. Research Questions
The Balanced Scorecard Methodology has been extensively studied and implemented in Small and Medium Enterprises, although a systematic literature review that outlines the application of the BSC in Small and Medium Enterprises or (SMEs) is very critical, and to achieve this, the following research questions have been considered:
- How is customer satisfaction measured and monitored in SMEs using the BSC framework?
- Which role does technology play in implementing an effective BSC in SMEs?
- What is the impact of the BSC on the performance and motivation of employees in SMEs?
- What challenges do SMEs face when integrating the BSC methodology into their existing management practices?
- How do SMEs customize the BSC framework to align with their specific strategic goals as well as operational contexts?
1.2. Research Motivation
The Balanced Scorecard (BSC) methodology, designed to translate organizational strategy into actionable performance metrics, has been extensively adopted and studied within large corporations. Despite its demonstrated effectiveness in strategic alignment and performance enhancement, BSC's application within SMEs remains underexplored. This study aims to bridge this gap by investigating the potential benefits and challenges associated with BSC in the SME context. SMEs, which play a vital role in economic growth, job creation, and innovation, often face resource constraints, smaller workforce sizes, and lower operational scales compared to larger firms. These factors hinder their ability to effectively implement strategic management frameworks such as the BSC. Modern research highlights that SMEs must rapidly adapt to market changes, optimize resource allocation, and sustain competitiveness in volatile economic conditions.
The BSC provides a structured approach for translating strategic objectives into performance measures, offering SMEs a clear framework for strategic alignment and performance evaluation. However, there is a scarcity of research on how SMEs can effectively adapt and implement the BSC framework to address their unique operational constraints and strategic needs. This systematic review addresses this critical gap by evaluating the application of BSC within SMEs, examining its impact on strategy execution and performance metrics, and identifying best practices for overcoming implementation challenges. Understanding how to customize BSC to meet SME-specific requirements is essential for enhancing strategic management practices, contributing to long-term growth, and building organizational resilience.
1.3. Research Contribution
This systematic review provides a comprehensive analysis of the application of the Balanced Scorecard methodology within SMEs, emphasizing its role in performance measurement and strategy execution. By evaluating a wide range of studies from three major academic databases, this review assesses the effectiveness of BSC implementation in SMEs. The findings reveal recent trends in adapting the BSC framework, including integrating digital tools and data analytics for real-time performance monitoring. Additionally, the review highlights the growing emphasis on aligning BSC metrics with sustainable business practices.
Several gaps in the existing literature are identified, such as the absence of standardized metrics tailored to SME-specific challenges and limited research on the impact of BSC on innovation and organizational agility. The review addresses these gaps, providing insights into how SMEs can adapt the BSC methodology effectively. Case studies demonstrating successful adaptations and innovative approaches are also examined, showcasing how SMEs customize BSC frameworks to align with competitive pressures and dynamic market conditions. Furthermore, this review synthesizes empirical evidence across various studies, offering actionable recommendations for SMEs aiming to implement BSC methodologies. It contributes to the literature by presenting a consolidated view of BSC's impact on strategic outcomes and performance improvement in smaller enterprises. Overall, this systematic review not only addresses existing gaps but also provides practical guidance for SMEs seeking to leverage the BSC for enhanced strategic alignment and business performance.
1.4. Research Novelty
This systematic review addresses a crucial gap in the literature by focusing specifically on the Balanced Scorecard's application in SMEs. Previous studies primarily target large corporations, with limited investigation into how the BSC framework operates within the tailored operational challenges of SMEs, such as resource constraints, limited managerial capacity, and informal business processes. This study offers a deeper examination of the four BSC perspectives—financial, customer, internal business processes, and learning and growth—emphasizing their interconnections and customized applicability for SMEs.
The financial perspective in SMEs is often challenged by unstable cash flows and restricted access to capital. This study explores how SMEs can adapt the BSC to focus on financial sustainability through agile financial management. The customer perspective, typically addressed in the context of large-scale customer bases, is revisited to show how SMEs can leverage BSC to closely monitor customer satisfaction, which is often relationship-based in small businesses. For internal business processes, SMEs frequently face inefficiencies and lack formalized processes. This review demonstrates how the BSC can provide a structured method for optimizing internal operations, directly addressing gaps in previous studies that overlooked process improvement in resource-limited environments. The learning and growth perspective, crucial yet underexplored in SMEs, is highlighted in terms of employee development and innovation. By examining these four perspectives, the review fills gaps in the literature and offers a detailed understanding of BSC's role in improving SME performance and strategy execution. The findings suggest that a tailored BSC model, sensitive to the specific needs and contexts of SMEs, can drive competitive advantage, sustainability, and strategic agility.
2. Materials and Methods
In this section, the study presents in full detail the methodology of how information was collected from various sources from different databases, the computer code used to search for research papers, the inclusion and exclusion criteria for the review etc. This includes all the materials and methods used to gather research papers, and the process is as follows: Firstly, the focus is on the eligibility criteria, information sources, search strategy, the process of selection, the process of collecting data, data items, study risk of bias assessment, effect measures, synthesis methods, reporting bias, as well as certainty assessment. This information is provided below:
2.1. Eligibility Criteria
The eligibility criteria for this systematic review were carefully defined to ensure the inclusion of high-quality and relevant studies that focus on the application of the Balanced Scorecard (BSC) methodology within the context of Small and Medium Enterprises (SMEs). The criteria were established with the intention of capturing recent advancements in the field and providing a comprehensive analysis of BSC implementation in SMEs. The selected criteria are described below, followed by a summary of the inclusion and exclusion conditions presented in Table 2. The inclusion of studies published between 2014 and 2024 was chosen to reflect the most recent developments in strategic management tools and methodologies. This period is considered relevant for understanding current trends in BSC application and addressing any evolving challenges that SMEs face. Publications prior to 2014 were excluded to maintain a focus on modern practices and innovations. Additionally, only peer-reviewed journal articles were considered, as peer review serves as a quality control mechanism, ensuring that the studies have undergone rigorous evaluation by experts. This requirement helps maintain the credibility and robustness of the evidence presented in this review. The review specifically targeted studies that discuss the BSC methodology in SMEs, providing insights into how these businesses adapt and implement BSC. General BSC studies not tailored to SMEs were excluded to focus on the unique context and challenges faced by smaller enterprises.
Studies were also required to be published in English to ensure accessibility and consistency in the analysis, despite recognizing the potential limitation of language bias. Finally, studies with unclear methodologies or insufficient data were excluded to uphold the integrity and reliability of the findings. These criteria collectively aim to provide a well-rounded and current analysis of BSC use in SMEs, ensuring that only relevant and high-quality studies are considered. Table 2 summarizes the inclusion and exclusion criteria applied in this review [172,173,174,175,176,177,178,179,180,181,182,183,184,185,186,187].
The eligibility criteria outlined above ensure that the systematic review captures recent evidence, maintains a high standard of quality, and provides meaningful insights into the strategic management practices of SMEs. By narrowing the focus to studies within the defined timeframe and context, the review aims to generate findings that are not only academically rigorous but also practically relevant for business leaders seeking to implement the BSC in their organizations.
2.1. Information Sources
For this systematic review, three primary databases—Google Scholar, SCOPUS, and Web of Science—were selected to ensure a comprehensive and high-quality search of the literature. These databases were chosen based on their distinct advantages and complementary strengths, which provide a balanced approach to the review [172,173,174,175,176,177,178,179,180,181,182,183,184,185,186,187]. Google Scholar is a widely accessible search engine that indexes a broad range of academic content, including journal articles, conference papers, and books. Its inclusion is justified by its extensive coverage, capturing a diverse array of documents related to the Balanced Scorecard methodology across different disciplines and contexts. However, one limitation of Google Scholar is that it does not consistently guarantee the quality of indexed sources. Since its algorithms can include non-peer-reviewed content, variability in the quality of search results may arise. SCOPUS serves as a comprehensive abstract and citation database, known for its wide disciplinary range, particularly in business management and strategic research. It indexes only peer-reviewed journals, book chapters, and conference proceedings, which adds rigor to the search results. SCOPUS's strong citation tracking capabilities help identify highly cited and influential works. However, coverage bias can occur, as the database tends to focus on established journals and publishers, potentially missing research from less conventional sources. Web of Science (WoS) is another premier research database, offering access to a variety of citation indexes across multiple academic disciplines. It is selected for its rigorous indexing standards and detailed bibliometric data, which are essential for tracking citation patterns. The database's emphasis on high-quality publications ensures a reliable review, although it shares the limitation with SCOPUS regarding coverage bias, as it predominantly includes well-established journals.
In choosing these three databases, this review balances scope and quality, ensuring a broad interdisciplinary perspective that covers various facets of the Balanced Scorecard implementation in SMEs. The databases were selected following a five-step process for determining information sources, as illustrated in Figure 1. This multi-step process ensures a systematic approach to capturing high-quality and relevant studies.
2.1. Search Strategy
To ensure a thorough and high-quality systematic review, a comprehensive search strategy was employed to identify relevant literature on the Balanced Scorecard (BSC), performance metrics, and strategy execution in Small and Medium Enterprises (SMEs) [172,173,174,175,176,177,178,179,180,181,182,183,184,185,186,187]. This process was designed to capture a diverse range of studies, allowing for a well-rounded exploration of BSC implementation across different contexts and recent developments. By following a structured and iterative approach, as shown in Figure 2, the search strategy aimed to balance inclusivity and rigor, ensuring that only the most pertinent and methodologically sound research articles were included. The search string used, which combined terms like Balanced Scorecard, BSC, performance metrics, strategy execution, and SMEs, aimed to comprehensively capture the application of BSC in SMEs. The search was conducted across three prominent academic databases: Scopus, Web of Science, and Google Scholar. Each database was selected for its distinctive strengths in covering business and management research, particularly in the areas of strategic management and SME-related studies. The time frame of 2014 to 2024 was chosen to include the most current research, reflecting recent trends and methodologies.
The search process encountered challenges, including terminology variations and the need for manual filtering to ensure relevance. Refinements were made to the search string to address these issues, such as using synonyms and alternative phrases to capture studies using different terms for the same concepts. The final selection of studies focused on peer-reviewed journal articles, conference proceedings, and case studies with rigorous methodologies, excluding non-academic sources and studies that lacked sufficient methodological quality. This careful selection process helped ensure the inclusion of high-quality, relevant literature that would provide a solid foundation for understanding BSC implementation in SMEs.
2.1. Selection Process
The study selection process for this systematic review was meticulously designed to ensure that only the most relevant and high-quality studies were included [172,173,174,175,176,177,178,179,180,181,182,183,184,185,186,187]. This process was implemented to filter out studies that did not meet the established criteria and to focus on those that would provide the most valuable insights into the implementation of the Balanced Scorecard (BSC) in Small and Medium-sized Enterprises (SMEs). Given the specific focus on BSC applications in the SME context, the selection criteria emphasized factors such as methodological rigor, publication quality, and relevance to the research questions. The selection involved multiple stages to refine the list of eligible studies. Initially, the inclusion criteria were applied to identify potentially relevant studies, followed by systematic screenings of titles, abstracts, and full texts. Each stage was conducted manually by two independent reviewers to ensure consistency and to minimize the risk of bias. In cases where disagreements arose, a consensus was reached through discussion, guaranteeing a thorough evaluation of all potential studies. Figure 3 outlines these steps in detail, depicting the sequential approach taken from the initial application of inclusion criteria to the final documentation of selected studies.
The multi-step selection process ensured a comprehensive review, aligning the chosen studies with the objectives of this systematic review and enabling a robust analysis of the BSC's effectiveness in SMEs. This careful approach, involving manual screening and multiple verification stages, contributed to a high-quality dataset that underpins the findings and recommendations of this review.
2.1. Data Collection Process
The data collection process for this systematic review was designed to systematically gather information on the implementation of the Balanced Scorecard (BSC) in Small and Medium-sized Enterprises (SMEs). A structured approach was applied to ensure the accuracy and objectivity of the data extracted from peer-reviewed studies [172,173,174,175,176,177,178,179,180,181,182,183,184,185,186,187]. The multi-step process began with identifying relevant studies that focused on the use of the BSC for performance measurement and strategy execution within the SME context. This systematic approach aimed to capture a comprehensive view of the literature, as depicted in Figure 4, which outlines the sequential steps involved in the data collection. Three independent reviewers conducted the data collection to enhance the reliability of the results. The process began with the screening of titles and abstracts, followed by a full-text review to determine the eligibility of each study based on established inclusion criteria. By having reviewers work independently, potential biases were minimized. Discrepancies between reviewers were addressed through discussions to reach a consensus, ensuring the selection of only relevant, high-quality studies.
Throughout the data collection phase, variability in the reporting standards of the studies posed a challenge, particularly in terms of consistency. To mitigate this, a standardized coding scheme was developed to ensure uniformity across the extracted data, encompassing study characteristics, BSC implementation details, performance metrics, and strategic outcomes. This coding scheme facilitated a coherent analysis and synthesis of the findings. The data collection framework involved five key steps: Initial Screening, Full-Text Review, Discrepancy Resolution, Data Extraction, and the use of Automation Tools for quality assurance. These steps collectively ensured the systematic retrieval and verification of data, providing a strong foundation for analysing how SMEs implement the BSC to overcome strategic challenges and drive performance improvements.
2.1. Data Items
The data items selected for this review focused on key performance indicators linked to the Balanced Scorecard (BSC) implementation in SMEs. Metrics were classified into customer satisfaction, employee performance, financial outcomes, and supporting tools [172,173,174,175,176,177,178,179,180,181,182,183,184,185,186,187]. These categories ensured comprehensive coverage of BSC's impact on strategic goals in SMEs. Figure 5 illustrates the data identification process.
Customer satisfaction was assessed through surveys, interviews, and Net Promoter Scores, providing both qualitative and quantitative insights. Employee performance and engagement metrics, including job satisfaction and productivity, were evaluated using surveys and performance reviews. Financial and non-financial outcomes, such as profitability and internal process improvements, were analysed to measure BSC's alignment with strategic goals. Where data was incomplete, decisions were made based on the relevance of available information. The review also examined software and digital tools used in BSC implementation, recognizing their role in execution. When details were missing, industry standards informed assumptions. This categorization aimed to capture BSC's influence on diverse performance metrics across SMEs.
2.1. Study Risk of Bias Assessment
The study risk of bias assessment is a critical step in ensuring the validity and reliability of systematic reviews [172,173,174,175,176,177,178,179,180,181,182,183,184,185,186,187]. For this review on the Balanced Scorecard (BSC) methodology in SMEs, potential biases were thoroughly evaluated using the Cochrane Risk of Bias tool, which helped identify and manage risks associated with selection, performance, detection, and reporting biases. Given that SMEs differ significantly from large corporations, the review specifically tailored the assessment to address the unique operational conditions of smaller enterprises, ensuring the findings are applicable and credible within the context of SME performance evaluation.
A tri-reviewer approach was employed to minimize bias, with two independent reviewers conducting evaluations separately before reaching a consensus through discussion. This process ensured that assessments were unbiased and well-supported. Selection bias was addressed by including only studies specifically focused on SMEs, while performance bias was managed by emphasizing studies using performance metrics appropriate for smaller enterprises. Detection bias was reduced by selecting studies employing robust, SME-specific tools, such as BSC models adapted for the unique needs of SMEs. Additionally, reporting bias was tackled by conducting a broad literature search across multiple databases (SCOPUS, Web of Science, and Google Scholar) to ensure the inclusion of a diverse range of studies, including less frequently cited works. Manual assessment, rather than automation tools, was used to maintain a context-specific approach, as automated processes might miss the nuanced differences in BSC applications between SMEs and larger firms. Figure 6 illustrates the risk of bias assessment process, detailing each step taken to evaluate and mitigate biases at various stages.
This comprehensive assessment aimed to ensure the quality and relevance of the studies included in the review, systematically addressing potential biases. The approach enhanced the reliability of the conclusions by tailoring the evaluation criteria to the specific characteristics of SMEs, making the findings more applicable to this sector. This bias management strategy ensures transparency and rigor in the systematic review process.
2.1. Effect Measures
To address, Effect Measures, this systematic review evaluates multiple metrics to capture the impact of Balanced Scorecard (BSC) implementation in SMEs, specifically focusing on financial and non-financial dimensions. The primary measures employed include customer, employee, and organizational outcomes, each assessed using distinct quantitative indicators. For customer outcomes, metrics such as the Net Promoter Score (NPS) and Customer Satisfaction Index (CSI) were utilized. NPS provides a direct gauge of customer loyalty and likelihood to recommend, while CSI quantifies satisfaction levels through survey-based data, reflecting the effects of BSC on customer experiences before and after implementation [172,173,174,175,176,177,178,179,180,181,182,183,184,185,186,187].
Employee-related metrics include the employee turnover rate and Key Performance Indicators (KPIs) to measure retention, engagement, and productivity shifts post-BSC. These measures illustrate changes in workforce dynamics and internal processes attributable to BSC adoption. For organizational performance, financial metrics such as profitability and revenue growth were analyzed, complemented by non-financial metrics like process innovation and operational efficiency improvements, offering a well-rounded evaluation of BSC's impact on SMEs. The methodological process of selecting and applying these effect measures is visualized in Figure 7, which outlines key steps from identifying relevant metrics to synthesizing results.
2.1. Synthesis Methods
The synthesis methods employed in this systematic review aimed to comprehensively integrate findings related to the implementation of the Balanced Scorecard (BSC) in SMEs [172,173,174,175,176,177,178,179,180,181,182,183,184,185,186,187]. The approach began with a structured search and selection process, ensuring the inclusion of only relevant studies published between 2014 and 2024, written in English, and peer-reviewed. These studies specifically addressed the BSC's role in performance metrics and strategy execution within SMEs, thereby aligning with the objectives of this review. Figure 8 provides a visual representation of the synthesis methods applied throughout the review. During data preparation, steps were taken to address missing or ambiguous data by imputing values when appropriate and ensuring consistency across studies through format standardization. This process involved excluding studies with substantial data limitations and documenting the impact on findings. Microsoft Excel was used for organizing extracted data, facilitating the comparison of variables such as performance metrics, strategy execution, and outcomes related to BSC implementation.
Qualitative synthesis methods played a significant role in analyzing the data, identifying thematic patterns and insights about BSC's impact on performance management and strategy execution in SMEs. While meta-analysis was not conducted due to the heterogeneity of the included studies, subgroup analyses were used to explore differences by industry type, geographic location, and SME size. Sensitivity analyses further strengthened the findings by excluding outlier studies to determine their influence on the conclusions. The synthesis approach allowed for a comprehensive evaluation of both financial and non-financial outcomes of BSC implementation, providing insights into its effectiveness in various SME contexts. This process ensured a robust and detailed analysis of the literature, thereby supporting the validity of the review's conclusions.
2.2. Reporting Bias
In this systematic review, assessing the risk of reporting bias was critical to ensuring the validity of the findings related to the Balanced Scorecard Methodology in SMEs. The review implemented a multi-step approach to detect potential biases and improve the comprehensiveness of the evidence base. A detailed search was conducted across multiple databases, including SCOPUS, Web of Science, and Google Scholar, which helped minimize publication bias by covering a wide spectrum of research, including grey literature such as case studies, conference papers, and dissertations [172,173,174,175,176,177,178,179,180,181,182,183,184,185,186,187]. By incorporating these diverse sources, the review aimed to avoid selective reporting bias that could arise if only peer-reviewed journal articles were considered. To further reduce the risk of bias, any available research protocols were compared with the results sections of the studies included in the review to identify any inconsistencies or instances of selective outcome reporting. This comparison was essential for ensuring that all relevant findings were accounted for and that no significant results were omitted or selectively highlighted. The overall approach emphasized qualitative synthesis while striving for a balanced and complete representation of the available evidence. The process used to assess and address reporting bias is illustrated in Figure 9, which outlines the steps taken to identify potential issues, including database selection, grey literature inclusion, and checks for redundant or over-represented studies.
This systematic review undertook a rigorous process to address reporting bias by employing a comprehensive search strategy, comparing research protocols to reported results, and including diverse types of literature to provide a more balanced evidence base. These efforts minimized the risk of missing data or selectively reported findings, thereby enhancing the reliability of the conclusions regarding the Balanced Scorecard's application in SMEs.
2.2. Certainty Assessment
A robust search strategy was employed to gather studies that are relevant. Multiple academic databases have been searched, including SCOPUS, Google Scholar, and Web of Science, using the following search code: Balanced Scorecard OR BSC AND SMEs OR Small and Medium-sized enterprises OR Small and Medium enterprises [172,173,174,175,176,177,178,179,180,181,182,183,184,185,186,187]. The initial search yielded 10 000 articles. These articles were subjected to a screening process: Articles were assessed based on their titles and abstracts to determine their eligibility and relevance. Studies that did not meet the eligibility criteria were excluded. The remaining articles were reviewed in full to evaluate their methodology as well as relevance. Inclusion criteria was applied to ensure studies specifically addressing the BSC in SMEs were selected. Two independent reviewers from colleagues working on the same project, which is creating a journal, conducted the screening and selection. All disagreements were resolved through discussion. Clear, predefined inclusion and exclusion criteria were utilized consistently to ensure decision-making that is objective. These measures were implemented to reduce bias.
Figure 10 outlines the steps taken to ensure the credibility of this systematic review: Define Certainty Criteria – Criteria were established for the evaluation of the relevance as well as quality of studies. Screen Abstracts for Relevance – Abstracts were initially screened to exclude or filter out studies that are irrelevant. Full-Text Evaluation – Selected articles were reviewed in full to assess whether they meet the required standard, as well as to assess their quality and applicability.
Assess Quality and Bias – Studies were evaluated for potential biases and methodological quality. Summarize and Rank Certainty – The findings were summarized, and the studies were graded based on the certainty of their contributions to this systematic review. This visual aid provides clarity on the review process, and it supports the presentation of results. By adhering to these methodological procedures, this review aims to deliver a comprehensive as well as an unbiased analysis of the BSC methodology in SMEs, which contributes valuable insights to the field. Figure 10 shows the steps followed for the certainty of assessment.
3. Results
This section is divided by subheadings, and it provides a concise and precise description of the experimental results, their interpretation, as well as the experimental conclusions drawn.
3.1. Study Selection
This study selection process followed the process shown in Figure 11. The research papers were extracted from the databases: Google Scholar, Web of Science, and SCOPUS, using the keyword search mentioned in section 2.3. Search strategy. The research papers were collected based on the inclusion and exclusion criteria mentioned in section 2.1. Eligibility criteria, and 10 000 papers appeared, and the papers were filtered using the inclusion and exclusion criteria, and the most relevant papers were selected. The selected papers are 136 papers. Out of 136 papers, 109 were from Google Scholar, 14 were from Web of Science, and 16 were from SCOPUS, and this is demonstrated in Figure 12. Out of the collected 136 papers, there were book chapters, conference papers, dissertations, and journal articles. All the 136 papers were eligible for full-text review and were integrated into this process of systematic analysis. Figure 13 shows the distribution of online databases, and many papers were collected from Google Scholar. Table 3 shows the publications of research papers associated with the Balanced Scorecard Methodology Performance Metrics and Strategy Execution in SMEs. Over the past 10 years, the table shows that the number of publications of research papers associated with this study increased, and this shows that there is a growing interest in the implementation of BSC in SMEs. Figure 13 shows the number of publications for different years in the past 10 years.
3.2. Study Characteristics
In this section, studies are included as well as the characteristics of each study. The characteristics of these research papers are reporting the details of the studies, and this is their applicability. The table shown below presents the research papers as well as citations, title, sample size, subject area, perspectives of Balanced Scorecard, and key performance indicators. Only 20 papers were used for the study characteristics, and this is shown in Table 3.
The distribution of publications on the Balanced Scorecard across various geographic locations is revealed in Figure 14. Asia and Europe have the largest number of publications, with Asia (including countries like: Vietnam, Malaysia, and Indonesia) leading with 13, 6, and 9 publications. Europe follows with significant contributions from individual countries such as Italy= 4 and United Kingdom=4. Other regions with substantial contributions include South Africa which stands at 8 publications as well as Portugal with 7 publications. Some research papers did not specify their geographic locations, and they amount to 18. Overall, the results tell us that while research on the BSC is globally distributed, there is a significant concentration in Europe and Asia, with notable contributions from countries like South Africa and Portugal. This geographic distribution highlights the global interest in the Balance Scorecard but underscores certain regions as more prominent in this research field.
The results suggest that the BSC is more extensively researched and more effectively implemented in certain regions. The very high volume of publications in Asia, particularly in Indonesia, Vietnam, and Malaysia, reflect a strategic focus on enhancing performance metrics within rapidly growing economies. This rising trend correlates with broader economic shifts in these regions, such as increasing emphasis on performance management as well as strategic alignment in SMEs. Overall, the geographic distribution of BSC research highlights regional differences in interest and implementation, suggesting that further investigation must be done into the factors driving these discrepancies could offer valuable insights into the effectiveness and adoption of the BSC methodology in various contexts.
Figure 15 illustrates the distribution of different types of research outputs related to the BSC. Many publications, 86.67%, are Journal Articles, and this reflects a strong preference for this format for distributing research outcomes. Conference Papers follow with 6.67%, indicating a lesser focus on presenting findings at academic conferences. Dissertations and Theses collectively make 5.18%. Case Studies and Book Chapters, each contribute 0.74%. This distribution shows that while journal articles are dominant in the publication landscape for Balanced Scorecard research, there is also some engagement with other types of studies such as conference presentations as well as academic theses. Overall, the minimal representation of other formats tells us that journal articles are the primary medium for disseminating research in this field.
The dominance of journal articles in the dissemination of BSC research highlights their role as the primary medium for stringent, peer-reviewed studies. This high percentage signifies that journal articles are the preferred format for presenting comprehensive analyses and validated findings on the implementation of BSC and effectiveness in SMEs. The sparse contribution from case studies and book chapters means that these methods are less used in the current BSC research framework. This distribution indicates a concentration of research efforts in producing journal articles that are detailed, peer-reviewed, which may possibly reflect a preference for well-established, empirical evidence over exploratory studies. Future research might benefit from diversifying publication formats and methodologies to enrich understanding as well as the application of BSC in SMEs.
The results illustrate how the publications related to the Balanced Scorecard methodology across various journals are distributed. The Accounting and Finance Research Journal has the highest proportion of publications which is 31.6%, which indicates that this journal is a prominent source for research on Balanced Scorecard within the context of financial and accounting studies. The Small Business Economics, as well as the Journal of Competitiveness, each contribute approximately 21% of the publications, reflecting a strong interest in BSC’s impact on the economic aspects as well as competitive strategies within SMEs. Materials Science and Engineering Journal, and Proceedings of the 13th European Conference on Innovation and Entrepreneurship, both account for the 5.3%, this suggests that BSC research is less in these areas, this indicates a niche or less direct application. Similarly, Sustainability represents 5.3%, showing that while BSC’s role in sustainability is recognized, it is less emphasized when compared to other fields. This distribution underscores that the primary focus of the BSC research is on financial management and competitiveness in SMEs, with different degrees of interest in other disciplines. This information is shown in Figure 16.
The distribution of publications across these journals notifies that the BSC methodology is largely explored through the view of financial management and competitive strategy within SMEs. The high proportion of articles in accounting and finance journals highlight the important role that financial performance measurement plays in BSC research. The substantial representation in journals focused on small business economics and competitiveness further shows the impact of the methodology on strategic decision-making and competitive positioning in SMEs. The lower representation in other journals, such as those focused on sustainability and materials science, suggests these areas are less prioritized in the context of BSC research. This distribution of journals points to a high interest in how BSC can improve financial and strategic outcomes in SMEs, while indicating future research opportunities to explore its application in other emerging fields.
Figure 17 illustrates the distribution of publications within the subject areas relevant to this systematic review. It reveals that a substantial proportion of the literature: 43.70% sorely focuses on the Balanced Scorecard. This indicates that there is a strong interest in how the BSC framework is applied and analyzed in diverse contexts. The area of SME Performance, which is very important for this review, constitutes the largest segment, which is 50.37%, indicating its significant emphasis in literature. On the other hand, 5.93% of the publications are not specified, suggesting a minor proportion of the literature remains unspecific. Overall, these results underscore a prominent focus on both the BSC methodology and SME performance, aligning well with the objectives of this systematic review to explore the application as well as the impact of BSC in SMEs.
The data underscores a clear trend towards a concentrated focus on the performance of SMEs and the BSC methodology within the literature. The significant emphasis on the performance of SMEs suggests that researchers are specifically interested in evaluating how the BSC framework impacts performance metrics in SMEs, aligning well with the objectives of this review to understand the practical implications of BSC in improving SME performance. The considerable proportion of publications dedicated to the BSC methodology reveal ongoing scholarly engagement with refining and expanding the theoretical as well as the practical applications of the framework. The small percentage of unspecified publications indicate that there is emerging areas of research or gaps in the literature classification. This distribution reveals that while there is a very strong focus on theoretical underpinnings and practical applications of BSC in SMEs, there is also a need for more comprehensive categorization as well as exploration of emerging topics. Future research will benefit from addressing these gaps and expanding the focus to include the less explored areas related to the BSC methodology.
Figure 18 shows the distribution of publications according to their industry context, focusing on SMEs, startups, and small businesses. Most of the literature, comprising 62.61%, specifically approaches SMEs, underscoring a strong emphasis on this sector, which is central to this review. Small businesses contribute 22.02% of the publications, presenting a significant but smaller body of research compared to SMEs. Startups offer 12.90% of the publications, indicating a average level of interest in this area. Additionally, 2.47% of the publications do not specify the industry context. These results propose that while there is notable research focused on SMEs, there is less focus on startups and small businesses, aligning well with the review’s objective of investigating the Balanced Scorecard’s impact within SMEs.
The predominance of publications focusing on SMEs underscores a clear research priority in understanding how the Balanced Scorecard methodology is applied and its effectiveness in this sector. This high concentration reveals the relevance and significance of BSC in addressing the unique challenges and opportunities faced by SMEs, hence aligning with the aim of the review to explore its impact in this context. The comparatively smaller focus on small businesses and startups means that while these areas are acknowledged, they are under explored compared to SMEs. This could suggest that there is a potential gap in the literature regarding how BSC might be adapted in startups and small businesses, which could be valuable for future research. There is a very low rating of unspecified industry contexts, which could reflect emerging areas of study or limitations in the available data, this suggests that new research directions might be needed. Overall, the results highlight a concentrated effort on SMEs, but also underscore opportunities for further investigation into the applicability of BSC across the different types of business contexts.
3.3. Risk of Bias in Studies
In this section, each study assessed the risk of bias by using the Chrohane risk tool. This tool assessed each study by evaluating their random sequence generation, allocation concealment, blinding of participants and personnel, blinding of outcomes, incomplete outcome data, selective reporting, other bias and overall risk of bias. Table 4 represents each study’s assessment by showing if the headings are UNCLEAR, LOW OR HIGH as a summary.
Figure 19 underscores that case studies and surveys are the predominant methods, with 53 and 45 publications respectively. This indicates a strong focus on detailed, real-world investigations and data collection from various SMEs to assess the effectiveness of the Balanced Scorecard (BSC). The significant number of experimental (7) and empirical research (5) studies suggests that some research efforts involved controlled experiments or data-driven insights to evaluate BSC applications. Meanwhile, less common research designs such as action research, behavioral experiments, and phenomenological studies reflect approaches to exploring BSC. The presence of diverse methodologies including mixed methods, qualitative, and quantitative approaches represents a comprehensive effort to capture different facets of BSC's impact. The small number of publications with unspecified research designs (6) points to some void in methodological clarity. Overall, the distribution highlights a strong emphasis on practical and applied research methods to understand BSC in SMEs.
The supremacy of case studies and surveys in the reviewed literature implies that practitioners and researchers alike prioritize real-world applicability and broad data collection when assessing the Balanced Scorecard's (BSC) effectiveness in SMEs. Case studies offer deep insights into individual organizations, while surveys offer a broader overview of BSC implementation across various SMEs. The relatively small number of experimental and empirical research studies shows that while some researchers attempt to control variables and derive data-driven conclusions, the field largely depends on observational methods. This reliance could suggest a potential gap in understanding causality and the direct impact of BSC on performance metrics. The different range of methodologies, including action research and phenomenological studies, highlights an acknowledgment of the BSC’s multifaceted nature and the need to investigate its implementation from various perspectives. The presence of mixed methods shows an effort to integrate qualitative and quantitative data to offer a more comprehensive view. However, the six studies with unspecified research designs implies an area for improvement in methodological rigor. The overall analysis underscores a strong engagement with practical aspects of BSC implementation, yet it also highlights a need for more experimental and thoroughly defined research approaches to better elucidate the direct effects of BSC on SME performance outcomes.
3.4. Results of Individual Studies
Table 5 summarizes the findings from several studies that explore the implementation and impact of the Balanced Scorecard (BSC) within small and medium-sized enterprises (SMEs) across different countries and industries. Each study assesses key performance dimensions, including customer perspective, internal processes, financial outcomes, and long-term organizational impacts. These studies collectively provide insights into how the Balanced Scorecard has influenced business efficiency, strategic management, and performance outcomes in SMEs. The findings highlight variations in the sample sizes, the extent of BSC adoption, and the nature of organizational improvements, particularly in relation to financial and non-financial performance indicators. The data presented offers a comprehensive look into the short- and long-term benefits observed, including improvements in strategic alignment, communication, competitive advantage, and resource management. Additionally, these studies show how the Balanced Scorecard has been integrated with other performance measurement tools, such as lean practices and management competence frameworks, to enhance overall business performance.
Figure 20 provides a breakdown of publications that focus on different perspectives of the Balanced Scorecard (BSC). The largest segment of the pie chart is 74%, which encompasses studies that address all the four perspectives of BSC: (Financial, Customer, Internal Processes, and Learning and Growth). This shows a strong emphasis on comprehensive analyses that consider all the four BSC’s dimensions (Financial, Customer, Internal Processes, and Learning and Growth). 21% of publications focus on the combination of the three metrics which are: Financial, Customer, and Internal Processes, suggesting a significant but less inclusive approach compared to the model that focuses on all the four metrics. The smallest segment, which is 5%, covers only the Financial as well as the Internal Processes perspectives, underscoring a more limited focus on specific aspects of BSC. Overall, the results show that many of research adopts a holistic view of BSC, integrating all the perspectives to provide a well-rounded analysis of performance metrics of the BSC.
The results uncover a pronounced preference for a holistic approach to the Balanced Scorecard (BSC) methodology in SMEs, with 74% of publications focusing on all four perspectives: Financial, Customer, Internal Processes, and Learning and Growth. This implies a regular trend towards adopting the BSC in its entirety, reflecting an understanding of its potential to offer a comprehensive view of organizational performance. The significant focus on all four perspectives implies that SMEs often pursue a balanced evaluation of various performance dimensions to align with strategic goals. In contrast, the 21% of studies that focus only three perspectives (excluding Learning and Growth) shows a preference for a somewhat simplified version of the BSC, possibly due to practical constraints or a focus on more immediate performance metrics. The minimal focus on just the Financial and Internal Processes perspectives (5%) underscores a niche approach that may reflect specific organizational needs or limitations in implementing a full BSC. This distribution of focus across various BSC perspectives highlights the flexibility of the methodology, but also points to potential voids in the integration of the Learning and Growth dimension. Overall, the findings propose that while the comprehensive BSC approach is widely adopted, there is room for further investigation into how the exclusion of certain perspectives might impact the effectiveness of performance management in SMEs. This analysis emphasizes the need for further research to study the implications of partial versus full implementation of the BSC in various SME contexts.
Figure 21 shows how the key performance indicators (KPIs) addressed in the publications reviewed are distributed for the systematic review on the Balanced Scorecard in SMEs. The data shows that Return on Investment or (ROI) is the most frequently discussed KPI, standing at 36.84% of the publications, underscoring its significant role in the evaluation of financial performance and effectiveness. Customer satisfaction as well as employee engagement are equally emphasized, featured in 26.32% of the publications, and this indicates their importance in understanding non-financial performance as well as organizational health. 10.53% of the publications do not specify which KPIs are measured, and this suggests some variability in reporting. This distribution highlights the focus on financial and employee-centric metrics while also pointing to a potential area that requires a more detailed reporting on KPI specifics in future research.
The distribution of key performance indicators (KPIs) emphasized in the publications reflects a nuanced understanding of the Balanced Scorecard (BSC) methodology in SMEs. The domination of Return on Investment (ROI) at 36.84% propose a robust emphasis on financial metrics, underscoring the importance placed on quantifiable financial outcomes within SMEs. This focus on ROI aligns with the requirement for SMEs to indicate clear financial performance and effectiveness, which is critical for securing investment and sustaining operations. In contrast, the same emphasis on customer satisfaction and employee engagement (26.32% each) points to a balanced approach in evaluating non-financial aspects of performance, critical for understanding broader organizational health and strategy execution. The 10.53% of publications that did not specify KPIs show a gap in standardization and reporting, which may vague a comprehensive assessment of BSC effectiveness. This variability suggests that future research should aim for more detailed and consistent KPI reporting to optimize the reliability of findings. Overall, the results propose that while SMEs are increasingly acknowledging the value of both financial and non-financial metrics, there remains a need for greater clarity and uniformity in KPI reporting to fully leverage the Balanced Scorecard methodology for strategic execution.
Figure 22 represents a wide variation in the number of participants analyzed. Most papers gathered have relatively small sample sizes, with each category (1, 2, 4, 12, 14, 27, and 35 participants) contributing 5.26% of the total publications. The small sample sizes show how much of the research on the Balanced Scorecard (BSC) in SMEs focus more on detailed, case-specific analysis rather than large-scale surveys or broad statistical studies. This may indicate the unique and context-dependent nature of BSC implementation in SMEs, where customized case studies or small-group analyses are more common for capturing specific organizational dynamics, performance impacts, and strategy execution challenges. However, the small sample sizes also suggest potential limitations in the applicability of findings, as wider trends might not be fully documented in studies with limited participant numbers.
The reliance on small sample sizes may show the complex and context-dependent nature of BSC implementation in SMEs. This approach allows for a refined understanding of how BSC frameworks are adapted and executed within varying organizational environments. However, this focus on case-specific studies could also restrict the generalizability of findings. The lack of larger-scale studies may impede the ability to identify wider trends or overarching patterns in BSC effectiveness across different SMEs. Therefore, while detailed insights are gained from individual case studies, the overall applicability of the results to a wider population of SMEs may be constrained. To optimize the strength of BSC research in SMEs, future studies could benefit from incorporating larger sample sizes or combining case studies with broader surveys to provide a more holistic view of the BSC methodology’s impact and effectiveness.
Figure 23 reflects that most studies (68.42%) focus on SMEs as their primary sample, reflecting the central theme of the review—evaluation of Balanced Scorecard (BSC) in the context of small and medium-sized enterprises (SMEs). A smaller portion of studies (5.26% each) involves subgroups within SMEs, such as business managers, employees, CEOs, and environmental managers, highlighting the BSC’s impact across various organizational roles. Additionally, some studies feature specific participants like cost accounting experts or focus on tailored sectors like a large Portuguese textile company or construction SMEs, indicating a diverse range of industries and expertise being explored. This distribution underscores the importance of understanding BSC implementation across various SME contexts, particularly in terms of managerial perspectives and sector-specific challenges. The involvement of academia and higher education institutions (HEIs) in a few studies suggests an interdisciplinary approach, blending practical business insights with academic research. Overall, the results indicate a strong emphasis on SMEs as the focus of the research, with additional consideration given to the roles and expertise of individuals involved in BSC implementation.
The concentration of studies on SMEs underscores a significant focus on how the Balanced Scorecard (BSC) is employed and adapted within this sector. This predominant focus proposes a recognition of the unique challenges encountered by SMEs in performance management and strategy execution. The limited involvement of specific roles such as business managers and environmental managers in some studies may show a narrower scope of investigation into the broader organizational impacts of BSC. However, the presence of studies targeting distinct sectors and roles shows an attempt to tackle these variations and the BSC's adaptability to different contexts. The various range of industries and expertise investigated in the reviewed studies proposes that while the BSC methodology is widely applicable, its implementation and effectiveness can differ significantly based on sector-specific and managerial factors. This variability highlights the need for more distinct analysis within future research, particularly focusing on how sectoral differences influence BSC outcomes. By integrating academic perspectives with practical applications, the studies contribute to a richer understanding of how BSC can be effectively customized to the needs of SMEs, contributing valuable insights into optimizing its strategic impact.
Figure 24 reveals a variety of methods applied to evaluate the effectiveness of the Balanced Scorecard (BSC) in SMEs. Thematic analysis is the most common, accounting for 31.58% of the techniques, highlighting its use in qualitative analysis to explore themes like strategy execution and performance alignment. The remaining techniques, each representing 5.26%, suggest a strong presence of quantitative methods such as descriptive statistics, chi-square tests, regression analysis, and statistical analysis, which reflect the efforts to measure performance using key performance indicators (KPIs) and validate models like PLS-SEM. This diversity of methods implies that studies take both qualitative and quantitative approaches to assess the Balanced Scorecard, providing a holistic view of its impact on SMEs. Thematic analysis dominance may also indicate a focus on understanding subjective factors like employee motivation and customer satisfaction.
The various use of data analytics techniques across the studies highlights the multifaceted approach researchers have taken to evaluate the Balanced Scorecard (BSC) in SMEs. The prevalence of thematic analysis (31.58%) proposes that many studies prioritize investigating qualitative dimensions such as strategy execution and performance alignment, which can contribute insights into how SMEs perceive and implement BSC. This focus might reflect an understanding that the success of BSC in SMEs is not solely reliant on numerical metrics but also on subjective factors like organizational culture and employee engagement. Conversely, the significant presence of quantitative methods, including descriptive statistics, chi-square tests, regression analysis, and PLS-SEM (5.26% each), points to a strong effort to validate the BSC’s impact through empirical measures. This contribution of qualitative and quantitative methods reflects the complexity of evaluating BSC’s effectiveness and suggests that a comprehensive evaluation involves both understanding organizational dynamics and measuring performance metrics. Such a methodological diversity proposes that while the BSC’s effectiveness in SMEs is being rigorously tested, there is also a recognition of the need to interpret results in the context of organizational and strategic nuances.
3.5. Results of Syntheses
The studies that were included in this paper are article journal, conference paper, book chapter, dissertation and thesis that are qualitative studies, quantitative studies or both methods. The participants that were involved in this review ranges from 1 SME to 2000 SMEs. From the participants (SMEs), managers, employees, customers and financial documents were used to keep track of the outcomes and long-term impacts of the BSC implemented in SMEs. These studies were conducted around the world in SMEs. The outcomes that were measured are financial and non-financial indicators (customers, business process, and learning and growth). There are 50 quantitative studies, 90 qualitative and 10 mixed-method studies. These types of study have 20000 participants in SMES that implemented balanced scorecard. 20 studies were low risk of bias, 10 were unclear risk of bias and 90 studies had high risk of lack of blinding and allocation. 10 studies had high overall risk of bias, and 50 studies had unclear incomplete outcome data. These 130 studies were pooled, as they each identified an implementation of BSC method on SMEs within the past 10 years and were not literature reviews.
Figure 25 reveals that many studies (36.84%) focus on the core elements of BSC: strategic objectives, measures, targets, and initiatives. This reflects a strong emphasis on the fundamental purpose of the BSC—aligning strategy with measurable outcomes to drive performance improvement. Other studies, comprising 15.79%, also prioritize financial performance and innovation outcomes, highlighting the BSC's role in fostering innovation and financial growth, key concerns for SMEs aiming to stay competitive. Some studies (5.26% each) examine more comprehensive frameworks, integrating financial, customer, internal processes, and learning and growth perspectives, which align with the traditional four BSC perspectives. Additionally, metrics like market share, product management time, and profit comparison point to sector-specific performance indicators, suggesting that some studies customize the BSC framework to reflect the unique needs of specific industries. The inclusion of cultural change, educational empowerment, and knowledge sharing in a few studies indicates that the BSC is also used to track non-financial outcomes like organizational culture and knowledge transfer. This broad mix of financial and non-financial metrics underscores the versatility of the BSC in addressing both tangible and intangible aspects of SME performance, with a clear emphasis on strategic alignment
The data that is presented in Figure 25 shows a diverse application of BSC metrics across different studies, highlighting the adaptability of the framework in addressing various dimensions of SME performance. The dominant focus on core BSC elements depicts a strong preference for using BSC to directly align strategic goals with measurable outcomes, which is important for improving performance in SMEs. The significant attention to financial performance and innovation underscores the role of BSC in driving competitive advantage through both financial growth and fostering innovative practices. The examination of comprehensive frameworks integrating all the four traditional BSC perspectives (5.26% each) indicates a balanced approach to performance measurement, this ensures that all critical areas of business performance are addressed. The inclusion of sector-specific metrics and non-financial outcomes reflects an evolving understanding of the application of BSC beyond traditional measures, showing its flexibility in adjusting and adapting to the unique needs of various industries. These findings suggest that while the core focus remains on strategic alignment and measurable outcomes, there is a growing recognition of the significance of incorporating both financial and non-financial indicators to provide a more holistic view of SME performance. Future research could further explore how these various applications of BSC metrics impact the overall effectiveness and provide insights into optimizing the framework for different business contexts.
Figure 26 illustrates that employee satisfaction and customer satisfaction are the most regularly reported results, including 26.32% of the publications. This highlights a clear focus on how the Balanced Scorecard (BSC) positively influences employee well-being and customer relations in SMEs, which are crucial for sustaining long-term business success. Other results, such as employee motivation, training participation, customer loyalty, and innovation, are also analyzed but to a lesser extent, each having 5.26% of the publications. These results reflect how BSC can enhance employee engagement, alignment with organizational goals, and service quality. Some studies also emphasize improvements in communication, decision-making, and strategic management, showing that the BSC assists SMEs not only to align their staff but also improve operational processes and management strategies. Interestingly, 10.53% of studies did not specify the results, hinting a void in clear documentation of how BSC impacts organizational dynamics. Overall, the results imply that while SMEs benefit from a variety of organizational improvements through BSC, the strongest focus stays on the satisfaction of employees and customers as key drivers of success.
The data in Figure 26 reflects that the Balanced Scorecard is predominantly associated with improving employee and customer satisfaction. This indicates a clear recognition of the effectiveness of BSC in fostering crucial elements for SME success, such as customer relations and employee well-being. The secondary focus on metrics such as employee motivation, training participation, as well as customer loyalty suggests that while these aspects are considered, they are not too central to the impact of BSC in current literature. The fact that some studies report enhancements in communication, decision making, and strategic management underscores a broader role of BSC in refining internal processes and management strategies. However, the unspecified results point to a lack of detailed documentation and possibly a lack of standardized metrics in evaluating the effectiveness of BSC, which could mean potential gaps in the research or imply variations in how outcomes are measured and reported. Overall, these findings suggest that while the BSC framework is treasured for its impact on employee and customer satisfaction, there is a need for a more comprehensive and consistent reporting on its broader organizational impacts as well as effectiveness across different.
Figure 27 shows that nearly half (49.63%) of the studies employ a quantitative approach, indicating a strong focus on measurable, data-driven performance metrics and outcomes in Balanced Scorecard (BSC) research related to SMEs. Qualitative studies make up 26.67%, highlighting the importance of contextual, in-depth exploration of how BSC is implemented and its impact on strategy execution, employee motivation, and organizational culture in SMEs. Mixed-methods studies represent 23.70%, reflecting a balanced integration of both qualitative and quantitative insights, suggesting that researchers recognize the need to assess both the measurable outcomes, sand the underlying processes or experiences associated with BSC implementation in SMEs. Overall, this distribution suggests a healthy blend of methodologies, with a slight emphasis on quantitative studies, possibly because of the tangible nature of performance metrics tied to BSC frameworks.
The distribution of study types shown in Figure 27 gives valuable insights into the methodological trends in BSC research within SMEs. The dominance of quantitative studies highlights a significant interest in analyzing objective, measurable aspects of BSC, like performance metrics and outcomes. This focus on quantitative data aligns with the emphasis of BSC on tracking and enhancing measurable performance indicators. The substantial proportion of qualitative studies underscores an equally important emphasis on understanding the contextual as well as experiential dimensions of the implementation of BSC, including its effects on employee motivation and organizational culture. The presence of mixed-methods studies means that there is a growing recognition of the value in combining quantitative rigor with qualitative depth to capture a more comprehensive view of the impact of BSC. This methodological diversity reveals a nuanced approach to evaluating BSC, indicating that researchers are also interested in the processes and perceptions that contribute to the effectiveness of the framework. The overall methodological blend indicates a robust research landscape that treasures both empirical measurement as well as contextual understanding, providing a well-rounded perspective on the effectiveness of BSC in SMEs.
Figure 28 papers shows a strong emphasis on business sustainability and competitive advantage, with the latter being mentioned in 38.52% of the publications. This shows that a huge portion of the studies underscore how the Balanced Scorecard (BSC) contributes to long-term strategic benefits for SMEs, such as maintaining a competitive edge and ensuring sustainability. While other impacts such as business growth, improved performance monitoring, and risk management are not frequently mentioned, they still show important areas where BSC is seen to influence long-term outcomes. The broad range of impacts covered, including market consolidation, economic development, and enhanced decision-making, highlights the diverse ways in which BSC is observed to affect SME performance. The percentage of not specified contributes (5.19%) suggests that some studies did not clearly detail the long-term outcomes of BSC implementation. Overall, the results point to a prevailing view that BSC is integral to achieving sustainable competitive advantage and enhancing long-term business performance in SMEs.
The data show a distinct trend towards the Balanced Scorecard's role in enhancing competitive advantage and sustainability, implying that SMEs perceive BSC as an important tool for achieving long-term strategic goals. The high percentage of studies highlighting competitive advantage shows that SMEs mainly value BSC for its ability to assist them outperform competitors over time. Despite the diverse impacts reported, such as improved decision-making and market consolidation, the relatively lower emphasis on business growth and risk management may reflect a research bias towards more clear and immediate benefits. 5.19% of studies with unspecified long-term impacts further proposes a need for more holistic reporting in future research. By integrating these findings, while BSC offers varied benefits, its strategic importance in sustaining a competitive edge and driving sustainability is consistently recognized across studies. This comprehensive understanding underscores the Balanced Scorecard's value not just as a performance measurement tool, but as a strategic framework crucial for long-term success in SMEs
Figure 29 shows key trends in how SMEs measure the impact of the Balanced Scorecard (BSC). The most studied metrics are financial performance and exploitative innovation, accounting for 21.05% of the publications. This proposes that SMEs prioritize evaluating the BSC's role in driving revenue growth and innovation aimed at improving current products or services. Metrics such as customer satisfaction, revenue growth, and export increase (5.26%) and environmental impact reduction combined with cost efficiency (5.26%) are less explored, showing a narrower focus on sustainability and cost-related outcomes.
Notably, 10.53% of studies did not specify performance metrics, which may underscore a void in the literature where the BSC's impact is discussed more generally without detailed metric analysis. These results reflect a significant emphasis on financial outcomes, with less focus on non-financial metrics like environmental sustainability or customer-focused performance. To assess the risk of bias due to missing results or reporting biases in this systematic review on The Balanced Scorecard Methodology: Performance Metrics and Strategy Execution in SMEs, multiple strategies were used. A comprehensive search across databases (Scopus, Web of Science, and Google Scholar), was implemented to minimize publication bias, ensuring that a wide range of studies, both published and unpublished, were collected. Grey literature, conference proceedings, and dissertations were included, to avoid selective reporting biases. Additionally, where research protocols were available, they were compared with the results sections of the included studies to detect any selective outcome reporting. Although the review is primarily qualitative, these strategies ensure that the findings are based on a complete and balanced synthesis of available evidence, reducing the risk of missing data due to reporting biases.
The results highlight a prominent emphasis on financial metrics and exploitative innovation in SMEs' application of the Balanced Scorecard (BSC), proposing that these enterprises predominantly view BSC through the lens of revenue growth and incremental improvements to existing products. This trend shows that while SMEs notice the BSC’s potential to motivate financial performance, there is a relative neglect of other vital dimensions such as customer satisfaction and environmental impact. The lower frequency of studies addressing these non-financial metrics, such as environmental impact reduction and cost efficiency, underscores a potential gap in how SMEs evaluate their strategic performance and sustainability efforts. The 10.53% of studies that overlook specific performance metrics further imply a need for more rigorous reporting standards in the literature. These gaps may point to a broader issue where the comprehensive benefits of the BSC are not fully investigated or captured. Consequently, while SMEs leverage BSC to optimize financial outcomes, a more holistic adoption that includes non-financial metrics could provide a more balanced view of performance and strategic alignment. This analysis presents that to fully realize the BSC's potential, future research should focus on integrating diverse performance metrics and addressing the identified gaps to promote a more complete understanding of its impact on SMEs.
3.6. Reporting Biases
In this systematic review, a thorough evaluation of potential reporting biases as well as missing results that could impact the validity and reliability of our findings was undertaken. The approach used to assess the risk of bias, the used tools, as well as the results of our sensitivity analyses is outlined in this section.
3.6.1. Assessment of Risk Bias
To ensure that the findings are robust, the risk of bias was assessed due to missing results for each synthesis evaluated. This involved examining whether certain studies were missing and how this might have an impact on the conclusions of this document. The Figure 30 shows the process followed for the assessment of risk bias.
3.6.2. Tools Utilized
The risk of bias assessment tool was employed to identify potential reporting biases. This tool assisted in the evaluation of data completeness and the probability that missing results could affect the review outcomes of this document. Figure 31 shows the tools questions. Figure 32 represents detailed responses to the tool’s questions, as well as the evidence that supports the judgements made, and Table 6 shows the some of the collected studies.
3.6.3. Sensitivity Analysis
Sensitivity analyses were performed to assess the impact of potential biases on the findings, and it was performed by excluding studies with high risk of bias. The aim of this analysis is to determine whether the primary results stayed consistent when the potentially biased studies were removed. Sensitivity analyses provide significant insights into the robustness of the findings, although they are limited by the quantity and quality of the available data. The process followed for sensitivity analysis is shown in Figure 33.
3.7. Certainty of Evidence
The effectiveness of the Balanced Scorecard (BSC) methodology in Small and Medium-sized Enterprises is evaluated by this systematic review, which focuses on performance metrics as well as strategy execution. The review synthesizes evidence from 20 studies to examine or assess how the Balanced Scorecard impacts performance management, customer satisfaction, employee motivation, as well as the overall business performance in SMEs.
3.7.1. The Summary of Evidence
The evaluation of key outcomes in this systematic review shows a range of certainty levels regarding the effectiveness of the Balanced Scorecard (BSC) in improving various performance aspects within SMEs. For performance management, the evidence suggests a moderate level of certainty, with positive outcomes reported in most studies. However, variations exist in how well BSC metrics align with the specific challenges faced by SMEs. When it comes to strategy execution, there is also moderate certainty about the impact of BSC, as it has been shown to enhance strategy alignment and execution, although inconsistencies arise due to different implementation approaches across the studies. In terms of employee motivation, the evidence indicates a low to moderate certainty level, with some studies noting improvements in motivation following BSC implementation, but small sample sizes and a limited number of studies weaken the overall findings. Regarding customer satisfaction, a moderate level of certainty is noted, with evidence suggesting positive effects, though the impact varies based on the specific context and customization of BSC within different SMEs. Lastly, the evidence concerning overall business performance also reflects moderate certainty, as most studies report improvements, albeit limited by factors such as the heterogeneity of SMEs and the diverse quality of included studies. The factors influencing these certainty ratings include risk of bias, where some studies exhibit potential reporting and selection biases that affect the reliability of the evidence. There is also a lack of precision due to small sample sizes and diverse methodologies, leading to variations in reported outcomes. Additionally, inconsistencies in results across studies are noted, influenced by differing implementation strategies and contexts.
4. Practical Recommendations
4.1. Key Findings and Strategic Implications for Business Leaders
This subsection presents the critical findings from the systematic review and explores their strategic implications for business leaders across various industries. The Balanced Scorecard (BSC) has demonstrated significant potential to enhance performance management and strategic execution within Small and Medium-sized Enterprises (SMEs). Key findings indicate that while the BSC can improve financial and non-financial metrics, its implementation must be tailored to address specific industry challenges and strategic drivers. The table below provides a detailed overview of the strategic implications of BSC adoption, highlighting industry-specific opportunities, challenges, and expected outcomes, along with the relevance of each finding to the systematic review as shown in Table 8.
The summary of Table 8 indicates that SMEs across industries can leverage the BSC to align strategic objectives with measurable outcomes, enhancing operational efficiency, customer satisfaction, sustainability, and risk management. For example, 43.70% of reviewed literature emphasizes the BSC framework's adaptability, underscoring its role in aligning diverse organizational goals. Additionally, 38.52% of studies highlight the long-term impact of BSC on business sustainability and competitive advantage, especially in sectors like financial services, where compliance and risk management are critical. Furthermore, thematic analysis techniques applied in 31.58% of the studies reveal the BSC's contribution to fostering innovation and integrating learning metrics, especially in technology-driven fields.
4.2. Decision-Making Framework for Implementation
This section outlines a structured decision-making framework for implementing Enterprise Social Platforms (ESPs) across different industries, building on the key findings from the systematic review. Implementing ESPs using a step-by-step approach enables organizations to address their unique strategic drivers while mitigating risks. The framework presented in Table 9 proposes a five-step process to guide business leaders through the phases of needs analysis, platform selection, pilot testing, full integration, and optimization. For each industry, the framework emphasizes specific focus areas, strategic drivers, and expected outcomes to ensure successful implementation of ESPs that align with the Balanced Scorecard's (BSC) performance metrics.
The summary of Table 9 reveals that while the decision-making framework follows a consistent five-step approach across industries, the focus and key features vary depending on sector-specific requirements. For example, in the financial services industry, Step 1: Needs Analysis would prioritize compliance and risk management as critical factors, while in the technology sector, it might emphasize innovation and customer-centricity. Additionally, the framework's adaptability is highlighted by its ties to the proposed study, with steps reflecting the need for customization based on insights from 31.58% of studies that employ thematic analysis, showing a demand for contextualization in performance measurement frameworks. By systematically implementing ESPs, organizations can enhance collaboration, streamline operations, and foster strategic alignment in line with BSC principles.
The framework's structure across industries provides a strategic pathway for implementing ESPs, enabling business leaders to make informed decisions that align with organizational goals and address sector-specific challenges. Through this approach, the proposed decision-making framework supports enhanced strategic alignment, operational efficiency, and sustainable growth across diverse industry contexts.
4.3. Proposed Best Practices for Successful Implementation
This section provides a set of best practices designed to support the successful implementation of the Balanced Scorecard (BSC) framework across five industries. The practices, detailed in Table 10, aim to address the unique operational challenges faced by Small and Medium-sized Enterprises (SMEs) within each sector, aligning them with strategic drivers that promote sustainable growth and performance improvement. The best practices are broken down into three components, catering to different SME types and operational challenges within each industry.
Table 10 draws from findings throughout the review, such as 74% of studies emphasizing a holistic BSC approach across multiple dimensions. It underscores the importance of integrating financial, customer, internal processes, and learning and growth perspectives in different contexts. These practices provide guidance for tailoring the BSC to the unique needs of SMEs, thereby facilitating better strategy execution and operational efficiency.
4.4. Metrics and KPIs for Measuring Performance
This section outlines the key metrics and Key Performance Indicators (KPIs) that are crucial for assessing performance in various industries using the Balanced Scorecard (BSC) framework. The proposed metrics in Table 11 aim to cover different dimensions such as financial, customer, internal processes, and learning and growth perspectives, which are significant for driving strategic outcomes and optimizing performance in SMEs. Each metric is linked to the strategic drivers that influence industry-specific goals, expected outcomes, and findings from the systematic review.
Table 11 outlines a set of industry-specific metrics and KPIs, highlighting their measurement focus and expected outcomes. As shown, metrics like ROI, time to market, and patient wait times are given the highest priority due to their direct impact on financial performance, operational efficiency, and customer satisfaction. These metrics are closely tied to findings from the systematic review, which emphasized the importance of balancing financial and non-financial indicators for a holistic assessment of SME performance.
4.5. Real Case Studies from Various Industries
Balanced Scorecard implementations have shown varied results across industries, ranging from improved strategic alignment to challenges in integrating the framework into existing management systems. Each case provides insights into how businesses have customized the BSC to fit their unique contexts, making it a useful tool for performance measurement and strategic management in SMEs. The examples in this table offer practical evidence that supports the findings of the systematic review, demonstrating the role of BSC in enhancing financial and non-financial performance, as well as its challenges and strategic drivers.
The case studies illustrate how BSC can be successfully tailored across different industries to drive strategic objectives. For instance, Volkswagen’s focus on aligning operations with strategic goals led to more efficient processes, while Verizon saw an improvement in customer service quality. These examples align with the systematic review's findings on BSC's flexibility and adaptability, reinforcing the framework's relevance in both traditional and service industries. Each case study underlines the importance of strategic alignment, customized implementation, and continuous monitoring for achieving sustainable performance outcomes.
4.5 Proposed Roadmap for SMEs Businesses and Policy Recommendations
This section outlines a comprehensive roadmap for implementing Balanced Scorecard (BSC) strategies within various industries to optimize performance in SMEs. The proposed roadmap incorporates industry-specific policy frameworks, estimated timelines, and the identification of champions who will lead these initiatives across different operational areas. The framework is aligned with strategic drivers to ensure significant impacts on SME performance. Table 17 provides a detailed summary of the roadmap, including strategic links, expected outcomes, and relevance to the proposed systematic review.
The proposed roadmap aims to provide industry-specific strategies for implementing BSC frameworks within SMEs, ensuring alignment with relevant policy frameworks and strategic goals. For example, the automotive industry would focus on digital transformation aligned with Industry 4.0 standards to boost automation, while healthcare aims to integrate patient management with national health policies. The expected outcomes, such as productivity gains and better resource allocation, are strategically tied to improving industry-specific KPIs discussed in the systematic review.

Table 13.
Proposed Roadmap for SMEs Businesses and Policy Recommendations Linked to Policy Frameworks.
Table 13.
Proposed Roadmap for SMEs Businesses and Policy Recommendations Linked to Policy Frameworks.
| Industry | Roadmap Focus | Policy Framework | Strategic Link | Strategic Drivers | Expected Outcome | Ties to Proposed Study | Timeline | Duration | Champion |
|---|---|---|---|---|---|---|---|---|---|
| Automotive | Implement digital transformation initiatives | Industry 4.0 Roadmap | Enhances automation and operational efficiency | Technological advancement, quality improvement | Increased productivity, reduced downtime | Linked to improving manufacturing KPIs in SMEs | Start in Q1 2025 | 18 months | Chief Technology Officer (CTO) |
| Healthcare | Integrate BSC with patient management systems | National Health Policy | Improves patient outcomes through systematic monitoring | Patient safety, healthcare quality | Enhanced patient care, better resource allocation | Relevant to improving healthcare service delivery KPIs | Start in Q2 2025 | 12 months | Chief Medical Officer (CMO) |
| Retail | Align supply chain management with sustainability goals | Sustainable Development Goals (SDG 12) | Encourages sustainable consumption and production | Environmental compliance, supply chain resilience | Reduced environmental footprint, increased customer satisfaction | Ties with optimizing supply chain management and customer satisfaction | Start in Q3 2025 | 24 months | Supply Chain Manager |
| Telecommunications | Enhance network infrastructure through BSC frameworks | National ICT Policy | Boosts connectivity and customer service | Innovation, service quality | Improved network reliability, increased market share | Supports tracking performance improvements in telecom services | Start in Q1 2026 | 15 months | Chief Operating Officer (COO) |
| Manufacturing | Adopt lean practices for quality improvement | Lean Manufacturing Policy | Aligns production processes with quality standards | Operational efficiency, cost reduction | Reduced production waste, enhanced product quality | Pertains to integrating lean principles within BSC for manufacturing | Start in Q4 2025 | 20 months | Production Manager |
5. Discussion
This section discusses how the research questions of the systematic review were addressed through the analysis of the findings, utilizing percentages to illustrate key trends and supporting the practical recommendations proposed earlier. The discussion also emphasizes the alignment of the results with the industry-specific practical recommendations outlined in the roadmap, decision-making framework:
How is customer satisfaction measured and monitored in SMEs using the BSC framework?
The review shows that 26.32% of the publications focused on customer satisfaction as a key performance indicator (KPI) within the Balanced Scorecard (BSC) framework for SMEs. The common measures include customer feedback surveys, net promoter scores (NPS), and customer retention rates, which are used to track satisfaction levels and customer loyalty. These metrics help in identifying areas for improvement in products and services, thereby enhancing customer experience. Proposed practical recommendations suggest that SMEs should regularly gather customer feedback through automated survey tools and integrate this data into their BSC framework for continuous monitoring. Additionally, customer satisfaction metrics should be aligned with strategic objectives to ensure they contribute to overall business goals (see Table 16).
Which role does technology play in implementing an effective BSC in SMEs?
The role of technology emerged as a critical factor, with 31.58% of studies using data analytics, cloud-based platforms, or performance management software to track BSC metrics. Technology facilitates real-time data collection and analysis, enabling SMEs to adapt their strategies based on dynamic market conditions. The practical recommendation for SMEs is to invest in technology platforms that support BSC implementation, such as performance management software that integrates financial and non-financial metrics. Training employees on these technologies can also optimize their effectiveness in monitoring BSC metrics.
What is the impact of the BSC on the performance and motivation of employees in SMEs?
The review identified that 26.32% of the studies highlighted improvements in employee motivation due to clear communication of strategic goals and involvement in setting KPIs. The Learning and Growth perspective in the BSC aligns employee performance with organizational goals, increasing job satisfaction and motivation. Recommendations suggest that SMEs should involve employees in the development of BSC metrics, particularly those related to career development and skill enhancement, to foster a sense of ownership and commitment.
What challenges do SMEs face when integrating the BSC methodology into their existing management practices?
The findings indicate that 21% of publications identified challenges such as limited resources, lack of management capacity, and difficulties in aligning BSC metrics with strategic objectives. These challenges hinder the successful integration of BSC in SMEs. To address these challenges, the proposed roadmap suggests phased implementation of BSC, starting with simpler metrics and gradually incorporating more complex indicators. Training programs for managers on strategic management and performance measurement can also help mitigate these challenges.
How do SMEs customize the BSC framework to align with their specific strategic goals and operational contexts?
Customization was a recurring theme, with 74% of studies focusing on adapting the BSC to the specific needs of the SMEs. This often involved modifying KPIs to better reflect the unique aspects of their industry or operational environment. Proposed recommendations include tailoring BSC metrics to reflect the strategic priorities of the business, whether it be market expansion, product development, or operational efficiency. This customization ensures that the BSC remains relevant and aligned with the company's growth trajectory.
6. Conclusions
The systematic review concludes that the Balanced Scorecard (BSC) provides significant benefits for SMEs by enhancing performance management and strategic alignment when adapted to the specific operational context of these businesses. Findings reveal that about 74% of the studies reviewed demonstrated improvements in both financial and non-financial metrics, such as customer satisfaction and employee motivation, through customized BSC frameworks. The integration of technology emerged as a vital factor, enabling real-time monitoring of KPIs and facilitating dynamic strategy adjustments in 31.58% of the cases. Despite these advantages, challenges such as limited resources and alignment issues were identified in 21% of the studies, indicating a need for phased implementation approaches. Moreover, engaging employees in the development and application of BSC metrics was found to significantly boost motivation and strategic alignment, as shown in 26.32% of the studies. The proposed roadmap and policy recommendations aim to guide SMEs in overcoming common challenges by offering practical steps for BSC adoption, technology integration, and employee involvement. This review underscores the necessity for further industry-specific research to explore long-term impacts and sustainable growth strategies using the BSC.
References
- R. Malagueño, E. Lopez-Valeiras, and J. Gomez-Conde, Balanced scorecard in SMEs: effects on innovation and financial performance. Small Bus. Econ. 2018, 51, 221–244. [Google Scholar] [CrossRef]
- SSRN. (n.d.). Balanced Scorecard in SMEs. Available at: https://papers.ssrn.com/sol3/papers.cfm?abstract_id=3154266. (accessed on 12 September 2024).
- H. Afonso and M. do R. Cabrita, Developing a lean supply chain performance framework in a SME: A perspective based on the balanced scorecard. Procedia Eng. 2015, 131, 270–279. [Google Scholar] [CrossRef]
- UCDC. (n.d.). Knowledge Horizons - Economics. Available at: http://www.orizonturi.ucdc.ro/arhiva/KHE%20nr.%204%20-%202018/10.%20CASE%20STUDY%20-%20KPIS.pdf. (accessed on 12 September 2024).
- H. Zaheer, A. Ramzan, K. Mahmood, and M. N. Nagra, Implementation of balanced scorecard and financial performance of SMEs. JAMEB 2023, 8, 50–61. [Google Scholar]
- ResearchGate. (n.d.). Balanced Scorecard Usage for Hotel and Tourism Small and Medium Enterprises Growth in Eswatini: A Proposed Conceptual Framework. Available at: https://www.researchgate.net/publication/341131461_Balanced_scorecard_usage_for_hotel_and_tourism_small_and_medium_enterprises_growth_in_ESwatini_Former_Swaziland_A_Proposed_conceptual_framework. (accessed on 12 September 2024).
- IPB. (n.d.). Biblioteca Digital. Available at: https://bibliotecadigital.ipb.pt/handle/10198/21522. (accessed on 12 September 2024).
- Reynolds, H. Fourie, and L. Erasmus, A generic balanced scorecard for small and medium manufacturing enterprises in South Africa, South. Afr. J. Entrep. Small Bus. Manag. 2019, 11. [Google Scholar]
- S. Falle, R. Rauter, S. Engert, and R. Baumgartner, Sustainability management with the Sustainability Balanced Scorecard in SMEs: Findings from an Austrian case study. Sustainability 2016, 8, 545. [Google Scholar] [CrossRef]
- C. Oliveira, C. Leal, and A. Pinho, Existing differences between SMEs that apply BSC and those that do not. J. Inf. Organ. Sci. 2021, 45, 375–397. [Google Scholar]
- Social Space Journal. (n.d.). The Impacts of Management Competence on Small and Medium-Sized Enterprises Performance: From the Balanced Scorecard Perspective. Available at: https://socialspacejournal.eu/menu-script/index.php/ssj/article/view/166/73. (accessed on 12 September 2024).
- Dergipark. (n.d.). Tekderg. Available at: https://dergipark.org.tr/en/pub/tekderg/issue/60700/977849. (accessed on 12 September 2024).
- Cloudfront. (n.d.). Non-Financial Indicators and Their Importance. Available at: https://d1wqtxts1xzle7.cloudfront.net/78270105/284-libre.pdf?1641534648=&response-content-disposition=inline%3B+filename%3DNon_Financial_Indicators_and_Their_Impor.pdf&Expires=1724019074&Signature=SjnPpWgOVf4vWTGzTvw5YA0LZuMvl-3xMFJSeaCzzkp9rmoZQDyE~vTtCOvZgViA2m5RRx7QopJFjRb6IhL9pPXN3E5cR5G4Ex2ZVRGWiD6bxR4rmjunTYn7uHPjbpvj~iEwJ6DqtVcisxEmRkICw76udGVKlmP1RcbYNNYgYnem4ntyWT4zgsUmZpaQdXNItjW1Ya~gUiRkgicsDEEbHlUnCrlslMz5jBwyRdX8TIKIPaeSHFRIOdZgG3dy-BVR9Bzu0WcTrVxdG5gKeDyixn98~YhmswLpMI~DsO1SL988pwlvxqDTlN1mnYjNP1PuujO8l4yLXoNfH~M-d8~-EA__&Key-Pair-Id=APKAJLOHF5GGSLRBV4ZA. (accessed on 12 September 2024).
- E. Benková, P. Gallo, B. Balogová, and J. Nemec, Factors affecting the use of Balanced Scorecard in measuring company performance. Sustainability 2020, 12, 1178. [Google Scholar] [CrossRef]
- ResearchGate. (n.d.). Supporting Open Innovation with the Use of a Balanced Scorecard Approach: A Study on Deep Smarts and Effective Knowledge Transfer to SMEs. Available at: https://www.researchgate.net/publication/323150172_Supporting_Open_Innovation_with_the_use_of_a_Balanced_Scorecard_Approach_A_Study_on_Deep_Smarts_and_Effective_Knowledge_Transfer_to_SMEs_Supporting_Open_Innovation_with_the_use_of_a_Balanced_Scorecard. (accessed on 12 September 2024).
- B. W. Permadi, A. Y. Ridwan, and W. Juliani, SCOR-BSC integrated model for a small-medium enterprise clothing industry using MTS-based production strategy in Indonesia, IOP Conf. Ser. Mater. Sci. Eng. 2019, 598, 012079. [Google Scholar]
- P. Quesado, S. Marques, R. Silva, and A. Ribeiro, The Balanced Scorecard as a strategic management tool in the textile sector. Adm. Sci. 2022, 12, 38. [Google Scholar] [CrossRef]
- PublishPK. (n.d.). Article. Available at: https://www.publishpk.net/art/2015%202.pdf. (accessed on 12 September 2024).
- S. Singh, E. U. Olugu, S. N. Musa, and A. B. Mahat, Fuzzy-based sustainability evaluation method for manufacturing SMEs using balanced scorecard framework. J. Intell. Manuf. 2018, 29, 1–18. [Google Scholar] [CrossRef]
- ResearchGate. (n.d.). SMEs' Perspective on Venture Capital Investment Criteria: A Study of Croatian SMEs. Available at: https://www.researchgate.net/publication/324902645_SMEs_perspective_on_venture_capital_investment_criteria_-_A_study_of_Croatian_SMEs. (accessed on 12 September 2024).
- Dergipark. (n.d.). IRM. Available at: https://dergipark.org.tr/en/pub/irmm/issue/32094/355444. (accessed on 12 September 2024).
- P. Achenbach, Sustainability Balanced Scorecard as a cost accounting instrument for small and medium sized companies. SHS Web Conf. 2021, 115, 03002. [Google Scholar] [CrossRef]
- . ResearchGate. (n.d.). Assessing the Impact of Electronic Supply Chain Management on the Performance of Small and Medium Sized Enterprises using the Sustainable Balanced Scorecard Approach: Case Study of Online Stores and In. Available at: https://www.researchgate.net/profile/Arshia-Taimouri/publication/333419475_Assessing_the_Impact_of_Electronic_Supply_Chain_Management_on_the_Performance_of_Small_and_Medium_sized_Enterprises_using_the_Sustainable_Balanced_Scorecard_Approach_Case_Study_of_Online_Stores_and_In/links/5ceccc96458515026a613c18/Assessing-the-Impact-of-Electronic-Supply-Chain-Management-on-the-Performance-of-Small-and-Medium-sized-Enterprises-using-the-Sustainable-Balanced-Scorecard-Approach-Case-Study-of-Online-Stores-and-In.pdf. (accessed on 12 September 2024).
- ResearchGate. (n.d.). The Influence of Enterprise Risk Management on Firm Performance Measured by the Balanced Scorecard: Evidence from SMEs in Southern Thailand. Available at: https://www.researchgate.net/profile/Muttanachai-Suttipun/publication/335899816_The_Influence_of_Enterprise_Risk_Management_on_Firm_Performance_Measured_by_the_Balanced_Scorecard_Evidence_from_SMEs_in_Southern_Thailand/links/62e0f78f7782323cf17ec8c6/The-Influence-of-Enterprise-Risk-Management-on-Firm-Performance-Measured-by-the-Balanced-Scorecard-Evidence-from-SMEs-in-Southern-Thailand.pdf. (accessed on 12 September 2024).
- ResearchGate. (n.d.). The Influence of Sufficiency Economy Philosophy Practice on SMEs' Performance in Thailand. Available at: https://www.researchgate.net/publication/343284749_The_Influence_of_Sufficiency_Economy_Philosophy_Practice_on_SMEs%27_Performance_in_Thailand. (accessed on 12 September 2024).
- IEMSJL. (n.d.). Article. Available at: http://www.iemsjl.org/j. (accessed on 12 September 2024).
- ResearchGate. (n.d.). The Application of a Balanced Scorecard in SME: A Case Study of Milanzo Kids. Available at: https://www.researchgate.net/publication/358593020_THE_APPLICATION_OF_A_BALANCED_SCORECARD_IN_SME_A_CASE_STUDY_OF_MILANZO_KIDS. (accessed on 12 September 2024).
- Cruscottodicontrollo.it. (n.d.). The Balanced Scorecard in Large Firms. Available at: https://www.cruscottodicontrollo.it/wp-content/uploads/2020/04/The_Balanced_Scorecard_in_Large_Firms_an.pdf. (accessed on 12 September 2024).
- F. Owolabi, Balanced score card and performance evaluation in Small and Medium Enterprises (SMEs) in Nigeria, Core.ac.uk. Available at: https://core.ac.uk/download/pdf/95550704.pdf. (accessed on 12 September 2024).
- G. K. Muli, Extent of Balanced Scorecard Implementation and its Effect on the Financial Performance of Small and Medium Enterprises in Nairobi County, 2016.
- ResearchGate. (n.d.). Leveraging the Balanced Scorecard - A Tool for SME Advancement. Available at: https://www.researchgate.net/publication/351639712_Leveraging_the_balanced_scorecard_-_a_tool_for_SME_advancement. (accessed on 12 September 2024).
- ResearchGate. (n.d.). Internationalization and Innovation on Balanced Scorecard (BSC) Among Malaysian Small and Medium Enterprises (SMEs). Available at: https://www.researchgate.net/publication/333509677_Internationalisation_and_innovation_on_balanced_scorecard_BSC_among_Malaysian_small_and_medium_enterprises_SMEs. (accessed on 12 September 2024).
- Z. Dudic, B. Dudic, M. Gregus, D. Novackova, and I. Djakovic, The Innovativeness and Usage of the Balanced Scorecard Model in SMEs. Sustainability 2020, 12, 3221. [Google Scholar] [CrossRef]
- Mohammed, S. Sulaiman, N. Md Zin, and N. Abdul Rahman, Exploring the Agile-Adaptive Balanced Scorecard Benefits Towards Improving the Management Accounting System: A Case Study of Iraqi SMEs. Social & Management Research Journal 2022, 19, 139–168. [Google Scholar]
- ResearchGate. (n.d.). Effect of Innovation, Knowledge Sharing, and Trust Culture on Hotels' SMEs Growth in Eswatini. Available at: https://www.researchgate.net/publication/354186670_Effect_of_Innovation_Knowledge_Sharing_and_Trust_Culture_on_Hotels%27_SMEs_Growth_in_Eswatini. (accessed on 12 September 2024).
- Assumptionjournal.au.edu. (n.d.). The Balanced Scorecard as a Performance Management Tool for Small and Medium Scale Enterprises in Nigeria. Available at: http://www.assumptionjournal.au.edu/index.php/eJIR/article/view/4074/2400. (accessed on 12 September 2024).
- C. Suárez-Gargallo and P. Zaragoza-Sáez, How the Balanced Scorecard is Implemented in the Spanish Footwear Industry. Sustainability 2021, 13, 5641. [Google Scholar] [CrossRef]
- Psarras, T. Anagnostopoulos, N. Tsotsolas, I. Salmon, and L. Vryzidis, Applying the Balanced Scorecard and Predictive Analytics in the Administration of a European Funding Program. Adm. Sci. 2020, 10, 102. [Google Scholar] [CrossRef]
- F. Ahmad, N. Abdul Hamid, A. Nur Aizat Ahmad, M. N. Mohd Nawi, N. A. Abdul Rahman, and N. A. Abdul Hamid, The Impact of TQM on Business Performances Based on Balanced Scorecard Approach in Malaysia SMEs. Int. J. Qual. Res. 2022, 16, 231–242. [Google Scholar] [CrossRef]
- C. Malesios, P. K. Dey, and F. B. Abdelaziz, Supply Chain Sustainability Performance Measurement of Small and Medium Sized Enterprises Using Structural Equation Modeling. Ann. Oper. Res. 2020, 294, 623–653. [Google Scholar] [CrossRef]
- ResearchGate. (n.d.). Balanced Scorecard Practices of Medium and Large Enterprises in the Province of Pampanga. Available at: https://www.researchgate.net/profile/Ma-Cristina-Naguit/publication/321081765_Balanced_Scorecard_practices_of_medium_and_large_enterprises_in_the_Province_of_Pampanga/links/5a0c58be4585153829b1441b/Balanced-Scorecard-practices-of-medium-and-large-enterprises-in-the-Province-of-Pampanga.pdf. (accessed on 12 September 2024).
- ResearchGate. (n.d.). Explaining the Impact of a Customer-Oriented Strategy on SMEs' Global Performance: Lessons from the Balanced Scorecard and the CUSTOR Scale Model. Available at: https://www.researchgate.net/publication/322466991_Explaining_the_impact_of_a_customer-oriented_strategy_on_the_small_and_medium-sized_enterprises%27_SMEs_global_performance_Lessons_from_the_Balanced_Scorecard_and_the_CUSTOR_scale_model. (accessed on 12 September 2024).
- ResearchGate. (n.d.). Advantages and Contributions in the Balanced Scorecard Implementation. Available at: https://www.researchgate.net/publication/323323907_Advantages_and_contributions_in_the_balanced_scorecard_implementation. (accessed on 12 September 2024).
- W. Sewell, R. B. Mason, and P. Venter, Socio-Economic Developmental Strategies as Retail Performance Indicators: A Balanced Scorecard Approach. Dev. South. Afr. 2017, 34, 365–382. [Google Scholar] [CrossRef]
- Bing. (n.d.). Effect of Entrepreneurial Orientation on Performance of SMEs in Ethiopia: The Mediation Role of Innovation. Available at: https://www.bing.com/search?pglt=41&q=Effect+of+Entrepreneurial+Orientation+on+Performance+of+SMEs+in+Ethiopia%3A+The+Mediation+role+of+Innovation+Gada+Gizachew+Wakjira1+%2C+Kenenisa+Lemi+Debela2*%2C+Shashi+Kant3&cvid=ba3bc35b92514fcab34ef02a89103fc1&gs_lcrp=EgZjaHJvbWUyBggAEEUYOdIBBzg0OWowajGoAgCwAgA&FORM=ANNTA1&PC=U531. (accessed on 12 September 2024).
- ResearchGate. (n.d.). Effect of Innovation, Knowledge Sharing, and Trust Culture on Hotels' SMEs Growth in Eswatini. Available at: https://www.researchgate.net/publication/354186670_Effect_of_Innovation_Knowledge_Sharing_and_Trust_Culture_on_Hotels'_SMEs_Growth_in_Eswatini. (accessed on 12 September 2024).
- Eamr-accid.eu. (n.d.). Volume 5, Issue 2. Available at: https://eamr-accid.eu/wp-content/uploads/Volume-5-Issue-2.pdf. (accessed on 12 September 2024).
- ResearchGate. (n.d.). Identification of Performance Measures for Textile Supply Chain: Case of Small Medium Size Enterprise. Available at: https://www.researchgate.net/profile/Pranav-Charkha/publication/288841428_Identification_of_performance_measures_for_textile_supply_chain_Case_of_small_medium_size_enterprise/links/5a34b842aca27247eddce429/Identification-of-performance-measures-for-textile-supply-chain-Case-of-small-medium-size-enterprise.pdf. (accessed on 12 September 2024).
- ResearchGate. (n.d.). Employee Retention Practices and the Performance of Small and Medium Enterprises in Nigeria. Available at: https://www.researchgate.net/publication/363317689_Employee_Retention_Practices_and_the_Performance_of_Small_and_Medium_Enterprises_in_Nigeria. (accessed on 12 September 2024).
- ResearchGate. (n.d.). Applicability of Performance Prism in SMEs: A Multiple Case Study. Available at: https://www.researchgate.net/publication/338773870_Applicability_of_Performance_Prism_in_SMEs_a_multiple_case_study. (accessed on 12 September 2024).
- ResearchGate. (n.d.). The Effect of Cloud Accounting Adoption on Organizational Performance in SMEs. Available at: https://www.researchgate.net/publication/364111154_The_effect_cloud_accounting_adoption_on_organizational_performance_in_SMEs. (accessed on 12 September 2024).
- Edu.pe. (n.d.). Inicio. Available at: https://ilagop.edu.pe/. (accessed on 12 September 2024).
- ResearchGate. (n.d.). A Taxonomy of Knowledge Management Outcomes for SMEs. Available at: https://www.researchgate.net/publication/286597565_A_taxonomy_of_knowledge_management_outcomes_for_SMEs. (accessed on 12 September 2024).
- L. Zhang, A Comparative Study of Modern Management Accounting Practices and SMEs Performance in Malaysia and China: The Moderating Role of Power Distance.
- M. Hidayat, C. I. Musa, S. Haerani, and I. Sudirman, The Design of Curriculum Development Based on Entrepreneurship Through Balanced Scorecard Approach. Int. Educ. Study. 2015, 8, 123. [Google Scholar] [CrossRef]
- ResearchGate. (n.d.). Identification and Determination of the Priority of Key Performance Indicators: Perspective of Customers on Cocoa Processing Industry of SMEs Scale in South Sulawesi. Available at: https://www.researchgate.net/publication/326300619_IDENTIFICATION_AND_DETERMINATION_OF_THE_PRIORITY_OF_KEY_PERFORMANCE_INDICATORS_PERSPECTIVE_OF_CUSTOMERS_ON_COCOA_PROCESSING_INDUSTRY_OF_SMEs_SCALE_IN_SOUTH_SULAWESI. (accessed on 12 September 2024).
- Academia.edu. (n.d.). Ranking of Performance Measurement Systems for Smaller Businesses. Available at: https://www.academia.edu/80974837/Ranking_of_Performance_Measurement_Systems_for_Smaller_Businesses. (accessed on 12 September 2024).
- ResearchGate. (n.d.). Revitalizing Small Business Growth Strategies: Exploring the Risk-Benefit of Strategic Management Approaches. Available at: https://www.researchgate.net/publication/281234873_Revitalising_Small_Business_Growth_Strategies_Exploring_the_Risk-Benefit_of_Strategic_Management_Approaches. (accessed on 12 September 2024).
- European Accounting and Management Review.
- Giannoukou and C., C. Beneki, Towards Sustainability Performance Management System of Tourism Enterprises: A Tourism Sustainable Balanced Scorecard Framework. Int. J. Glob. Environ. Issu. 2018, 17, 175. [Google Scholar] [CrossRef]
- Academia.edu. (n.d.). A Green Corridor Balanced Scorecard. Available at: https://www.academia.edu/55344725/A_Green_Corridor_Balanced_Scorecard. (accessed on 12 September 2024).
- Emerald.com. (n.d.). International Journal of Productivity and Performance Management. Available at: https://www.emerald.com/insight/publication/issn/1741-0401. (accessed on 12 September 2024).
- ResearchGate. (n.d.). Effect of Opportunity Recognition and Organization Capability on SME Performance in Indonesia: Moderated by Business Model Innovation. Available at: https://www.researchgate.net/publication/365743414_Effect_of_Opportunity_Recognition_and_Organisation_Capability_on_SME_Performance_in_Indonesia_Moderated_by_Business_Model_Innovation. (accessed on 12 September 2024).
- Bing. (n.d.). Implementation of the Balanced Scorecard in Large Firms: A Systematic Review by Zhijun Liu. Available at: https://www.bing.com/search?pglt=41&q=Implementation+of+the+Balanced+Scorecard+in+Large+Firms%3A+A+Systematic+Review+Zhijun+Liu1*&cvid=a797a40e10ce4a90a04bca21a02028bb&gs_lcrp=EgZjaHJvbWUyBggAEEUYOdIBBzc4OGowajGoAgCwAgA&FORM=ANNTA1&PC=U531. (accessed on 12 September 2024).
- N. Sahraen, Risk Mitigation Using Integration of Enterprise Risk Management and Balanced Scorecard Model: A Case Study in a Consulting Services Company in Indonesia. SPEKTRUM IND. 2021, 19, 73. [Google Scholar] [CrossRef]
- Taylor & Francis. Performance management of supply chain sustainability in small and medium-sized enterprises using a combined structural equation modelling and data envelopment analysis. [Online]. Available: https://www.taylorfrancis.com/chapters/edit/10.4324/9781003018551-6/performance-management-supply-chain-sustainability-small-medium-sized-enterprises-using-combined-structural-equation-modelling-data-envelopment-analysis-prasanta-kumar-dey-guo-liang-yang-chrisovaladis-malesios-debashree-de-konstantinos-evangelinos. (accessed on 18 September 2024).
- P. K. Dey, G.-L. Yang, C. Malesios, D. De, and K. Evangelinos, Performance management of supply chain sustainability in small and medium-sized enterprises using a combined structural equation modelling and data envelopment analysis. Computational Economics 2021, 58, 573–613. [Google Scholar] [CrossRef]
- ResearchGate. Supply Chain Sustainability Performance Measurement of Small and Medium-Sized Enterprises using Structural Equation Modeling. [Online]. Available: https://www.researchgate.net/publication/328253969_Supply_Chain_Sustainability_Performance_Measurement_of_Small_and_Medium_Sized_Enterprises_using_Structural_Equation_Modeling. (accessed on 18 September 2024).
- C. Malesios, P. K. Dey, and F. B. Abdelaziz, Supply chain sustainability performance measurement of small and medium-sized enterprises using structural equation modeling. Annals of Operations Research 2020, 294, 623–653. [Google Scholar] [CrossRef]
- Balanced Scorecard, The Strategy Story - Simplifying Business Strategies, Feb. 6, 2024. [Online]. Available: (accessed on 18 September 2024).
- S. Bakhtiari, R. Breunig, L. Magnani, and J. Zhang, Financial constraints and small and medium enterprises: A review. Econ. Rec. 2020, 96, 506–523. [Google Scholar] [CrossRef]
- Cput.ac.za. [Online]. Available: https://etd.cput.ac.za/bitstream/20.500.11838/3230/1/Masixole_Solani_205047297.pdf. (accessed on 28 September 2024).
- Researchgate.net. [Online]. Available: https://www.researchgate.net/publication/331548047_IMPACT_OF_INNOVATION_PRACTICES_ON_SUSTAINABLE_PERFORMANCE_SMEs. (accessed on 28 September 2024).
- Z. Zhang, H. Zhu, Z. Zhou, and K. Zou, How does innovation matter for sustainable performance? Evidence from small and medium-sized enterprises. J. Bus. Res. 2022, 153, 251–265. [Google Scholar] [CrossRef]
- Academia.edu. [Online]. Available: https://www.academia.edu/39198226/IMPACT_OF_INNOVATION_PRACTICES_ON_SUSTAINABLE_PERFORMANCE_SMEs. (accessed on 28 September 2024).
- Tawse and, P. Tabesh, Thirty years with the balanced scorecard: What we have learned. Bus. Horiz. 2023, 66, 123–132. [Google Scholar] [CrossRef]
- Llorach and, E. Ottosson, The Balanced Scorecard during the early stages of a tech firm: A multiple case study regarding performance management in Swedish tech startups, 2016.
- Diva-portal.org. [Online]. Available: https://www.diva-portal.org/smash/get/diva2:953509/FULLTEXT02.pdf. (accessed on 28 September 2024).
- Dameshifa, A. Azazi, E. Listiana, H. Malini, and H. Heriyadi, The influence of entrepreneurial and Market Orientation on Business Performance through mediation of innovation capability: Implementation of SMEs in Indonesia. East Afr Sch J Econ Bus Manag.
- Abacademies.org. [Online]. Available: https://www.abacademies.org/articles/The-effect-of-entrepreneurial-orientation-on-1528-2651-22-5-461.pdf. (accessed on 28 September 2024).
- V. Oyaneder and S. M. Valderrama, A new balanced scorecard approximation to enhance performance management systems of Chilean wineries. J. Wine Res. 2016, 27, 1–18. [Google Scholar] [CrossRef]
- Researchgate.net. [Online]. Available: https://www.researchgate.net/publication/295396300_A_new_balanced_scorecard_approximation_to_enhance_performance_management_systems_of_Chilean_wineries. (accessed on 28 September 2024).
- Researchgate.net. [Online]. Available: https://www.researchgate.net/publication/318928910_Business_intelligence_systems_and_bank_performance_in_Ghana_The_balanced_scorecard_approach. (accessed on 28 September 2024).
- Owusu, Business intelligence systems and bank performance in Ghana: The balanced scorecard approach. Cogent Bus. Manag. 2017, 4, 1364056. [CrossRef]
- Edu.gh. [Online]. Available: https://pure.ug.edu.gh/en/publications/business-intelligence-systems-and-bank-performance-in-ghana-the-b. (accessed on 28 September 2024).
- Ssrn.com. [Online]. Available: https://papers.ssrn.com/sol3/papers.cfm?abstract_id=3481364. (accessed on 28 September 2024).
- Gov.my. [Online]. Available: https://smecorp.gov.my/images/Publication/MSME_Insights/2022_23/3Chapter%202_Performance%20of%20MSMEs%20in%20Malaysia.pdf. (accessed on 28 September 2024).
- Researchgate.net. [Online]. Available: https://www.researchgate.net/publication/375544721_Determining_key_factors_influencing_SMEs'_performance_A_systematic_literature_review_and_experts'_verification. (accessed on 28 September 2024).
- N. M. Mustapha and S. Sorooshian, SME performance measurement: A technical review of Malaysia, Edu.my. [Online]. Available: http://umpir.ump.edu.my/id/eprint/25913/1/SME%20performance%20measurement%20a%20technical%20review%20of%20Malaysia.pdf. (accessed on 28 September 2024).
- Unl.pt. [Online]. Available: https://run.unl.pt/handle/10362/107266?locale=en. (accessed on 28 September 2024).
- Hegazy, K. Hegazy, and M. Eldeeb, The balanced scorecard: Measures that drive performance evaluation in auditing firms. J. Account. Audit. Finance 2022, 37, 902–927. [Google Scholar] [CrossRef]
- Researchgate.net. [Online]. Available: https://www.researchgate.net/publication/359479328_Performance_of_Food_and_NonFood_SMIS_Based_on_Marketing_Entrepreneurs_Entrepreneurship_Marketing_Food_and_Non-Food_SMIs_Performance_Balanced_Scorecard. (accessed on 28 September 2024).
- Neliti.com. [Online]. Available: https://www.neliti.com/publications/410597/marketing-entrepreneurs-performance-of-food-and-non-food-smis-based-on-marketing. (accessed on 28 September 2024).
- Researchgate.net. [Online]. Available: https://www.researchgate.net/publication/336136888_ASSESSMENT_OF_ENTREPRENEURIAL_MARKETING_PERFORMANCE_IN_SMALL_AND_MEDIUM_FOOD_AND_NON-FOOD_INDUSTRY_IN_INDONESIA_USING_IPA_ANALYSIS. (accessed on 28 September 2024).
- D. Gemina, Performance of food and non-food SMIS based on marketing entrepreneurs: Entrepreneurship marketing, food, and non-food SMIs performance, balanced scorecard. International Journal of Economics Development Research (IJEDR) 2020, 1, 243–259. [Google Scholar] [CrossRef]
- Del Baldo, The implementation of integrating reporting in SMEs: Insights from a pioneering experience in Italy. Meditari Account. Res. 2017, 25, 505–532. [CrossRef]
- Jami Pour and, M. Asarian, Strategic orientations, knowledge management (KM) and business performance: An exploratory study in SMEs using clustering analysis. Kybernetes 2019, 48, 1942–1964. [Google Scholar] [CrossRef]
- Researchgate.net. [Online]. Available: https://www.researchgate.net/publication/329819484_Strategic_orientations_knowledge_management_KM_and_business_performance_An_exploratory_study_in_SMEs_using_clustering_analysis. (accessed on 28 September 2024).
- B. Song, Y. Li, and L. Zhao, Complementary effect of knowledge management strategy on firm performance: Evidence from Chinese firms. Sustainability 2019, 11, 3616. [Google Scholar] [CrossRef]
- C. S. Lee and K. Y. Wong, Development and validation of knowledge management performance measurement constructs for small and medium enterprises. J. Knowl. Manag. 2015, 19, 711–734. [Google Scholar] [CrossRef]
- Researchgate.net. [Online]. Available: https://www.researchgate.net/publication/306010707_The_Balanced_Scorecard_vs_Total_Quality_Management#:~:text=Empirical%20investigation%20suggests%20that%20numerous%20organizations%20have%20adopted,customer%2C%20internal%20business%20processes%2C%20and%20learning%20and%20growth. (accessed on 28 September 2024).
- G. Mehralian, J. A. Nazari, G. Nooriparto, and H. R. Rasekh, TQM and organizational performance using the balanced scorecard approach. Int. J. Product. Perform. Manag. 2017, 66, 111–125. [Google Scholar] [CrossRef]
- Z. Hoque, Total quality management and the balanced scorecard approach: A critical analysis of their potential relationships and directions for research. Crit. Perspect. Account. 2003, 14, 553–566. [Google Scholar] [CrossRef]
- Researchgate.net. [Online]. Available: https://www.researchgate.net/publication/274573303_Critical_success_factors_for_implementation_of_supply_chain_management_in_Indian_small_and_medium_enterprises_and_their_impact_on_performance#:~:text=this%20paper%20identi%EF%AC%81ed%2013%20critical%20success%20factors%20%28CSFs%29,emerge%20d%20as%20the%20most%20perti%20nent%20CSFs. (accessed on 28 September 2024).
- R. Kumar, R. K. Singh, and R. Shankar, Critical success factors for implementation of supply chain management in Indian small and medium enterprises and their impact on performance. IIMB Manag. Rev. 2015, 27, 92–104. [Google Scholar] [CrossRef]
- Researchgate.net. [Online]. Available: https://www.researchgate.net/publication/274573303_Critical_success_factors_for_implementation_of_supply_chain_management_in_Indian_small_and_medium_enterprises_and_their_impact_on_performance. (accessed on 28 September 2024).
- Taschner, Improving SME logistics performance through benchmarking, Benchmarking 2016, 23, 1780–1797.
- Researchgate.net. [Online]. Available: https://www.researchgate.net/publication/309103764_Improving_SME_logistics_performance_through_benchmarking. (accessed on 28 September 2024).
- Sciencedirect.com. [Online]. Available: https://www.sciencedirect.com/science/article/abs/pii/S2214785321041511#:~:text=For%20deducing%20supply%20chain%20performance%2C%20the%20Balanced%20Scorecard,Envelopment%20Analysis%20%28DEA%29%20and%20Heuristic%20techniques%20based%20models. (accessed on 28 September 2024).
- M. Balaji, S. N. Dinesh, P. Manoj Kumar, and K. Hari Ram, Balanced Scorecard approach in deducing supply chain performance. Mater. Today 2021, 47, 5217–5222. [Google Scholar]
- Dau.edu. [Online]. Available: https://www.dau.edu/library/damag/july-august2017/balanced-scorecards-supply-chain-management. (accessed on 28 September 2024).
- Kosa, I. Mohammad, and D. Ajibie, Entrepreneurial orientation and venture performance in Ethiopia: the moderating role of business sector and enterprise location. J. Glob. Entrep. Res. 2018, 8. [Google Scholar] [CrossRef]
- R. U. Khan, Y. Salamzadeh, H. Kawamorita, and G. Rethi, Entrepreneurial orientation and small and medium-sized enterprises’ performance; Does ‘access to finance’ moderate the relation in emerging economies? Vis. J. Bus. Perspect. 2021, 25, 88–102. [Google Scholar] [CrossRef]
- N. Sahraen, Risk mitigation using integration enterprise risk management and balanced scorecard model: A case study in a consulting services company in Indonesia. SPEKTRUM IND. 2021, 19, 73. [CrossRef]
- Z. Liu, Implementation of the balanced scorecard in large firms: A systematic review. Asian Journal of Accounting and Finance 2024, 6, 1–11. [Google Scholar]
- Researchgate.net. [Online]. Available: https://www.researchgate.net/publication/365743414_Effect_of_Opportunity_Recognition_and_Organisation_Capability_on_SME_Performance_in_Indonesia_Moderated_by_Business_Model_Innovation. (accessed on 28 September 2024).
- Academia.edu. [Online]. Available: https://www.academia.edu/93437960/The_Effect_of_Opportunity_Recognition_and_Organization_Capability_on_SME_Performance_in_Indonesia_Moderated_by_Business_Model_Innovation. (accessed on 28 September 2024).
- Consensus.app. [Online]. Available: https://consensus.app/papers/opportunity-recognition-organisation-capability-hartono/5834fcd02f535c889d83e40fc527da90/. (accessed on 28 September 2024).
- S. Pekkola, M. Saunila, and H. Rantanen, Performance measurement system implementation in a turbulent operating environment, Int. J. Product. Perform. Manag. 2016, 65, 947–958. [Google Scholar]
- Eifert and, C. Julmi, Challenges and how to overcome them in the formulation and implementation process of a Sustainability Balanced Scorecard (SBSC). Sustainability 2022, 14, 14816. [Google Scholar] [CrossRef]
- W. Sewell, R. B. Mason, and P. Venter, Socio-economic developmental strategies as retail performance indicators: A balanced scorecard approach, Dev. South. Afr. 2017, 34, 365–382. [Google Scholar] [CrossRef]
- University of Gothenburg, S. Sorooshian, N. Aziz, U. M. Pahang, N. Azizan, and Prince Sultan University, Ranking of performance measurement systems for smaller businesses. Int. J. Intell. Eng. Syst. 2020, 13, 108–116. [Google Scholar]
- Researchgate.net. [Online]. Available: https://www.researchgate.net/publication/326300619_IDENTIFICATION_AND_DETERMINATION_OF_THE_PRIORITY_OF_KEY_PERFORMANCE_INDICATORS_PERSPECTIVE_OF_CUSTOMERS_ON_COCOA_PROCESSING_INDUSTRY_OF_SMEs_SCALE_IN_SOUTH_SULAWESI. (accessed on 28 September 2024).
- M. Dahlan, Ramlawati, and Lamatinulu, Identification and determination of priority of key performance indicator of financial perspectives on industry cocoa SMEs in south Sulawesi. IOP Conf. Ser. Earth Environ. Sci. 2018, 175, 012029. [Google Scholar] [CrossRef]
- M. Hidayat, C. I. Musa, S. Haerani, and I. Sudirman, The design of curriculum development based on entrepreneurship through balanced scorecard approach. Int. Educ. Stud. 2015, 8, 123. [Google Scholar] [CrossRef]
- L. Lamatinulu, Identification and determination of the priority of key performance indicators perspective of customers on cocoa processing industry of SMEs scale in south Sulawesi. International Journal of Engineering Sciences & Research Technology.
- L. Zhang, A comparative study of modern management accounting practices and SMEs performance in Malaysia and China: The moderating role of power distance.
- B. D. Dağıdır and B. Özkan, A comprehensive evaluation of a company performance using sustainability balanced scorecard based on picture fuzzy AHP. J. Clean. Prod. 2024, 435, 140519. [Google Scholar] [CrossRef]
- E. Neder, The new relationship among state, market, and political actors in public policies. Mei Zhong Gong Gong Guan Li 2015, 12. [Google Scholar]
- Ssrn.com. [Online]. Available: https://papers.ssrn.com/sol3/papers.cfm?abstract_id=4307192. (accessed on 28 September 2024).
- Researchgate.net. [Online]. Available: https://www.researchgate.net/publication/338773870_Applicability_of_Performance_Prism_in_SMEs_a_multiple_case_study. (accessed on 28 September 2024).
- Researchgate.net. [Online]. Available: https://www.researchgate.net/publication/363317689_Employee_Retention_Practices_and_the_Performance_of_Small_and_Medium_Enterprises_in_Nigeria. (accessed on 28 September 2024).
- Researchgate.net. [Online]. Available: https://www.researchgate.net/figure/Innovation-effect-on-SMEs-hotels-growth_tbl1_354186670. (accessed on 28 September 2024).
- V. Tuan, Analysis of managerial factors on the performance of small and medium-sized enterprises (SMEs) in manufacturing sector in Ho Chi Minh City- Vietnam, 2018.
- Researchgate.net. [Online]. Available: https://www.researchgate.net/publication/286597565_A_taxonomy_of_knowledge_management_outcomes_for_SMEs. (accessed on 28 September 2024).
- Building and Deploying a Balanced Scorecard within SMEs, ICAEW. [Online]. Available: https://www.icaew.com/technical/business/business-performance-management/bpm-tools-templates-and-case-studies/building-and-deploying-a-balanced-scorecard-within-small-and-medium-sized-organisations. (accessed on 19 September 2024).
- E. Kirsten, F. Vermaak, and H. Wolmarans, Performance Measurement in Small and Medium Enterprises: South African Accountants’ Perspective. Journal of Economic and Financial Sciences 2015, 8, 13–34. [Google Scholar] [CrossRef]
- M. Lonbani, S. Sofian, and M. B. Baroto, Balanced Scorecard Implementation in SMEs: Addressing the Moderating Role of Environmental Uncertainty. Global Business and Organizational Excellence 2016, 35, 58–66. [Google Scholar] [CrossRef]
- C. J. van Zyl, A Practical Performance Measurement Framework for SMEs in a South African Context, *Stellenbosch University*, [Online]. Available: https://scholar.sun.ac.za/server/api/core/bitstreams/16fc52ae-9ed9-4db8-a610-03602cc6fc0c/content. (accessed on 19 September 2024).
- R. Malagueño, E. Lopez-Valeiras, and J. Gomez-Conde, The Balanced Scorecard in SMEs: Effects on Innovation and Financial Performance. Small Business Economics 2018, 51, 221–244. [Google Scholar] [CrossRef]
- R. Malagueño, E. Lopez-Valeiras, and J. Gomez-Conde, The Balanced Scorecard in SMEs: Effects on Innovation and Financial Performance. Small Business Economics 2017, 51, 221–244. [Google Scholar]
- Balanced Scorecard, Intrafocus, 17 Jun. 2014. [Online]. Available: https://www.intrafocus.com/balanced-scorecard/. (accessed on 19 September 2024).
- D. M. A. Mba et al., Balanced Scorecard. Der Anaesthesist 2003, 52, 947–956. [Google Scholar]
- Balanced Scorecard Course, Udemy, [Online]. Available: https://www.udemy.com/course/building-balanced-scorecard/?utm_source=bing&utm_medium=udemyads&utm_campaign=BG-Search_DSA_Beta_Prof_la.EN_cc.ROW-English&campaigntype=Search&portfolio=Bing&language=EN&product=Course&test=&audience=DSA&topic=&priority=Beta&utm_content=deal4584&utm_term=_._ag_1329311946398319_._ad__._kw_Finance+en_._de_c_._dm__._pl__._ti_dat-2334881661677439%3Aloc-168_._li_137821_._pd__._&matchtype=b&msclkid=14c20d8ce7e9125baf6f6b671a4d2566&couponCode=2021PM20. (accessed on 19 September 2024).
- Balanced Scorecard, The Strategy Story, 06 Feb. 2024.
- Balanced Scorecard Institute, BSC Basics, 23 Nov. 2017. [Online]. Available: https://balancedscorecard.org/bsc-basics/. (accessed on 19 September 2024).
- Jurevicius, Balanced Scorecard, Strategic Management Insight, 22 Jan. 2024. [Online]. Available: https://strategicmanagementinsight.com/tools/balanced-scorecard/. (accessed on 19 September 2024).
- D. Croft, The Four Perspectives of the Balanced Scorecard: Explained and Analyzed, Learn Lean Sigma, 23 Jul. 2023. [Online]. Available: https://www.learnleansigma.com/improvement-methodology/balanced-scorecard-explained/. (accessed on 19 September 2024).
- J. Weller, Everything You Need to Know About the Balanced Scorecard, Smartsheet, 27 Jul. 2017.
- Balanced Scorecard Institute, Nine Steps to Success, 09 Apr. 2018. [Online]. Available: https://balancedscorecard.org/about/nine-steps/. (accessed on 19 September 2024).
- What is a Balanced Scorecard?, Business Insights Blog, 26 Oct. 2023. [Online]. Available: https://online.hbs.edu/blog/post/balanced-scorecard. (accessed on 19 September 2024).
- Balanced Scorecard Institute, Balanced Scorecard Basics, 30 Jun. 2018. [Online]. Available: https://balancedscorecard.org/bsc-basics-overview/. (accessed on 19 September 2024).
- L. Tucci and K. T. Hanna, Balanced Scorecard, CIO, 28 Jul. 2021. [Online]. Available: https://www.techtarget.com/searchcio/definition/balanced-scorecard-methodology. (accessed on 19 September 2024).
- E. Tarver, What is a Balanced Scorecard (BSC), and How is it Used in Business?, *Investopedia*, 18 Nov. 2003. [Online]. Available: https://www.investopedia.com/terms/b/balancedscorecard.asp. (accessed on 19 September 2024).
- Z. Dudić et al., Innovativeness and Usage of the Balanced Scorecard Model in SMEs, *Sustainability* 2020, 12, 3221.
- SMEs and BSC, Bing. [Online]. Available: https://www.bing.com/search?q=SMEs%20and%20BSC&qs=n&form=QBRE&=Search%20%7B0%7D%20for%20%7B1%7D&=Search%20work%20for%20%7B0%7D&=%25eManage%20Your%20Search%20History%25E&sp=-1&ghc=1&lq=0&pq=smes%20and%20bsc&sc=10-12&sk=&cvid=96684DEE8D304762B69E6BC6786AD873&ghsh=0&ghacc=0&ghpl=. (accessed on 19 September 2024).
- Researchgate.net. [Online]. Available: https://www.researchgate.net/publication/330563573_A_generic_balanced_scorecard_for_small_and_medium_manufacturing_enterprises_in_South_Africa. (accessed on 19 September 2024).
- Academia.edu. [Online]. Available: https://www.academia.edu/24487910/THE_BALANCED_SCORECARD_IN_THE_CONTEXT_OF_SMES_A_LITERATURE_REVIEW. (accessed on 19 September 2024).
- Researchgate.net. [Online]. Available: https://www.researchgate.net/publication/358161111_Existing_Differences_Between_SMEs_That_Apply_BSC_and_Those_That_Do_Not. (accessed on 19 September 2024).
- Malagueño, E. Lopez-Valeiras, and J. Gomez-Conde, Balanced scorecard in SMEs: effects on innovation and financial performance. Small Bus. Econ. 2018, 51, 221–244. [Google Scholar] [CrossRef]
- Researchgate.net. [Online]. Available: https://www.researchgate.net/publication/337192218_Balanced_Scorecard_Learning_and_Growth_Perspective. (accessed on 19 September 2024).
- How to implement the balanced scorecard framework (with examples), Cascade.app. [Online]. Available: https://www.cascade.app/blog/how-to-implement-the-balanced-scorecard. (accessed on 19 September 2024).
- MindTools, Mindtools.com. [Online]. Available: https://www.mindtools.com/arlnxwf/the-balanced-scorecard. (accessed on 19 September 2024).
- E. Tarver, What is a balanced scorecard (BSC), how is it used in business?, Investopedia, 18-Nov-2003. [Online]. Available: https://www.investopedia.com/terms/b/balancedscorecard.asp. (accessed on 19 September 2024).
- What is a balanced scorecard?, Business Insights Blog, 26-Oct-2023. [Online]. Available: https://online.hbs.edu/blog/post/balanced-scorecard. (accessed on 19 September 2024).
- Balanced scorecard, Corporate Finance Institute. [Online]. Available: https://corporatefinanceinstitute.com/resources/management/balanced-scorecard/. (accessed on 19 September 2024).
- Balanced Scorecard, The Strategy Story - Simplifying Business Strategies, 06-Feb-2024.
- D. Croft, The four perspectives of the Balanced Scorecard: Explained and analyzed, Learn Lean Sigma, 23-Jul-2023. [Online]. Available: https://www.learnleansigma.com/improvement-methodology/balanced-scorecard-explained/. (accessed on 19 September 2024).
- Lean Transition Solutions LTS, What is Balanced Scorecard (BSC)? Four Perspectives, 2022. [Online]. Available: https://balancedscorecard.ltslean.com/fcil-balanced-scorecard. (accessed on 19 September 2024).
- Savkín, What is a K&N Balanced Scorecard and the role of its perspectives, Bscdesigner.com, 22-Feb-2019. [Online]. Available: https://bscdesigner.com/four-perspectives.htm. (accessed on 19 September 2024).
- Marr, The four perspectives in a Balanced Scorecard, Bernard Marr, 02-Jul-2021. [Online]. Available: https://bernardmarr.com/the-four-perspectives-in-a-balanced-scorecard/. (accessed on 19 September 2024).
- Tsiu, S.; Ngobeni, M.; Mathabela, L.; Thango, B. Applications and Competitive Advantages of Data Mining and Business Intelligence in SMEs Performance: A Systematic Review. Preprints 2024, 2024090940. [Google Scholar] [CrossRef]
- Mkhize, A.; Mokhothu, K.; Tshikhotho, M.; Thango, B. Evaluating the Impact of Cloud Computing on SMEs Performance: A Systematic Review. Preprints 2024, 2024090882. [Google Scholar] [CrossRef]
- Kgakatsi, M.; Galeboe, O.; Molelekwa, K.; Thango, B. The Impact of Big Data on SME Performance: A Systematic Review. Preprints 2024, 2024090985. [Google Scholar] [CrossRef]
- Molete, O. B.; Mokhele, S. E.; Ntombela, S. D.; Thango, B. A. The Impact of IT Strategic Planning Process on SME Performance: A Systematic Review. Preprints 2024, 2024091024. [Google Scholar] [CrossRef]
- Mothapo, M.; Thango, B.; Matshaka, L. Tracking and Measuring Social Media Activity: Key Metrics for SME Strategic Success – A Systematic Review. Preprints 2024, 2024091757. [Google Scholar] [CrossRef]
- Ngcobo, K.; Bhengu, S.; Mudau, A.; Thango, B.; Matshaka, L. Enterprise Data Management: Types, Sources, and Real-Time Applications to Enhance Business Performance - A Systematic Review. Preprints 2024, 2024091913. [Google Scholar] [CrossRef]
- Mohlala, T. T.; Mehlwana, L. L.; Nekhavhambe, U. P.; Thango, B.; Matshaka, L. Strategic Innovation in HRIS and AI for Enhancing Workforce Productivity in SMEs: A Systematic Review. Preprints 2024, 2024091996. [Google Scholar] [CrossRef]
- Chabalala, K.; Boyana, S.; Kolisi, L.; Thango, B. A.; Matshaka, L. Digital Technologies and Channels for Competitive Advantage in SMEs: A Systematic Review. Preprints 2024, 2024100020. [Google Scholar] [CrossRef]
- Ndzabukelwako, Z.; Mereko, O.; Sambo, T. V.; Thango, B. The Impact of Porter’s Five Forces Model on SMEs Performance: A Systematic Review. Preprints 2024, 2024100119. [Google Scholar] [CrossRef]
- Maswanganyi, N. G.; Fumani, N. M.; Khoza, J. K.; Thango, B. A.; Matshaka, L. Evaluating the Impact of Database and Data Warehouse Technologies on Organizational Performance: A Systematic Review. Preprints 2024, 2024100059. [Google Scholar] [CrossRef]
- Gumede, T. T.; Chiworeka, J. M.; Magoda, A. S.; Thango, B. Building Effective Social Media Strategies for Business: A Systematic Review. Preprints 2024, 2024100379. [Google Scholar] [CrossRef]
- Myataza, A.; Mafunga, M.; Mkhulisi, N. S.; Thango, B. A. A Systematic Review of ERP, CRM, and HRM Systems for SMEs: Managerial and Employee Support. Preprints 2024, 2024100384. [Google Scholar] [CrossRef]
- Mudau, M. C.; Moshapo, L. W.; Monyela, T. M.; Thango, B. A. A The Role of Manufacturing Operations in SMEs Performance: A Systematic Review. Preprints 2024, 2024100539. [Google Scholar] [CrossRef]
- Khanyi, M.; Xaba, S.; Mlotshwa, N.; Thango, B.; Matshaka, L. The Role of Data Networks and APIs in Enhancing Operational Efficiency in SME: A Systematic Review. Preprints 2024, 2024100848. [Google Scholar] [CrossRef]
- Skosana, S.; Mlambo, S.; Madiope, T.; Thango, B. Evaluating Wireless Network Technologies (3G, 4G, 5G) and Their Infrastructure: A Systematic Review. Preprints 2024, 2024101331. [Google Scholar] [CrossRef]
- Mtjilibe, T.; Rameetse, E.; Mgwenya, N.; Thango, B. Exploring the Challenges and Opportunities of Social Media for Organizational Engagement in SMEs: A Comprehensive Systematic Review. Preprints 2024, 2024101438. [Google Scholar] [CrossRef]
Figure 1.
Five Step Process for Determining Information Sources.

Figure 2.
Search Strategy.
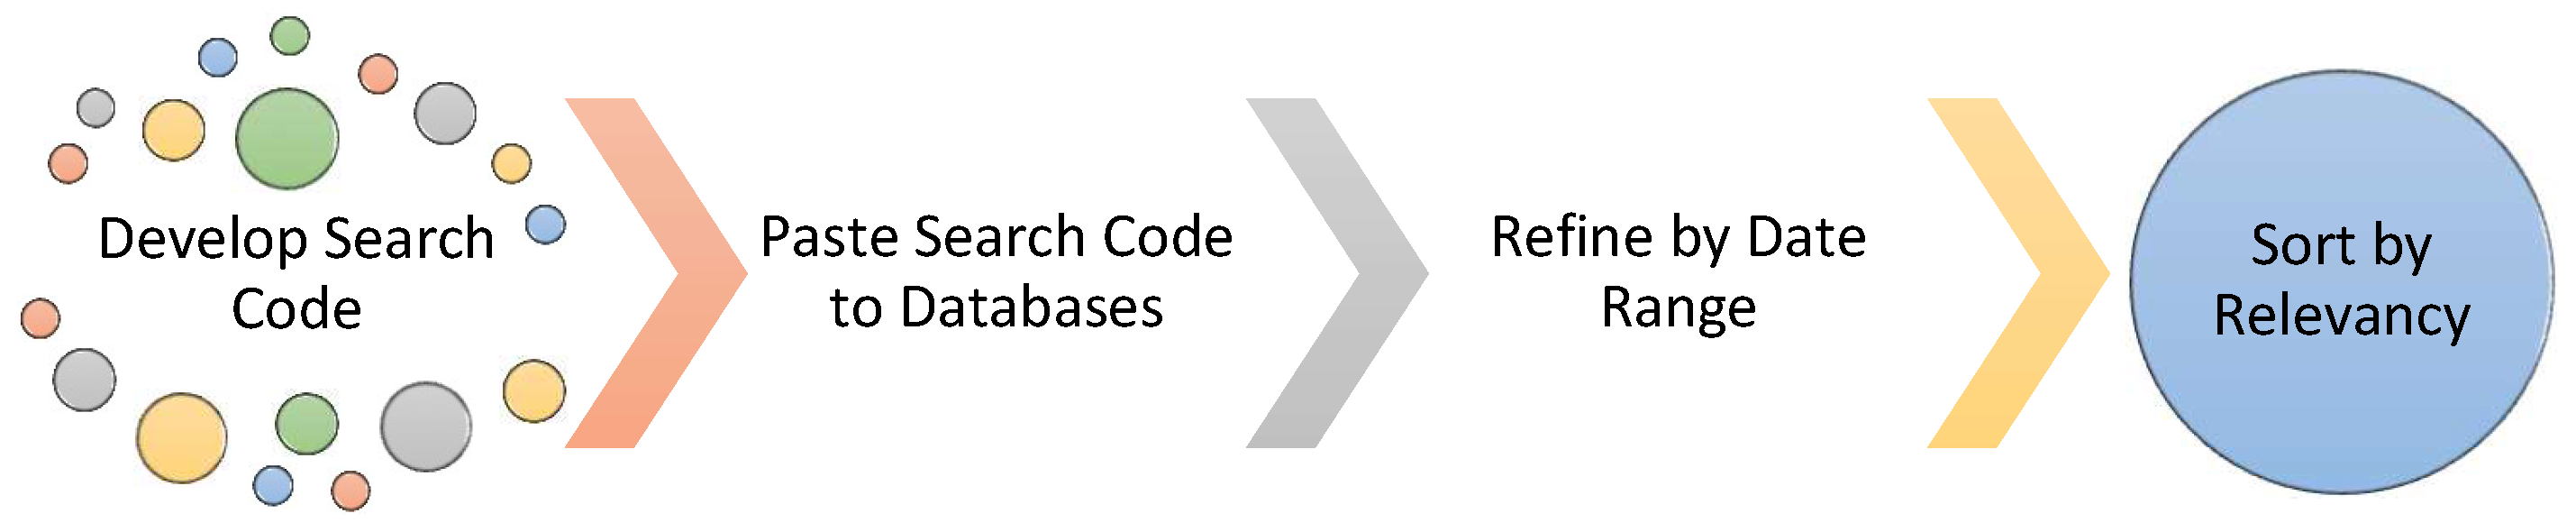
Figure 3.
Selection Process.
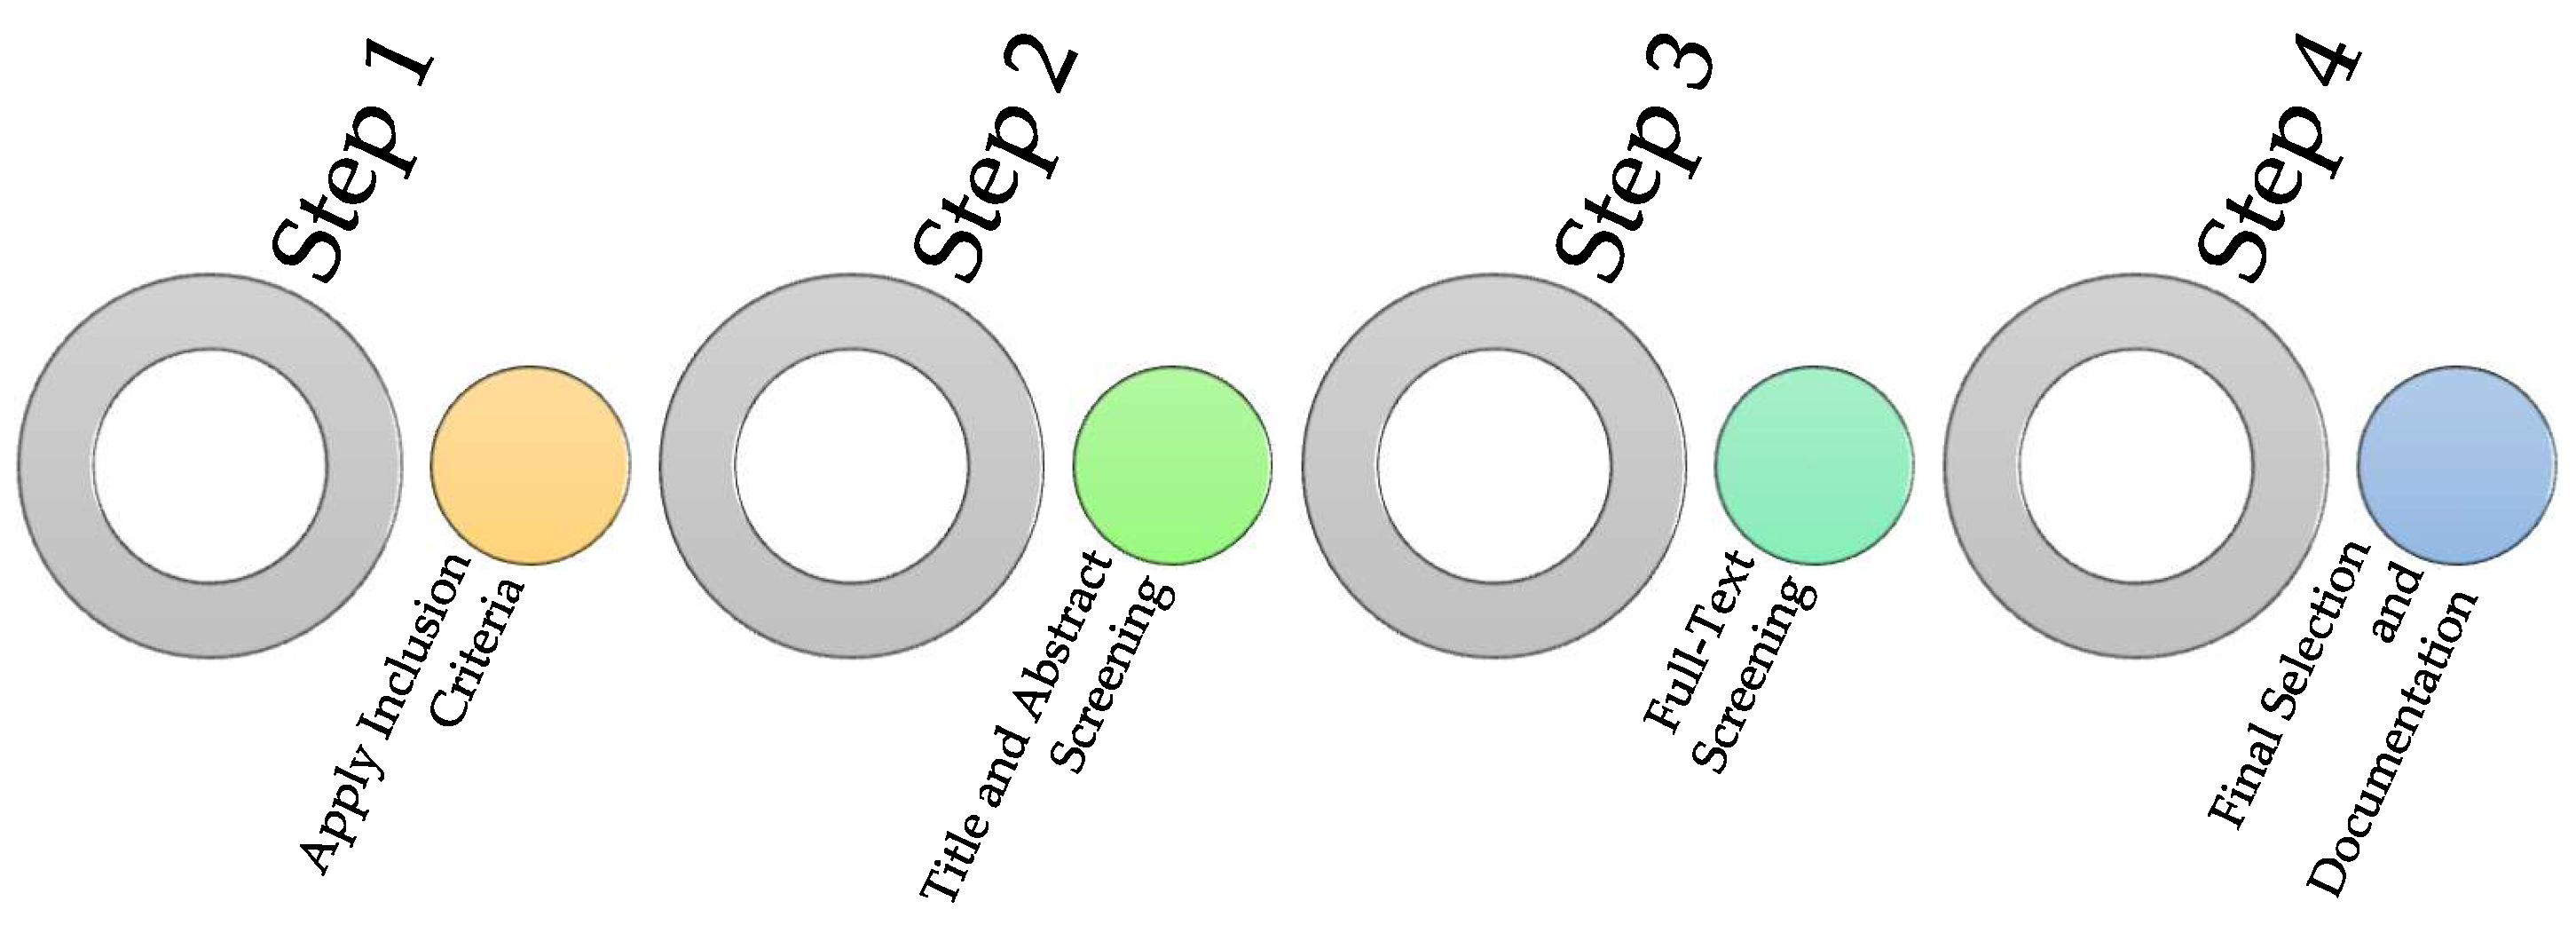
Figure 4.
Data Collection Process.
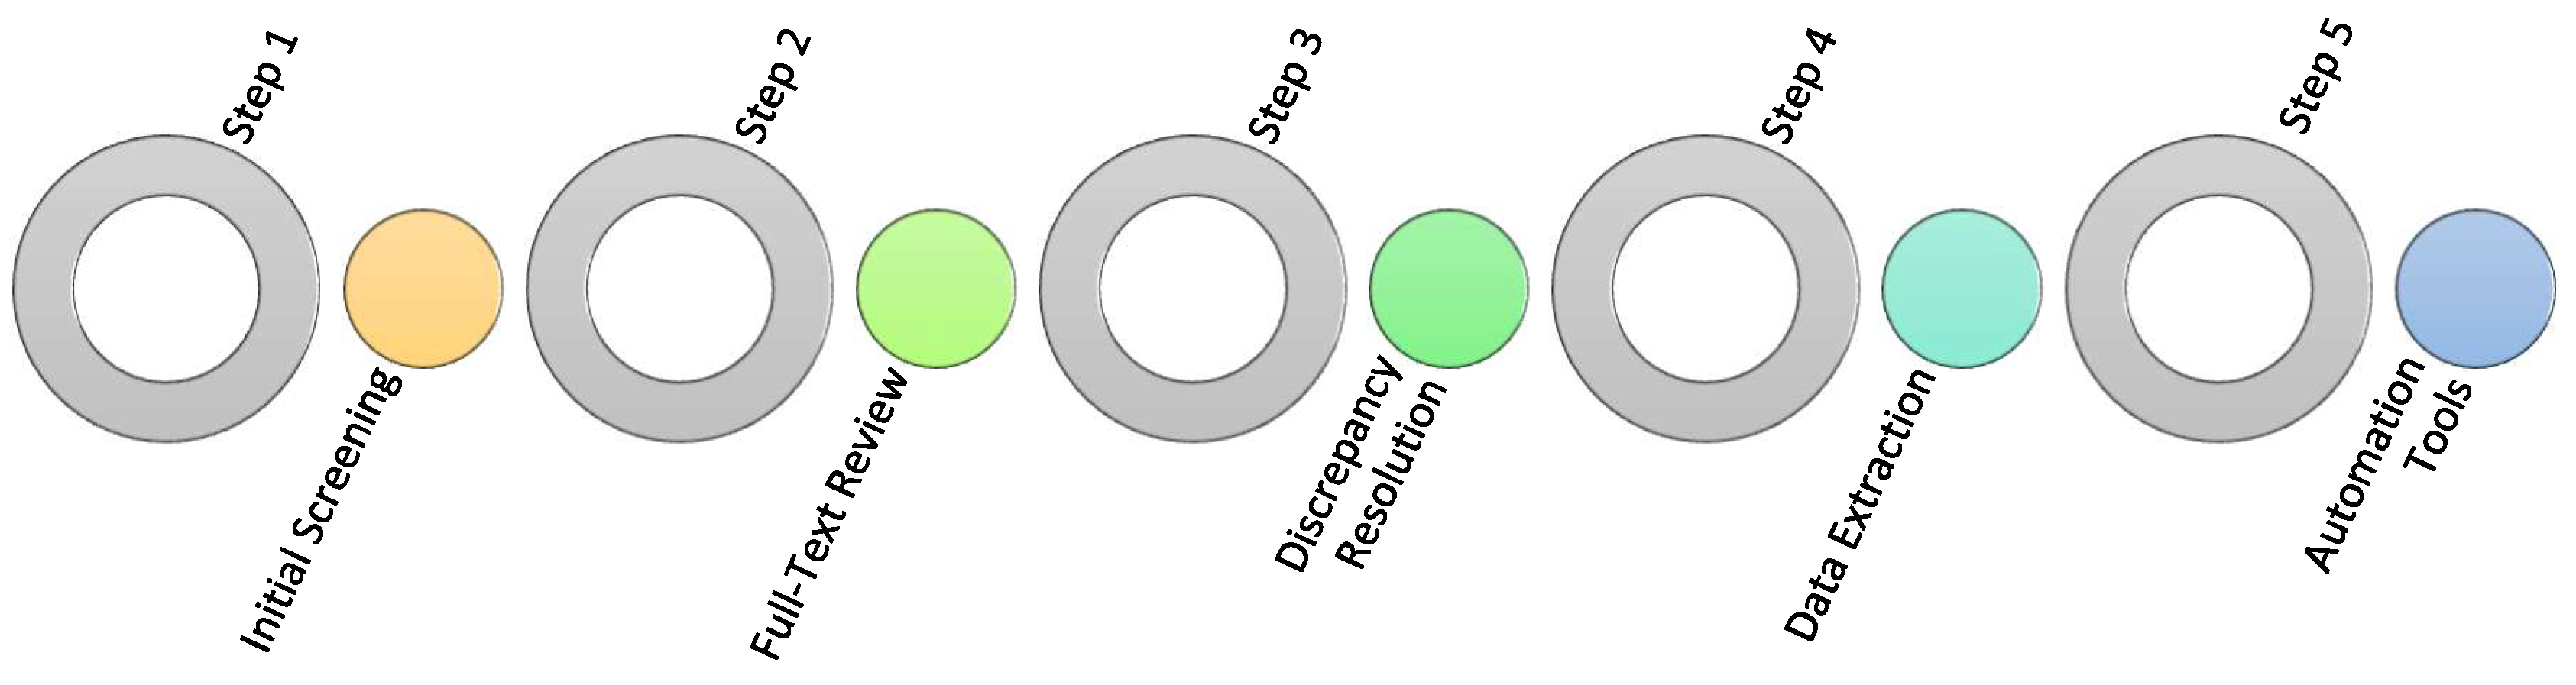
Figure 5.
Data Items Process.
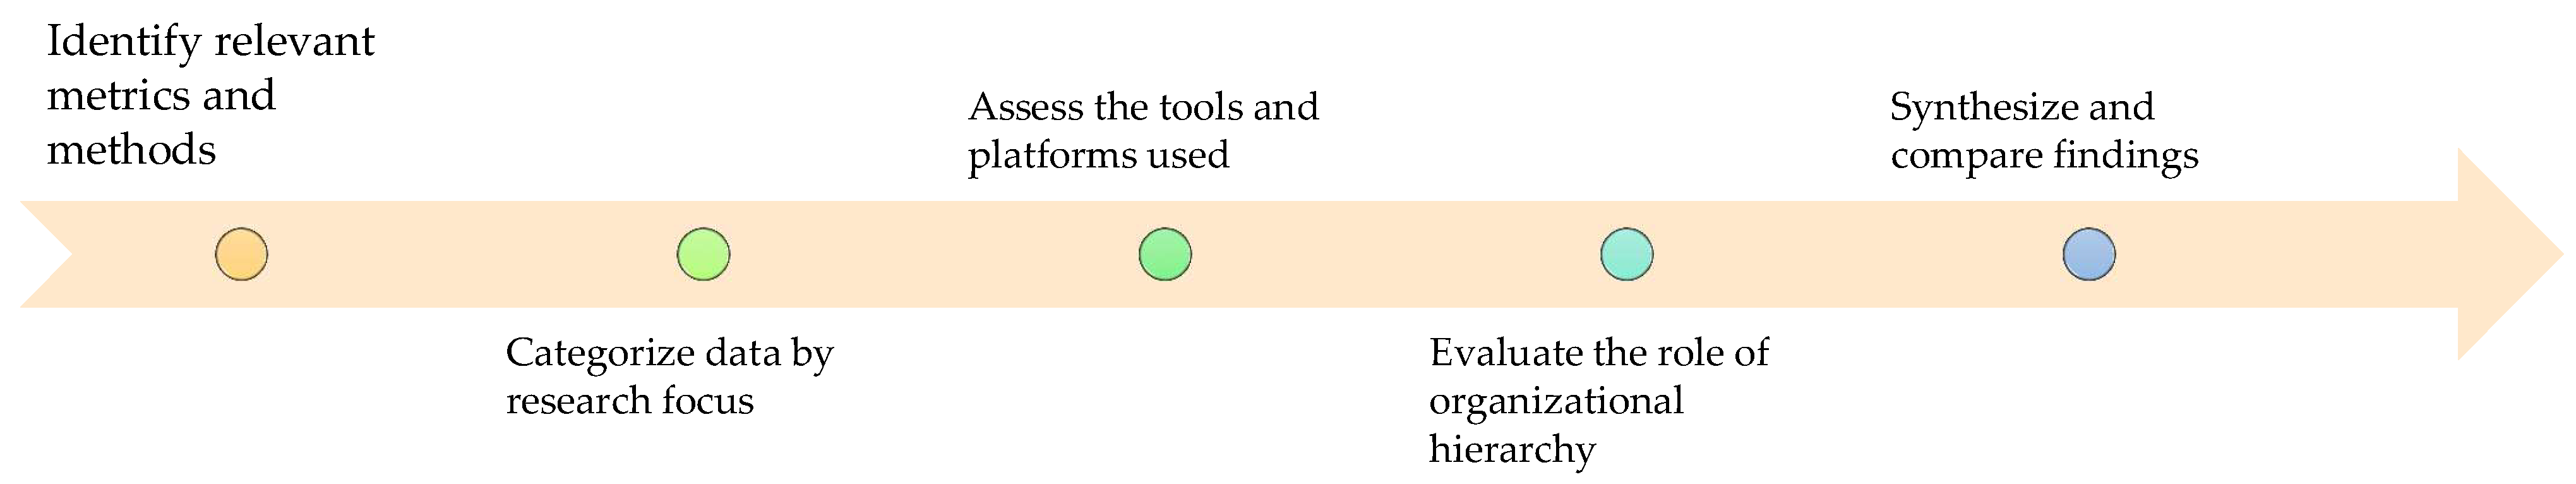
Figure 6.
Study Risk of Bias Process.
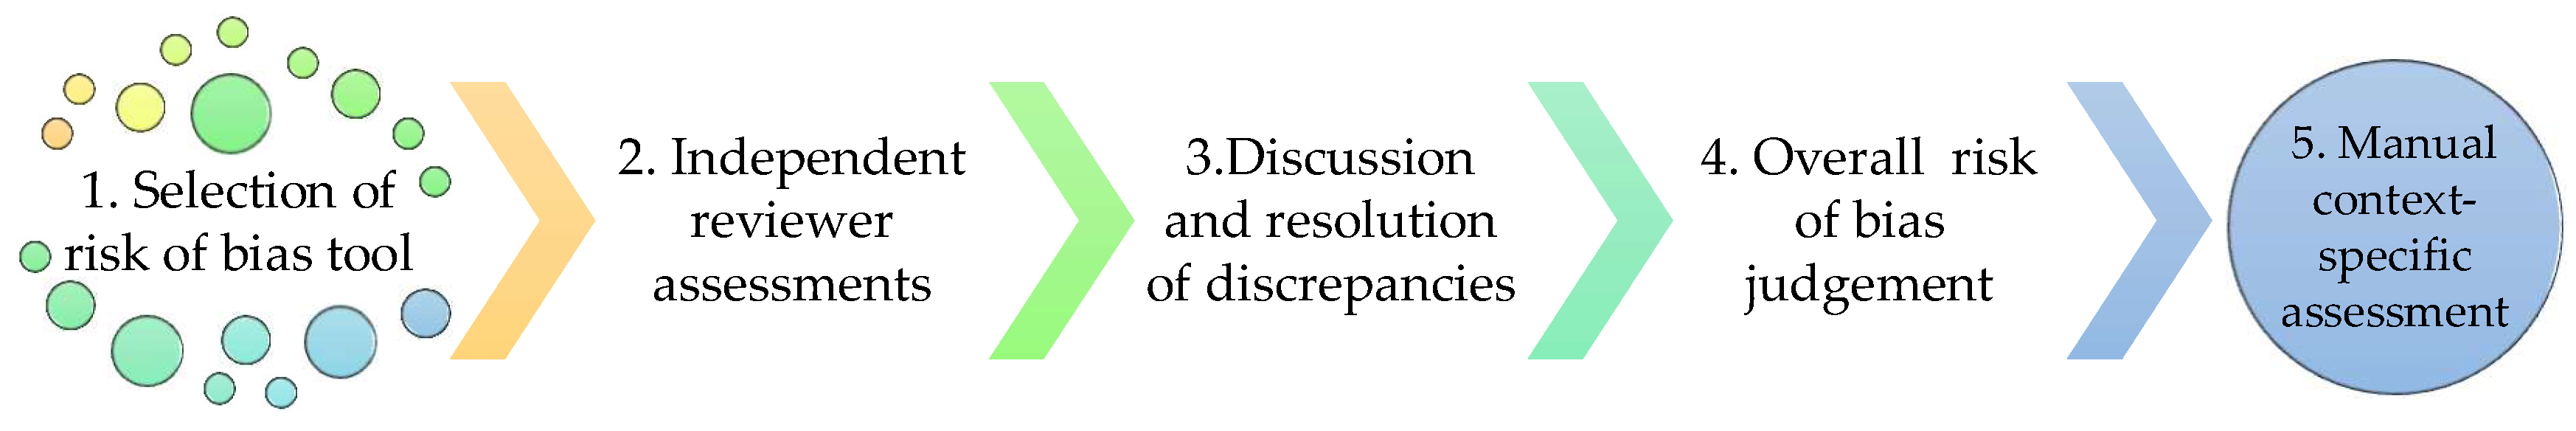
Figure 7.
Effect Measures Process.
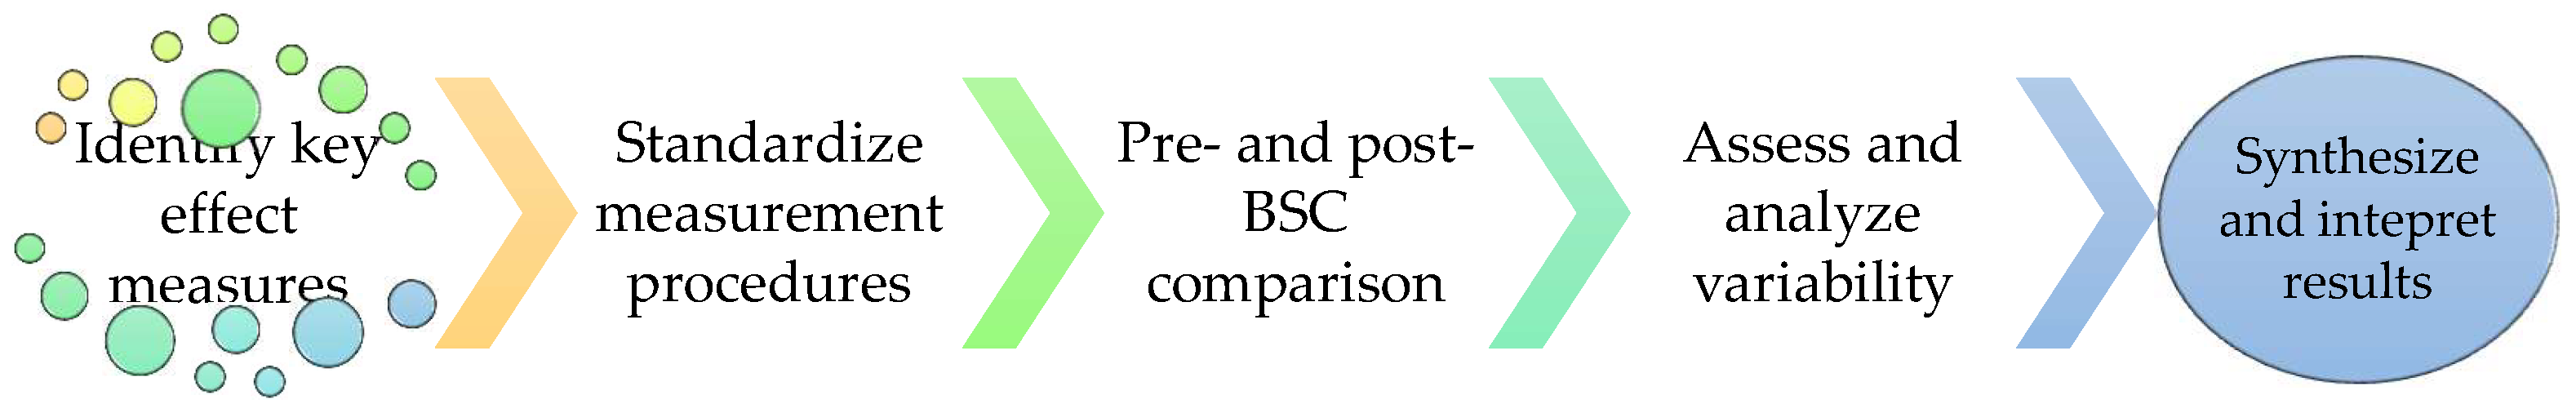
Figure 8.
Process of Synthesis Methods.
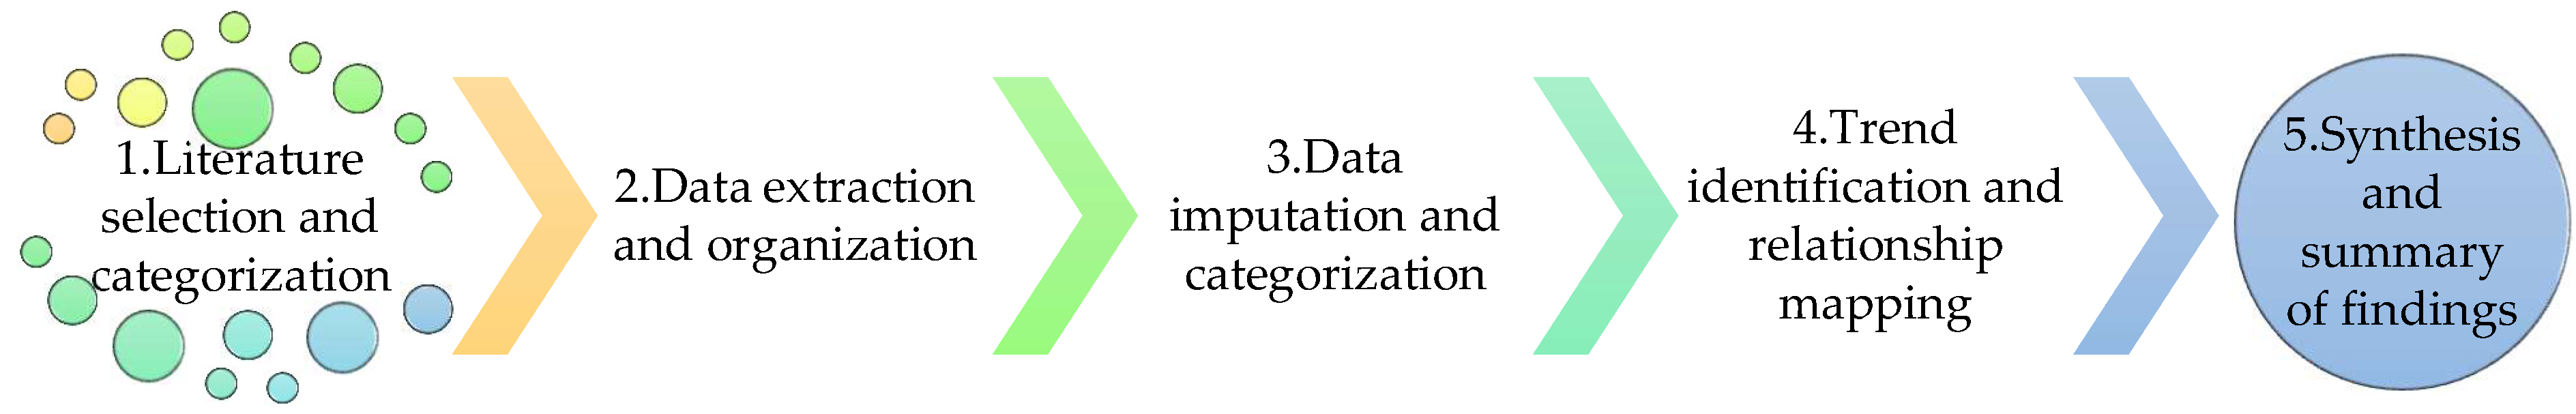
Figure 9.
Method of Reporting Bias.
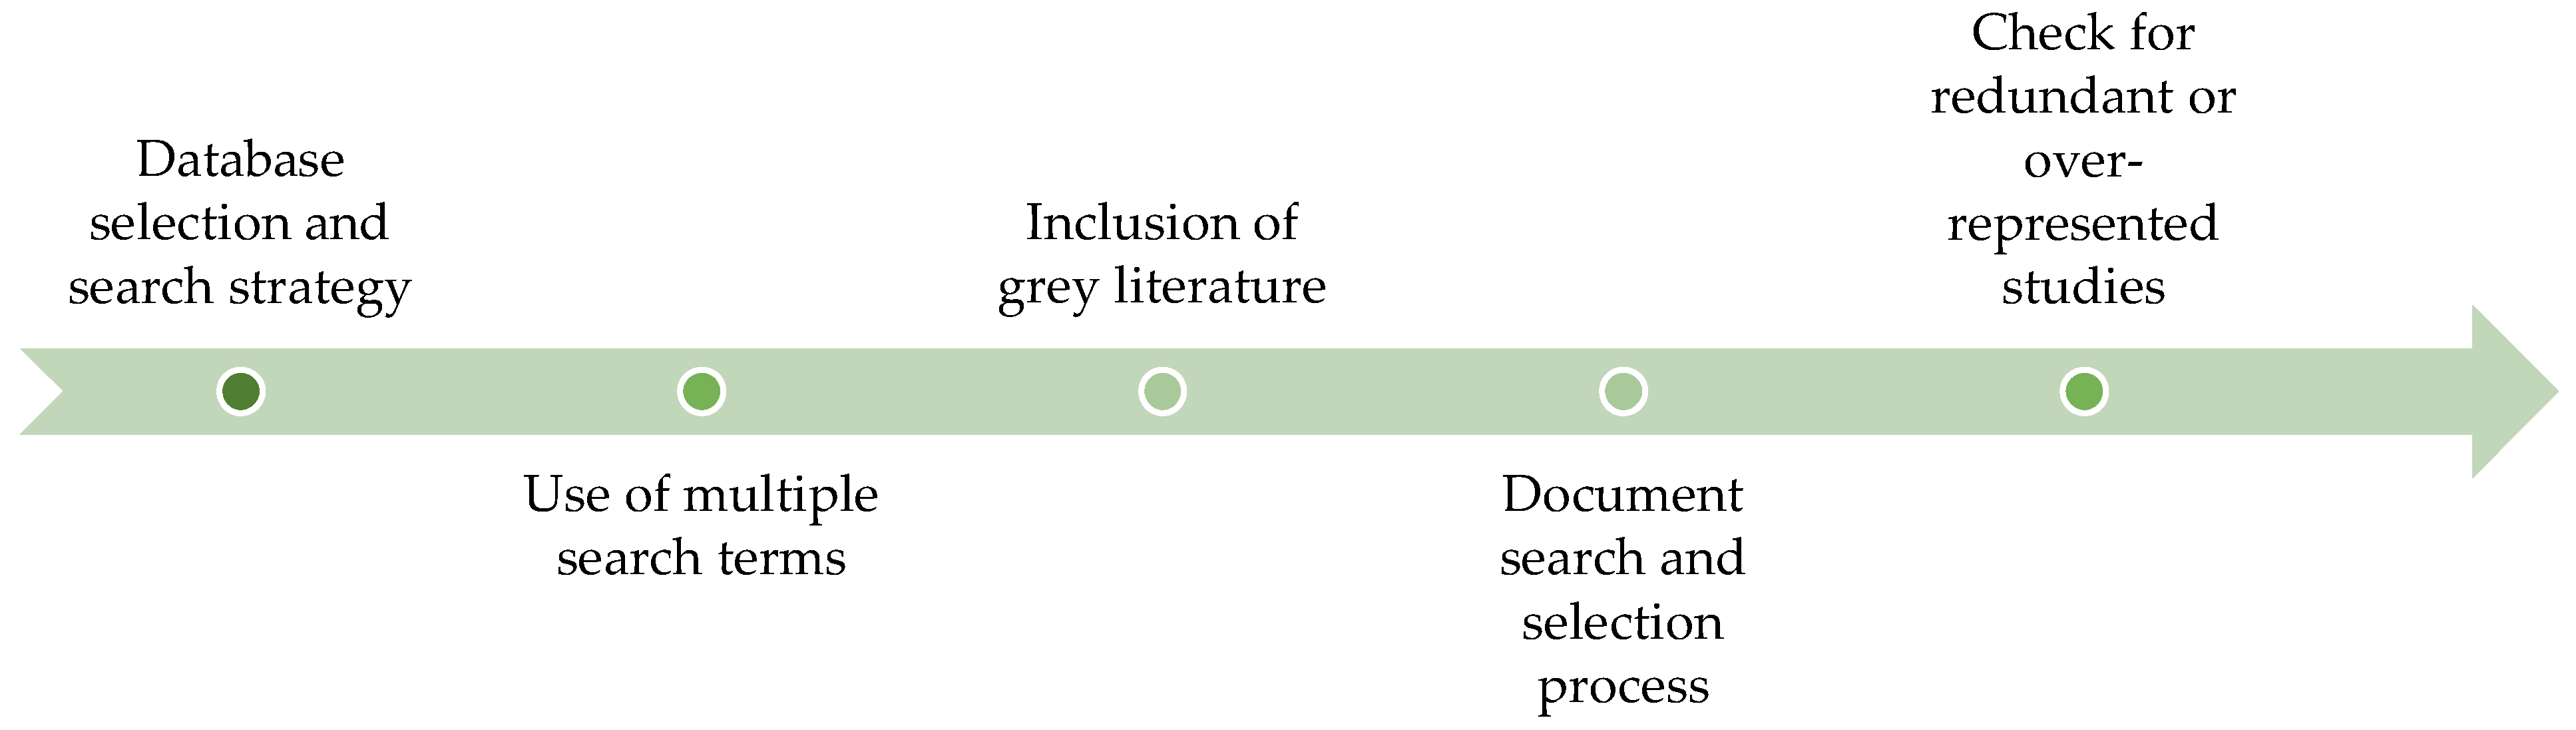
Figure 10.
Certainty of Assessment Process.
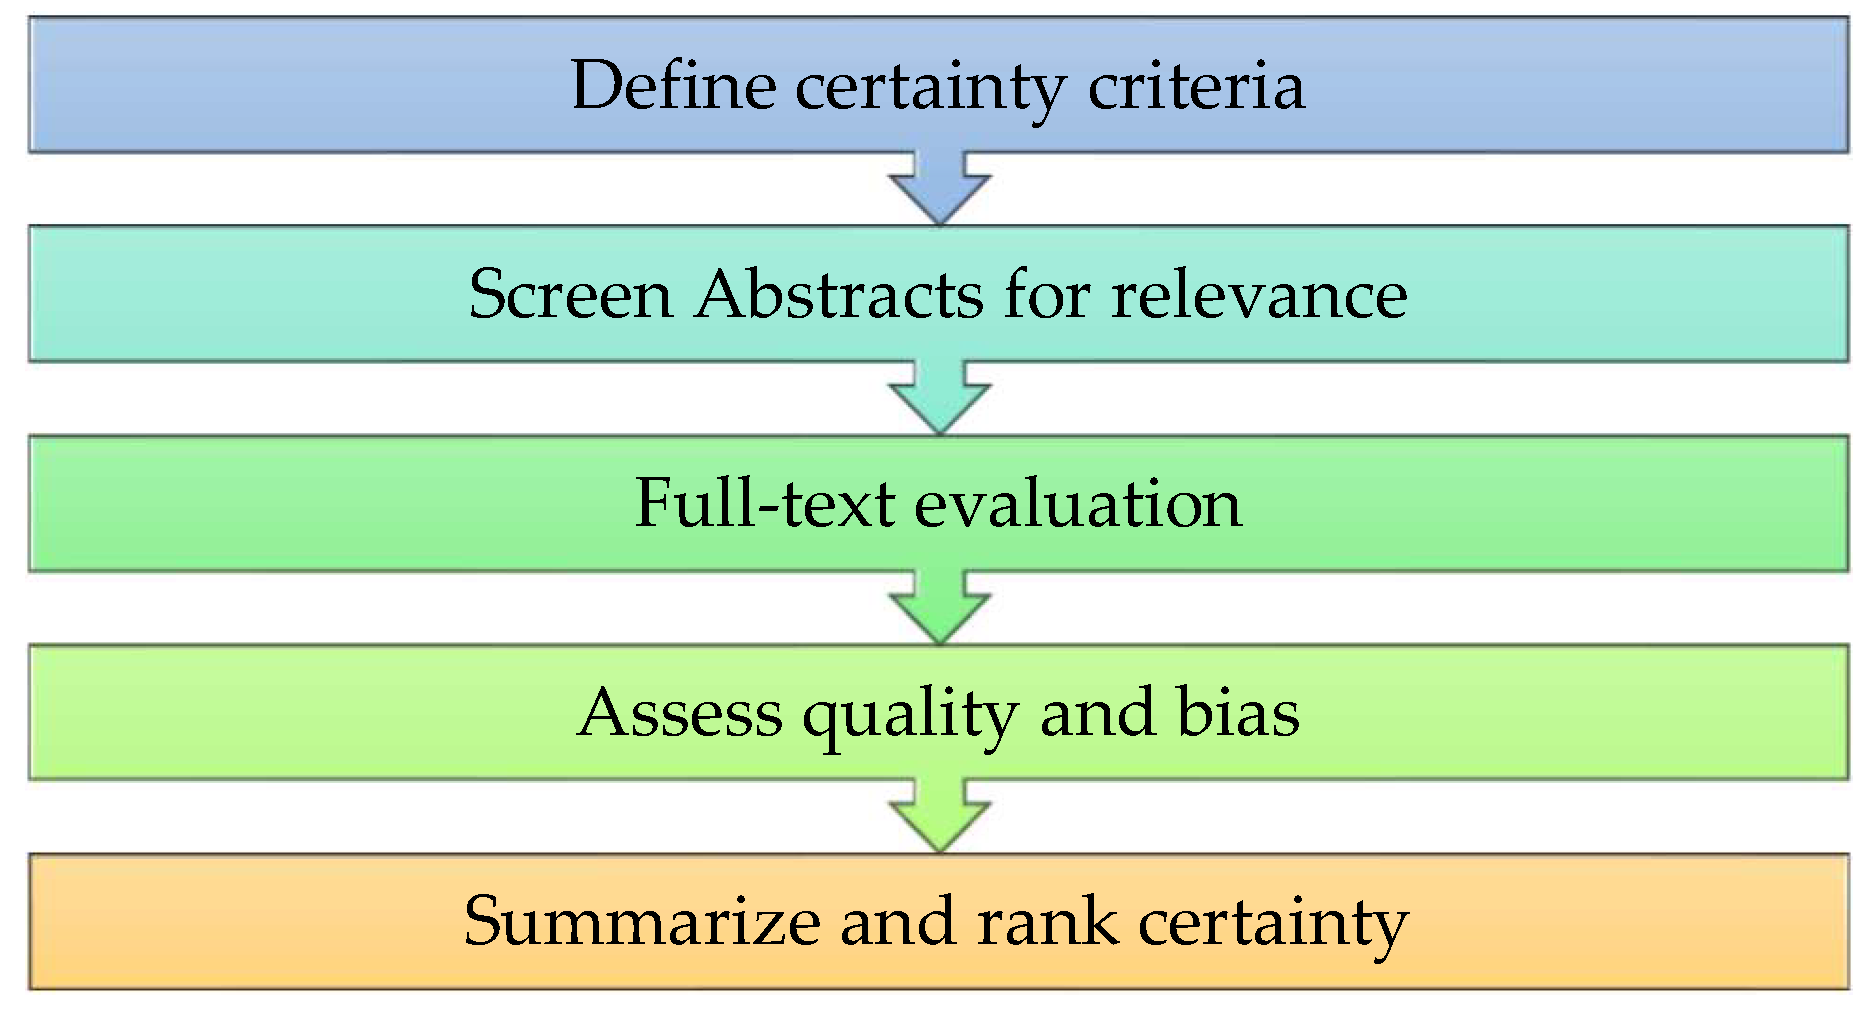
Figure 11.
Proposed PRISMA Flowchart.
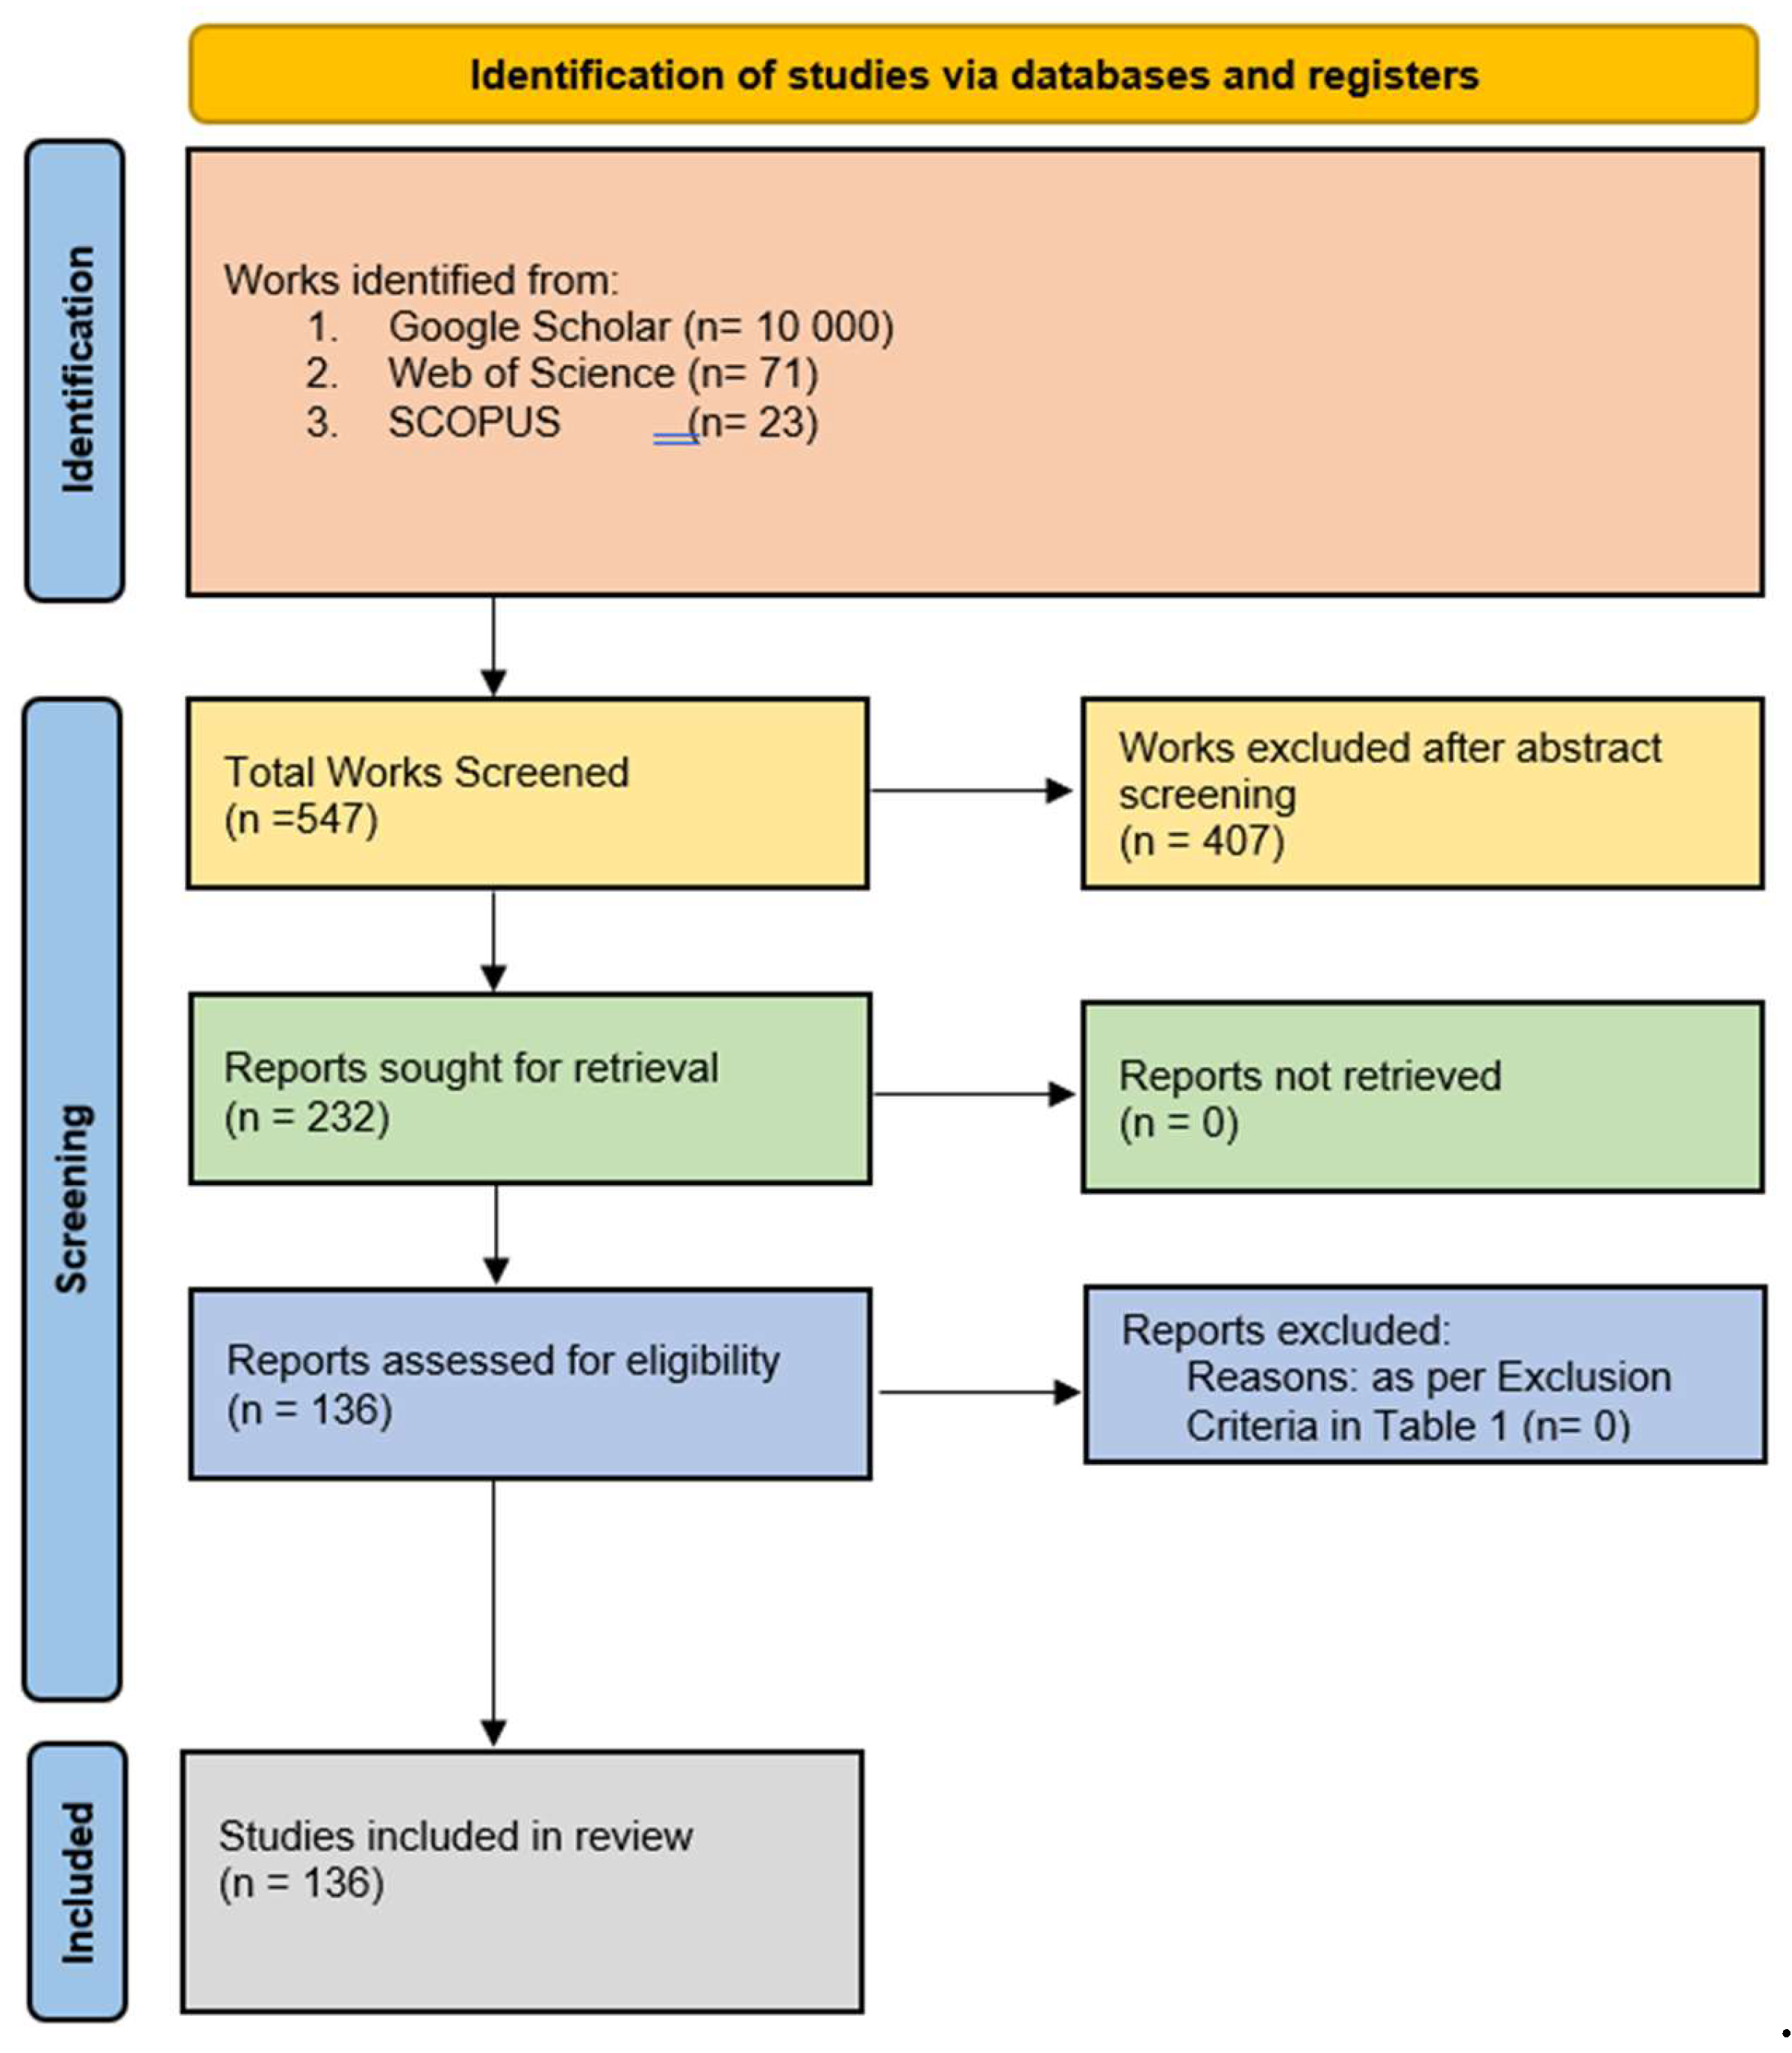
Figure 12.
Online Databases.
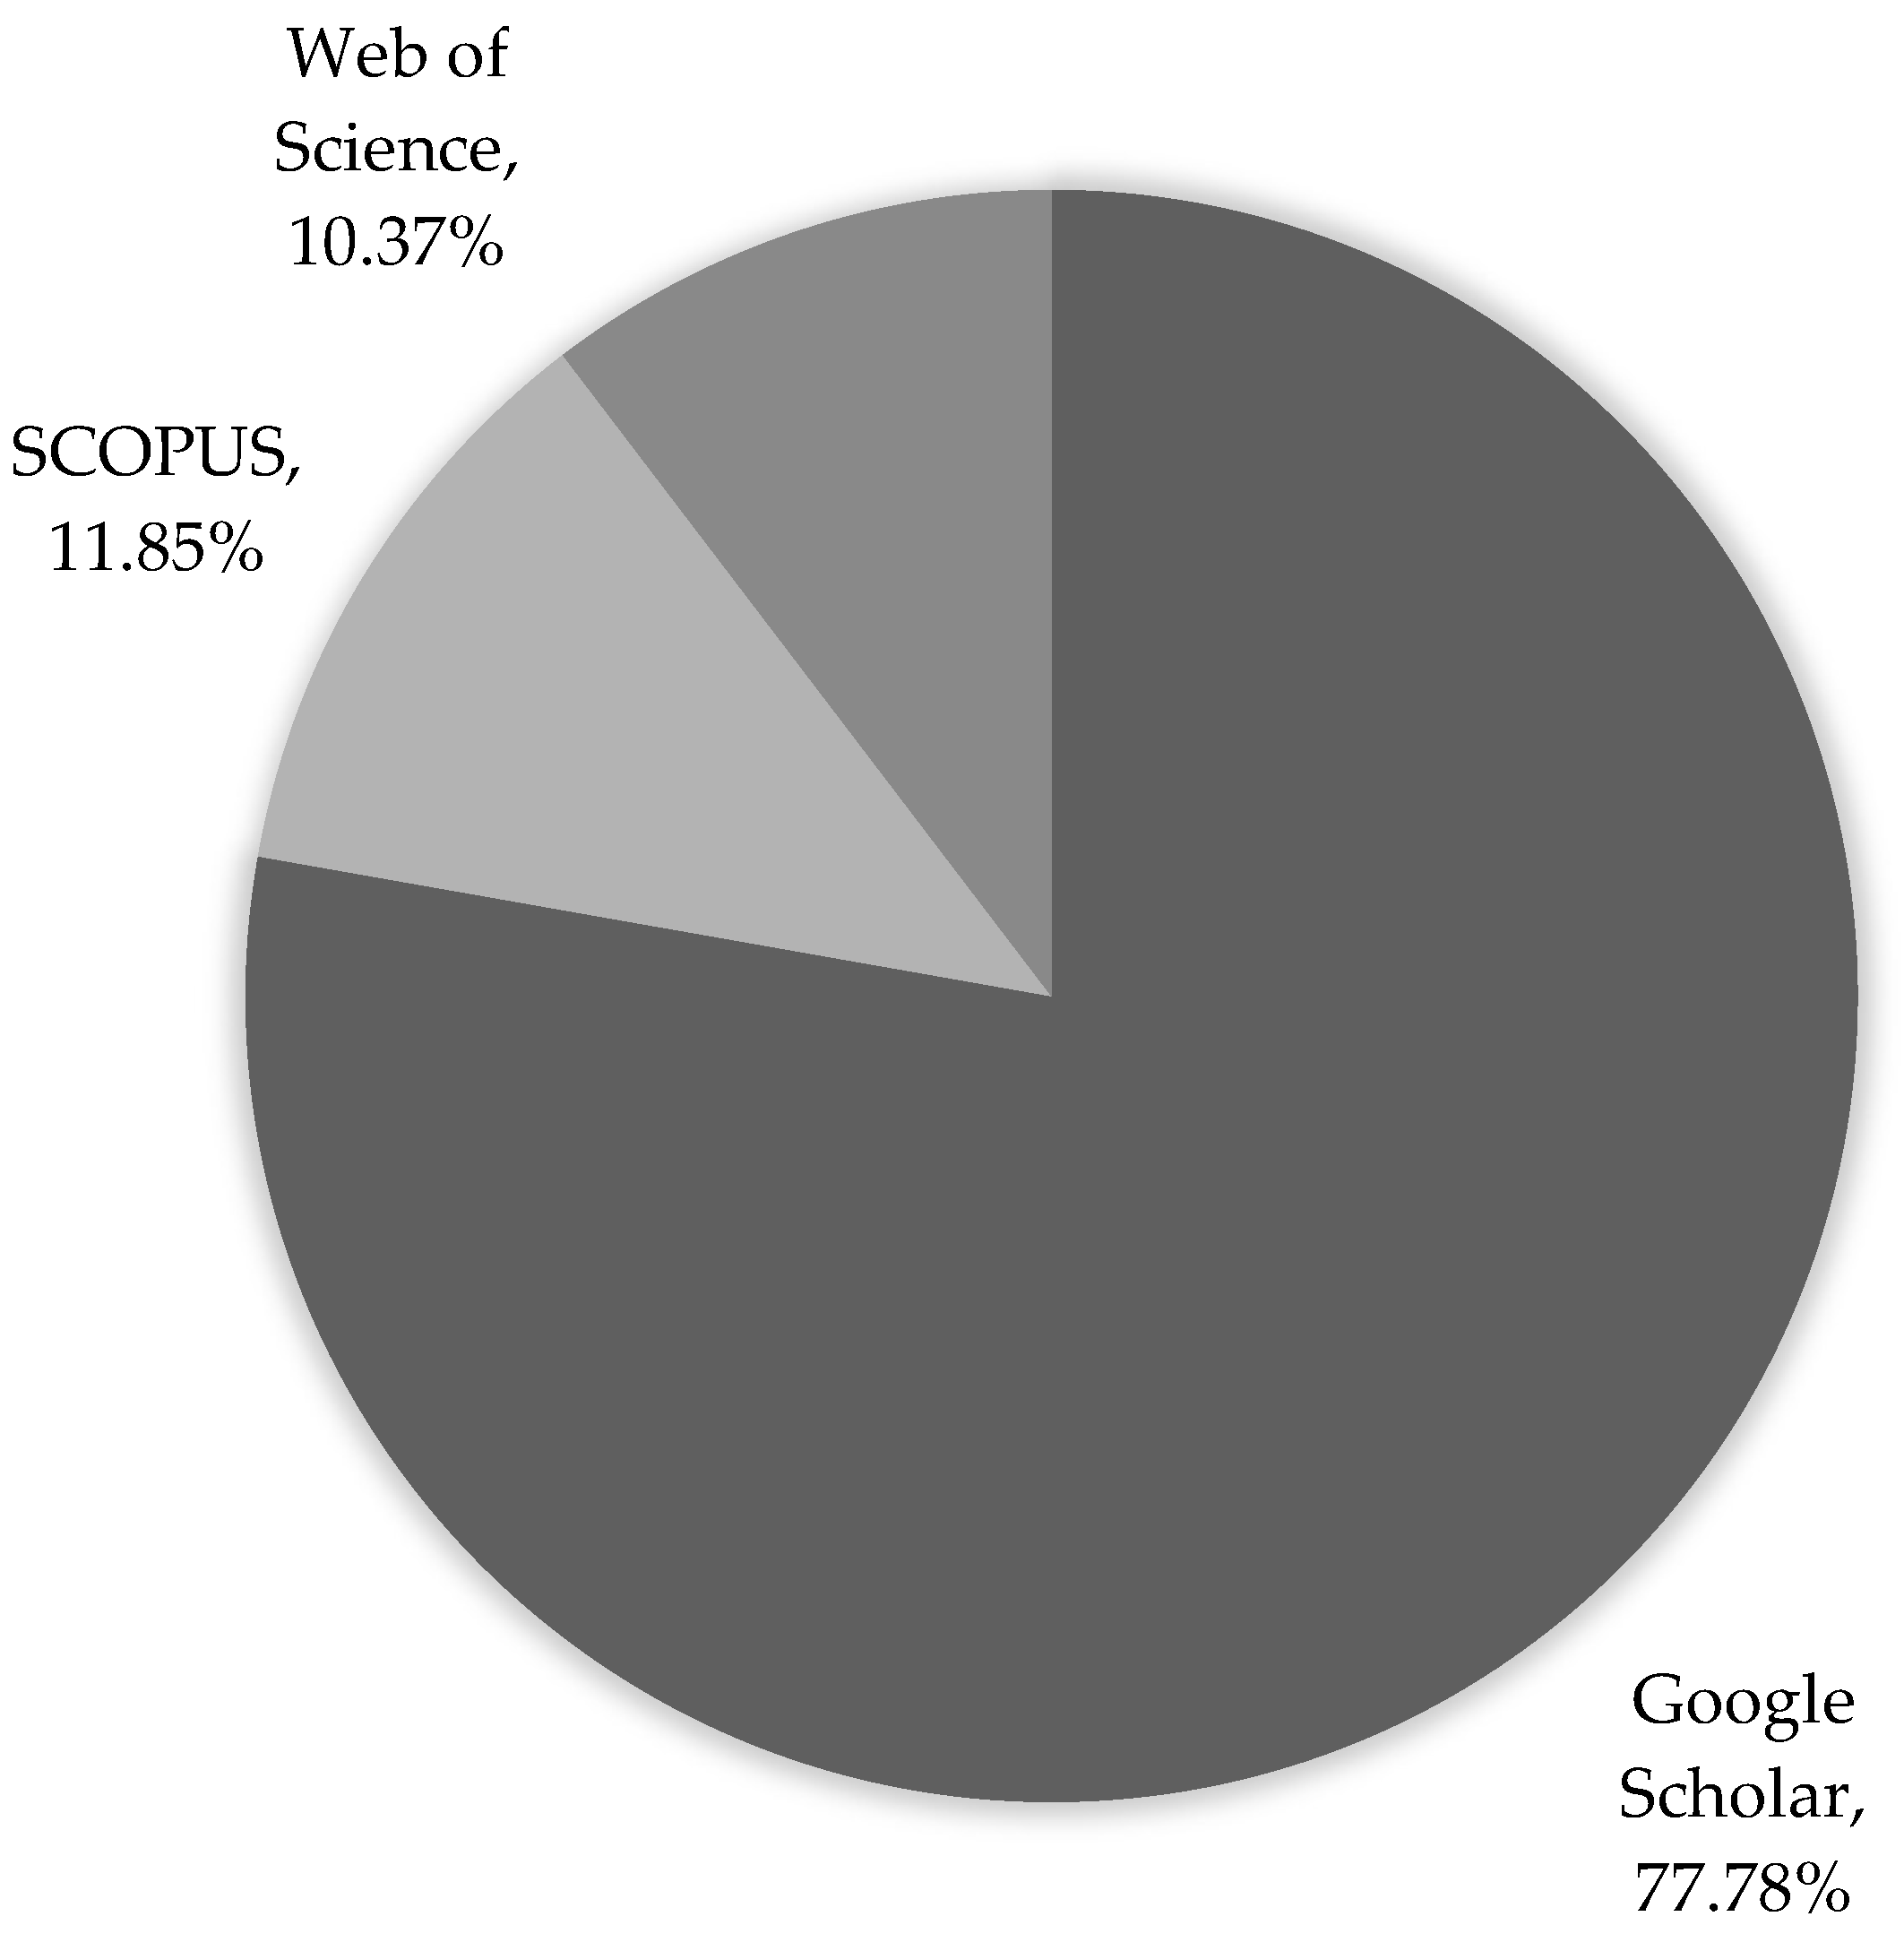
Figure 13.
Year of Publication.
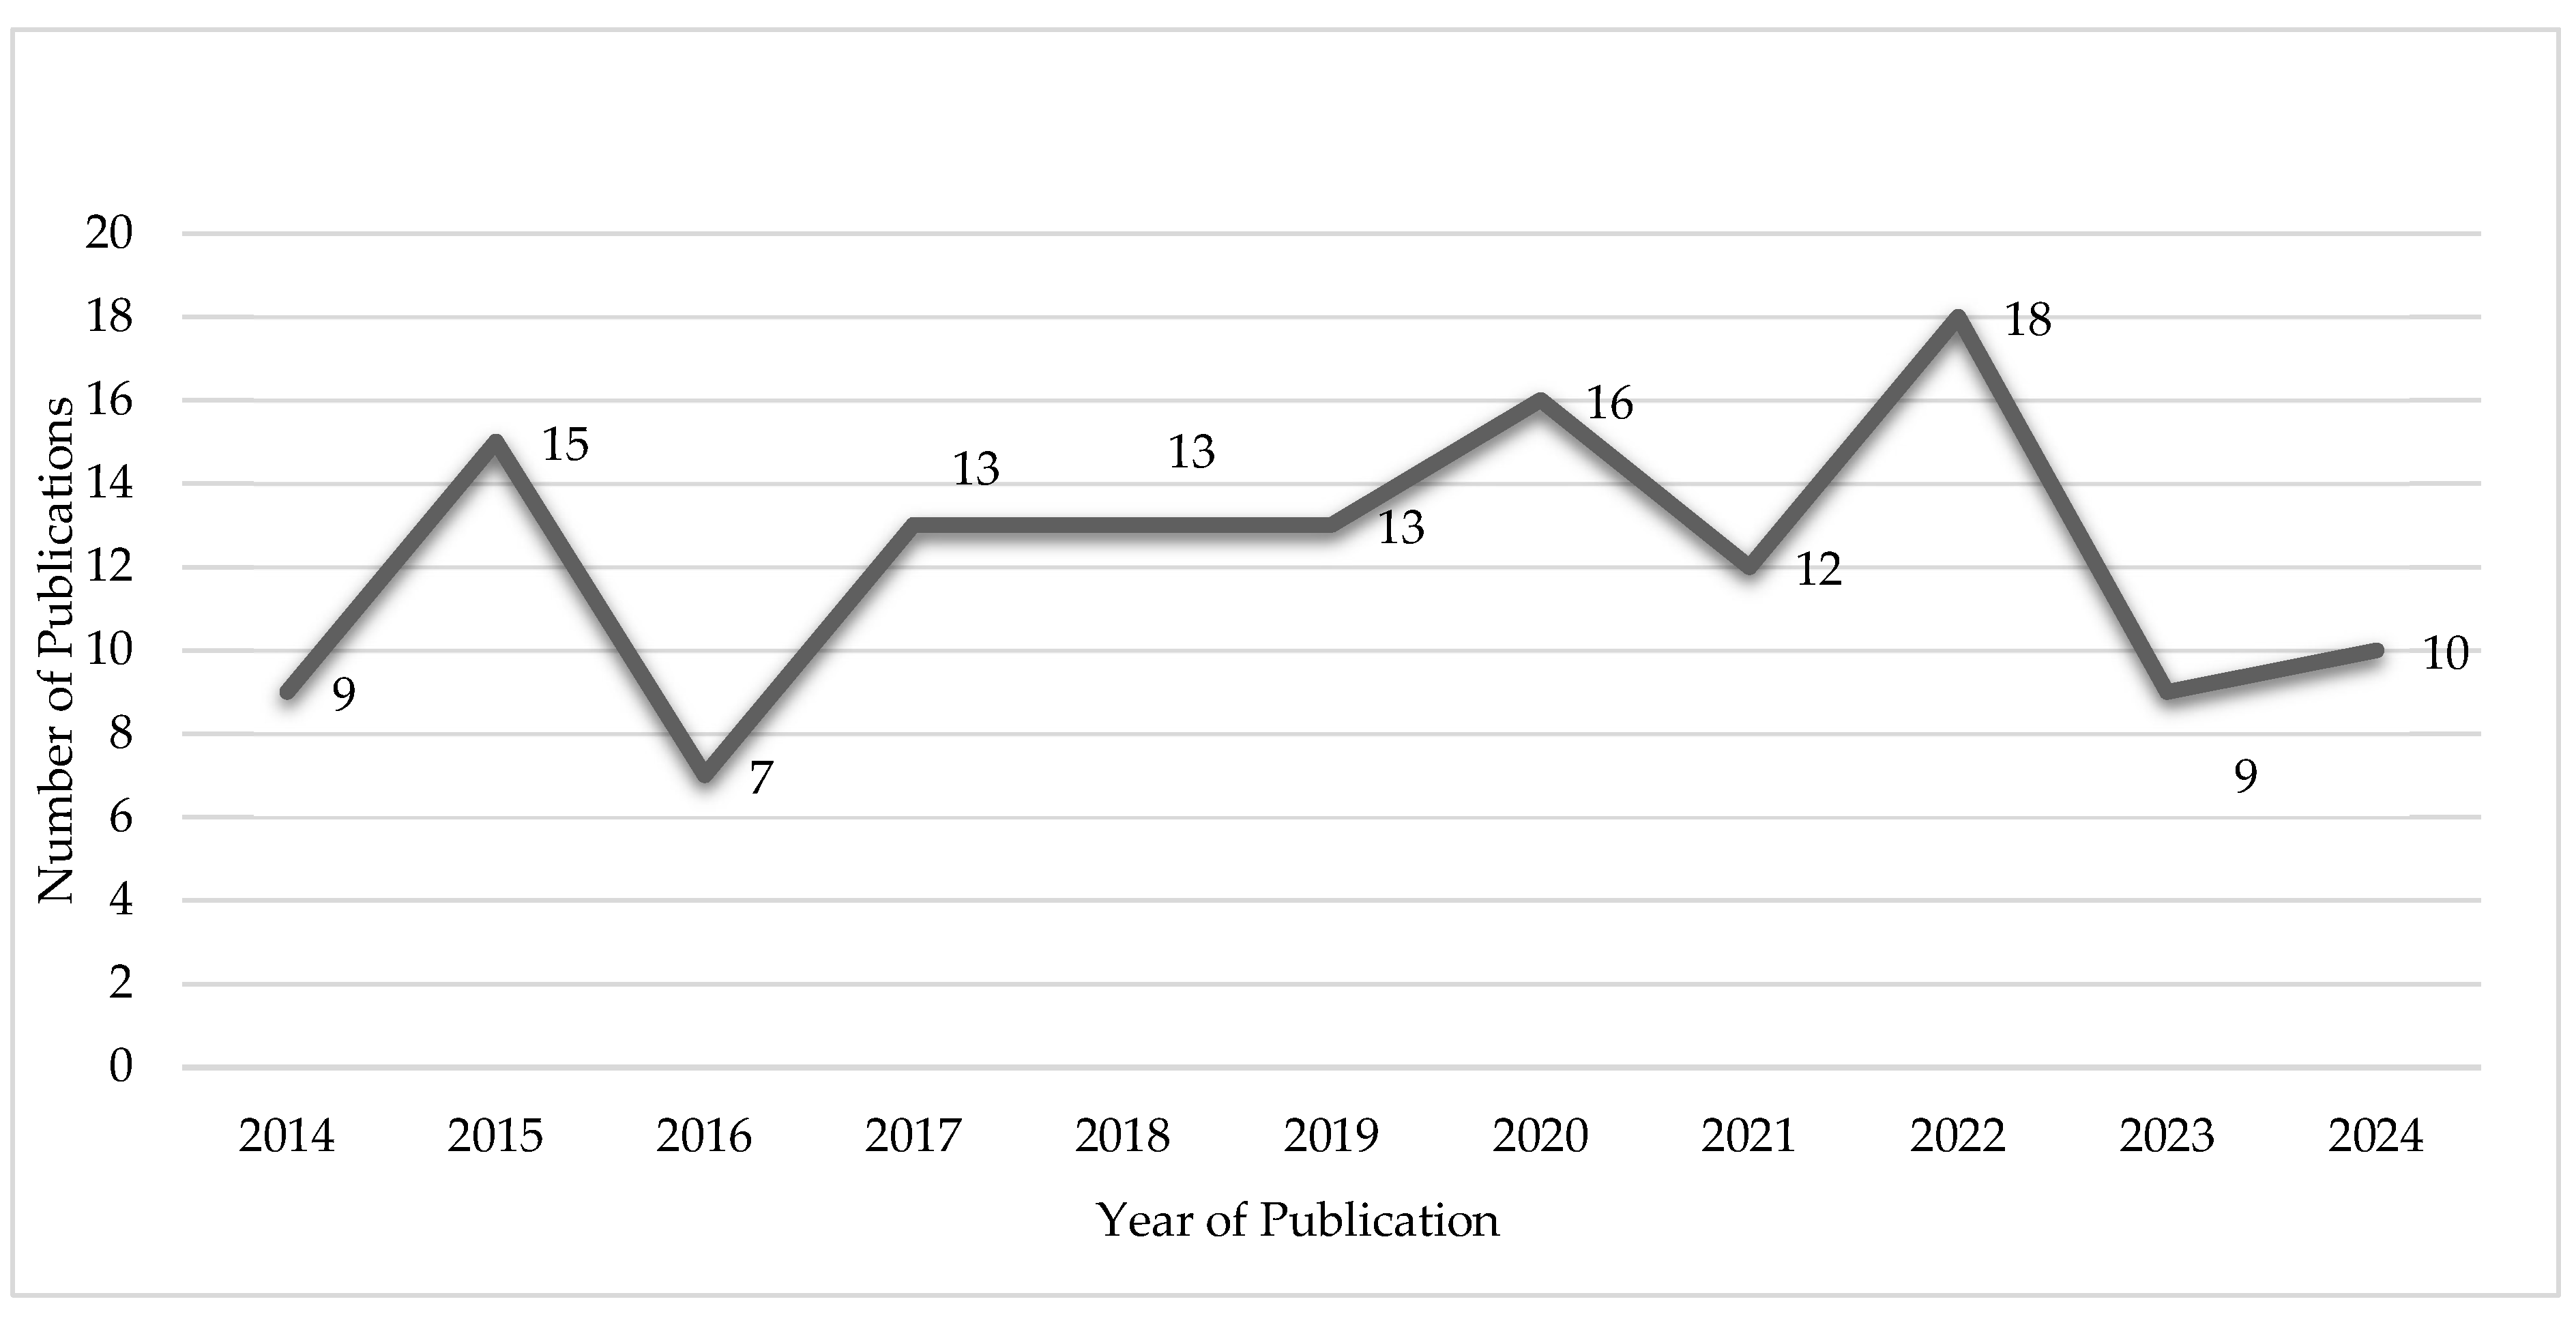
Figure 25.
Balanced Scorecard Metrics.
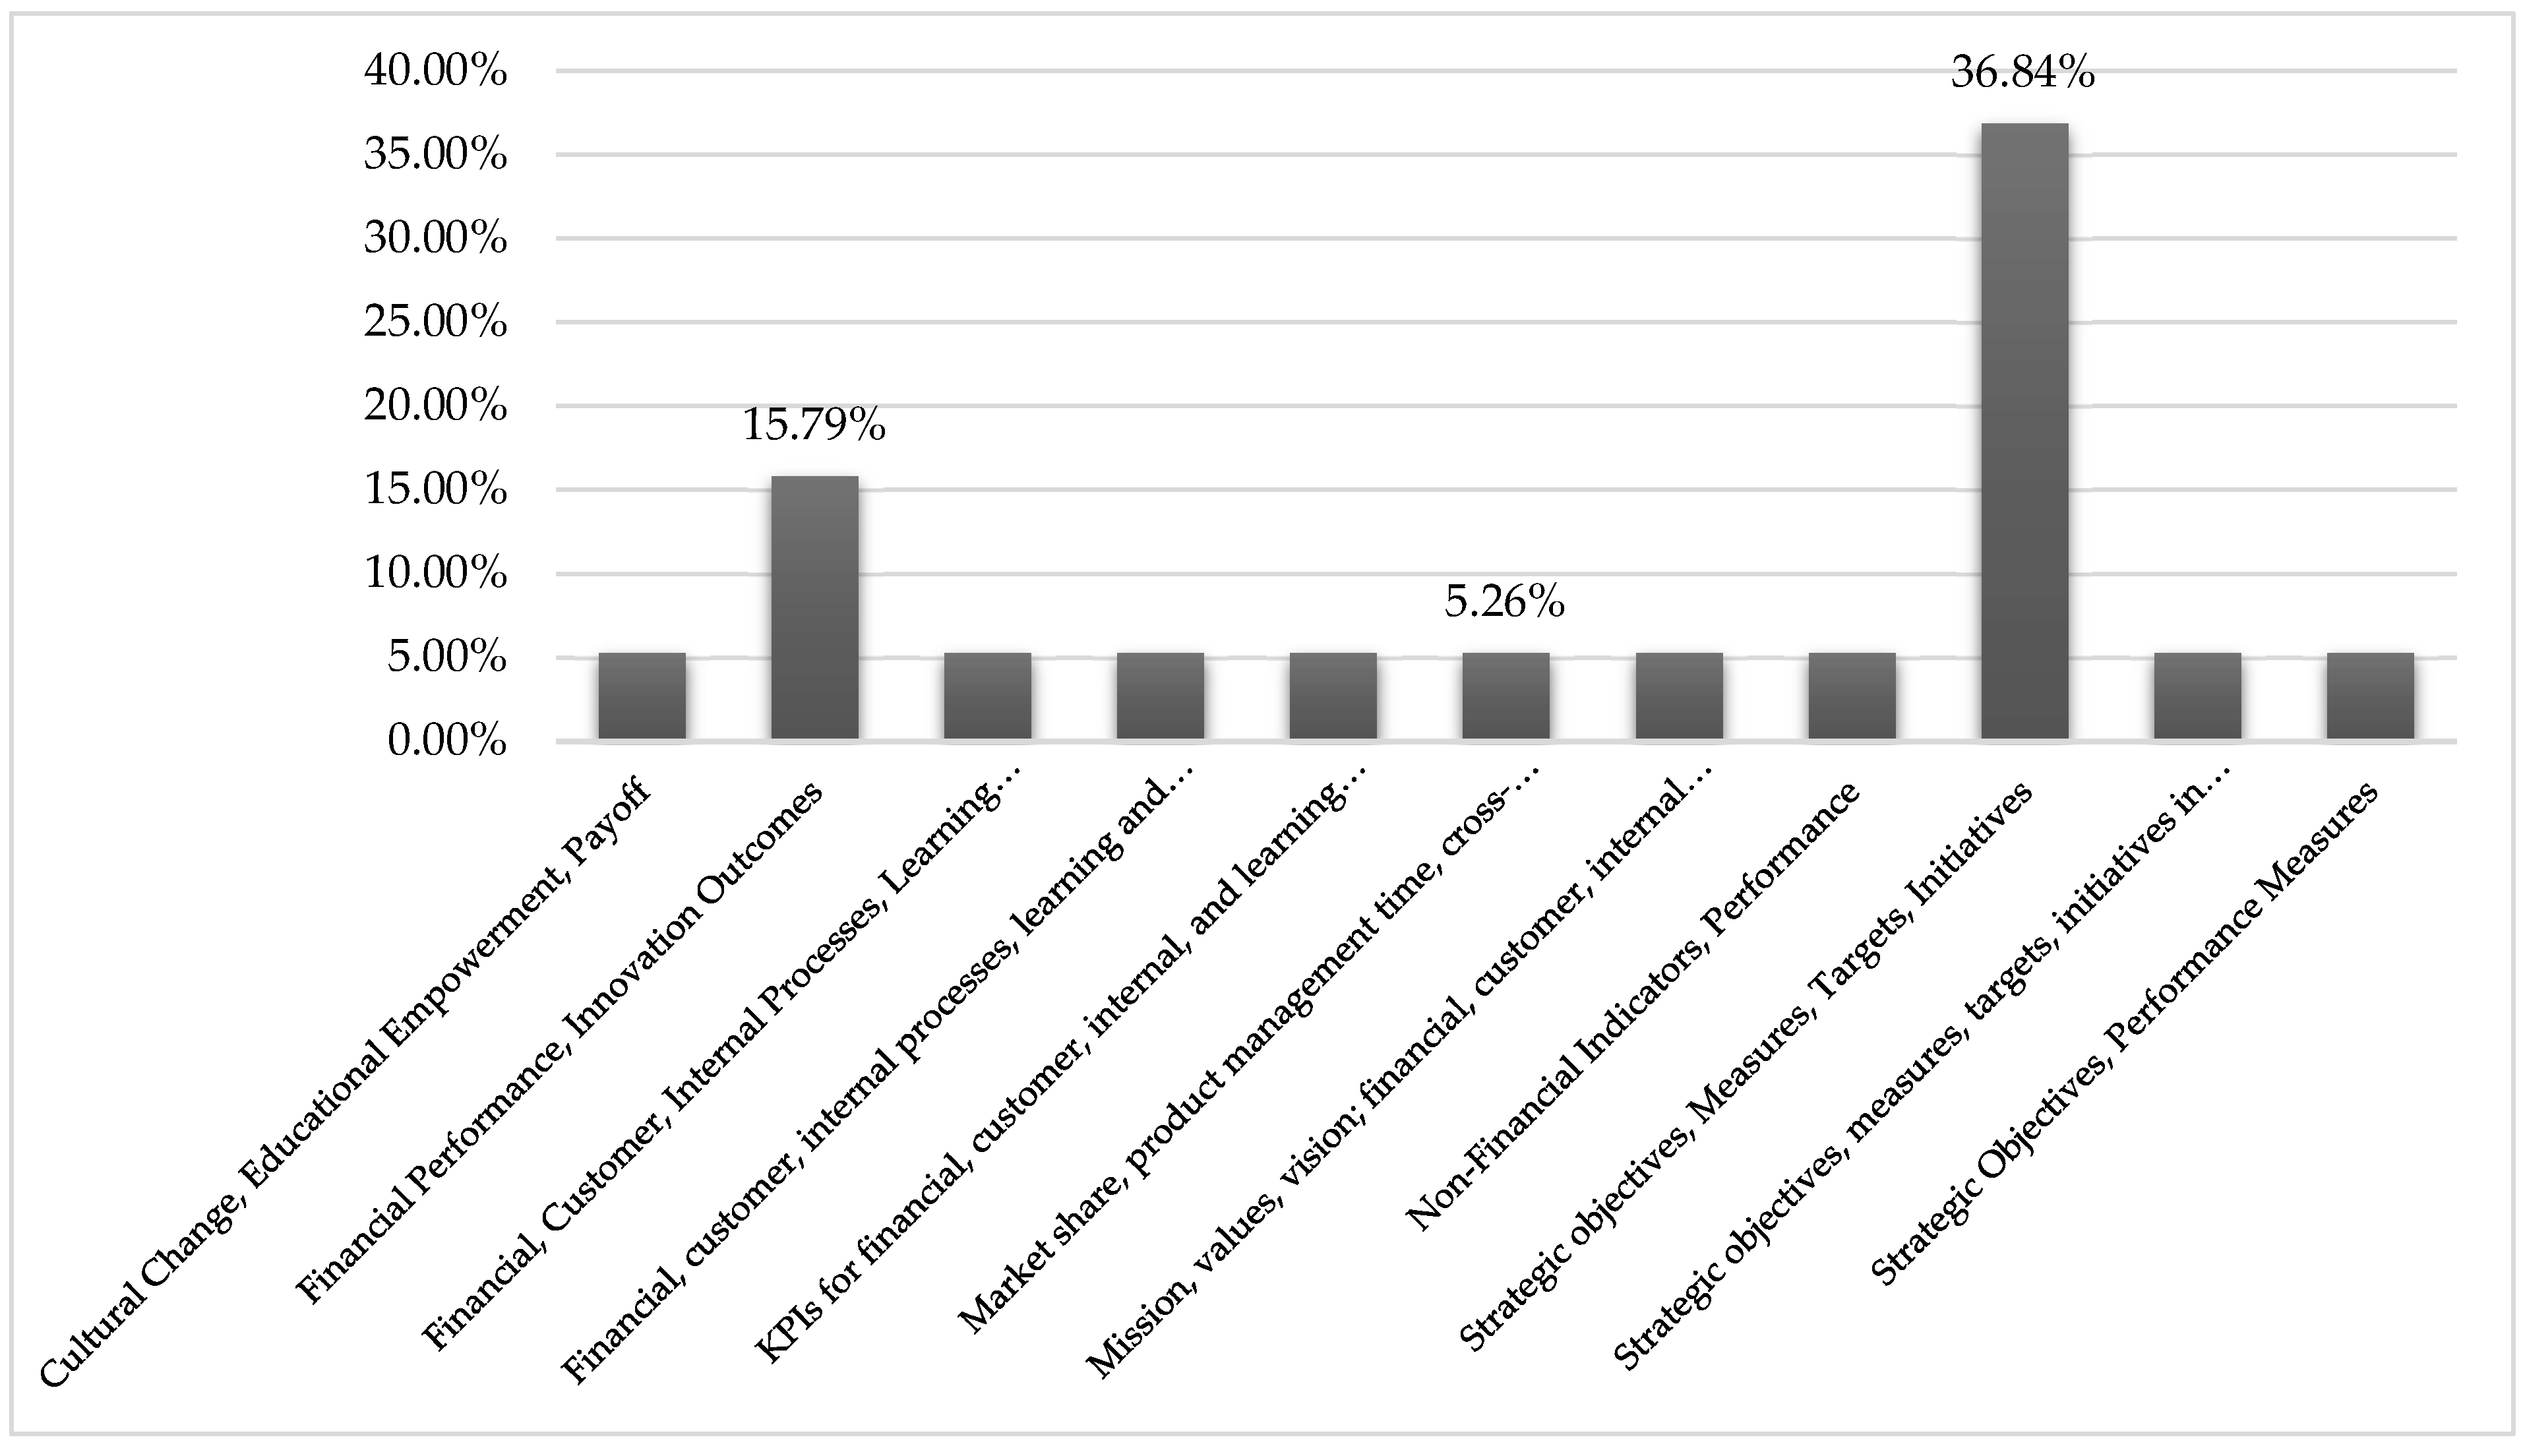
Figure 26.
Organizational Outcomes.
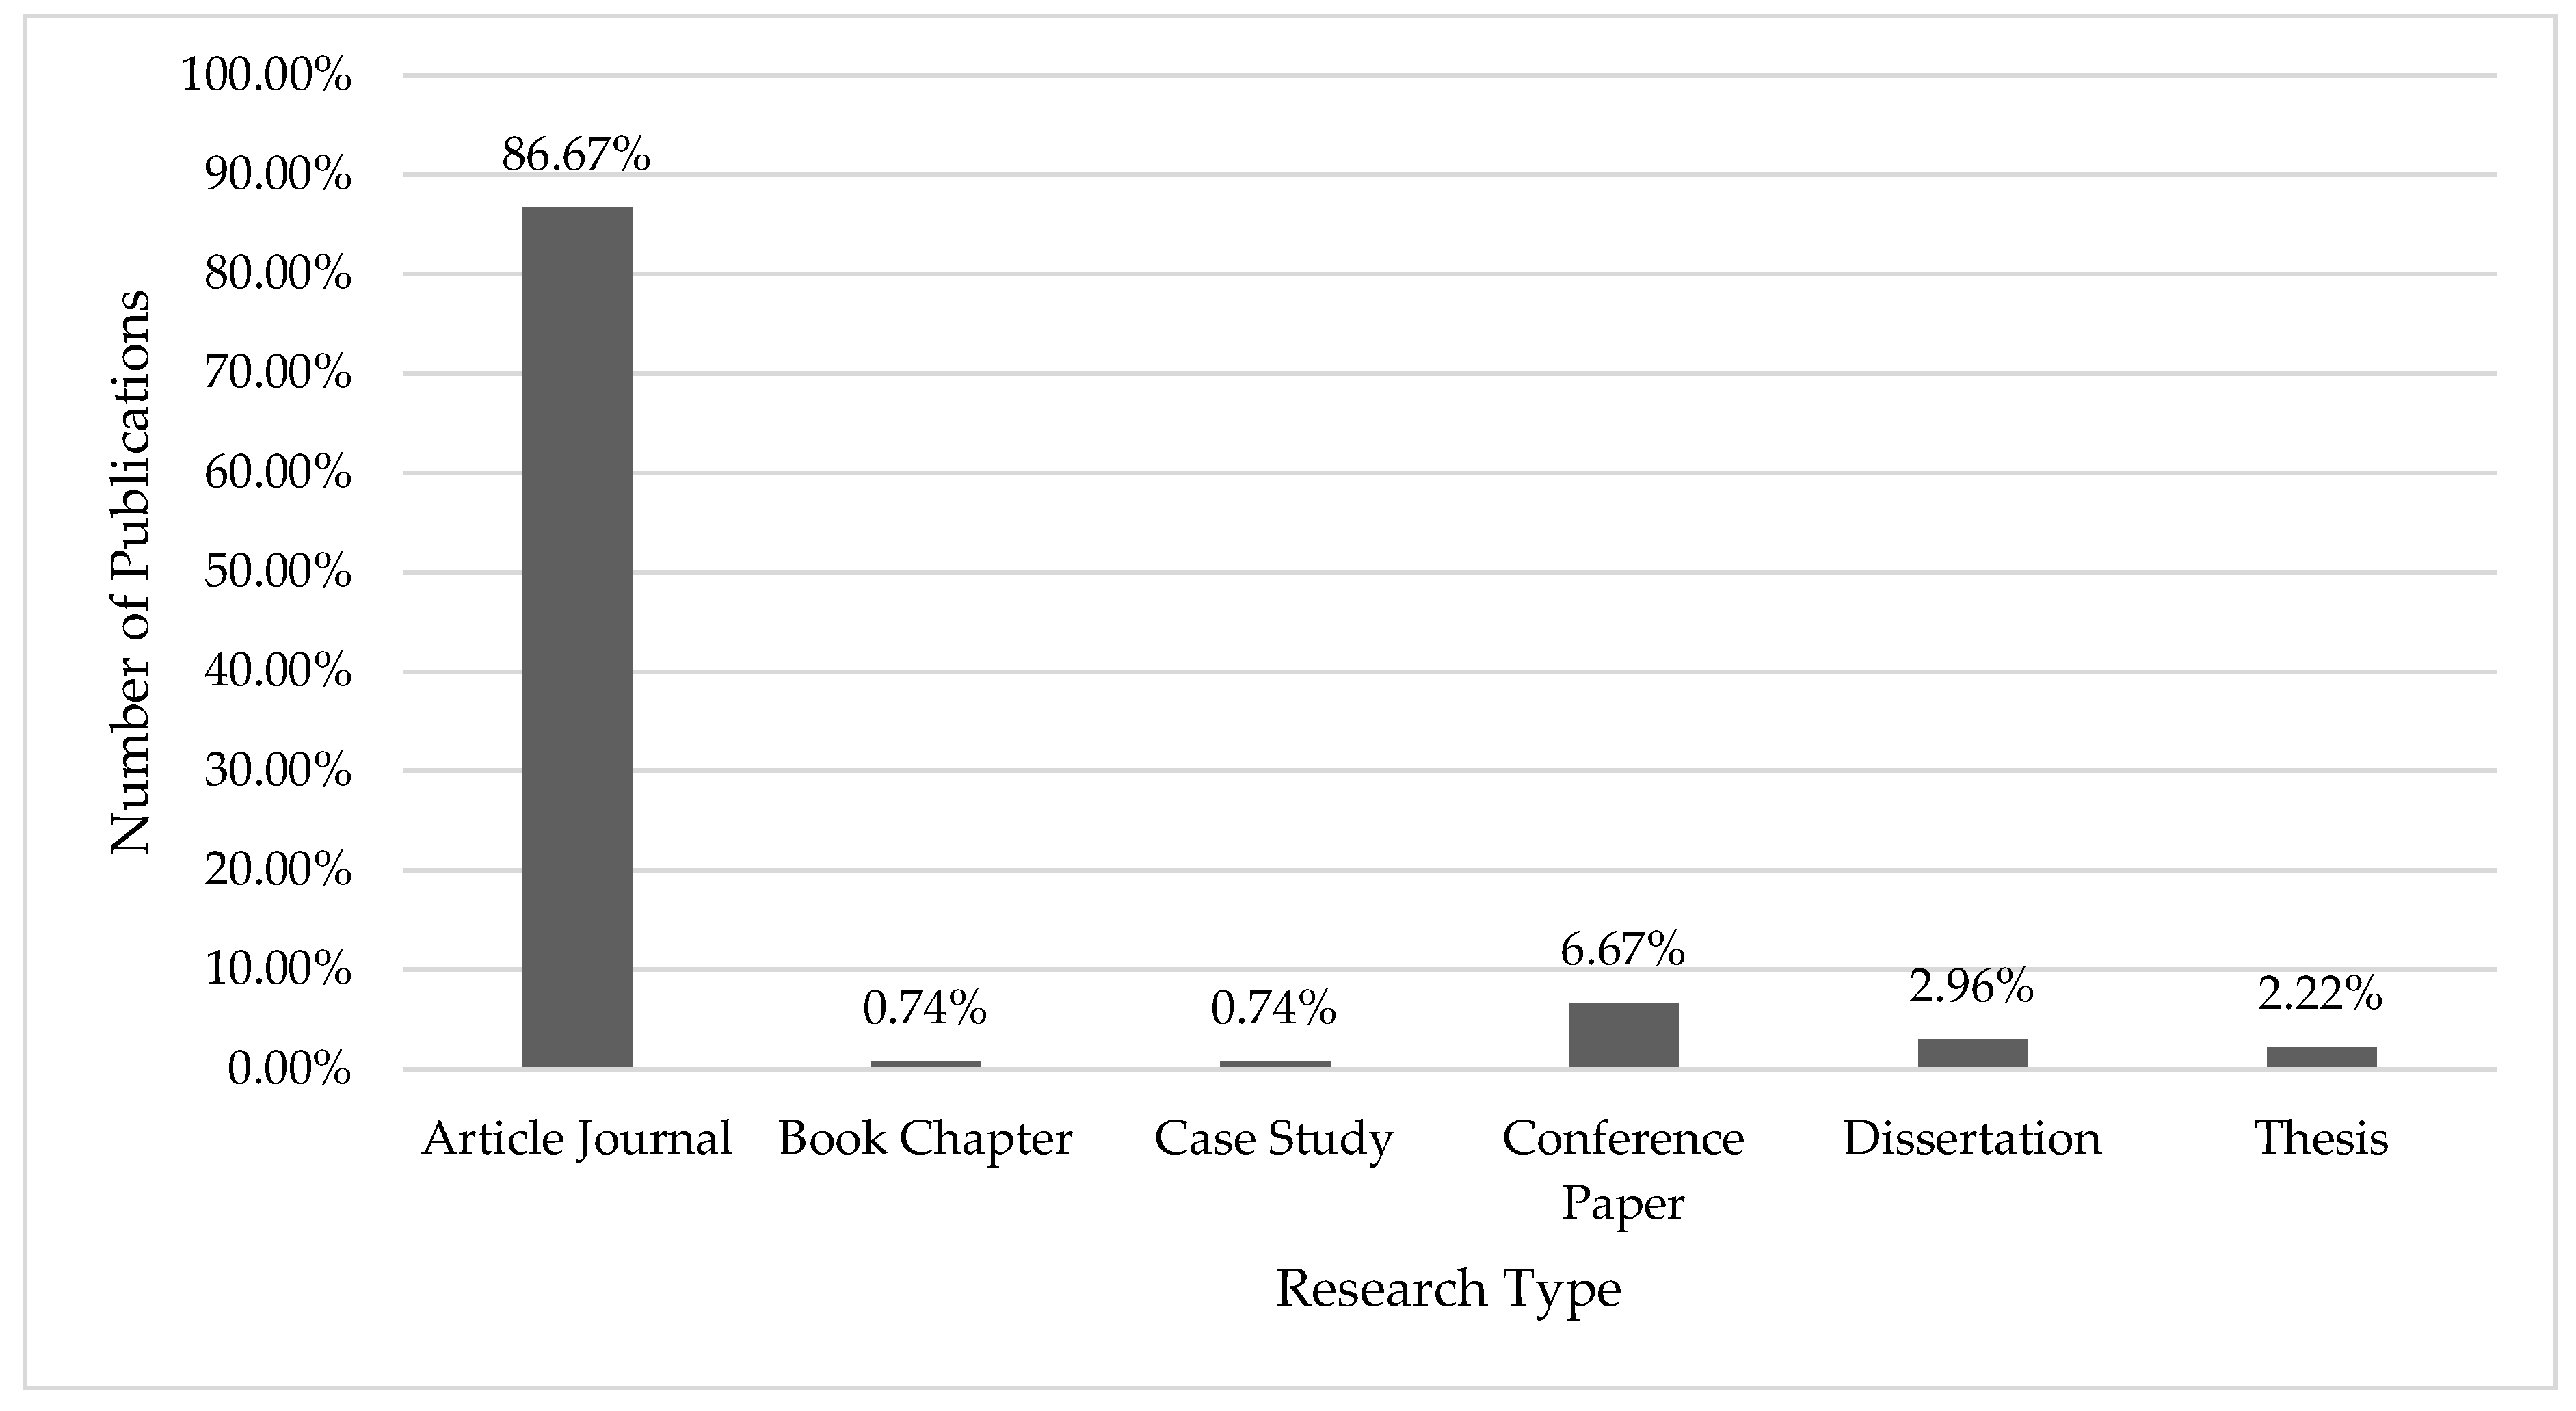
Figure 27.
Distribution of Study Types.
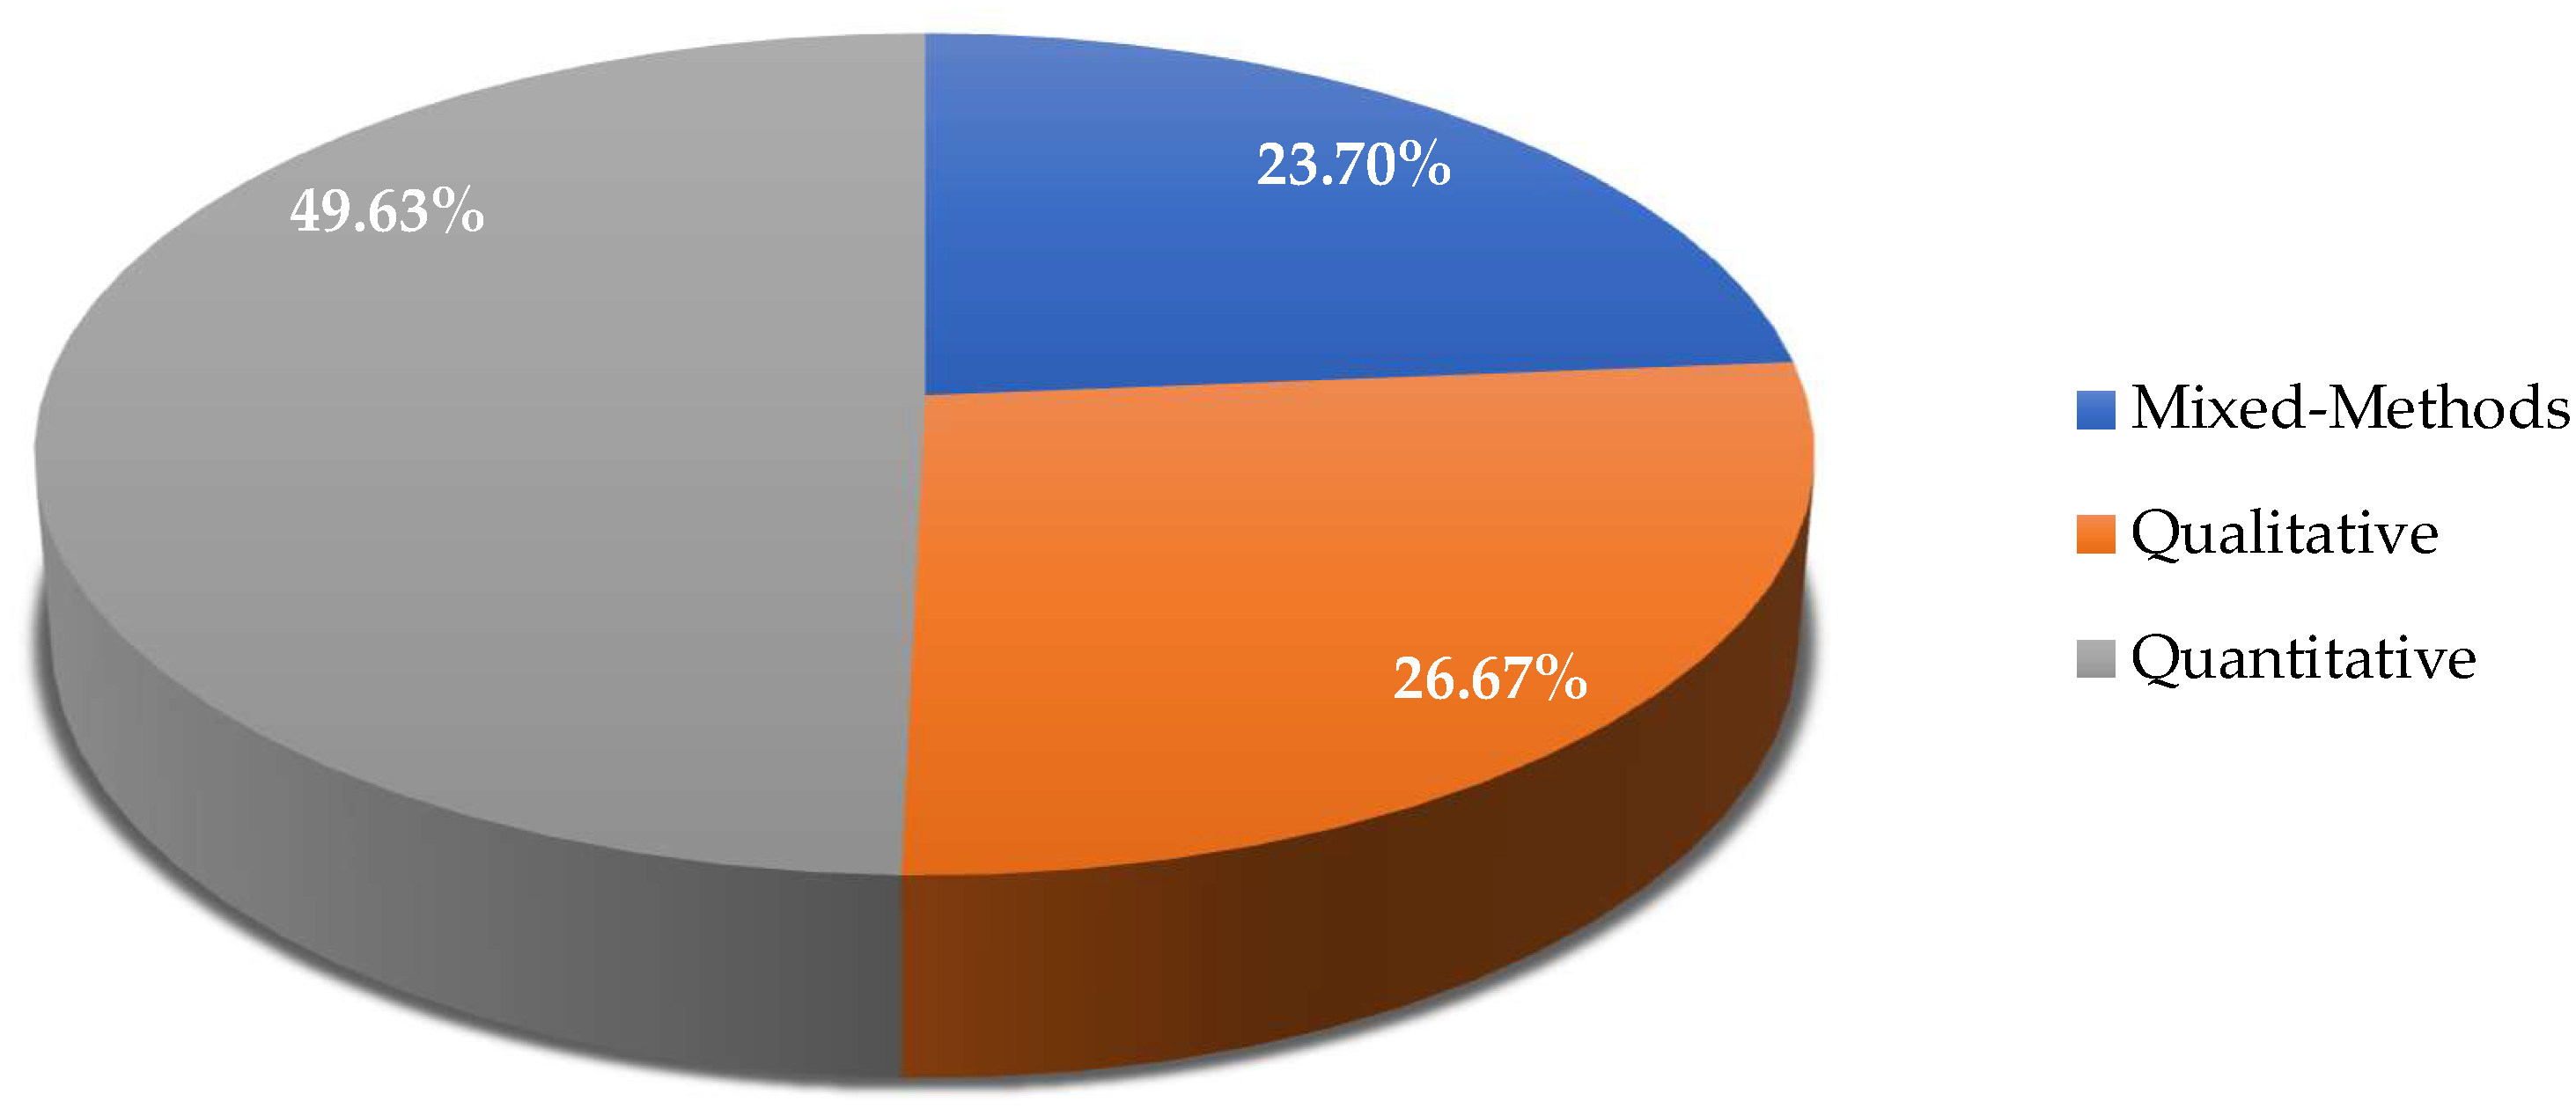
Figure 28.
Long-Term Impacts.

Figure 29.
Business Performance Metrics.
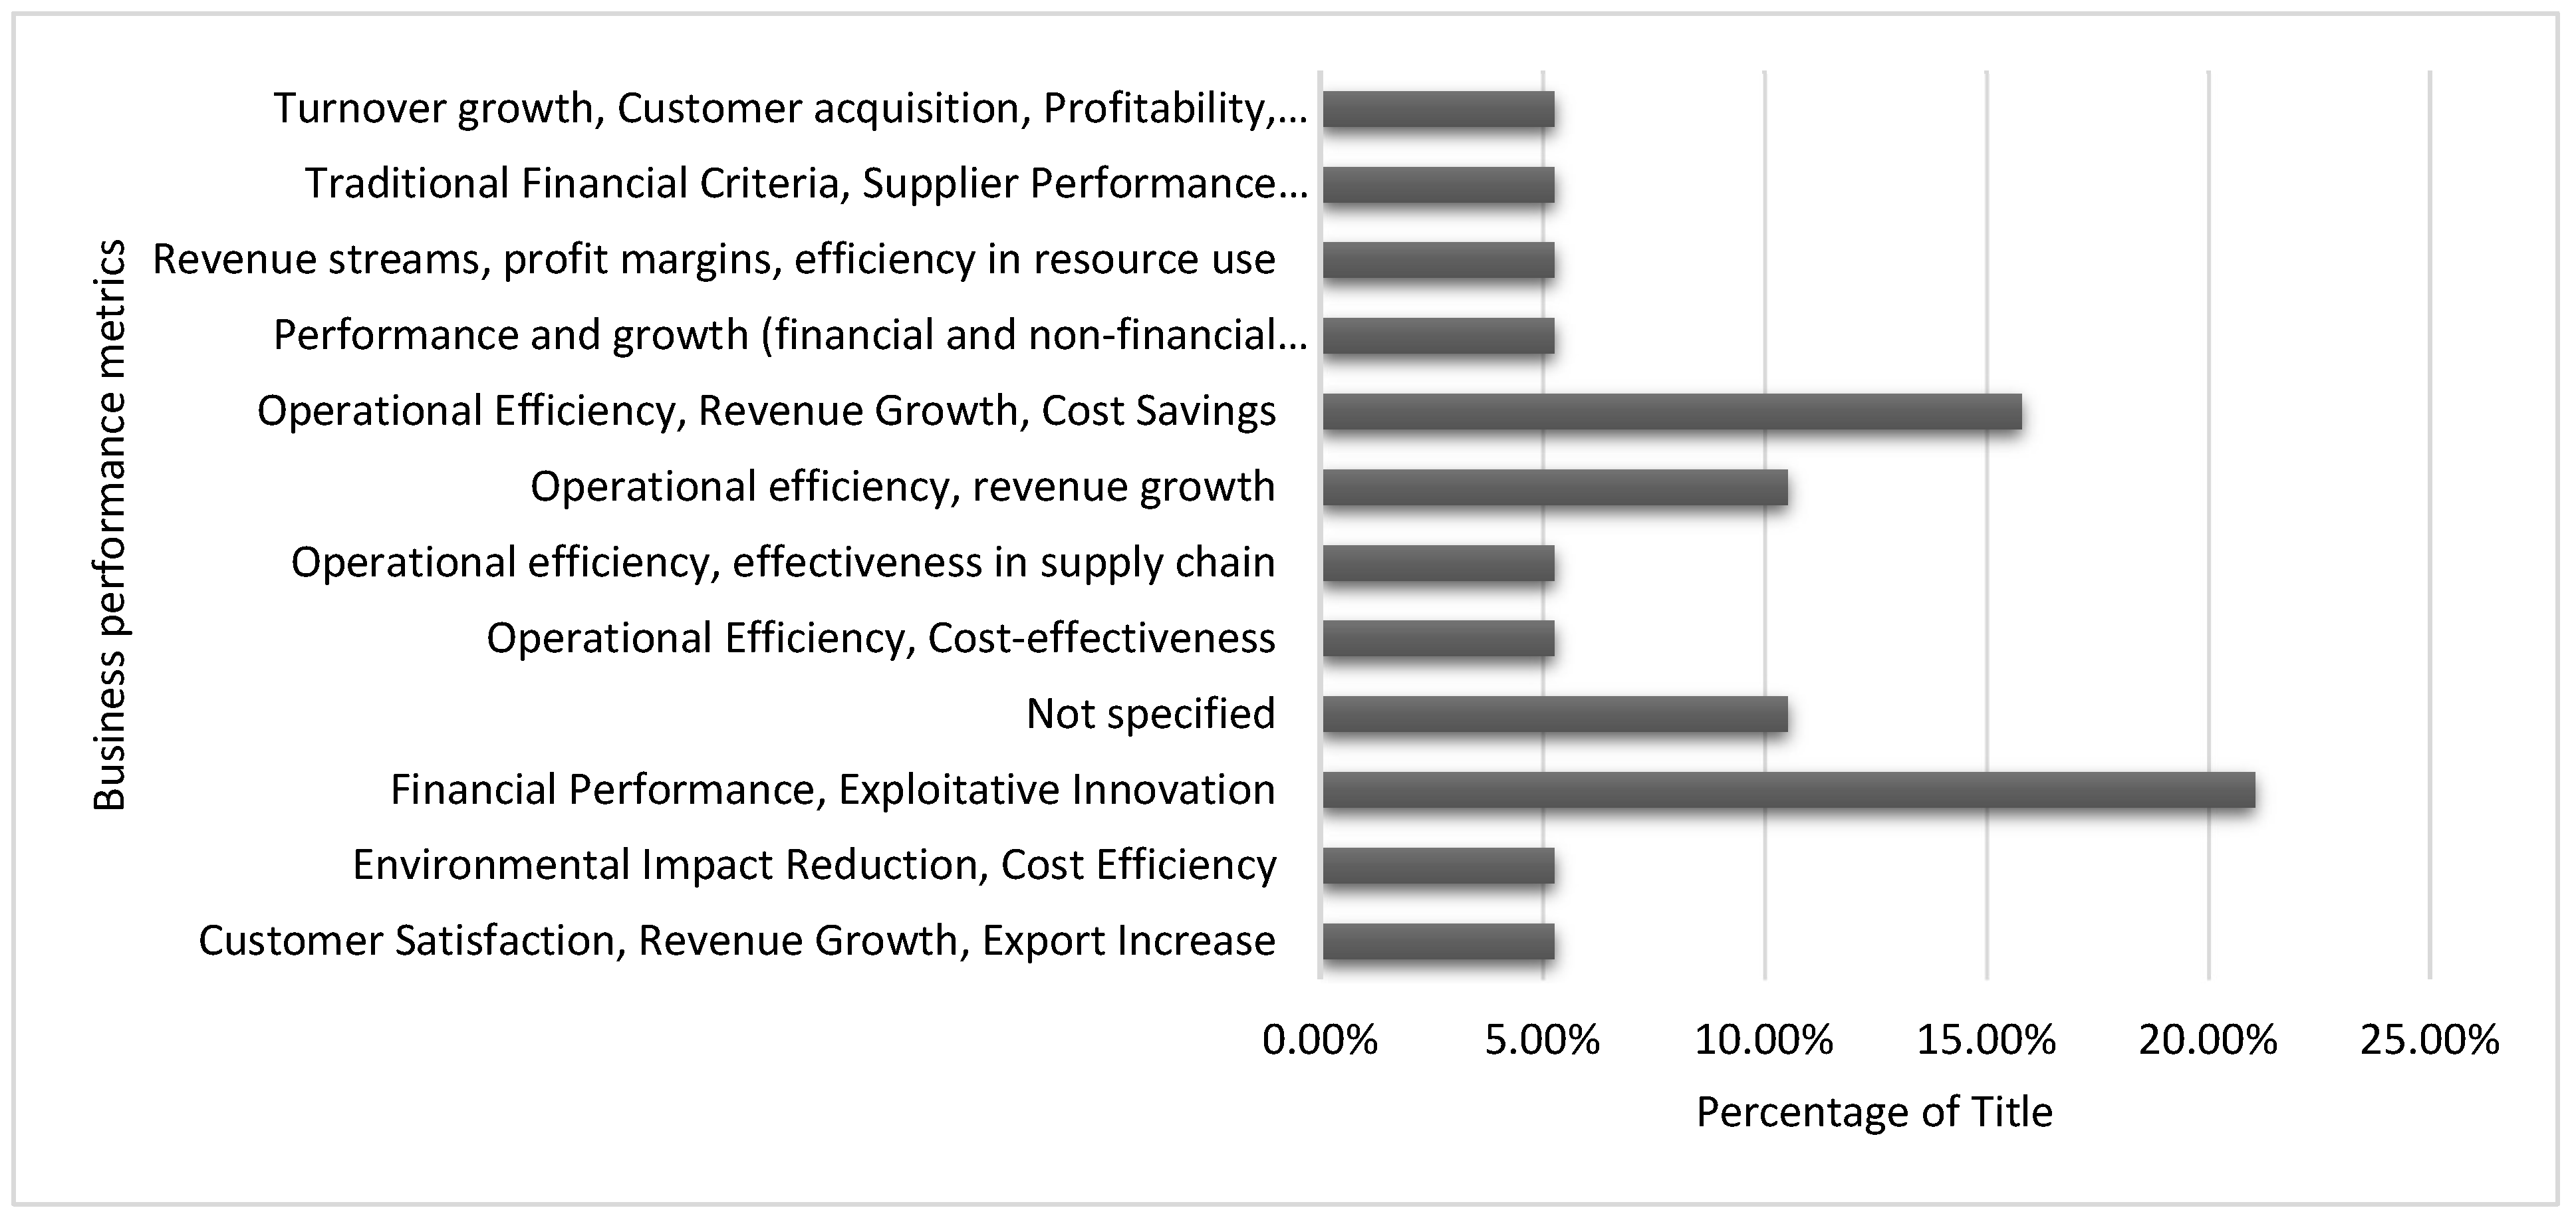
Figure 30.
Assessment of Risk Bias Process.

Figure 31.
Tool’s Questions.
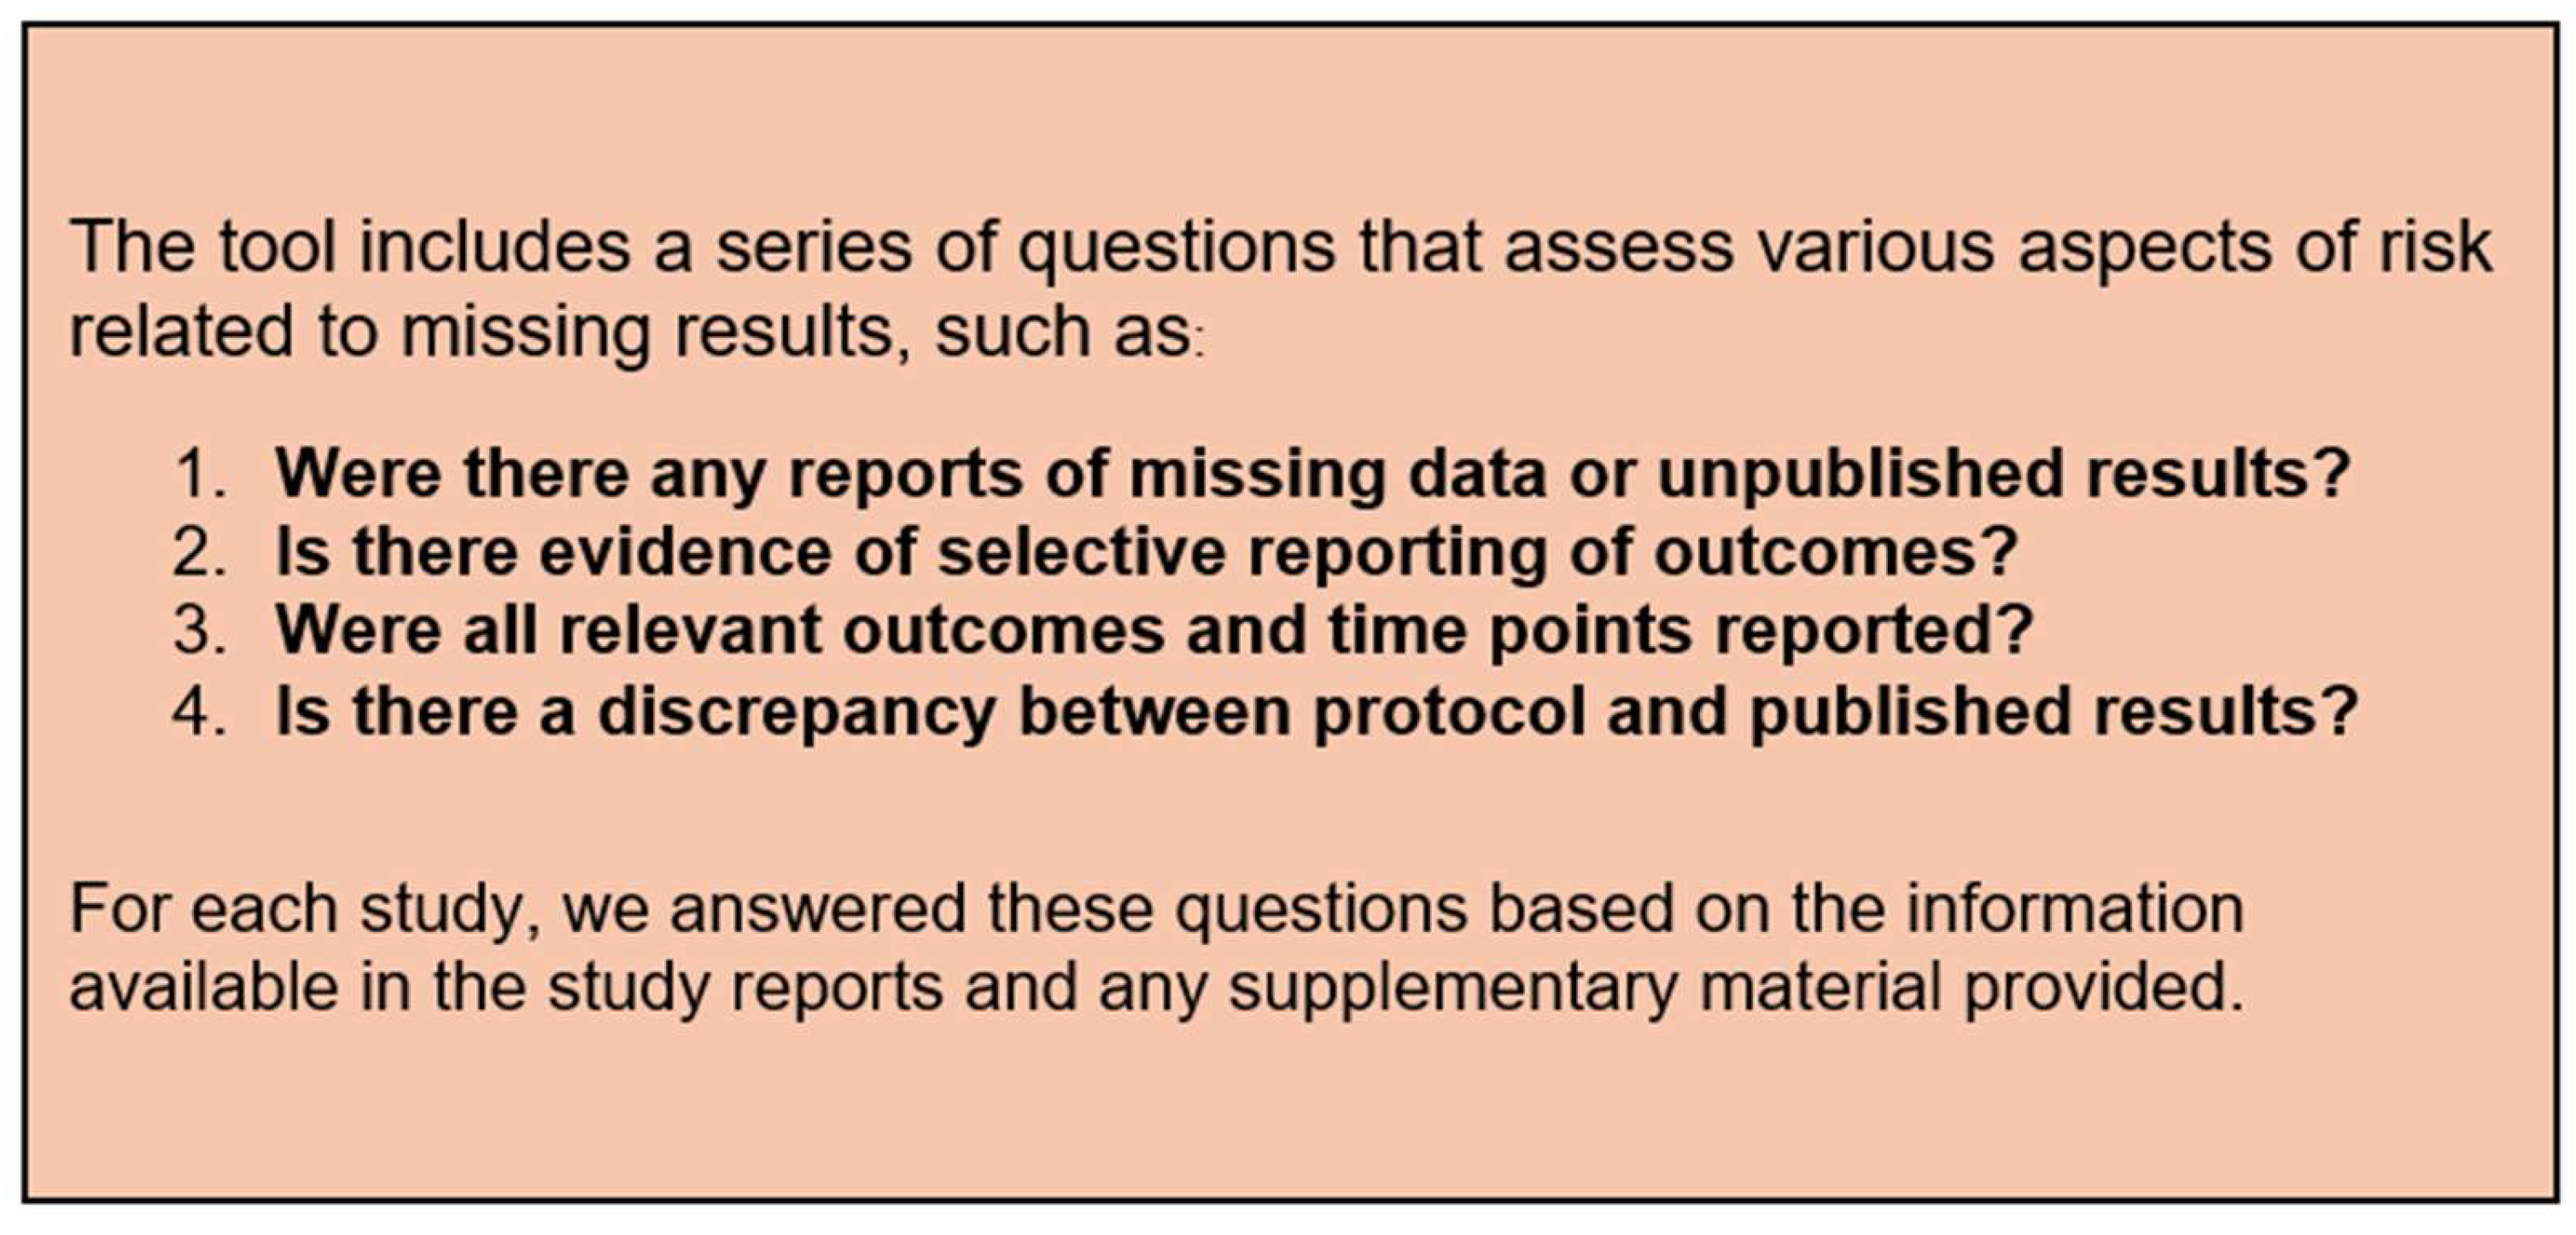
Figure 32.
Tool Questions.
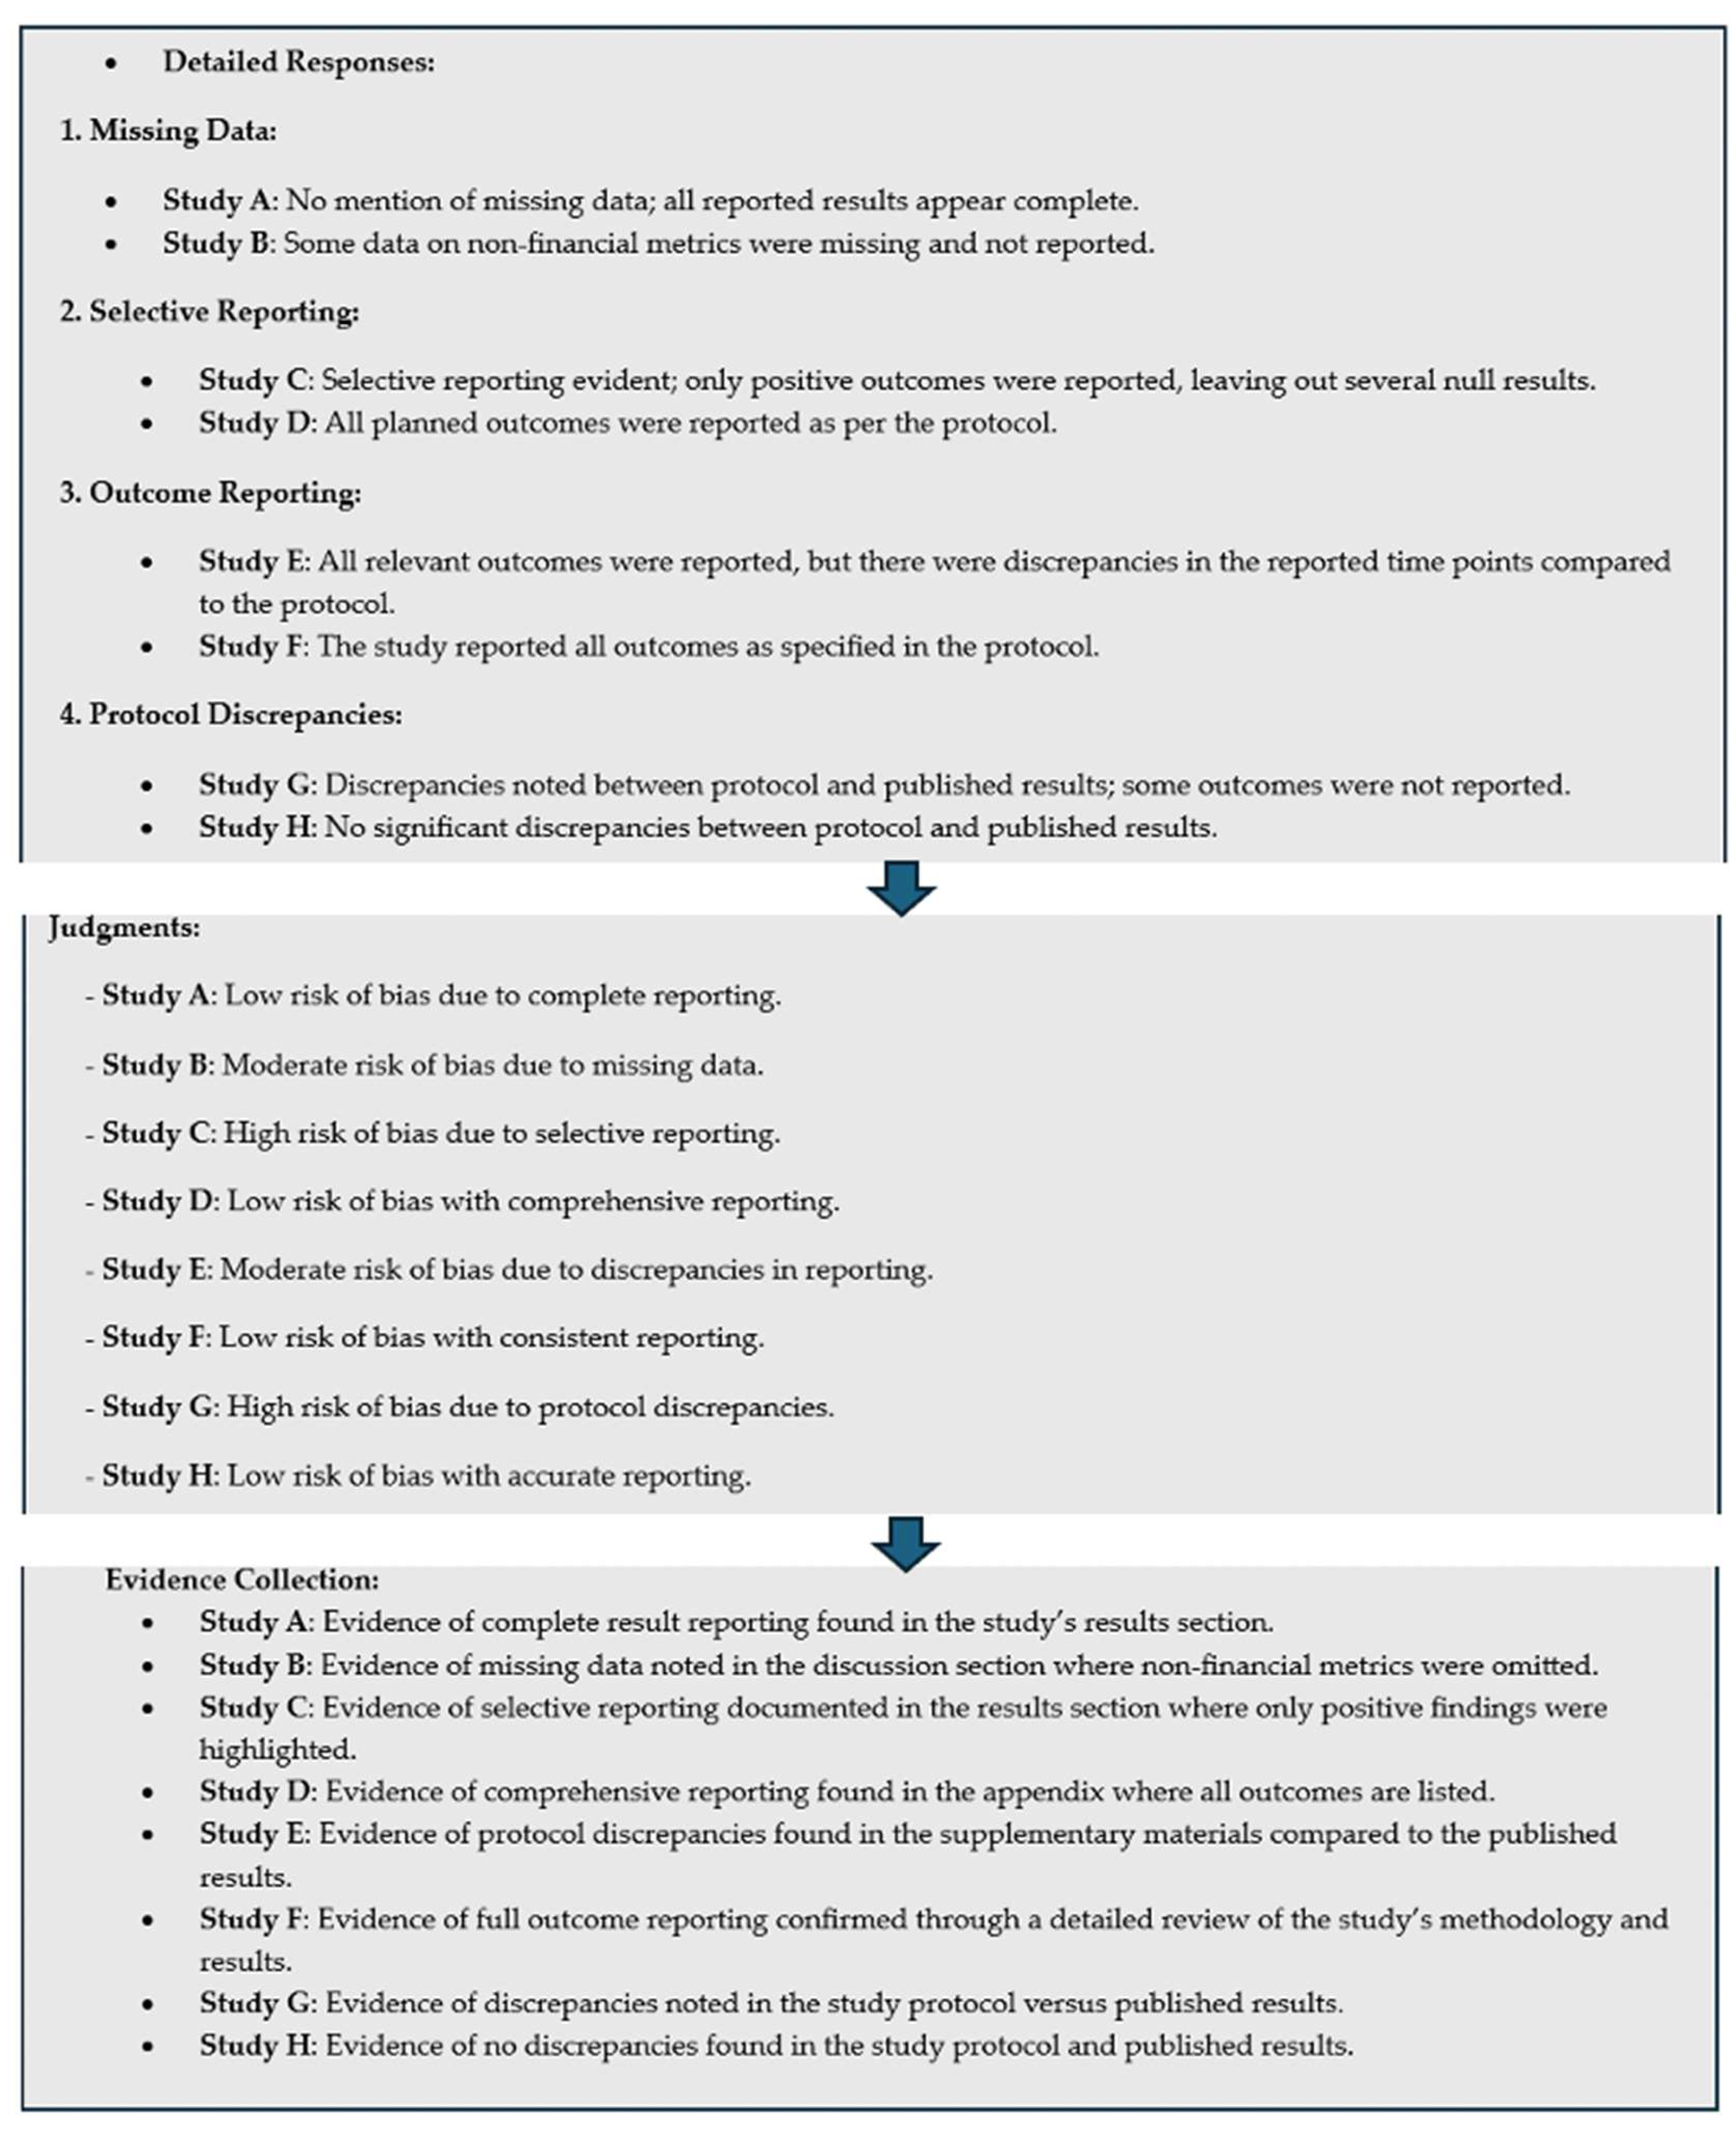
Figure 33.
Sensitivity Analysis Process.
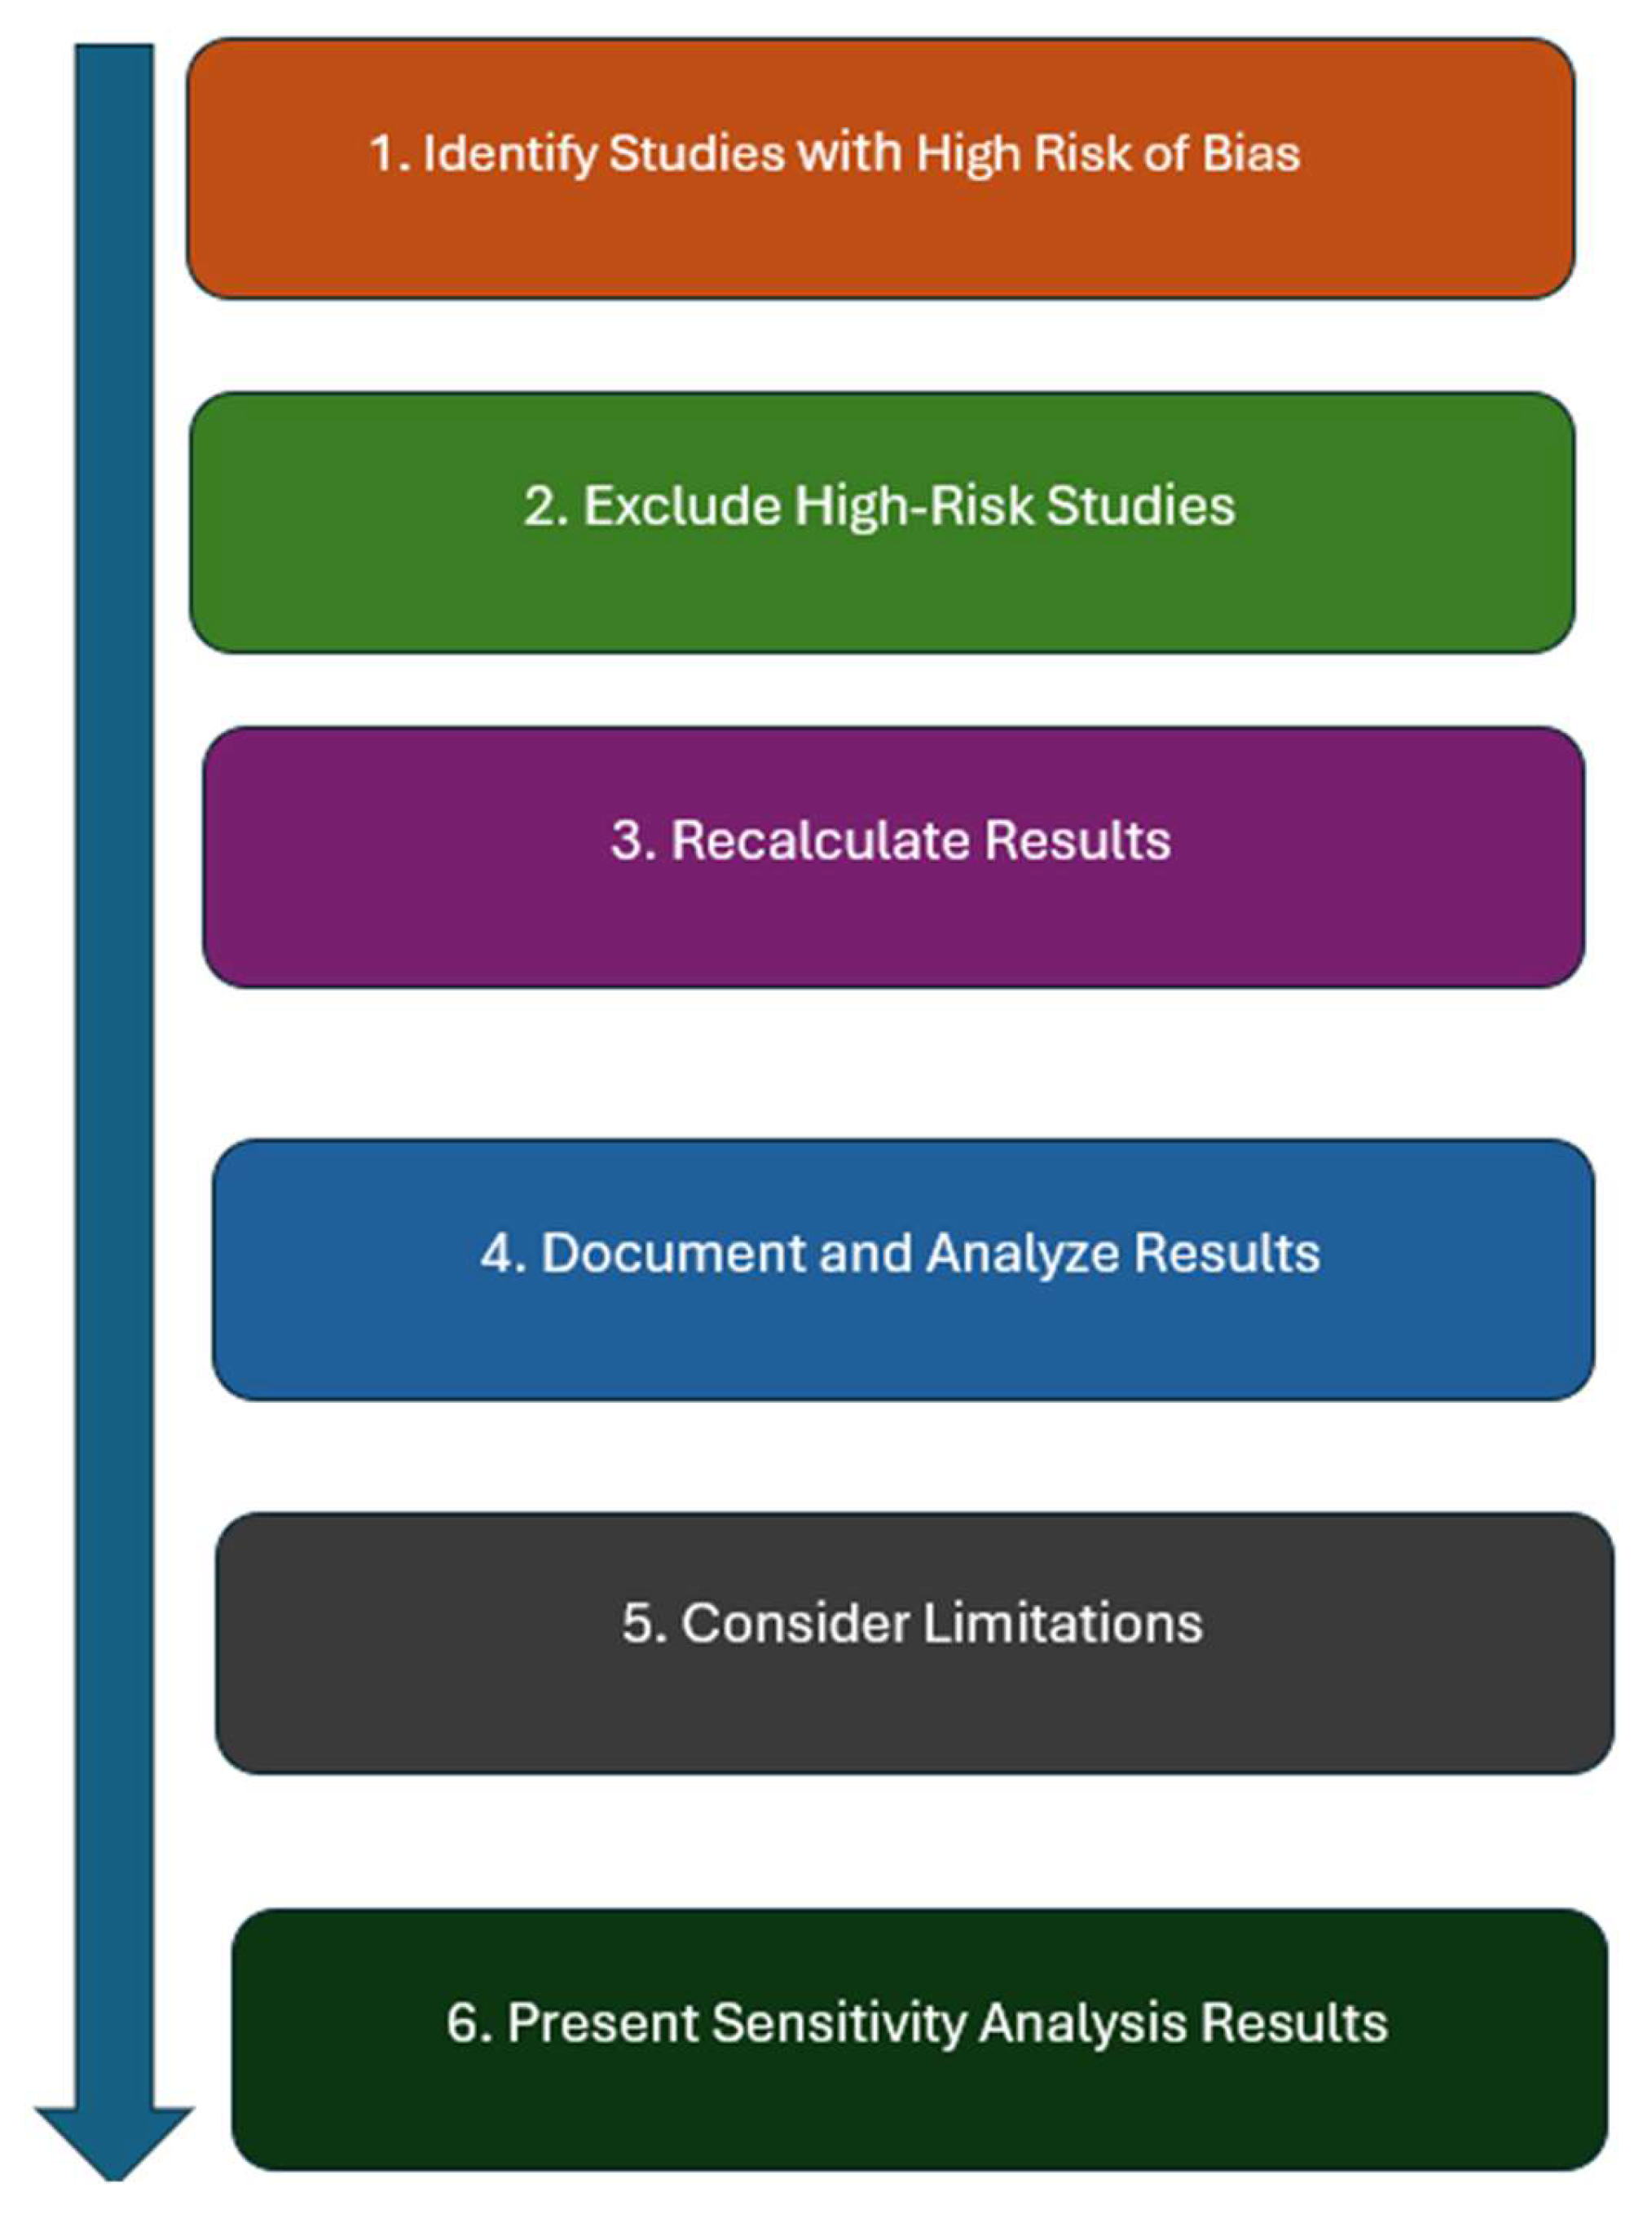
Figure 14.
Geographic Location.
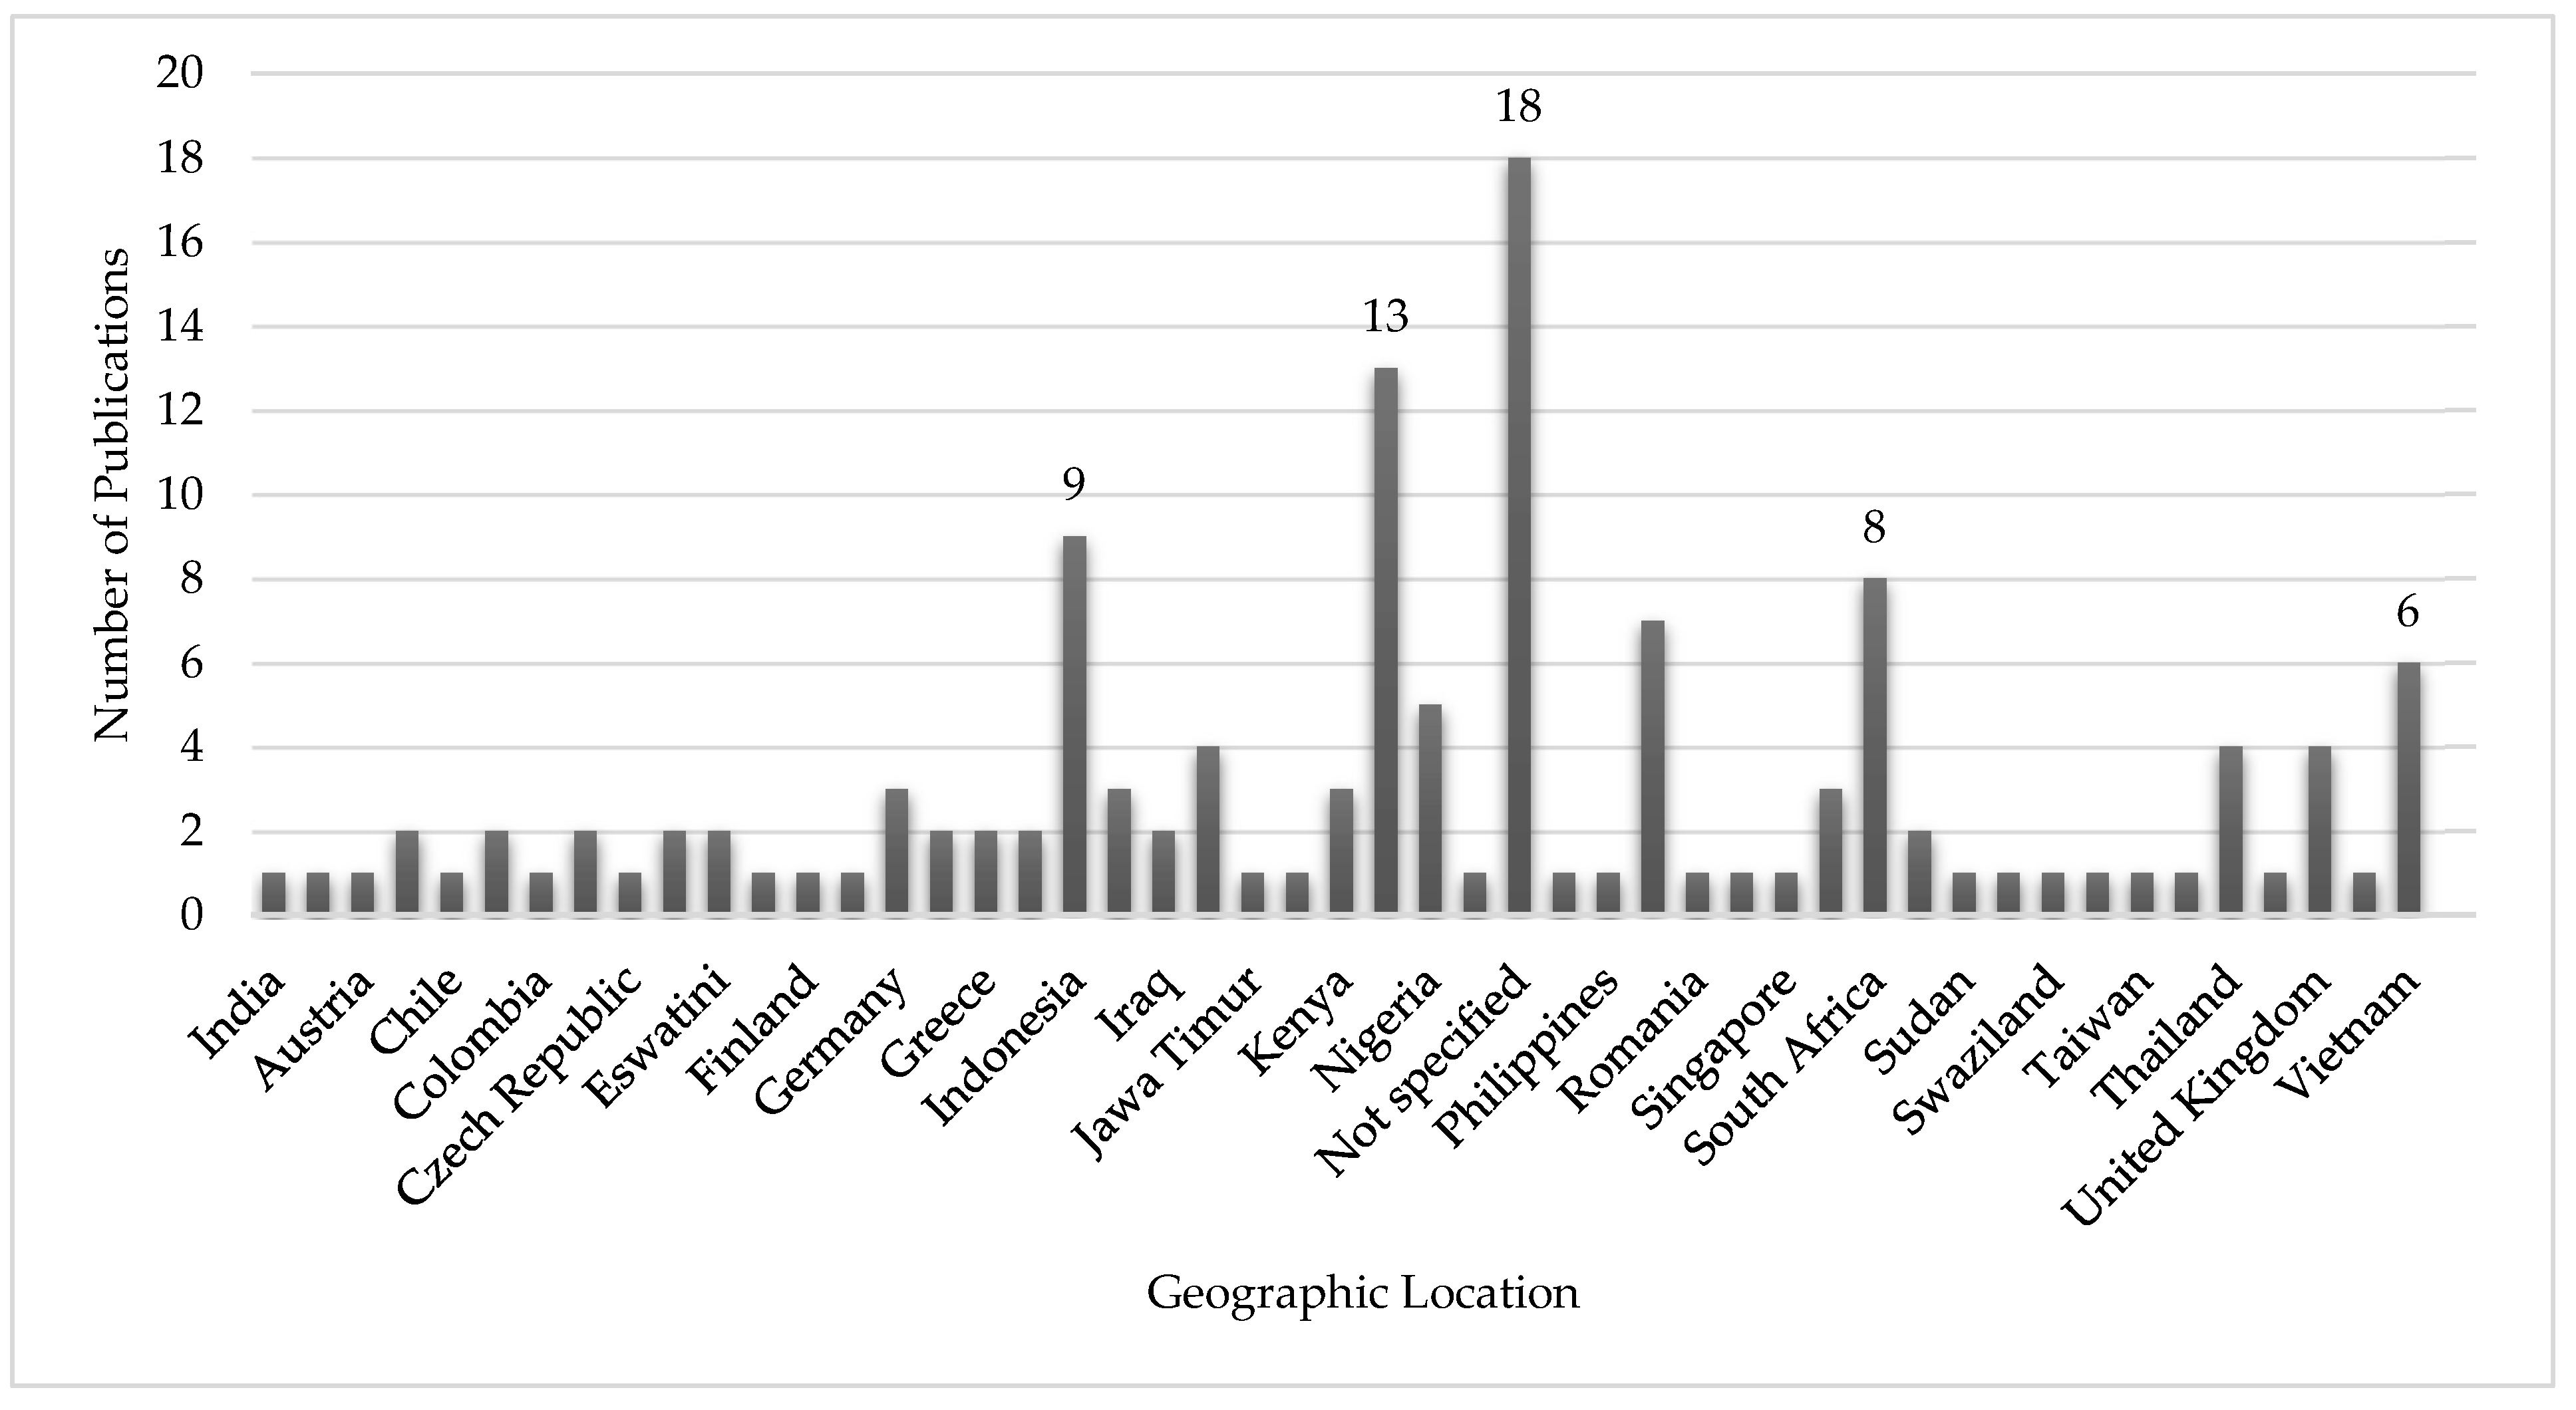
Figure 15.
Research Type.
Figure 16.
Journal Name.
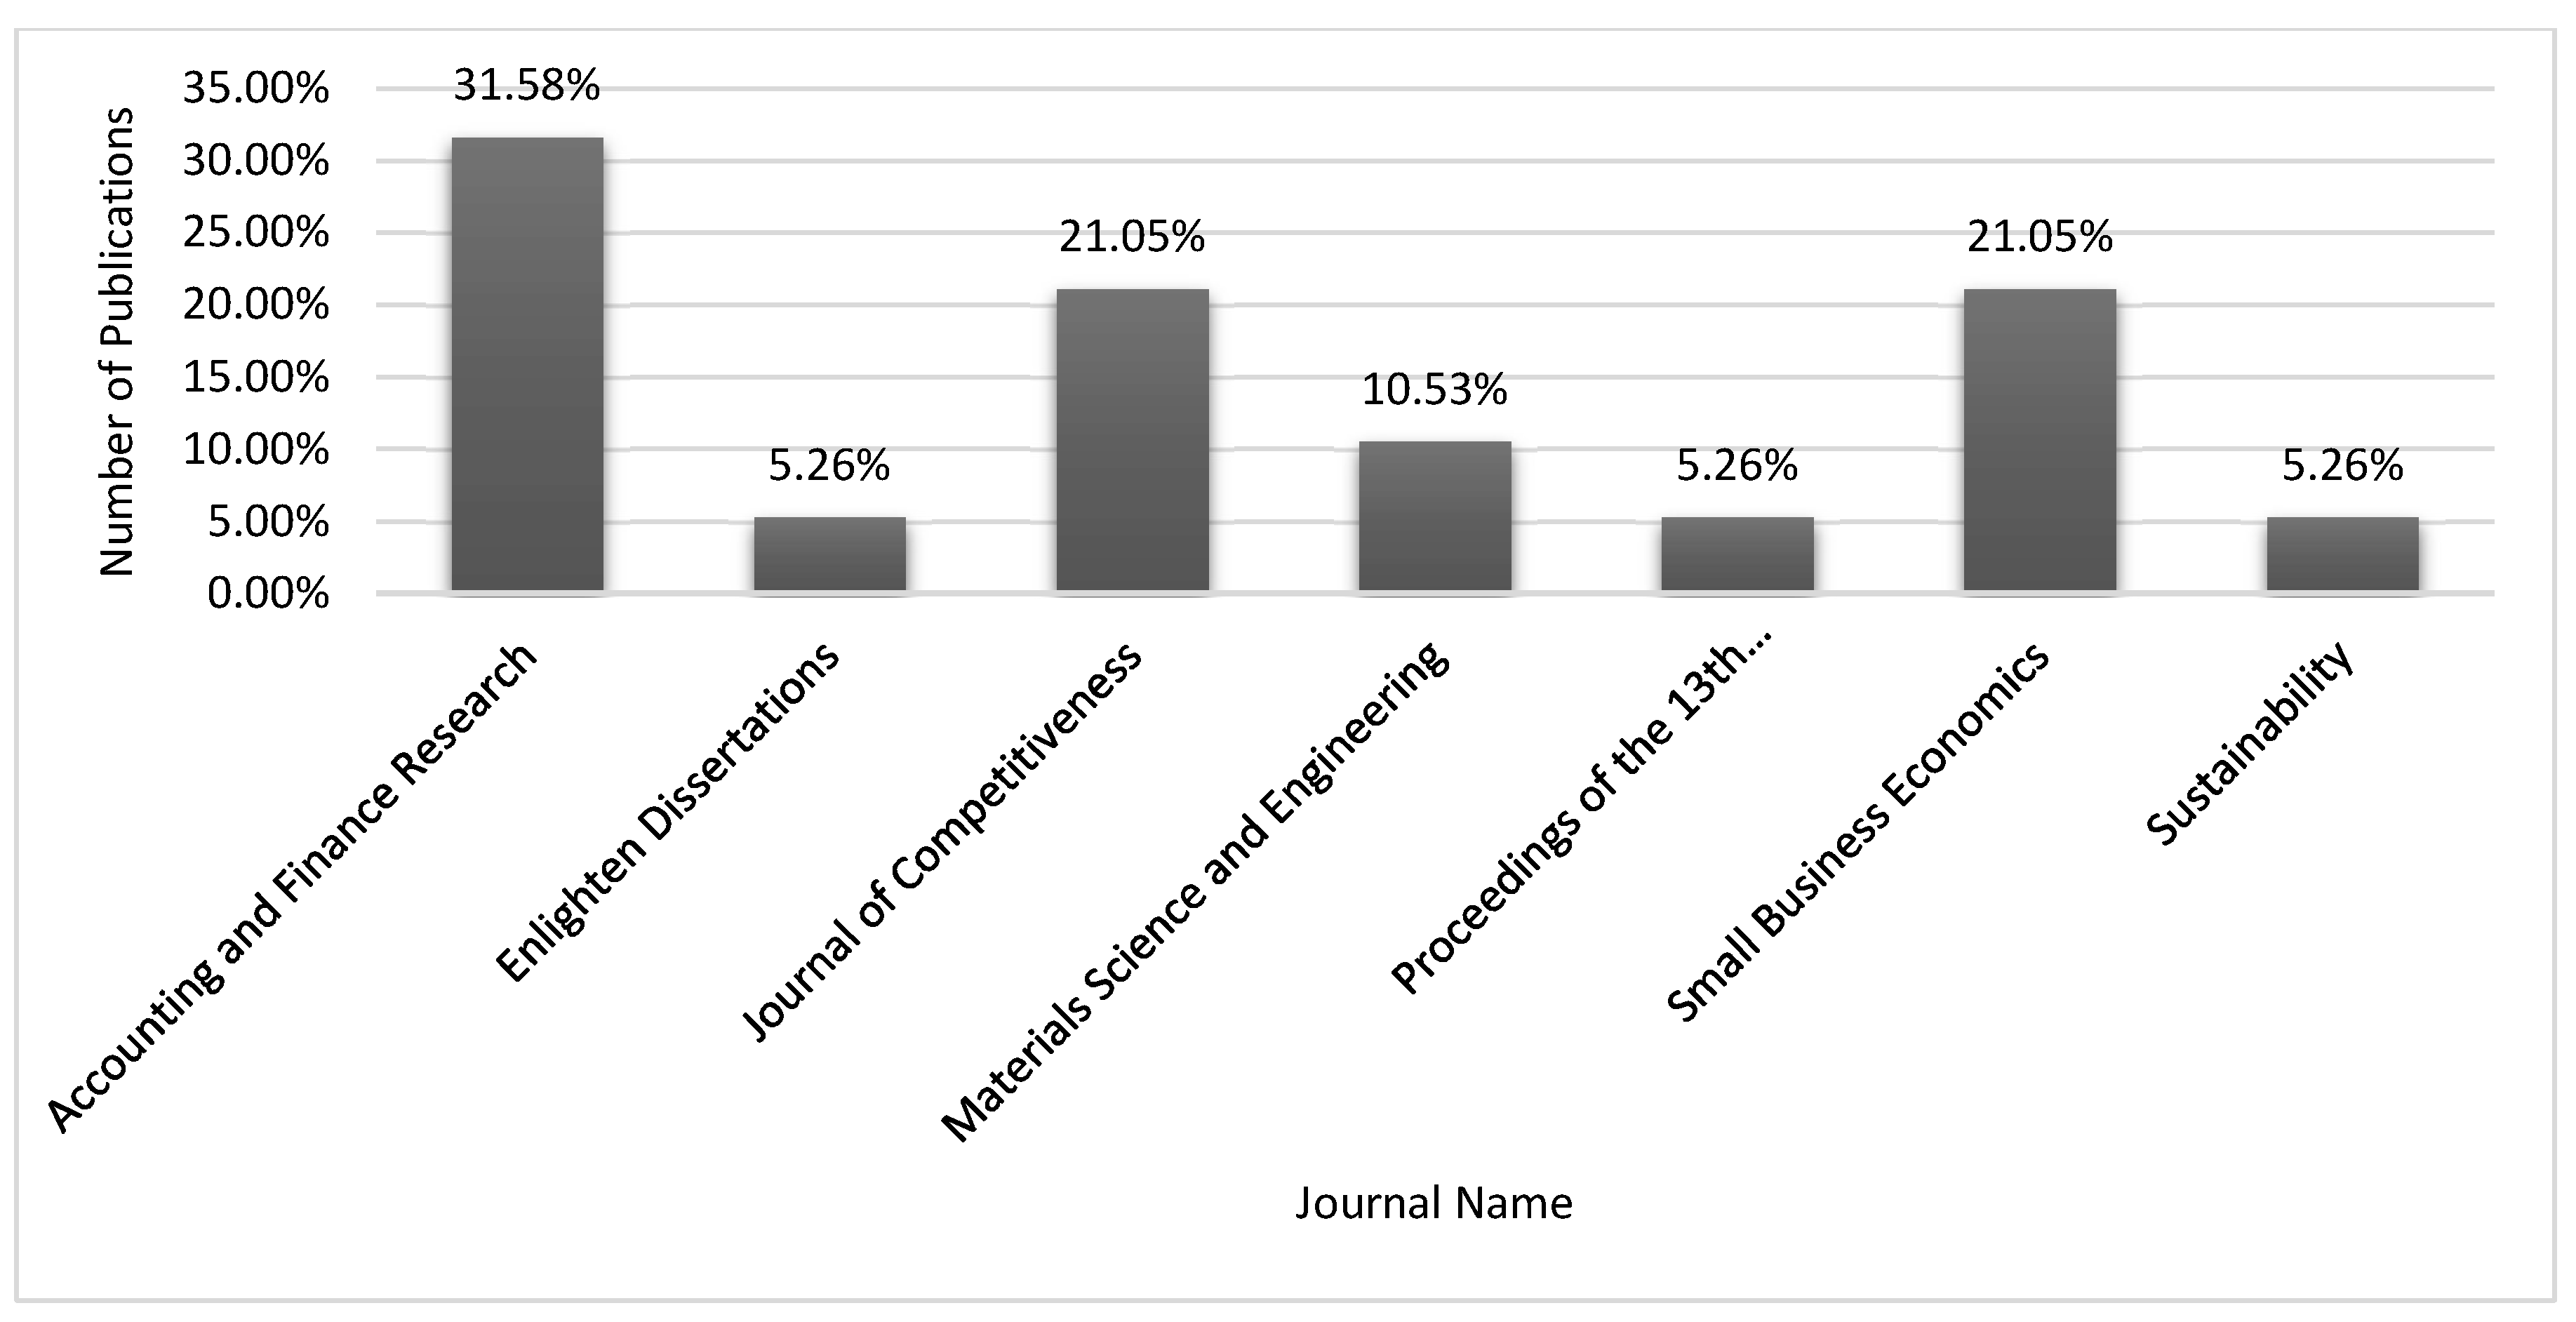
Figure 17.
Subject Area.
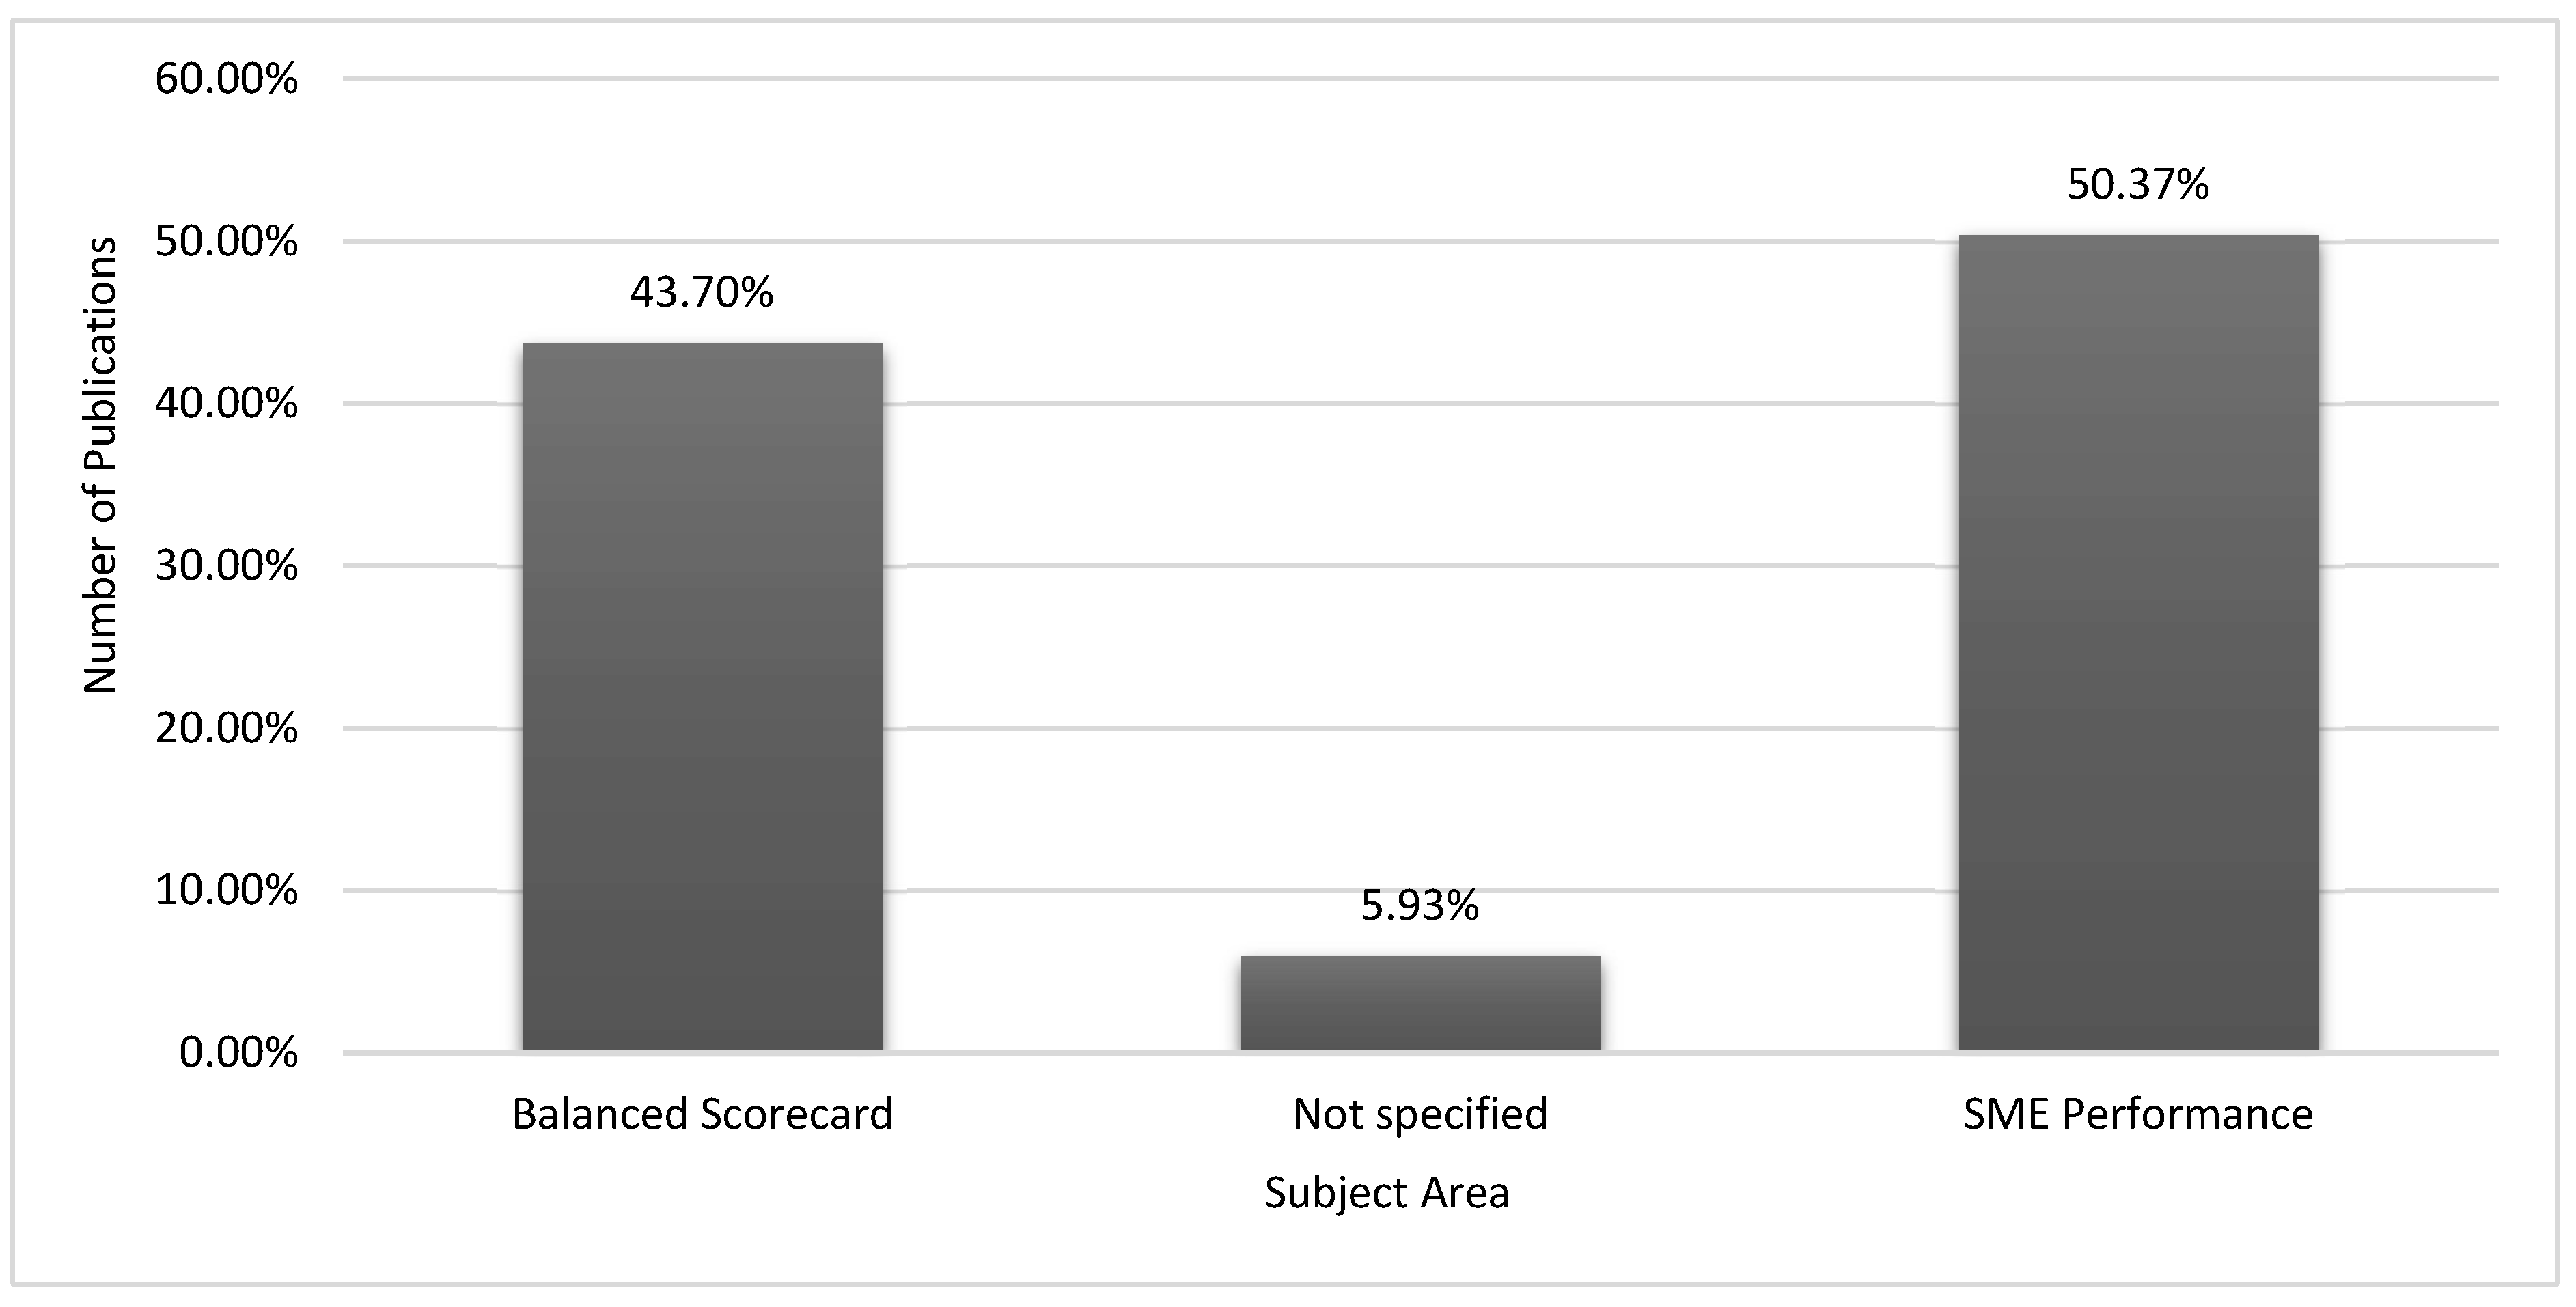
Figure 18.
Industry Context.
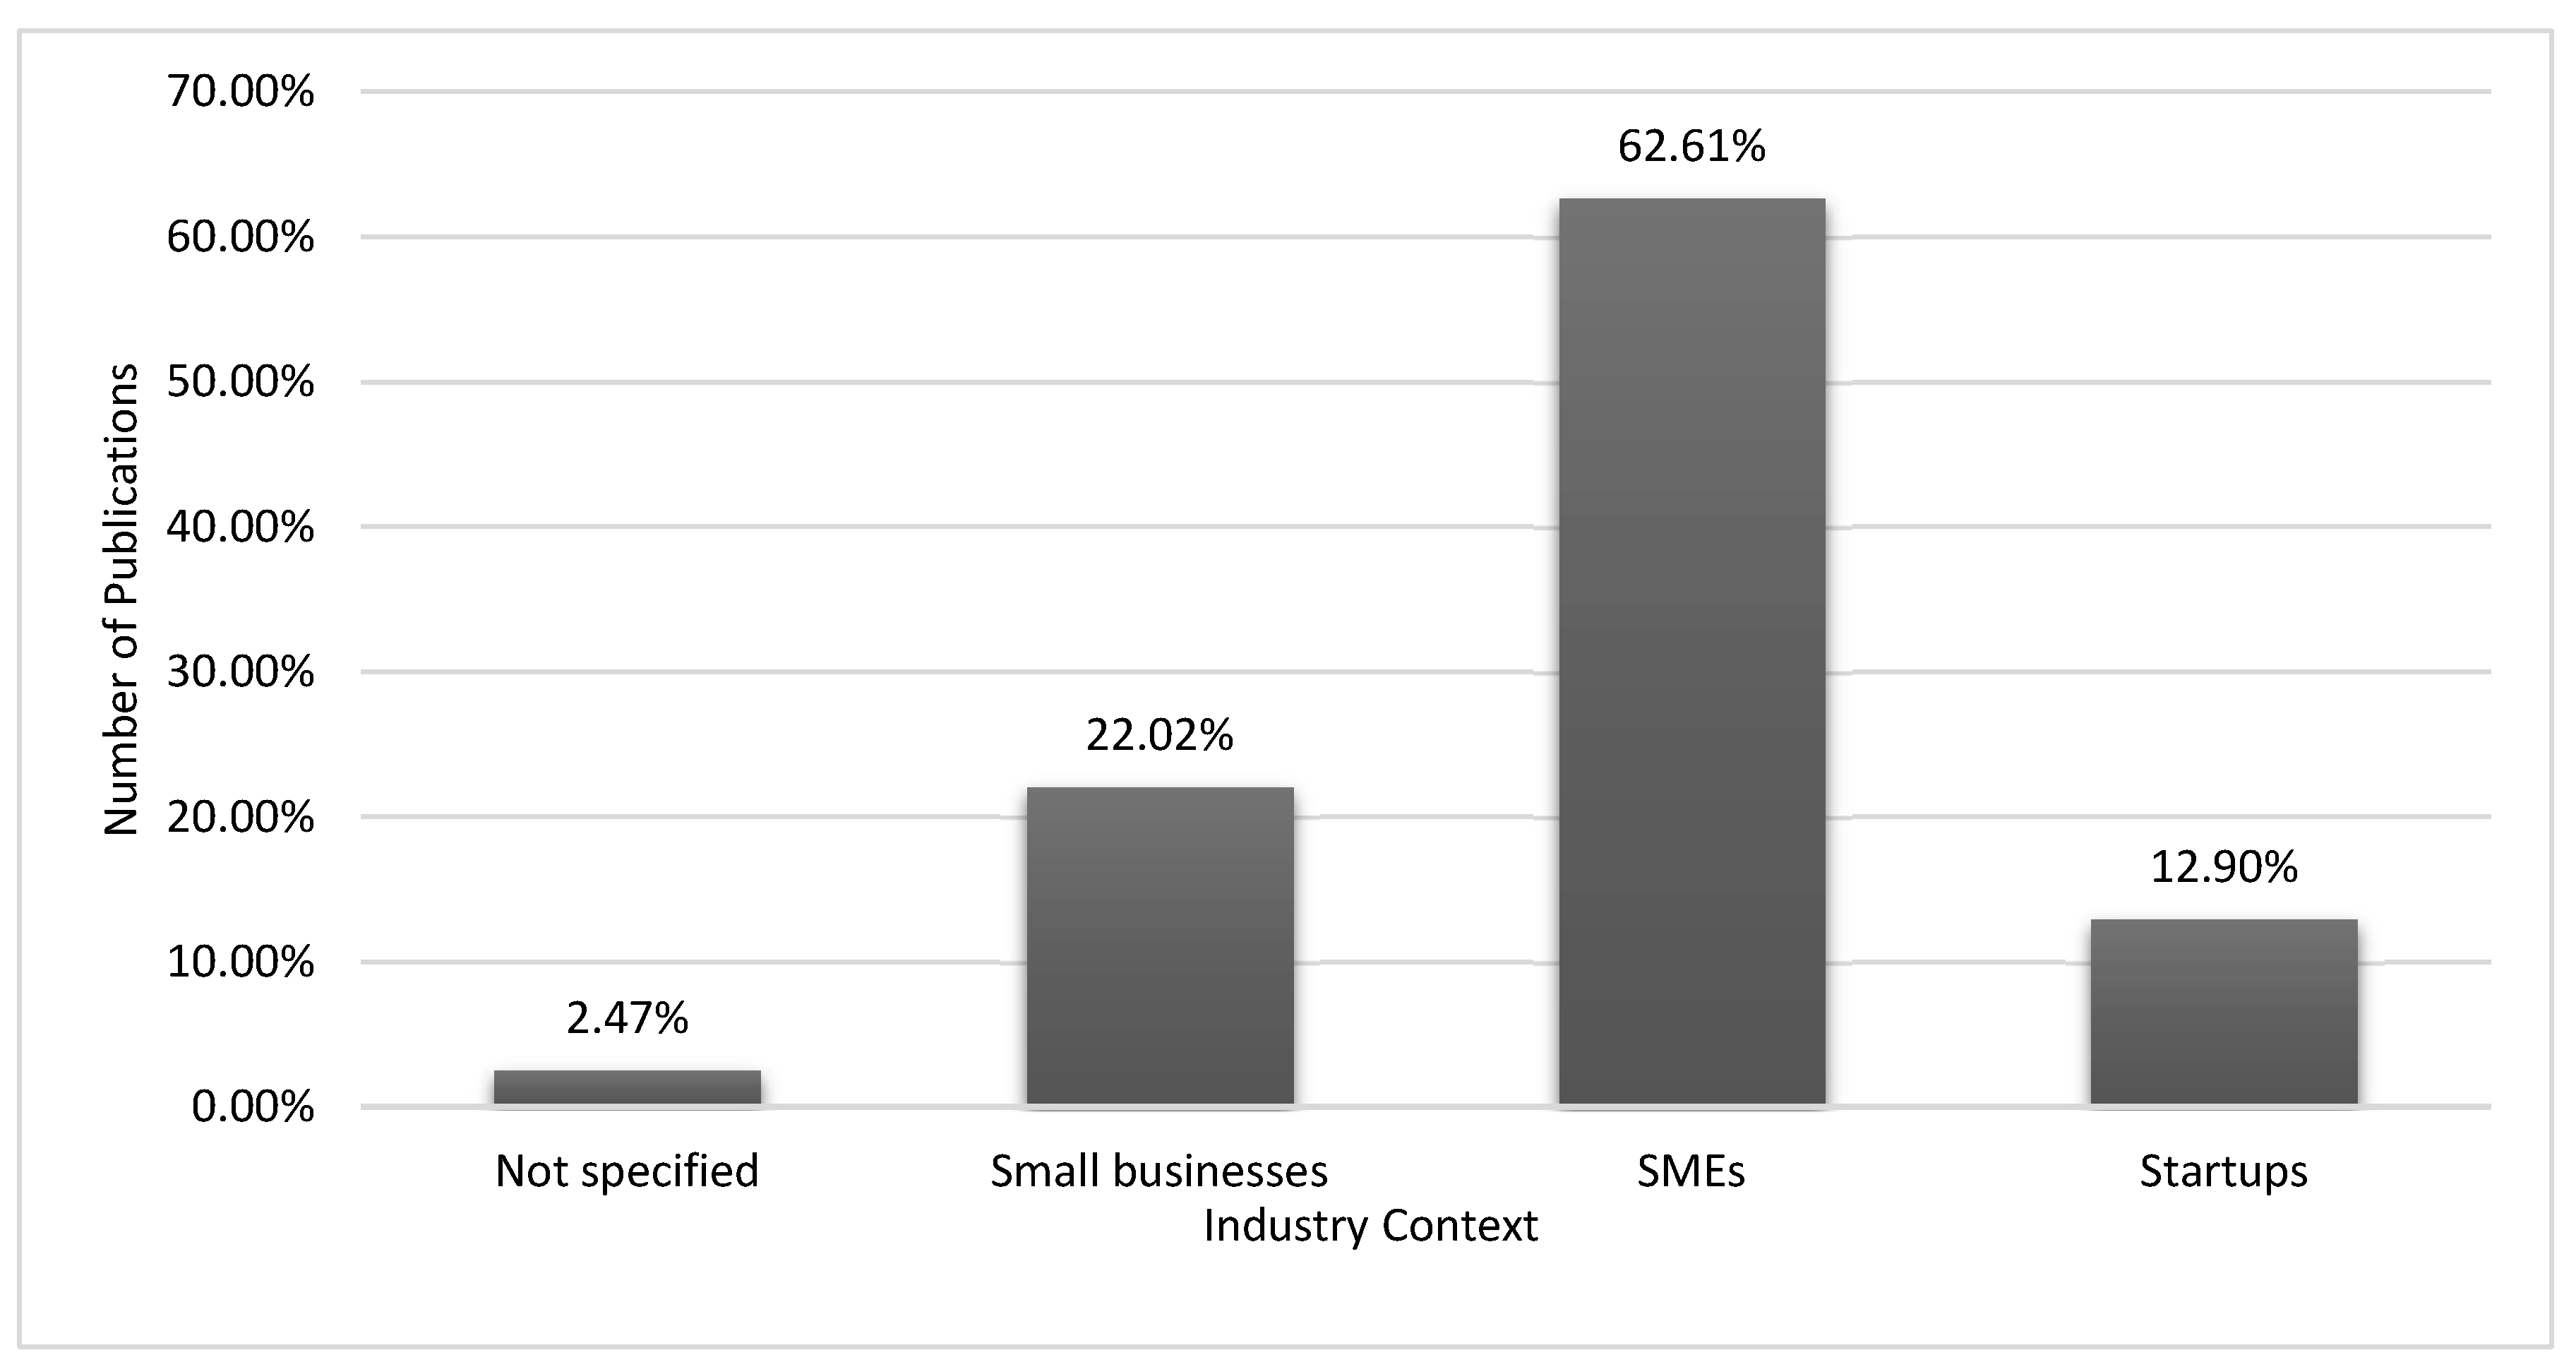
Figure 19.
Research Design.
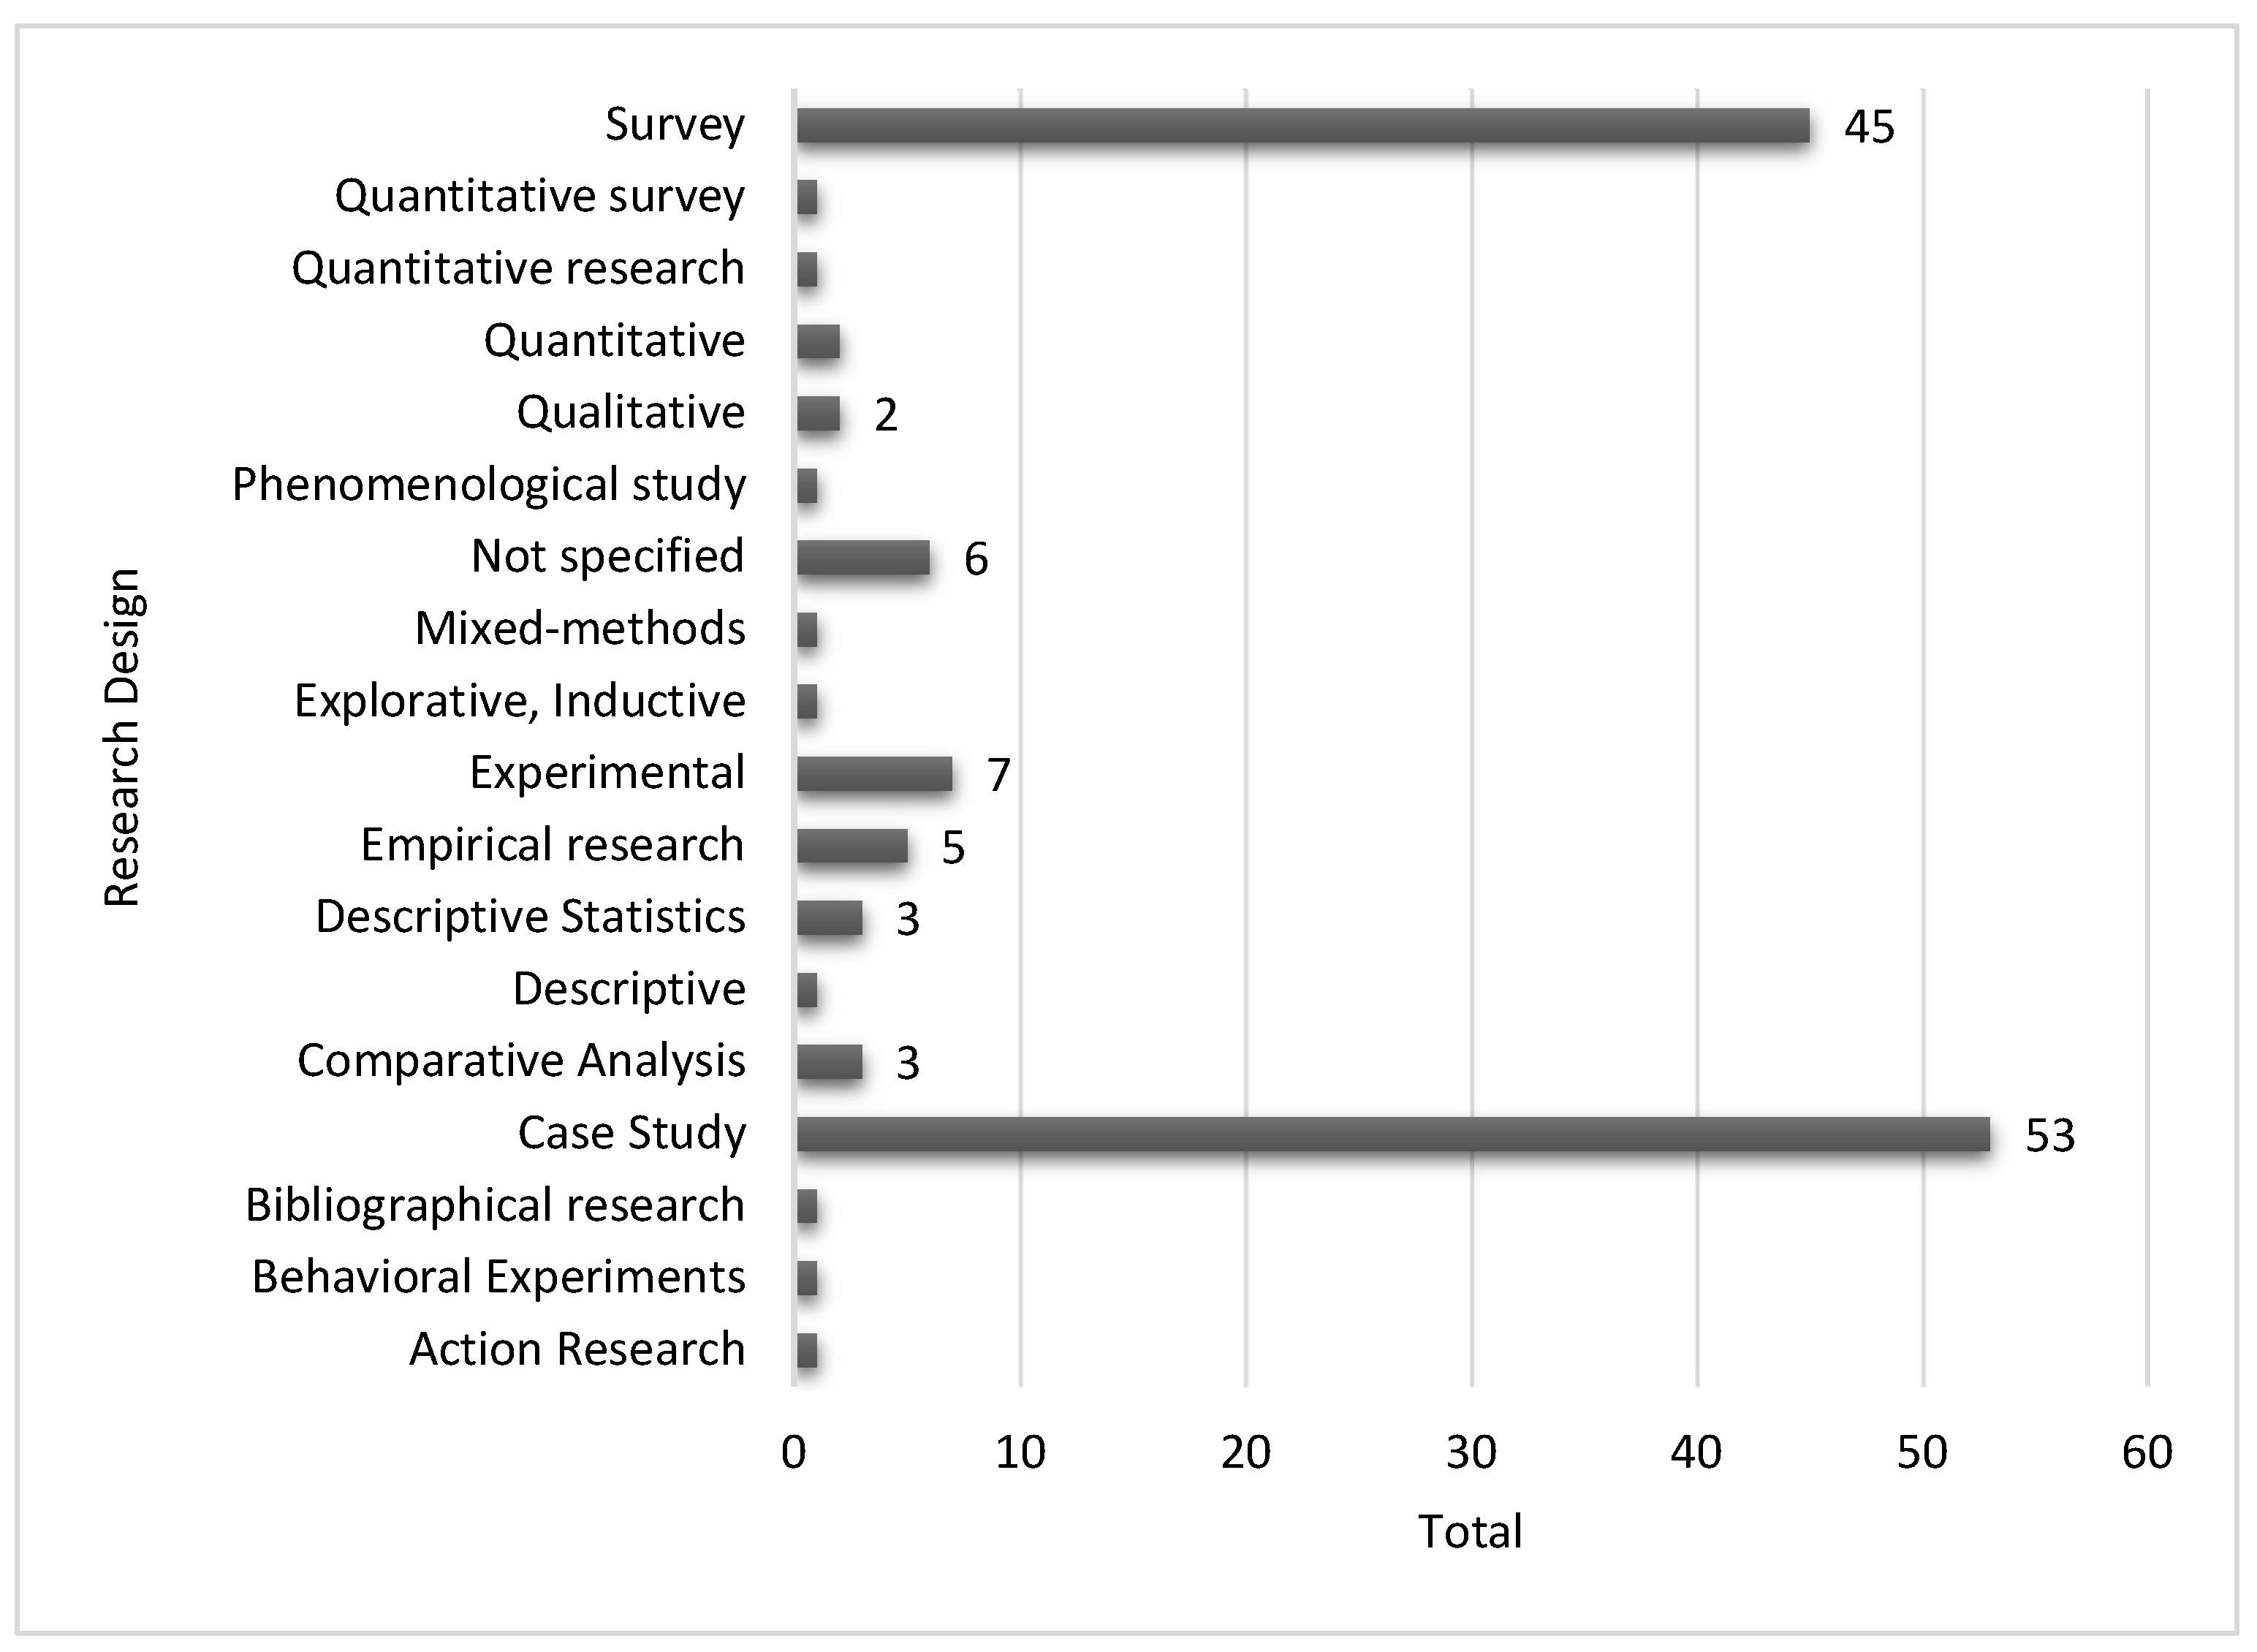
Figure 20.
Perspectives of BSC.
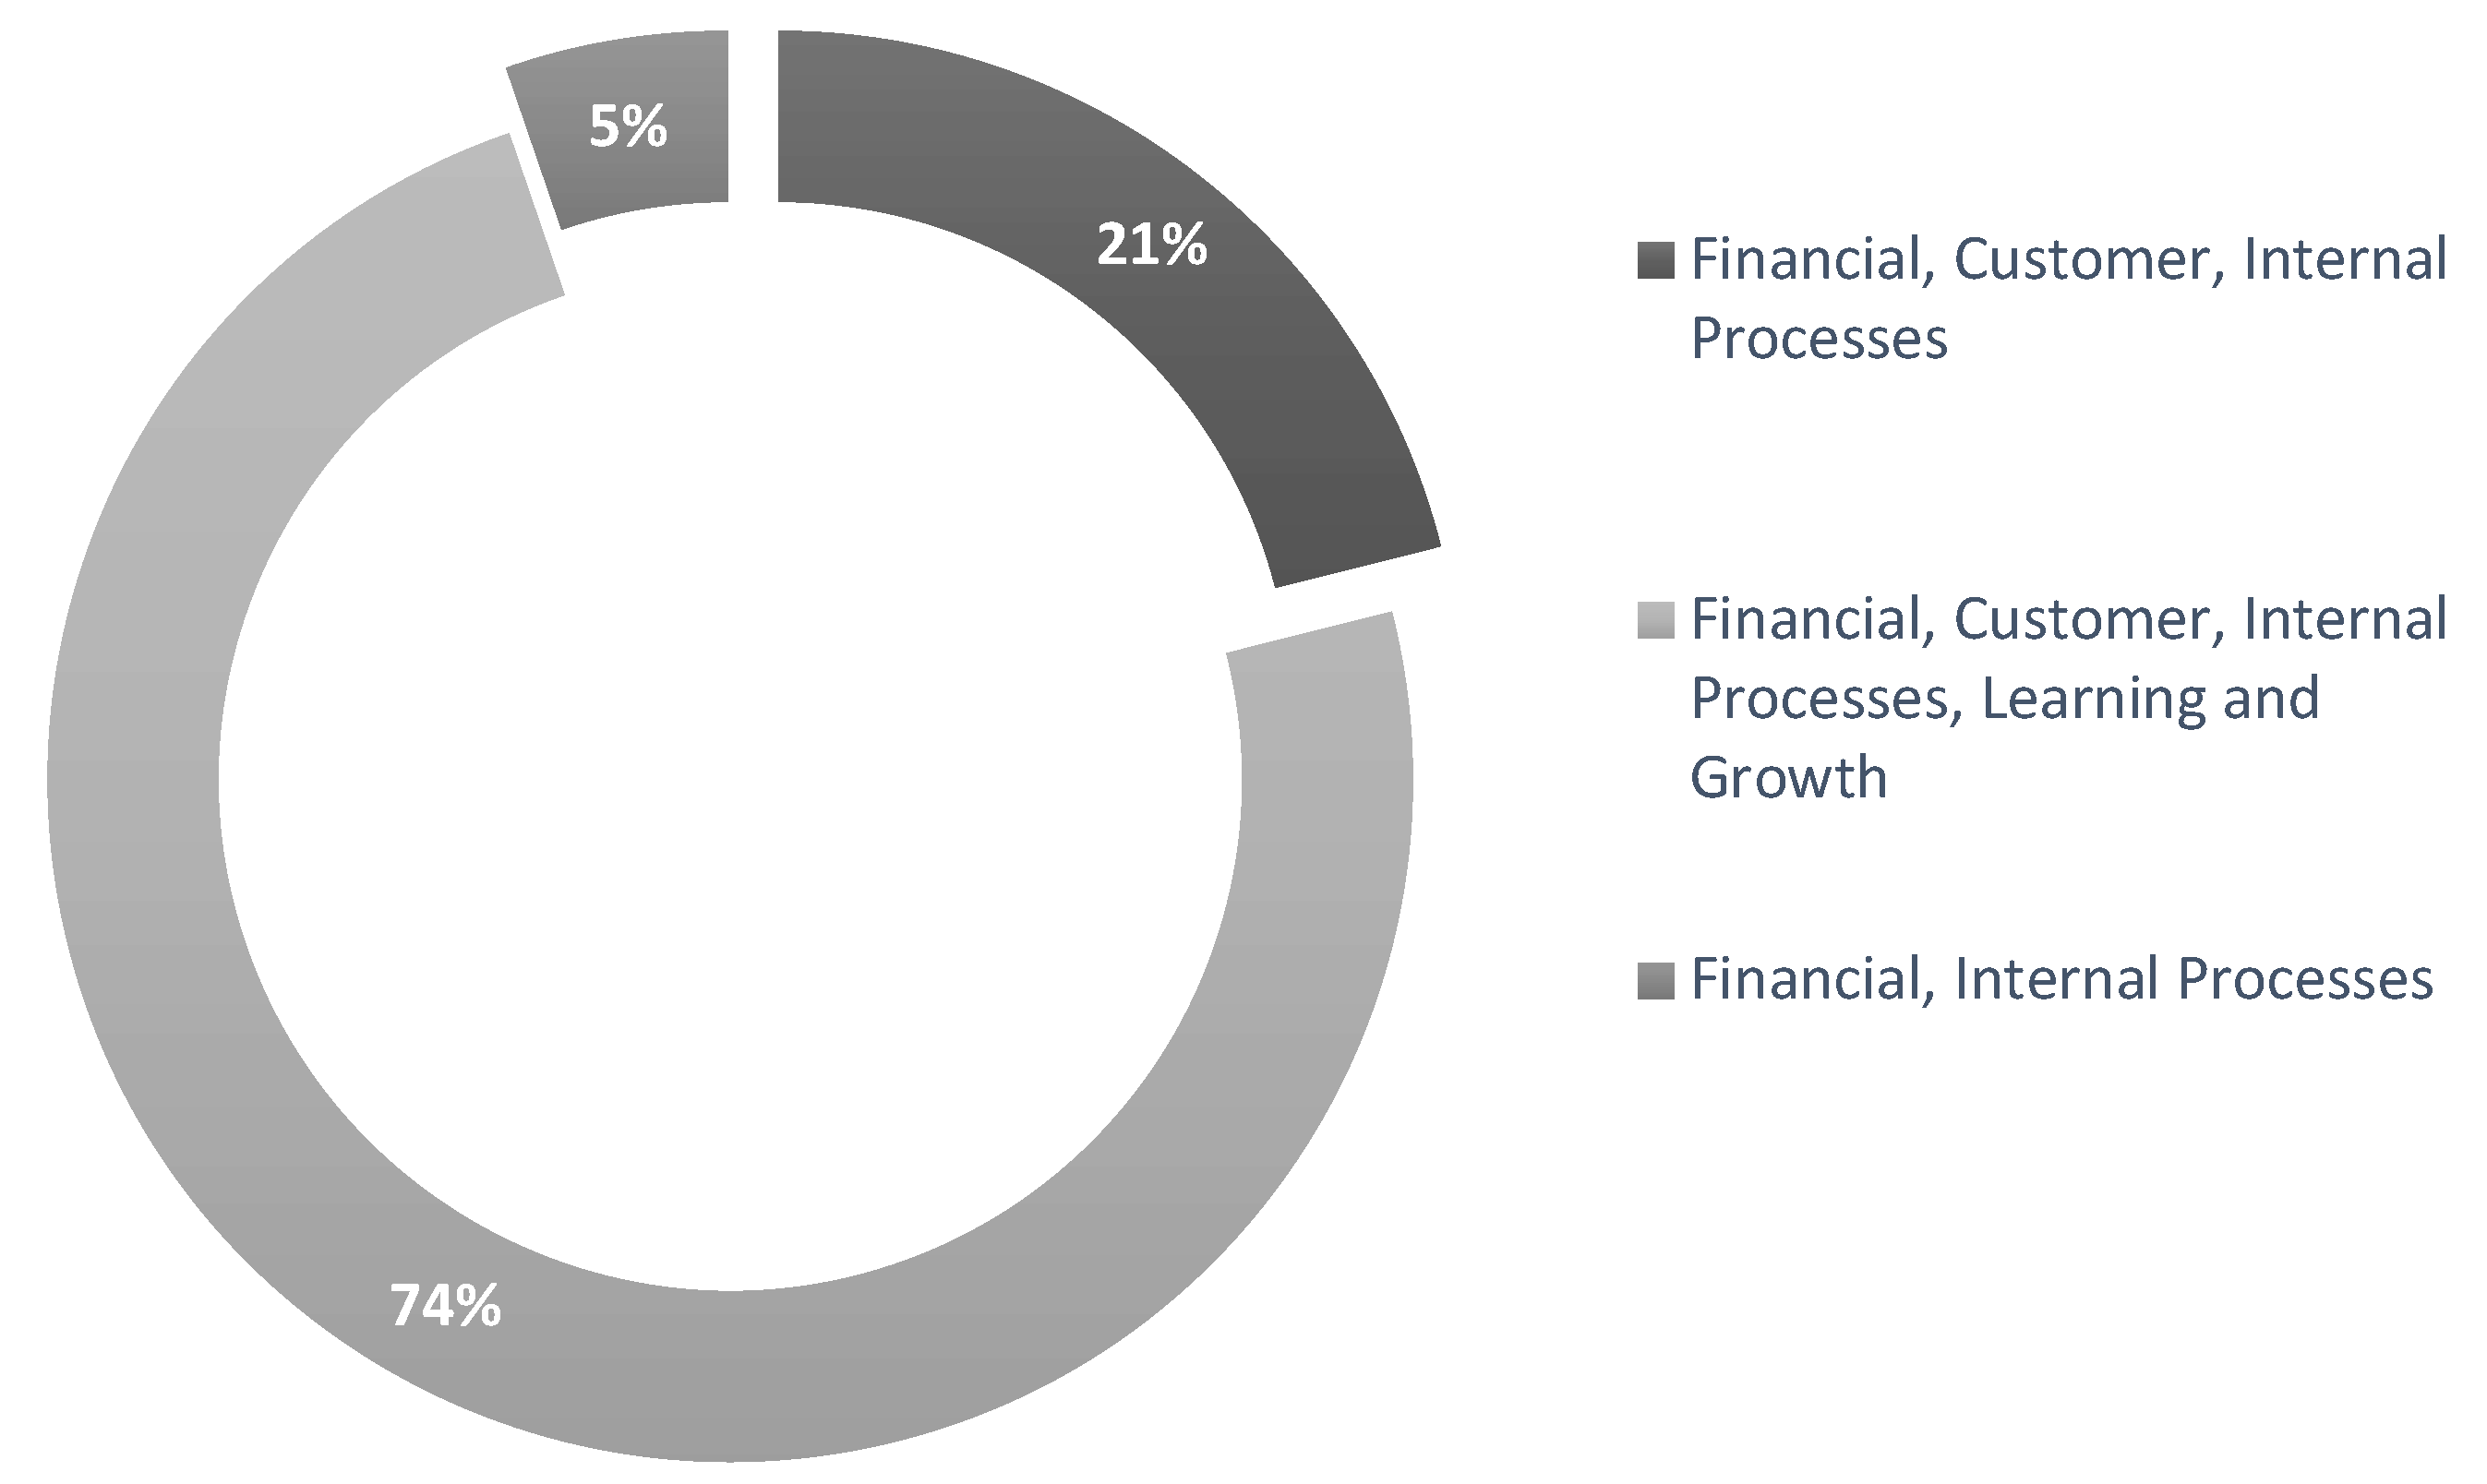
Figure 21.
Key Performance Indicators.
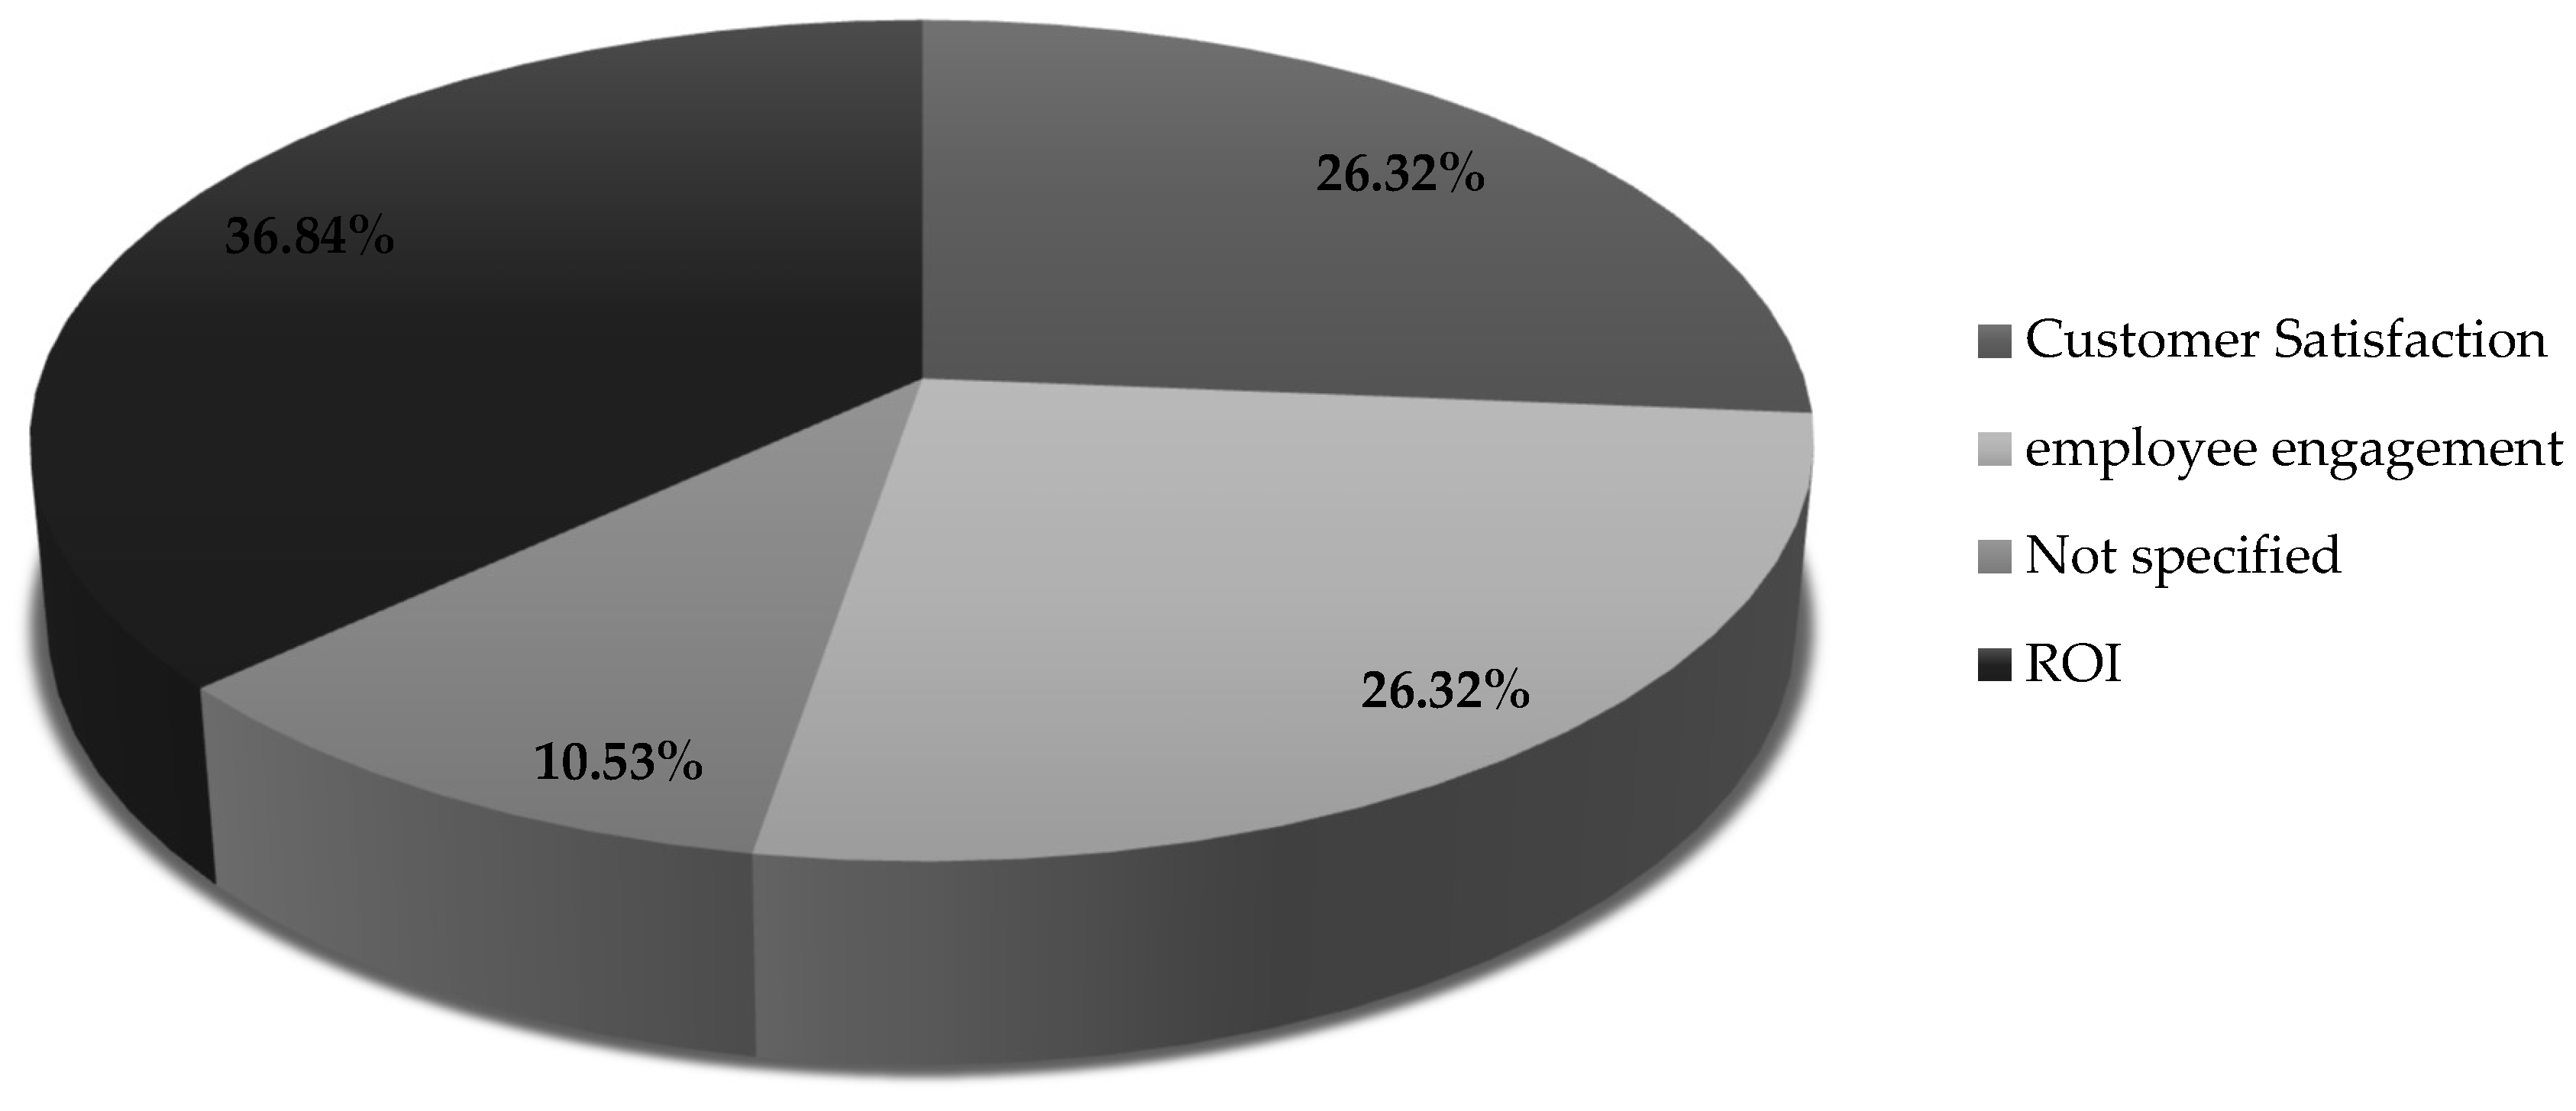
Figure 22.
Sample Size.
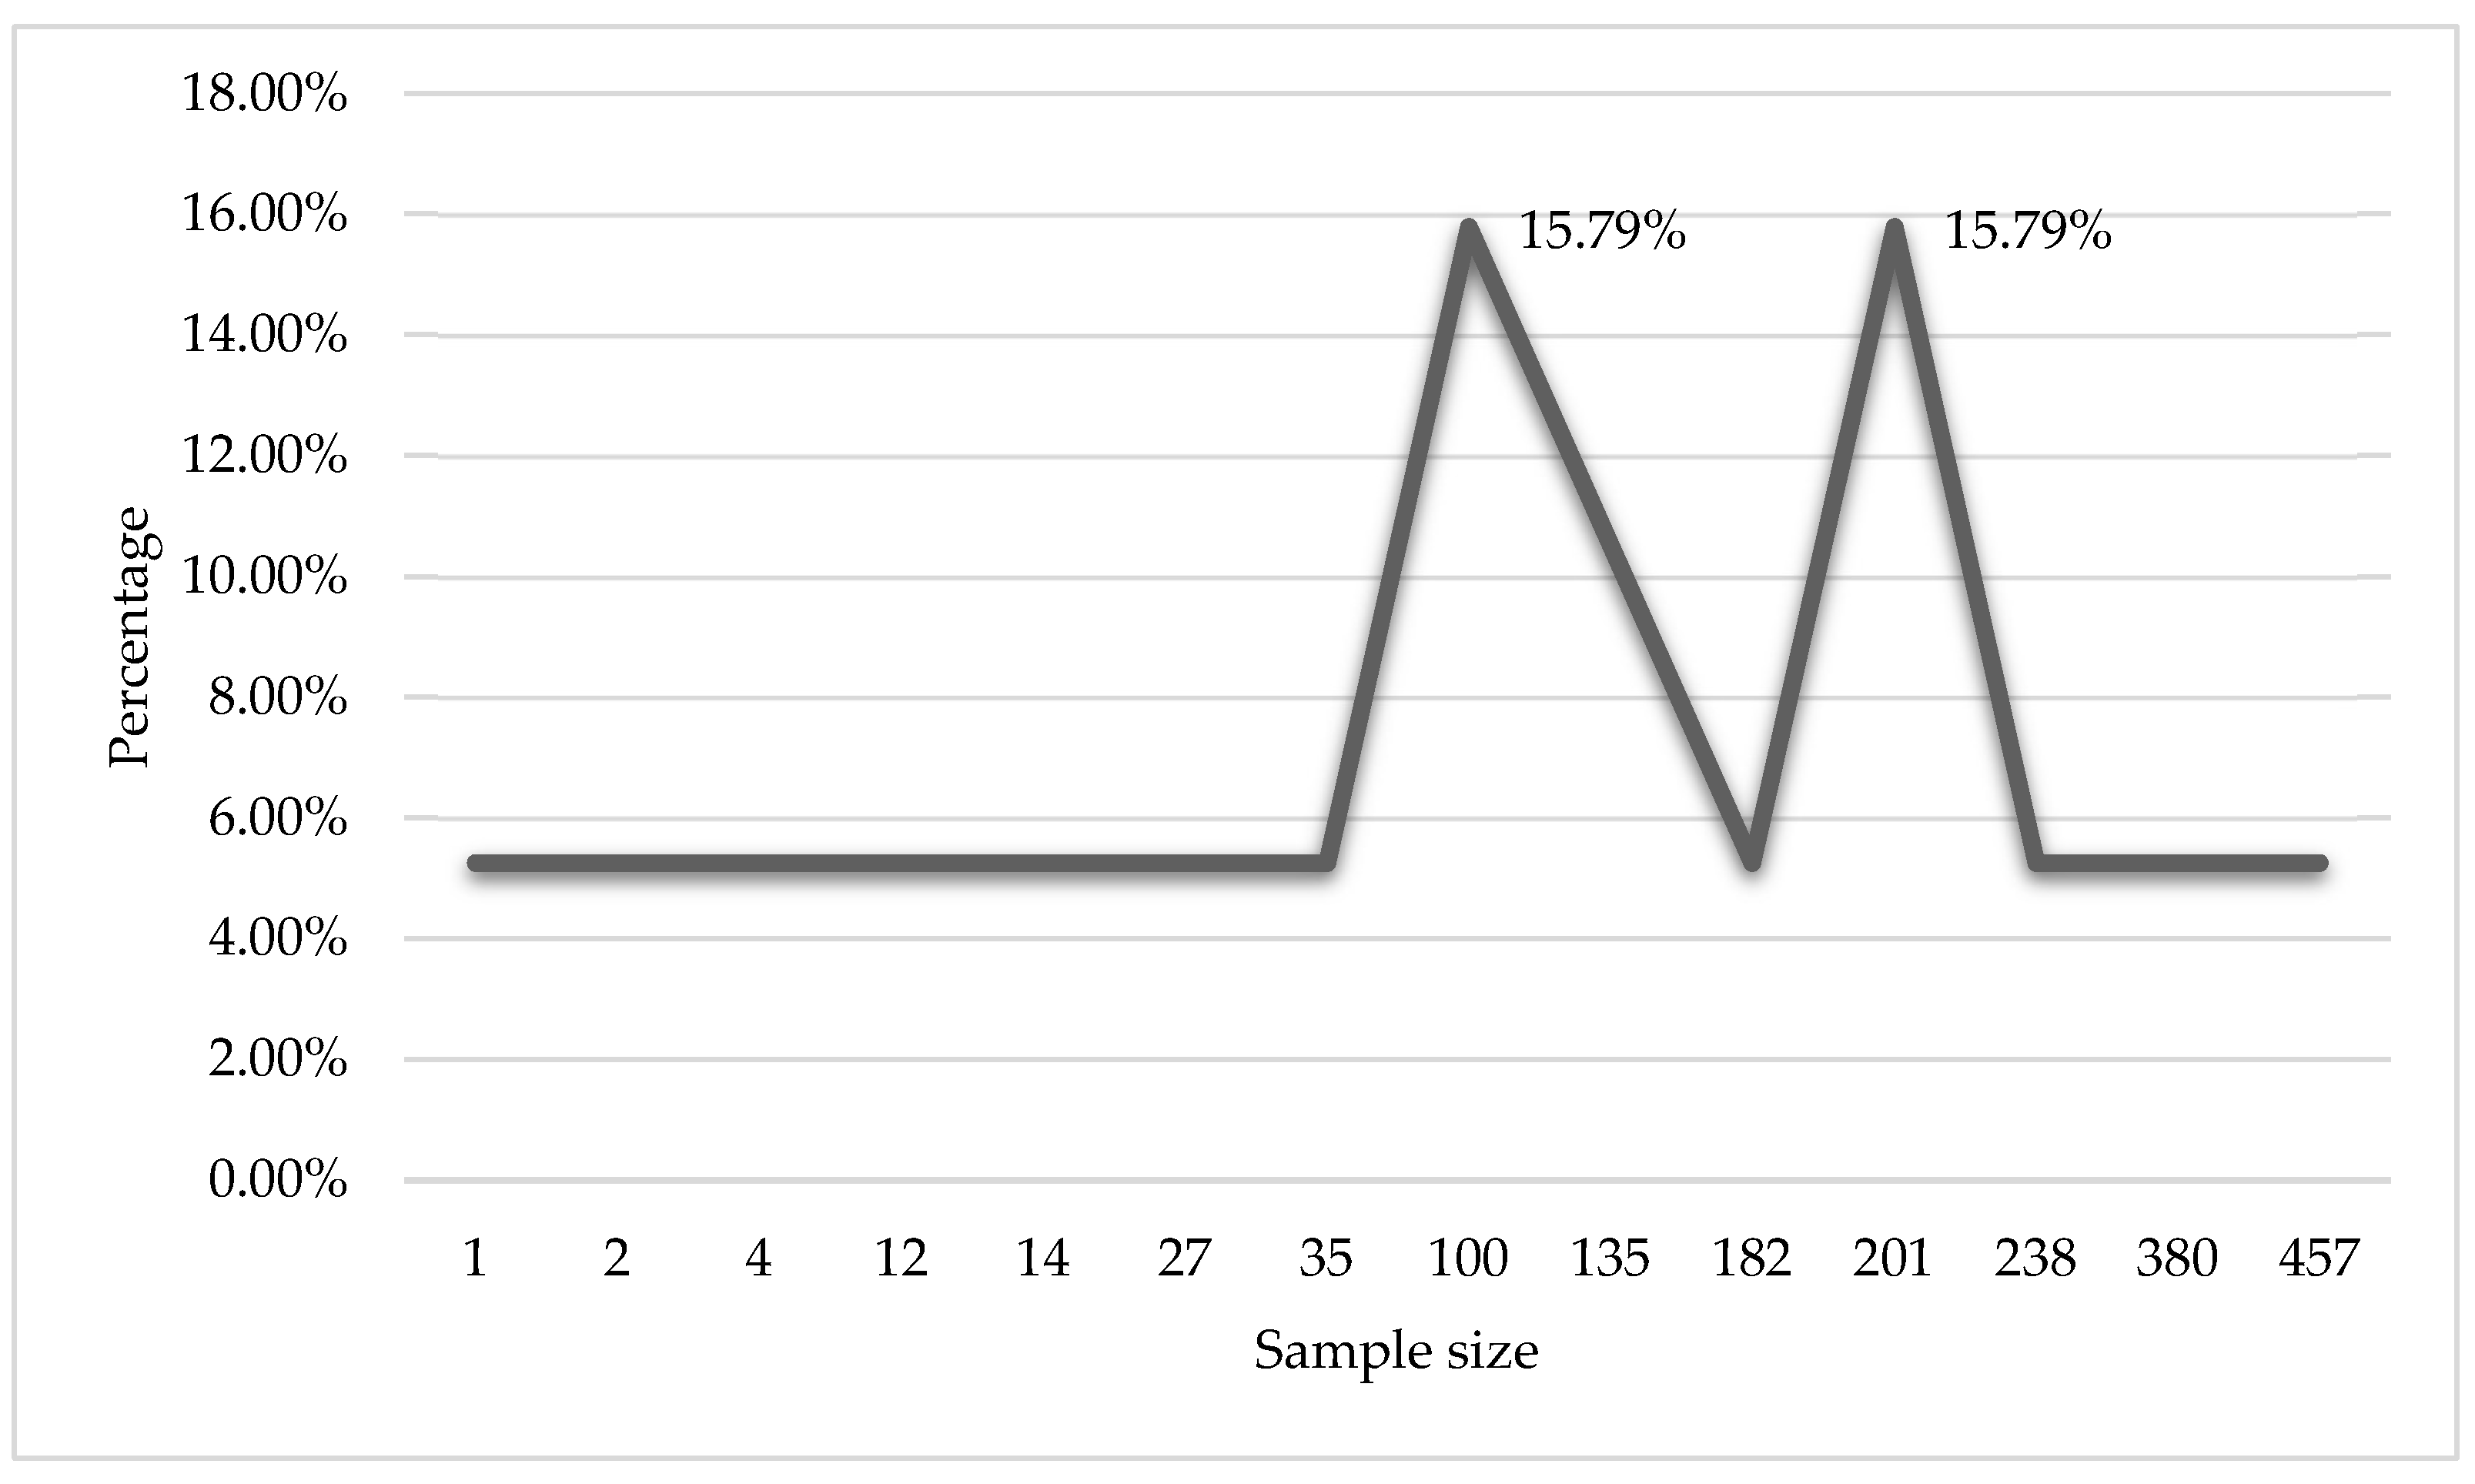
Figure 23.
Sample Characteristics.
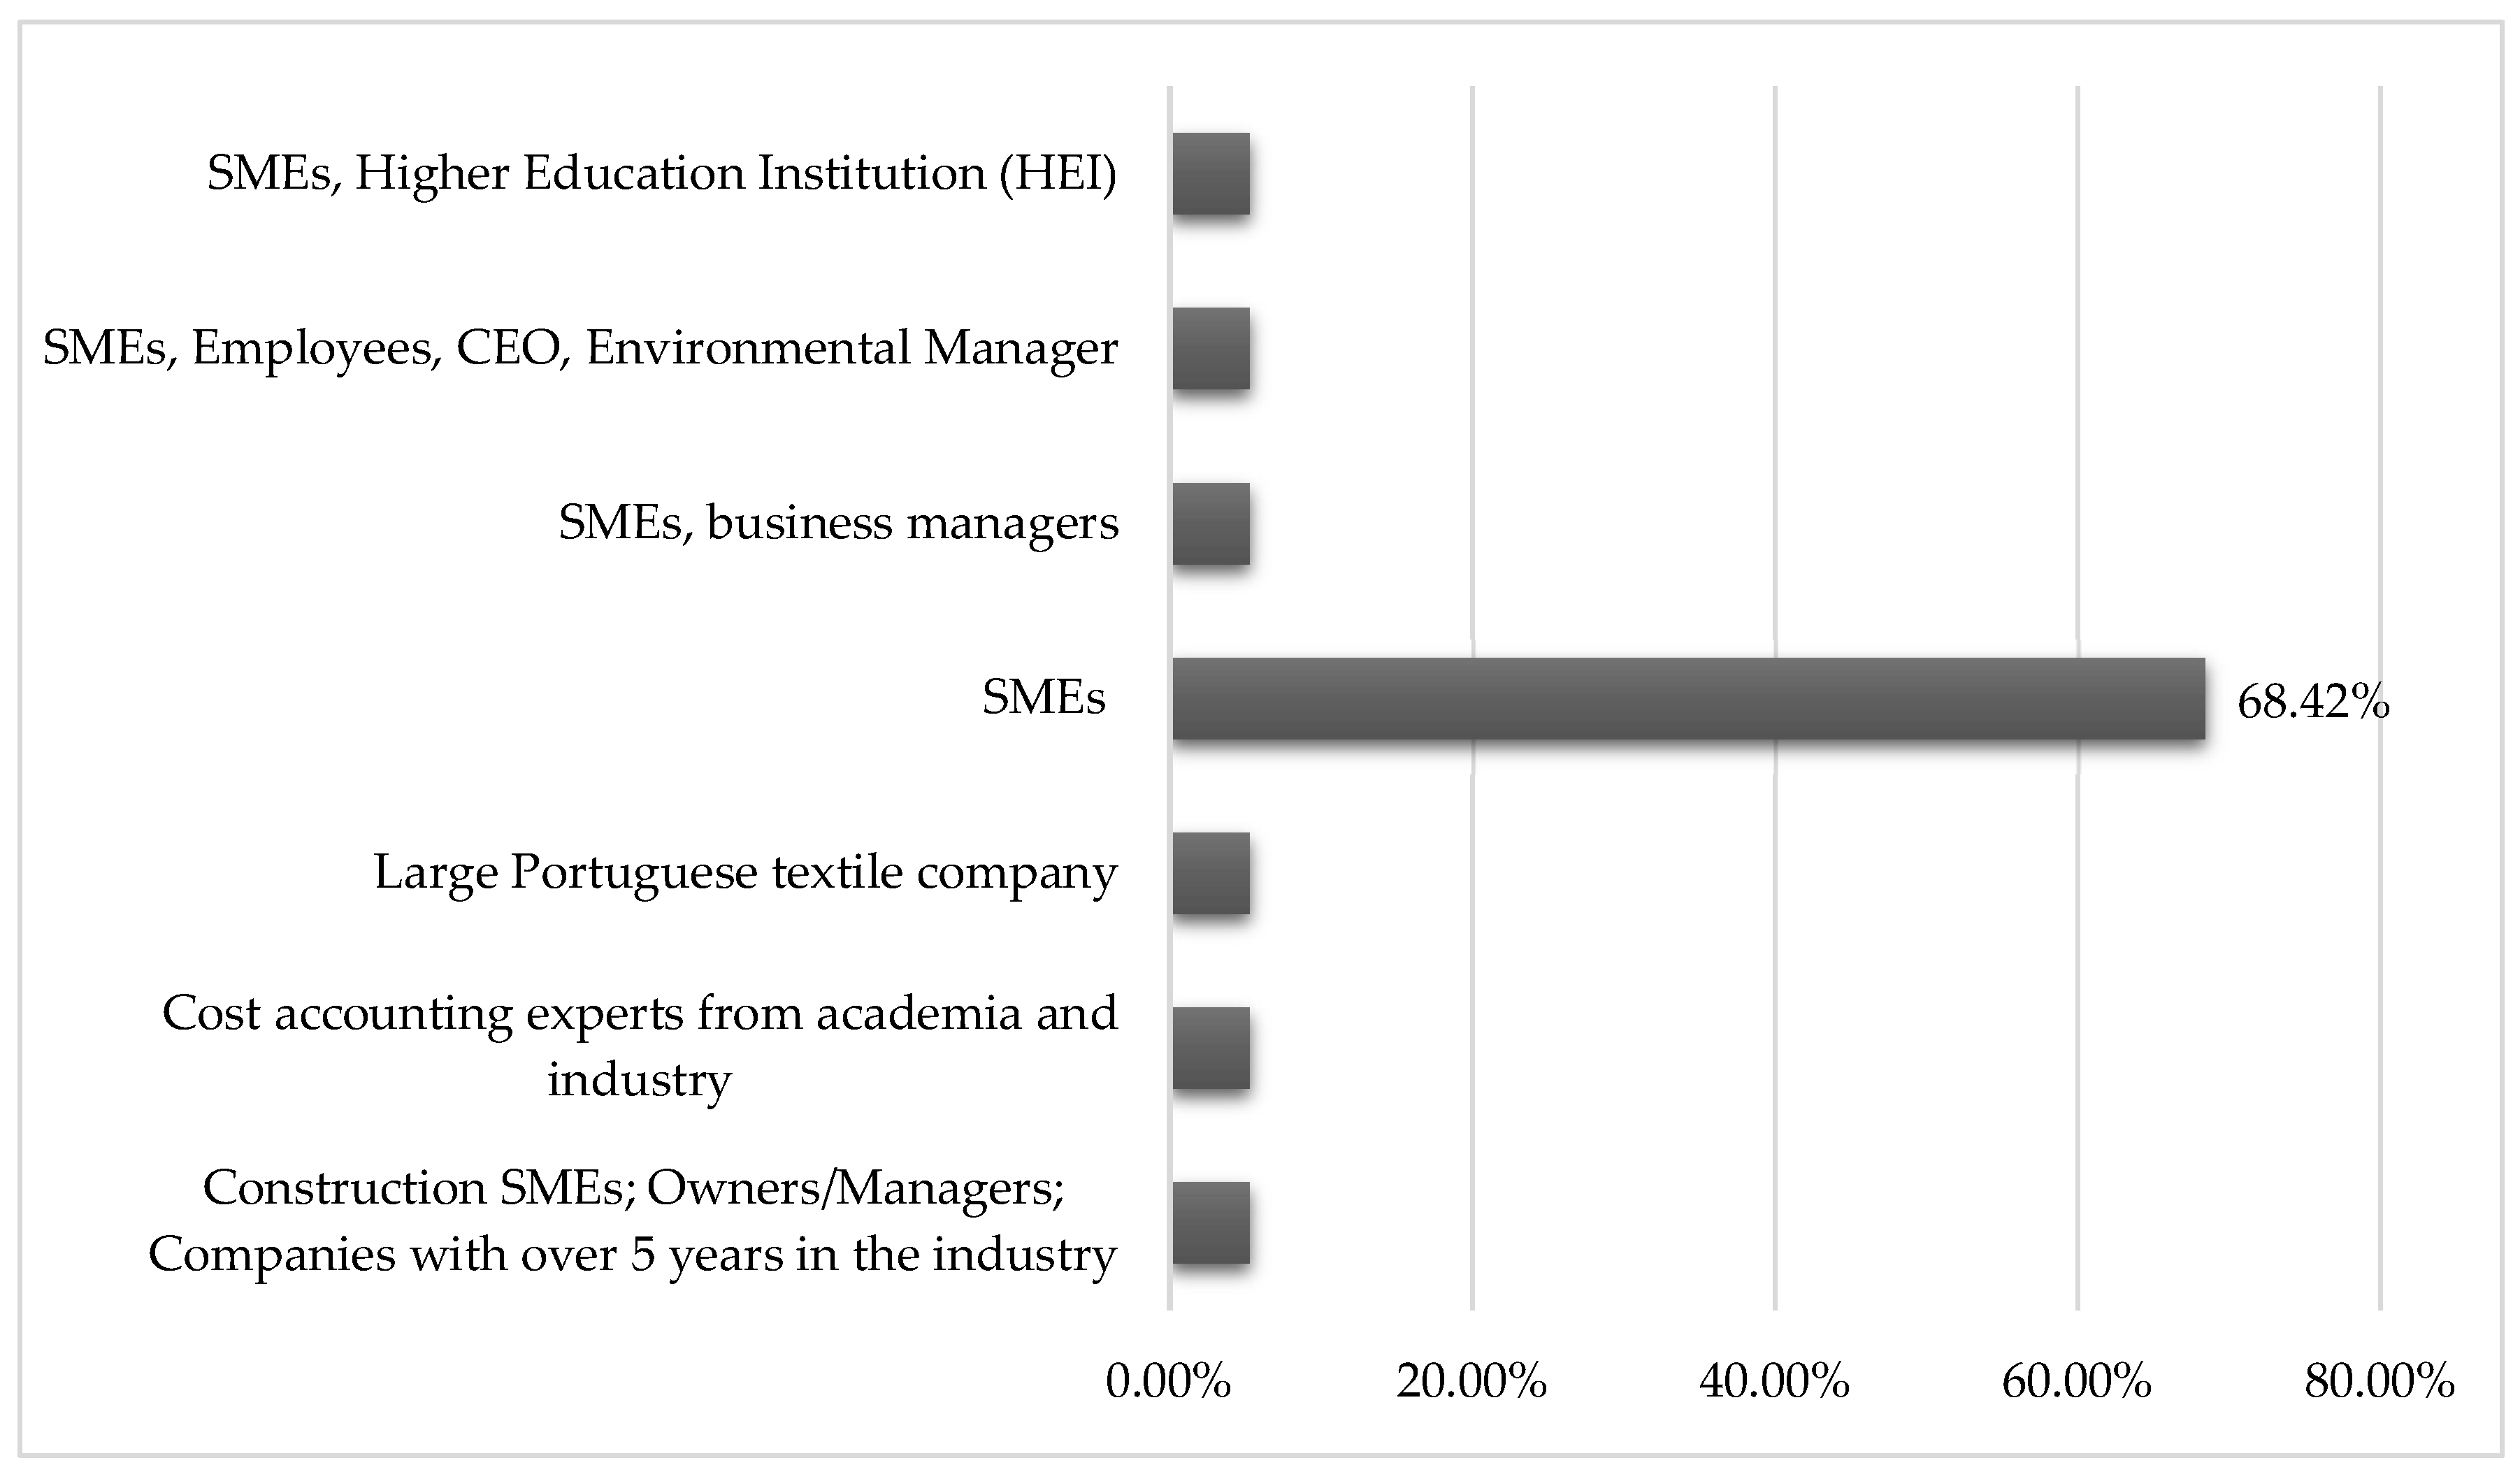
Figure 24.
Data Analytics Techniques.
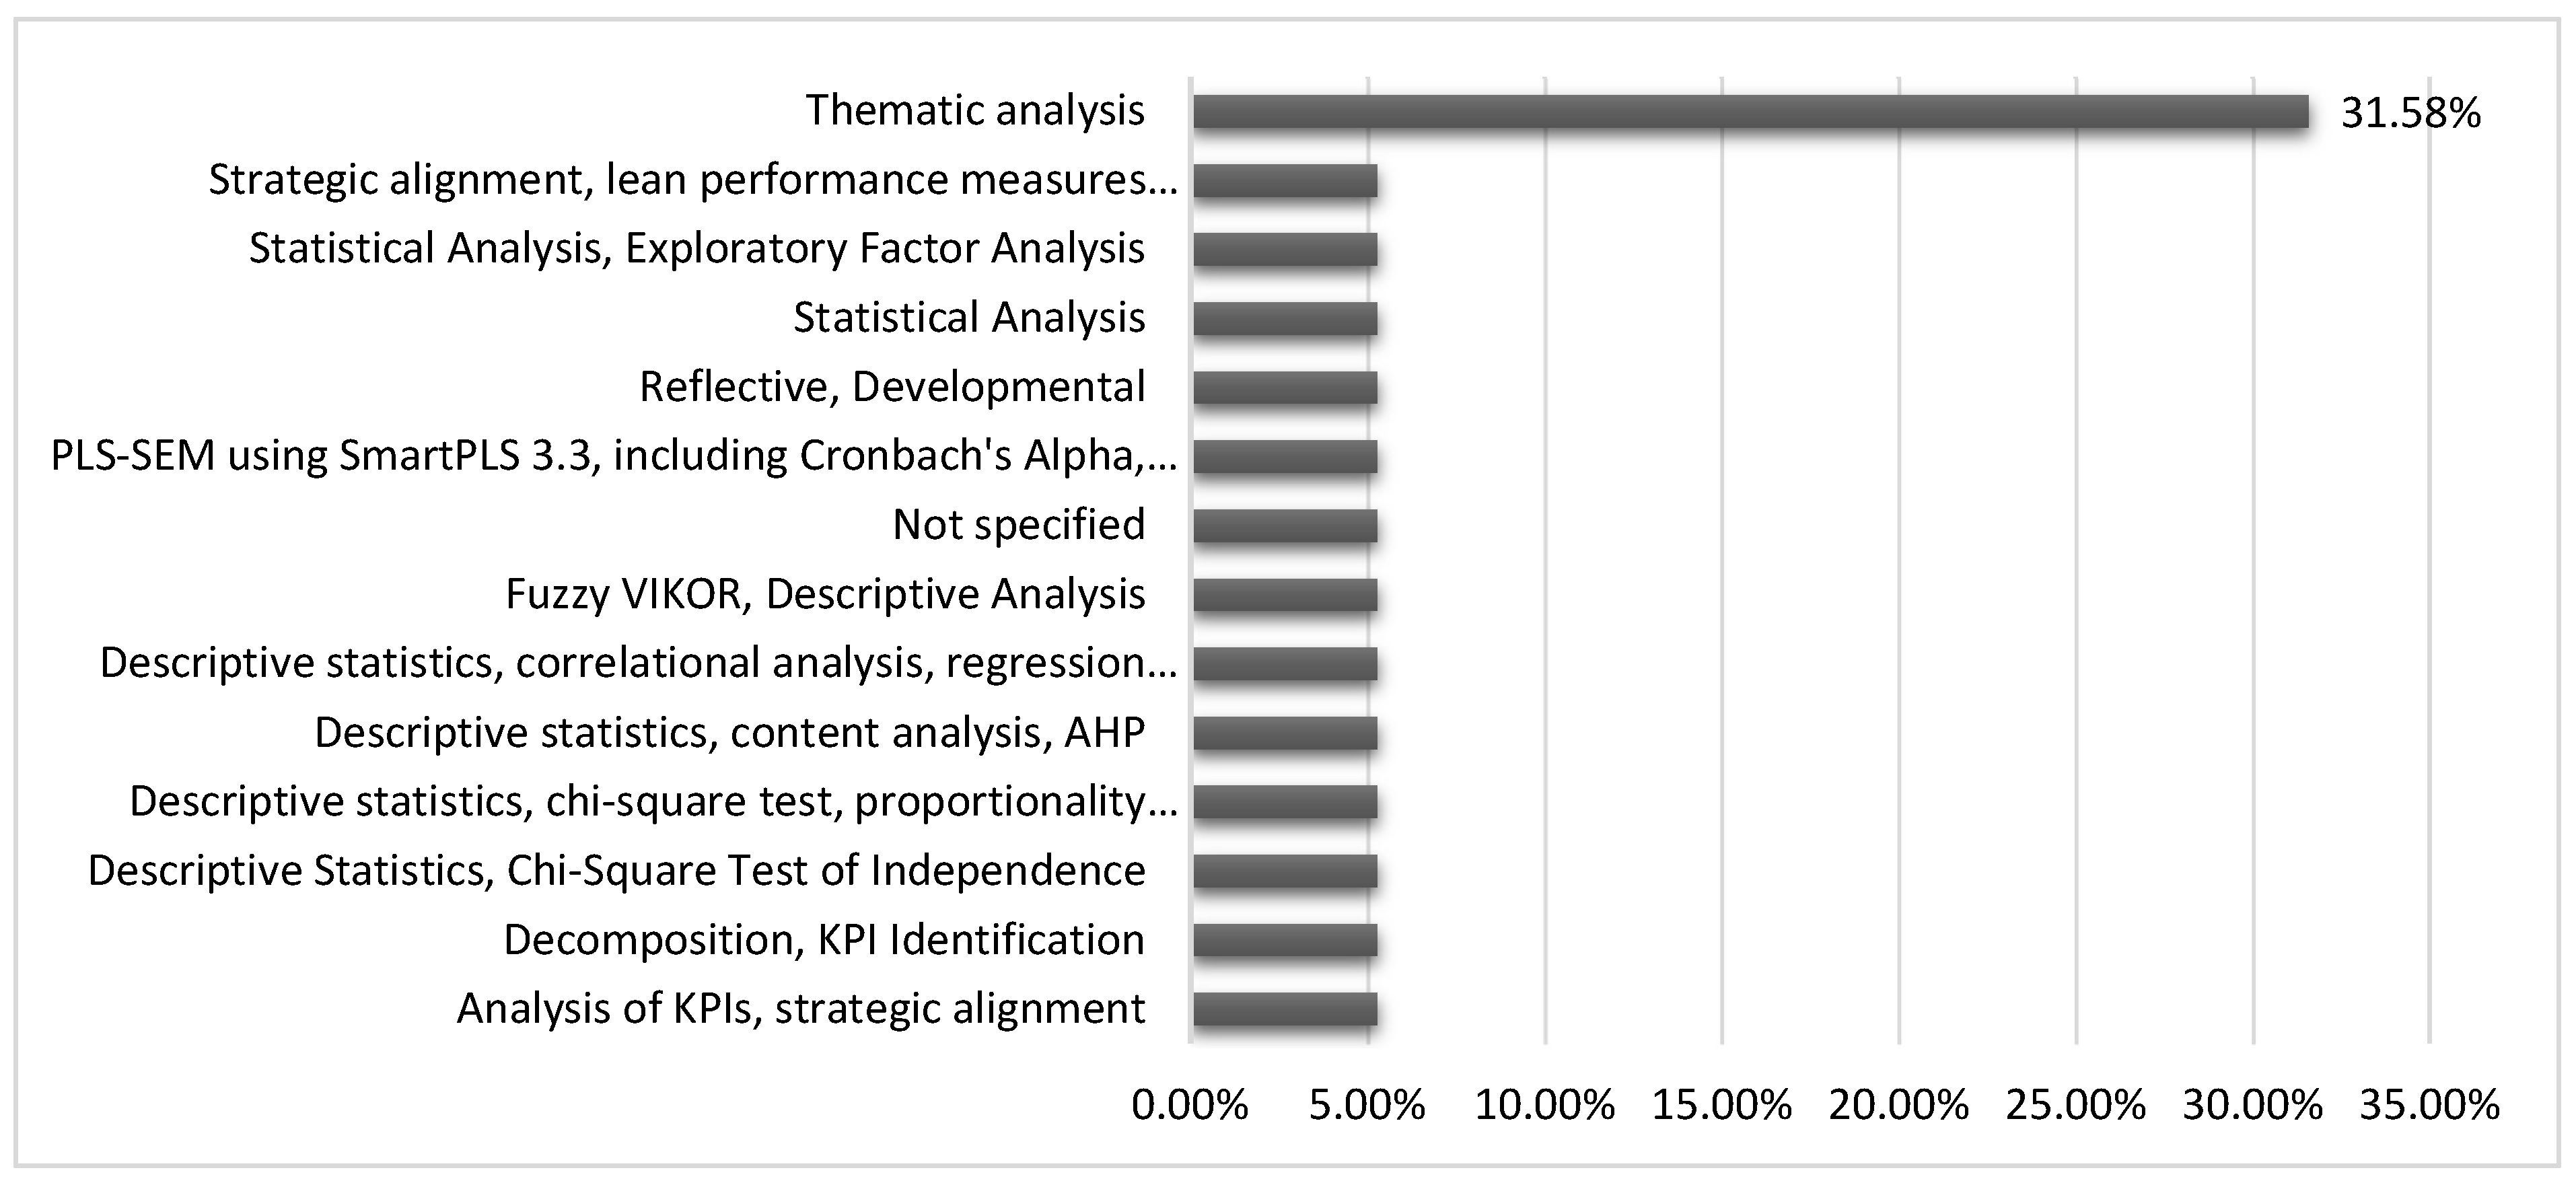
Table 1.
Comparative Analysis of the Existing Review Works and Proposed Systematic Review on the Implementation of the Balanced Scorecard on SMEs Performance.
Table 1.
Comparative Analysis of the Existing Review Works and Proposed Systematic Review on the Implementation of the Balanced Scorecard on SMEs Performance.
| Ref | Cites | Year | Contribution | Pros | Cons |
|---|---|---|---|---|---|
| [21] | 21 | 2014 | Address the gap in the literature regarding the use of the Balanced Scorecard in SMEs, and it reviews existing research and suggests an agenda for future studies specific to SMEs. | Emphasizes the lack of SME-focused BSC research. | The paper may not include specific quantitative data from SMEs. |
| [22] | 50 | 2015 | Pinpoints the current state of research and highlights the barriers and limitations faced by small businesses in implementing these concepts. | Offers a comprehensive review of how the BSC can integrate sustainability into small business management. | The research paper may not provide new empirical data or case studies. |
| [23] | 13 | 2016 | It assesses the benefits, implementation, as well as limitations of the BSC, particularly in SMEs. | Provides a comprehensive review of BSC across different sectors. | It is limited to research papers from specific quality ratings (Scopus), missing relevant research from other sources. |
| [24] | 44 | 2016 | Details the use, development, design, as well as consequences of BSC in SMEs, with particular attention to family firms. | Highlights research gaps and it provides guidance for studies in the future. | The review is limited to European, Australian, and North American contexts, and it overlooks other regions. |
| [25] | 10 | 2017 | Examines the BSC's efficacy, attributes, merits, and demerits, which provides a comprehensive evaluation of its application and implementation. | Identifies the potential benefits as well as characteristics of BSCs in large firms. | Only focuses on large organizations, potentially missing insights relevant to smaller organizations. |
| [26] | 5 | 2018 | Explores the constraints of the BSC model, its practice, its execution, and it assesses whether the BSC is a definitive solution for corporate performance measurement. | Contributes to the development of the model for performance measurement research. | Overshadows the benefits of BSCs because it only focuses on the constraints and limitations of BSCs. |
| [27] | 55 | 2020 | Organizes knowledge on the use stage of the Sustainability Balanced Scorecard (SBSC) and provides an overview of recent research. | Provides a comprehensive and literature review, maps research streams, and presents potential future research avenues in SBSC. | Limited to peer-reviewed articles in English from 2000–2020, which might exclude appropriate studies outside this scope. Focuses on ABS-ranked journals, resulting in missing other insights. |
| [28] | 201 | 2021 | Determines the current state of research on SBSCs related to environmental performance outcomes and proposes a conceptual framework. | Systematic literature review with a main focus on environmental performance outcomes; proposes a novel model linking SBSC, environmental performance, and expert managers. | Lacks consensus on the relationship between BSC architecture and environmental performance; constrained to articles published in double-blind peer-reviewed journals from 2001-2020. |
| [29] | 83 | 2021 | Reviews literature on the BSC system, focusing on the BSC-compensation link and its impact on company performance. | Comprehensive analysis of 117 empirical studies; identifies gaps in research, particularly in the BSC-compensation link. | 30 studies adequately capture the BSC as suggested by Kaplan and Norton; BSC's relevance in improving performance stays unproven. |
| [30] | 80 | 2022 | Reviews and evaluates the development of research on the balanced scorecard, exploring in detail its applications and criticisms. | Reviews and evaluates the development of research on the balanced scorecard, exploring in detail its applications and criticisms. | Restricted to studies from Q1 journals, which may exclude accurate research from lower-ranked sources; some skepticism exists regarding BSC's effectiveness. |
| [31] | 1 | 2022 | Reviews the relationship between strategic management and the development of Small and Medium Enterprises, focusing on the variation between ad hoc planning and structured strategic planning. It presents the lack of studies in developing economies. | Addresses a gap in literature regarding strategic management in SMEs, particularly in developing economies. | Limited empirical evidence on the direct relationship between strategic management and SMEs' performance; mainly focuses on theoretical frameworks. |
| [32] | 201 | 2023 | Reviews the application of the Balanced Scorecard across various fields and identifies the perspectives used in measuring organizational performance. | Provides a comprehensive overview of the Balanced Scorecard's implementation in different sectors. | Restricted to 30 articles and focuses solely on Indonesian authors, which may limit generalizability. |
| Summary | The reviewed literature underscore various aspects of Balanced Scorecard implementation in SMEs, including benefits, limitations, as well as regional applications. It identifies gaps in regional focus, empirical data, and scope of research, suggesting areas for further investigation such as integrating sustainability as well as expanding geographical coverage. | Provides a very comprehensive analysis of BSC implementation, underscores barriers, and suggests future research agendas. Covers many sectors and applications, contributing valuable insights to the field. | Limited by sectoral and regional focus, lack of new empirical data, as well as reliance on specific types of publications. Overemphasis on theoretical aspects, and restricted generalizability due to narrow research scopes. | ||
| Proposed Literature | Identifies new trends in the measurement of business performances, and it offers an important evaluation of how the implementation of BSC in SMEs evolved over time. | Provides comprehensive insights of the implementation of BSC in SMEs and helps uncover trends and findings that are new in performance measurement. | Limited by available data. Analysis is complex and time consuming. | ||
Table 2.
Proposed Inclusion and Exclusion Criteria.
| Criteria | Inclusion | Exclusion |
| Topic | Research papers focusing on Balanced Scorecard Methodology: Performance metrics and strategy execution | Research papers not focusing on Balanced Scorecard Methodology |
| Research Framework | The article must include a methodology for the implementation of BSC in SMEs | Articles that lack a clear methodology for BSC implementation |
| Language | Articles must be written in English | Articles written in other languages |
| Period | Publications between 2014 and 2024 | Publications outside the period 2014 and 2024 |
Table 3.
Summary of Study Characteristics.
| Ref | Sample size | Subject Area | Perspectives of BSC | KPIs |
|---|---|---|---|---|
| [36] | 201 | Balanced Scorecard | Finance, customer, internal processes | ROI |
| [37] | 238 | Balanced Scorecard | Financial, Internal Processes | Customer satisfaction |
| [38] | 100 | Balanced Scorecard | Financial, Customer, Internal Processes, Learning and Growth | Customer satisfaction |
| [39] | 1 | Balanced Scorecard | Financial, Customer, Internal Processes | ROI |
| [40] | 380 | SME Performance | Financial, Customer, Internal Processes, Learning and Growth | ROI |
| [41] | 135 | SME Performance | Financial, Customer, Internal Processes, Learning and Growth | ROI |
| [42] | 35 | SME Performance | Financial, Customer, Internal Processes, Learning and Growth | Customer satisfaction |
| [43] | 4 | Balanced Scorecard | Financial, Customer, Internal Processes, Learning and Growth | Customer satisfaction |
| [44] | 27 | SME Performance | Financial, Customer, Internal Processes, Learning and Growth | ROI |
| [45] | 14 | SME Performance | Financial, Customer, Internal Processes, Learning and Growth | Employee engagement |
| [46] | 2 | Balanced Scorecard | Financial, Customer, Internal Processes, Learning and Growth | Customer satisfaction |
| [47] | 457 | SME Performance | Financial, Customer, Internal Processes, Learning and Growth | Customer satisfaction |
| [48] | 12 | Balanced Scorecard | Financial, Customer, Internal Processes, Learning and Growth | ROI |
| [49] | 135 | Balanced Scorecard | Financial, Customer, Internal Processes, Learning and Growth | ROI |
| [50] | 182 | Balanced Scorecard | Financial, Internal Processes | Not specified |
| [51] | 100 | SME Performance | Financial, Customer, Internal Processes, Learning and Growth | Employee engagement |
| [52] | 100 | SME Performance | Financial, Customer, Internal Processes, Learning and Growth | ROI |
| [53] | 201 | Balanced Scorecard | Finance, customer, internal processes | Customer satisfaction |
| [54] | 201 | SME Performance | Financial, Customer, Internal Processes, Learning and Growth | Employee engagement |
| [55] | 549 | Balanced Scorecard | Financial, Internal Processes | ROI |
| [56] | 14 | Balanced Scorecard | Financial, Customer, Internal Processes, Learning and Growth | Not specified |
| [57] | 12 | SME Performance | Financial, Customer, Internal Processes, Learning and Growth | ROI |
| [58] | 160 | SME performance | Financial, Customer, Internal Processes, Learning and Growth | Customer satisfaction |
| [59] | 549 | Balanced Scorecard | Finance, customer, internal processes | ROI |
| [60] | 14 | Balanced Scorecard | Financial, Customer, Internal Processes, Learning and Growth | Customer satisfaction |
| [61] | Not specified |
SME Performance | Financial, Customer, Internal Processes, Learning and Growth | ROI |
| [62] | 111 | SME Performance | Finance, customer, internal processes | ROI |
| [63] | 29 | Balanced Scorecard | Financial, Internal Processes | Not specified |
| [64] | 385 | Balanced Scorecard | Financial, Customer, Internal Processes, Learning and Growth | ROI |
| [65] | 600 | SME Performance | Financial, Customer, Internal Processes, Learning and Growth | Customer satisfaction |
| [66] | 12 | SME Performance | Financial, Customer, Internal processes, Learning and growth | Employee engagement |
| [67] | Not specified |
SME Performance | Financial, Customer, Internal Processes, Learning and Growth | Not specified |
| [68] | Not specified |
Balanced Scorecard | Financial, Customer, Internal processes, Learning and growth | Employee engagement |
| [69] | 1 | Balanced Scorecard | Financial, Customer, Internal Processes, Learning and Growth | ROI |
| [70] | 50 | SME Performance | Financial, Customer, Internal Processes, Learning and Growth | Customer satisfaction |
| [71] | 67 | Balanced Scorecard | Financial, Customer, Internal Processes, Learning and Growth | Customer satisfaction |
| [72] | 5 | SME Performance | Financial, Customer, Internal Processes, Learning and Growth | Not specified |
| [73] | Not specified |
Balanced Scorecard | Financial, Customer, Internal Processes, Learning and Growth | ROI |
| [74] | 202 | SME Performance | Financial, Customer, Internal Processes, Learning and Growth | Customer satisfaction |
| [75] | 4 | Balanced Scorecard | Financial, Internal Processes | Customer satisfaction |
| [76] | 225 | SME Performance | Finance, customer, internal processes | Employee engagement |
| [77] | 5 | Balanced Scorecard | Finance, customer, internal processes | Customer satisfaction |
| [78] | 200 | SME Performance | Financial, Customer, Internal Processes, Learning and Growth | ROI |
| [79] | 7 | Not specified | Financial, Customer, Internal Processes, Learning and Growth | Customer satisfaction |
| [80] | 4071 | SME Performance | Finance, customer, internal processes | Employee engagement |
| [81] | 130 | SME Performance | Financial, Customer, Internal Processes, Learning and Growth | Customer satisfaction |
| [82] | 120 | Balanced Scorecard | Finance, customer, internal processes | ROI |
| [83] | 529 | Balanced Scorecard | Financial, Customer, Internal Processes, Learning and Growth | Employee engagement |
| [84] | 100 | Balanced Scorecard | Financial, Customer, Internal Processes, Learning and Growth | Customer satisfaction |
| [85] | 5 | SME Performance | Financial, Customer, Internal Processes, Learning and Growth | Not specified |
| [86] | 31 | Balanced Scorecard | Finance, customer, internal processes | Customer satisfaction |
| [87] | 5 | Balanced Scorecard | customer, Financial, Customer, Internal Processes, Learning and Growth | Customer satisfaction |
| [88] | 111 | SME Performance | Financial, Customer, Internal Processes, Learning and Growth | Employee engagement |
| [89] | 386 | SME Performance | Financial, Customer, Internal Processes, Learning and Growth | Customer satisfaction |
| [90] | 40 | Balanced Scorecard | Financial, Customer, Internal Processes, Learning and Growth | ROI |
| [91] | 150 | Balanced Scorecard | Financial, Customer, Internal processes, Learning and growth | Customer satisfaction |
| [92] | 100 | Balanced Scorecard | Financial, Customer, Internal Processes, Learning and Growth | Customer satisfaction |
| [93] | 2 | Balanced Scorecard | Financial, Customer, Internal Processes, Learning and Growth | Employee engagement |
| [94] | 154 | SME Performance | Financial, Customer, Internal Processes, Learning and Growth | ROI |
| [95] | 10 | SME Performance | Financial, Customer, Internal Processes, Learning and Growth | ROI |
| [96] | 15 | Balanced Scorecard | Financial, Customer, Internal Processes, Learning and Growth | ROI |
| [97] | 8 | SME Performance | Financial, Customer, Internal Processes, Learning and Growth | ROI |
| [98] | 20 | Balanced Scorecard | Financial, Customer, Internal Processes, Learning and Growth | ROI |
| [99] | 30 | SME Performance | Financial, Customer, Internal Processes, Learning and Growth | ROI |
| [100] | 12 | Balanced Scorecard | Financial, Customer, Internal Processes, Learning and Growth | ROI |
| [101] | 10 | Not specified | Financial, Customer, Internal Processes, Learning and Growth | ROI |
| [102] | 4739 | Balanced Scorecard | Financial, Customer, Internal Processes, Learning and Growth | ROI |
| [103] | 4739 | Balanced Scorecard | Financial, Customer, Internal Processes, Learning and Growth | Customer satisfaction |
| [104] | 8 | Balanced Scorecard | Financial, Customer, Internal Processes, Learning and Growth | Employee engagement |
| [105] | 274 | SME Performance | Financial, Customer, Internal Processes, Learning and Growth | Employee engagement |
| [106] | 160 | Balanced Scorecard | Financial, Internal Processes | Not specified |
| [107] | 384 | SME Performance | Finance, customer, internal processes | Employee engagement |
| [108] | 135 | SME Performance | Financial, Customer, Internal processes, Learning and growth | Employee engagement |
| [109] | 156 | SME Performance | Financial, Customer, Internal Processes, Learning and Growth | Employee engagement |
| [110] | 12 | Balanced Scorecard | Financial, Customer, Internal Processes, Learning and Growth | Not specified |
| [111] | 309 | SME Performance | Financial, Internal Processes | Employee engagement |
| [112] | 219 | Balanced Scorecard | Financial, Customer, Internal Processes, Learning and Growth | Customer satisfaction |
| [113] | 135 | SME Performance | Finance, customer, internal processes | Employee engagement |
| [114] | 1 000 | SME Performance | Finance, customer, internal processes | Customer satisfaction |
| [115] | 120 | SME Performance | Financial, Customer, Internal Processes, Learning and Growth | Employee engagement |
| [116] | 400 | Balanced Scorecard | Financial, Customer, Internal Processes, Learning and Growth | Customer satisfaction |
| [117] | 156 | SME Performance | Financial, Customer, Internal Processes, Learning and Growth | Customer satisfaction |
| [118] | 40 | Balanced Scorecard | Finance, customer, internal processes | Employee engagement |
| [119] | 107 | SME Performance | Customer, Internal Processes | Employee engagement |
| [120] | 15 | Balanced Scorecard | Financial, Customer, Internal Processes, Learning and Growth | Employee engagement |
| [121] | 100 | SME Performance | Financial, Customer, Internal Processes, Learning and Growth | Customer satisfaction |
| [122] | 16 | SME Performance | Financial, Customer, Internal Processes | Employee engagement |
| [123] | 750 | Not specified | Financial, Customer, Internal Processes, Learning and Growth | Employee engagement |
| [124] | 88 | Balanced Scorecard | Financial, Customer, Internal Processes, Learning and Growth | Customer satisfaction |
| [125] | 15 | Balanced Scorecard | Financial, Customer, Internal Processes, Learning and Growth | ROI |
| [126] | 4071 | SME Performance | Financial, Customer Satisfaction | Customer satisfaction |
| [127] | 225 | SME Performance | Financial, Customer, Internal Processes, Learning and Growth | Customer satisfaction |
| [128] | 5 | SME Performance | Finance, customer, internal processes | Employee engagement |
| [129] | 30 | SME Performance | Financial, Customer, Internal Processes, Learning and Growth | Employee engagement |
| [130] | 200 | SME Performance | Financial, Customer, Internal Processes, Learning and Growth | Employee engagement |
| [131] | 350 | Balanced Scorecard | Finance, customer, internal processes | Customer satisfaction |
| [132] | 404 | SME Performance | Financial, Customer, Internal Processes, Learning and Growth | Customer satisfaction |
| [133] | 5 | SME Performance | Financial, Customer, Internal Processes, Learning and Growth | ROI |
| [134] | 277 | SME Performance | Financial, Customer, Internal processes, Learning and growth | Employee engagement |
| [135] | Not specified |
SME Performance | Finance, customer, internal processes | ROI |
| [136] | 1 | Balanced Scorecard | Financial, Customer, Internal Processes, Learning and Growth | ROI |
| [137] | 6 | Balanced Scorecard | Finance, customer, internal processes | ROI |
| [138] | 79 | SME Performance | Financial, Customer, Internal Processes, Learning and Growth | Customer satisfaction |
| [139] | Not specified |
SME Performance | Finance, customer, internal processes | ROI |
| [140] | 15 | SME Performance | Financial, Customer, Internal Processes, Learning and Growth | Not specified |
| [141] | 223 | SME Performance | Finance, customer, internal processes | ROI |
| [142] | 60 | Not specified | Financial, Customer, Internal Processes, Learning and Growth | Employee engagement |
| [143] | 10 | SME Performance | Finance, customer, internal processes | ROI |
| [144] | 20 | Balanced Scorecard | Financial, Customer, Internal Processes, Learning and Growth | ROI |
| [145] | 15 | Balanced Scorecard | Financial, Customer, Internal processes | ROI |
| [146] | Not specified |
Balanced Scorecard | Financial, Customer, Internal Processes, Learning and Growth | Customer satisfaction |
| [147] | Not specified |
SME Performance | Finance, customer, internal processes | ROI |
| [148] | Not specified |
Not specified | Financial, Customer, Internal Processes, Learning and Growth | Employee engagement |
| [149] | 1 | SME Performance | Financial, Customer, Internal Processes, Learning and Growth | ROI |
| [150] | 100 | SME Performance | Financial, Customer, Internal Processes | ROI |
| [151] | Not specified |
Balanced Scorecard | Financial, customer, internal processes, learning and growth | Employee engagement |
| [152] | Not specified |
Not specified | Financial, Customer, Internal Processes, Learning and Growth | Employee engagement |
| [153] | 451 | SME Performance | Finance, customer, internal processes | Not specified |
| [154] | 399 | SME Performance | Financial, Customer, Internal Processes, Learning and Growth | ROI |
| [155] | Not specified |
Balanced Scorecard | Financial, Customer, Internal Processes, Learning and Growth | ROI |
| [156] | 3 | SME Performance | Finance, customer, internal processes | Employee engagement |
| [157] | 251 | SME Performance | Finance, customer, internal processes | ROI |
| [158] | 933 | Balanced Scorecard | Financial, Customer, Internal Processes, Learning and Growth | ROI |
| [159] | 101 | SME Performance | Finance, customer, internal processes | Employee engagement |
| [160] | 227 | Not specified | Financial, Customer, Internal Processes, Learning and Growth | Employee engagement |
| [161] | 10 | SME Performance | Finance, customer, internal processes | Not specified |
| [162] | 200 | SME Performance | Financial, Customer, Internal Processes, Learning and Growth | Employee engagement |
| [163] | 10 | Balanced Scorecard | Financial, Customer, Internal Processes, Learning and Growth | ROI |
| [164] | Not specified |
Balanced Scorecard | Financial, Customer, Internal Processes, Learning and Growth | Not specified |
| [165] | 130 | Not specified | Finance, customer, internal processes | Employee engagement |
| [166] | 813 | Balanced Scorecard | Financial, Customer, Internal Processes, Learning and Growth | ROI |
| [167] | 130 | SME Performance | Financial, Customer, Internal processes, Learning and growth | Not specified |
| [168] | 143 | Balanced Scorecard | Finance, customer, internal processes | ROI |
| [169] | 346 | SME Performance | Financial, Customer, Internal Processes, Learning and Growth | Not specified |
| [170] | 56 | Balanced Scorecard | Financial, Customer, Internal Processes, Learning and Growth | ROI |
Table 4.
Summary of Study Assessments.
| Ref | Random sequence Generation | Allocation Concealment | Blinding of Participants & Personnel | Blinding of Outcome Assessment | Incomplete Outcome Data | Selective Reporting | Other Bias | Overall Risk of Bias |
|---|---|---|---|---|---|---|---|---|
| [36] | UNCLEAR | UNCLEAR | UNCLEAR | UNCLEAR | LOW | LOW | LOW | UNCLEAR |
| [37] | UNCLEAR | UNCLEAR | LOW | LOW | LOW | LOW | LOW | LOW |
| [38] | UNCLEAR | UNCLEAR | UNCLEAR | UNCLEAR | UNCLEAR | UNCLEAR | UNCLEAR | UNCLEAR |
| [39] | UNCLEAR | UNCLEAR | UNCLEAR | UNCLEAR | LOW | UNCLEAR | UNCLEAR | UNCLEAR |
| [40] | UNCLEAR | UNCLEAR | UNCLEAR | UNCLEAR | LOW | LOW | LOW | UNCLEAR |
| [41] | UNCLEAR | UNCLEAR | UNCLEAR | UNCLEAR | LOW | UNCLEAR | HIGH | HIGH |
| [42] | UNCLEAR | UNCLEAR | UNCLEAR | UNCLEAR | LOW | LOW | LOW | UNCLEAR |
| [43] | UNCLEAR | UNCLEAR | UNCLEAR | UNCLEAR | LOW | LOW | LOW | UNCLEAR |
| [44] | UNCLEAR | UNCLEAR | UNCLEAR | UNCLEAR | UNCLEAR | LOW | LOW | UNCLEAR |
| [45] | UNCLEAR | UNCLEAR | LOW | UNCLEAR | LOW | LOW | LOW | LOW |
| [46] | UNCLEAR | HIGH | UNCLEAR | UNCLEAR | UNCLEAR | LOW | LOW | HIGH |
| [47] | UNCLEAR | UNCLEAR | LOW | UNCLEAR | UNCLEAR | UNCLEAR | LOW | UNCLEAR |
| [48] | UNCLEAR | UNCLEAR | UNCLEAR | UNCLEAR | LOW | UNCLEAR | LOW | LOW |
| [49] | UNCLEAR | UNCLEAR | LOW | UNCLEAR | UNCLEAR | LOW | HIGH | HIGH |
| [50] | UNCLEAR | UNCLEAR | UNCLEAR | UNCLEAR | LOW | LOW | LOW | UNCLEAR |
| [51] | UNCLEAR | UNCLEAR | LOW | UNCLEAR | LOW | LOW | LOW | LOW |
| [52] | UNCLEAR | UNCLEAR | UNCLEAR | UNCLEAR | LOW | UNCLEAR | HIGH | HIGH |
| [53] | UNCLEAR | UNCLEAR | UNCLEAR | UNCLEAR | UNCLEAR | LOW | LOW | UNCLEAR |
| [54] | UNCLEAR | UNCLEAR | UNCLEAR | UNCLEAR | LOW | LOW | LOW | UNCLEAR |
| [55] | UNCLEAR | UNCLEAR | LOW | LOW | LOW | LOW | LOW | LOW |
| *** | *** | *** | *** | *** | *** | *** | *** | *** |
| *** | *** | *** | *** | *** | *** | *** | *** | *** |
| *** | *** | *** | *** | *** | *** | *** | *** | *** |
| [160] | UNCLEAR | UNCLEAR | UNCLEAR | UNCLEAR | LOW | LOW | LOW | UNCLEAR |
| [161] | UNCLEAR | UNCLEAR | LOW | LOW | LOW | LOW | LOW | LOW |
| [162] | UNCLEAR | UNCLEAR | LOW | UNCLEAR | LOW | LOW | LOW | LOW |
| [163] | UNCLEAR | UNCLEAR | UNCLEAR | UNCLEAR | LOW | UNCLEAR | HIGH | HIGH |
| [164] | UNCLEAR | UNCLEAR | LOW | LOW | LOW | LOW | LOW | LOW |
| [165] | UNCLEAR | UNCLEAR | UNCLEAR | UNCLEAR | LOW | LOW | LOW | UNCLEAR |
| [166] | UNCLEAR | UNCLEAR | LOW | UNCLEAR | LOW | LOW | LOW | LOW |
| [167] | UNCLEAR | UNCLEAR | UNCLEAR | UNCLEAR | UNCLEAR | LOW | LOW | UNCLEAR |
| [168] | UNCLEAR | UNCLEAR | UNCLEAR | UNCLEAR | LOW | UNCLEAR | HIGH | HIGH |
| [169] | UNCLEAR | UNCLEAR | UNCLEAR | UNCLEAR | LOW | LOW | LOW | UNCLEAR |
| [170] | UNCLEAR | UNCLEAR | LOW | LOW | LOW | LOW | LOW | LOW |
Table 5.
Summary of Studies.
| Ref | Year | Country | Financial | Customer | Internal process | Learning and growth | Organizational outcomes | Long-term impacts |
|---|---|---|---|---|---|---|---|---|
| [36] | 2017 | Spain | yes | Yes | yes | no | Not specified | Enhanced organizational efficiencies |
| [37] | 2018 | Vietnam | yes | Yes | no | no | Not specified | Improved Performance, Strategic Alignment |
| [38] | 2015 | Portugal | yes | Yes | yes | no | Awareness of lean practices, improved performance | Business sustainability, competitive advantage |
| [39] | 2018 | Romania | yes | Yes | yes | yes | Improved strategic management, high efficiency in resource use | Enhanced strategic management, potential for increased market share |
| [40] | 2023 | Pakistan | yes | Yes | yes | yes | Improved communication, better understanding of goals | Enhanced performance, potential competitive advantage |
| [41] | 2018 | United Kingdom | yes | Yes | yes | yes | Top-management commitment, employee education, organizational buy-in | Positive return on investment, enhanced implementation of BSC in SMEs |
| [42] | 2020 | Eswatini | yes | No | yes | no | Employee satisfaction, customer satisfaction, innovation | Business sustainability, growth, competitive advantage |
| [43] | 2018 | Portugal | yes | No | yes | yes | Employee satisfaction, Customer loyalty, Increased training hours | Business sustainability, Competitive advantage, Market consolidation |
| [44] | 2019 | South Africa | yes | Yes | yes | yes | Improved decision-making, process optimization | Business sustainability, competitive advantage |
| [45] | 2016 | Austria | no | No | no | no | Employee Motivation, Customer Service | Business Sustainability, Competitive Advantage |
| [46] | 2021 | Portugal | yes | Yes | yes | yes | Improved Communication, Organizational Performance | Business Sustainability, Competitive Advantage |
| [47] | 2023 | Vietnam | yes | Yes | yes | yes | Employee Satisfaction, Customer Satisfaction | Business Sustainability, Competitive Advantage |
| [48] | 2022 | United Kingdom | yes | Yes | yes | yes | Employee Satisfaction, Customer Satisfaction | Business Sustainability, Competitive Advantage |
| [49] | 2018 | Slovakia | yes | Yes | yes | yes | Employee satisfaction, customer satisfaction | Business sustainability, competitive advantage |
| [50] | 2020 | Slovakia | yes | no | yes | no | Employee Satisfaction, Customer Satisfaction | Business Sustainability, Competitive Advantage |
| [51] | 2024 | United Kingdom | yes | Yes | yes | yes | Knowledge Transfer Effectiveness, Improved Performance | Business Sustainability, Competitive Advantage |
| [52] | 2019 | Indonesia | yes | Yes | yes | yes | Employee Training Participation, Customer Retention | Business Growth, Improved Performance Monitoring |
| [53] | 2015 | Egypt | yes | Yes | yes | no | Employee satisfaction, Customer satisfaction | Business sustainability, Competitive advantage |
| [54] | 2022 | Portugal | yes | Yes | yes | yes | Employee and organizational alignment, communication of strategic objectives | Potential improvement in organizational performance, strategic alignment, sustainability |
| [55] | 2015 | Portugal | yes | no | yes | no | Not specified | Not specified |
| [56] | 2015 | Malaysia | no | no | no | no | Not specified | Business Sustainability, Competitive Advantage |
| [57] | 2015 | Norway | yes | yes | yes | yes | Not specified | Not specified |
| [58] | 2017 | Malaysia | yes | yes | yes | yes | Not specified | Not specified |
| [59] | 2016 | Portugal | yes | yes | yes | no | Use of BSC | Enhanced Organizational Performance |
| [60] | 2020 | Eswatini | yes | yes | yes | yes | High repeat and new customer visits, Need for continuous improvement and innovations | Business sustainability, Enhanced performance and growth, Competitive advantage |
| [61] | 2016 | Not specified | yes | yes | yes | yes | Improved competitive advantage, Employee focus | Enhanced long-term performance, Better alignment with organizational goals |
| [62] | 2015 | Iran | yes | yes | yes | no | Positive impact on economic and learning and growth performances; limited impact on social and environmental outcomes | Expected increase in use and integration in manufacturing and service sectors |
| [63] | 2017 | Croatia | yes | yes | yes | yes | Not specified | Not specified |
| [64] | 2018 | Thailand | yes | no | yes | no | Employee satisfaction, customer satisfaction | Business sustainability, competitive advantage |
| [65] | 2020 | Thailand | yes | yes | yes | no | Employee satisfaction, customer satisfaction | Business sustainability, competitive advantage |
| [66] | 2022 | Indonesia | yes | yes | yes | no | Increased productivity, Improved performance | Business excellence, Competitive advantage |
| [67] | 2022 | Indonesia | yes | yes | yes | yes | Employee satisfaction, customer satisfaction | Business sustainability, competitive advantage, improvement in performance metrics |
| [68] | 2014 | Egypt | yes | yes | yes | yes | Benefits of BSC (communication, coordination, strategic vision description) | Addressing internal and external factors affecting SME performance, improving strategic planning |
| [69] | 2018 | Italy | yes | yes | yes | yes | Employee satisfaction, partner commitment | Business sustainability, competitive advantage |
| [70] | 2020 | Nigeria | yes | yes | yes | yes | Employee satisfaction, customer satisfaction | Potential for improved performance, competitive advantage |
| [71] | 2016 | Kenya | yes | yes | yes | yes | Increased Profitability, Improved Financial Performance | Increased Profitability, Improved Financial Performance |
| [72] | 2024 | Brazil | yes | yes | yes | yes | Improved decision-making, Strategic alignment | Enhanced competitiveness, Better strategic planning |
| [73] | 2022 | Europe | yes | yes | yes | yes | Employee satisfaction, customer feedback | Business sustainability, competitive advantage |
| [74] | 2019 | Malaysia | yes | yes | yes | yes | Employee Satisfaction, Customer Satisfaction | Business Sustainability, Competitive Advantage |
| [75] | 2022 | Iraq | yes | no | yes | No | Improved decision-making, customer and stakeholder relationships | Enhanced business environment, response to economic fluctuations |
| [76] | 2020 | Slovakia | yes | yes | yes | no | Business Improvement, Customer Satisfaction | Business Sustainability, Competitive Advantage |
| [77] | 2023 | South Africa | yes | yes | yes | No | Not specified | Sustainable growth, competitive advantage |
| [78] | 2019 | Nigeria | yes | yes | yes | yes | Employee Satisfaction, Customer Satisfaction | Business Sustainability, Competitive Advantage |
| [79] | 2021 | Spain | yes | yes | yes | yes | Employee and Customer Satisfaction | Business Sustainability |
| [80] | 2020 | Greece | yes | yes | yes | no | Financial performance improvements | Competitive advantage, business sustainability |
| [81] | 2021 | Malaysia | yes | yes | yes | yes | Low level of quality certification (35.9% MS ISO 9001) | Need for improvement in quality and environmental management systems |
| [82] | 2018 | Not specified | yes | yes | yes | no | Regional sustainability scores, Benchmarking of SMEs | Business sustainability, Feedback to policymakers |
| [83] | 2023 | Philippines | yes | yes | yes | yes | Employee Satisfaction, Customer Satisfaction | Business Sustainability, Competitive Advantage |
| [84] | 2021 | Indonesia | yes | yes | yes | yes | Employee satisfaction, Customer loyalty, Improved services | Business sustainability, Competitive advantage, Market differentiation |
| [85] | 2023 | South Africa | yes | yes | yes | yes | Employee satisfaction, customer satisfaction | Business sustainability, competitive advantage |
| [86] | 2015 | Malaysia | yes | yes | yes | no | Increased customer satisfaction | Improved business performance, Enhanced SME productivity |
| [87] | 2017 | Not specified | yes | yes | yes | yes | Customer satisfaction, global performance | Business sustainability, competitive advantage |
| [88] | 2015 | Tehran | yes | yes | yes | yes | Employee satisfaction, Customer service improvement | Business sustainability, Competitive advantage |
| [89] | 2022 | Kenya | no | no | no | no | Improved growth and performance of SMEs | Enhanced strategic implementation and growth |
| [90] | 2019 | Jordan | yes | yes | yes | yes | Customer Satisfaction, Employee Satisfaction | Competitive Advantage, Business Sustainability |
| [91] | 2015 | South Africa | yes | yes | yes | yes | Managerial Decision Support, Performance Improvement | Business Survival, Economic Growth |
| [92] | 2018 | Portugal | yes | yes | yes | yes | Improvement in strategy communication, organizational learning | Enhanced strategic alignment, business sustainability |
| [93] | 2023 | United Kingdom | yes | yes | yes | yes | Business Performance Improvement | Competitive Advantage, Enhanced Adoption of Technology |
| [94] | 2014 | Taiwan | yes | yes | yes | yes | Interaction between leadership styles and BSC implementations | Synergy of leadership styles and BSC, improved organizational performance |
| [95] | 2020 | Europe | yes | yes | yes | yes | Employee Engagement, Customer Satisfaction | Competitive Advantage, Business Sustainability |
| [96] | 2022 | North America | yes | yes | yes | yes | Employee Satisfaction, Customer Growth | Long-term Growth, Market Positioning |
| [97] | 2019 | Asia | yes | yes | yes | yes | Customer Satisfaction, Employee Engagement | Business Adaptability, Competitive Position |
| [98] | 2021 | Latin America | yes | yes | yes | yes | Customer Satisfaction, Employee Performance | Market Penetration, Sustainable Development |
| [99] | 2018 | Africa | yes | yes | yes | yes | Employee Satisfaction, Customer Satisfaction | Long-term Strategic Growth, Business Resilience |
| [100] | 2023 | North America | no | no | no | no | Customer Satisfaction, Employee Engagement | Technology Adoption, Competitive Advantage |
| [101] | 2024 | Africa | yes | yes | yes | yes | Employee Engagement, Customer Satisfaction | Market Expansion, Sustainable Practices |
| [102] | 2021 | Germany | yes | yes | yes | yes | Employee Satisfaction, Customer Satisfaction | Increased Welfare, Long-term Business Sustainability |
| [103] | 2022 | South Africa | yes | yes | yes | yes | Performance improvement of the grant-funded programme | Enhanced programme effectiveness, improved grant application success, development impact in SMEs |
| [104] | 2021 | South Africa | yes | yes | yes | yes | Improved data collection and management, increased interaction and measurement capabilities | Increased economic development, enhanced incubator performance, improved entrepreneurial activity |
| [105] | 2022 | Vietnam | yes | yes | yes | yes | Enhanced Operational Efficiency | Business Sustainability, Competitive Advantage |
| [106] | 2014 | Malaysia | yes | no | yes | No | Employee satisfaction, Customer satisfaction | Business sustainability, Competitive advantage |
| [107] | 2022 | Thailand | yes | yes | yes | No | Employee performance, Organizational assessment | Risk mitigation, Enhanced organizational control |
| [108] | 2020 | Singapore | yes | yes | yes | Yes | Employee satisfaction, Manager satisfaction | Business sustainability, Competitive advantage |
| [109] | 2021 | France | yes | yes | yes | Yes | Not specified | Not specified |
| [110] | 2022 | Sudan | yes | yes | yes | Yes | Not specified | Enhancing understanding of BSC in emerging economies |
| [111] | 2017 | Italy | yes | No | yes | no | Improved firm management | Business growth |
| [112] | 2020 | Italy | yes | yes | yes | Yes | Financial performance | Economic Sustainability |
| [113] | 2020 | Vietnam | yes | yes | yes | No | Improving Business and Development Efficiency | Business Sustainability, Competitive Advantage |
| [114] | 2014 | Malaysia | yes | yes | yes | No | Customer Satisfaction, Process Efficiency | Business Sustainability |
| [115] | 2020 | Vietnam | yes | yes | yes | Yes | Not specified | Sustainability |
| [116] | 2019 | Thailand | yes | yes | yes | Yes | Employee satisfaction, customer satisfaction | Business sustainability, competitive advantage |
| [117] | 2023 | Europe | yes | yes | yes | Yes | Flexibility, competitiveness | Long-term prosperity, better customer value, adaptability to changes |
| [118] | 2020 | Nigeria | yes | yes | yes | No | Customer Satisfaction, Employee Satisfaction | Business Sustainability, Competitive Advantage |
| [119] | 2024 | Jawa Timur | yes | No | yes | no | Improved Performance in Customer & Internal Processes | Enhanced Business Models, Competitive Advantage |
| [120] | 2017 | Czech Republic | yes | Yes | yes | yes | Company’s attitude to risk | Business competitiveness, Company performance |
| [121] | 2019 | South Africa | yes | Yes | yes | yes | Employee Satisfaction, Customer Satisfaction | Business Sustainability, Competitive Advantage |
| [122] | 2015 | India | yes | Yes | yes | No | Employee Satisfaction, Customer Satisfaction | Business Sustainability, Competitive Advantage |
| [123] | 2014 | Malaysia | yes | yes | yes | Yes | Employee satisfaction, Customer satisfaction | Business sustainability, Competitive advantage |
| [124] | 2017 | Indonesia | yes | yes | yes | Yes | Customer Satisfaction, Employee Satisfaction | Business Sustainability, Competitive Advantage |
| [125] | 2017 | Colombia | yes | yes | yes | yes | Strengths and weaknesses identification, customer satisfaction | Business sustainability, improved decision-making |
| [126] | 2022 | Greece | yes | yes | no | No | Customer satisfaction, proposal submission, e-shop | Business sustainability, competitive advantage |
| [127] | 2024 | Ghana | yes | yes | yes | Yes | Employee satisfaction, Customer satisfaction | Business sustainability, Competitive advantage |
| [128] | 2019 | Iraq | yes | yes | yes | No | Improved strategic performance, cost reduction | Enhanced competitiveness, sustainable strategic performance |
| [129] | 2014 | Australia | yes | yes | yes | Yes | Employee development, Customer satisfaction | Sustainable competitive advantage, Business performance |
| [130] | 2018 | Vietnam | yes | yes | yes | Yes | Employee satisfaction, Customer satisfaction | Business sustainability, Competitive advantage |
| [131] | 2021 | Swaziland | yes | yes | yes | No | Employee satisfaction, customer satisfaction | Business sustainability, competitive advantage |
| [132] | 2022 | Nigeria | yes | yes | yes | Yes | Employee satisfaction, retention rates | Business sustainability, improved performance |
| [133] | 2019 | Brazil | yes | yes | yes | Yes | Employee Satisfaction, Customer Satisfaction | Business Sustainability, Competitive Advantage |
| [134] | 2023 | Saudi Arabia | yes | yes | yes | Yes | Employee satisfaction, customer satisfaction | Business sustainability, competitive advantage |
| [135] | 2015 | United States | yes | yes | yes | No | Social stability, policy effectiveness | Enhanced state-civil society relationship, improved policy implementation |
| [136] | 2024 | Turkey | yes | yes | yes | Yes | Adherence to traditional framework | Improved performance measurement, potential for enhanced sustainability |
| [137] | 2022 | China | yes | yes | yes | No | Not specified | Insights on MMAPs adoption and performance |
| [138] | 2015 | Indonesia | yes | yes | yes | Yes | Curriculum development, teaching strategy | Enhanced entrepreneurship education, integrated curriculum |
| [139] | 2018 | Sulawesi | yes | yes | yes | No | Improved performance, customer satisfaction | Business sustainability, competitive advantage |
| [140] | 2020 | Malaysia | yes | yes | yes | Yes | Enhanced strategic focus, improved financial performance | Increased business success, enhanced strategic management |
| [141] | 2015 | Nigeria | yes | yes | yes | No | Strategy implementation effectiveness | Business sustainability, Economic development |
| [142] | 2017 | South Africa | yes | yes | yes | Yes | Employee and community engagement, reputation | Socio-economic development, knowledge-sharing, sustainability |
| [143] | 2022 | Germany | yes | yes | yes | No | Employee engagement, Stakeholder communication | Improved sustainability practices, Competitive advantage |
| [144] | 2022 | North America | yes | yes | yes | Yes | Customer satisfaction, Employee satisfaction | Enhanced corporate sustainability, Strategic alignment |
| [145] | 2021 | Europe | yes | yes | yes | No | Increased employee morale, Better customer relations | Long-term operational excellence, Improved market position |
| [146] | 2017 | Not specified | yes | yes | yes | Yes | Not specified | Business sustainability, Competitive advantage |
| [147] | 2018 | Not specified | yes | yes | yes | No | Not specified | Business sustainability, rational decision-making process |
| [148] | 2014 | Europe | yes | yes | yes | Yes | Network-oriented controlling, Strategic management | Efficient, innovative, safe, and environmentally friendly corridor development |
| [149] | 2014 | Finland | yes | yes | yes | Yes | Adaptability of PMS, challenges in implementation | Business sustainability, adaptability to market changes |
| [150] | 2022 | Indonesia | yes | yes | yes | no | Performance metrics include customer satisfaction, financial performance | Enhanced SME performance, improved capability, moderated by innovation |
| [151] | 2024 | Malaysia | yes | yes | yes | Yes | Employee Satisfaction, Customer Satisfaction | Business Sustainability, Competitive Advantage |
| [152] | 2021 | Indonesia | yes | yes | yes | Yes | Risk Reduction, Stakeholder Decision Making | Business Performance Improvement, Risk Management Enhancement |
| [153] | 2024 | Ethiopia | yes | yes | yes | No | Impact of innovation on organizational performance | Improvement of organizational performance through innovation; insights for future research |
| [154] | 2024 | Kenya | yes | yes | yes | Yes | Superior operational performance, Quality product | Competitive edge, Improved enterprise performance |
| [155] | 2021 | India | yes | yes | yes | Yes | Employee satisfaction, Customer satisfaction | Business sustainability, Competitive advantage |
| [156] | 2016 | Germany | yes | yes | yes | No | Employee Satisfaction, Internal Discussions on Logistics Contribution | Improved Competitiveness, Process and Organizational Enhancements |
| [157] | 2015 | India | yes | yes | yes | No | Customer satisfaction, employee satisfaction | Competitive advantage, business sustainability |
| [158] | 2017 | Iran | yes | yes | yes | Yes | Employee Satisfaction, Customer Satisfaction | Business Sustainability, Competitive Advantage |
| [159] | 2015 | Malaysia | yes | yes | yes | No | Employee satisfaction, Customer satisfaction | Business sustainability, Competitive advantage |
| [160] | 2019 | Iran | yes | yes | yes | Yes | Employee Satisfaction, Customer Satisfaction | Business Sustainability, Improved Strategic Resource Allocation |
| [161] | 2017 | Italy | yes | yes | yes | No | Employee satisfaction, stakeholder engagement | Business sustainability, competitive advantage |
| [162] | 2020 | Not specified | yes | yes | yes | Yes | Employee satisfaction, customer satisfaction | Business sustainability, competitive advantage |
| [163] | 2014 | Malaysia | yes | yes | yes | Yes | Customer satisfaction, employee satisfaction | Business sustainability, competitive advantage |
| [164] | 2020 | China | yes | yes | yes | Yes | Employee Satisfaction | Business Sustainability, Competitive Advantage |
| [165] | 2024 | Malaysia | yes | yes | yes | No | Employee satisfaction, customer satisfaction | Business sustainability, competitive advantage |
| [166] | 2019 | Republic of Croatia | yes | yes | yes | Yes | Employee Satisfaction, Customer Satisfaction | Business Sustainability, Competitive Advantage |
| [167] | 2017 | Ghana | yes | yes | yes | Yes | Not specified | Not specified |
| [168] | 2016 | Chile | yes | yes | yes | No | Employee satisfaction, Customer satisfaction | Business sustainability, Competitive advantage |
| [169] | 2019 | Indonesia | yes | yes | yes | Yes | Not specified | Not specified |
| [170] | 2016 | Sweden | yes | yes | yes | Yes | Employee satisfaction, customer satisfaction | Business sustainability, competitive advantage |
Table 6.
Collected Studies.
| Ref | Study | Title |
|---|---|---|
| [36] | A | Balanced scorecard in SMEs: effects on innovation and financial performance |
| [37] | B | An Investigation of the Effects of Balanced Scorecard (BSC) Implementation on Small and Medium Sized Enterprises (SMEs) Performance: Quantitative and Qualitative Approaches (A Case of Egypt) |
| [38] | C | Developing a lean supply chain performance framework in a SME: a perspective based on the balanced scorecard |
| [39] | D | Implementation of Balanced Scorecard and Financial Performance of SMEs |
| [40] | E | How does the Balanced Scorecard work for SMEs? An explorative study |
| [41] | F | Sustainability Management with the Sustainability Balanced Scorecard in SMEs: Findings from an Austrian Case Study |
| [42] | G | Existing Differences Between SMEs That Apply BSC and Those That Do Not |
| [43] | H | Architecture of Balanced Scorecard for SMEs |
Table 7.
Summary of Tool Application.
| Study | Missing data | Selective reporting | Protocol inconsistencies |
Outcome reporting | Overall risk of bias |
|---|---|---|---|---|---|
| A | No | No | No | Yes | Low |
| B | Yes | No | No | Yes | Moderate |
| C | No | Yes | No | Yes | High |
| D | No | No | No | Yes | Low |
| E | No | No | Yes | No | Moderate |
| F | No | No | No | Yes | Low |
| G | No | No | Yes | Yes | High |
| H | No | No | No | Yes | Low |
Table 8.
Key Findings and Strategic Implications for Business Leaders.
| Industry | Key Finding | Strategic Implications for Business Leaders | Opportunities | Challenges | Relevance to Proposed Systematic Review | Strategic Drivers | Expected Outcome |
|---|---|---|---|---|---|---|---|
| Manufacturing | Integration of BSC with operational frameworks like Lean or Six Sigma improves process efficiency. | Adopt BSC alongside Lean or Six Sigma to optimize operational efficiency. | Streamlined processes and waste reduction. | High initial investment in training and resources. | 36.84% of studies focused on operational performance and process alignment, reflecting the review’s emphasis on aligning strategic objectives with practical improvements in SMEs. | Operational efficiency; strategic alignment. | Enhanced productivity and competitive advantage. |
| Healthcare | BSC aligns clinical outcomes with organizational objectives, improving patient care. | Use BSC to connect clinical outcomes with strategic goals for better decision-making. | Potential to improve patient care quality and service delivery. | Balancing clinical priorities with financial targets. | 26.32% of studies focused on non-financial metrics like customer satisfaction and employee engagement, relevant to improving patient care and aligning with strategic outcomes in the review. | Employee engagement; customer satisfaction (patient outcomes). | Improved quality of care and organizational performance. |
| Information Technology | BSC encourages continuous innovation by linking learning metrics to tech initiatives. | Utilize BSC to track technological advancements and link them to skill development. | Promotes new technology adoption and skill development. | Rapid technological changes can outpace metric updates. | 31.58% of studies applied thematic analysis to assess qualitative dimensions like innovation, relevant for IT's dynamic and evolving nature as discussed in the review. | Learning and growth; technological innovation. | Increased innovation capability and market competitiveness. |
| Retail | BSC aligns financial objectives with customer satisfaction, boosting sales outcomes. | Integrate customer feedback and financial metrics to guide strategic decisions. | Opportunity to enhance customer loyalty and revenue growth. | Balancing cost reduction with improving customer experience. | 26.32% of studies emphasized customer satisfaction as a critical KPI, aligning with the systematic review's findings on the importance of customer-focused performance metrics. | Customer satisfaction; financial performance. | Strengthened customer loyalty and increased sales. |
| Energy | BSC aids in tracking sustainability alongside financial metrics, promoting eco-friendly practices. | Link sustainability initiatives with financial goals using the BSC for holistic performance. | Enhances brand reputation and regulatory compliance. | High costs and complexity in sustainability metric implementation. | 5.26% of studies integrated sustainability perspectives, highlighting the review's attention to including environmental considerations in performance management. | Sustainability; financial alignment. | Improved sustainability reporting and long-term business viability. |
| Education | BSC aligns educational goals with performance metrics, enhancing student outcomes. | Use BSC to set clear learning objectives and track educational progress. | Opportunity to improve educational quality and institutional reputation. | Standardizing educational KPIs across diverse environments can be challenging. | 43.70% of literature focused on the BSC methodology itself, aligning with educational applications and non-financial performance indicators reviewed. | Learning and growth; stakeholder satisfaction (student success). | Enhanced educational quality and institutional performance. |
| Financial Services | BSC integrates risk management into strategic planning, improving compliance outcomes. | Use BSC to monitor regulatory compliance and financial targets concurrently. | Opportunity to reduce regulatory risks and increase transparency. | Complexity in adapting BSC to include compliance metrics. | 38.52% of studies emphasized long-term impacts like business sustainability and competitive advantage, which relate to compliance and risk management in the financial sector. | Risk management; compliance. | Improved compliance and risk mitigation strategies. |
| Agriculture | BSC links productivity with sustainability, optimizing resource use and market access. | Adopt BSC to track productivity and sustainability efforts for better resource management. | Opportunity to implement sustainable practices and improve market reach. | Customizing BSC metrics for agriculture-specific performance can be difficult. | 5.26% of studies discussed sector-specific metrics, suggesting the need for customized BSC frameworks relevant to agricultural sustainability highlighted in the review. | Productivity; sustainability; market alignment. | Increased productivity, market reach, and sustainable practices. |
| Automotive | BSC aligns production goals with quality standards for better operational control. | Integrate quality control metrics with production objectives using the BSC. | Potential to improve manufacturing efficiency and product quality. | High costs for integrated quality management systems. | 49.63% of studies utilized quantitative approaches focusing on measurable metrics like production quality, which aligns with the systematic review's emphasis on operational performance. | Quality management; operational efficiency. | Enhanced product quality and manufacturing efficiency. |
Table 9.
Proposed Decision-Making Framework for Implementing ESPs.
| Industry | Step | Framework Focus | Key Features | Strategic Drivers | Expected Outcome | Ties to Proposed Study |
|---|---|---|---|---|---|---|
| Financial Services | Step 1: Needs Analysis | Compliance and Risk Management | Identify regulatory requirements and risk factors | Compliance, risk mitigation | Improved compliance, reduced risk exposure | Addresses compliance focus in 38.52% of studies |
| Step 2: Select Platform | Security and Data Management | Choose platforms with robust security features | Data protection, regulatory compliance | Secure communication and data handling | Reflects findings on security requirements | |
| Step 3: Pilot Testing | Regulatory Integration | Test platform's integration with regulatory frameworks | Seamless integration with existing processes | Reduced disruptions during implementation | Mirrors the emphasis on integration in BSC studies | |
| Step 4: Full Integration | Standardization | Implement platform across all departments | Consistency in regulatory practices | Unified compliance management | Supports holistic BSC approach across departments | |
| Step 5: Optimization | Continuous Risk Monitoring | Ongoing assessment of risk management processes | Dynamic adaptation to regulatory changes | Enhanced risk management strategies | Correlates with the review's focus on dynamic adaptation | |
| Technology | Step 1: Needs Analysis | Customer-Centric Approach | Assess customer needs and user feedback | Customer satisfaction, user engagement | Improved user experience, higher customer retention | Aligns with 26.32% of studies on customer satisfaction |
| Step 2: Select Platform | Innovation Focus | Choose platforms with advanced collaboration features | Innovation, technology adoption | Enhanced collaboration, faster decision-making | Related to findings on innovation in 21.05% of studies | |
| Step 3: Pilot Testing | User Experience | Test user-friendliness and integration capabilities | User acceptance, ease of use | High user adoption rates, seamless integration | Reflects studies emphasizing pilot testing | |
| Step 4: Full Integration | Cross-Functional Integration | Implement across multiple teams and departments | Cross-functional collaboration, agile processes | Improved agility, streamlined operations | Tied to BSC focus on internal processes and efficiency | |
| Step 5: Optimization | Continuous Feedback and Updates | Regular updates based on user feedback | Adaptation to changing user needs | High user satisfaction, continuous improvement | Supports findings on the importance of continuous optimization | |
| Manufacturing | Step 1: Needs Analysis | Supply Chain Optimization | Identify bottlenecks and efficiency opportunities | Cost reduction, efficiency improvement | Lower production costs, streamlined processes | Relates to BSC focus on internal processes (43.70%) |
| Step 2: Select Platform | Production Monitoring | Choose platforms with real-time monitoring features | Operational efficiency, productivity | Real-time data visibility, reduced downtime | Supports findings on monitoring and KPI tracking | |
| Step 3: Pilot Testing | Process Alignment | Test platform with small-scale production | Process optimization, employee training | Improved workflow efficiency, reduced errors | Reflects importance of pilot testing in 53 studies | |
| Step 4: Full Integration | Automation | Implement automated systems across production lines | Automation, process standardization | Higher productivity, consistent quality | Aligned with BSC metrics focusing on internal processes | |
| Step 5: Optimization | Continuous Improvement | Regular upgrades based on production feedback | Lean practices, Six Sigma implementation | Enhanced quality control, continuous efficiency gains | Mirrors findings on process optimization | |
| Retail | Step 1: Needs Analysis | Customer Engagement | Evaluate customer preferences and market trends | Customer retention, sales growth | Improved sales performance, enhanced customer loyalty | Linked to 26.32% studies on customer satisfaction |
| Step 2: Select Platform | Omni-Channel Integration | Choose platforms supporting seamless multi-channel | Digital transformation, e-commerce growth | Consistent customer experience across channels | Supports studies focusing on digital transformation | |
| Step 3: Pilot Testing | Promotion and Feedback Loop | Test platform with selected promotional campaigns | Campaign effectiveness, customer insights | Optimized marketing strategies, increased sales | Correlates with emphasis on feedback loops | |
| Step 4: Full Integration | Loyalty Program Integration | Expand to include loyalty programs across platforms | Customer loyalty, repeat sales | Higher customer retention, long-term revenue growth | Mirrors findings on loyalty programs and sales impact | |
| Step 5: Optimization | Dynamic Pricing and Inventory Management | Update based on customer behavior and market data | Competitive pricing, stock management | Improved margins, optimized inventory turnover | Reflects the importance of optimization for agility | |
| Healthcare | Step 1: Needs Analysis | Patient-Centric Services | Evaluate patient needs and data management practices | Patient satisfaction, data privacy | Enhanced patient care, better data management | Related to studies on patient satisfaction and data handling |
| Step 2: Select Platform | Data Security and Privacy | Select platforms with robust data protection features | Compliance with health regulations, data integrity | Secure patient data handling, regulatory compliance | Correlates with findings on healthcare data challenges | |
| Step 3: Pilot Testing | Data Handling Procedures | Test integration with electronic health records (EHR) | Seamless data transfer, system compatibility | Reduced data entry errors, enhanced patient care | Mirrors emphasis on system integration in healthcare | |
| Step 4: Full Integration | Interoperability | Full-scale integration with healthcare systems | System interoperability, efficient patient care | Improved workflow, better coordination among departments | Reflects findings on integrated healthcare systems | |
| Step 5: Optimization | Continuous Quality Improvement | Regular updates based on patient feedback and data analysis | Quality of care, patient safety | Higher patient satisfaction, continuous quality enhancements | Related to continuous improvement focus in BSC |
Table 10.
Proposed Best Practices for Successful Study Implementation.
| Industry | Best Practice | SME Type | Operational Challenge | Strategic Drivers | Expected Impact | Ties to Systematic Review Findings |
|---|---|---|---|---|---|---|
| Financial Services | 1. Align Compliance Requirements | Regulated SMEs | Adhering to complex financial regulations | Compliance, risk management | Improved compliance, reduced penalties | Correlates with studies highlighting regulatory focus |
| 2. Implement Data-Driven Decision Making | Tech-Enabled Financial SMEs | Integrating data analytics for strategic decisions | Data accuracy, customer insight | Better decision-making, strategic agility | Reflects 31.58% thematic analysis emphasis | |
| 3. Foster a Culture of Continuous Learning | Small Brokerage Firms | Keeping up with financial market changes | Learning and growth, employee engagement | Increased adaptability, enhanced employee skills | Aligns with BSC's learning and growth dimension | |
| Technology | 1. Prioritize User Experience | High-Growth Tech Startups | Enhancing platform usability and adoption | Customer satisfaction, innovation | Higher user retention, improved product features | Linked to 26.32% studies focusing on customer satisfaction |
| 2. Drive Innovation Through Cross-Functional Teams | Mid-Sized IT Consulting Firms | Bridging communication gaps across departments | Collaboration, agile development | Faster time-to-market, cohesive team environment | Mirrors emphasis on cross-functional integration | |
| 3. Leverage AI for Predictive Analytics | Emerging Tech SMEs | Adopting advanced technologies for market trends | Predictive capabilities, data-driven decisions | Improved forecasting, strategic planning capabilities | Tied to findings on the strategic use of technology | |
| Manufacturing | 1. Integrate Lean Principles with BSC | Lean-Adopting Manufacturing SMEs | Reducing waste and improving process efficiency | Cost reduction, process standardization | Lower production costs, streamlined workflows | Relates to 43.70% studies emphasizing internal processes |
| 2. Use Real-Time Monitoring Systems | High-Volume Production SMEs | Enhancing operational visibility | Operational efficiency, productivity | Reduced downtime, increased production capacity | Supports findings on monitoring and automation | |
| 3. Train Employees on Process Optimization | Small Family-Owned Manufacturers | Minimizing human errors, improving quality | Employee skills development, continuous improvement | Enhanced product quality, higher employee productivity | Reflects process optimization focus in BSC literature | |
| Retail | 1. Implement Omnichannel Strategies | Digital-Transforming Retail SMEs | Maintaining consistent customer experiences | Customer engagement, digital transformation | Improved sales performance, higher customer satisfaction | Aligns with 26.32% focus on customer experience |
| 2. Develop Data-Driven Pricing Strategies | Growing E-Commerce Platforms | Adjusting prices dynamically based on market data | Competitive pricing, revenue maximization | Optimized pricing models, increased revenue | Correlates with findings on pricing optimization | |
| 3. Foster Customer Loyalty Programs | Small Brick-and-Mortar Stores | Retaining customers amidst competition | Customer loyalty, repeat sales | Higher retention rates, long-term revenue growth | Mirrors studies linking loyalty programs to sales impact | |
| Healthcare | 1. Ensure Data Privacy and Security | Health-Tech Startups | Meeting regulatory requirements on patient data | Compliance, patient data protection | Reduced data breaches, higher trust levels | Reflects findings on data security challenges |
| 2. Optimize Patient Care Workflows | Small Clinics | Reducing administrative inefficiencies | Workflow efficiency, patient satisfaction | Faster service delivery, enhanced patient care | Supports findings on the importance of operational workflows | |
| 3. Promote Continuous Quality Improvement | Mid-Sized Healthcare Providers | Meeting evolving healthcare standards | Quality of care, patient safety | Improved compliance, ongoing service quality enhancement | Related to 5.26% of studies on continuous quality improvements |
Table 11.
Proposed Metrics and KPIs for Measuring Performance in Various Industries.
| Industry | Key Metrics/KPIs | Measurement Focus | Strategic Drivers | Expected Outcome | Ties to Systematic Review Findings | Priority (1 = Highest, 2 = Medium, 3 = Low) |
|---|---|---|---|---|---|---|
| Financial Services | 1. Return on Investment (ROI) | Financial performance measurement | Profitability, risk management | Improved financial stability | Tied to 36.84% studies focusing on financial metrics | 1 |
| 2. Customer Retention Rate | Customer satisfaction and loyalty | Customer engagement, service quality | Higher customer retention, increased lifetime value | Reflects emphasis on customer satisfaction in 26.32% | 2 | |
| 3. Regulatory Compliance | Adherence to legal and industry standards | Compliance, data protection | Reduced legal risks, enhanced reputation | Supports findings related to compliance requirements | 1 | |
| Technology | 1. Time to Market | Innovation and product development speed | Agile development, rapid iteration | Faster delivery cycles, increased competitiveness | Linked to findings on strategic agility | 1 |
| 2. System Uptime | Operational efficiency and system reliability | Service availability, customer satisfaction | Enhanced user experience, fewer service disruptions | Correlates with 43.70% studies on internal processes | 2 | |
| 3. Employee Productivity | Workforce efficiency and task completion | Skills development, resource utilization | Higher output, optimized resource allocation | Aligns with the learning and growth dimension in BSC | 2 | |
| Manufacturing | 1. Production Lead Time | Efficiency of production processes | Process optimization, cost reduction | Reduced production costs, faster order fulfillment | Related to findings on manufacturing efficiency | 1 |
| 2. Defect Rate | Quality control and product standardization | Quality assurance, continuous improvement | Fewer returns, higher customer satisfaction | Reflects the focus on process quality in 43.70% studies | 1 | |
| 3. Inventory Turnover | Inventory management and cash flow | Operational efficiency, demand forecasting | Lower inventory holding costs, improved cash flow | Supports insights on lean principles | 2 | |
| Retail | 1. Average Transaction Value | Sales performance and revenue generation | Revenue growth, competitive pricing | Increased sales, higher profit margins | Mirrors 26.32% studies focusing on financial and customer metrics | 1 |
| 2. Conversion Rate | Effectiveness of sales strategies | Customer engagement, digital transformation | More sales conversions, improved marketing ROI | Correlates with findings on customer-focused strategies | 1 | |
| 3. Customer Feedback Score | Quality of customer service and product offering | Customer satisfaction, service improvement | Better customer experiences, increased loyalty | Linked to the importance of customer feedback in BSC | 2 | |
| Healthcare | 1. Patient Wait Time | Efficiency of patient care and service delivery | Workflow efficiency, patient satisfaction | Shorter wait times, higher patient satisfaction | Supports findings on optimizing patient care workflows | 1 |
| 2. Readmission Rate | Quality of care and treatment effectiveness | Patient safety, quality of care | Fewer readmissions, improved health outcomes | Tied to 5.26% studies on continuous quality improvement | 1 | |
| 3. Employee Training Hours | Workforce development and skills enhancement | Learning and growth, compliance | Higher staff competency, compliance with standards | Reflects findings on learning and growth in BSC | 2 |
Table 12.
Real Case Studies from Various Industries and Their Outcomes.
| Industry | Case Study | Implementation | Outcome | Reference |
| Automotive | Volkswagen do Brasil: Driving Strategy with the Balanced Scorecard | Utilized BSC to align strategic objectives across finance, customer, internal processes, and growth, introducing a strategy map to drive cultural change. | Improved employee engagement, increased quality, and operational performance, and helped restore market share. |
[LINK] |
| Healthcare | Boston Children's Hospital | Applied BSC to integrate hospital-wide objectives, focusing on patient and employee development. | Enhanced patient outcomes, staff training efficiency, and financial stability, leading to improved service quality. | [LINK] |
| Retail | Tesco | Deployed BSC t XLRI Academic Information Systemement, emphasizing customer satisfaction, financial growth, internal efficiency, and employee training. |
Achieved significant growth in customer loyalty, boosted revenue from increased sales, and improved operational efficiency, especially in supply chain management. | [LINK] |
| Manufacturing | Siemens | BSC used to drive strategy execution across multiple divisions, focusing on innovation, customer satisfaction, and operational efficiency. | Resulted in improved R&D outcomes, higher quality standards, and better alignment of divisional goals with corporate strategy. | [LINK] |
Disclaimer/Publisher’s Note: The statements, opinions and data contained in all publications are solely those of the individual author(s) and contributor(s) and not of MDPI and/or the editor(s). MDPI and/or the editor(s) disclaim responsibility for any injury to people or property resulting from any ideas, methods, instructions or products referred to in the content. |
© 2024 by the authors. Licensee MDPI, Basel, Switzerland. This article is an open access article distributed under the terms and conditions of the Creative Commons Attribution (CC BY) license (http://creativecommons.org/licenses/by/4.0/).
Copyright: This open access article is published under a Creative Commons CC BY 4.0 license, which permit the free download, distribution, and reuse, provided that the author and preprint are cited in any reuse.


