1. Introduction
Steel-concrete composite girders can fully exploit the advantages of 2 materials, steel and concrete. Due to the advantages of low weight, high load capacity, good dynamic performance, excellent economy and industrialized construction, steel-concrete composite girders have become a very competitive bridge type for small and medium span bridges [
1].
Bridge structures exposed to the environment are directly affected by solar radiation, air temperature and wind speed, the formation of temperature action has a significant impact on the bridge [
1,
2,
3]. The composite girder consists of two types of materials with a difference in thermal conductivity of about 50 times between steel and concrete, which makes the temperature effect more complicated than that of concrete bridges. Temperature actions in bridges can be divided into two categories, in which the uniform temperature action controls the longitudinal deformation of the main girder, which is a key factor in determining the length of the girder bridge splitting coupling as well as the selection of the bearing and expansion joints [
4,
5], and if the value is too large, it will significantly increase the cost of the construction, and vice versa, which will make the bridge longitudinal On the contrary, it will make the longitudinal deformation of the bridge cannot be fully released, and then produce a large constraint stress, which will cause damage to the structure in serious cases. The other category is the temperature gradient action, the temperature stress caused by the non-uniformity of the temperature distribution of the cross-section is an important cause of concrete cracking [
6,
7].
Bridge temperature action due to different meteorological conditions and there is a significant geographical variability, the temperature action value obtained in a particular region is often difficult to apply to other regions, full consideration of the geographical variability of meteorological factors for zoning values is a reasonable choice [
8]. National codes have made provisions for regional differences in the effective temperature extremes of concrete main girders. The AASHTO-LRFD specification uses two methods to consider the effective temperature extremes of concrete main girders: method one divides the United States into cold and mild regions, giving the effective temperature extremes of concrete bridges in each region; method two gives the isothermal map of the design temperature extremes of concrete bridges in the United States. Eurocode and British Standard (BS 5400-2) give the effective temperature extremes of concrete bridges based on the shade air temperature extremes, in which the shade air temperature extremes are obtained by isothermal plots. The Chinese highway code divides China into extremely cold, cold, and warm regions, stipulates the effective temperature extremes for bridges in each region, and refers to the British specification to give the formula for calculating the effective temperature extremes based on the average daily temperature extremes of the local calendar year. China Railway Bridge and Culvert Design Code (TB 10002-2017) determines the effective temperature extremes based on the style and size of the structure and the local outside air temperature, etc., in which the outside air temperature is determined based on the national average air temperature charts for January and July. Analyzing the above codes, it can be found that, except for the Chinese highway code, the rest of the codes use the isothermal map to calculate the effective temperature extremes. Compared with the zonal value of temperature actions, isothermal map is a more accurate method to consider the geographical variability of temperature actions for value taking. Therefore, the zoning method used in the Chinese highway code may lead to inaccurate values of the effective temperature extremes.
Potgieter et al [
9] obtained the role of temperature gradients for concrete box girders in different regions of the United States by numerical simulation based on historical meteorological data from 26 meteorological stations in the United States. On this basis, the AASHTO code divides the United States into four regions for temperature gradient taking according to the solar radiation intensity level. Mirambell [
10] gave isotherm maps for the temperature difference taking of concrete girders in cross sections in different regions of the Iberian Peninsula by considering different meteorological parameters in summer. Liu Jiang et al [
8], on the other hand, divided China into four regions for temperature gradient taking by establishing the correlation between the temperature action of concrete box girders and geographic and meteorological parameters in terms of cities. The Chinese highway code stipulates that the temperature gradient action in different regions is taken as the same value, without considering the regional differences. With the development of bridge construction to the cold region, whether the unified value of the specification can encompass the temperature action in the extreme cold region needs to be verified, which brings a great risk for the safety and durability of bridges in extreme regions.
It is time-consuming and laborious to measure the meteorological data and the temperature field of the main girder cross-section in different areas on site, and it is impossible to measure the temperature data at all locations of the main girder cross-section and the temperature field of the main girder cross-section under the extreme meteorological conditions due to the limited number of measuring points and the length of monitoring time [
11,
12,
13]. Therefore, in the absence of on-site measured meteorological information, the use of long-term historical meteorological data from meteorological stations to simulate the temperature field of the bridge cross-section under extreme meteorological conditions has become the key to accurately predict the value of the bridge temperature action [
14,
15].
In this paper, 26 meteorological observation stations in Tibet, China, were investigated for nearly 50 years of historical meteorological data, and numerical simulations of composite girder temperature field were carried out using the most unfavorable extreme meteorological conditions of each meteorological station as the boundary, respectively. The most unfavorable values of effective temperature and positive and negative vertical temperature gradients were obtained. The geographical variability of the temperature actions at different meteorological stations is analyzed, and the contour maps of the extreme values of the effective temperature and temperature gradient actions are further obtained by using the spatial interpolation method, which improves the accuracy of the temperature actions. The related research can provide guidance for the refined design of composite girder bridges.
2. Numerical Simulation Method for Temperature Field
2.1. Differential Equation of Heat Conduction
The temperature distribution of a bridge structure under insolation depends on both heat exchange with the outside world and heat conduction inside. The accuracy of numerical simulation results also depends on this [
16,
17].
The solution of the temperature field of a bridge structure is a spatial heat conduction problem. The heat conduction inside the bridge structure follows the partial differential equation for heat conduction proposed by Fourier, see equation (1).
Where:
t, x, y, z are the time and space coordinates corresponding to the determination of the temperature place;
T is the temperature of the bridge structure at the point (
x, y, z) at the moment
t;
ρ, c, k are the density, specific heat capacity, and thermal conductivity of the material, respectively;
Q is the heat generated by the structure per unit of volume of itself, generally for the effect of the heat of hydration of concrete.
2.2. Boundary Conditions under Sunshine Effect
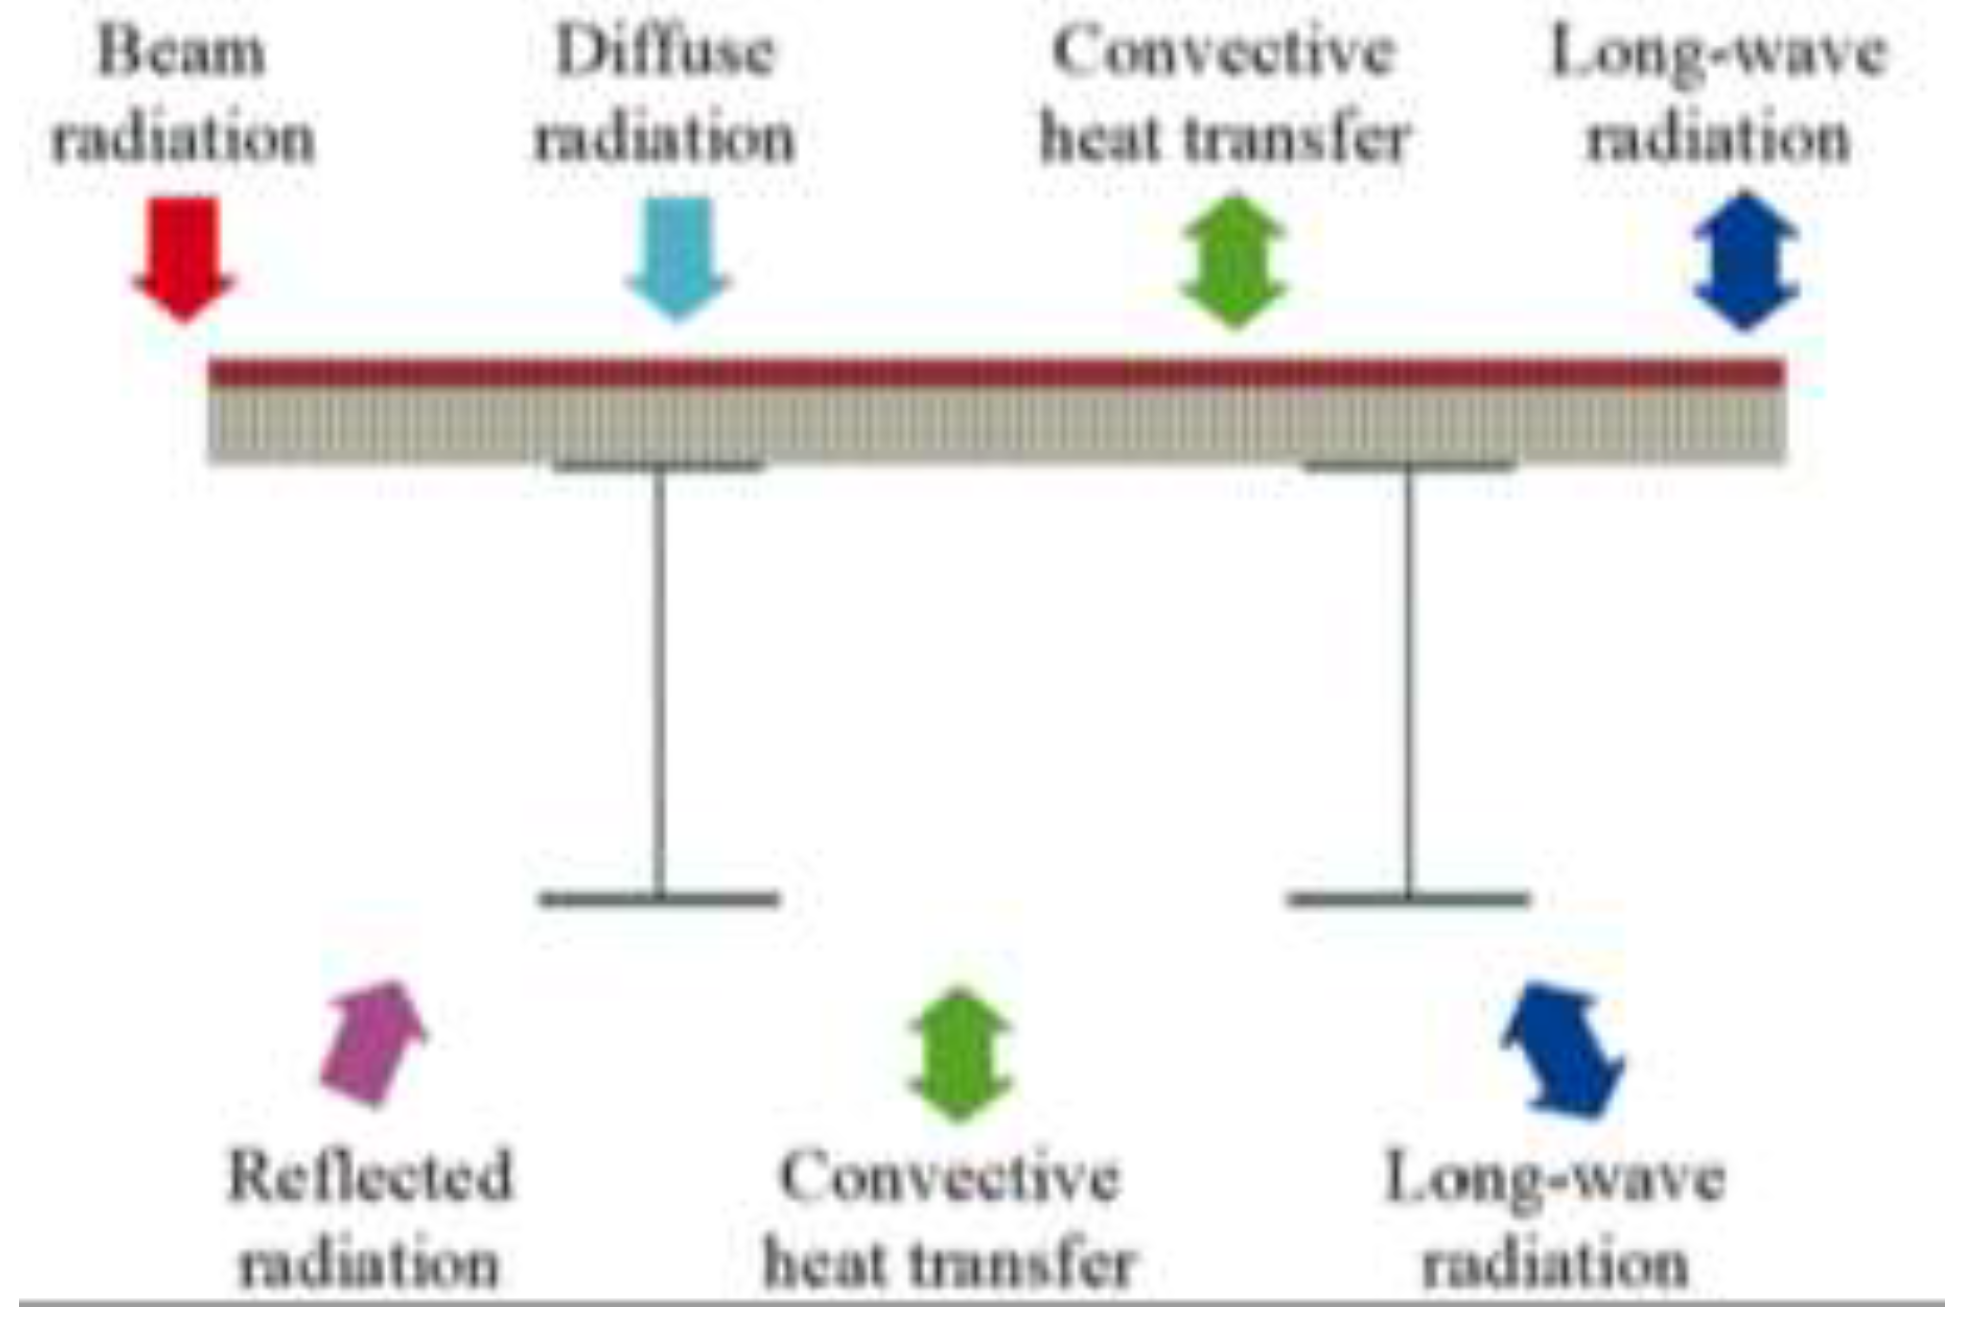
The heat transfer between the bridge structure and the outside world under the action of sunshine mainly consists of solar radiation, convection heat transfer and radiation heat transfer. This is also the boundary condition for solving the above partial differential equation of heat transfer. See
Figure 1.
2.2.1. Solar Radiation
The total solar radiation heat flow density
qh in the horizontal plane consists of direct radiation
qbh in the horizontal plane and scattered radiation
qdh in the horizontal plane [
18].
The solar radiation heat flow density can be obtained from real measurements, and when only total daily radiation data are available, it can be calculated by decomposing it in the following equation [
19]
Where:
Ir and
Idr are the total daily solar radiation in the horizontal plane and the total daily scattered radiation in the horizontal plane, respectively, which can usually be obtained from the radiation meteorological station;
ω and
ωs are the time angle and the corresponding time angle at sunset, respectively;
a1 and
b1 can be determined by the following formula [
20].
The solar radiation heat flow density
qθ absorbed by any surface of the structure is:
Where: α is the absorption rate of solar radiation on the surface of the structure;
ρ is the ground reflectivity;
Rb,
Rd,
Rξ are the correction factors for direct radiation, scattered radiation and ground reflection on the surface at any inclination angle, which are calculated according to Eqs. (8) to (10), respectively.
Where:
i is the solar incidence angle, which has to be calculated by parameters such as latitude, time angle, declination angle and structural surface inclination;
h is the solar altitude angle;
θ is the structural surface inclination. The solar radiation received by the web will be shaded by the cantilever flange, and the shading range changes continuously with time, the shading length
ls at any moment is:
Where: lc is the cantilever length; β is the web inclination; γn is the web face azimuth; γs is the solar azimuth.
2.2.2. Convection
Convection refers to heat transfer between two bodies by currents of moving gas or fluid, and the calculation method is as:
where,
and
are the temperature of surrounding environment and bridge structure, respectively;
s the convective heat transfer coefficient, different parts of the convective heat transfer coefficient can be calculated from the ambient wind speed
ν.
2.2.3. Radiation Heat Transfer
The heat flux of radiation heat transfer between structure surface and surrounding environment can be calculated by :
where,
is the surface emissivity (emissivity) of the structure, generally 0.85~0.95;
is the Stefan-Boltzmann constant of 5.67
10
−8 W/(m
2·K
2);
and
are the temperature of surrounding environment and bridge structure, respectively.
3. Temperature Actions on Composite Girder Bridges
3.1. Uniform Temperature
The uniform temperature is defined as the difference between the effective temperature and the merging temperature. The temperature of a composite girder section can be decomposed into four parts: effective temperature, transverse linear temperature difference, vertical linear temperature difference and residual temperature difference [
1], where the uniform temperature causes longitudinal elongation and shortening of the bridge. Composite girder consists of two materials with very different thermophysical properties, steel and concrete, the temperature-induced longitudinal deformation of the steel girder and concrete deck slab must be coordinated, and its uniform temperature can be calculated by the following equation 15.
where Te is the effective temperature of the composite girder section, Es and Ec are the modulus of elasticity of steel and concrete, respectively, αs and αc are the coefficient of linear expansion of steel and concrete, respectively, and Ei, Ti, and Ai are the modulus of elasticity, temperature value, and cross-sectional area, respectively.
3.2. Temperature Gradient
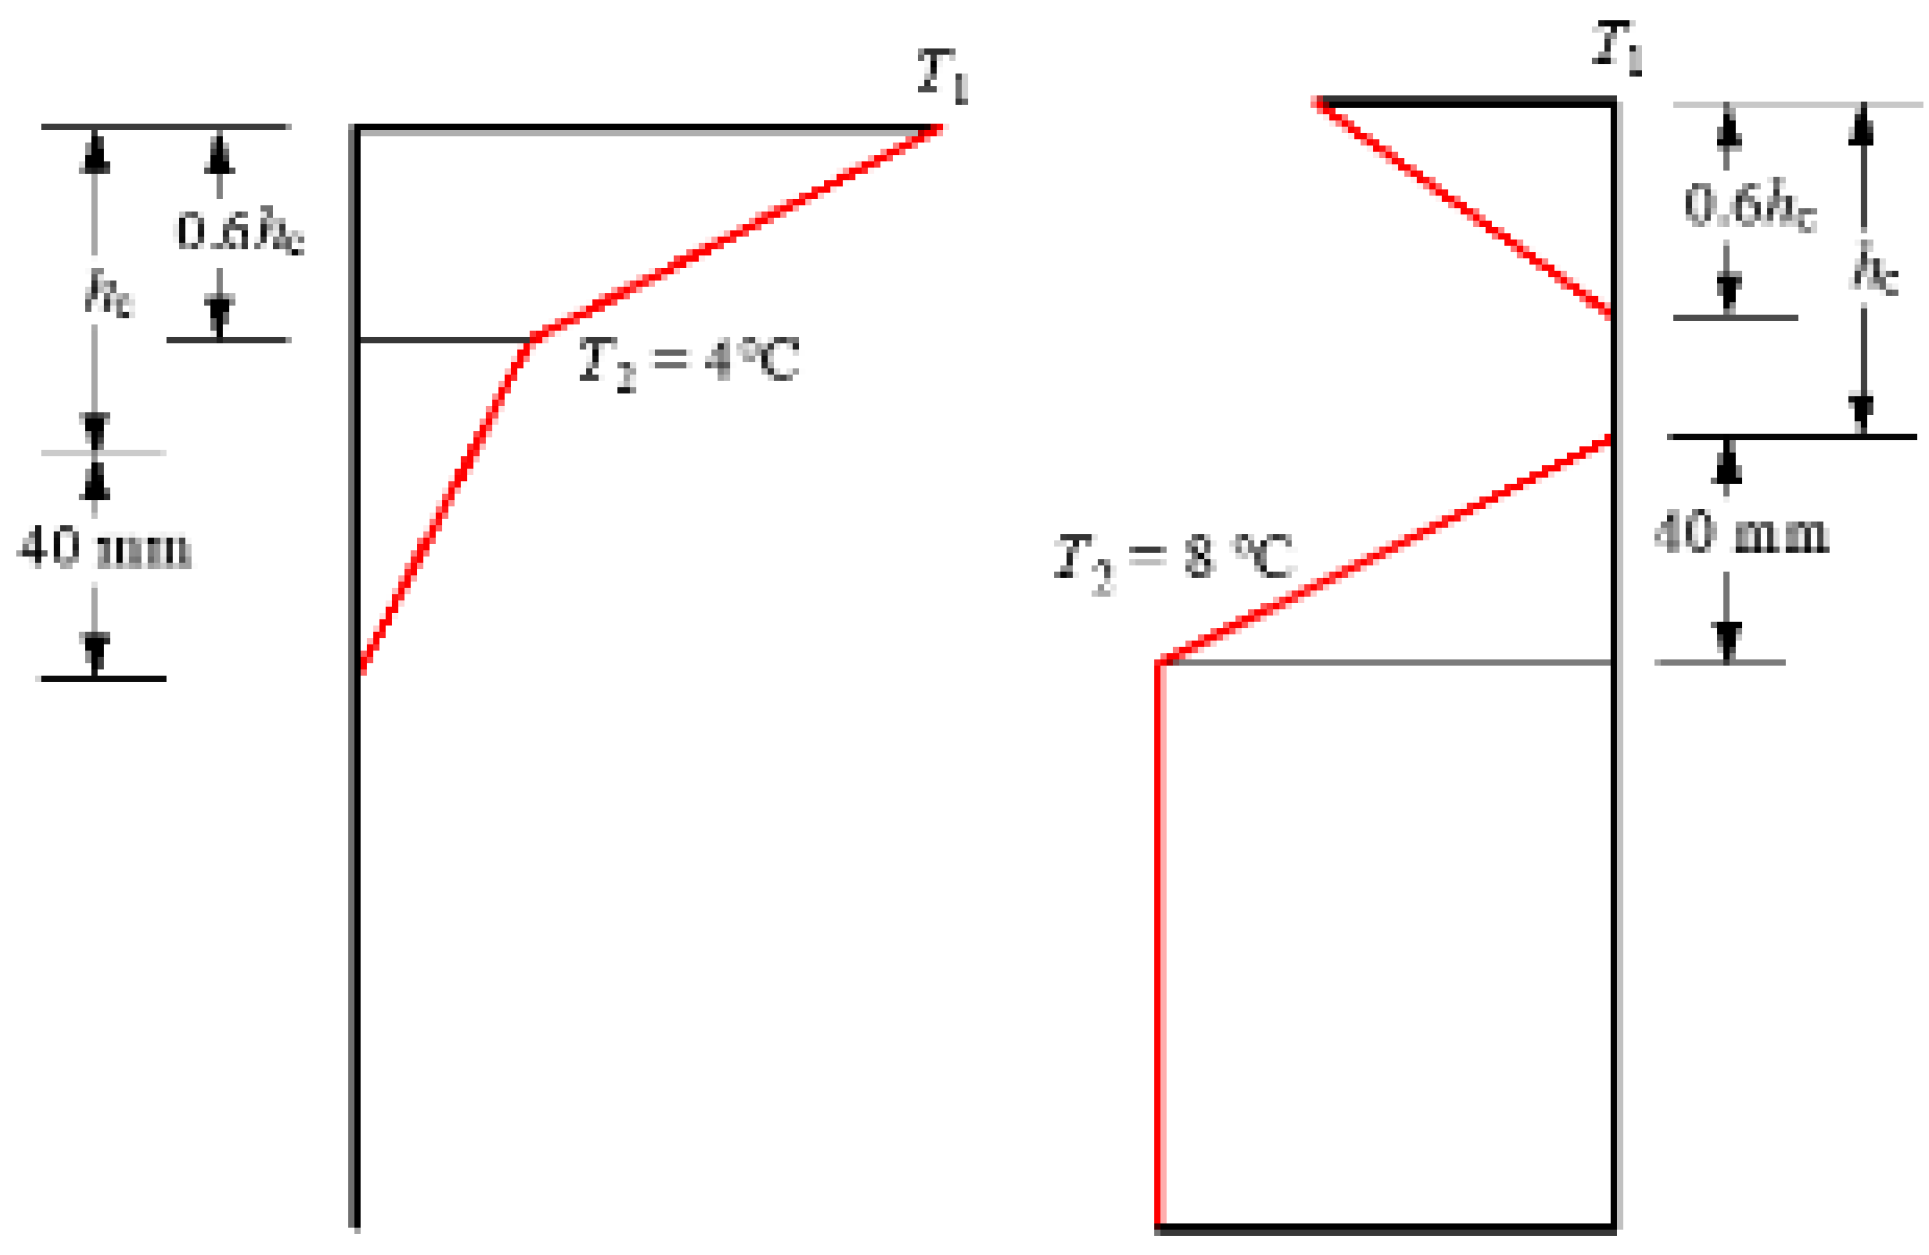
The vertical temperature gradient curves of bridges can generally be expressed in the form of multiple parabolas, exponential curves and multifolds, which can better reflect the effect of insolation on the warming of the top of bridges. The temperature gradient at the top of the composite girder caused by insolation decreases gradually from the top to the bottom according to the nonlinear form, in which the Chinese JTG D60-2015, AASHTO and Eurocode-1 general model adopt the form of bifold line.
For the negative temperature gradient mode, China JTG D60-2015 and AASHTO take -0.5 and -0.3 of the respective positive temperature gradient, respectively. only the general mode of Eurocode-1 considers that there exists an obvious nonlinear distribution of temperature on the steel girder. The measured and calculated studies have shown that the negative temperature gradient model of Eurocode-1 is more in line with the form of temperature distribution of the composite girder at night or cold wave cooling, in the daytime sunshine the concrete temperature is higher than that of the steel girder, at night or cold wave cooling, the top of the concrete deck plate cools down quickly while the interior cools down slowly, forming a negative temperature difference in the bridge deck plate, while the heat conductivity of the steel girder is about 50 times of that of the concrete deck plate, and the The temperature drops rapidly, but not as rapidly at the top where it is connected to the concrete, so a significant negative temperature difference is formed at the top of the steel girder.
For comprehensive consideration, the positive temperature gradient model in China JTG D60-2015 is selected for the subsequent analysis, which is more in line with the characteristics of China’s climate environment. Eurocode-1 negative temperature gradient model is selected for negative temperature gradient analysis, which better reflects the temperature distribution characteristics of composite girders under cooling conditions.
Figure 2.
Temperature gradient model of composite girder bridge.
Figure 2.
Temperature gradient model of composite girder bridge.
4. Temperature Action Extremes Based on Meteorological Data
4.1. Historical Meteorological Data Research
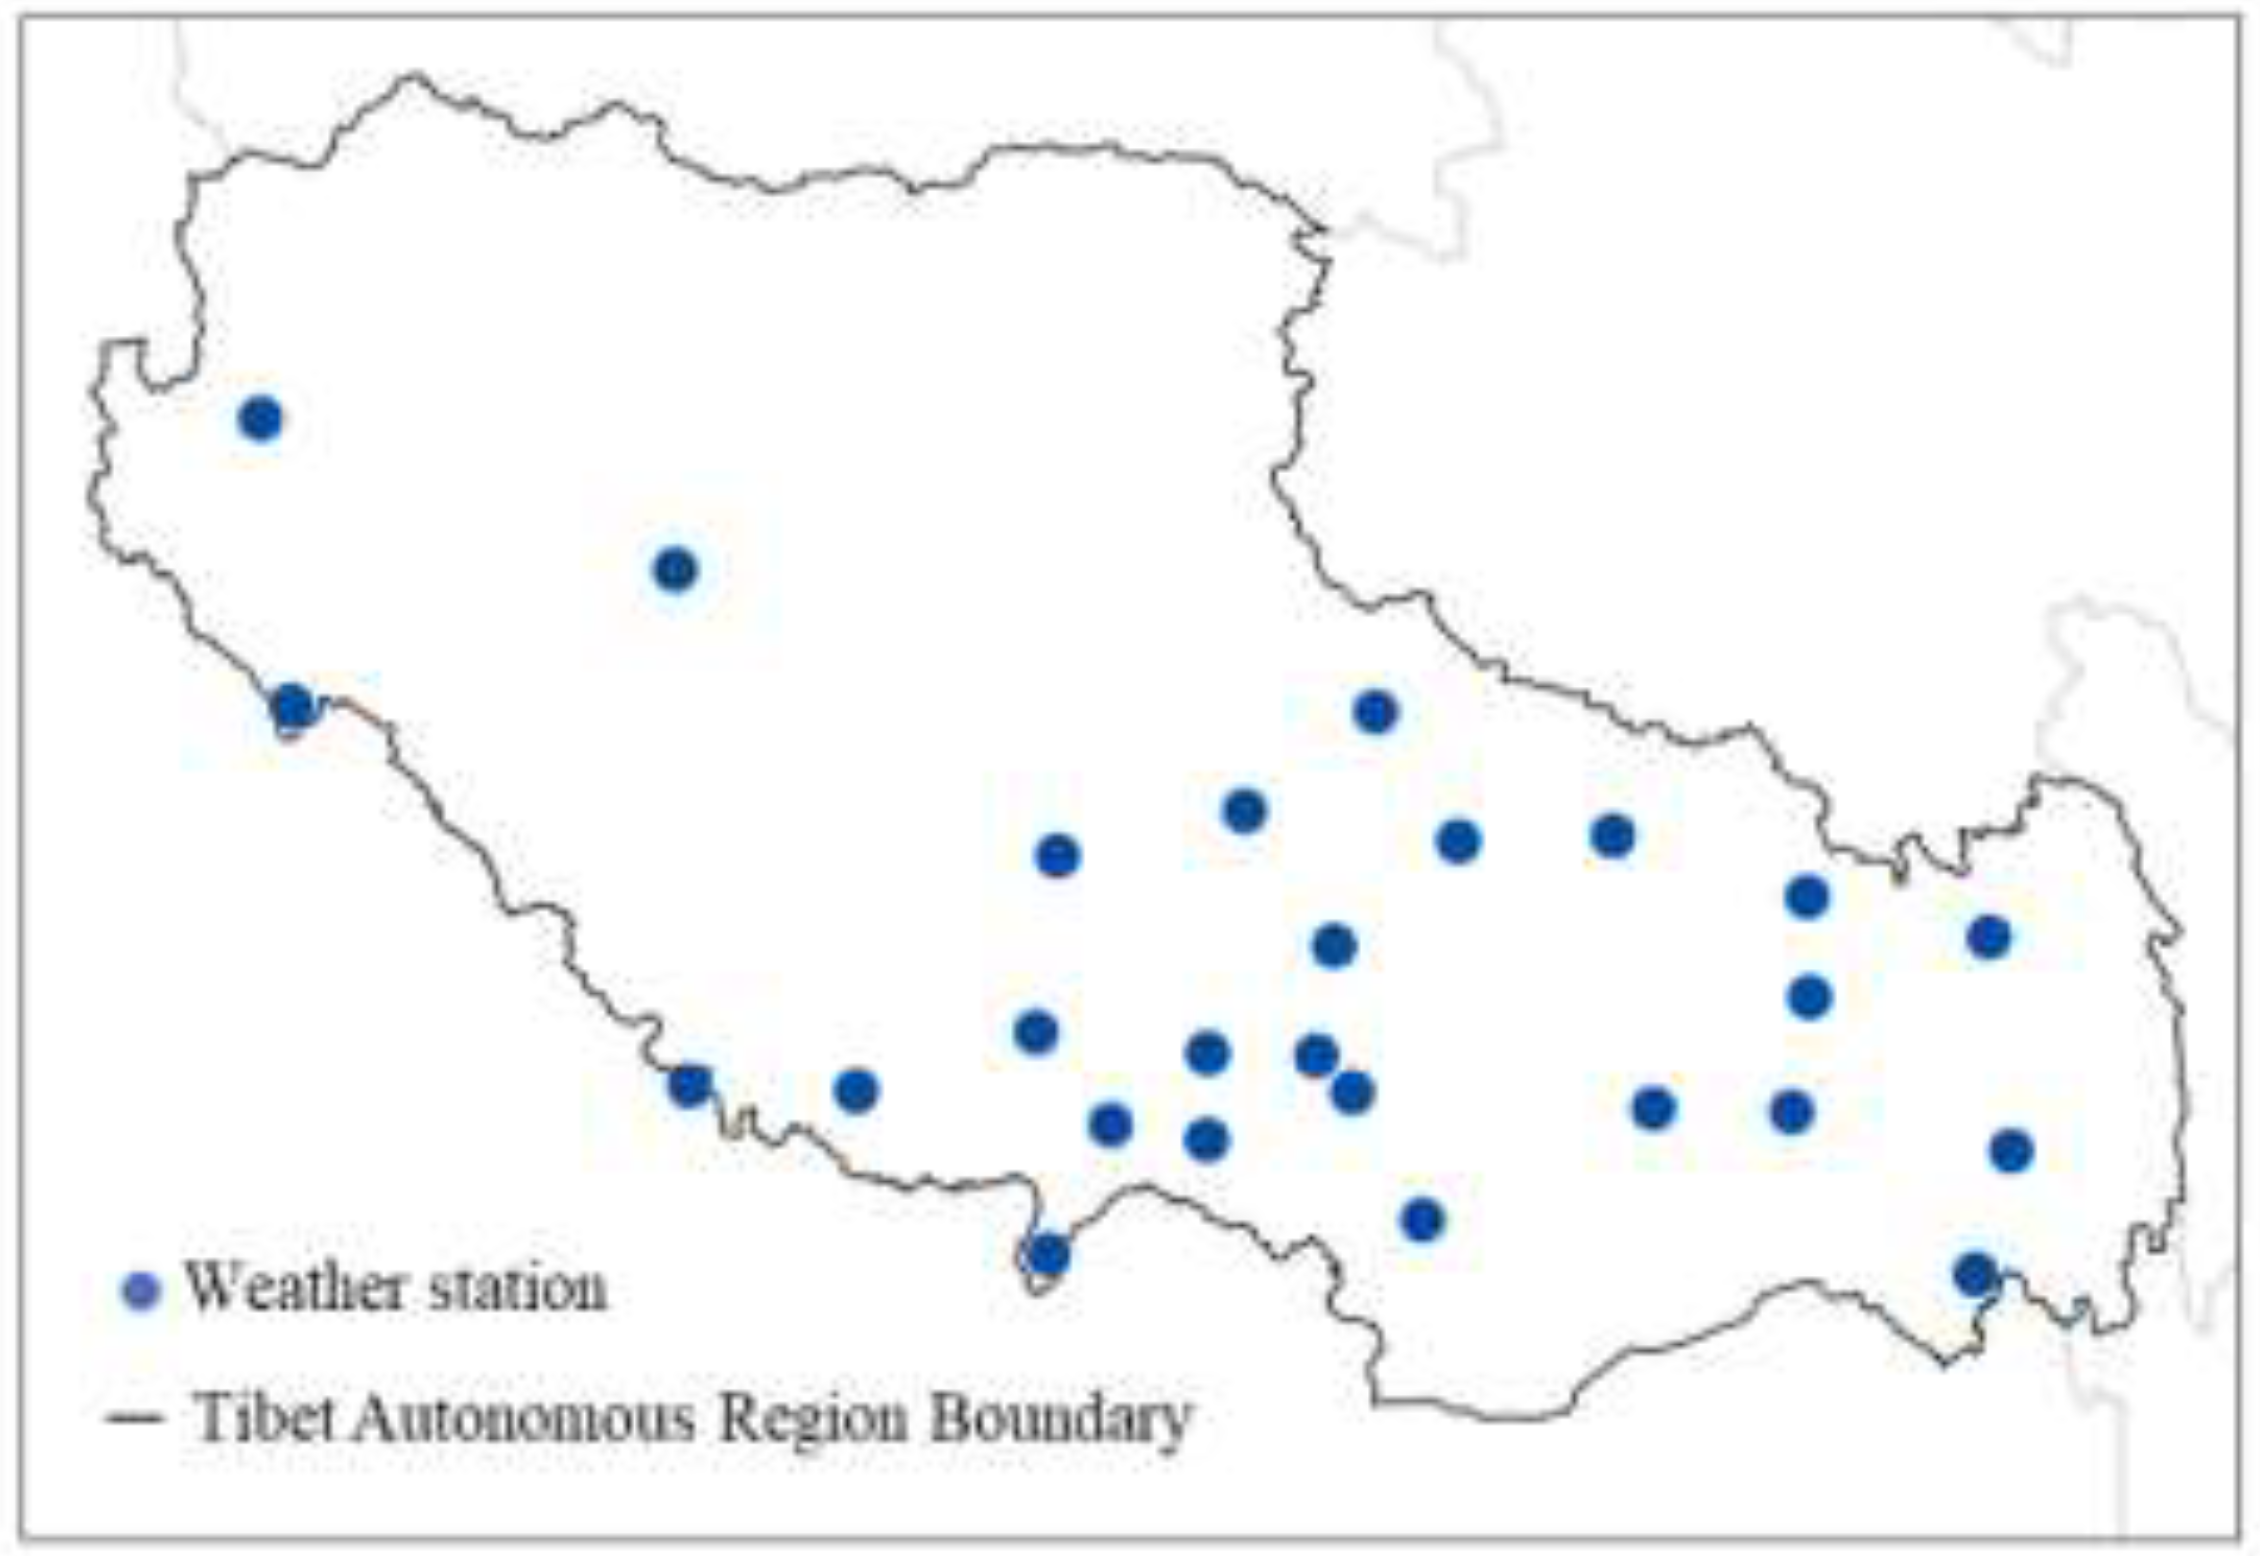
Since the temperature of bridge structure is significantly affected by climatic environment factors, in order to investigate the differences of temperature actions in different regions, various types of measured meteorological data were collected from meteorological observation stations in Tibet, China, from the „National Meteorological Science Data Center” (
http://data.cma.cn/). A total of 26 meteorological stations were collected, and the distribution of those were shown in
Figure 3.
The data collected by the meteorological stations include sunshine hours, daily maximum temperature, daily minimum temperature and daily average wind speed. In addition, some meteorological stations also provide solar radiation data such as total daily solar radiation in the horizontal plane, total direct radiation in the horizontal plane and total scattered radiation in the horizontal plane. The time span of the meteorological data is from January 1, 1953 to December 31, 2015.
The effect of solar radiation on the temperature action of steel-concrete composite girder bridges is also very significant, and the missing solar radiation data can be supplemented by the theoretical values of solar radiation calculated by numerical methods in the literature [
18].
4.2. Extreme Meteorological Conditions
In order to obtain the extreme values of effective temperatures at each meteorological station, it is necessary to determine the most unfavorable meteorological conditions at each station. The dates of occurrence of the maximum and minimum temperatures observed at the meteorological stations during the period from January 1, 1953 to December 31, 2015 were selected as the conditions for the occurrence of the maximum and minimum effective temperatures, respectively, and at the same time, based on the long-term observational data, the maximum and minimum temperatures were corrected to obtain the ambient temperature extremes of each meteorological station for the period of one-in-100-years by the normal distribution (with a 95% guarantee rate). For the maximum effective temperature, the Hottel model and Liu and jordan model were used to calculate the hour-by-hour direct solar radiation curve and the scattered radiation curve on the summer solstice, taking into account the maximum value of solar radiation during the observation period [
19]. The minimum effective temperature then does not take into account the effect of solar radiation. Wind speed is taken from actual observations synchronized with air temperature.
A sinusoidal function is used to simulate the daily ambient temperature profile. When the daily maximum temperature
Tmax and daily minimum temperature
Tmin are known, the temperature at any moment of the day can be obtained by the following formula [
21,
22].
Where, Ta(t) is the daily temperature change function; Ta,max and Ta,min are the highest and lowest temperatures in a day; t is time; t0 represents the time when the highest temperature and the lowest temperature occur. When t0=9, the highest temperature is at 15: 00 p.m. and the lowest temperature is at 3: 00 a.m.
4.3. Extreme Value Calculation of Temperature Action
4.3.1. Computational Models
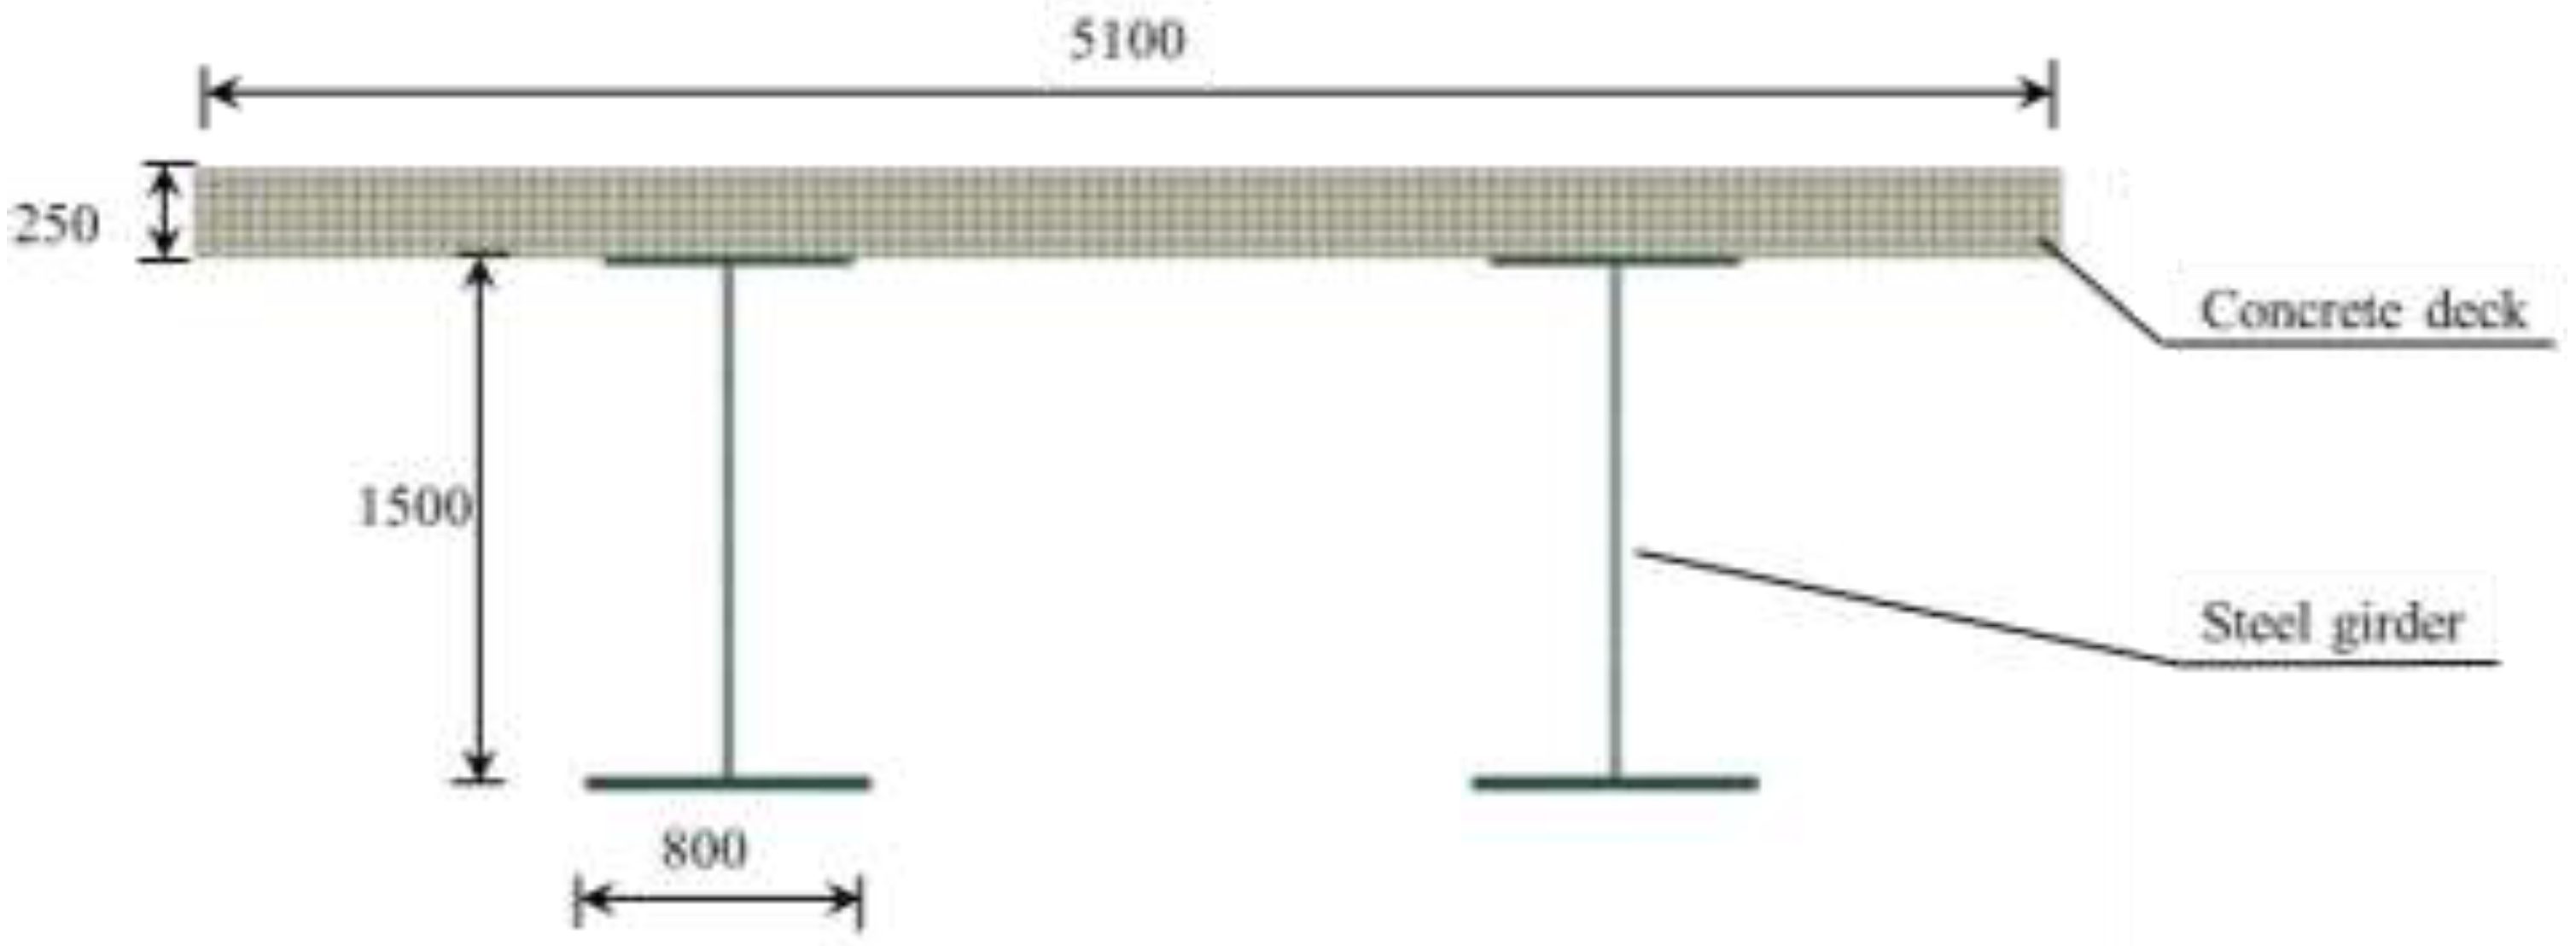
Taking a steel-concrete composite girder bridge in Tibet as an engineering example, a finite element model of the composite girder section was established using the ABAQUS program to carry out long-term two-dimensional numerical simulation of the temperature field. Among them, the concrete deck, steel girder and asphalt pavement are simulated by four-node linear heat transfer quadrilateral unit (DC2D4) provided in ABAQUS program, and the interfaces of deck, asphalt pavement and steel girder are simulated by „binding” constraints, i.e., the interface is considered to be continuous with respect to the temperature and heat flow, which can satisfy the requirements of the fourth type of boundary conditions. That is to say, the temperature and heat flow at the interface are considered to be continuous, which meets the requirements of the fourth type of boundary conditions. The finite element model and mesh division are shown in
Figure 4, and the thermal parameters of steel, concrete and asphalt in the model are shown in
Table 1.
4.3.2. Calculation Results
Based on the aforementioned extreme meteorological conditions setting method, the most unfavorable meteorological boundary conditions of 26 meteorological stations in Tibet were obtained. ABAQUS software is used to establish the temperature field calculation model of the composite girder at one time, and the cell type, mesh division, inner and outer boundary condition setting method and material properties of the model described in section 3.3.1 are adopted. The ambient temperature at time 0 was taken as the initial temperature field of the section, and the boundary conditions of the meteorological parameters on that day were looped to repeat the calculation for three days, and the results of the last day were taken to be analyzed in order to eliminate the influence of the initial error. Finally, each meteorological station has the highest effective temperature and the lowest effective temperature extremes, see
Table 2.
5. Temperature Actions Extremes Based on Geographic Variation
5.1. Regional Differences in Temperature Actions
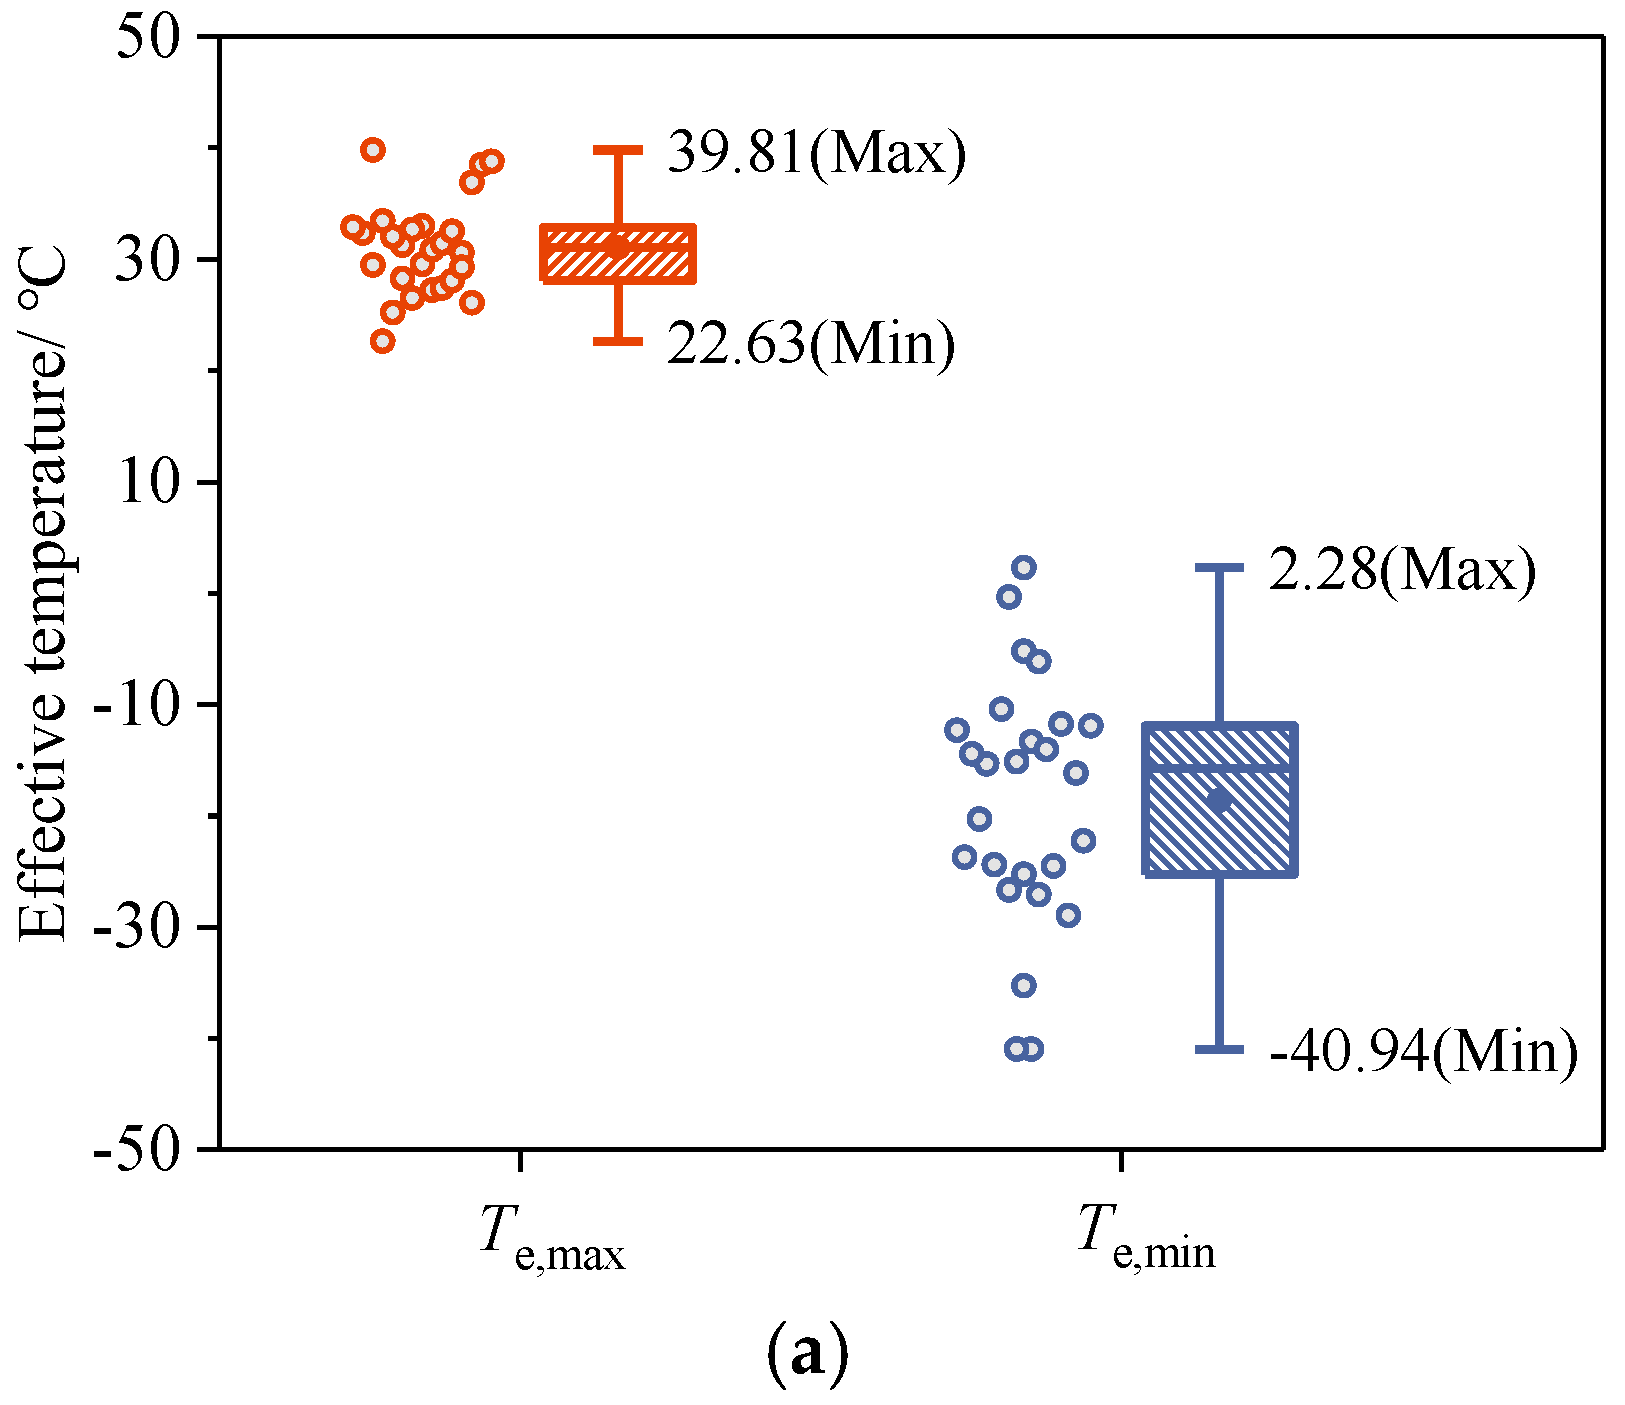
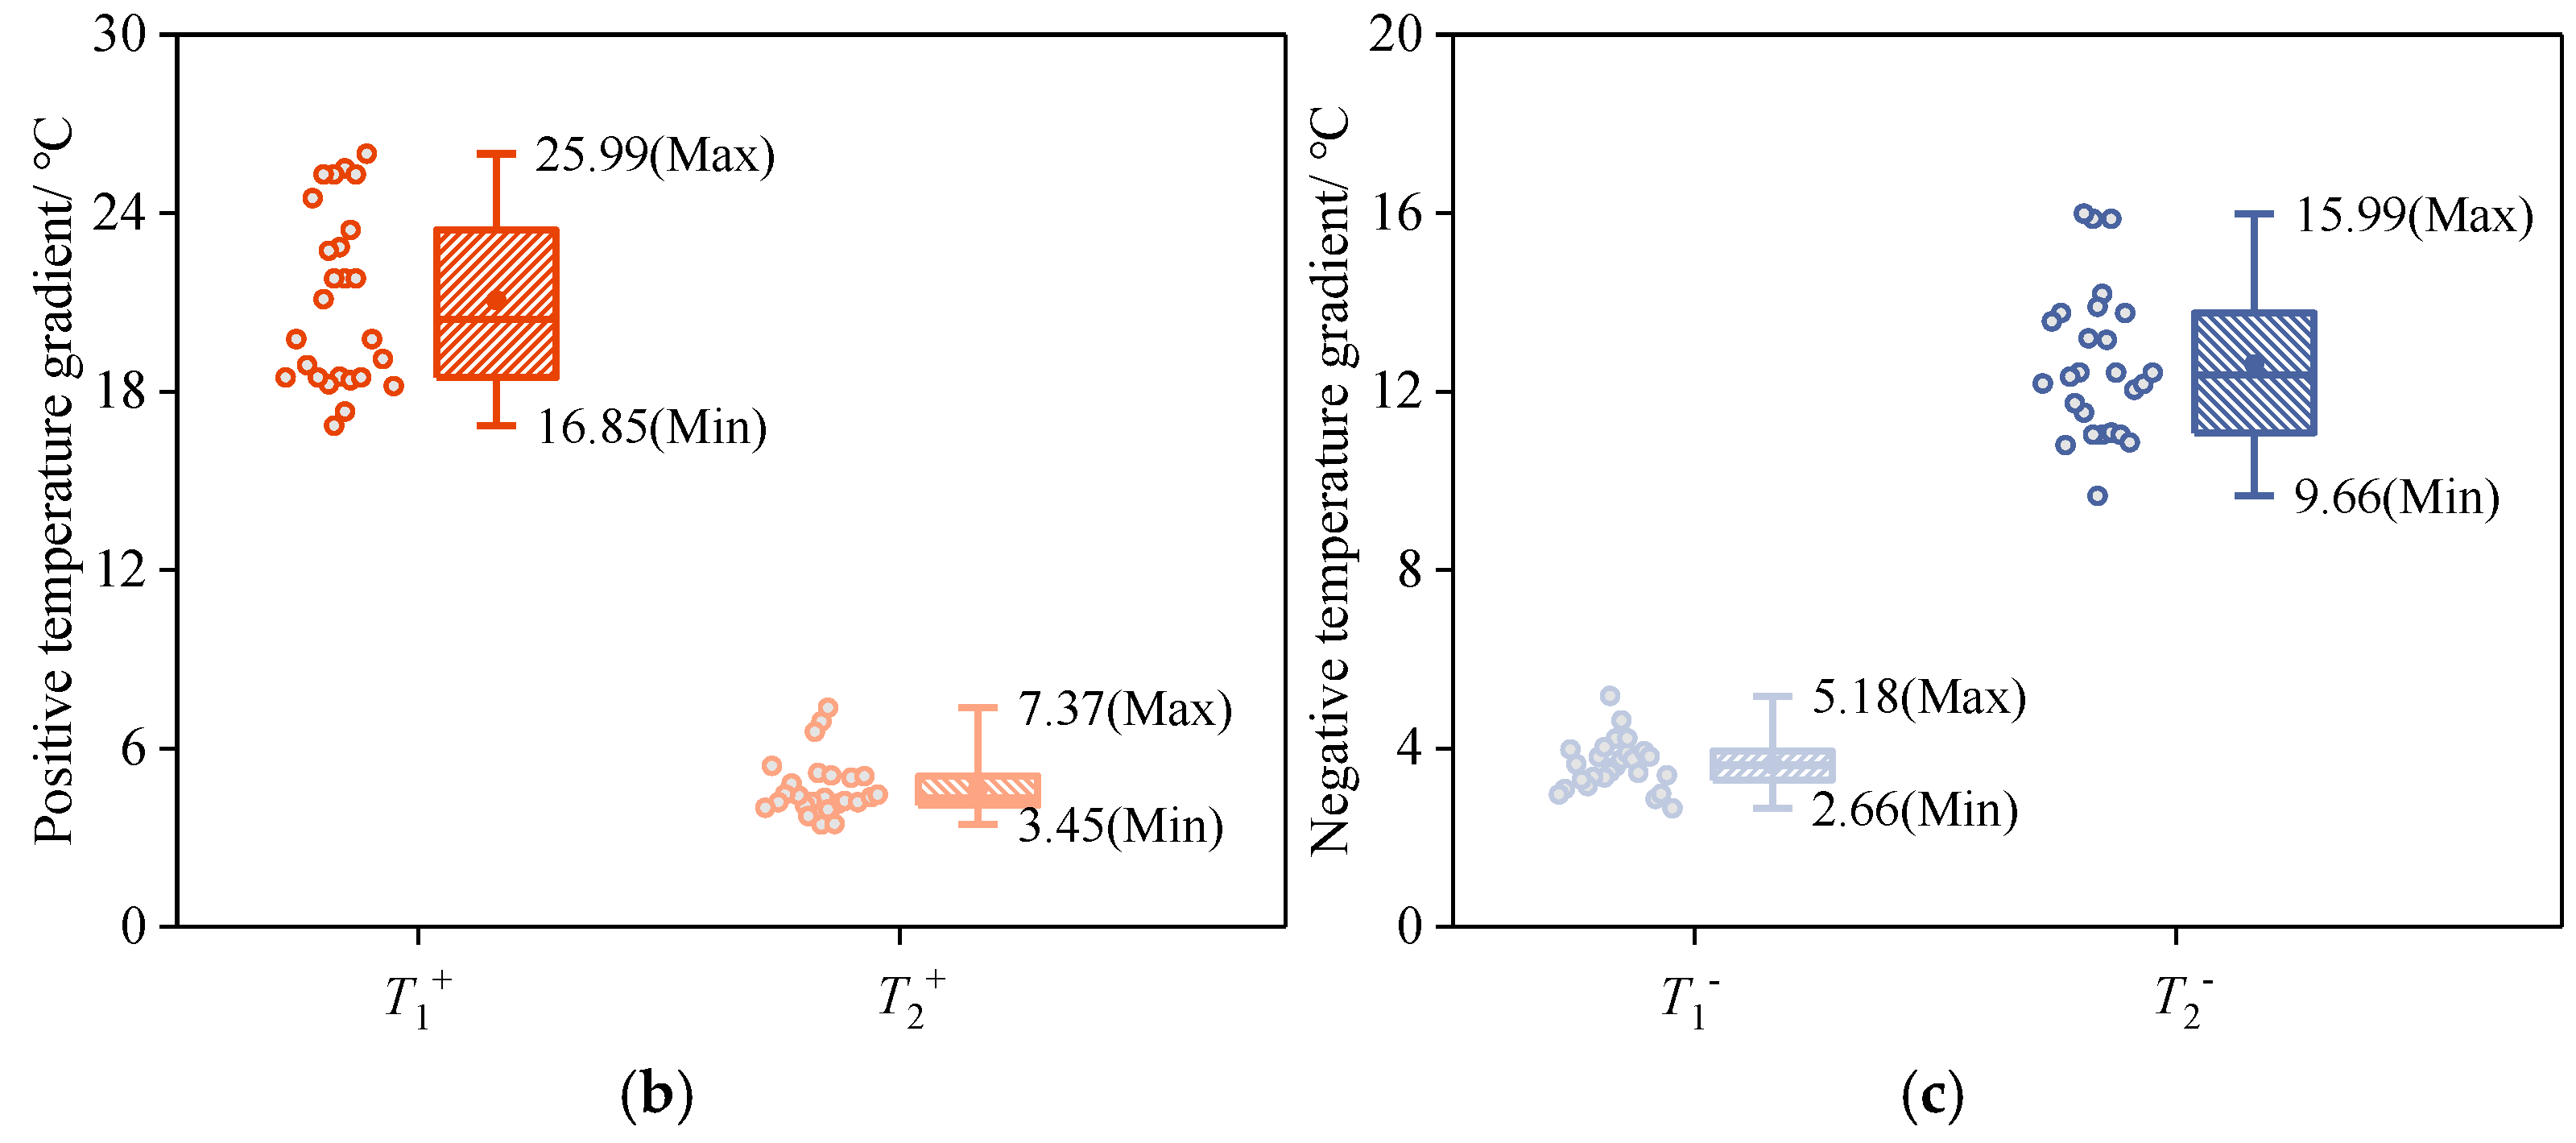
The box plots of the results of effective temperature and temperature gradient calculations for the composite girders are given in
Figure 5, and the maximum and minimum values of each temperature action in the 26 meteorological stations are indicated. It can be clearly seen that the representative values of each temperature action have significant variability in each station. Among them, the values of
Te,max and
Te,min in the 26 stations range from 22.63 to 39.81 ℃ and -40.94 to -2.28 ℃, respectively, and the maximum difference between stations reaches 17.18 ℃ and 43.22 ℃, respectively; the values of
T1+ and
T2+ in the positive temperature gradient range from 16.85 to 25.99 ℃ and 3.45 to 7.37 ℃, respectively, with the maximum difference reaching 9.14 ℃. The values of
T1+ and
T2+ in the positive temperature gradient ranged from 16.85 to 25.99 ℃ and 3.45 to 7.37 ℃, with the maximum difference of 9.14 ℃ and 3.92 ℃, respectively; the values of
T1- and
T2- in the negative temperature gradient ranged from 2.66 to 5.18 ℃ and 9.66 to 15.99 ℃, with the maximum difference of 2.52 ℃ and 6.33 ℃, respectively; and the geographic variability of
Te,min was the most significant.
5.2. Isotherm Maps of Extreme Temperatures Actions
On the basis of the long-term calculation of the temperature action representative values of the 26 stations using finite elements, the spatial interpolation calculation is carried out by using ArcMap program in ArcGIS 10.8 software platform, and the temperature action contour maps are further drawn. In order to ensure that the data of the sample points are unchanged after spatial interpolation and to avoid extreme interpolation results on the basis of controlling the smoothness of the interpolation curve, the REGULARIZED curve in the built-in spline function interpolation method of the software is selected to produce smooth surface and smooth first-order derivatives, the interpolation weight is taken as 0.1, and the number of interpolation points is taken as 10.
5.2.1. Effective Temperature
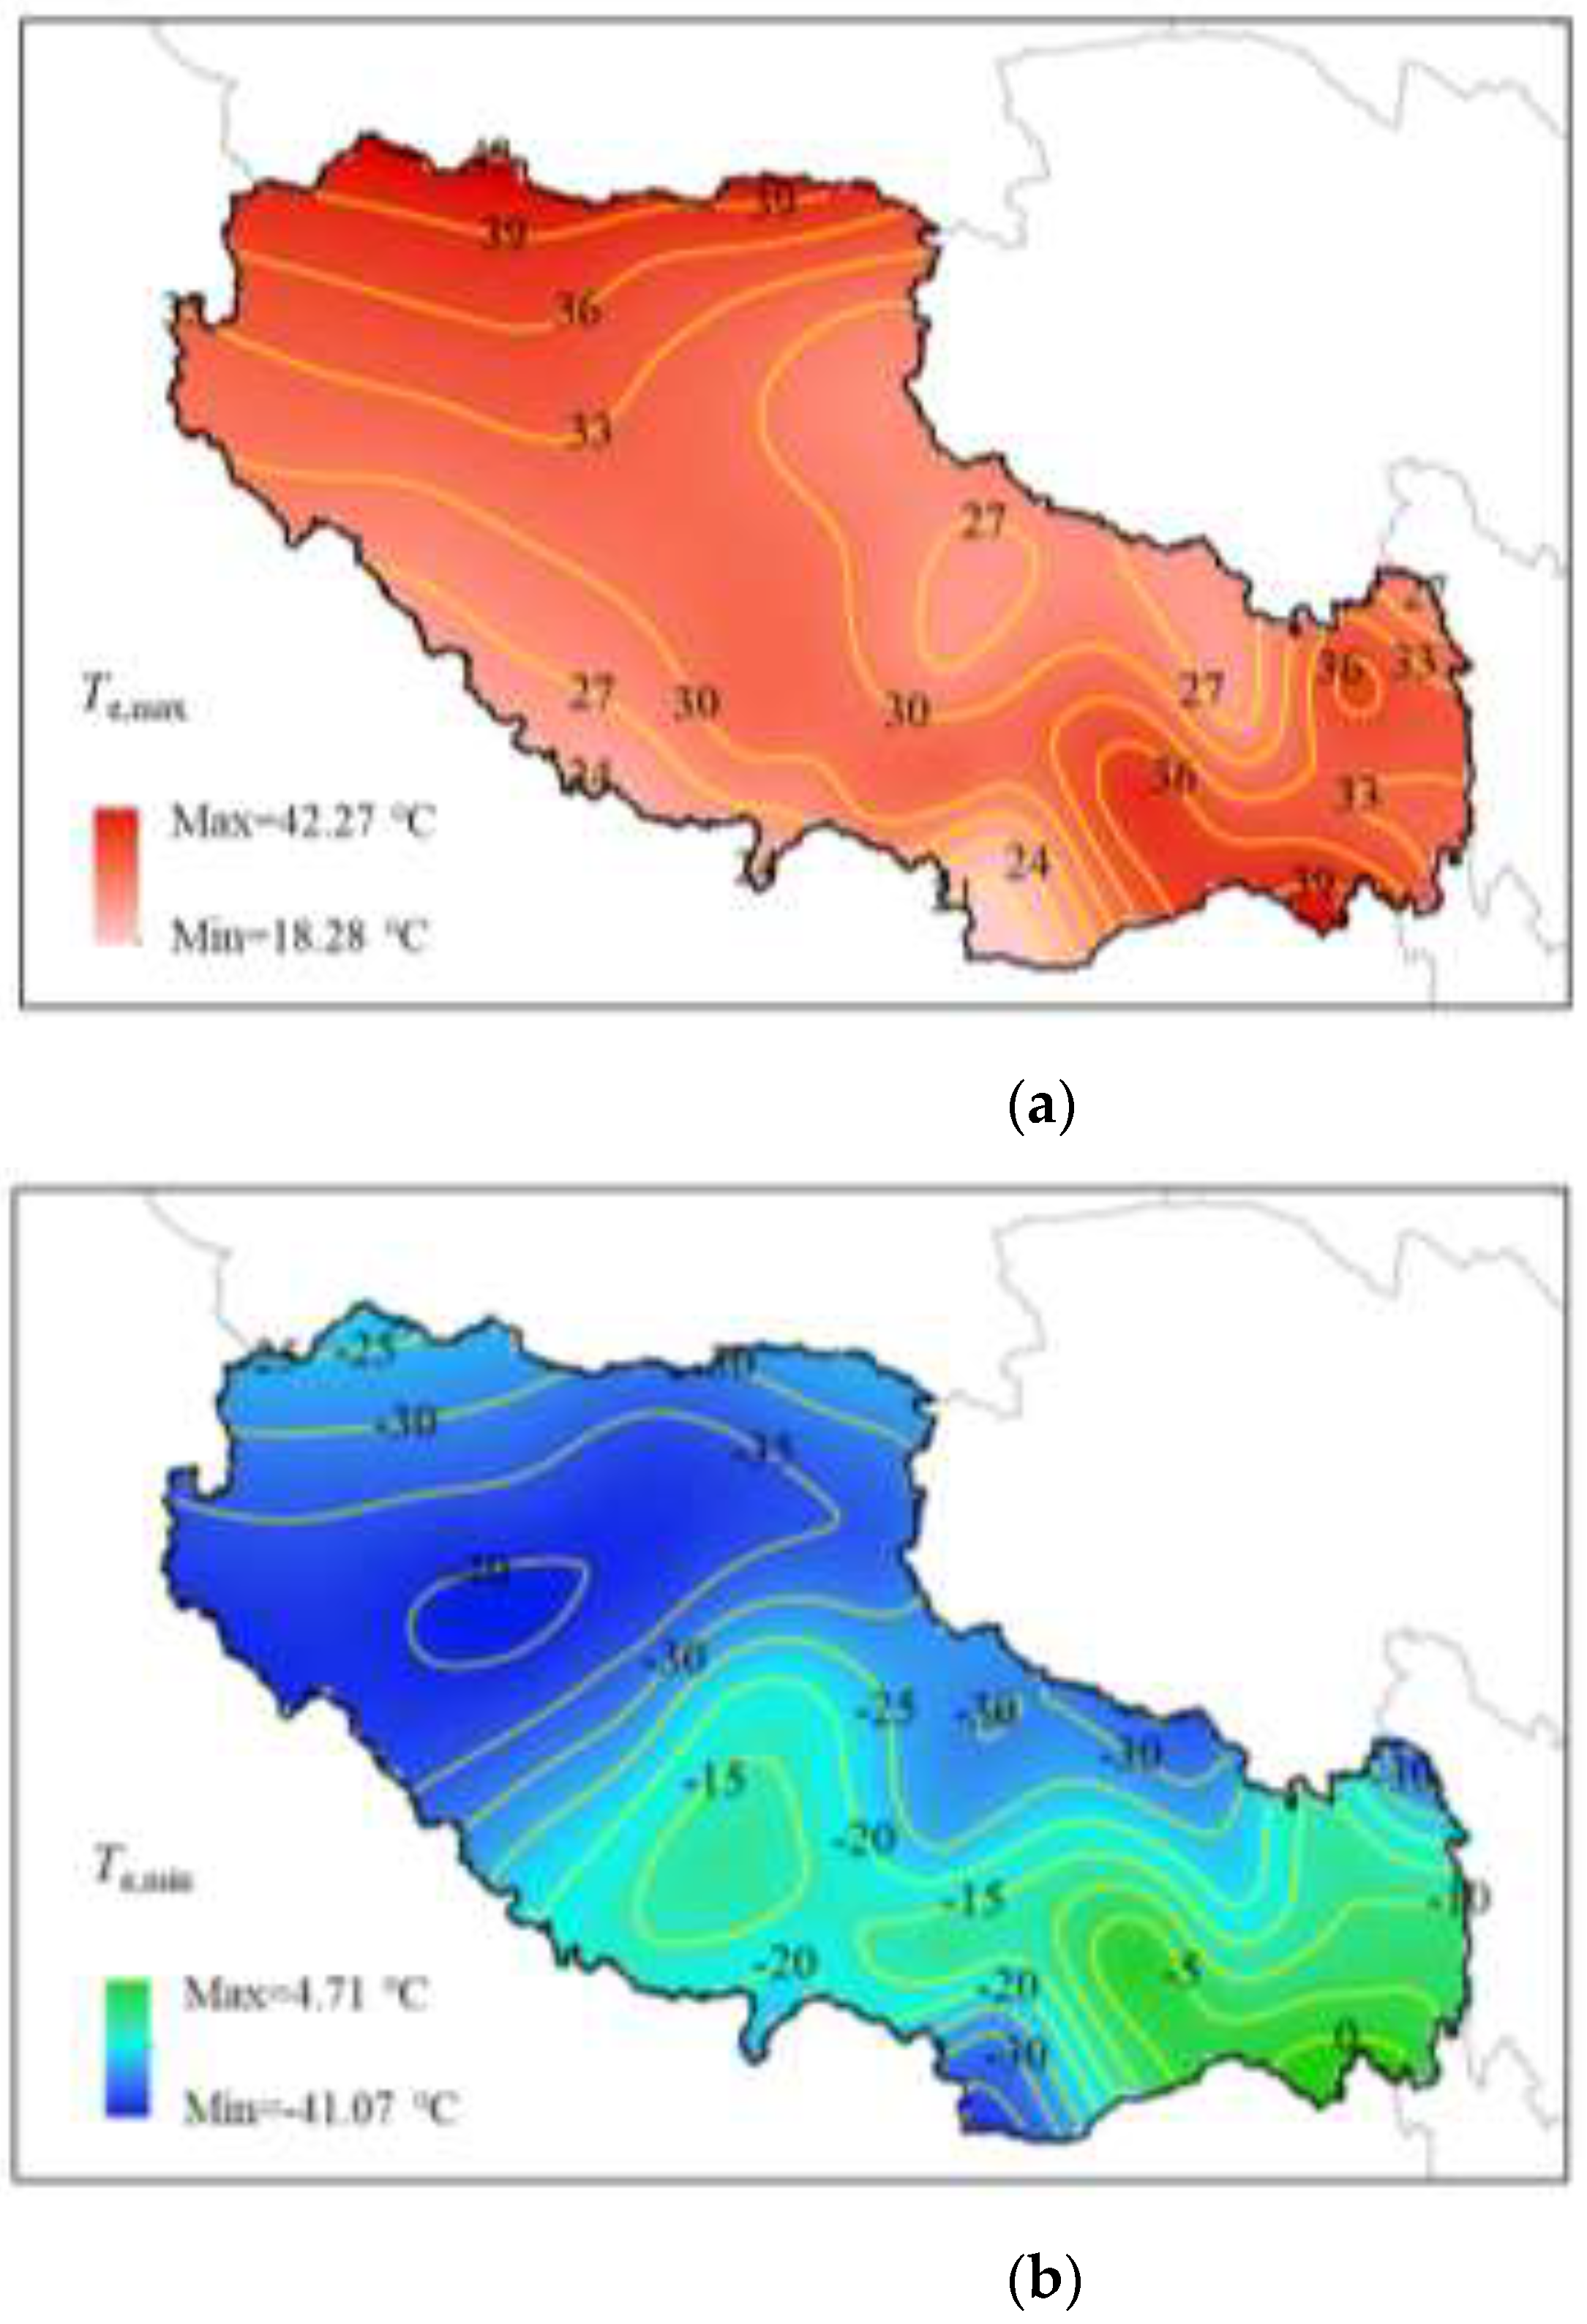
The contour map of the maximum effective temperature in Tibet is plotted in
Figure 6(a). For the effective temperature
Te, the interpolated maximum effective temperature
Te,max takes values ranging from 18.28 ℃ to 42.27 ℃, and the range of variation is slightly larger than that of the finite element calculation results, which also explains the reasonableness of the spatial interpolation method to some extent. Among them, the highest
Te,max occurs at the junction of northern Tibet and Xinjiang Tarim Basin, and the
Te,max is also larger at the junction of eastern Tibet and Sichuan and Yunnan. This is due to the fact that the effective temperature is mainly affected by the annual average temperature, and these areas have lower altitude and higher temperature. The lowest
Te,max occurs at the border of southwest Xinjiang and India, which is located on the Tibetan Plateau and has lower annual temperatures.
Figure 6(b) shows the contour map of the minimum effective temperature, and it can be seen that the value of the minimum effective temperature,
Te,min, ranges from -41.07 ℃ to 4.71 ℃. The variation range of
Te,min reaches 45.47 ℃, which is significantly higher than that of the maximum effective temperature, and T
Te,min is also significantly affected by the air temperature, and the minimum value mainly occurs in the Tibetan Plateau region of northwestern Tibet, mainly due to the sharp decrease of the minimum temperature with the increase in altitude. This is mainly due to the sharp decrease of the minimum temperature with the increase of altitude.
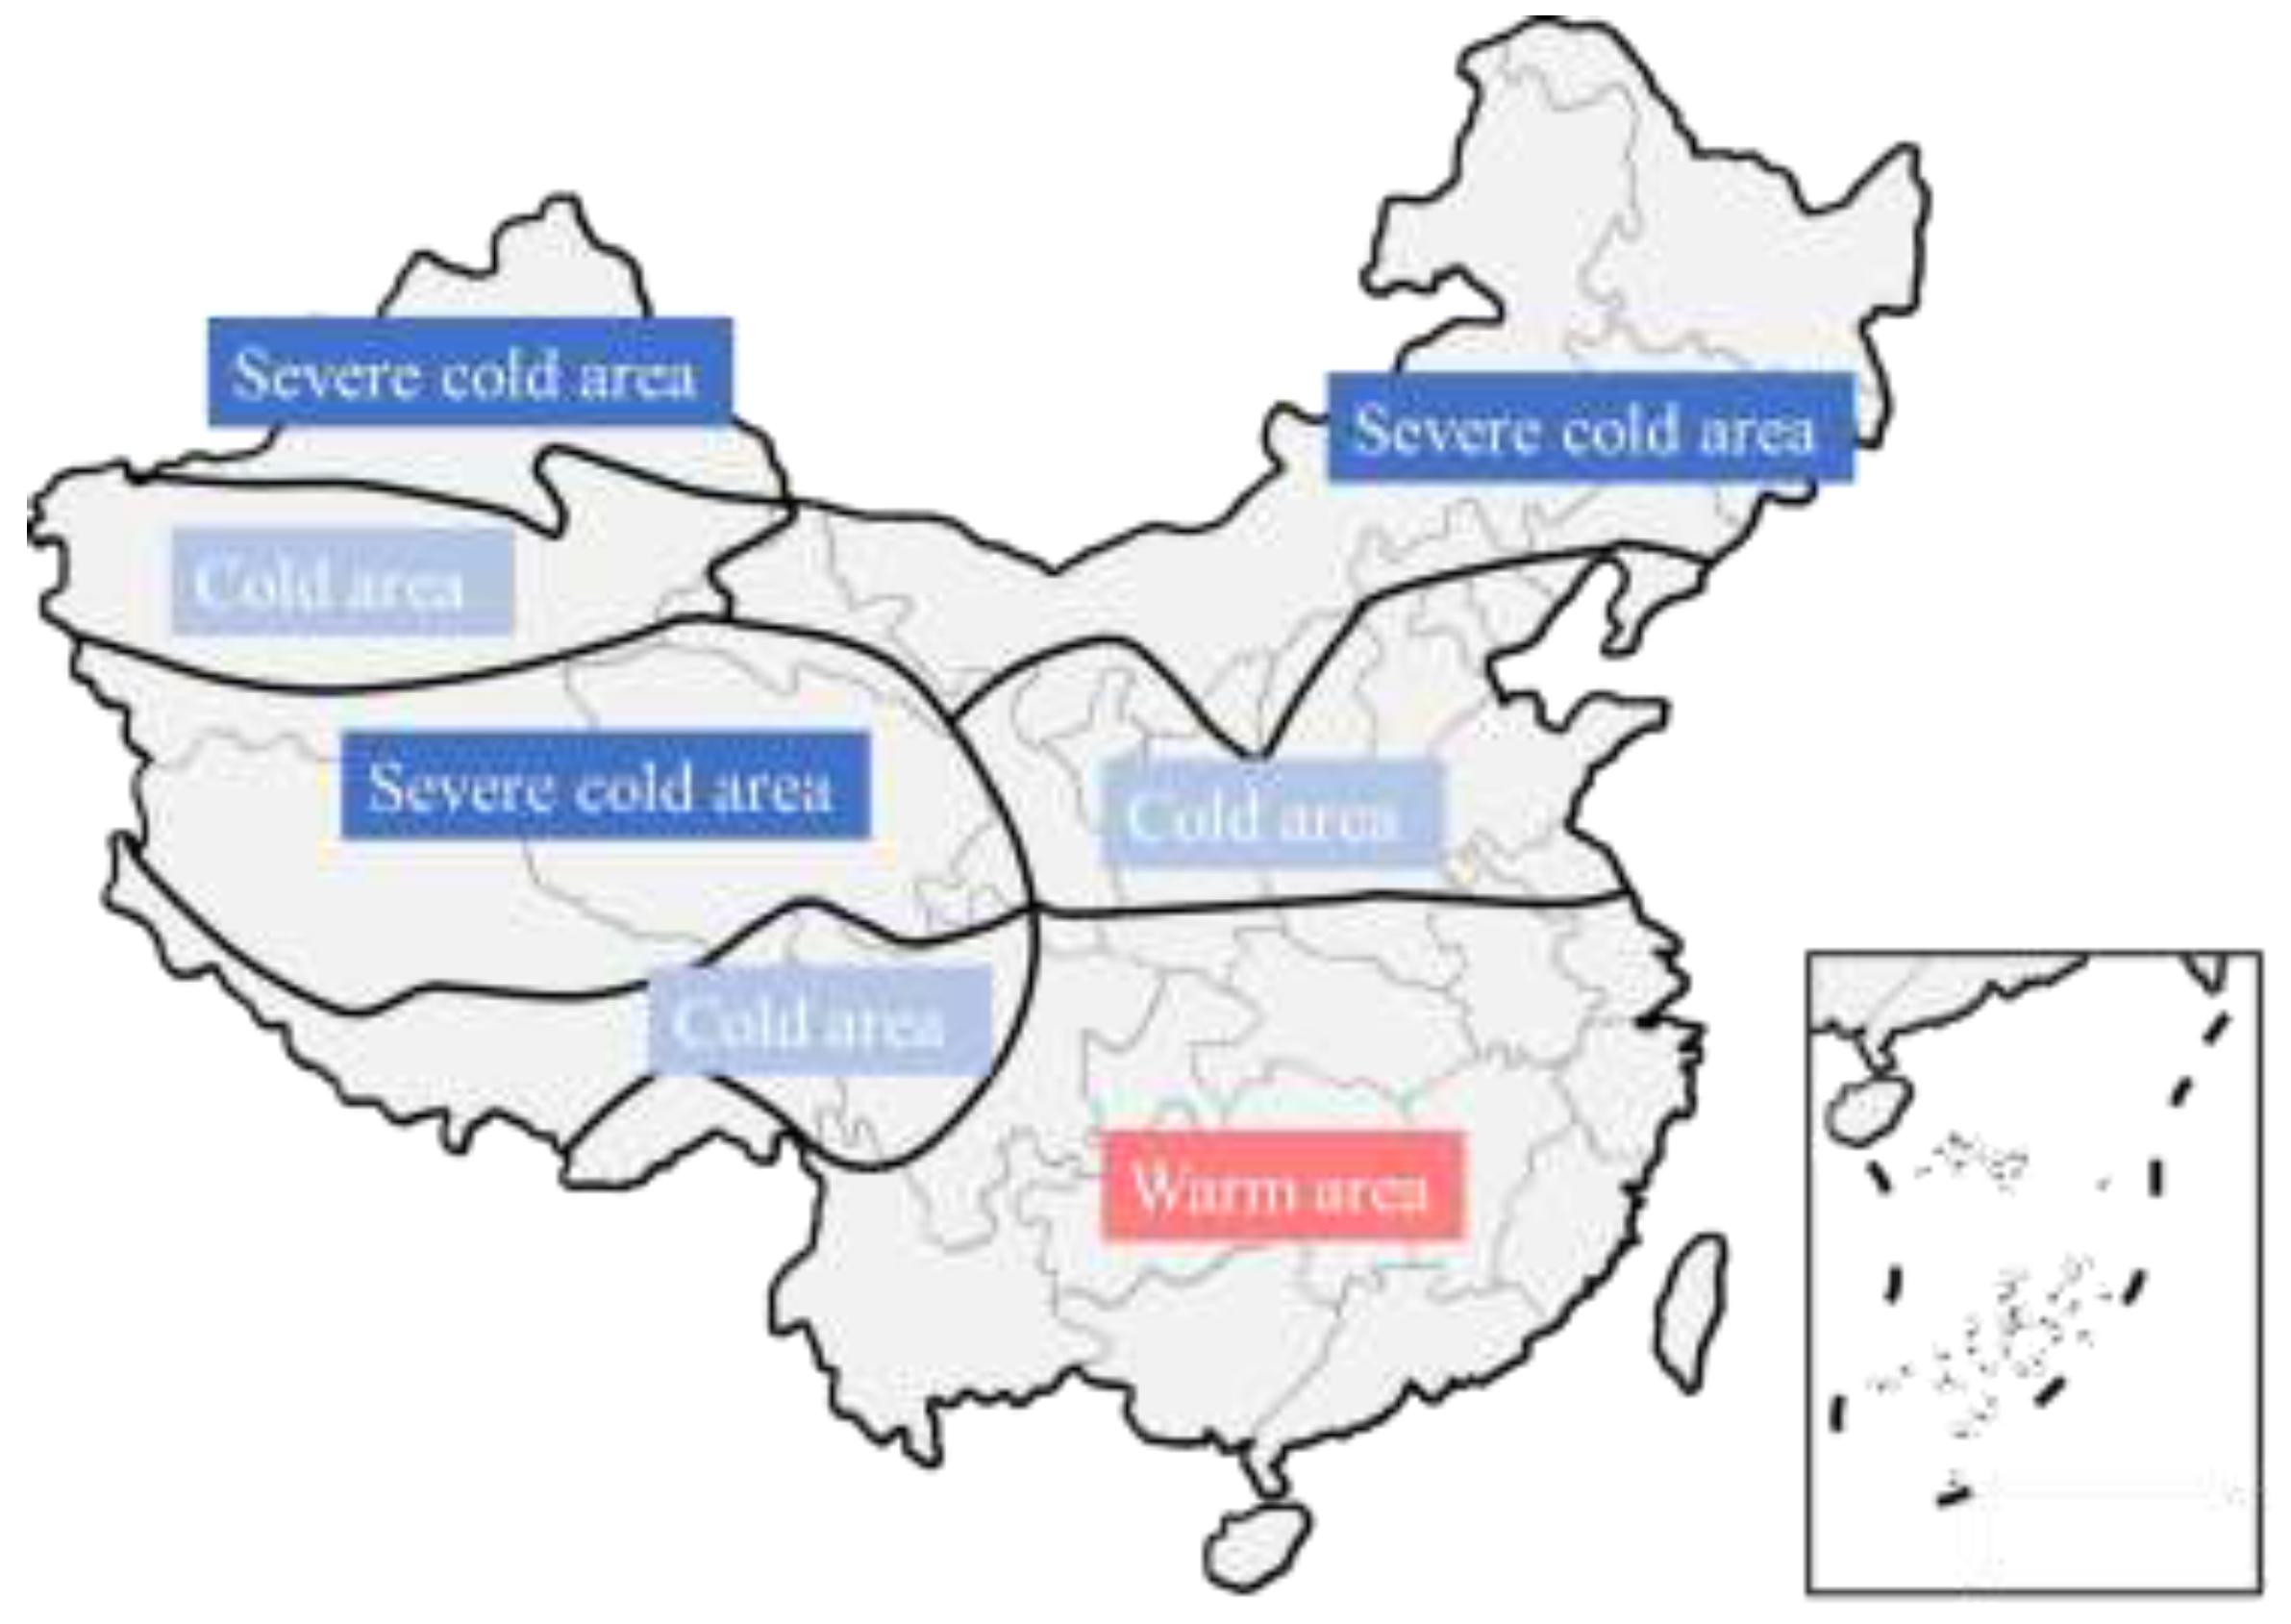
Figure 7 shows the climatic zoning map of the effective temperature values in the Chinese highway code, and the comparison with the Chinese highway code, it can be seen that in the Chinese highway code, the northern part of Tibet is in the cold region, the southern part is in the cold region, and the maximum effective temperature code suggests that the values are all 39 ℃, and comparing with the results of this paper, except for a few areas in the northern part of Tibet, the other areas are all less than the code suggests the value. This shows that the Chinese code for the maximum effective temperature is safe enough, but the economy may be insufficient. The normative recommended values for the minimum effective temperature in severe cold regions and cold regions are -32 °C and -15 °C, respectively, and the range of variation is much smaller than the calculated results of this paper, which are -41.07 °C to 4.71 °C. The minimum effective temperature in cold regions is -41.07 °C to -4.71 °C. If the value is taken according to the specification, it is obviously too rough, and the minimum effective temperature of the composite girder in most areas of the plateau region in northern Tibet is seriously underestimated, while the design of the composite girder bridge in the southern region of Tibet may be too conservative.
5.2.2. Positive Temperature Gradient
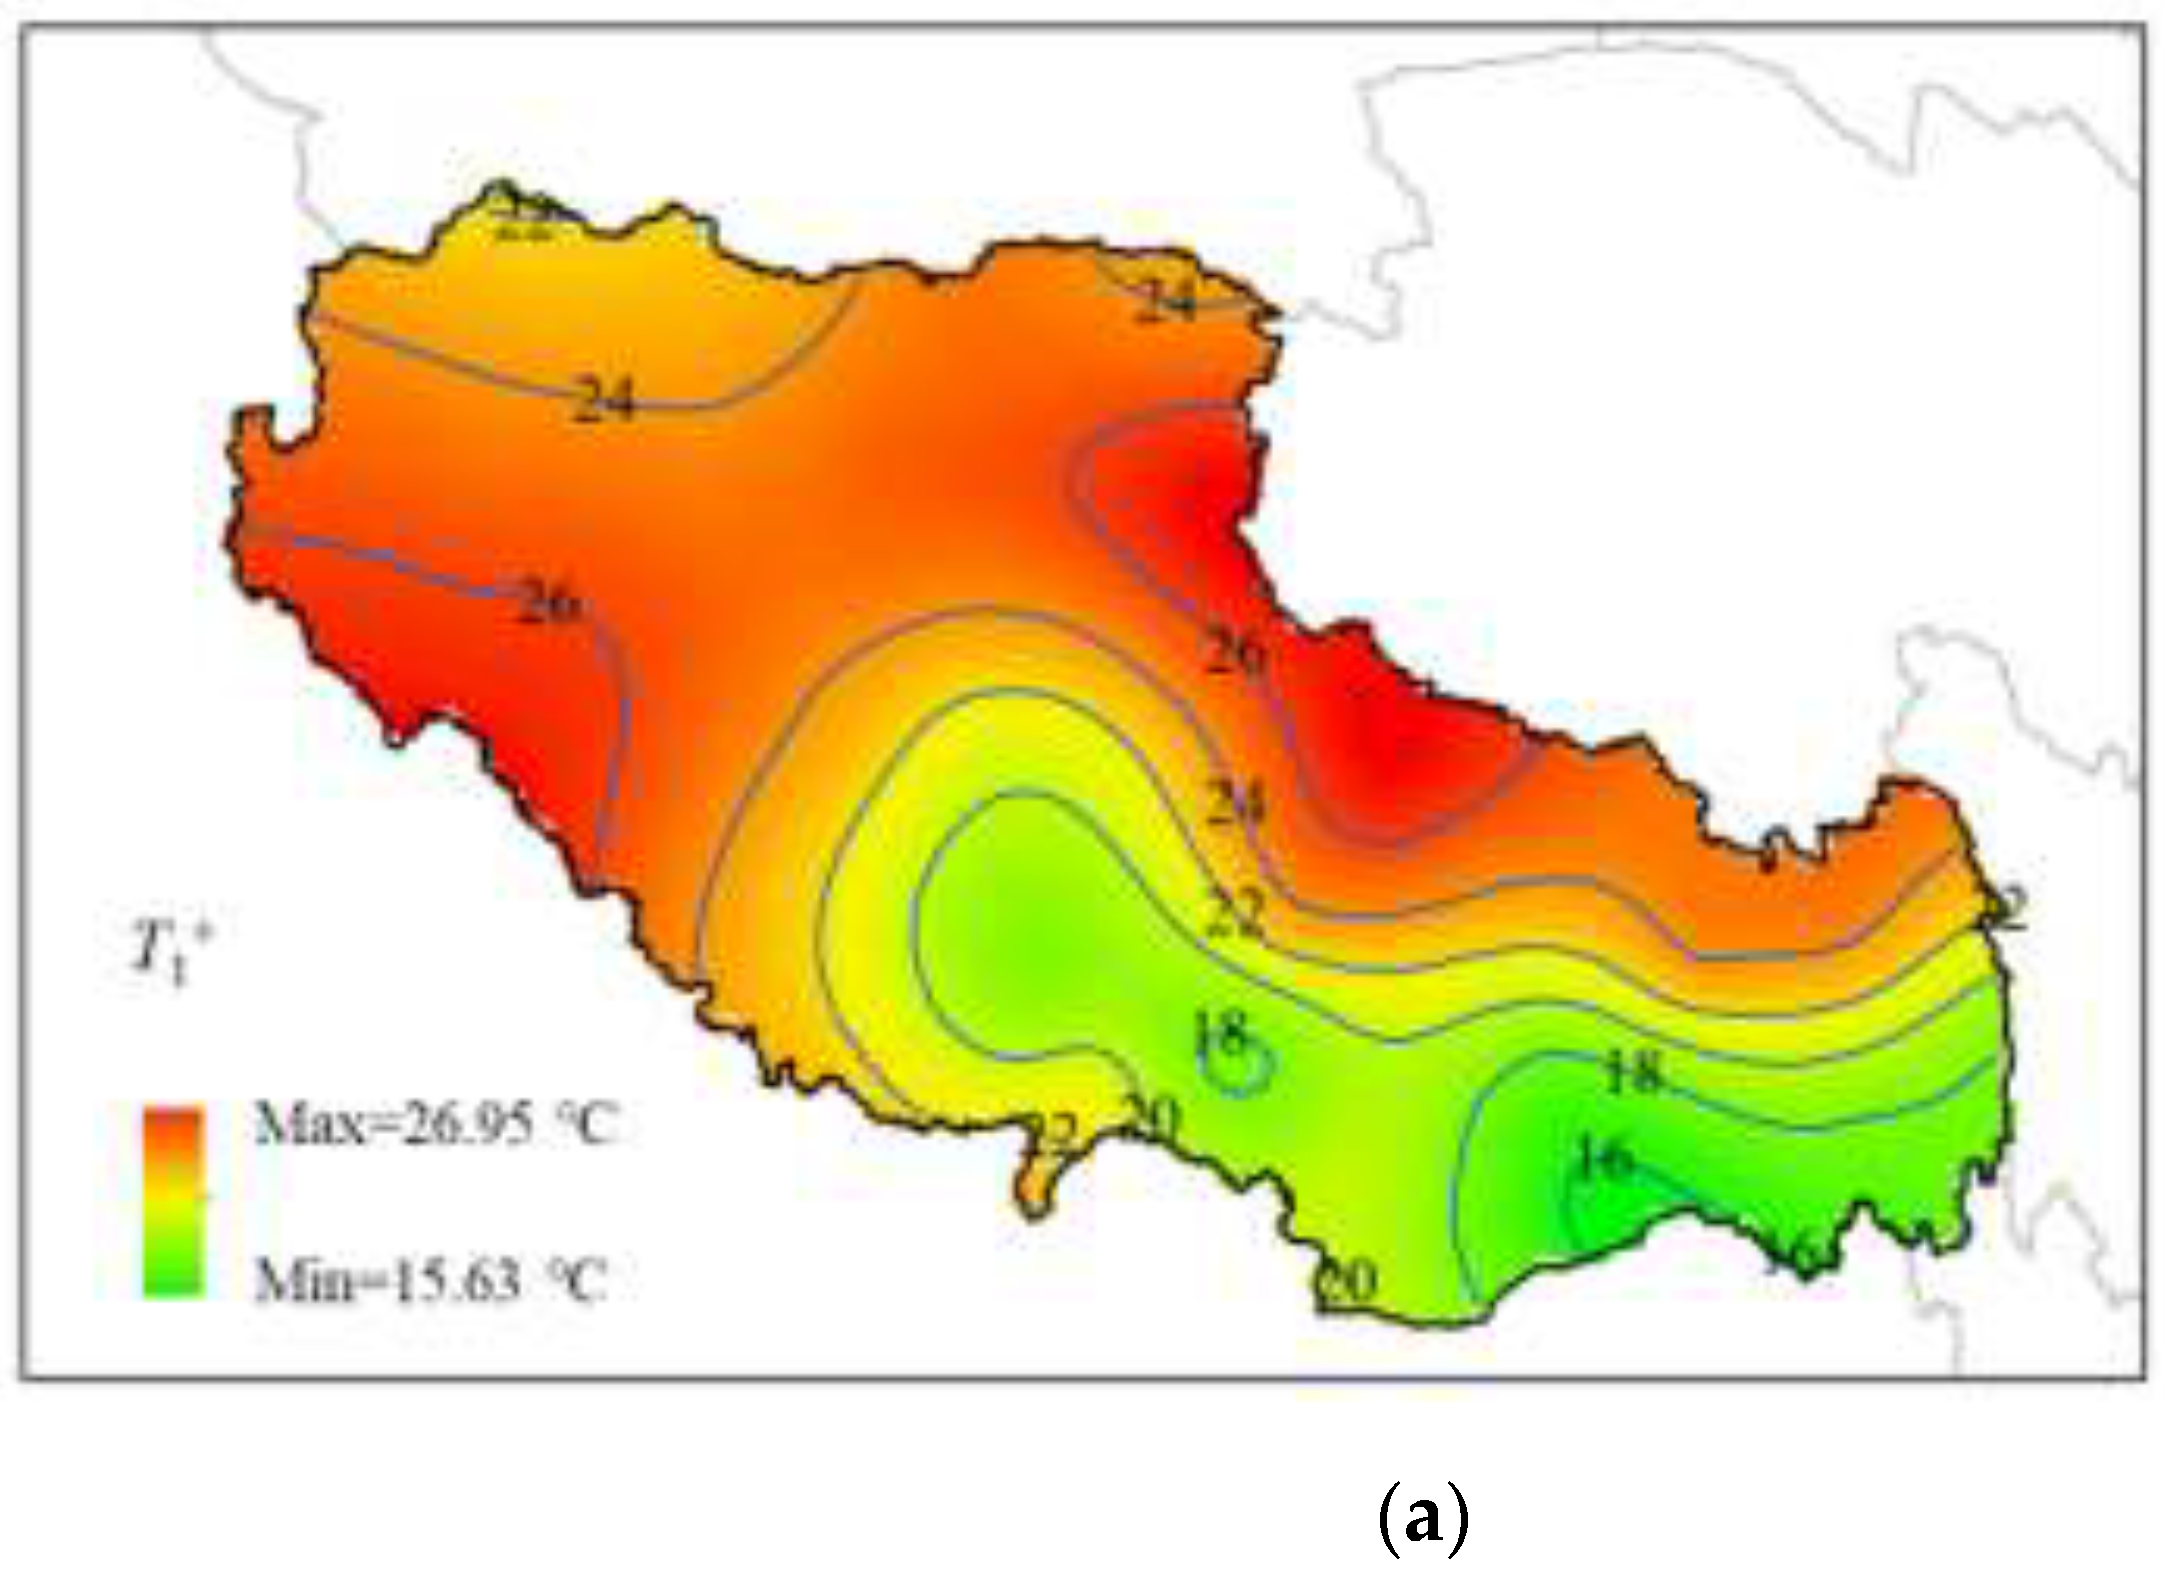
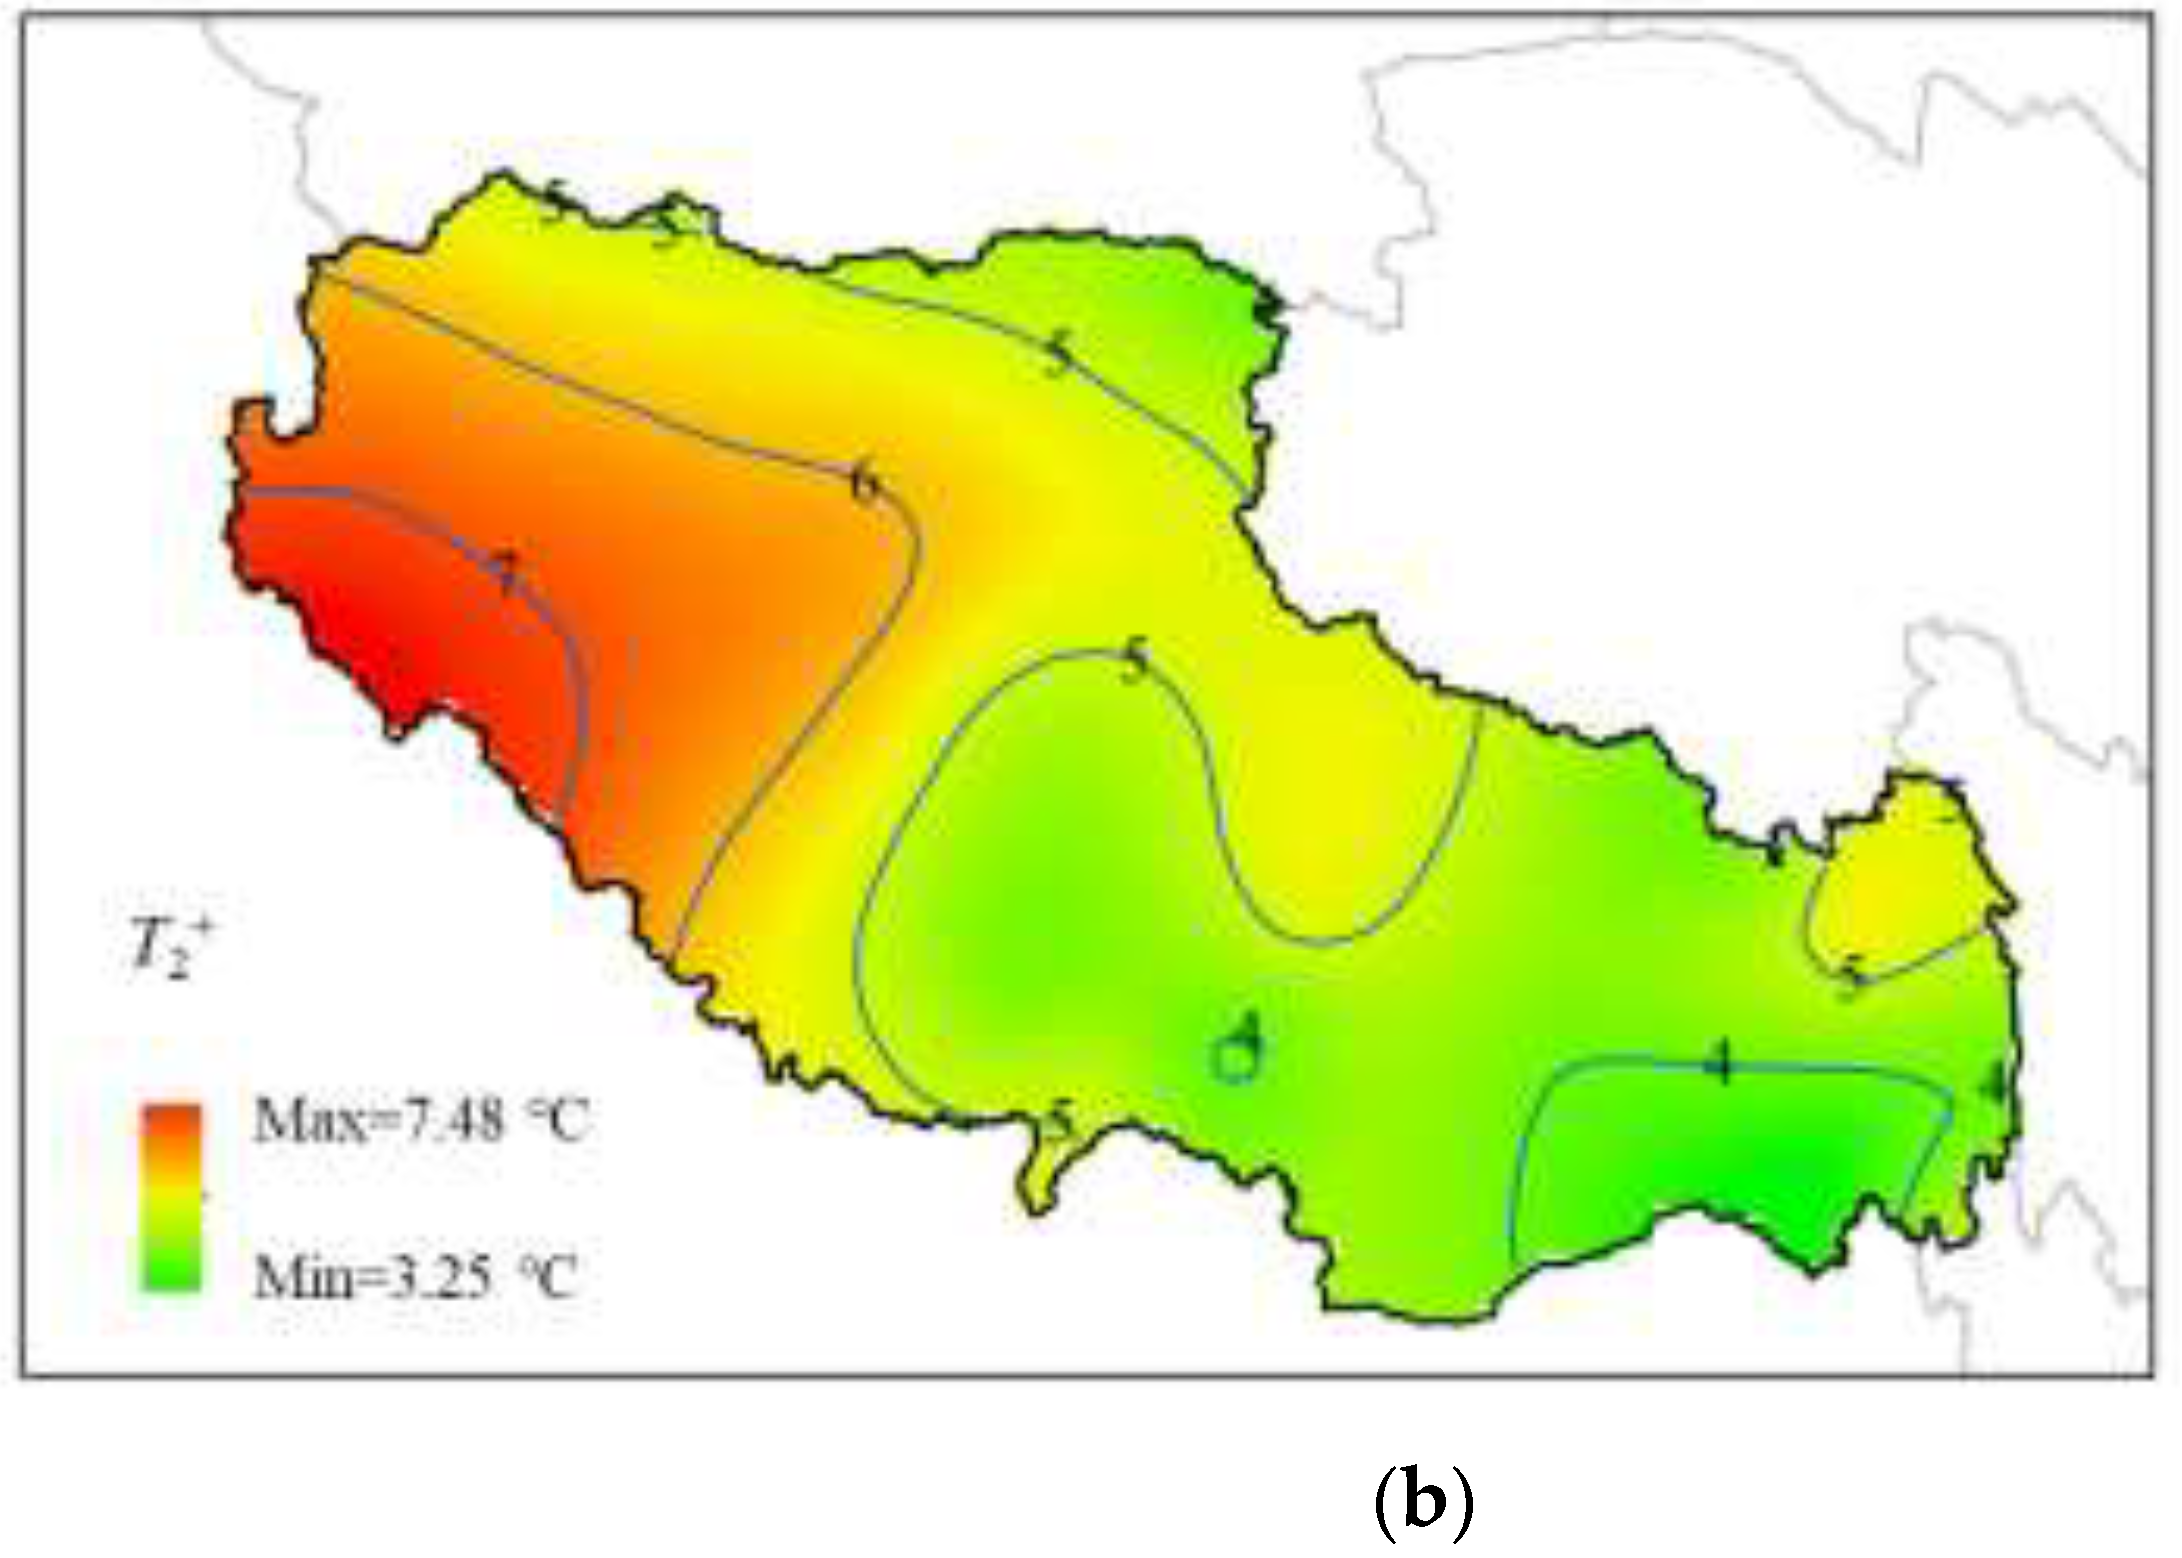
The national contour maps of
T1+ and
T2+ in the positive temperature gradient of the composite girder bridge are plotted in
Figure 8, in which the values of
T1+ range from 15.63 °C to 26.95 °C, with a geographic variation of 11.32 °C. The
T1+ is mainly caused by the solar radiation at the top of the deck slabs, which is stronger at higher elevations. Therefore, the maximum value occurs at the highest elevation in the southwestern and northeastern part of the Tibetan Plateau. The temperature difference
T2+ is accompanied by
T1+, so the distribution pattern is similar to that of
T1+. However, after the heat transfer process of the concrete of the bridge deck slab, the value decreases significantly. the value of
T2+ ranges from 3.25 °C to 7.48 °C. The temperature difference
T2+ is the same as that of
T1+.
For the deck slab thickness of not more than 0.4m of the composite girders, the Chinese highway specification of the top temperature difference T1+ take the value of 25 ℃, basically can cover the unfavorable value in the calculation results of this paper. However, for most areas in Tibet, the specification is still conservative, and the value of T2+ is 6.7 ℃, which is not more than 1℃ different from the average value of T2+ calculated in this paper.
5.2.3. Negative Temperature Gradient
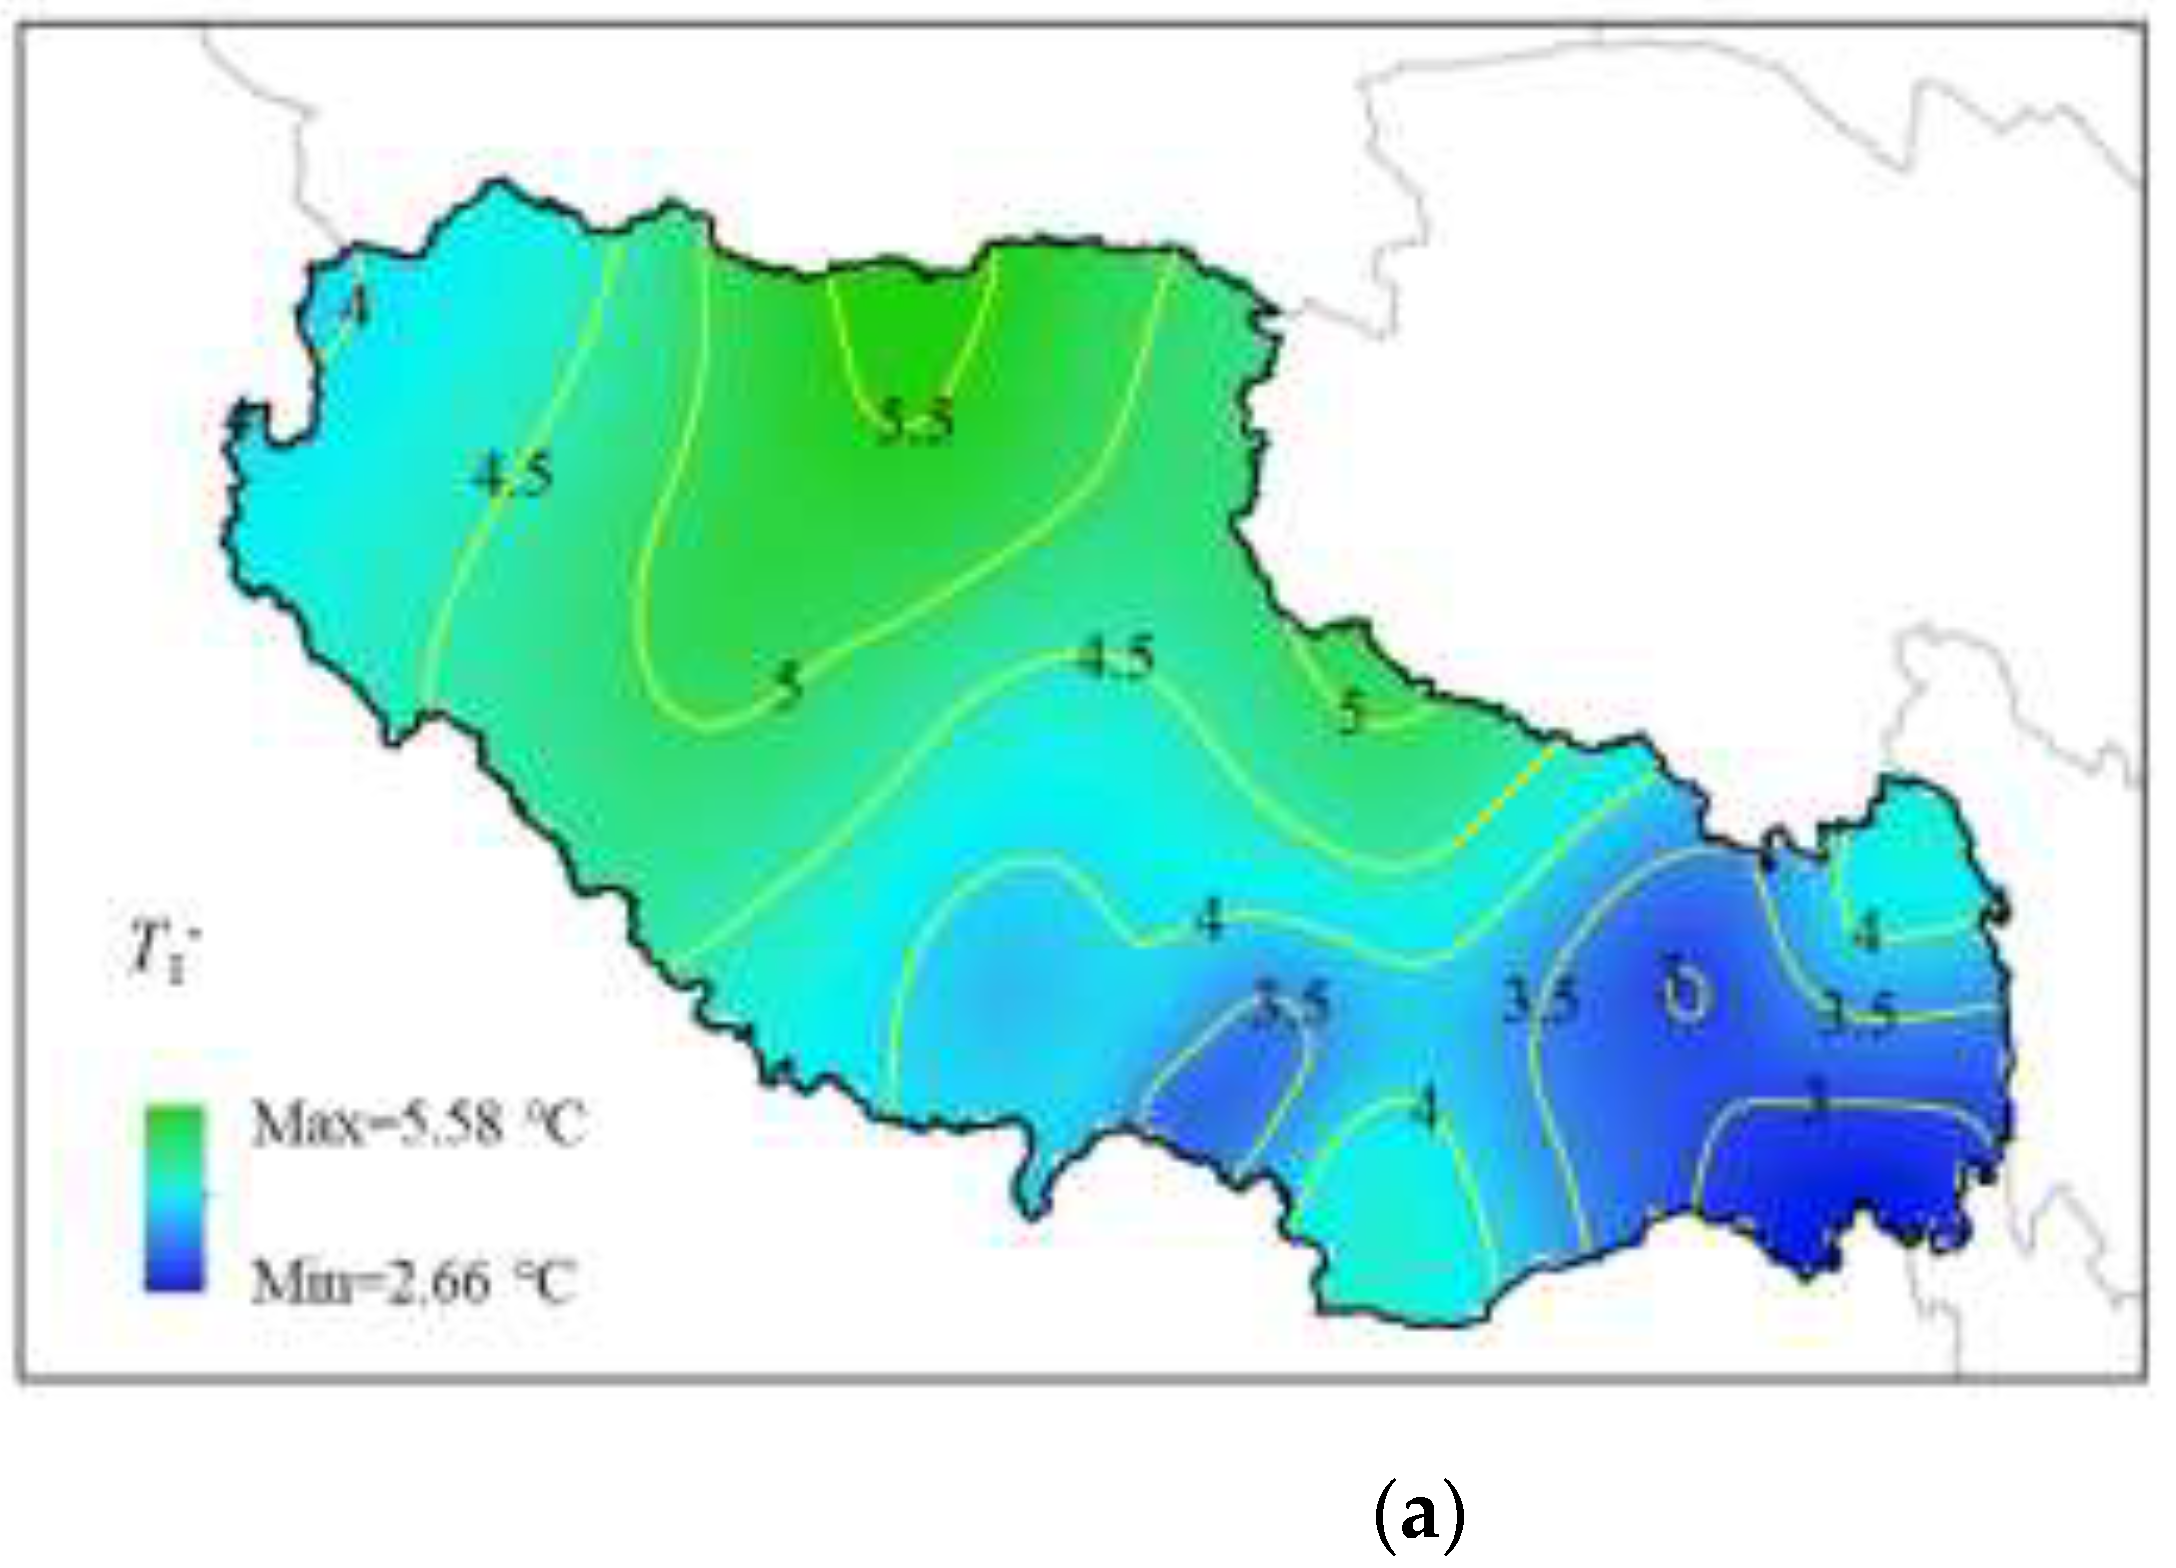
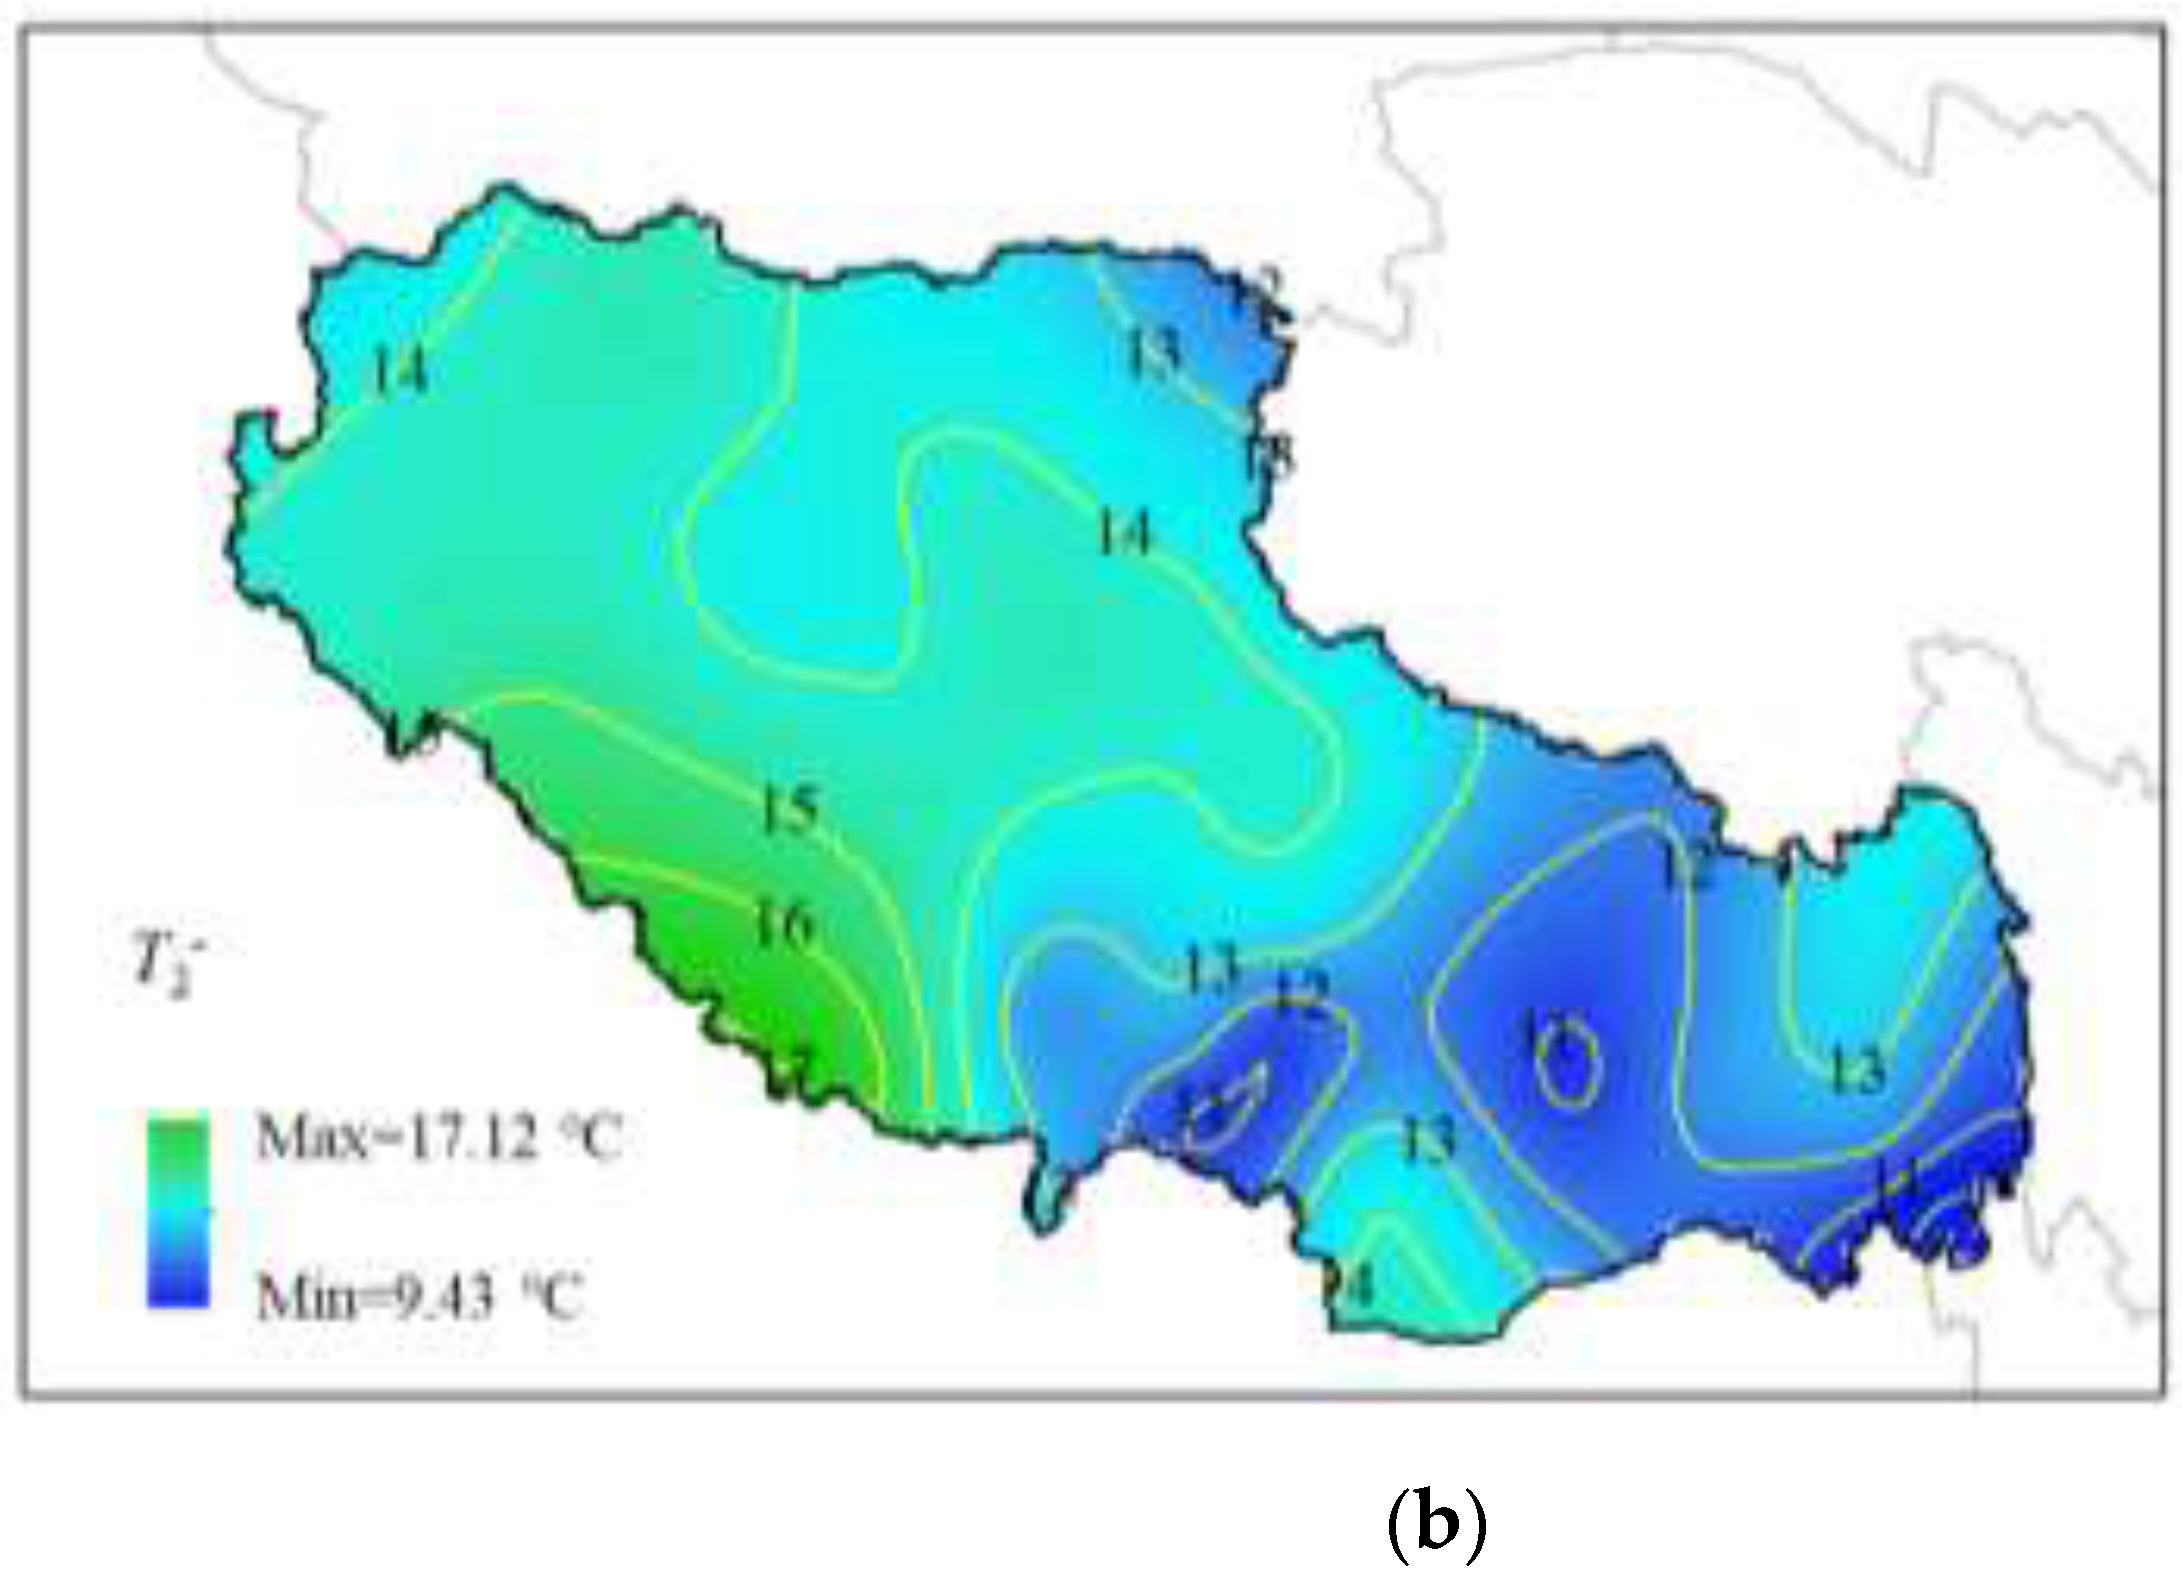
The national contour maps of
T1- and
T2- in the negative temperature gradient of the composite girder bridge are plotted in
Figure 9, where the values of
T1- are taken in the range of 2.66 °C to 5.58 °C, and the geographical variability is not significant. This is due to the poor thermal conductivity of concrete, so the temperature difference in the concrete deck slab during cooling is not significant. While steel girders have good thermal conductivity, steel girders cool down quickly when the temperature drops. The range of
T2-values reaches 9.43 ℃~ 17.12 ℃, and the distribution characteristics are basically the same as that of
T1-values. The negative temperature gradient is mainly affected by the daily temperature difference, with larger values in the western Tibetan Plateau region and smaller values in the eastern region.
The temperature difference at the top and bottom of the composite girder in Eurocode-1 is taken as -5 °C and -8 °C, respectively, respectively, the top temperature difference with the calculation of this paper basically coincides with the results, but this paper calculates the T2- much larger than the European norms, which may be due to the Tibetan Plateau region of the more severe climatic environment caused by the.
6. Conclusions
Contour maps of effective temperature and temperature gradient action extremes have been obtained based on the most unfavorable extreme meteorological conditions by investigating nearly 50 years of historical meteorological data from 26 meteorological observation stations in the Tibet of China. Results show that:
- (1)
Meteorological data can be used to calculate the temperature field of the bridge, and it is more reasonable to obtain the extreme value of the temperature of the bridge through the most unfavorable value of long-term meteorological data.
- (2)
The effective temperature of the composite girder is significantly affected by the climatic environment. The isotherm map can be used to visualize the geographical distribution pattern of the extreme value of the effective temperature. The maximum and minimum effective temperatures in Tibet are 18.28 ℃~42.27 ℃ and -41.07 ℃~4.71 ℃, respectively. The geographical difference between these temperatures is 23.99 ℃ and 45.78 ℃, respectively. The influence of low temperatures is more pronounced.
- (3)
The positive temperature gradient in the Chinese code and the negative temperature gradient in the European code are used to describe the temperature difference characteristics of the composite girders. The values of T1+ and T2+ in the positive temperature gradient range from 15.63 ℃ to 26.95 ℃ and from 3.25 ℃ to 7.48 ℃, with geographical differences of 11.32 ℃ and 4.23 ℃, respectively. It can be observed that the effect of temperature difference at the top is more significant. In the negative temperature gradient, the values of T1- and T2- range from 2.66 ℃~ 5.58 ℃ and 9.43 ℃~ 17.12 ℃ respectively, with geographical differences of 2.92 ℃ and 7.69 ℃ respectively, and the effect of temperature difference at the bottom is more significant.
- (4)
Referring to the temperature action values of composite girders in Chinese code and Eurocode, the highest effective temperature and positive temperature gradient values are too conservative in most areas of Tibet, while the lowest effective temperature and negative temperature gradient values are not safe enough, which may lead to cracking of concrete deck slabs of composite girder bridges and diseases of bearings and expansion joints. The isotherm map in this paper can visualize the geographical distribution of the effective temperature extremes of the composite girder bridge, and the effective temperature extremes in the areas between different isotherms can be obtained by linear interpolation. It helps to refine the design of composite girder bridges in cold regions.
Author Contributions
Conceptualization, Y.L. and Z.M; methodology, Y.L. and Z.M.; software, Z.M.; validation, Z.M.; formal analysis, Y.L. and Z.M; investigation, Y.L. and Z.M; supervision, Y.L.; project administration, Y.L.; writing—original draft preparation, Y.L. and Z.M; writing—review and editing, J.L. and Z.M.; All authors have read and agreed to the published version of the manuscript.
Funding
This study is funded by the Special Fund for Basic Scientific Research of Central College of Chang’an University (Grant No. 300102213703, 300102214205), which are gratefully acknowledged.
Institutional Review Board Statement
Not applicable.
Informed Consent Statement
Not applicable.
Data Availability Statement
All datasets are publicly available.
Conflicts of Interest
The authors declare no conflict of interest.
References
- Liu, J.; Liu, Y.J.; Zhang, C.Y.; Zhao, Q.H.; Lyu, Y. Temperature Action and Effect of Concrete-filled Steel Tubular Bridges: A Review. J. Traffic Transp. Eng. (Engl. Ed.) 2020, 7, 174–191. [Google Scholar] [CrossRef]
- Liu, J.; Liu, Y.J.; Jiang, L.; Zhang, N. Long-term Field Test of Temperature Gradients on the Composite Girder of a Long-span Cable-stayed Bridge. Adv. Struct. Eng, 2019; 22, 2785-2798. [Google Scholar]
- Sang-Hyo, K.; Se-Jun, P.; Jiaxu, W.; Jeong-Hun, W. Temperature variation in steel box girders of cable-stayed bridges during construction. J. Constr. Steel. Res. 2015, 112, 80-92.
- Elbadry, M.M.; Ghali, A. ; Temperature Variations in Concrete Bridges. J. Struct. Eng. 1983, 109, 2355-2374, 2355. [Google Scholar]
- Ding, Y.; Zhou, G. , Li, A.; Wang, G. Thermal Field Characteristic Analysis of Steel Box Girder Based on Long-term Measurement Data. Int. J. Steel Struct. 2012, 12, 219--232.
- Zhang, N.; Liu, Y.J.; Liu, J. Temperature Effects of H-shaped Concrete Pylon in Arctic-alpine Plateau Region. J. Traffic Transp. Eng. 2017, 17, 66–77. [Google Scholar]
- Ren, X.; He, Q.; Tong, Y.; Huang, P.M. Temperature and Stress Fields Analysis of Concrete Bridge Tower. J. Zhengzhou Univ. (Eng. Sci.). 2011, 32, 62–65. [Google Scholar]
- Liu, J.; Liu, Y.J.; Bai, Y.X. Study on Regional Difference and Zoning of the Temperature Gradient Pattern of Concrete Box Girder. China J. Highw. Transp. 2020, 33, 73–84. [Google Scholar]
- Potgieter, I. C. , Gamble, W. L. Nonlinear Temperature Distributions in Bridges at Different Locations in the United States. PCI Journal, 1989, 34, 80–103. [Google Scholar] [CrossRef]
- Mirambell, E. , Aguado, A., Mendes, P. A. Design Temperature Differences for Concrete Bridges. Structural Engineering International. 1991, 1, 36–40. [Google Scholar]
- Dai, P.; Qian, Y.J. Short-term Temperature Characteristics of H-shaped Section Concrete Pylon of Cable-stayed Bridge. J. Southwest Jiaotong Uni. 2014, 49, 59–65. [Google Scholar]
- Liu, X.F. Thermal Stress Analysis of Concrete Structures; China Communications Press: Beijing, China, 1991. [Google Scholar]
- Wang, Y.B.; Zhan, Y.L.; Zhao, R.D. Analysis of thermal behavior on concrete box-girder arch bridges under convection and solar radiation. Adv. Struct. Eng. 2016, 19, 1043–1059. [Google Scholar] [CrossRef]
- Li, Y.; He, S.H.; Liu, P. Effect of Solar Temperature Field on a Sea-crossing Cable-stayed Bridge Tower. Adv. Struct. Eng. 2019, 22, 1867–1877. [Google Scholar] [CrossRef]
- Wang, Z.; Liu, Y.J.; Tang, Z.W.; Zhang, G.J.; Liu, J. Three-dimensional Temperature Field Simulation Method of Truss Arch Rib Based on Sunshine Shadow Recognition. China J. Highw. Transp. 2022, 35, 91–105. [Google Scholar]
- Chen, D.S.; Wang, H.J.; Qian, H.L.; Li, X.Y.; Fan, F.; Shen, S.Z. Experimental and Numerical Investigation of Temperature Effects on Steel Members Due to Solar Radiation. Appl. Therm. Eng. 2017, 127, 696–704. [Google Scholar] [CrossRef]
- Liu, H.B.; Chen, Z.H.; Zhou, T. Theoretical and experimental study on the temperature distribution of H-shaped steel members under solar radiation. Appl. Therm. Eng. 2012, 37, 329–335. [Google Scholar] [CrossRef]
- Kehlbeck, F. Effect of Solar Radiation on Bridge Structure.; China Railway Publishing House, Beijing, 1981.
- Liu, B.Y.; Jordan, R.C. The Interrelationship and Characteristic Distribution of Direct, Diffuse and Total Solar Radiation. Sol. Energy. 1960, 4, 1–19. [Google Scholar] [CrossRef]
- Hottel, H.C. A Simple Model for Estimating the Transmittance of Direct Solar Radiation Through Clear Atmospheres. Sol. Energy. 1976, 18, 129–134. [Google Scholar] [CrossRef]
- Jiang, H.F.; Wen, D.Y.; Li, N.; Ding, Y.; Xiao, J. A New Simulation Method for the Diurnal Variation of Temperature--Sub-sine Simulation. Metro. Disaster Red. Res. 2010, 33, 61–65. [Google Scholar]
- Thapar, V.; Agnihotri, G.; Sethi, V.K. Estimation of Hourly Temperature at a Site and its Impact on Energy Yield of a PV Module. Int. J. Green Energy. 2012, 9, 553–572. [Google Scholar] [CrossRef]
|
Disclaimer/Publisher’s Note: The statements, opinions and data contained in all publications are solely those of the individual author(s) and contributor(s) and not of MDPI and/or the editor(s). MDPI and/or the editor(s) disclaim responsibility for any injury to people or property resulting from any ideas, methods, instructions or products referred to in the content. |
© 2024 by the authors. Licensee MDPI, Basel, Switzerland. This article is an open access article distributed under the terms and conditions of the Creative Commons Attribution (CC BY) license (http://creativecommons.org/licenses/by/4.0/).
