1. Introduction
Water resources are integral to sustaining human life, fostering economic growth, and supporting biotic ecosystems, particularly in regions such as the Lake Victoria Basin, one of Africa's most critical transboundary water systems [
1]. The significance of these resources is underscored by global and regional frameworks, such as Sustainable Development Goal 6, Africa's Agenda 2063 Goal 6, and Uganda's National Development Plan 4, all of which advocate for easy and equitable access to safe and sustainable water resources [
2,
3,
4]. However, increasing pressures from population growth, agricultural expansion, and climate variability threaten the sustainability of these resources [
1]. The current water resource demand in the Nakivale Sub-catchment ranges between 3.5-4.5 MCM/year, with groundwater recharge estimated at 10-25 mm/year [
5]. This close range imbalance between water demand and recharge highlights the need for detailed studies on local hydrological processes, which are essential for the sustainable management of water resources in the region.
According to previous studies [
6,
7], groundwater and surface water within the Lake Victoria Basin are closely interlinked. As a consequence, this symbiotic effect influences both the quantity and quality of water resources in the two hydrological systems. Despite this, critical aspects such as localized groundwater recharge processes, flow dynamics, and the factors influencing groundwater chemistry in the region remain poorly understood [
1]. Therefore, this study aims to characterize groundwater within Nakivale sub-catchment in Southwestern Uganda using both classical hydrochemistry and isotopic approaches.
These techniques have been globally used to infer information on groundwater origin, recharge processes, flow patterns, rock-water interaction processes among many more hydrological studies [7,15]. The specific objectives are to evaluate the key processes controlling groundwater hydrochemistry, determine the hydrogeochemical groundwater facies prevalent in the study area, analyse groundwater origin, recharge processes, and finally, formulate evidence-based policy recommendations for sustainable groundwater management and development within the Nakivale sub-catchment.
The findings of this study are not only relevant for the Nakivale sub-catchment but also have broader implications for the entire Lake Victoria Basin. As a transboundary water system shared by Uganda, Kenya, Tanzania, Rwanda, and Burundi, effective management of the Lake Victoria Basin’s water resources requires a comprehensive understanding of the hydrological processes that govern water availability and quality at both localized and broader fronts. This enhances the understanding of groundwater dynamics in the study area and provides valuable insights for the wider management of the transboundary Lake Victoria Basin.
2. Materials and Methods
2.1. Study Area
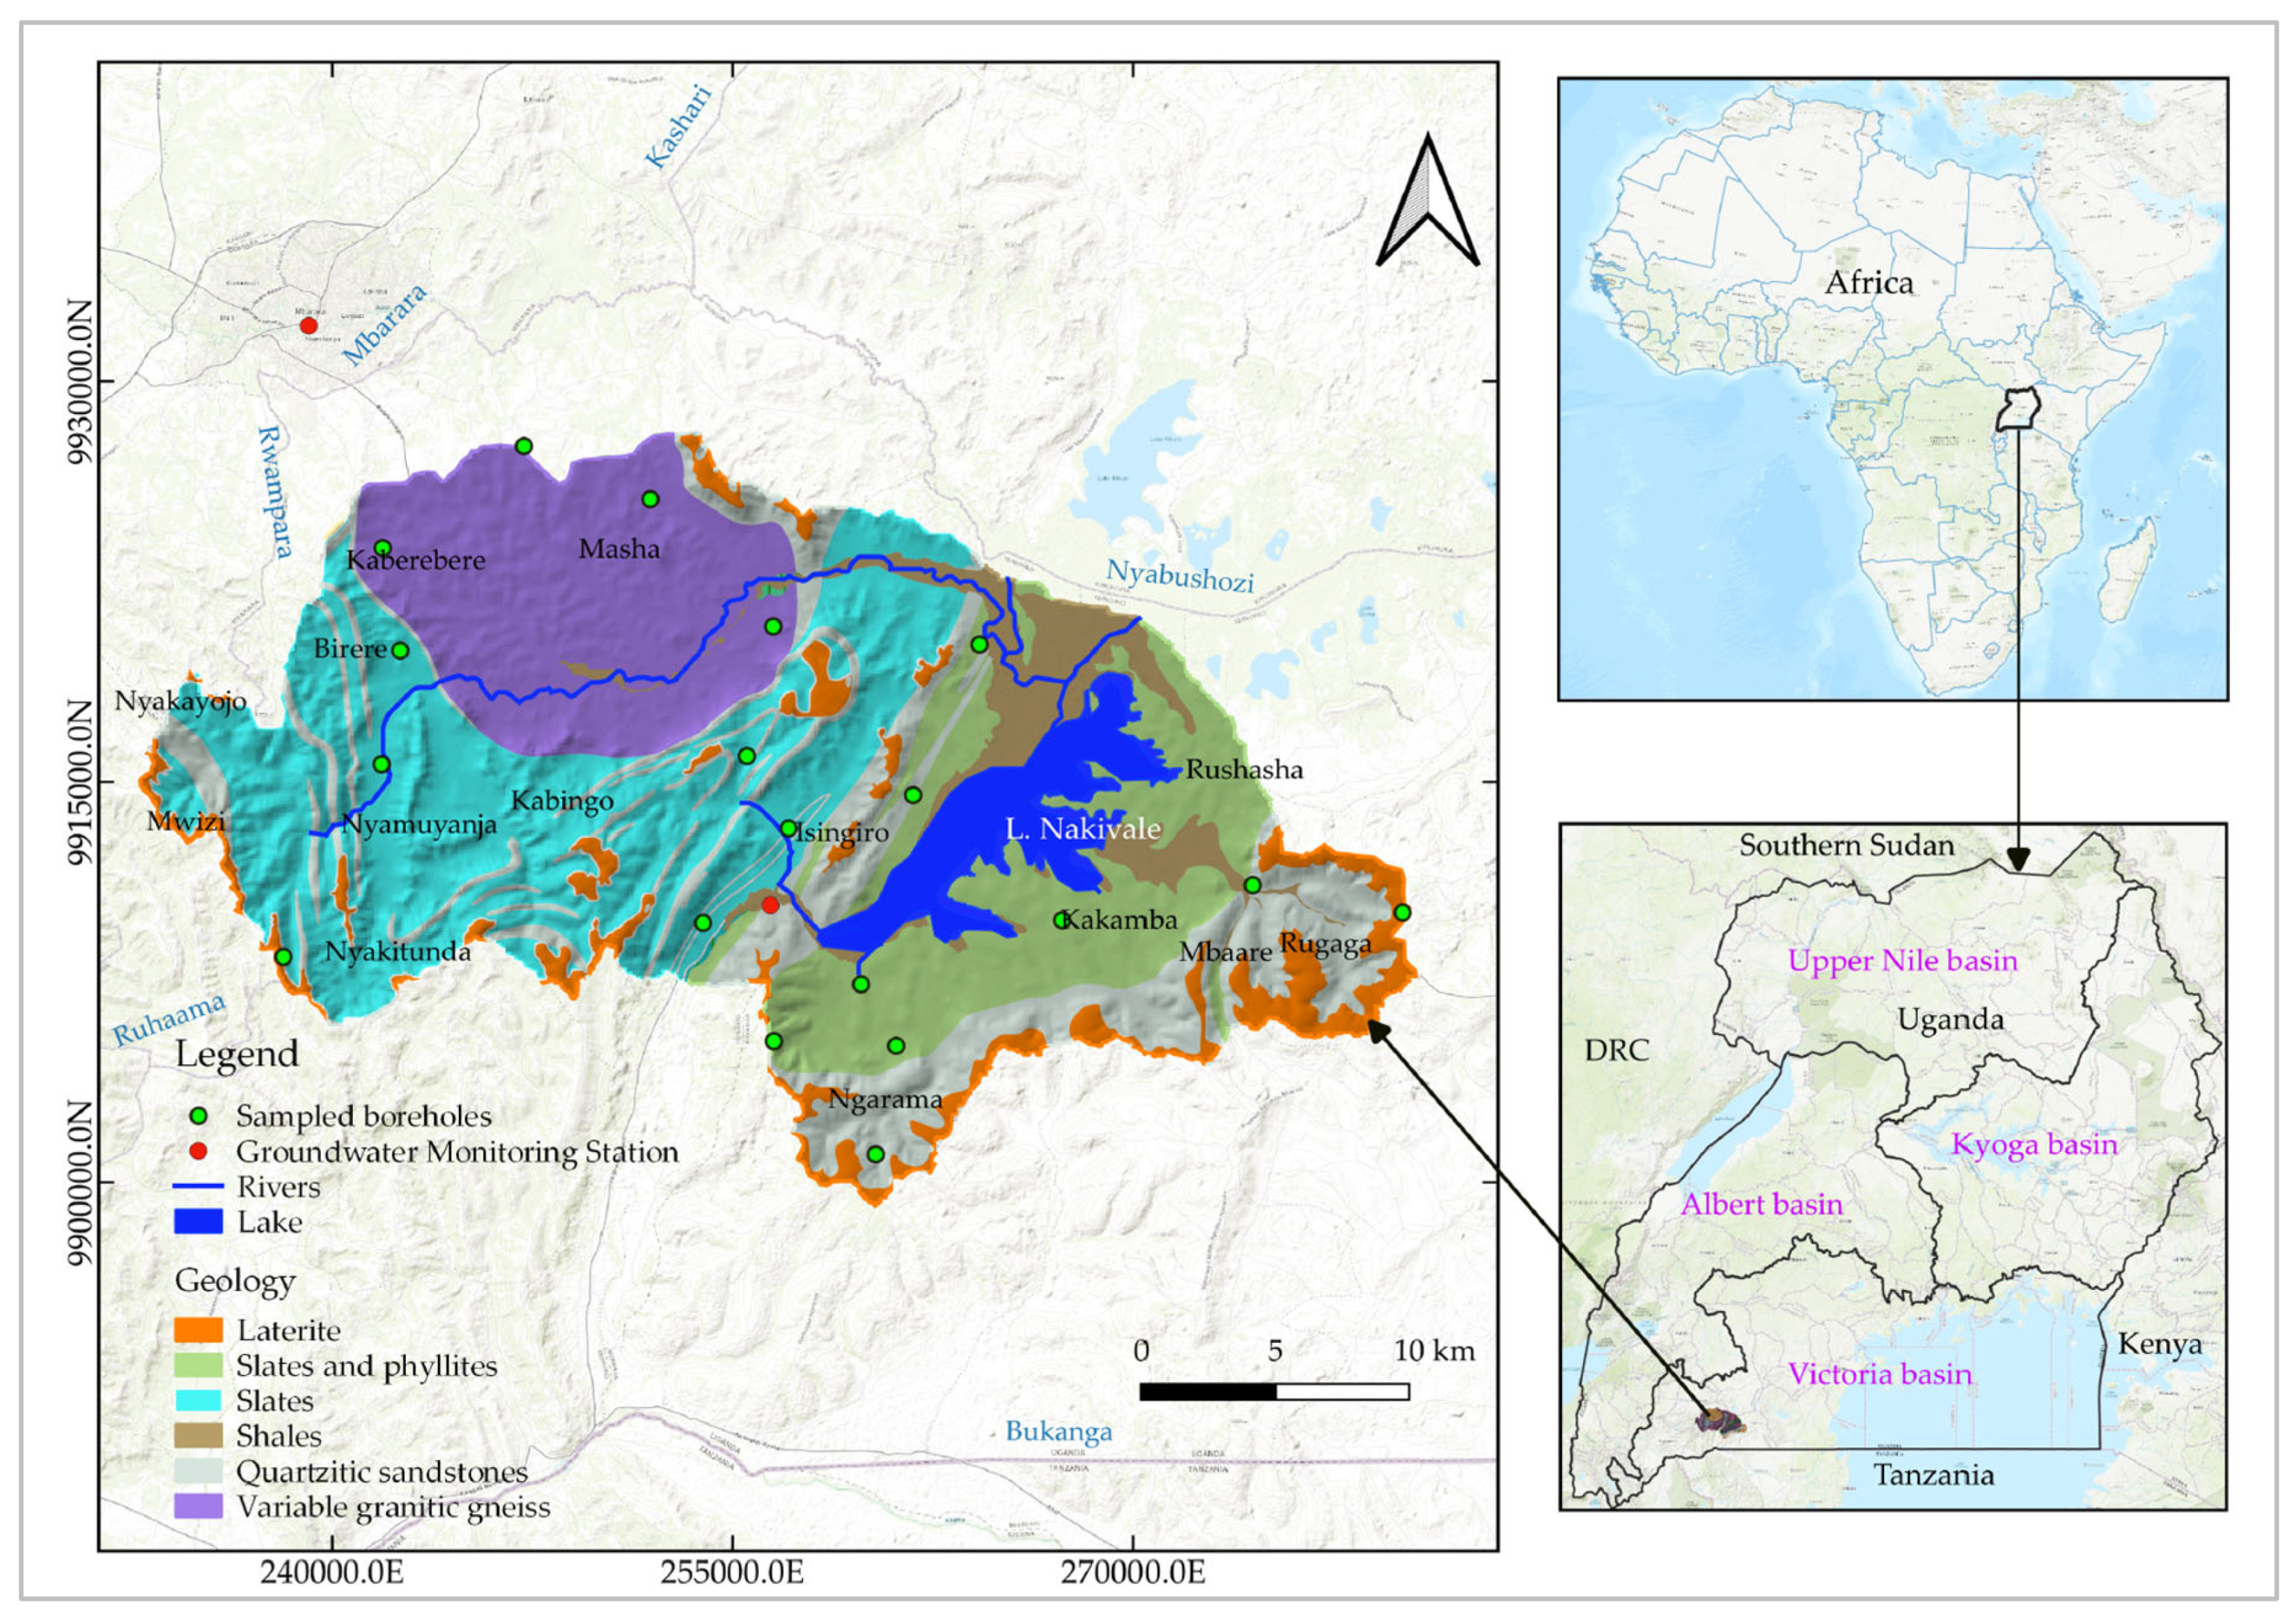
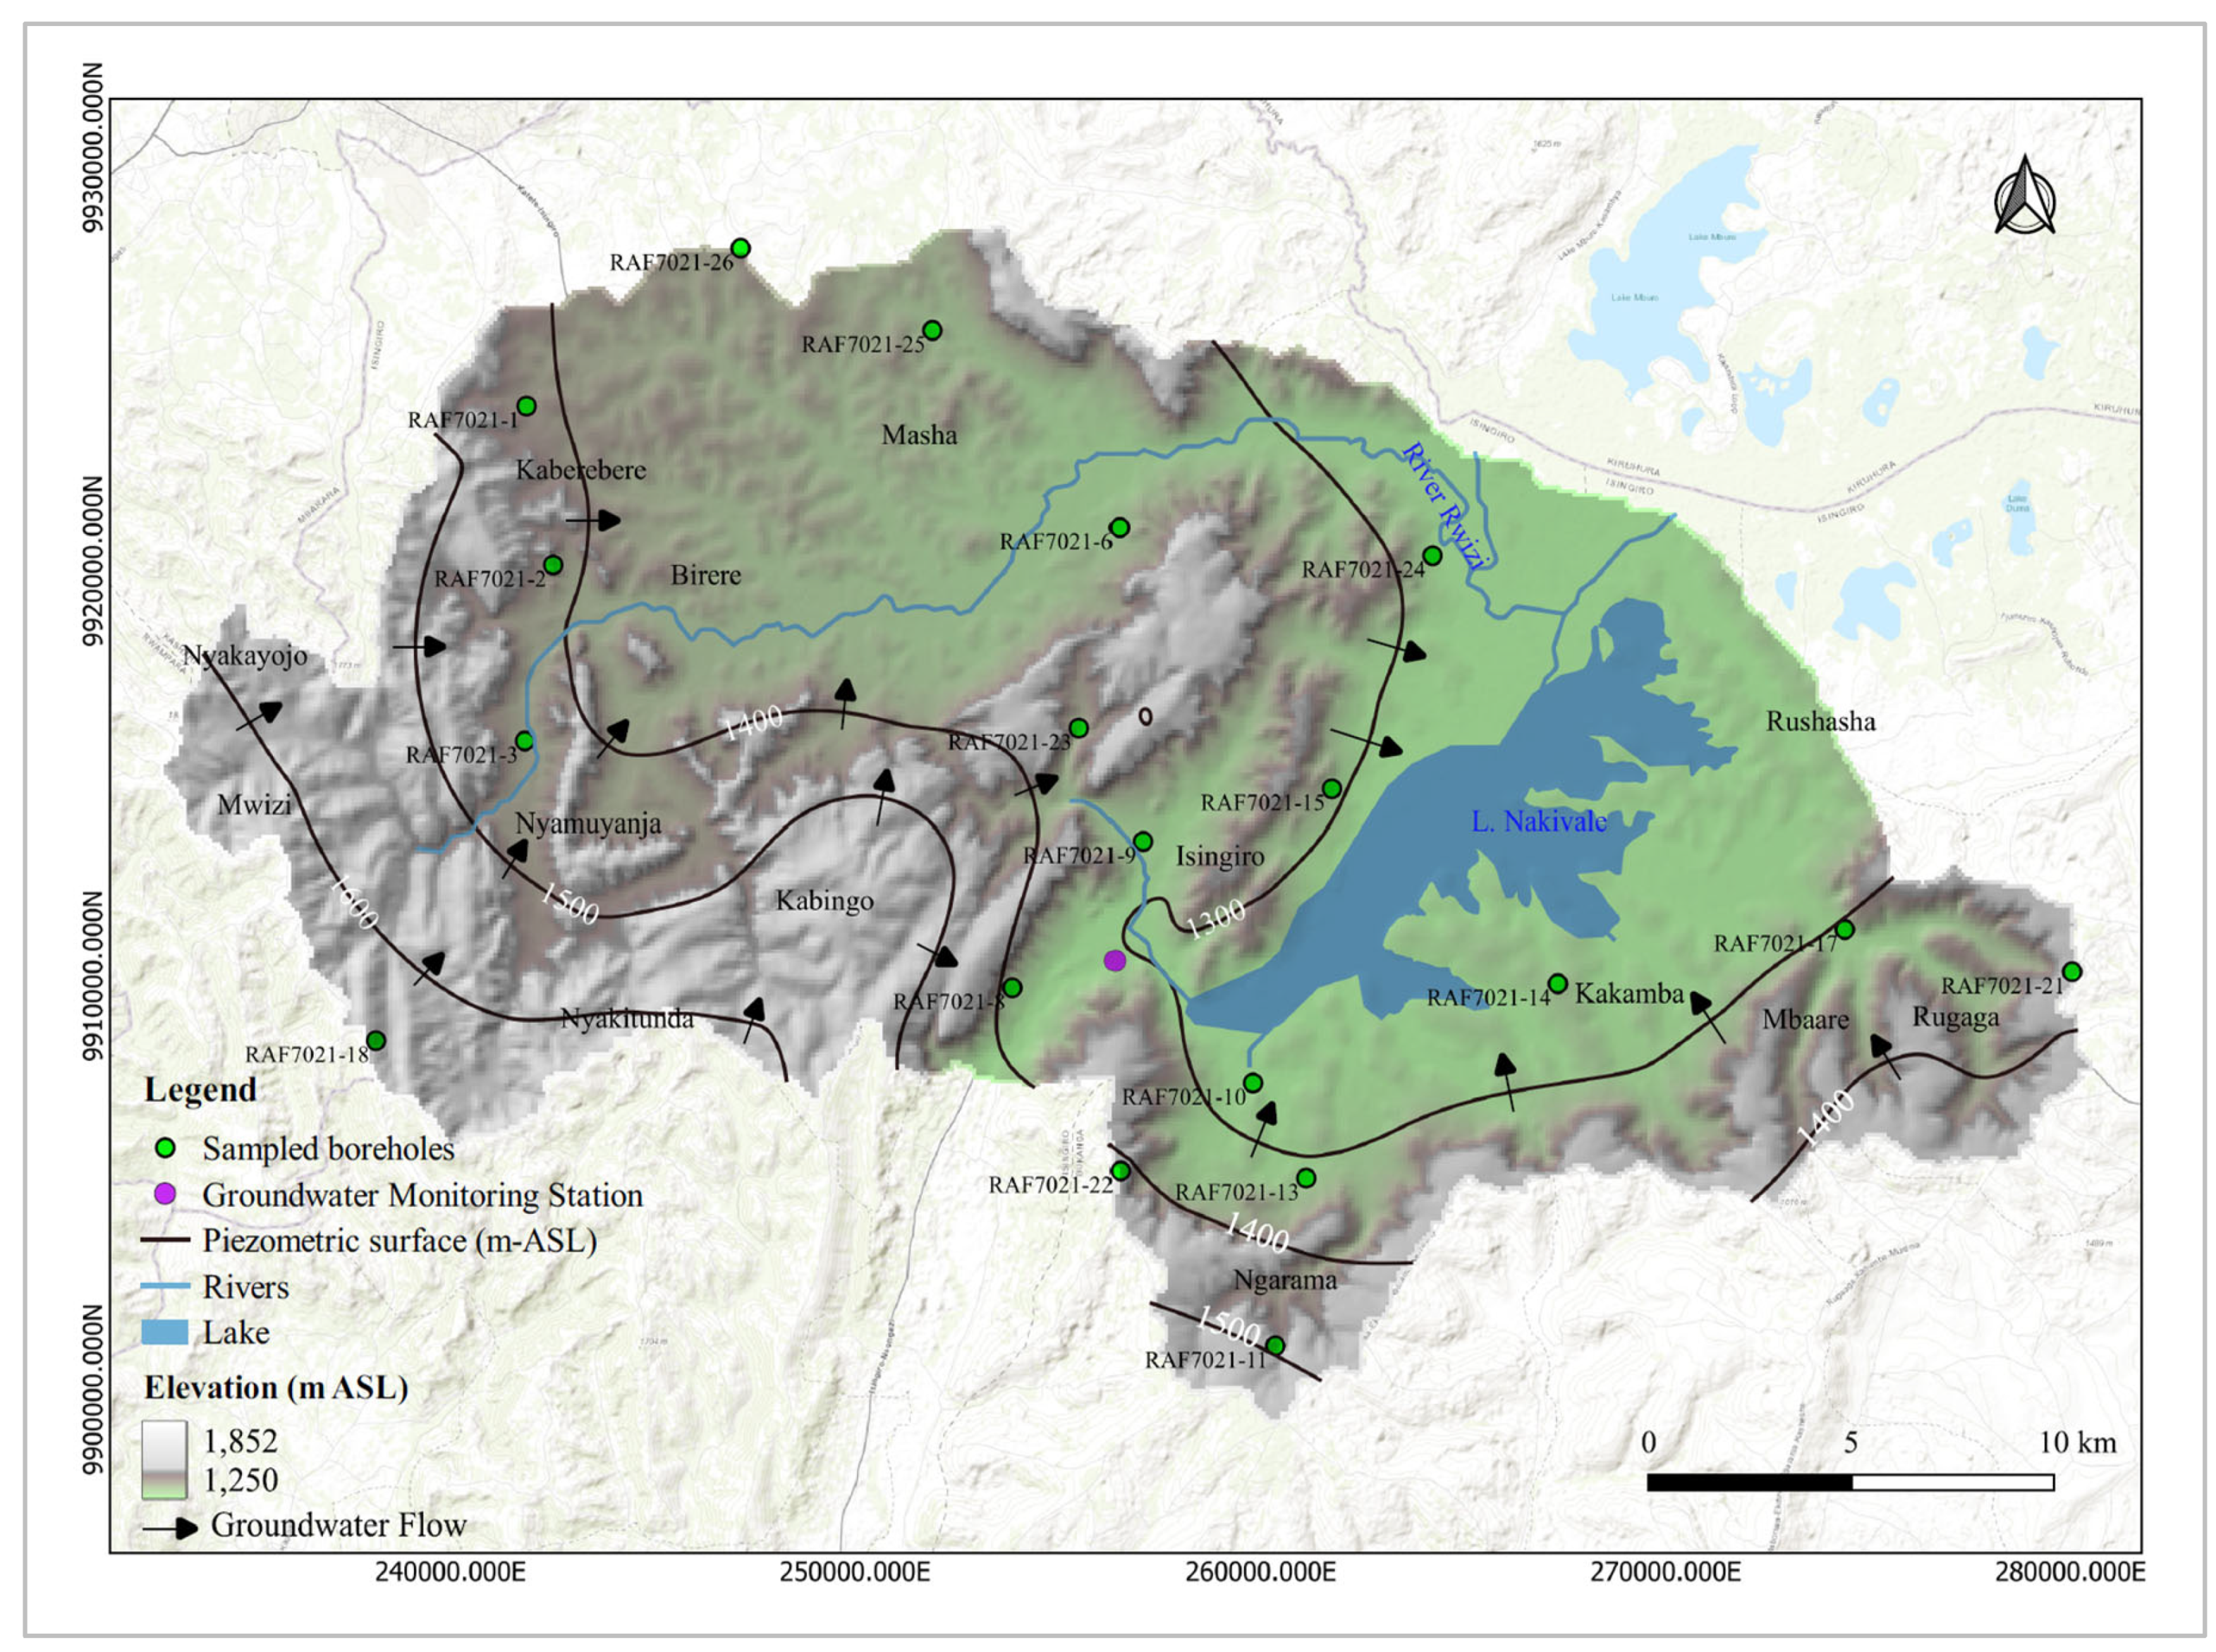
Nakivale Sub-catchment is located in Isingiro district, southwestern Uganda (
Figure 1). It serves as a tributary to the Rwizi Catchment which is also a tributary to the greater Victoria basin. The area spans over a total area of 760 square kilometers and is positioned within the country's water stressed area (locally referred to as a cattle corridor), where riparian communities travel long distances during drought spells in search for water from nearby deep boreholes and limited surface water bodies [16].
The study area predominantly consists of lowland surface remnants, occupying more than 60 percent of the sub-catchment. Infill areas are located in the western and eastern parts of the sub-catchment and are characterized by poorly sorted outwash fans. High-relief areas are positioned along the extreme margins of the catchment and are covered by upland surface remnants susceptible to erosion (
Figure 1). The project area has a population estimate of over 616,700 people with most of the riparian communities staying within urban and peri urban centers [17]. It houses the fourth largest refugee camp in Uganda after Yumbe, Adjumani, and Arua districts. The area also registers an annual refugee influx estimate of 10,000-30,000 [18], and is a grazing spot for over 0.5 million cattle [19].
2.2. Climate
Nakivale lies within the equatorial zone of low pressure where winds typically remain light and variable [20]. Its weather patterns are notably influenced by the thermal equator, also known as the Inter-Tropical Convergence Zone (ITCZ) which acts as a zone of instability separating the converging air masses of the northern and southern hemispheres [16]. Characterized as hot and humid, the climate of the study area features two distinct rainy seasons (March to May and September to November), the later occasionally extending to December [16]. Dry seasons extend from December to February, and from June to August. The wettest months typically occur in November and April, with July being the driest. Annual rainfall ranges between 966 mm to 1380 mm and is influenced significantly by factors such as topography, wetland systems and open water bodies [1]. Average monthly temperatures range from a minimum of 27°C to a maximum of 31°C. The dew-point temperature averages around 19°C while the long-term average monthly temperature consistently surpasses 30°C and occasionally peaks at 38°C [16].
2.3. Geological Setting
The study area is overlain by the Proterozoic Karagwe-Ankolean system of rocks (1400-950 Ma) which is part of the Burundian belt in the eastern Democratic Republic of Congo [16]. This rock system rests unconformably on the Buganda-Toro rock system in Uganda which also overlies the Basement Complex rocks [21]. The Karagwe-Ankolean rock system consists of sedimentary to meta-sedimentary rocks that have been exposed to various grades of metamorphism, ranging from low to high [22].
The sedimentary facies within the Karagwe-Ankolean rock system comprise sandstones, shales, and conglomeratic lenses, while the metamorphic rocks include granite gneisses, phyllites, and schists. Sedimentary facies are common in elevated areas while the metamorphosed facies are present in lowlands, providing evidence of regional metamorphism and contact metamorphism near former areas of granitic intrusion [23]. These older rocks were intruded by younger variable granitic rocks that initially formed topographical highs but are now represented as low lying areas due to the susceptibility of granites to weathering. The current topography can be attributed to differential weathering between the older host rocks and the younger granitic rocks [24].
The dominant minerals in this area are silicate minerals, ranging from felsic silicates (quartz, muscovite and orthoclase) to mafic silicate minerals (plagioclase feldspars and minerals of the Bowen discontinuous series). This is due to varying episodes of variable granitic intrusions (G1-G4) that the region experienced [25]. Muscovite schists and phyllites intercalated with quartzites are also common within the lower Karagwe-Ankolean rock system where the project area lies. Occasional calc-silicate are also common in the study area [24]. According to [21], the Karagwe-Ankolean rock system is also characterized by sulfide rich minerals such as chalcopyrite, pyrite, galena, and sphalerite evident in Kitaka (Mbarara district) and Gayaza (Isingiro district).
2.4. Hydrogeology
The hydrogeology of the Nakivale sub-catchment is primarily shaped by the region's underlying geology. The area is predominantly composed of argillaceous, impermeable rock types such as shales, slates, phyllites, and granite gneisses (
Figure 1). These low-permeability lithologies result in high surface runoff, limiting groundwater recharge. Groundwater infiltration occurs mainly through fractured networks and bedding planes, where structural weaknesses allow for some permeability [26].
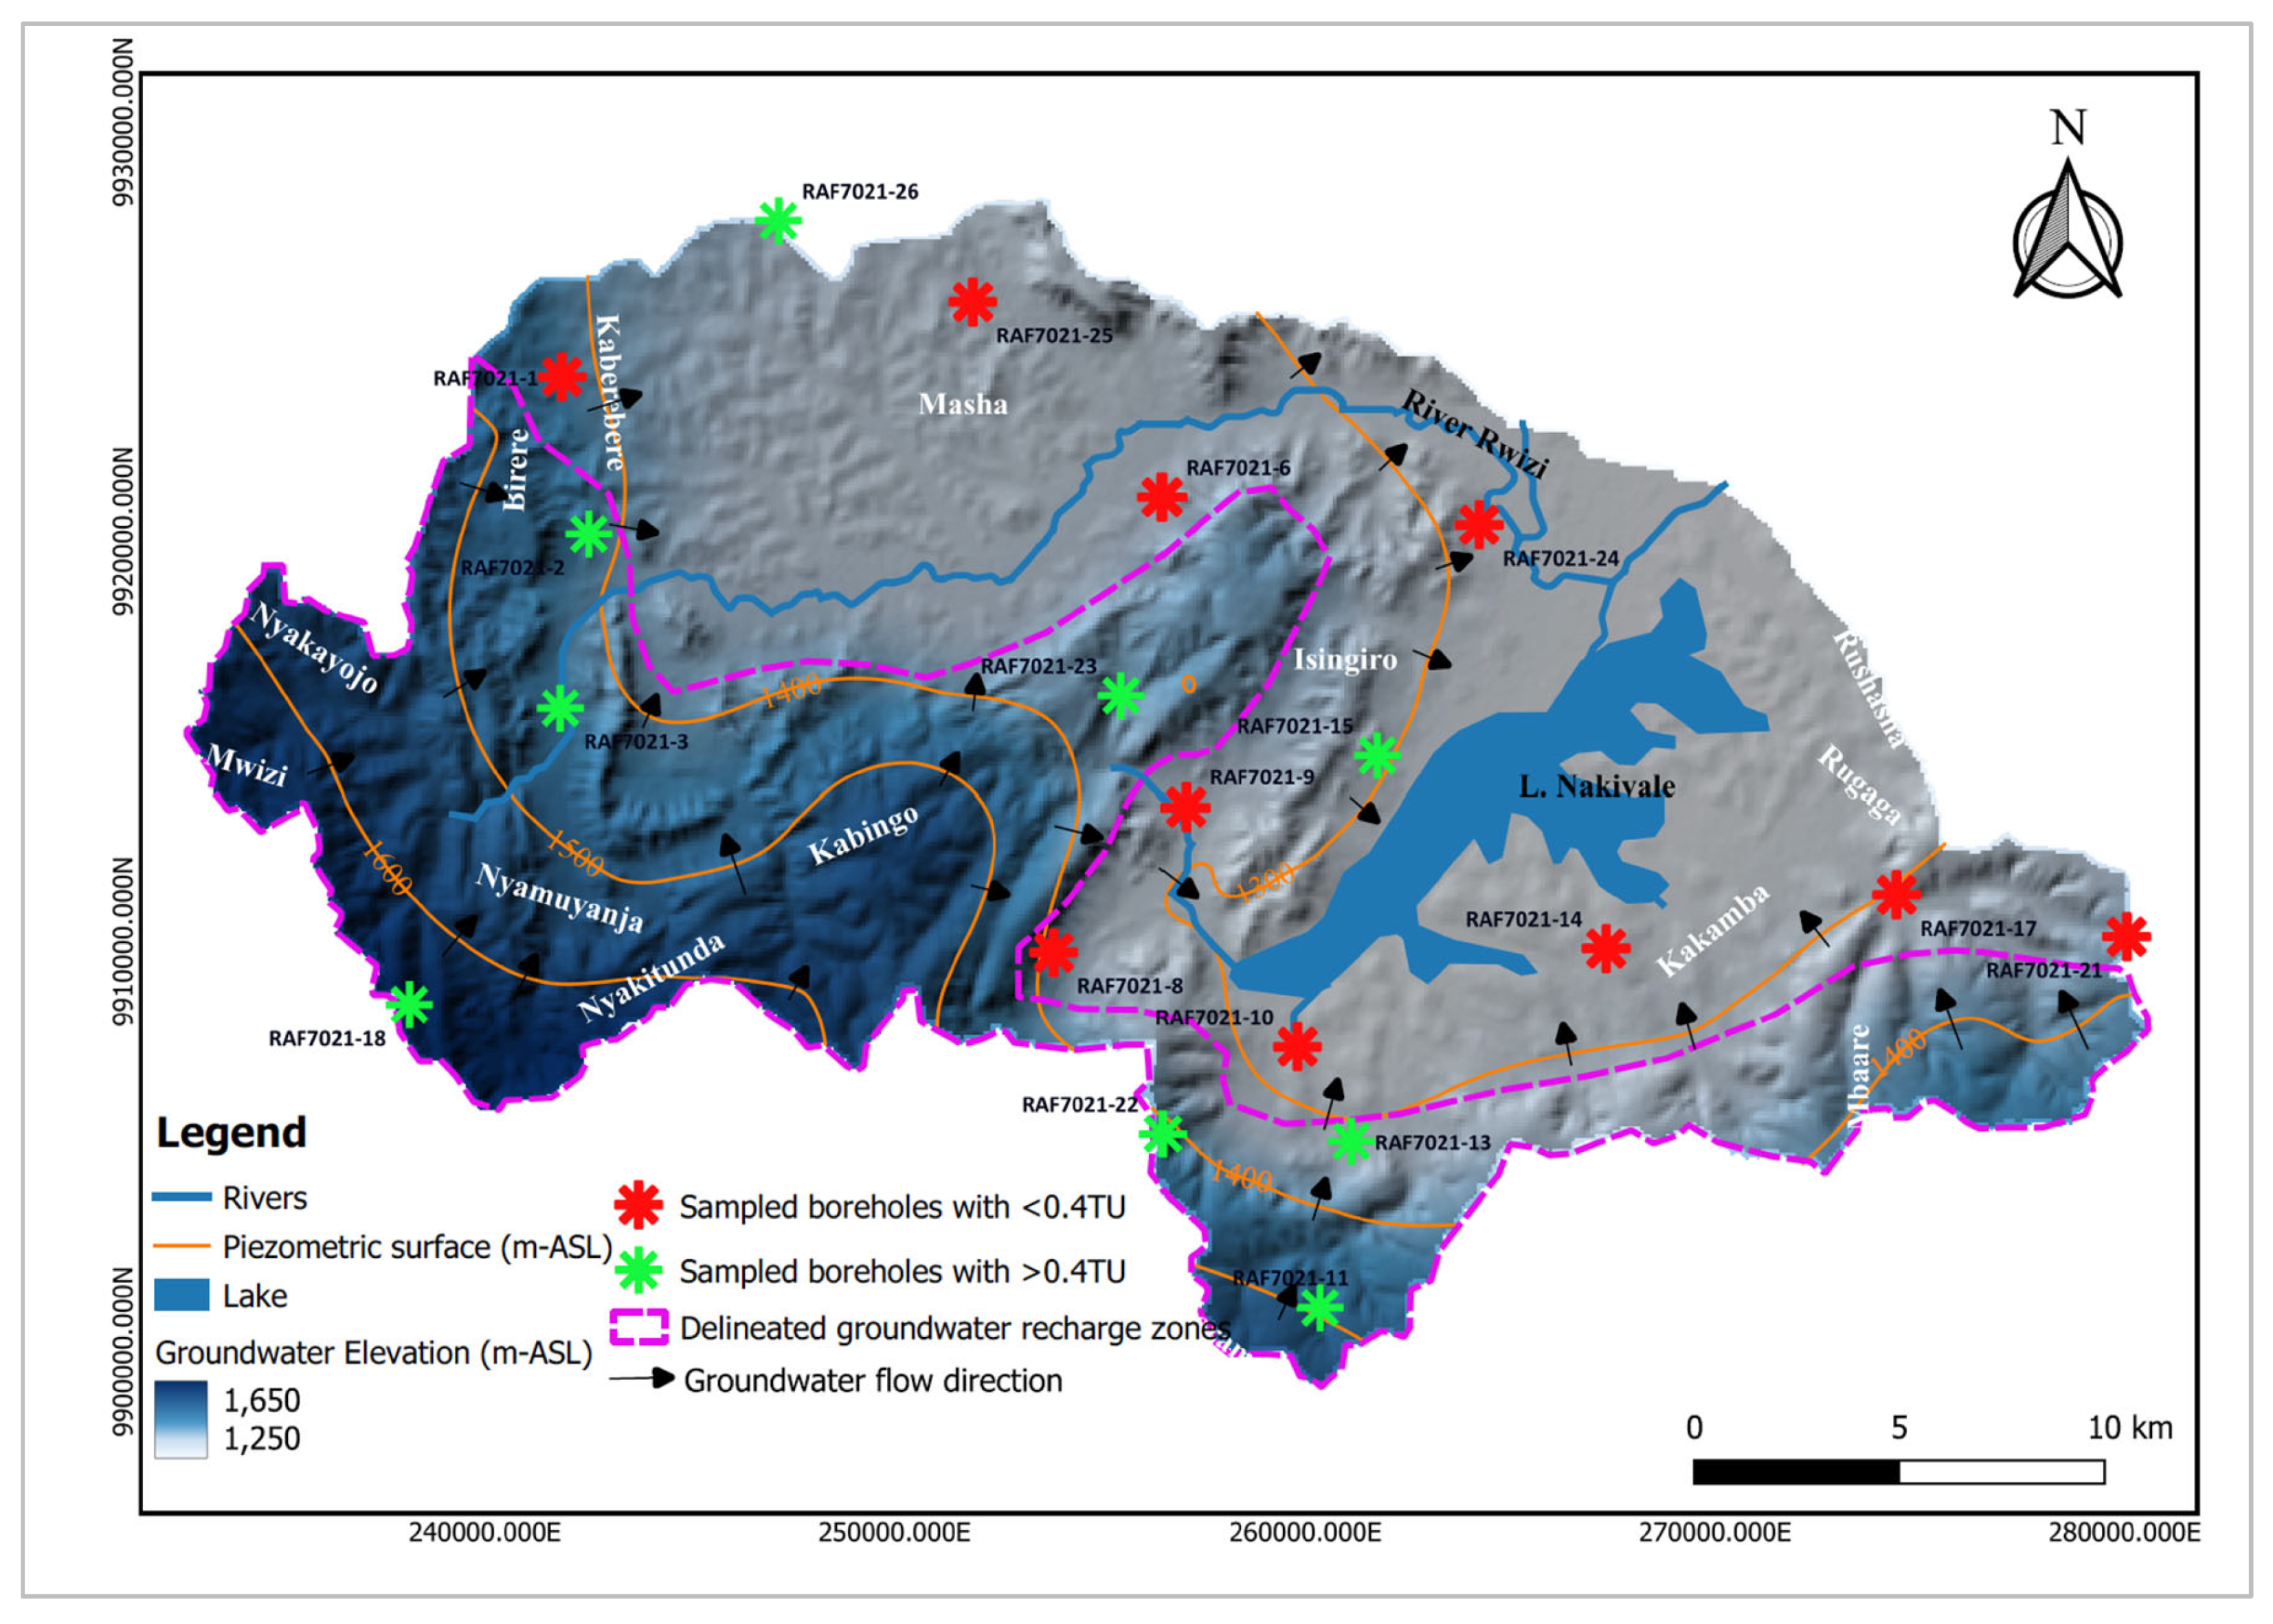
Groundwater flow in the study area is largely controlled by the hydraulic head gradient which closely follows the natural topography. The flow pattern is predominantly local, with groundwater moving through shallow aquifers over short distances. In certain areas, particularly in the western and eastern parts of the sub-catchment (
Figure 2), intermediate groundwater flow systems exist, indicating slightly longer flow paths.
Previous studies by [27–29], identified three main aquifer types in the region: weathered/fractured aquifers, fluvial aquifers, and paleochannels. The weathered and fractured aquifer system typically occurs at depths greater than 60 meters [28], though this can vary. Permeability is highest near the fracture-saprolite interface and is determined by the number, distribution, and connectivity of fractures [27,28].
Fluvial aquifers consist of consolidated and unconsolidated sediments and are generally shallow [16]. Their hydraulic properties depend on sediment sorting, size, and packing, with well-sorted sediments exhibiting higher permeability [30]. These aquifers can be unconfined or semi-confined, with fine riverbed material often creating confined conditions [27].
According to [28], paleochannel aquifers formed by historic river reversals, also serve as significant aquifers in the region. These ancient river channels are filled with thick sediment deposits, including gravels and sands, and provide high groundwater yields, often exceeding 50 cubic meters per hour [31]. In areas like Rukungiri in southwestern Uganda, paleochannels are known for their high aquifer productivity due to the thick alluvial deposits [32,33].
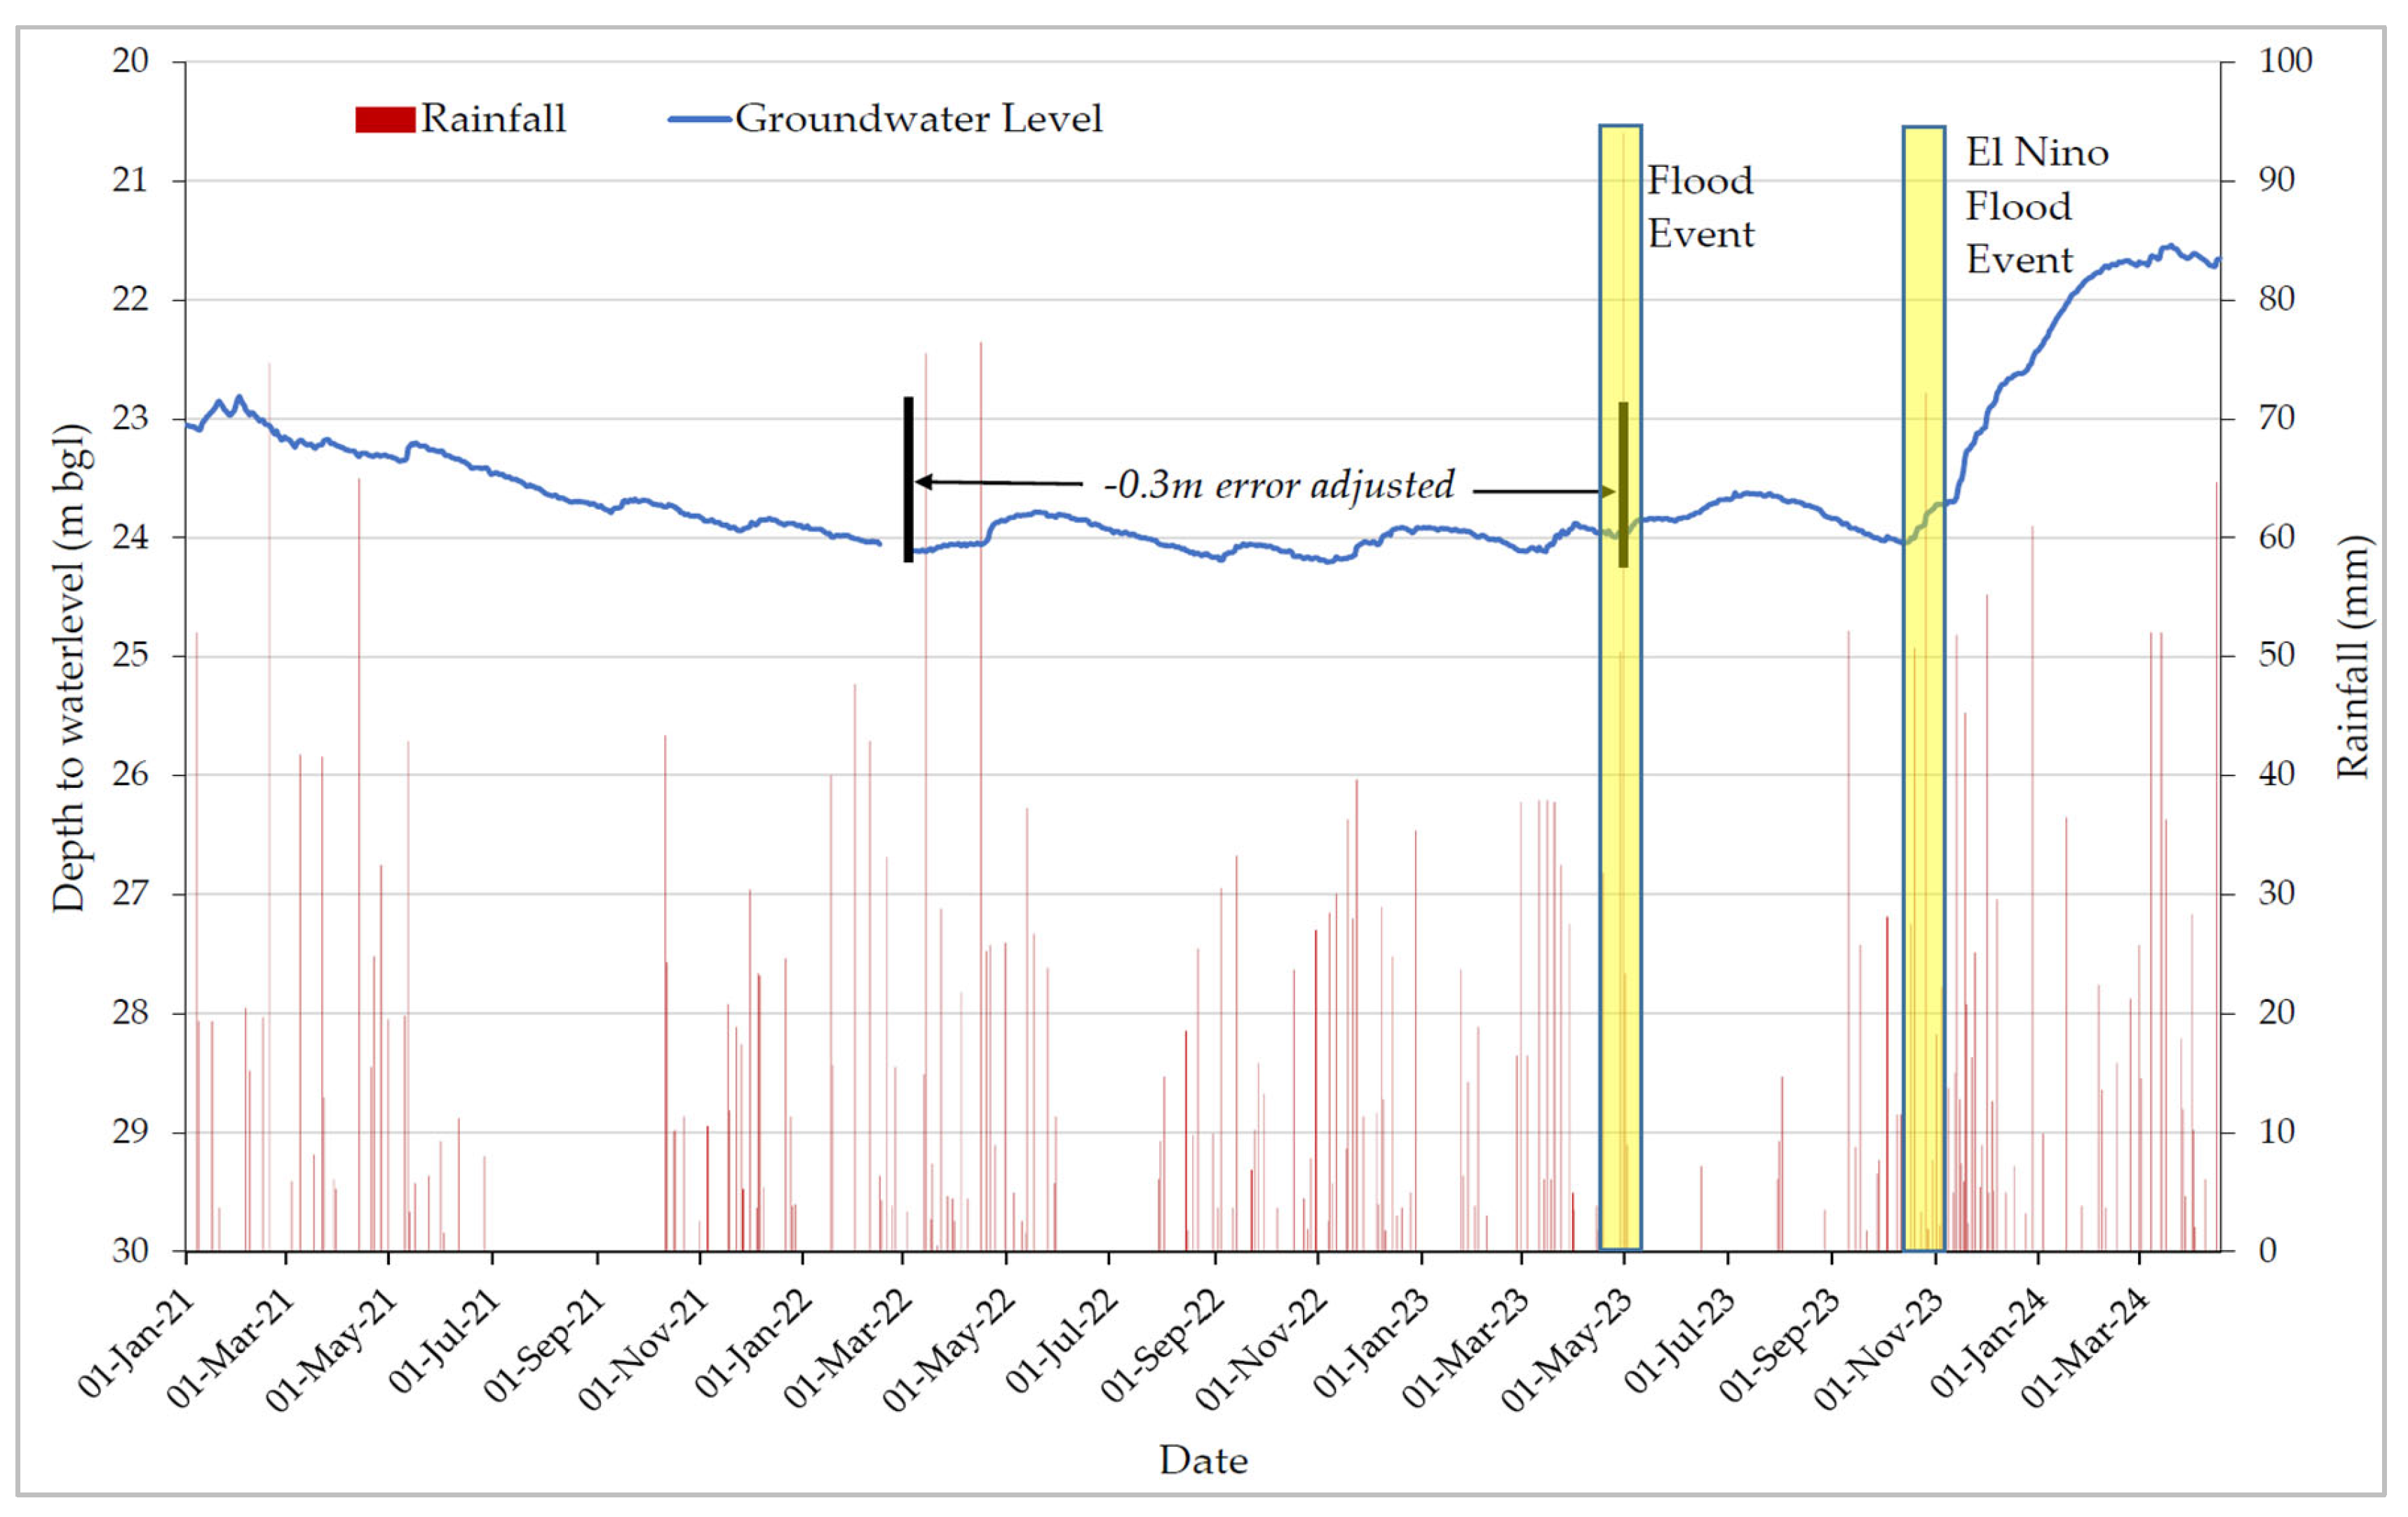
Over the past three years, groundwater levels at the Isingiro groundwater monitoring station in the study area have notably fluctuated (
Figure 3). From January 2021 to mid-2023, these levels exhibited a declining trend, indicating over-extraction or inadequate recharge during that time. Groundwater levels at this station respond to rainfall with a time lag of 1-2 months, reflecting low recharge rates in the area (
Figure 3). The recent increase in groundwater recharge can be partly attributed to catchment restoration activities in the Rwizi catchment since 2021, as well as two significant flooding events: one in May 2023 and the El Nino flood event in November 2023 [32,33]. Additionally, potential changes in confining pressure related to land use and aquifer recharge processes can play a role in controlling piezometric surfaces [34]. Therefore, it is evident that effective groundwater management is essential for the sustainable use of groundwater resources in the study area.
2.5. Sample Collection and Analysis
Sampling points were strategically selected to account for hydrogeological variations in the study area. Groundwater samples were collected from 19 boreholes in the study area (
Figure 1). Sampling occurred from 15/02/2024 to 20/02/2024 during the dry season. Field measurements of pH, redox potential (Eh), dissolved oxygen (mg/L), temperature (
oC), and electrical conductivity (µS/cm) were taken in situ using a calibrated HANNATM multi-parameter meter (HI 9829_S/N 07100011101). Total alkalinity was analysed in situ by acid-base titration using 0.02M hydrochloric acid. Water samples for cations and anions were collected in 500 mL HDPE bottles and tightly capped to prevent any leakage. Samples intended for cation analysis underwent filtration using GF/C filter papers and were then acidified with concentrated nitric acid of analytical grade to achieve a pH of less than 2. For tritium and stable isotope analysis (Deuterium and oxygen-18), water samples were respectively collected in 500 mL HDPE bottles and 50 mL HDPE bottles.
The major ions: Na⁺, K+, Ca2+, Mg2+, Cl-, NO3-, and SO42-, were analysed in mg/L using the ion chromatography method. Al, Fe, Si, and B were analysed in their elemental forms using the Inductively Coupled Plasma Mass Spectrometry (ICP-MS) method. This method allows for highly sensitive and precise measurement of elements at very low concentrations [35]. The stable isotopes, 2H and 18O in each water sample were estimated using laser absorption spectroscopy. The results possess an accuracy of ±0.2‰ for 18O and ±1.6‰ for 2H. Tritium concentration was determined with an accuracy of ±0.2TU using liquid scintillation counting (LSC), a method known for its high sensitivity and accuracy [36].
2.6. Hydrochemical Data Analysis
2.6.1. Groundwater Facies Analysis
This analysis involved graphical representation of the cationic (Ca2+, Mg2+, Na+ + K+) and anionic (HCO3-, SO42-, Cl-) chemical species on a Piper diagram using Origin Pro Version 2022, a statistical software. The respective concentrations (meq/L) were normalized to 100% and then plotted as points on a Piper diagram. The position of each plot on a piper diagram serves as an estimate for the groundwater type inherent to the sampled well [37].
2.6.2. Groundwater Hydrochemical Evolution Assessment
- i)
The Gibbs plot
The Gibbs plot involved plotting total dissolved solids (TDS) against the quotient factor of major cations for the cationic Gibbs plot (1Equation 1) and TDS against the quotient factor of major anions for the anionic Gibbs plot (2Equation 2). According to [38], this model offers insights into three key mechanisms that influence groundwater chemistry: atmospheric precipitation dominance, rock weathering dominance and evaporation-crystallization dominance.
- ii)
Multivariate analysis
This utilized both the R-mode and Q-mode Hierarchical Cluster Analysis (HCA), along with Factor Analysis approach, using Origin Pro version 2022. R-mode and Q-mode HCA group variables and samples respectively, to identify relationships and possible common sources or processes affecting these parameters [39]. These clusters can reveal spatial or temporal patterns in groundwater quality and can be instrumental in identifying distinct facies or regions influenced by similar geochemical processes [13]. Factor Analysis was used to complement HCA by reducing the dimensionality of hydrochemical data and identifying the most significant factors influencing groundwater chemistry [40].
2.6.3. Geochemical Modelling
This approach utilized the Geochemist’s Workbench Community Edition 17.0 software to calculate the saturation indices (SI) of different mineral species as well as the partial pressure of carbon dioxide for each groundwater sample. The saturation index was estimated as the logarithm of the ratio of the ion activation product (IAP) to the solubility product (K
sp) of dissolving species.
The calcite saturation index and partial pressure of carbon dioxide provide insights into the potential sources of bicarbonates within groundwater [41,42]. They also shed light on the incongruent weathering of silicates or other forms of chemical weathering [42].
2.6.4. Spatial Analysis Using GIS Tools
Spatial analysis utilized Quantum Geographical Information System (QGIS) Version 3.36.3. The spatial analytical tools employed in this study include, but are not limited to, interpolation and raster analysis tools. The interpolation tool used in this thesis was the ordinary kriging interpolation tool which is ideal for datasets with unknown trends such as hydrochemical datasets [43]. This tool assumes a constant mean and variance across the interpolated field [44]. It is particularly suitable for hydrochemical assessments [43–45].
2.7. Isotope Analysis
2.7.1. Stable Isotope Analysis
This involved characterizing the isotopic signature of rainfall in the area through establishment of a local Deuterium excess (D-parameter) line for Nakivale sub-catchment. This approach has been widely adopted for tracing the origin of groundwater [9,15,46]. Deuterium excess values in precipitation were calculated to identify the moisture source for rainfall received within the study area (Equation 4).
where δ
2H and δ
18O are deuterium and oxygen-18 values in local precipitation respectively.
The obtained D-excess values were used to generate the D-parameter line for Nakivale sub-catchment using Equation (5).
The D-parameter line was then plotted alongside the Global Meteoric Waterline (GMWL) on the δ
2H vs δ
18O graph. The GMWL is represented by Equation (6) [47]. The shift of the D-parameter line from the GMWL provided insights into the moisture sources for precipitation received within the study area [48].
2.7.2. Tritium Isotope Analysis
According to [49], interpreting tritium values involves comparing tritium concentrations with known atmospheric input levels from local precipitation. This comparison helps reconstruct groundwater recharge histories and assess the sustainability of aquifer resources in the study area [50]. However, it is important to note that there are no historical tritium measurements for precipitation received within the project area and nearby isotope stations. Therefore, this study adopted a proxy approximation: tritium unit values less than 0.4 to indicate groundwater likely to be older than 20 years and tritium unit values greater than 0.4 to indicate recent groundwater water recharged less than 20 years ago.
2.8. Groundwater Recharge Assessment
The assessment of groundwater recharge employed a multifaceted approach, integrating hydrogeochemical evolution analysis with the examination of the local groundwater flow network through geospatial analysis of hydraulic head gradients. The hydrogeochemical analysis focused on evaluating the groundwater's chemical properties as they evolve along its flow path, providing insights into the transformation of these properties along hypothetical recharge-discharge lines. Additionally, analyzing the piezometric surface in relation to the area's geomorphology and structural geology offered a deeper understanding of active groundwater recharge zones.
3. Results and Discussion
3.1. Chemical Analysis
The chemical parameters show a range of variability across the samples. pH values range from 4.5 to 9.3 with a mean of 6.7 and a low standard deviation (SD) of 1.0, indicating consistency. Bicarbonate (HCO3-) has a wide range (10.0-439.3 mg/L) and a high SD (134.0), reflecting significant variability. Chloride (Cl-) and nitrate (NO3-) show moderate variability, while sulphate (SO42-), calcium (Ca2+), and alkalinity exhibit considerable fluctuation. Sodium (Na+), potassium (K+), and magnesium (Mg2+) have moderate variability. Total iron (Fe) ranges from 0.02 to 5.1 mg/L with a high SD of 1.5, indicating large fluctuations, with some samples showing minimal iron and others significantly higher. Electrical conductivity (EC) also shows significant variation (297.0-1538.0 µS/cm) with a high SD of 366.3.
Table 1.
Descriptive statistics of major analysed chemical parameters.
Table 1.
Descriptive statistics of major analysed chemical parameters.
| Chemical Parameter |
Mean |
Standard Deviation (SD) |
Maximum |
Minimum |
| pH |
6.7 |
1.0 |
9.3 |
4.5 |
| HCO3- (mg/L) |
141.5 |
134.0 |
439.3 |
10.0 |
| Cl- (mg/L) |
48.6 |
25.6 |
96.1 |
16.0 |
| NO3- (mg/L) |
16.4 |
14.1 |
46.1 |
0.0 |
| SO42- (mg/L) |
204.7 |
148.9 |
515.6 |
29.9 |
| Na+ (mg/L) |
59.9 |
27.4 |
134.6 |
8.7 |
| K+ (mg/L) |
6.6 |
3.8 |
15.1 |
2.8 |
| Mg2+ (mg/L) |
23.5 |
15.6 |
51.5 |
0.0 |
| Ca2+ (mg/L) |
59.0 |
42.3 |
144.0 |
0.7 |
| Total Fe (mg/L) |
0.8 |
1.5 |
5.1 |
0.02 |
| Alkalinity (mg/L CaCO3) |
145.2 |
136.1 |
445.3 |
11.4 |
| EC (µS/cm) |
746.8 |
366.3 |
1538.0 |
297.0 |
3.2. Mechanisms Controlling Groundwater Hydrochemistry
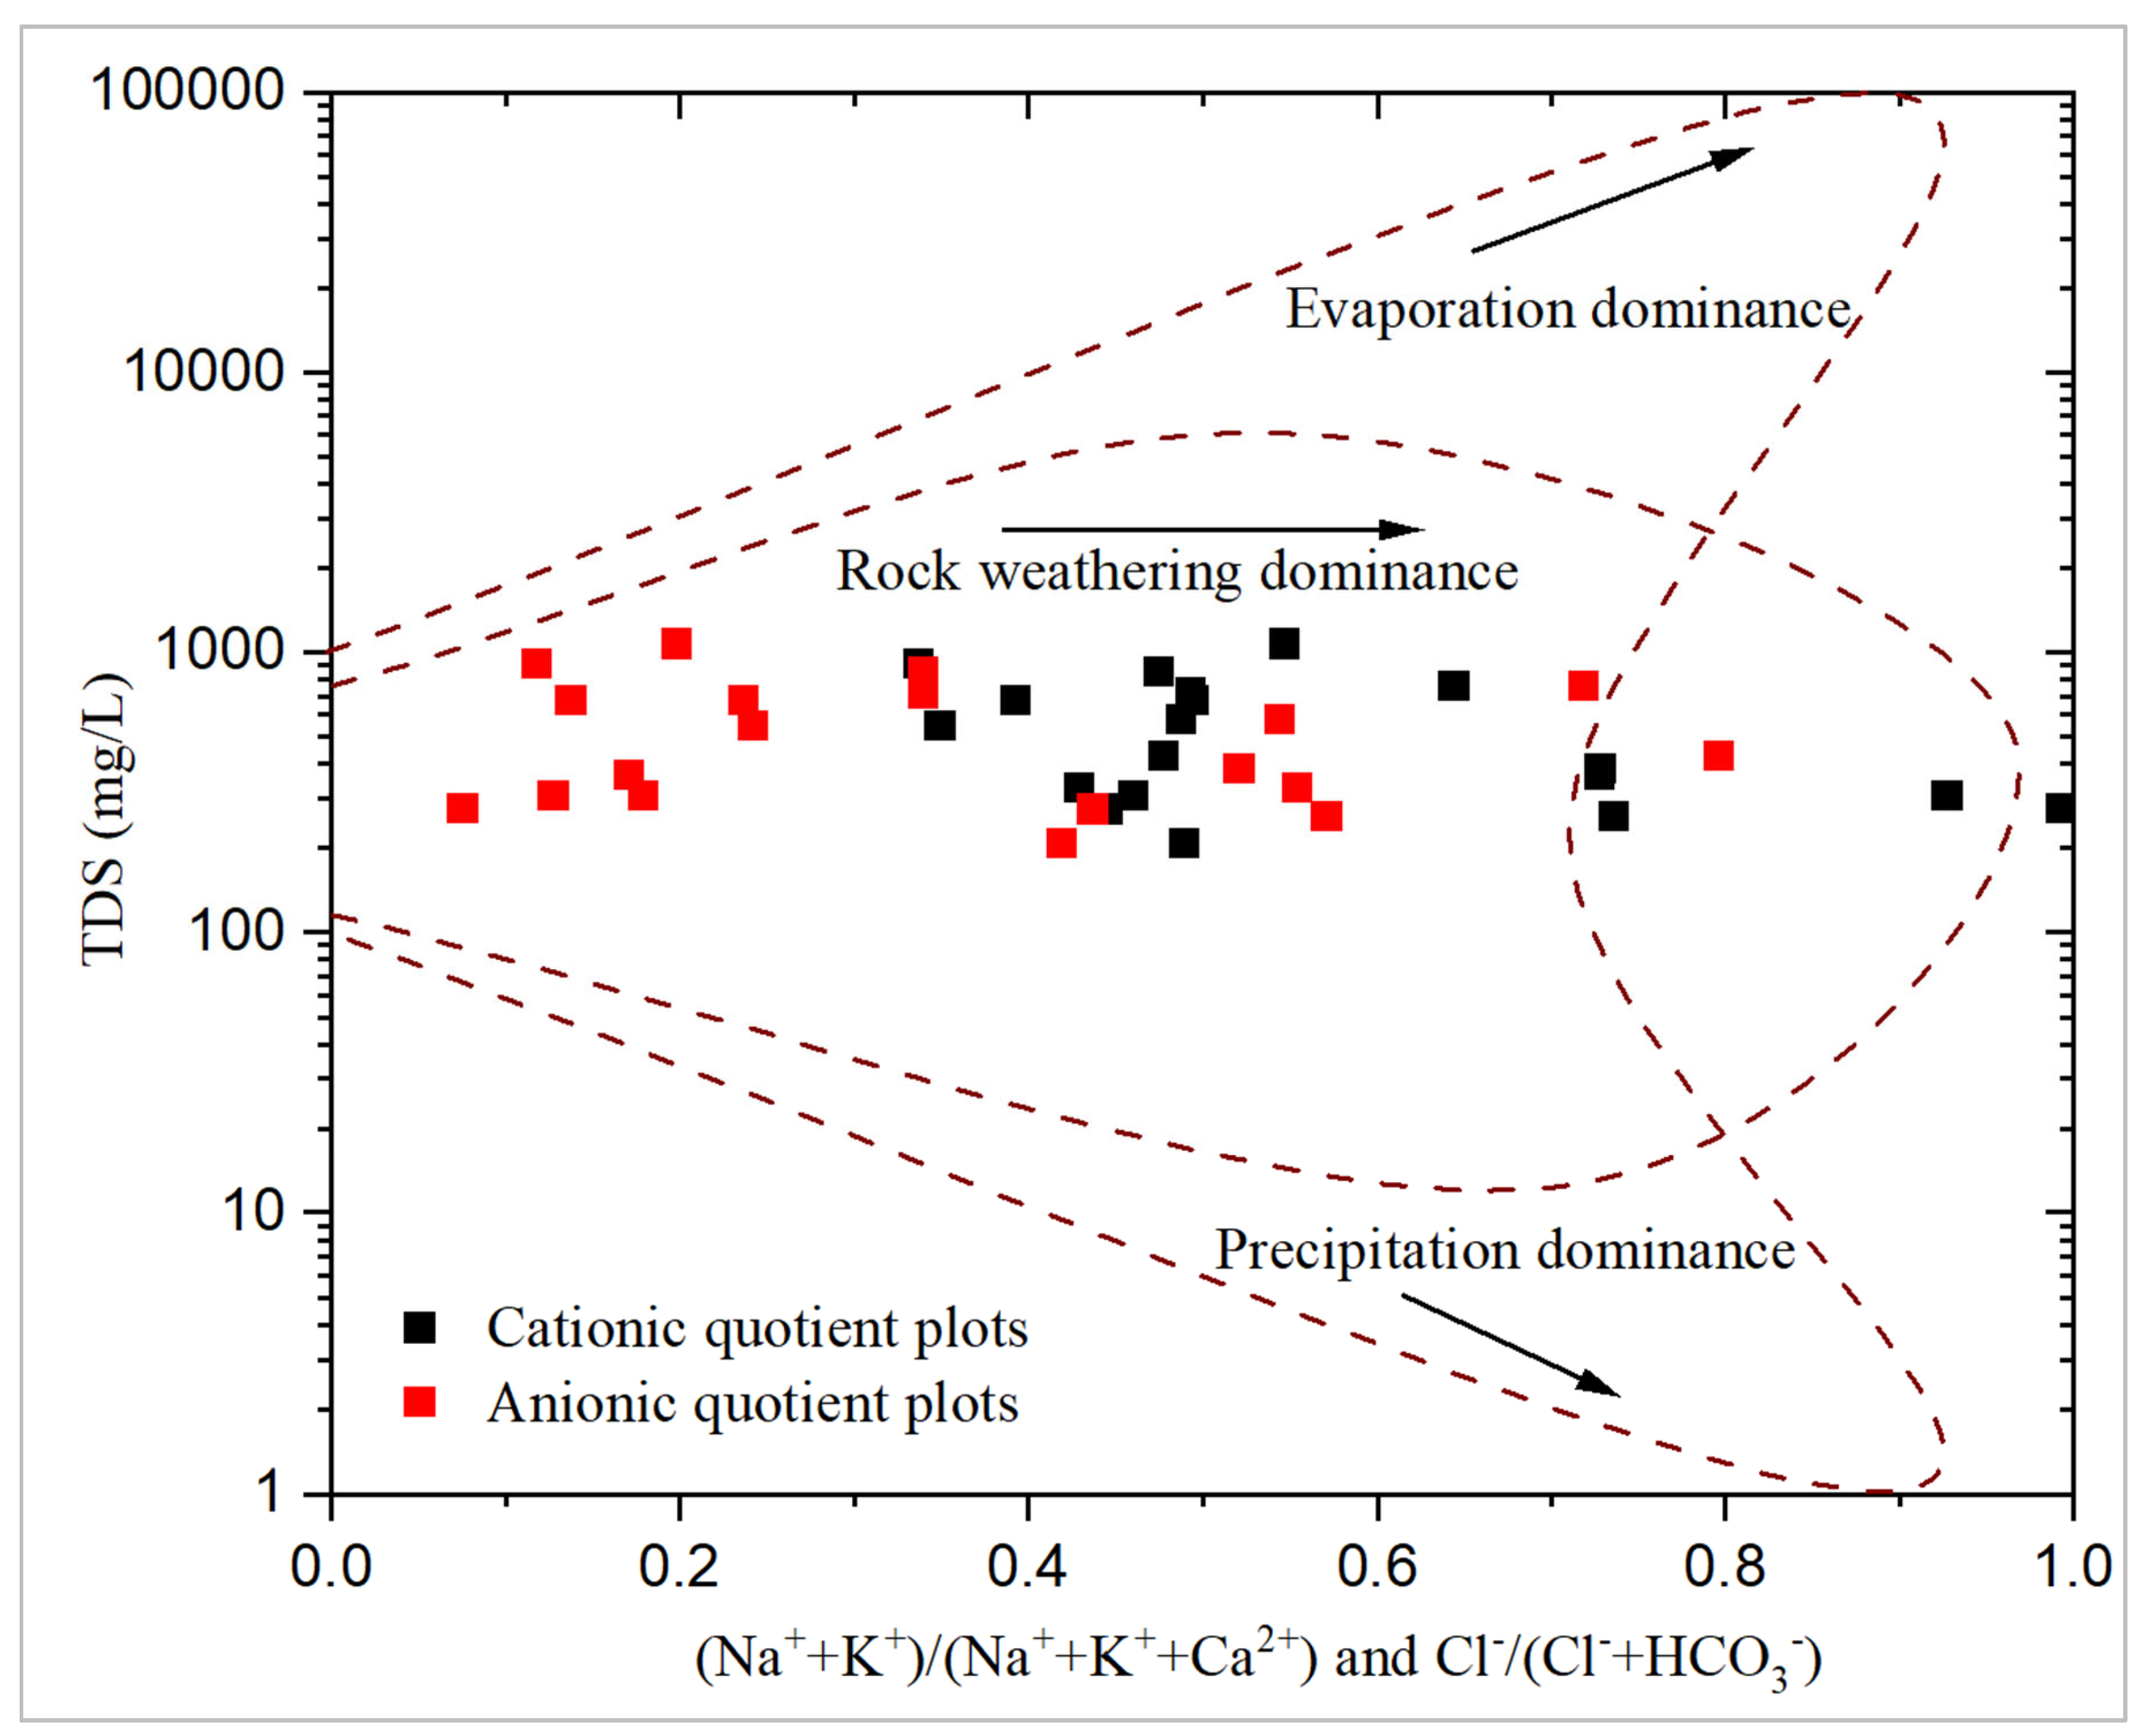
All groundwater samples fall within the rock-weathering dominance region of the Gibbs diagram. This clearly indicates that rock weathering is the predominant geochemical process shaping groundwater chemistry in the study area. These findings align with those of [12], who also attributed rock weathering processes as the primary mechanism controlling groundwater hydrochemistry in the region.
The relative position of each groundwater sample on the Gibbs diagram is primarily influenced by the Gibbs ionic ratio in relation to Total Dissolved Solids [51]. When anionic plots tend toward a ratio of 1, it suggests Cl- dominance. Similarly, when cationic plots approach a ratio of 1, it suggests Na++K+ dominance. From the Gibbs plots, it is evident that the exchanging cations are less of Na++K+ relative to Ca2+ for the ionic species and less of Cl- relative to HCO3- for the anionic species. However, these interpretations should be treated with caution, as other principal hydrochemical components of groundwater, such as SO42- and Mg2+, are not considered in the Gibbs graphical model.
Figure 4.
Cationic and Anionic Gibbs plot for analysed groundwater samples.
Figure 4.
Cationic and Anionic Gibbs plot for analysed groundwater samples.
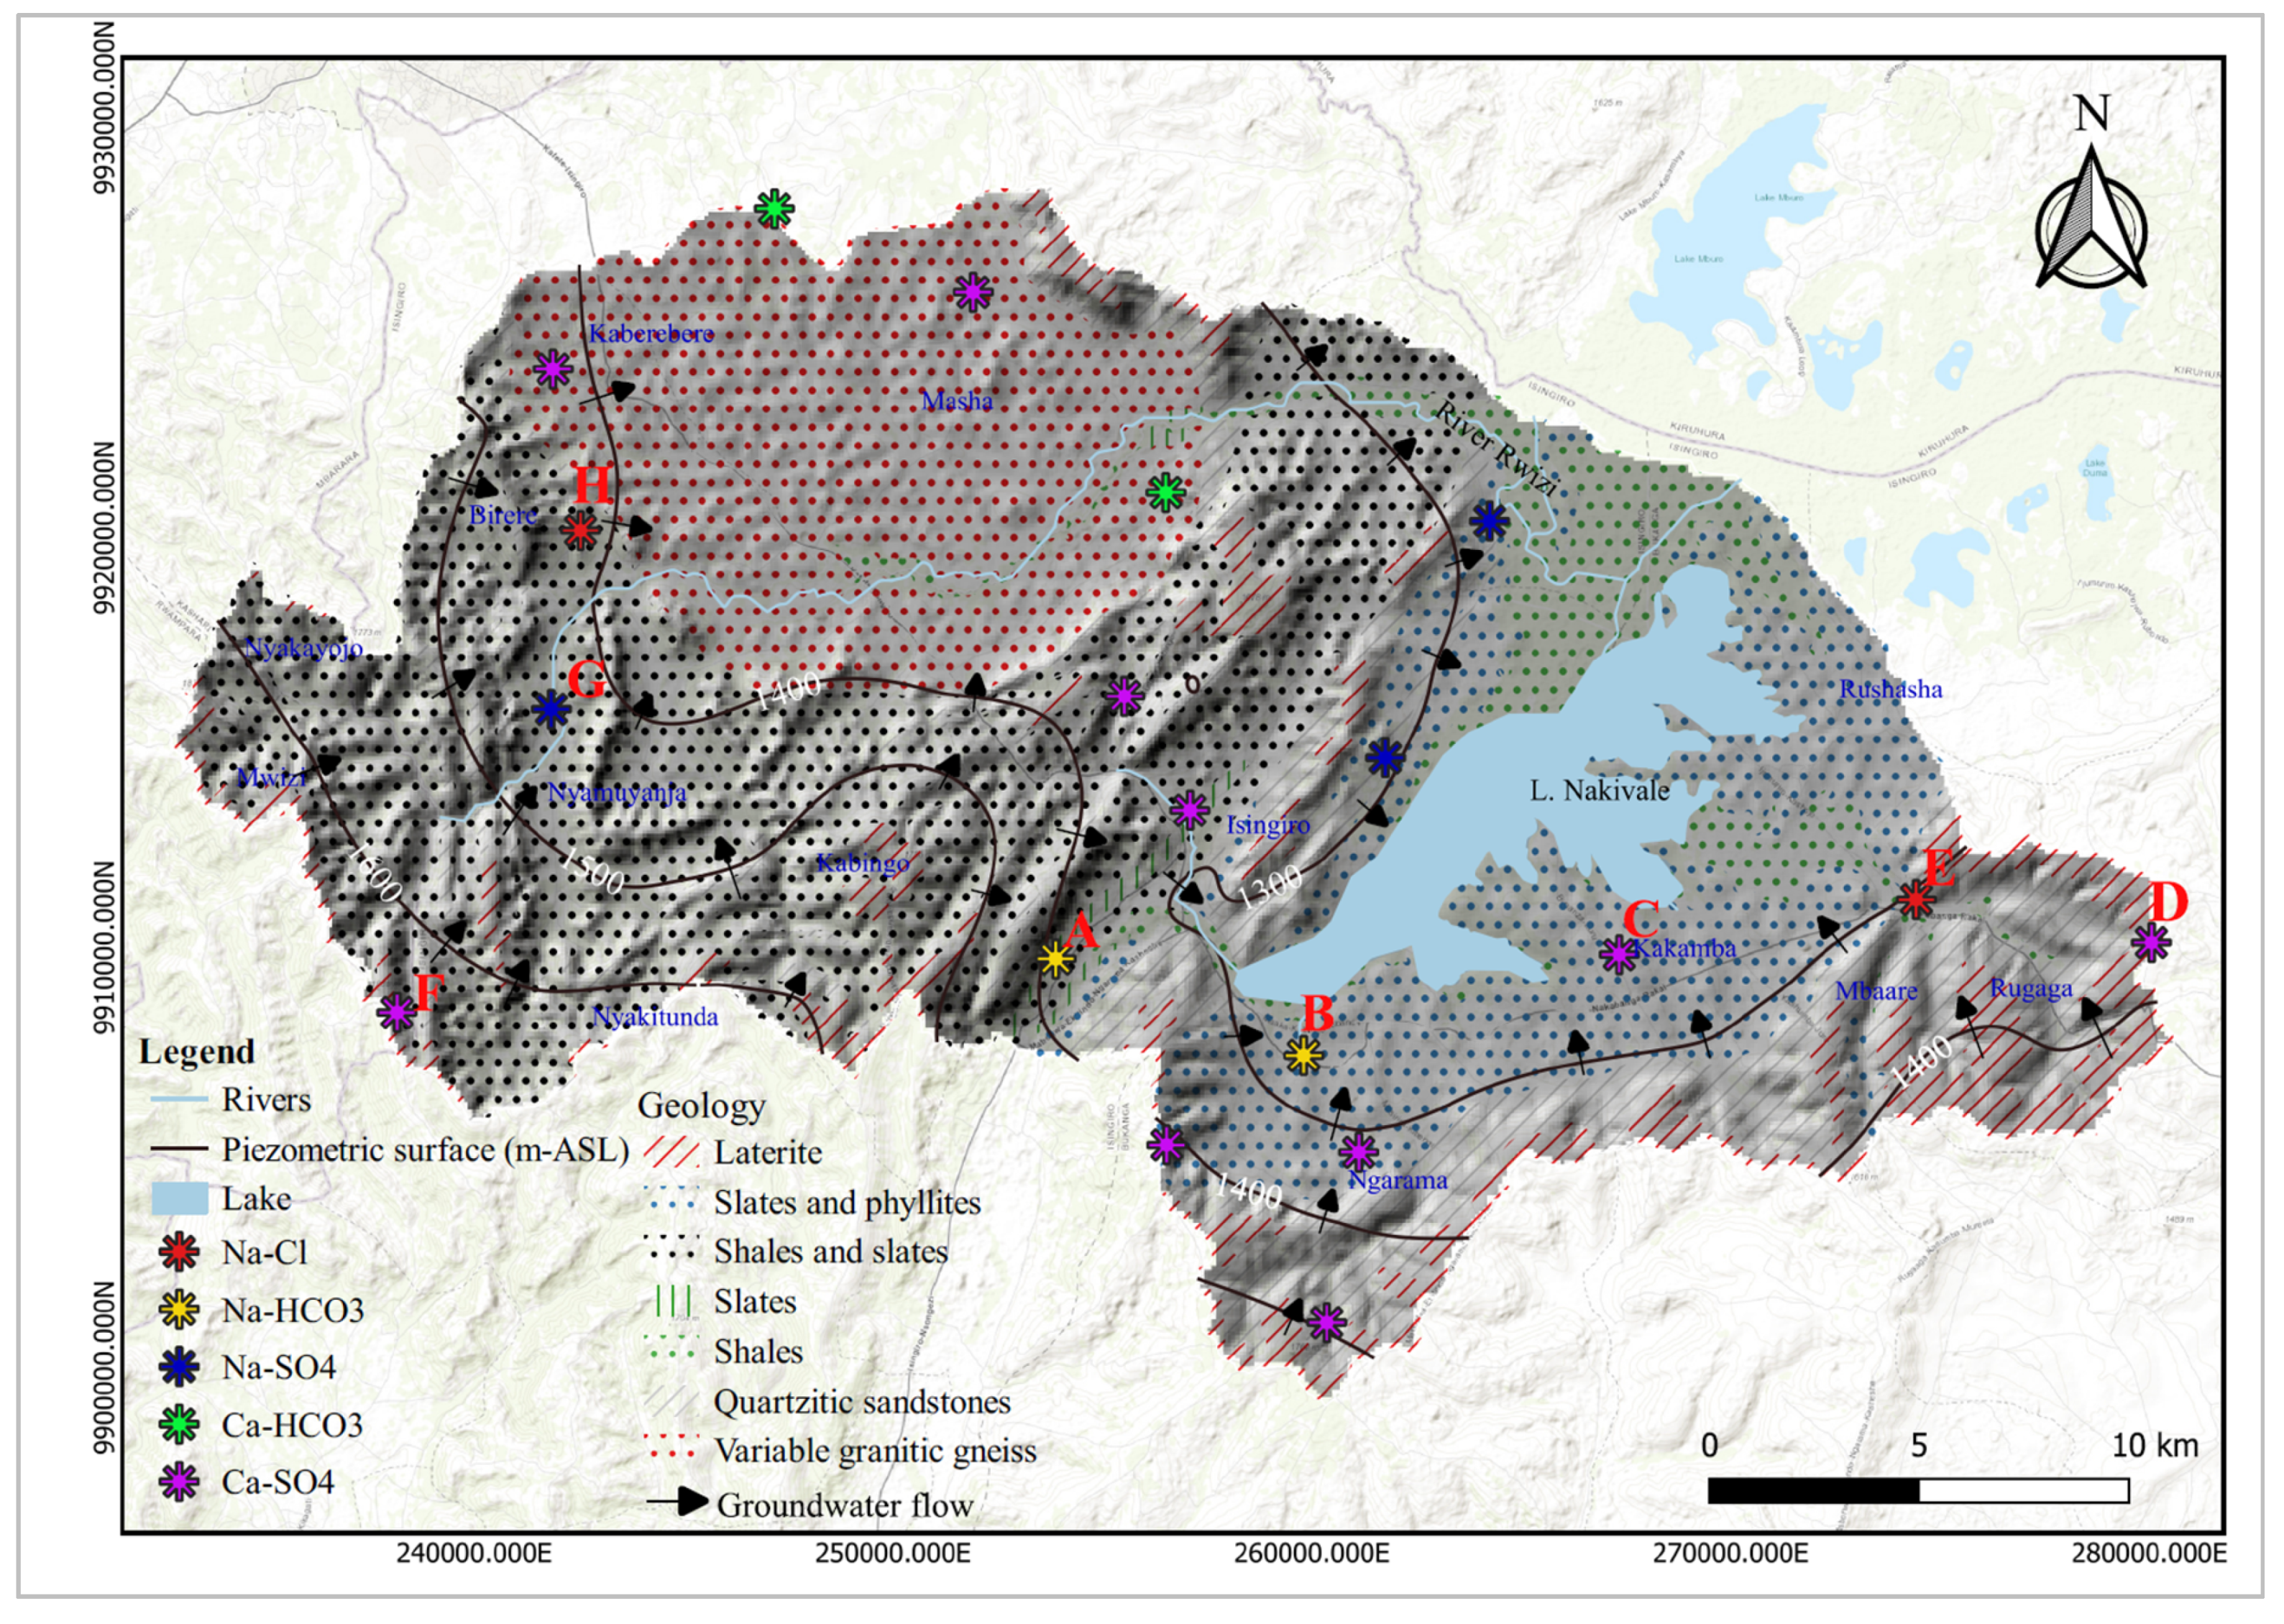
There is evidence of the Chebotarev sequence of groundwater hydrochemical species along groundwater flowlines within the study area .This sequence indicates that groundwater hydrochemistry evolves in the following order as it moves along a pathway: [52]. Therefore, water dominated by HCO3- suggests young, shallow groundwater or a localized flow pattern while water dominated by Cl- provide evidence of older groundwater or a regional flow pattern.
Figure 5.
Evidence of groundwater evolution along groundwater flow path lines. The hydrochemical evolution of groundwater from within the study area can be traced from points D-E, F-G-H, and from A-B-C.
Figure 5.
Evidence of groundwater evolution along groundwater flow path lines. The hydrochemical evolution of groundwater from within the study area can be traced from points D-E, F-G-H, and from A-B-C.
3.3. Groundwater Facies Analysis
The identified cationic groundwater types in the area include Ca, Mg, and Na, while the anionic groundwater facies consist of SO
4, HCO
3 and Cl. Based on the diamond-shaped Piper plot, these groundwater facies in the study area are further classified into Ca-Mg-SO
4-Cl and a mixed water type comprising Na-HCO
3 and Ca-Mg-SO
4-Cl (
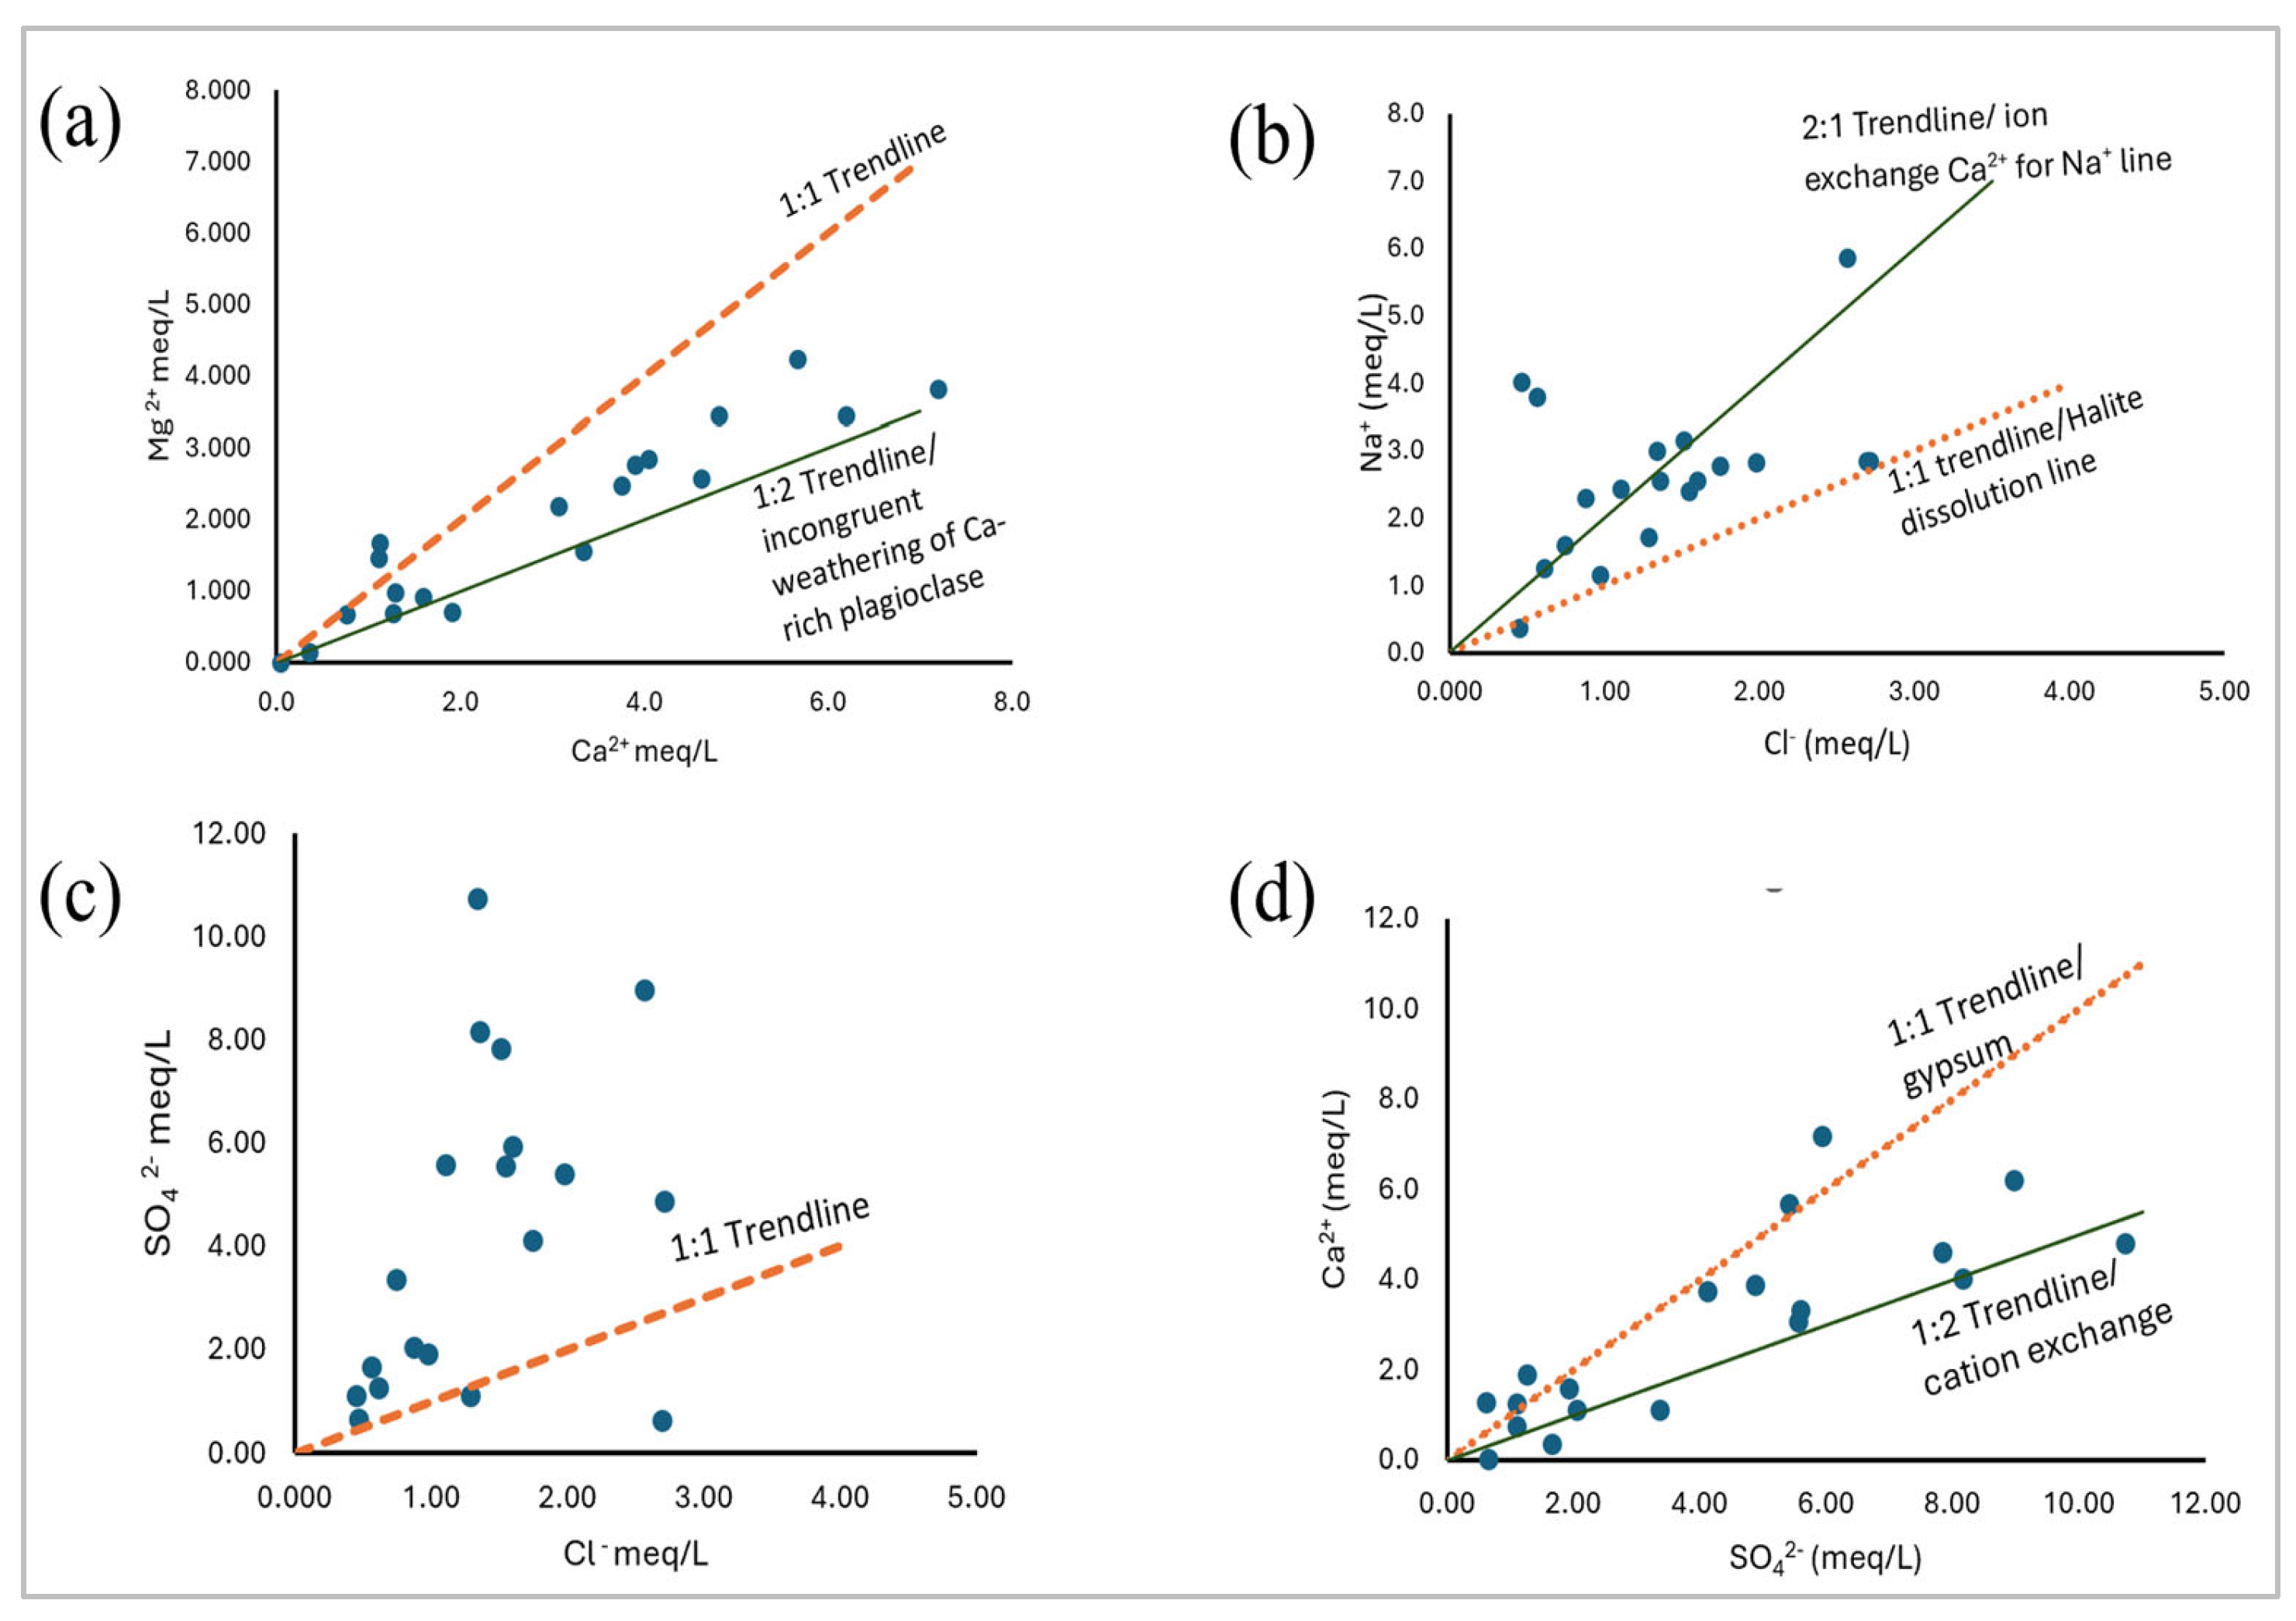
Figure S2). To address the bias posed by summing up hydrochemical facies within the Piper plot, the analysis of dominant hydrochemical species was further refined using 1:1 trendline plots. This approach helped to accurately characterize the dominant hydrochemical species and identify potential geogenic sources of ions and weathering processes.
(
Figure 6a) reveals that Ca
2+ is more dominant as compared to Mg
2+. Therefore, the cationic facies in the Nakivale sub-catchment groundwater are ordered by relative abundance as Ca > Na > Mg > K. The 1:2 trendline represents potential incongruent weathering of Ca-rich plagioclase feldspars (Equation 9). (
Figure 6c) clearly shows that the dominant anionic species is SO
4 evidenced by 90% of groundwater samples plotting above the SO
42- vs Cl
- 1:1 trendline. Therefore, the anionic species are ordered by relative abundance as SO
4 > HCO
3 > Cl. These finding also align with the results of [12], which suggested the prevalence of Ca-SO
4 rich waters within southwestern Uganda.
(
Figure 6b) reveals that the occurrence of Na-Cl groundwater facies is minimally due to halite dissolution, as only 16% of the points plot along the halite dissolution line. This is further evidenced by a weak correlation coefficient of less than 0.5 between Na
+ and Cl
- (
Table S3). Most plots fall toward the sodium side and thus indicating another potential source of Na ions, possibly the weathering of Na-rich plagioclase feldspars. The 2:1 trendline indicates potential cation exchange of Ca
2+ for Na
+ in groundwater.
(
Figure 6d) reveals that gypsum dissolution is less predominant within the study area. This is evidenced by only a few groundwater samples (26%) plotting along the gypsum dissolution line. This trend indicates that Ca and SO
4 ions are derived from other sources other than gypsum dissolution. The 1:2 trendline signifies potential ion exchange of Ca
2+ for Na
+ in groundwater.
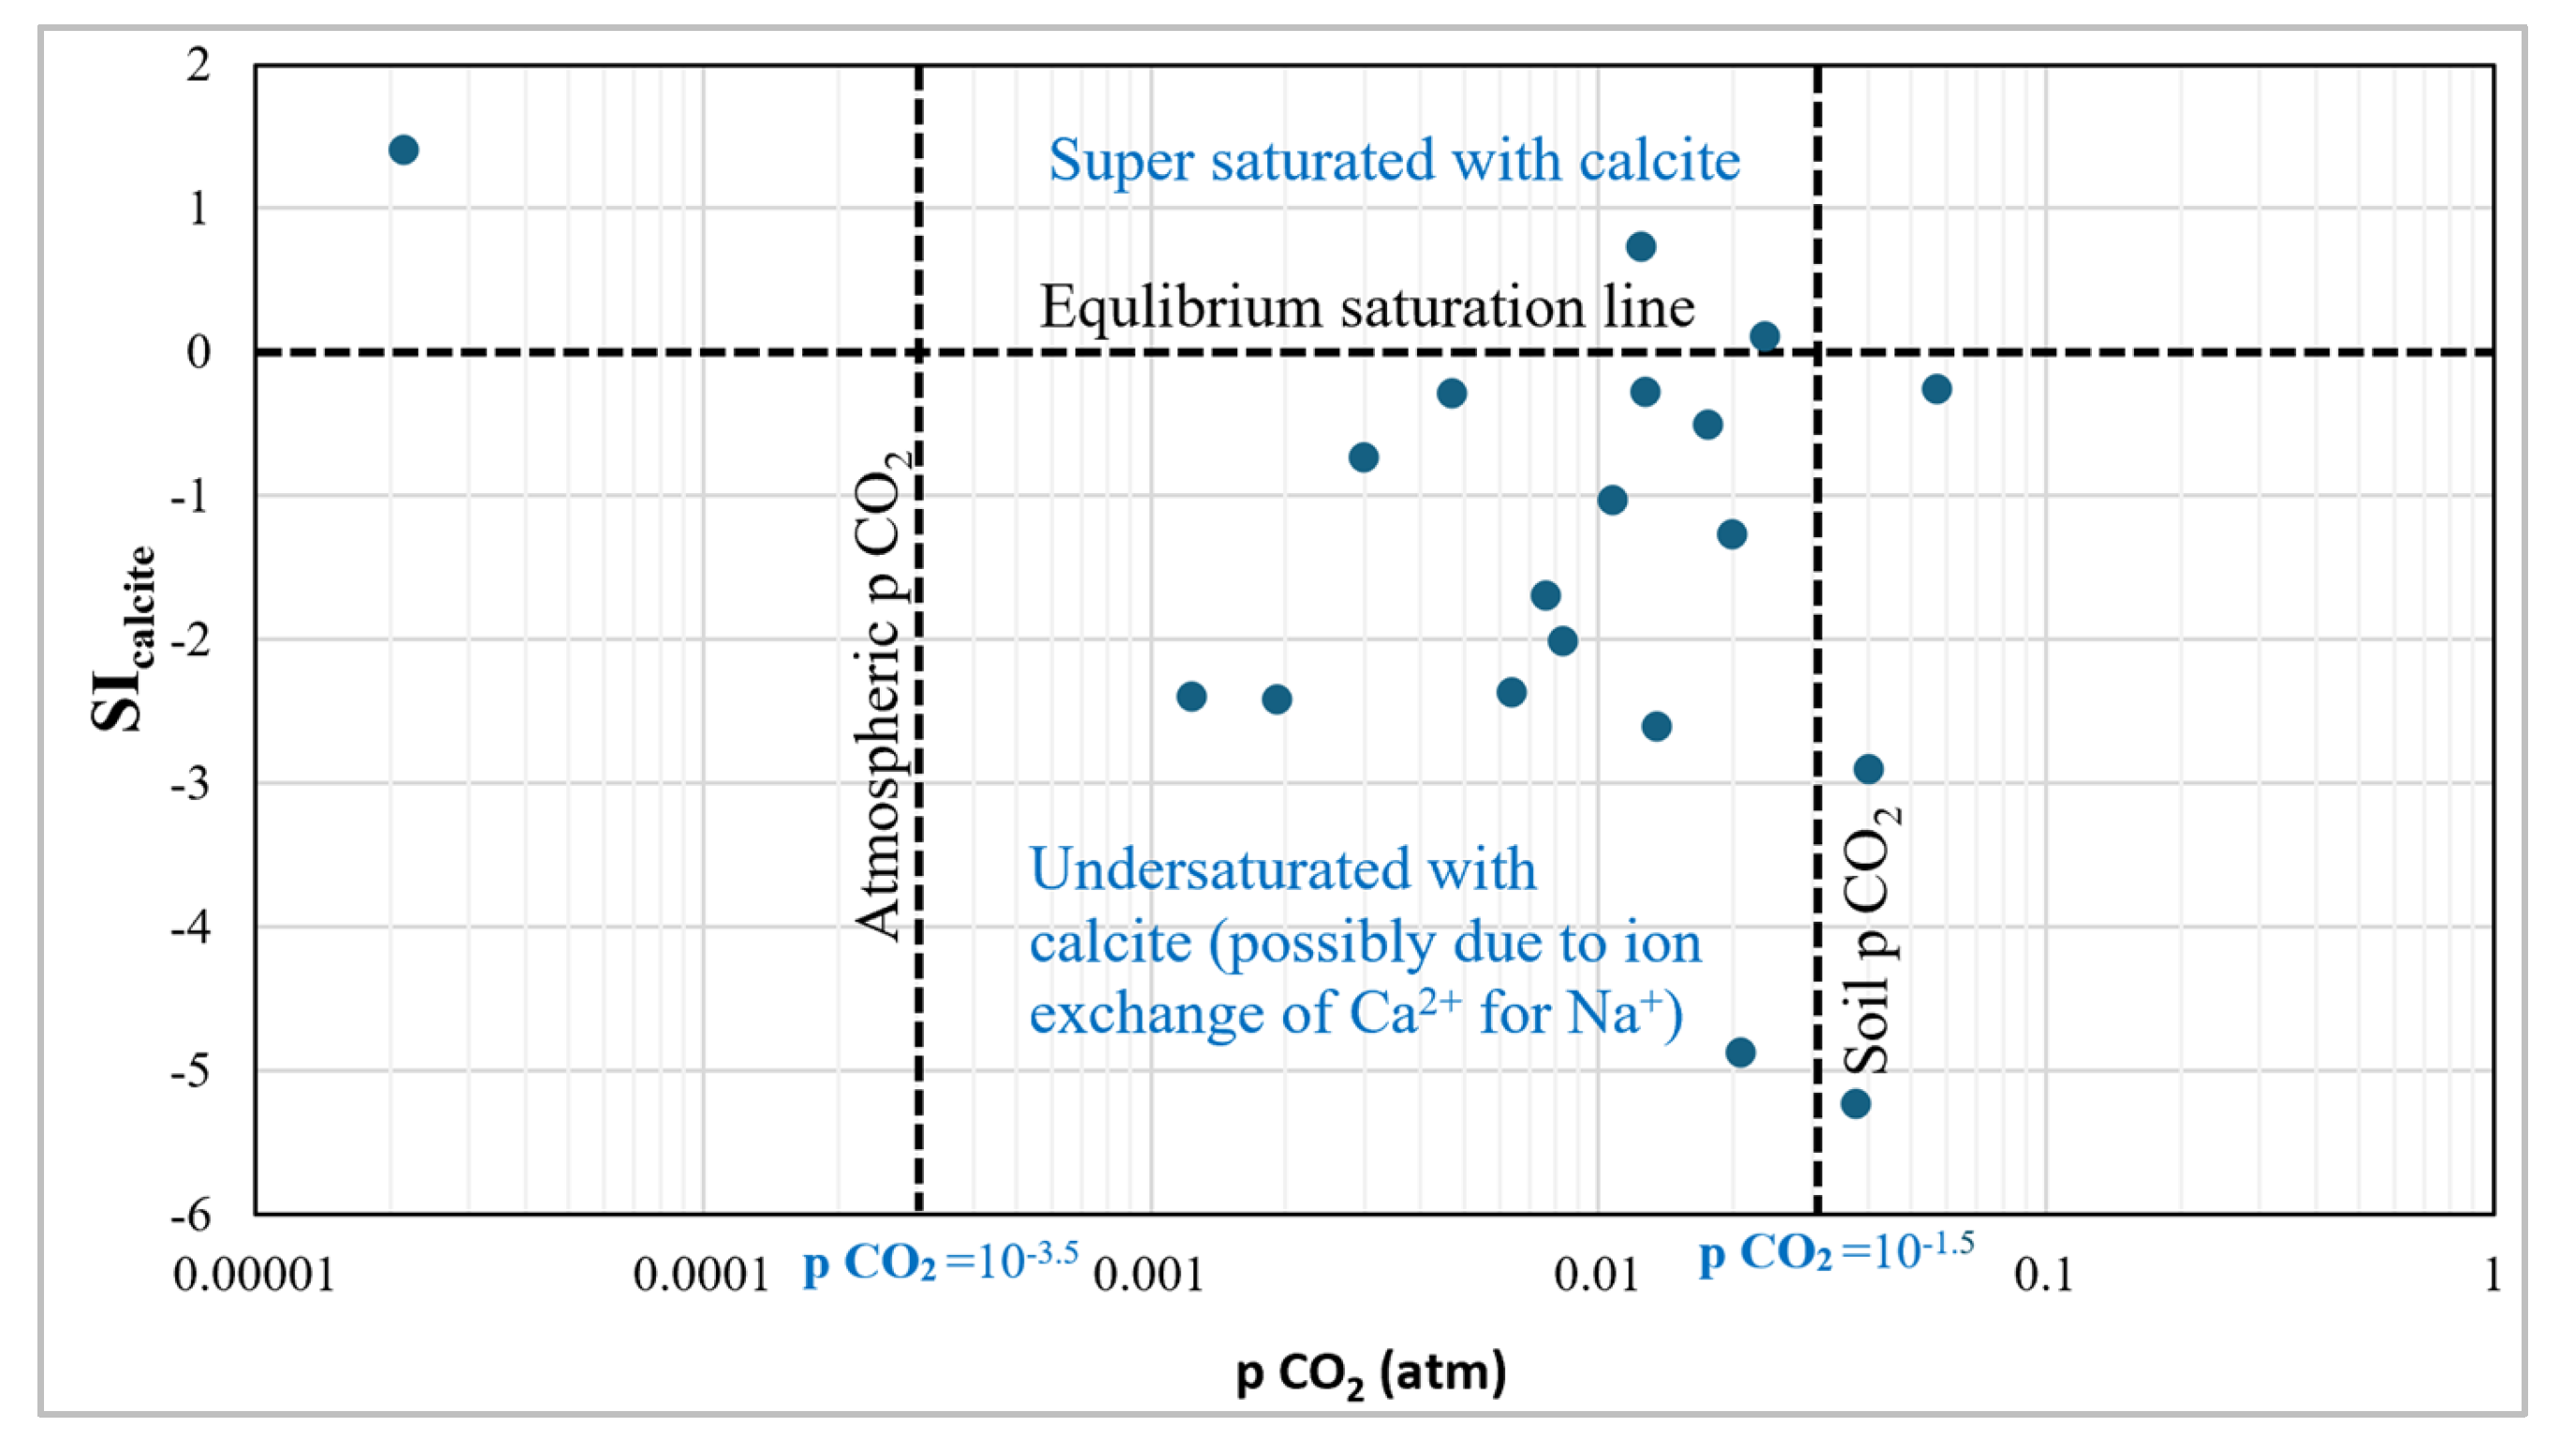
(
Figure 7) indicates that HCO
3- in groundwater is not primarily due to calcite dissolution. Instead, it likely results from the dissolution of soil CO
2 derived from organic matter decay and microbial respiration as groundwater infiltrates (Equation 7).
Typical atmospheric pCO
2 is around 10
-3.5 atm [53]. 95% of the sample values indicate higher dissolved CO
2 concentrations typical of groundwater influenced by soil CO
2 or microbial respiration. 16% of the samples exhibit positive SI
calcite values indicating that these samples are oversaturated with calcite mineral [41].
High pCO2 and negative SIcalcite values also suggest active groundwater recharge with recent infiltration of CO2-rich water whereas lower pCO2 and increasing SIcalcite values may indicate the progression of groundwater away from recharge areas to discharge areas with potential for calcite precipitation as CO2 degasses [53].
There exists a negative correlation between Partial pressure of carbon dioxide (pCO
2) and pH in groundwater (
Figure S3). This can be attributed to the consumption of hydrogen ions (H
+) during silicate incongruent weathering [54]. H
+ are consumed as they react with silicate minerals to produce clay minerals (such as kaolinite) and dissolved ions (like bicarbonate and silica) [55].This consumption of H
+ ions reduces the acidity of the water leading to an increase in pH.
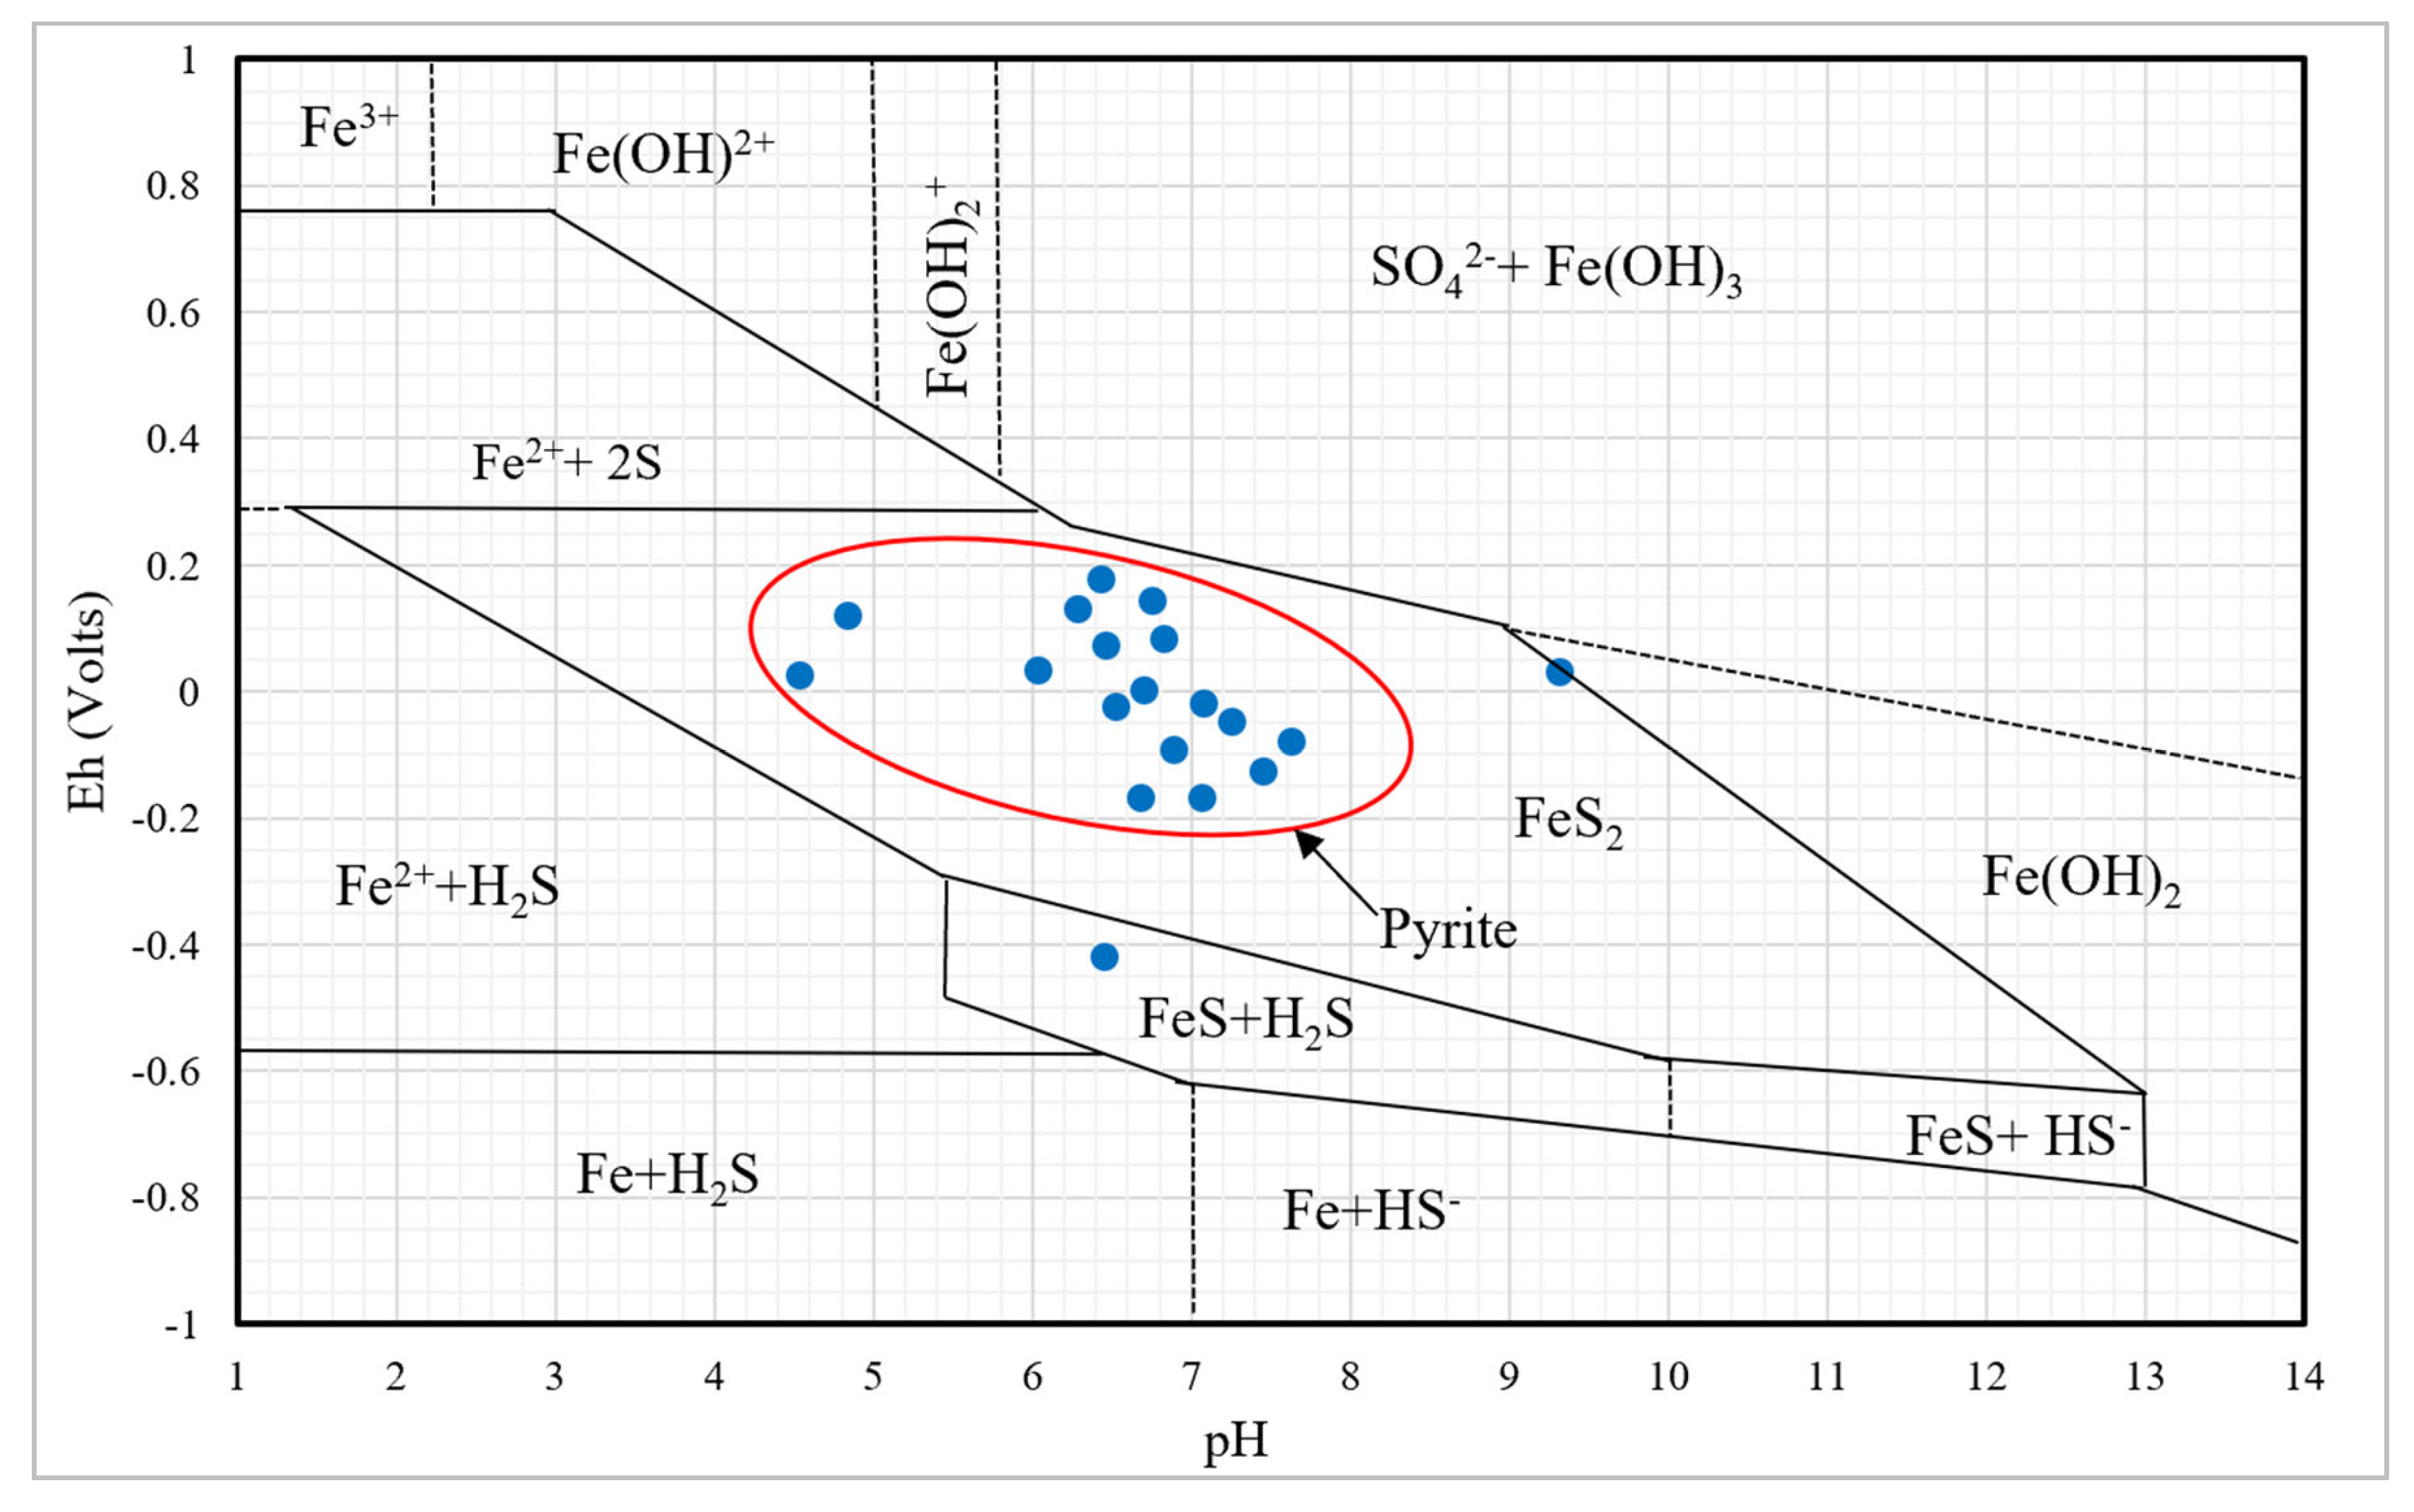
The redox potential (Eh) vs pH, Pourbaix plot for a pyrite-water system, indicates that 90% of the samples fall within the pyrite region (
Figure 8). Therefore, the dominance of sulphate anionic facies within groundwater in the study area primarily results from the oxidation of pyrite [56].
3.4. Hierarchical Cluster Analysis
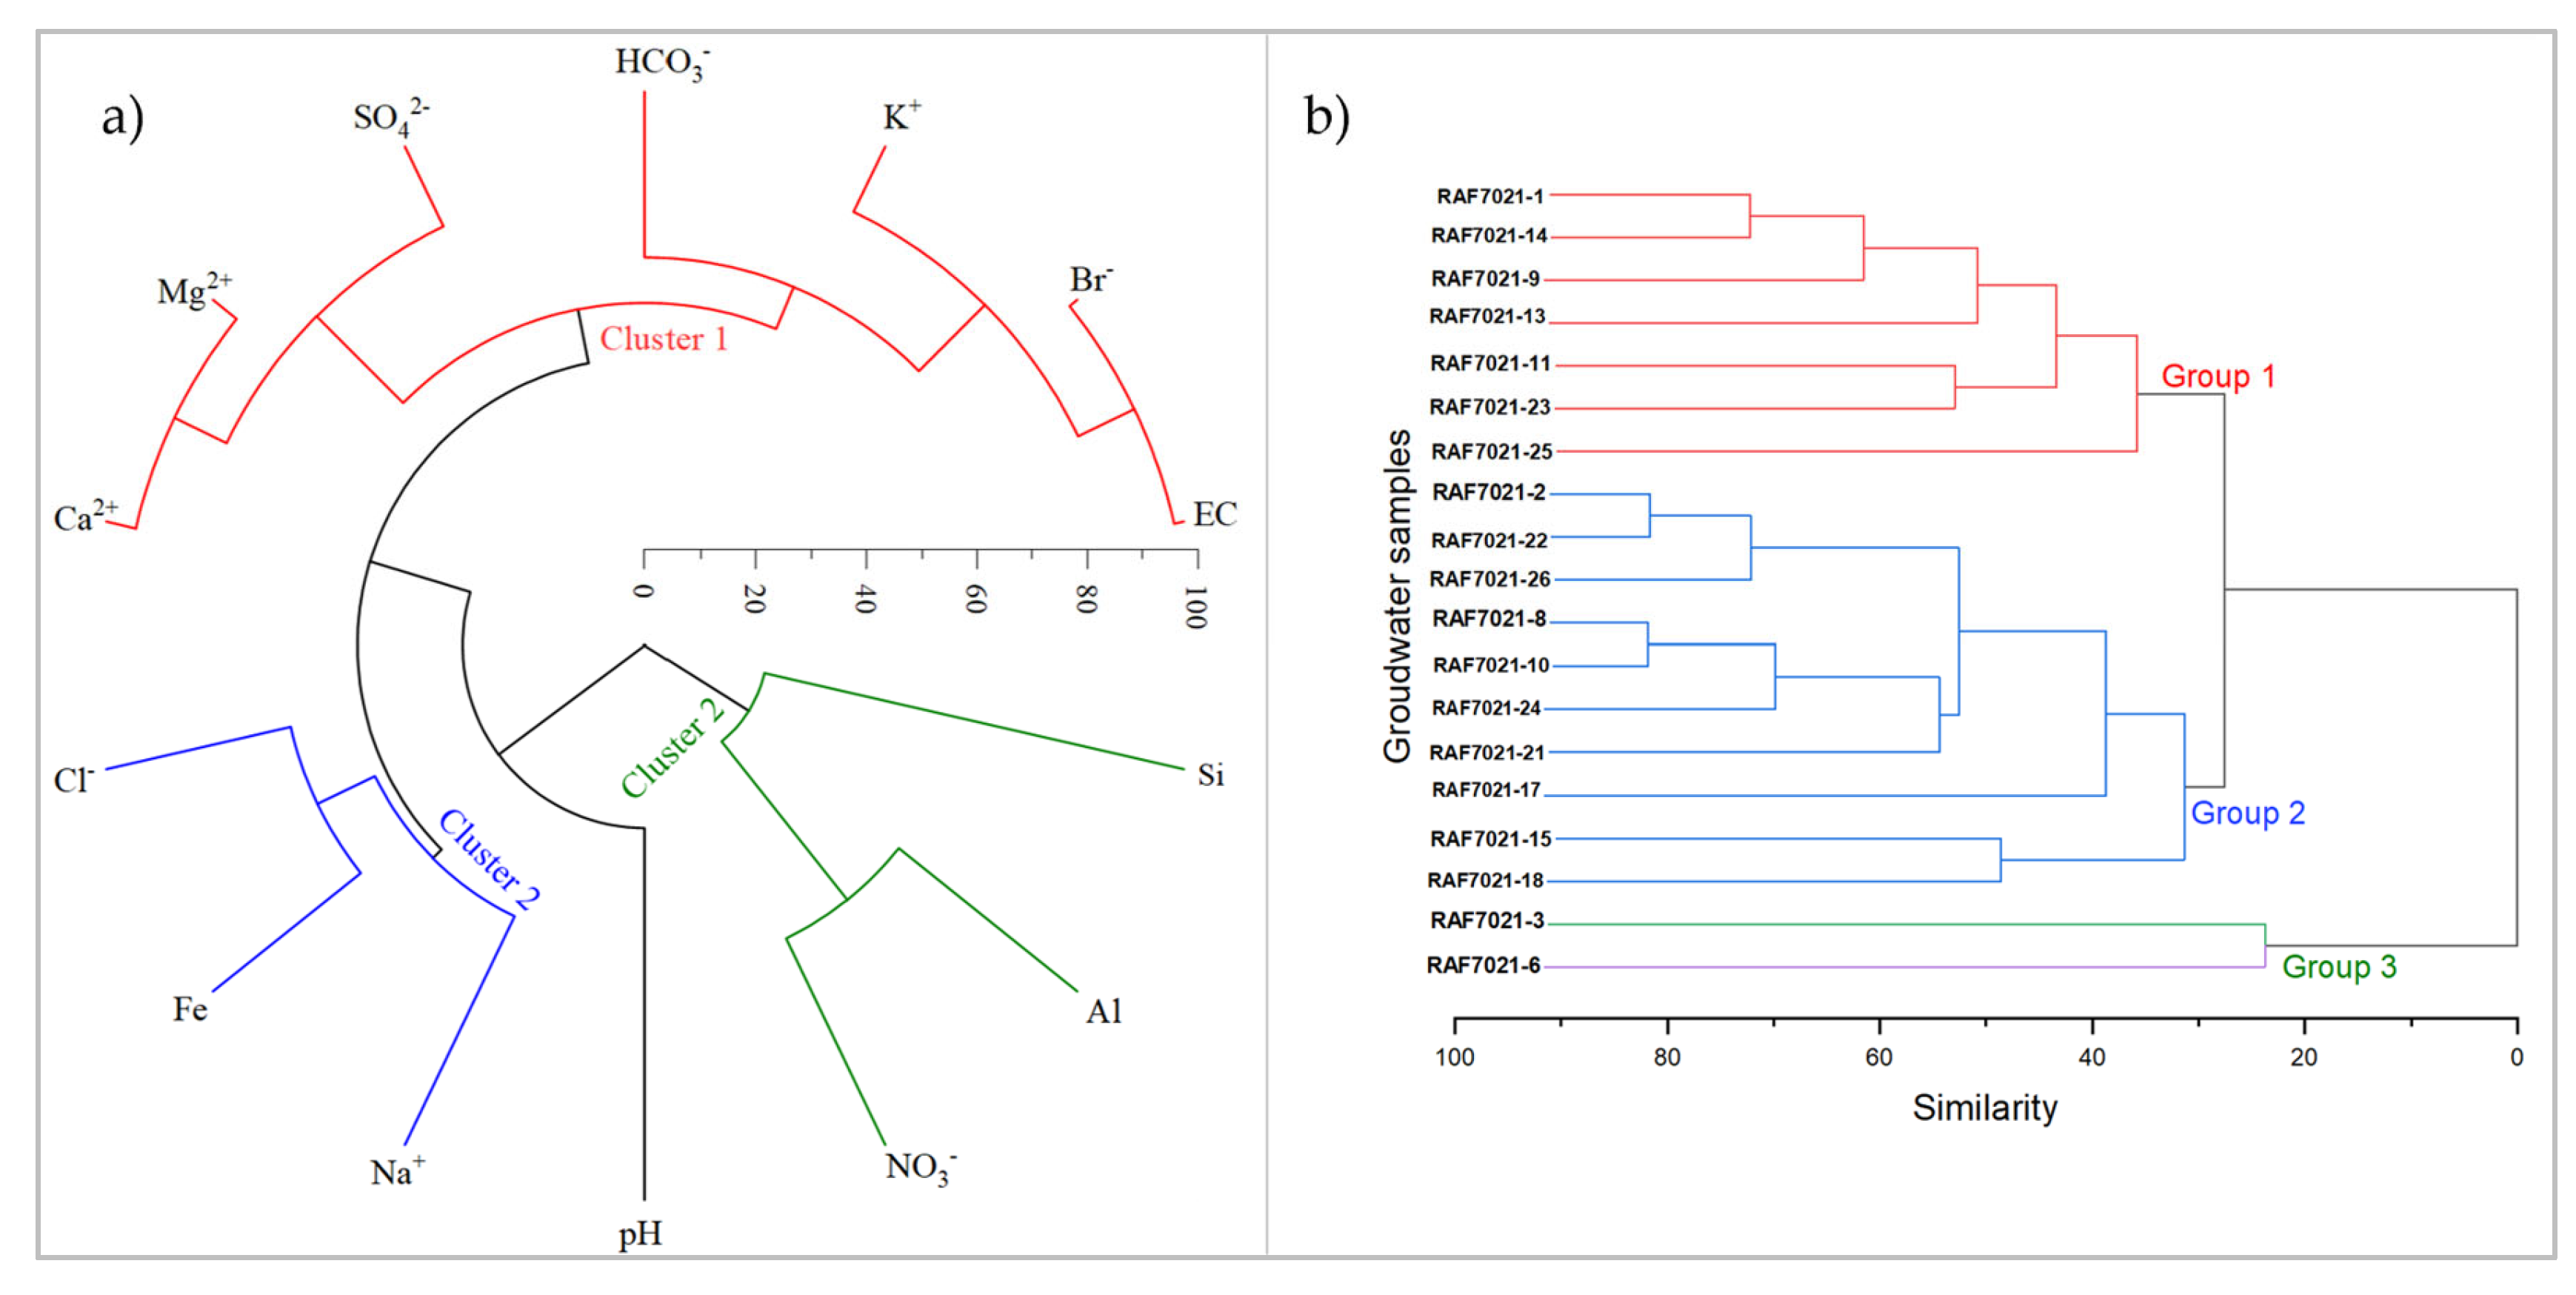
The R-mode cluster analysis of variables identified three clusters of hydrochemical facies (
Figure 9a). Cluster 1 includes the ionic species K
+, Na
+, Fe
2+, Cl
-, HCO
3-, and Br
-. Cluster 2 comprises SO
42-, Mg
2+, and Ca
2+, while cluster 3 consists of NO
3-, Al
3+, and Si. pH is more closely correlated with the ionic species in cluster 1, and Electrical Conductivity (EC) is more correlated with the ionic species in cluster 2. The presence of these ions is likely due to a combination of natural geological processes and human activities. The detection of chloride and bromide points to potential anthropogenic sources such as agricultural runoff or industrial activities [57].
Cluster 2 contains bivalent ions typically associated with natural mineral weathering. Sulphates potentially originate from the weathering of rocks rich in sulfides such as FeS2 which is common in the area [21]. The correlation of pH with these ions indicates that their concentrations in solution are mainly influenced by pH, particularly during the hydrolysis of plagioclase minerals. The presence of sulphate further underscores the influence of both natural geological processes and potential anthropogenic sources such as the use agricultural fertilizers [56].
Cluster 3 ions reflect both natural and anthropogenic influences. Nitrate often indicates agricultural activity such as the use of nitrogen-based fertilizers or contamination from septic systems [58]. Aluminium and silicon are typically derived from the weathering of silicate minerals [59]. This cluster shows a blend of natural mineral weathering and human-induced contamination.
The Q-mode cluster analysis grouped groundwater samples into three groups based on their similarity in hydrochemical signatures. Group 1 includes samples RAF7021-1, RAF7021-9, RAF7021-11, RAF7021-13, RAF7021-14, RAF7021-23, and RAF7021-25. Group 2 consists of samples RAF7021-2, RAF7021-8, RAF7021-10, RAF7021-15, RAF7021-17, RAF7021-18, RAF7021-21, RAF7021-22, RAF7021-24, and RAF7021-26. Lastly, Group 3 comprises samples RAF7021-3 and RAF7021-6 (
Figure 9b).
Group 1 groundwater samples exhibit moderate electrical conductivity (EC), indicating moderate mineral presence. The pH levels range from slightly acidic to slightly basic with an average around neutral (7.1). This group also has moderate levels of chloride (Cl-) and nitrate (NO3-) with variability in HCO3- and SO42- concentrations, indicating diverse sources of mineralization [10]. The water types in this group include Ca-Mg-SO4-HCO4, Ca-Mg-SO4 and Ca-Mg-SO4-HCO3.
Group 2 groundwater samples have lower electrical conductivity compared to Group 1, reflecting lower mineral content. The pH values are more variable, with some samples being notably more acidic. The concentrations of HCO3-, Cl- and SO42- are generally lower than in Group 1. However, this group shows high variability in nitrate NO3- levels indicating potential diverse contamination sources [58]. This group's lower mineral content and variable pH suggest different hydrochemical processes [60]. The water types in this group are varied including Na-Cl-SO4, Na-HCO3, Ca-Mg-SO4 and Ca-Mg-SO4-HCO3.
Group 3 groundwater samples show the highest electrical conductivity and bicarbonate HCO3- levels, indicating very high mineral content. The pH values in this group are relatively stable averaging around 7.3 (slightly basic). This group also has significantly higher concentrations of SO42- and Ca2+. The dominant water type in Group 3 is Ca-SO4.
3.5. Analysis of Stable Isotope in Local Precipitation
Stable isotope data from 11 isotope stations near the study area: within Uganda and Rwanda obtained from the IAEA GNIP website, reveal variations in stable isotope signature across the region (
Table S1). Mean δ
2H values range from -7.099 to 10.845, while mean δ
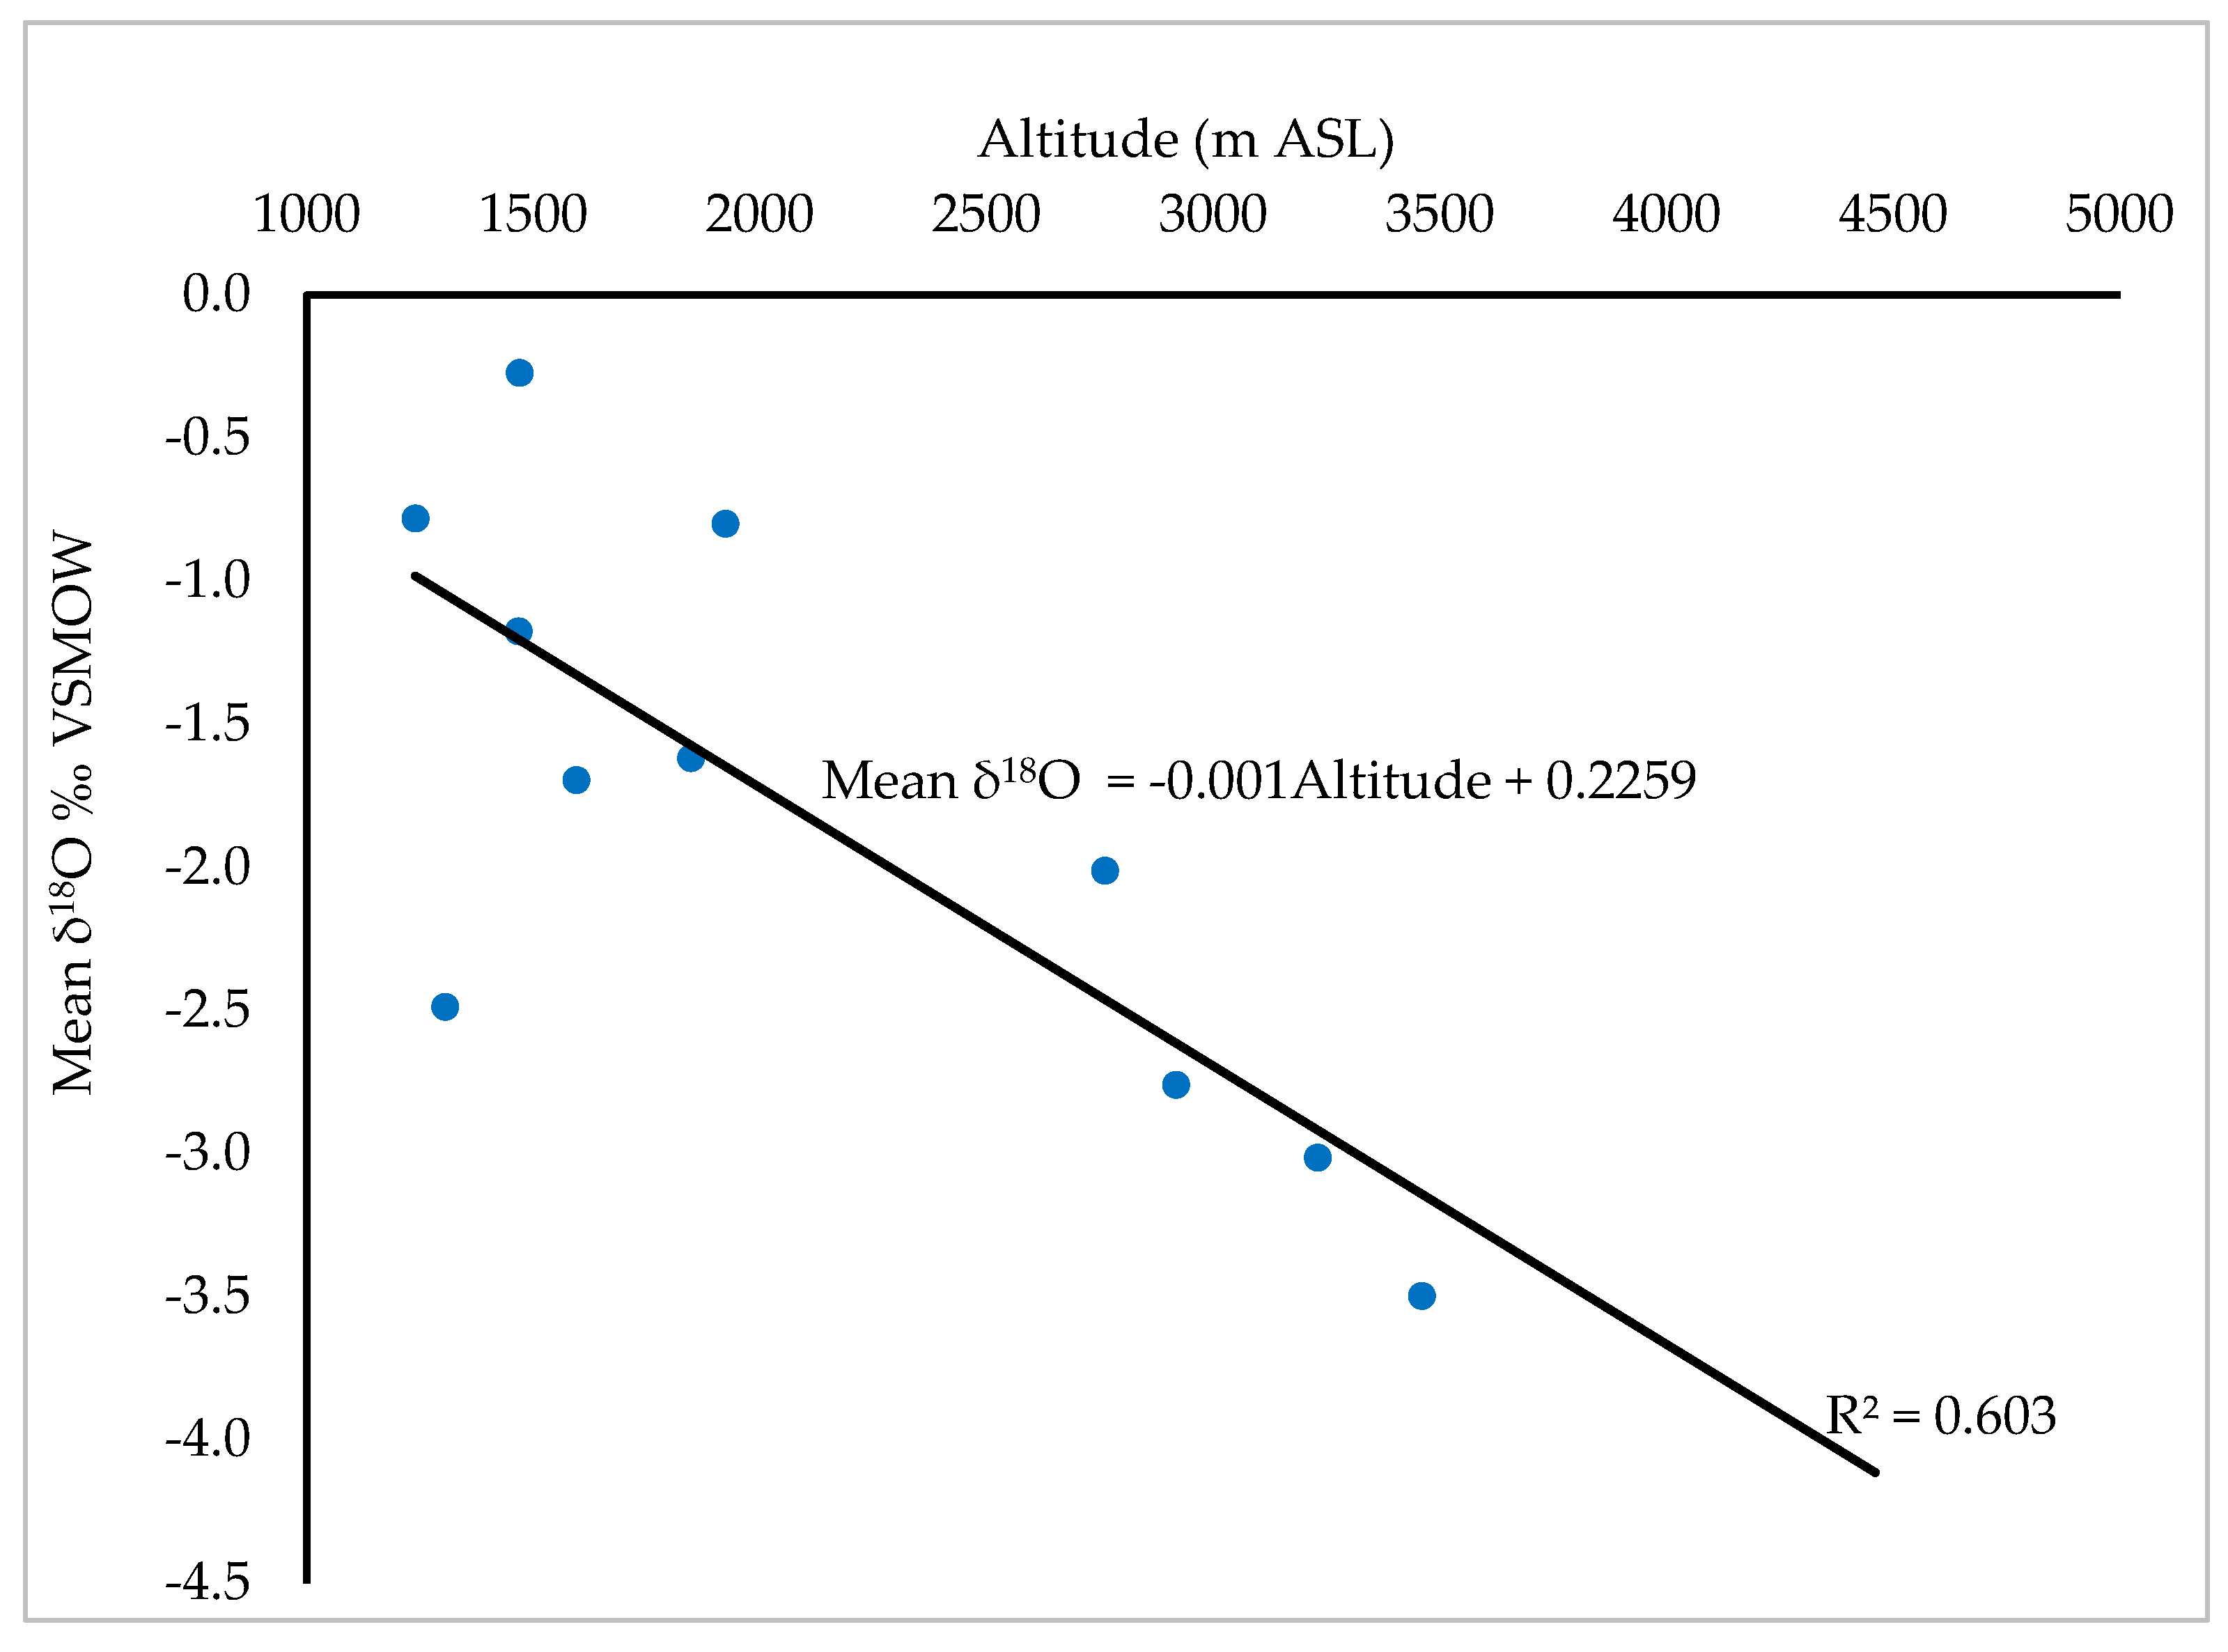
18O values range from -3.497 to -0.272. There is an altitude effect on the isotopic composition of rainfall in the study area (
Figure 10). This is attributed to the temperature gradients associated with elevation differences [48]. Low-altitude areas are associated with high temperatures that enhance heavy isotope enrichment, whereas high-altitude areas experience lower temperatures that result into heavy isotope depletion [61].
The majority (90%) of stations show a mean Deuterium (D) excess value higher than the global average of 10 computed by [47]. The high D-excess values (>10) observed in local precipitation, along with findings from studies by [7,62,63], suggest local atmospheric moisture recycling processes within the region. This localized effect can be attributed to the influence of the Great lakes (particularly lake Victoria) on local precipitation.
D-excess histograms indicate that both the SON (September-October-November) and MAM (March-April-May) rainy seasons exhibit moderate variability, with the highest frequencies in the mid-range bins. The SON season's D-excess values suggest more uniform and stable moisture sources with limited atmospheric mixing. In contrast, the MAM season shows a slightly broader range. However, the consistency in moisture sources across seasons, despite some variability, underscores the dynamic atmospheric processes in the study area and can be attributed to the effects of the Intertropical Convergence Zone (ITCZ) shift on rainfall patterns in the region.
To determine if there is a significant difference in D-excess between the two rainy seasons (MAM and SON), a statistical t-test was conducted. This test was appropriate for assessing whether a statistical difference existed between the D-excess values for these two seasons. The paired t-test results showed a t-statistic of 1.929 and a p-value of 0.066. Since the p-value is greater than the common significance level of 0.05, there is no evidence to reject the null hypothesis [65]. Therefore, there is no statistically significant difference in D-excess between the MAM and SON rains at the 5% significance level.
3.6. Analysis of Stable Isotope in Groundwater
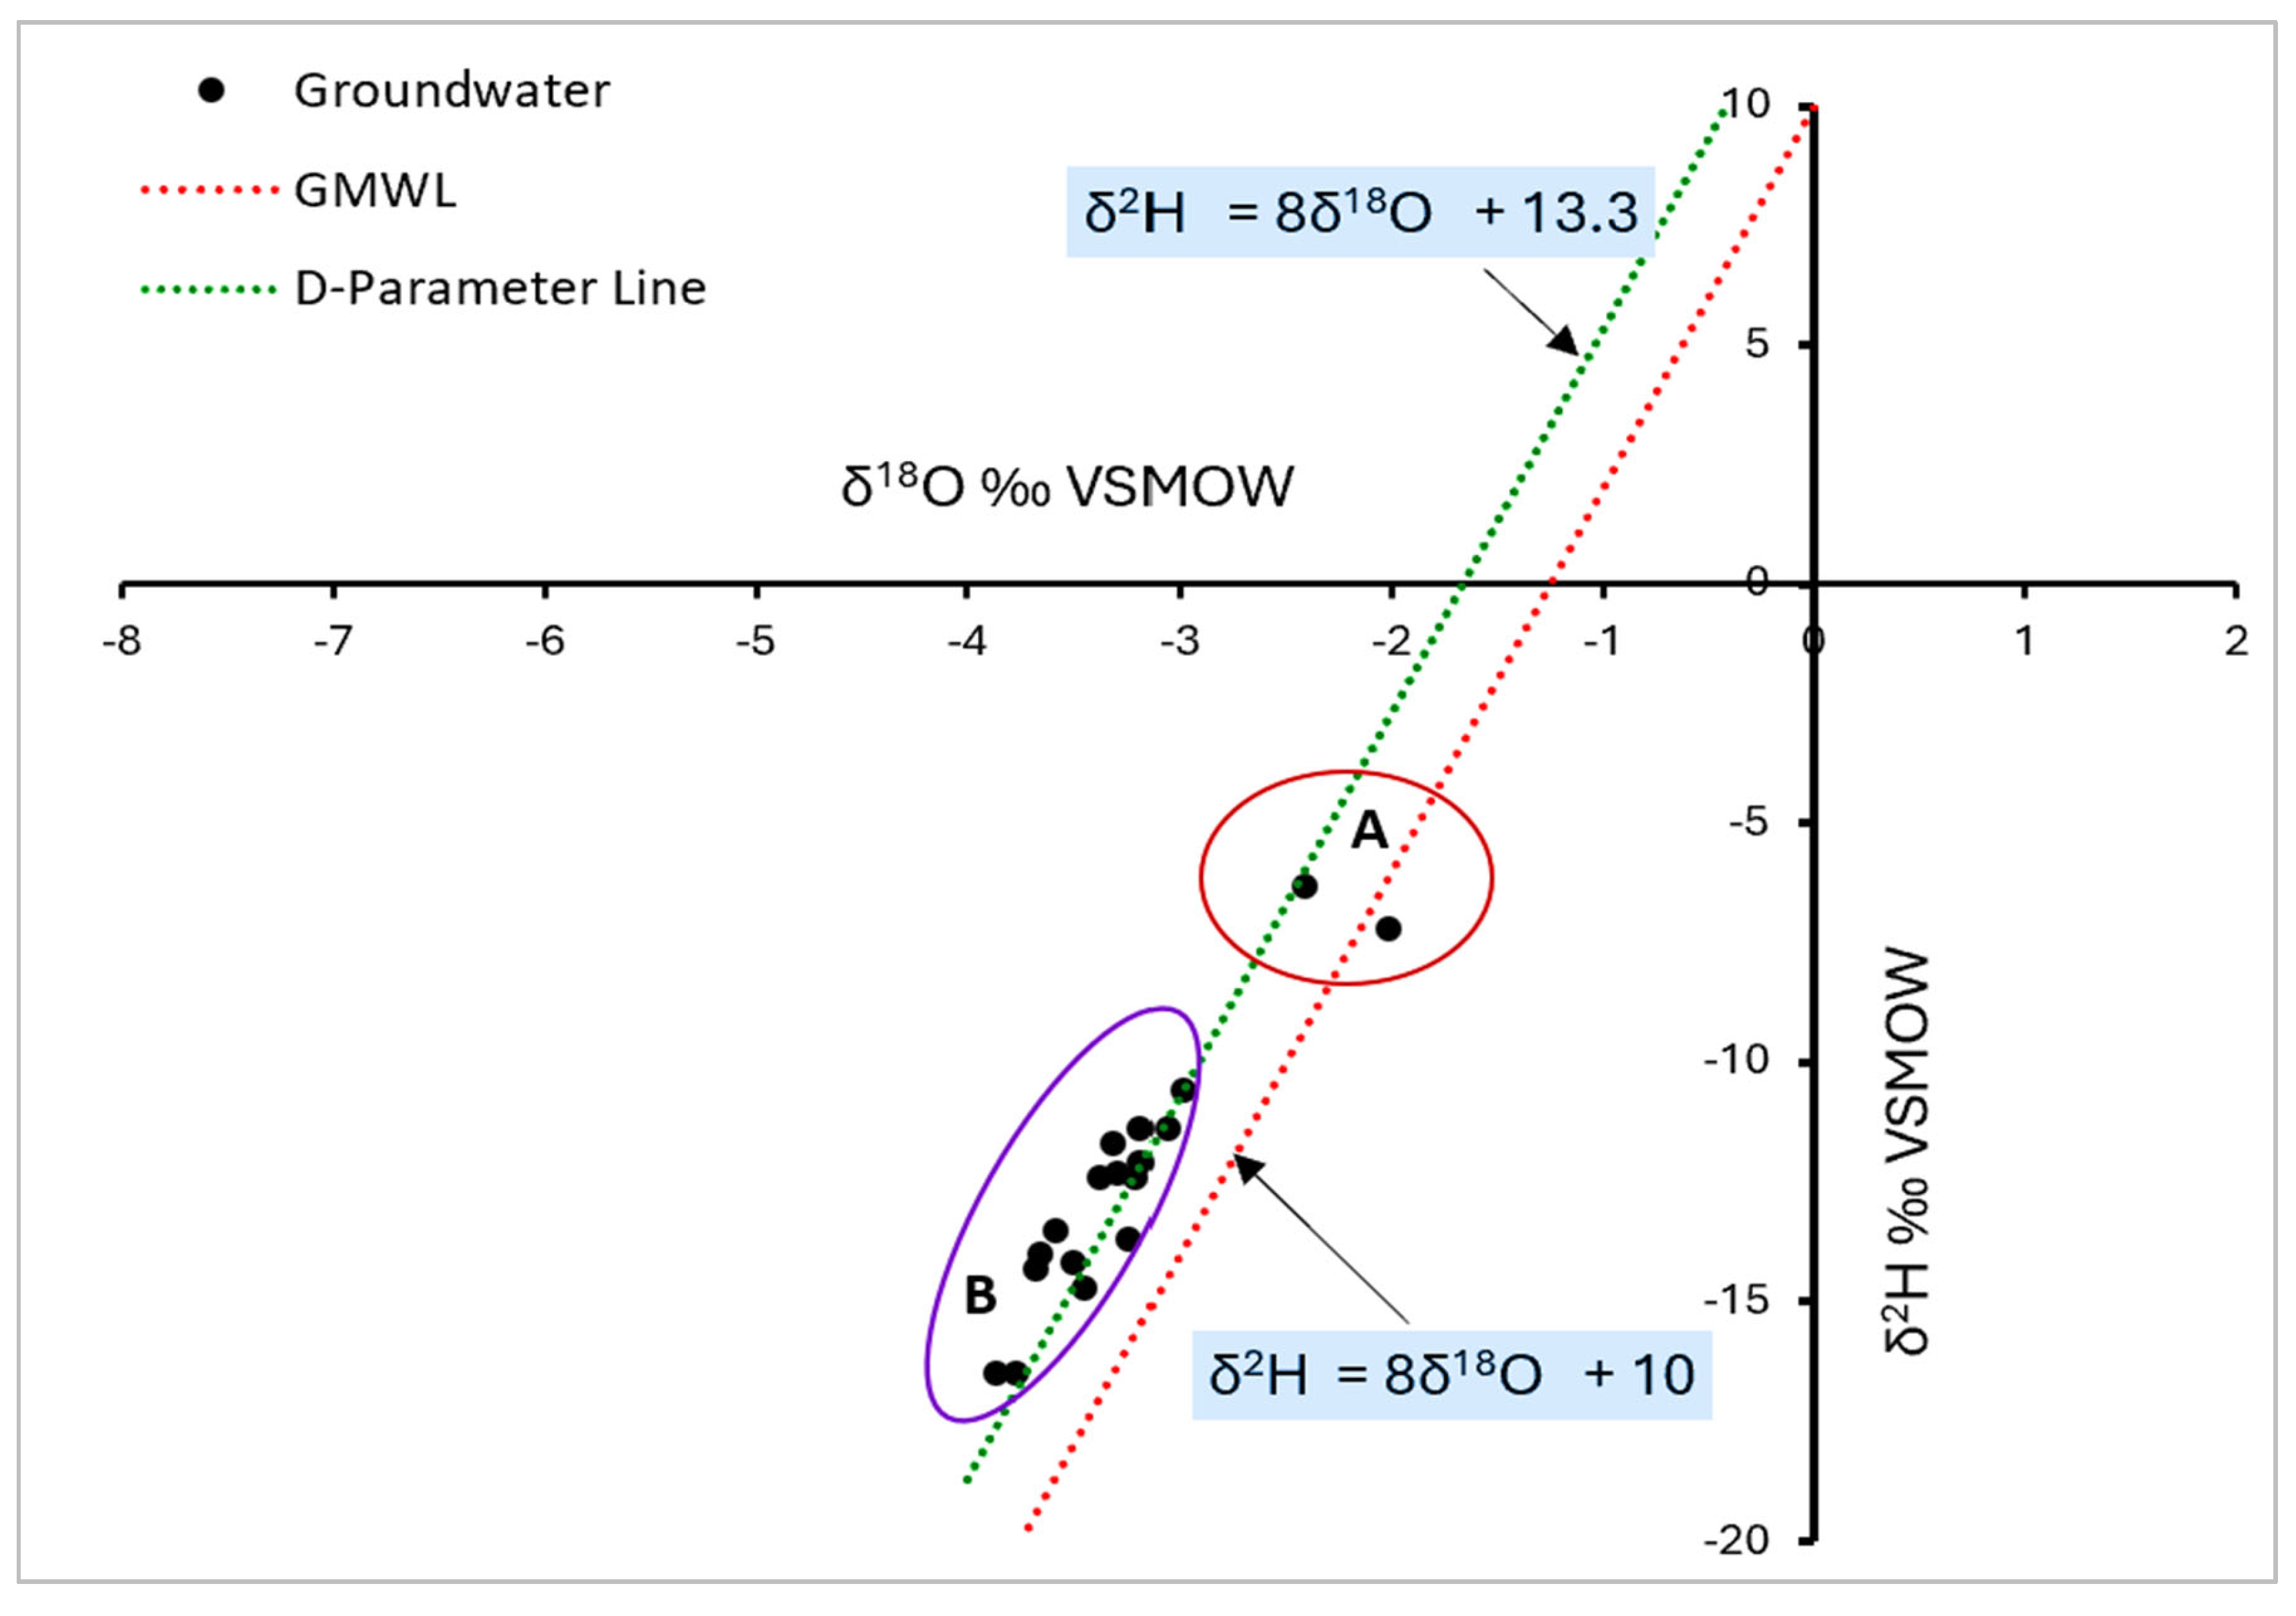
Eighteen groundwater samples (seventeen from cluster B and one from cluster A) plot along and close to the D-parameter line that also plots above the Global Meteoric Waterline (
Figure 11). One groundwater sample (in cluster A) plots below the Global Meteoric Waterline. Cluster A consists of groundwater samples that are more enriched in heavy isotopes relative to Cluster B samples. This can be attributed to evaporative enrichment imposed on Cluster A samples prior to groundwater recharge possibly from depression storage and slow groundwater recharge as a consequence of the prevalence of impervious formations such as shales and phyllites that are dominant in the study area (
Figure 1).
One groundwater sample in Cluster A plots away from the D-parameter line (
Figure 11). This groundwater sample (RAF7021-25) was collected at Masha within the granite gneiss at lower hydraulic elevations (
Figure 2). The isotopic shift of this sample can be attributed to high-temperature chemical reactions relative to its sister groundwater sample in the same cluster [65].
The graphical model in (
Figure 11) clearly indicates that groundwater in the project area originates from local precipitation. This is evidenced by 90% of the groundwater samples plotting along and close to the D-parameter line. This signifies that both groundwater and local precipitation share a common moisture source [48].
3.7. Tritium Isotope Analysis
Tritium results reveal clusters of groundwater samples based on their respective relative ages (
Figure 12). Ten groundwater samples (marked in red) clustered in the lower eastern and northwestern regions, have tritium units below the detection limit of 0.4, indicating groundwater likely older than 20 years. These samples cover areas of Masha, Kaberebere, Isingiro, Kakamba, Rugaga and Mbaare. Conversely, nine samples (marked in green) have tritium units above 0.4, indicating recently recharged groundwater (likely less than 20 years old). This dating approach was adopted due to the lack of historical tritium measurements in precipitation for the region and the study area in particular from the Global Network of Isotopes in Precipitation (GNIP) website.
The results from the tritium analysis align with the findings of [29] which identified paleo water characterized by very low tritium values (less than 0.4 TU) in the region. This ancient groundwater is thought to reside within the underlying paleochannels formed by historic river reversals due to the down warping and uplifting of the Ugandan plateau [31].
3.8. Groundwater Recharge Assessment
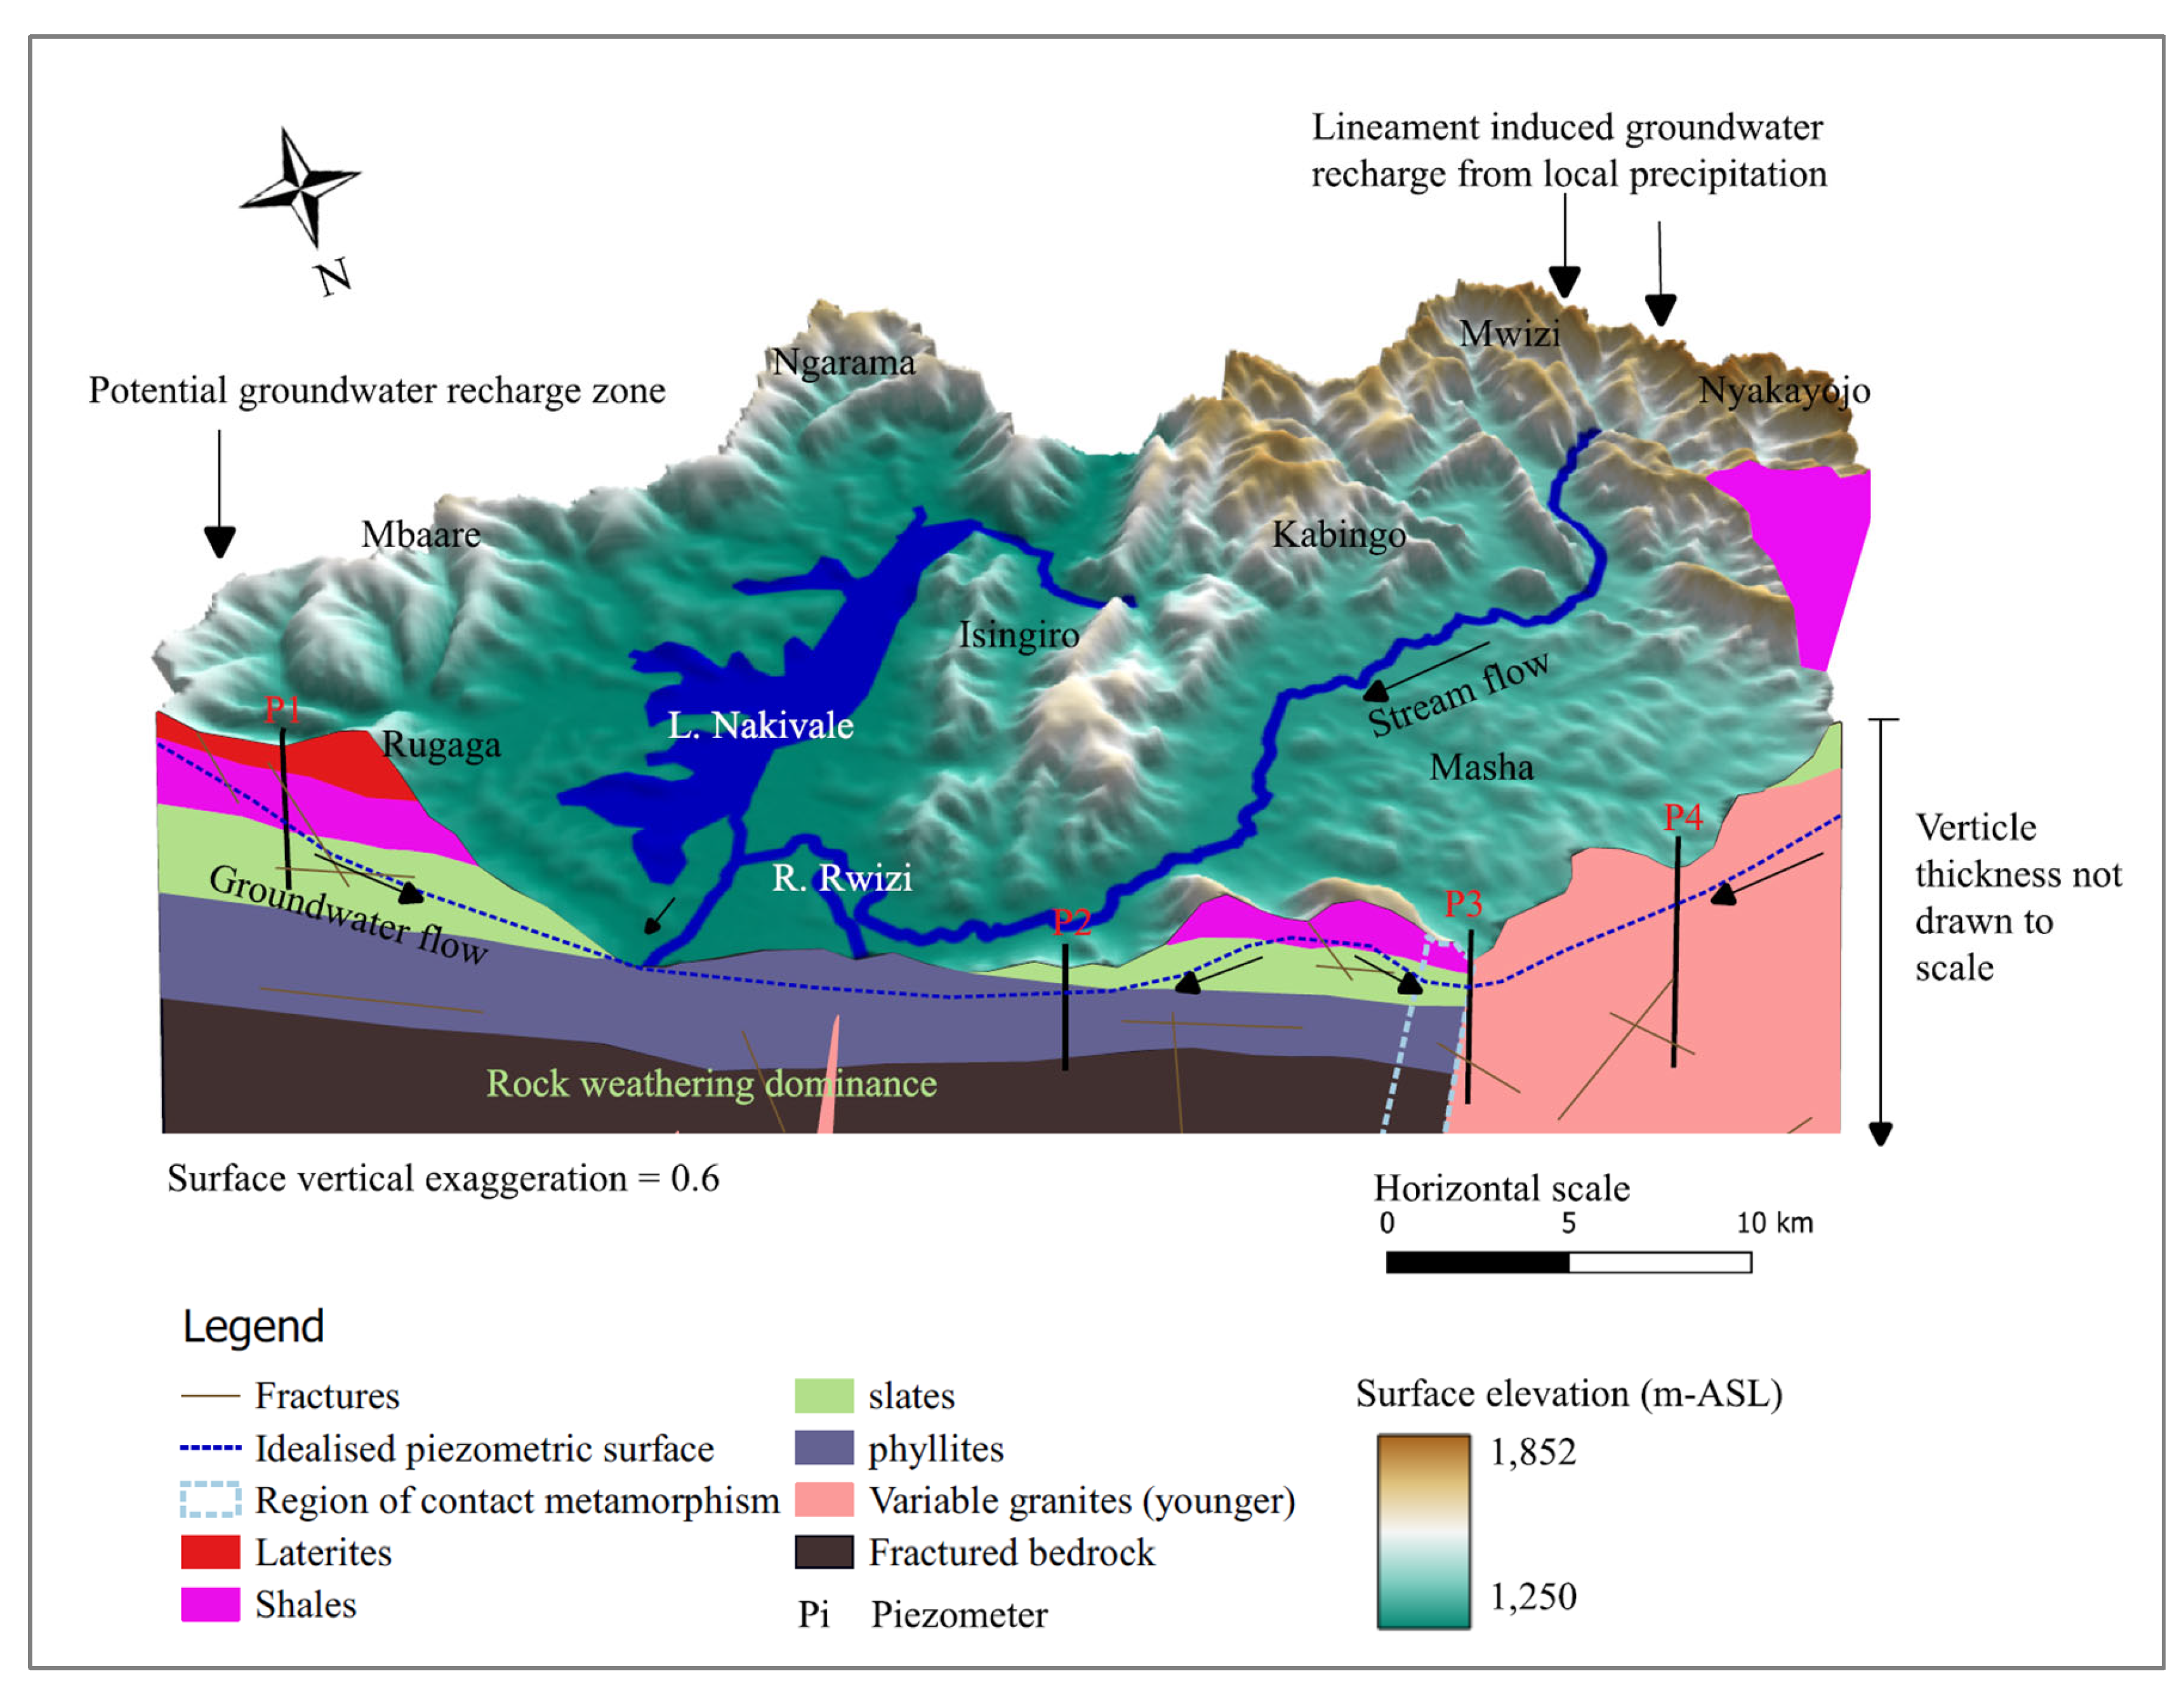
Groundwater recharge zones correlate to topographically high areas characterized by a network of lineament features which facilitate groundwater infiltration into the underlying aquifers. Groundwater generally flows from these elevated regions with high hydraulic gradients to discharge areas situated within lowlands of the study area. Additionally, these zones exhibit low Cl/Br ratios. According to [66], areas with a low Cl/Br ratio may signify active groundwater recharge zones. The low Cl/Br ratio in areas close to Lake Nakivale may be attributed to preferential organic adsorption of chloride [67].
Figure 13.
Conceptual site model showing major groundwater recharge areas, hydro-stratigraphy and geological structures in Nakivale sub-catchment.
Figure 13.
Conceptual site model showing major groundwater recharge areas, hydro-stratigraphy and geological structures in Nakivale sub-catchment.
3.9. Implications to Water Resources Management
The Ministry of Water and Environment plays a crucial role in ensuring the sustainable management of groundwater resources in Uganda. Groundwater serves as a source of water for agricultural, domestic, and industrial purposes, contributing significantly to economic growth and development within the study area and the region at large. As Uganda strives to achieve middle-income status by 2040, it is imperative that the Ministry and all stakeholders take immediate action to protect this invaluable resource. This study offers critical insights into the current state of groundwater resources, identifying key challenges and opportunities for enhanced management. The following recommendations are proposed to ensure the long-term sustainability of groundwater in the region.
A robust groundwater monitoring network should be established to continuously assess both water quality and quantity in the study area. Regular hydrochemical and isotopic analyses will allow for tracking changes over time and identifying emerging contamination sources. This approach has been successfully implemented in California, where extensive groundwater monitoring programs support effective water management [68];
To protect identified recharge areas from contamination and over-extraction, it is crucial to enforce land-use regulations and promote conservation practices. Controlling agricultural runoff, preventing industrial discharges, and encouraging reforestation in critical zones will help safeguard these areas. The Guangzhou Greenway Initiative in China serves as an example of how stringent land-use regulations and reforestation can protect and enhance groundwater recharge areas [69];
Community awareness programs should be developed to educate local populations on groundwater conservation and sustainable usage practices. Involving communities in monitoring activities fosters ownership and responsibility, which leads to better water management. The "Waterkeeper" movement in the USA and Canada has demonstrated how community engagement can significantly improve water quality and conservation efforts [68];
An integrated approach to water resource management is necessary, considering the interdependencies between surface and groundwater. A rigorous IWRM framework should address the needs of all water users while ensuring sustainable use. The Murray-Darling Basin Plan in Australia showcases how integrated management across states can promote long-term water sustainability [70];
Investing in infrastructure such as check dams, infiltration ponds, and wastewater treatment facilities is essential, particularly in urban and industrialized areas where contamination risks are higher. The state of Gujarat in India provides a successful example, where the construction of check dams and recharge wells has significantly improved groundwater levels and quality [71].
4. Conclusions
This study has comprehensively examined groundwater resources within the Nakivale sub-catchment in Isingiro district, Southwestern Uganda using both classical hydrochemistry and isotopic approaches.
The predominant groundwater type in the study area is Ca-SO4. The cationic facies are ordered by relative abundance as Ca>Mg>Na>K while the anionic species are ordered as SO4>HCO3>Cl. Groundwater hydrochemistry is primarily influenced by water-rock interaction processes, including the weathering of plagioclase and alkali feldspars, as well as mafic minerals. Calcium is mainly derived from the weathering of Ca-rich plagioclase feldspars and sulphate primarily from the oxidation of sulfide minerals like pyrite which are predominant in the study area. Key weathering processes identified include dissolution, hydrolysis, hydration, and carbonation.
Groundwater recharge and flow in the study area is primarily influenced by the topographical makeup. High recharge zones are found in elevated areas with dense lineament networks which facilitate groundwater infiltration into underlying aquifers. These recharge areas include Birere, Nyakayonjo, Mwizi, Nyamuyanja, Kabingo, Rugaga, and the southern parts of Rugaga. Additionally, there is evidence of the Chebotarev sequence along groundwater flow lines (
Figure 5). This sequence involves the transitioning of groundwater dominant hydrochemical facies from bicarbonate to chloride dominance.
Isotopic analysis reveals that the groundwater primarily originates from local precipitation. Tritium data indicate the presence of both recent and older groundwater, with some samples from Masha, Kaberebere and Kakamba suggesting groundwater age likely older than 20 years. The tritium analysis results are consistent with the findings of [29] who identified paleo water in the region characterized by very low tritium values (less than 0.4 TU).
Supplementary Materials
The following supporting information can be downloaded at the website of this paper posted on Preprints.org, Figure S1: Mineral saturation index vs electrical conductivity; Figure S2: Piper diagram showing the groundwater types within the study area; Figure S3: Partial pressure of carbon dioxide vs pH bivariate plot; Figure S 1: D-excess variation in precipitation received within the study area for MAM rainy season (Data source: GNIP website); Figure S 2: D-excess variation in precipitation received within the study area for SON rainy season (Data source: GNIP website); Figure S 3: Soil type map for Nakivale sub-catchment; Figure S 4: Histogram showing D-Excess values for local precipitation received within Nakivale sub-catchment; Figure S 5: A box plot showing descriptive statistics of D-excess for local precipitation received in Nakivale sub-catchment; Figure S 6: Paired student’s t-test results for MAM and SON D-excess values for rainfall received within Nakivale sub-catchment; Figure S 7: Hydrochemical analysis laboratory certificate; Figure S 8: Stable isotope analysis laboratory certificate; Figure S 9: Tritium analysis laboratory certificate; Table S 1: Summary of the used precipitation data obtained from 11 isotope stations on the Global Network of Isotopes in Precipitation (GNIP) website; Table S 2: Charge balance error (CBE) computation for the analysed hydrochemical Samples; Table S 3: Correlation matrix for analysed hydrochemical species; Table S 4: Stable isotopes in precipitation data for Masaka Station in Uganda; Table S 5: Groundwater types for each sample: classified based on dominant ions in meq/L.
Author Contributions
Conceptualization, E.N.H. and R.M.K.; methodology, E.N.H. and R.M.K.; software, E.N.H.; validation, E.N.H. and R.M.K.; formal analysis, E.N.H. and R.M.K.; investigation, E.N.H.; resources, E.N.H. and R.M.K.; data curation, E.N.H. and R.M.K.; writing—original draft preparation, E.N.H.; writing—review and editing, E.N.H., R.M.K. and C.M.; visualization, E.N.H.; supervision, R.M.K.; project administration, E.N.H.; funding acquisition, E.N.H., R.M.K. and C.M. All authors have read and agreed to the published version of the manuscript.
Funding
This research was funded by the International Atomic Energy Agency (IAEA) under the RAF7021 project, in partnership with the Ministry of Water and Environment of Uganda. The research was conducted during a fellowship (Code: EVT2304936-0001-UGA) hosted by the University of Strathclyde, United Kingdom, from October 9, 2023 to November 8, 2024.
Data Availability Statement
All the data used in this research has been provided within the attached supporting information.
Acknowledgments
The authors gratefully acknowledge IAEA TC Project RAF7021 for the invaluable financial support extended throughout all stages of the project's implementation. The authors are also thankful for the financial support of the Scottish Government under the Climate Justice Fund Water Futures Program (research grant HN-CJF-03), awarded to the University of Strathclyde (Prof. R.M. Kalin PI).
Conflicts of Interest
The authors declare no conflicts of interest.
References
- Ministry of Water and Environment. National Water Resources Assessment Report: Uganda 2013. Kampala, Uganda: Ministry of Water and Environment; 2013.
- African Union. The African Union Commission Agenda 2063 Framework Document. African Union. 2015;1–172.
- United Nations Environment Programme. Goal 6: Clean Water and Sanitation [Internet]. 2024. Available from: https://www.unep.org/explore-topics/sustainable-development-goals/why-do-sustainable-development-goals-matter/goal-6 (accessed on 23-05-2024). (accessed on 23-05-2024).
- National Planning Authority. The National Development Plan 4 Strategic Direction. Kampala: Ministry of Finance, Planning and Economic Development, Kampala, Uganda. 2024.
- Ministry of Water and Environment. Baseline Groundwater Assessment Report-National Groundwater Study. Ministry of Water and Environment, Kampala, Uganda. Ministry of Water and Environment (2011), National Water Resources Assessment of Uganda. Uganda; 2022.
- Ministry of Water and Environment. National Groundwater Resources Availability and Demand Asssessment for Uganda. Kampala; 2023.
- Owor M, Taylor R, Mukwaya C, Tindimugaya C. Groundwater/surface-water interactions on deeply weathered surfaces of low relief: Evidence from Lakes Victoria and Kyoga, Uganda. Hydrogeol J. 2011, 19. [CrossRef]
- Kalin RM, Long A. Application of hydrogeochemical modelling for validation of hydrologic flow modelling in the Tucson Basin Aquifer, Arizona. USA Mathematical Models and their Applications to Isotope Studies in Groundwater Hydrology IAEA. 1994;TECDOC-777, Ch. 8:209–54.
- Banda LC, Kalin RM, Phoenix V. Isotope hydrology and hydrogeochemical signatures in the Lake Malawi Basin: a multi-tracer approach for groundwater resource conceptualisation. Water 2024, 16, 1587. [Google Scholar] [CrossRef]
- Shuaibu A, Kalin RM, Phoenix V, Banda LC, Lawal IM. Hydrogeochemistry and Water Quality Index for Groundwater Sustainability in the Komadugu-Yobe Basin, Sahel Region. Water 2024, 16, 601. [CrossRef]
- Fraser CM, Kalin RM, Rivett MO, Nkhata M, Kanjaye M. A national approach to systematic transboundary aquifer assessment and conceptualisation at relevant scales: A Malawi case study. J Hydrol Reg Stud. [CrossRef]
- Owor M, Muwanga A, Tindimugaya C, Taylor RG. Hydrogeochemical processes in groundwater in Uganda: a national-scale analysis. Journal of African Earth Sciences 2021, 175. [CrossRef]
- Belkhiri L, Boudoukha A, Mouni L. A multivariate statistical analysis of groundwater chemistry data. Int J Environ Res. 2011, 5. [Google Scholar]
- Asmael NM, Huneau F, Garel E, Celle-Jeanton H, Coustumer P Le, Dupuy A, Hamid S. Origin and recharge mechanisms of groundwater in the upper part of the Awaj River (Syria) based on hydrochemistry and environmental isotope techniques. Arabian Journal of Geosciences 2015, 8. [CrossRef]
- Pradhan RM, Behera AK, Kumar S, Kumar P, Biswal TK. Recharge and Geochemical Evolution of Groundwater in Fractured Basement Aquifers (NW India): Insights from Environmental Isotopes (δ18O, δ2H, and3H) and Hydrogeochemical Studies. Water 2022, 14. [CrossRef]
- Ministry of Water and Environment. Rwizi Catchment Management Plan. Kampala, Uganda: Ministry of Water and Environment; 2020.
- Uganda Bureau of Statistics. Census Population Counts (2002 and 2014) by Region, District, and Mid-Year Population Projections (2015-2021) [Internet]. 2023. Available from: https://www.ubos.
- Bjørkhaug, I. Revisiting the Refugee–Host Relationship in Nakivale Refugee Settlement: A Dialogue with the Oxford Refugee Studies Centre. J Migr Hum Secur. 2020, 8. [Google Scholar] [CrossRef]
- Walekhwa AW, Conlan AJ, Atim SA, Ademun AR, Hasahya E, Wood JL, Mugisha L. Exploring community-based reporting of livestock abortions for Rift Valley Fever surveillance in Uganda: A pilot study. medRxiv. 2025, 2024–2025. [CrossRef]
- Fletcher, RD. THE GENERAL CIRCULATION OF THE TROPICAL AND EQUATORIAL ATMOSPHERE. Journal of Meteorology 1945, 2. [Google Scholar] [CrossRef]
- Nagudi, B. Status of Geological Resources in Uganda. Report for the Embassy of the Republic of Korea in Uganda. Kampala: Embassy of the Republic of Korea in Uganda; 2011.
- Doornkamp, JC. The Role of Inselbergs in the Geomorphology of Southern Uganda. Transactions of the Institute of British Geographers 1968. [Google Scholar] [CrossRef]
- Stheeman, HA. Various Phases of Folding—Nature of Contact—Manner of Intrusion. In: The Geology of Southwestern Uganda. 1932.
- Combe AD, Holmes A. The Kalsilite-bearing Lavas of Kabirenge and Lyakauli, South-West Uganda. Transactions of the Royal Society of Edinburgh 1947, 61. [CrossRef]
- McMaster, DN. Change of Regional Balance in the Bukoba District of Tanganyika. Geogr Rev. 1960, 50. [Google Scholar] [CrossRef]
- Huang CC, Yeh HF, Lin HI, Lee ST, Hsu KC, Lee CH. Groundwater recharge and exploitative potential zone mapping using GIS and GOD techniques. Environ Earth Sci. 2013, 68. [Google Scholar] [CrossRef]
- Taylor RG, Howard KWF. Post-Palaeozoic evolution of weathered land surfaces in Uganda by tectonically controlled deep weathering and stripping. Geomorphology 1998, 25, 173–192. [Google Scholar] [CrossRef]
- Tindimugaya, C. Groundwater flow and storage in weathered crystalline rock aquifer systems of Uganda: evidence from environmental tracers and aquifer responses to hydraulic stress. UCL (University College London; 2008.
- Tindimugaya C, Gaye CB. Use of isotopes in the management of Kisoro town water supply, Uganda (No. IAEA-CN–104). 2003.
- Leeder, MR. Grain properties. In: Sedimentology. 1982.
- Williams, M. THE NILE BASIN: Quaternary Geology, Geomorphology and Prehistoric Environments. The Nile Basin: Quaternary Geology, Geomorphology and Prehistoric Environments. 2019.
- Anderson W, Glauber J, Mamun A, You L, Thurlow J, Jamali A. Presentations for Implications of El Niño 2023/24 for Africa South of the Sahara. 2023.
- Singh M, Ouedraogo M, Kagabo D. El Niño 2023-2024 status and its possible impact on food security in African continent. 2023.
- Maliva RG, Coulibaly K, Guo W, Missimer TM. Confined Aquifer Loading: Implications for Groundwater Management. Ground Water 2011, 49. [CrossRef]
- Broekaert JAC. Inductively coupled plasmas in analytical atomic spectrometry, edited by A. Montaser and D.W. Golightly. TrAC Trends in Analytical Chemistry. 1988, 7.
- Hou, X. Liquid scintillation counting for determination of radionuclides in environmental and nuclear application. Journal of Radioanalytical and Nuclear Chemistry 2018, 318. [Google Scholar] [CrossRef]
- Piper, AM. A graphic procedure in the geochemical interpretation of water-analyses. Eos, Transactions American Geophysical Union 1944, 25. [Google Scholar] [CrossRef]
- Gibbs, RJ. Mechanisms controlling world water chemistry. Science (1979). 1970, 170. [Google Scholar] [CrossRef] [PubMed]
- Fentahun A, Mechal A, Karuppannan S. Hydrochemistry and quality appraisal of groundwater in Birr River Catchment, Central Blue Nile River Basin, using multivariate techniques and water quality indices. Environ Monit Assess. 2023, 195. [CrossRef]
- Lawley DN, Maxwell AE. Factor Analysis as a Statistical Method. The Statistician. 1962, 12. [Google Scholar]
- Larson TE, Buswell AM. Calcium Carbonate Saturation Index and Alkalinity Interpretations. Journal AWWA 1942, 34. [Google Scholar] [CrossRef]
- Koul VK, Davison W, Zutshi DP. Calcite supersaturation in some subtropical, Kashmir, Himalayan lakes. Hydrobiologia 1990, 192. [CrossRef]
- Myers, DE. Kriging Hydrochemical Data. In 1988. 1988.
- Oliver MA, Webster R. Kriging: A method of interpolation for geographical information systems. International Journal of Geographical Information Systems 1990, 4. [CrossRef]
- Belkhiri L, Tiri A, Mouni L. Spatial distribution of the groundwater quality using kriging and Co-kriging interpolations. Groundw Sustain Dev. 2020, 11. [CrossRef]
- Aladejana JA, Kalin RM, Hassan I, Sentenac P, Tijani MN. Origin and residence time of groundwater in the shallow coastal aquifer of eastern Dahomey basin, southwestern Nigeria, using δ18O and δD isotopes. Applied Sciences 2020, 10. [CrossRef]
- Craig, H. Isotopic variations in meteoric waters. Science (1979). 1961, 133. [Google Scholar] [CrossRef]
- Kendall C, McDonnell JJ. Isotope tracers in catchment hydrology. Isotope tracers in catchment hydrology. 1998. [Google Scholar]
- Lindsey BD, Jurgens BC, Belitz K. Tritium as an indicator of modern, mixed, and premodern groundwater age. Scientific Investigations Report 2019. [CrossRef]
- Schlosser P, Stute M, Dörr H, Sonntag C, Münnich KO. Tritium/3He dating of shallow groundwater. Earth Planet Sci Lett. 1988, 89. [CrossRef]
- Marandi A, Shand P. Groundwater chemistry and the Gibbs Diagram. Applied Geochemistry 2018, 97. [Google Scholar] [CrossRef]
- Chebotarev, II. Metamorphism of natural waters in the crust of weathering-1. Geochim Cosmochim Acta. 1955, 8. [Google Scholar] [CrossRef]
- Hilberg S, Brandstätter J, Glück D. CO2 partial pressure and calcite saturation in springs-useful data for identifying infiltration areas in mountainous environments. Environmental Sciences: Processes and Impacts. 2013, 15. [CrossRef]
- Mandalaparty P, Deo M, Moore J. Gas-compositional effects on mineralogical reactions in carbon dioxide sequestration. In: SPE Journal. 2011. [CrossRef]
- Chorley, RJ. The Role of Water in Rock Disintegration. In: Water, Earth, and Man. 2021.
- Zhang D, Xue T, Xiao J, Chai N, gui Gong S. Significant influence of water diversion and anthropogenic input on riverine sulfate based on sulfur and oxygen isotopes. J Hazard Mater. 2024, 461. [Google Scholar] [CrossRef]
- Fuge, R. Sources of halogens in the environment, influences on human and animal health. Environ Geochem Health 1988, 10. [Google Scholar] [CrossRef]
- Almasri, MN. Nitrate contamination of groundwater: A conceptual management framework. Environ Impact Assess Rev. 2007, 27. [Google Scholar] [CrossRef]
- Farmer, VC. Sources and speciation of aluminium and silicon in natural waters. Ciba Found Symp. 1986, 121. [Google Scholar] [CrossRef]
- Akpataku KV, Rai SP, Gnazou MDT, Tampo L, Bawa LM, Djaneye-Boundjou G, Faye S. Hydrochemical and isotopic characterization of groundwater in the southeastern part of the Plateaux Region, Togo. Hydrological Sciences Journal 2019, 64. [CrossRef]
- Coplen, T. Stable Isotope Hydrology: Deuterium and Oxygen-18 in the Water Cycle. Eos, Transactions American Geophysical Union 1982, 63. [Google Scholar] [CrossRef]
- Anyah RO, Semazzi FHM, Xie L. Simulated physical mechanisms associated with climate variability over Lake Victoria basin in East Africa. Mon Weather Rev. 2006, 134. [Google Scholar] [CrossRef]
- Beverly EJ, White JD, Peppe DJ, Faith JT, Blegen N, Tryon CA. Rapid Pleistocene desiccation and the future of Africa’s Lake Victoria. Earth Planet Sci Lett. 2020, 530. [CrossRef]
- Goodman SN, Royall R. Evidence and scientific research. Am J Public Health 1988, 78, 1568–1574. [Google Scholar] [CrossRef]
- Baskaran, M. Handbook of environmental isotope geochemistry. Vols. 1–2, Handbook of Environmental Isotope Geochemistry. 2012.
- Goldowitz, J. The chloride to bromide ratio as an environmental groundwater tracer, with a field study at the Wellton-Mohawk Irrigation and Drainage District. The University of Arizona; 1989.
- Naily W, Sudaryanto. Cl/Br Ratio to Determine Groundwater Quality. In IOP Conference Series: Earth and Environmental Science 2018.
- Norman ES, Cohen A, Bakker K. Water without borders? Canada, the United States, and shared waters. Water Without Borders? Canada, The United States, and Shared Waters. 2013.
- Chen S, Wang Y, Ni Z, Zhang X, Xia B. Benefits of the ecosystem services provided by urban green infrastructures: Differences between perception and measurements. Urban For Urban Green 2020, 54. [CrossRef]
- Hart, BT. The Australian Murray–Darling Basin Plan: challenges in its implementation (part 1). Int J Water Resour Dev. 2016, 32. [Google Scholar] [CrossRef]
- Chinnasamy P, Misra G, Shah T, Maheshwari B, Prathapar S. Evaluating the effectiveness of water infrastructures for increasing groundwater recharge and agricultural production - A case study of Gujarat, India. Agric Water Manag. 2015, 158. [CrossRef]
- Liap, Z. Environmental chemistry of trace elements and their biological effect. Chinese Environmental Science Press, Beijing. 1992, 320.
|
Disclaimer/Publisher’s Note: The statements, opinions and data contained in all publications are solely those of the individual author(s) and contributor(s) and not of MDPI and/or the editor(s). MDPI and/or the editor(s) disclaim responsibility for any injury to people or property resulting from any ideas, methods, instructions or products referred to in the content. |
© 2024 by the authors. Licensee MDPI, Basel, Switzerland. This article is an open access article distributed under the terms and conditions of the Creative Commons Attribution (CC BY) license (http://creativecommons.org/licenses/by/4.0/).

