Preprint
Article

Pharmacological Study of Amaranthus spinosus L. Root Extract on High-Fat Diet and Low-Dose Streptozocin-Induced Type 2 Diabetes Complications in Rats

Altmetrics

Downloads

78

Views

26

Comments

0

Submitted:

21 October 2024

Posted:

24 October 2024

You are already at the latest version

Alerts
Abstract
Diabetes complications appear with the severity of hyperglycemia and the age of the disease. In type 2 diabetes mellitus (T2DM), herbal medicines are also effective in reducing hyperglycemia and can be used for this purpose to manage complications. This study aimed to prove the effectiveness of Amaranthus spinosus root extract on type 2 diabetes (T2D) and its microvascular complications. A high-fat diet and low-dose streptozocin were used for 20 days to induce T2D syndrome and complications in rats. The validated animal models were treated orally with the dried hydroethanolic extract of A. spinosus for three weeks; then the hematological, biochemical, and histological markers were evaluated. The results showed that the extract at a dose of 500 mg/kg bw was effective against diabetes and its complications. This effectiveness was linked to a significant reduction (p < 0.0001) in basal blood glucose, tissue oxidative stress, serum cardiovascular and hepato-renal markers, and an improvement in insulin secretion and utilization. The protective activity of the extract against macular edema and renal fibrosis was confirmed by histopathological examinations. These findings prove that A. spinosus root extract contains bioactive compounds that may be useful in preventing or reversing diabetic retinopathy and renal fibrosis.
Keywords: 
Subject: Medicine and Pharmacology  -   Pharmacology and Toxicology

1. Introduction

Type 2 diabetes mellitus (T2DM) is the most common of all diabetes. It is a metabolic disorder of carbohydrate metabolism and is characterized by peripheral insulin resistance [1,2]. This insulin resistance leads to underutilization and overproduction of glucose, resulting in hyperglycemia [2]. T2DM is a silent disease that sooner or later develops into complications [3,4]. Retinopathy and nephropathy are complications that occur in diabetes as a result of microvascular damage that progressively leads to blindness, end-stage renal disease (ESRD), and death [4]. These two complications occur in people with T2DM with rates of approximately 25.2% and 40% respectively [5,6]. Despite preventive and corrective measures such as regular physical activity, a healthy and balanced diet, and strict maintenance of blood glucose, cholesterol and blood pressure around normal, diabetes progresses with duration and age toward complications [4,7,8]. This has led to the search for new therapies that can reverse these complications. Among conventional antidiabetic drugs, no molecule is available to prevent progression to complications [9,10]. However, medicinal plants are replete with several pharmacological properties such as antidiabetic, antioxidant, anti-inflammatory and antilipidemic activity; and can be used against complications induced by diabetes [11,12,13].
Amaranthus spinosus L. is a medicinal plant belonging to the Amaranthaceae family that grows almost everywhere, usually along roads, wastelands, railways, cultivated lands and gardens [14]. It is a nitrophilous plant that is drought-resistant and can even grow in arid conditions [14]. Previous works by some authors have revealed that Amaranthus spinosus has several pharmacological properties such as antioxidant, antilipemic, antiobesity, and antidiabetic activity [15,16,17,18]. However, studies targeting the roots of the plant and the complications of diabetes are lacking. Thus, we have previously carried out in vitro work on the roots of A. spinosus and data have proven the efficacy of the plant extract against high glucose-induced oxidative stress and complications [19,20]. But how effective could it be in an organism living with diabetes and its complications?
This study was therefore carried out in vivo in rats in a model of type 2 diabetes (T2D) with complications to prove the effectiveness of Amaranthus spinosus root extract on diabetes and its microvascular complications, notably retinopathy and nephropathy.

2. Results

2.1. Validated model

2.1.1. Basal Blood Glucose

Compared to normal control (NC), oral administration of fructose-lard (10 mL/kg twice daily) to rats did not cause a significant change in basal blood glucose. However, the injection of streptozocin (STZ) into rats on day 12 caused a significant (p < 0.0001) increase in blood glucose starting on day 15 and remained almost constant. This increase in blood glucose was approximately 6 times the basal blood glucose in rats (Figure 1A). The area under the curve (AUC), which evaluates the level of total glucose available in the blood, confirmed this significant increase (p < 0.0001) in basal blood glucose in pretreated rats (Figure 1B).

2.1.2. Serum Biochemical Markers for the Cardiovascular System

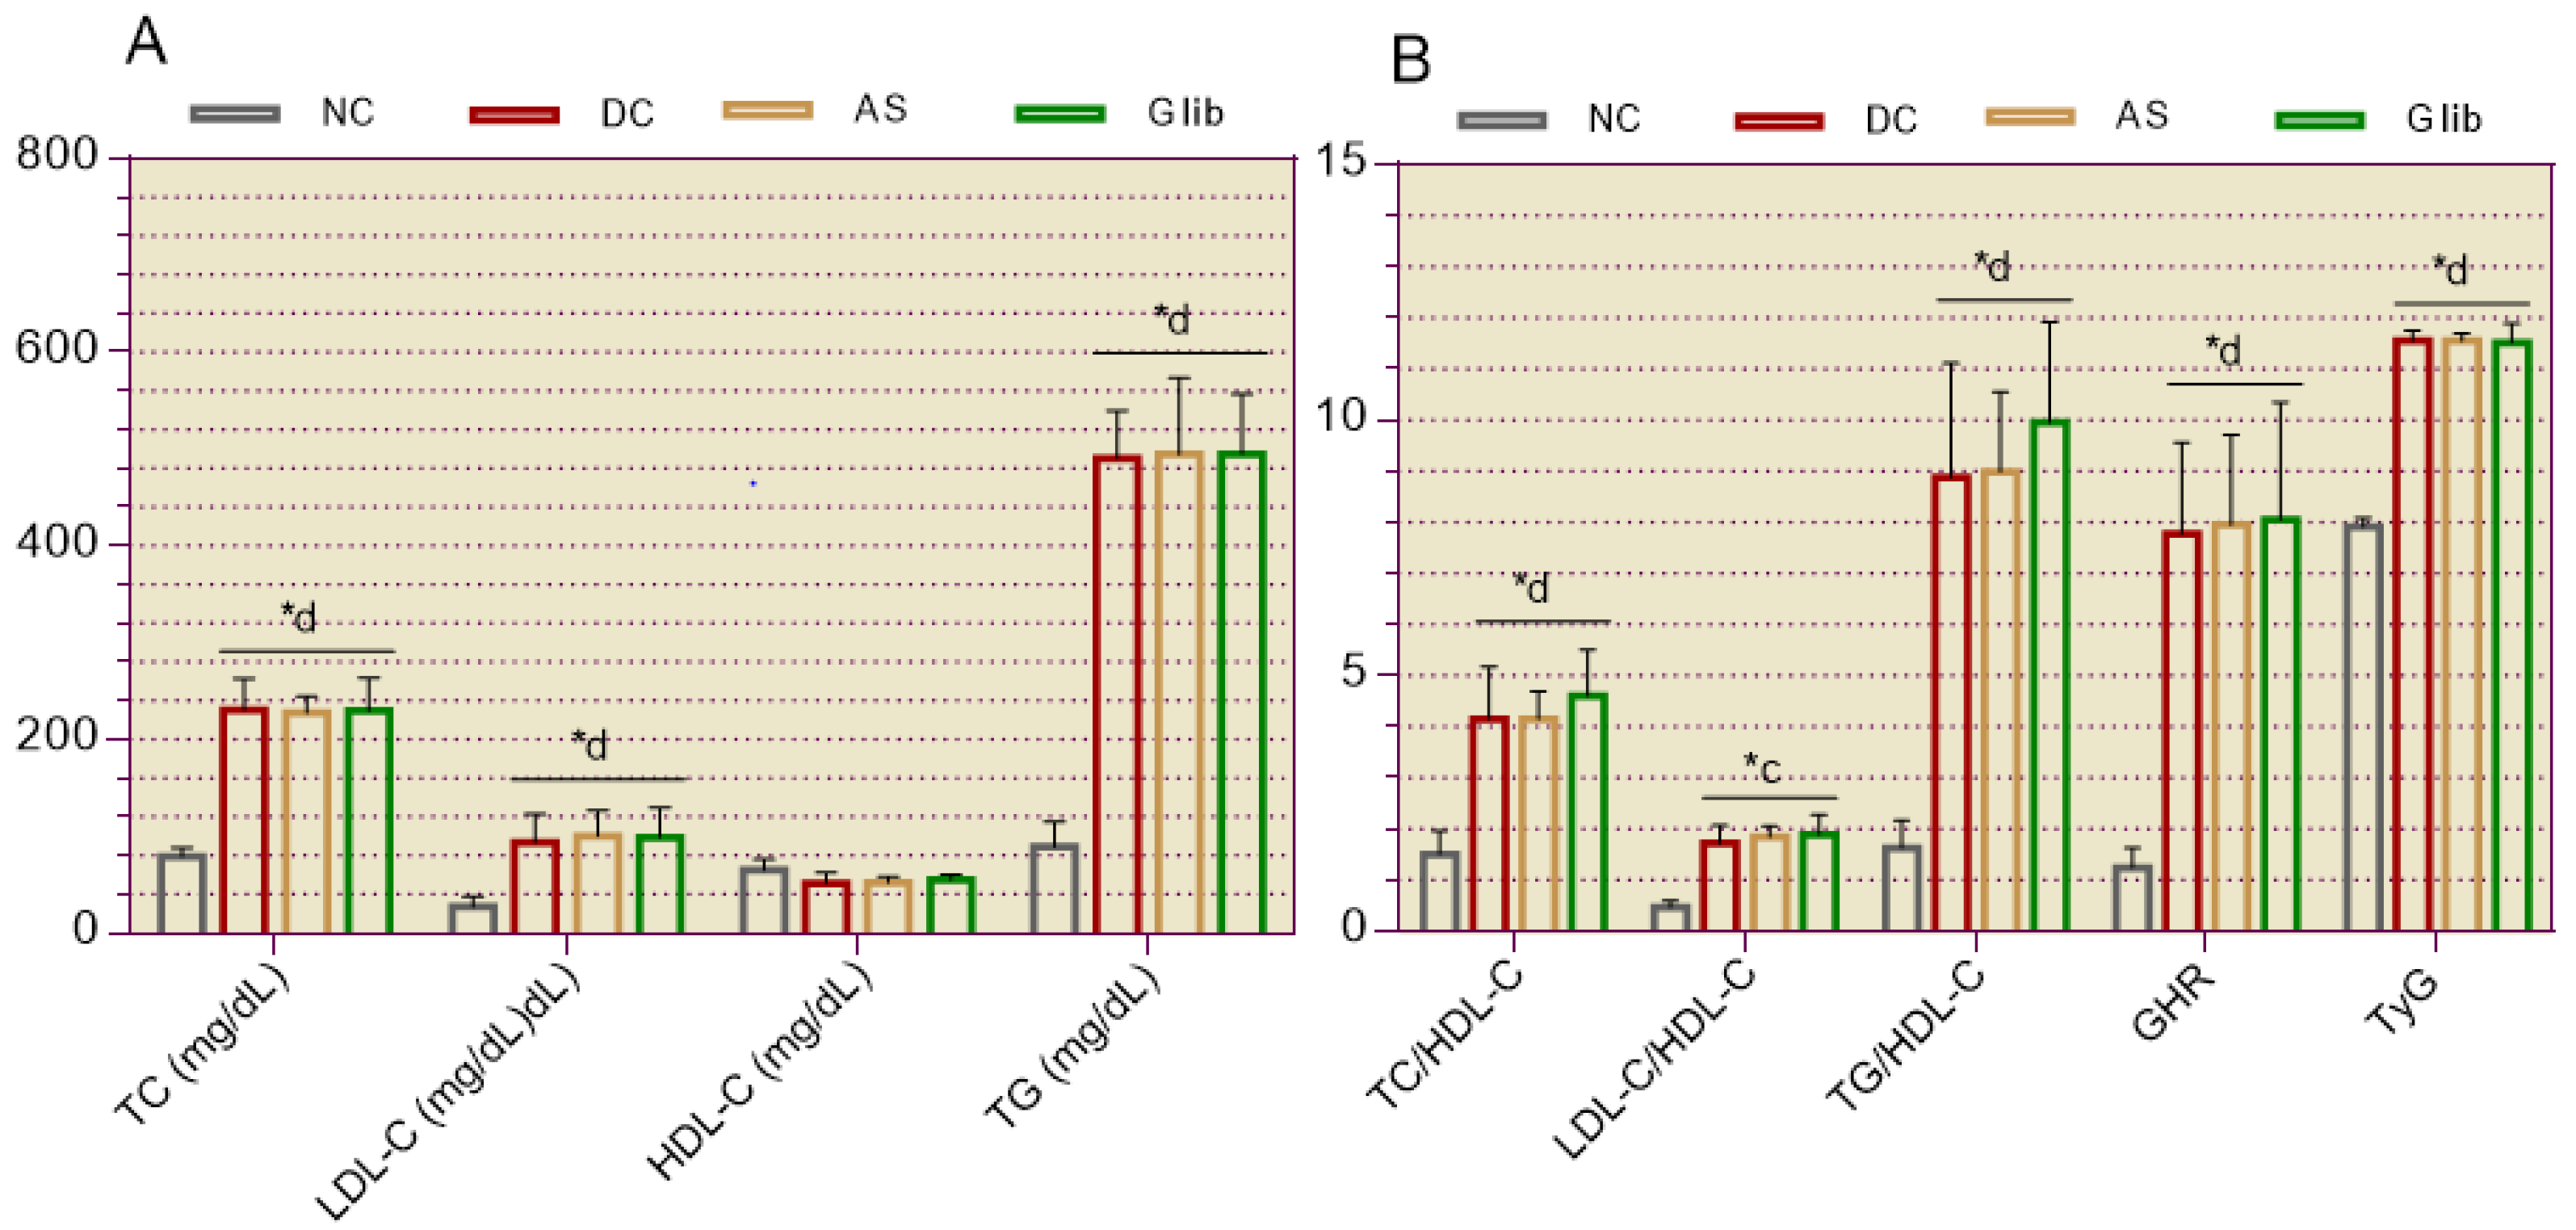
The groups (DC, AS, Glib) receiving oral fructose-lard showed a significant increase (p < 0.0001) in total cholesterol (TC), LDL cholesterol (LDL-C), and triglycerides (TG ), compared to the normal control group (NC). (Figure 2A). However, the pretreated groups showed a non-significant decrease (p > 0.05) in HDL cholesterol (HDL-C) compared to NC (Figure 2A). Compared to NC, all cardiovascular event prediction indices were significantly increased (p < 0.001) in pretreated rats (Figure 2B).

2.1.3. Serum Biochemical Markers for Hepatic and Cardiac

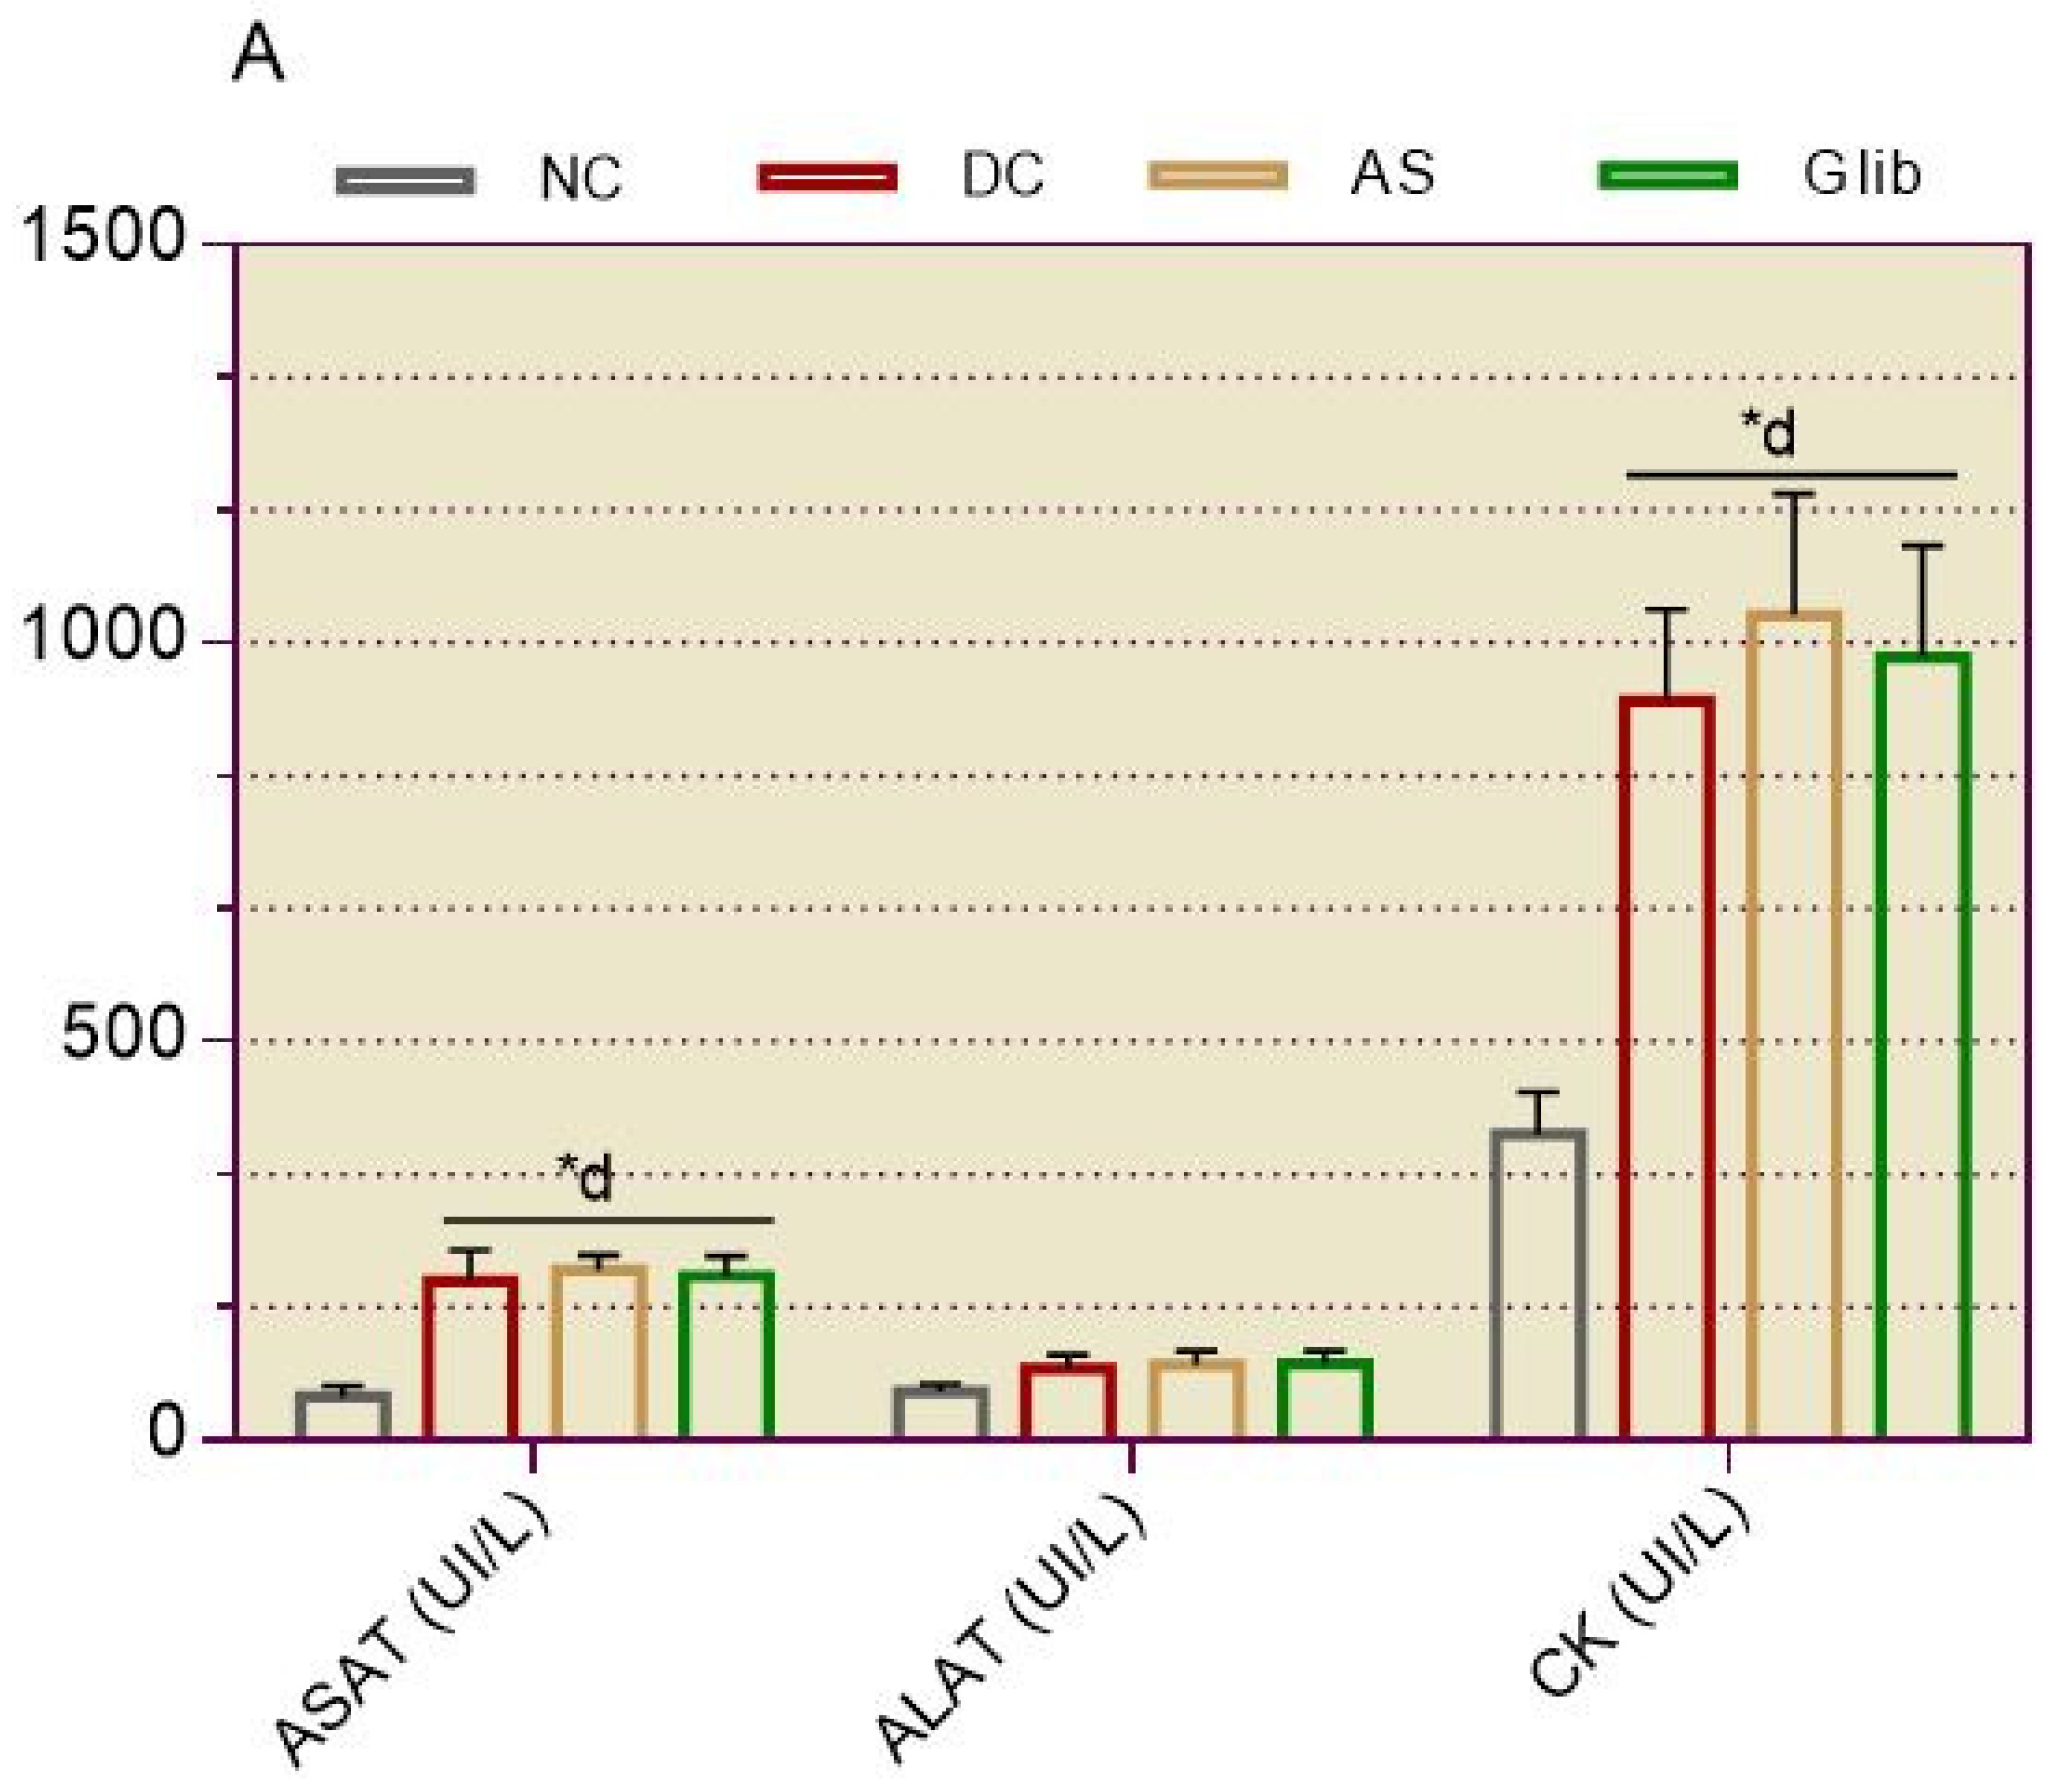
At the end of day 20, aspartate aminotransferase (ASAT), alanine aminotransferase (ALT), and creatine kinase (CK) were elevated in the serum of all pretreated groups, compared to NC. However, it was the increase in AST and CK that remained significant (p < 0.0001) in these groups (Figure 3).

2.1.4. Serum and Urine Biochemical Markers for Renal

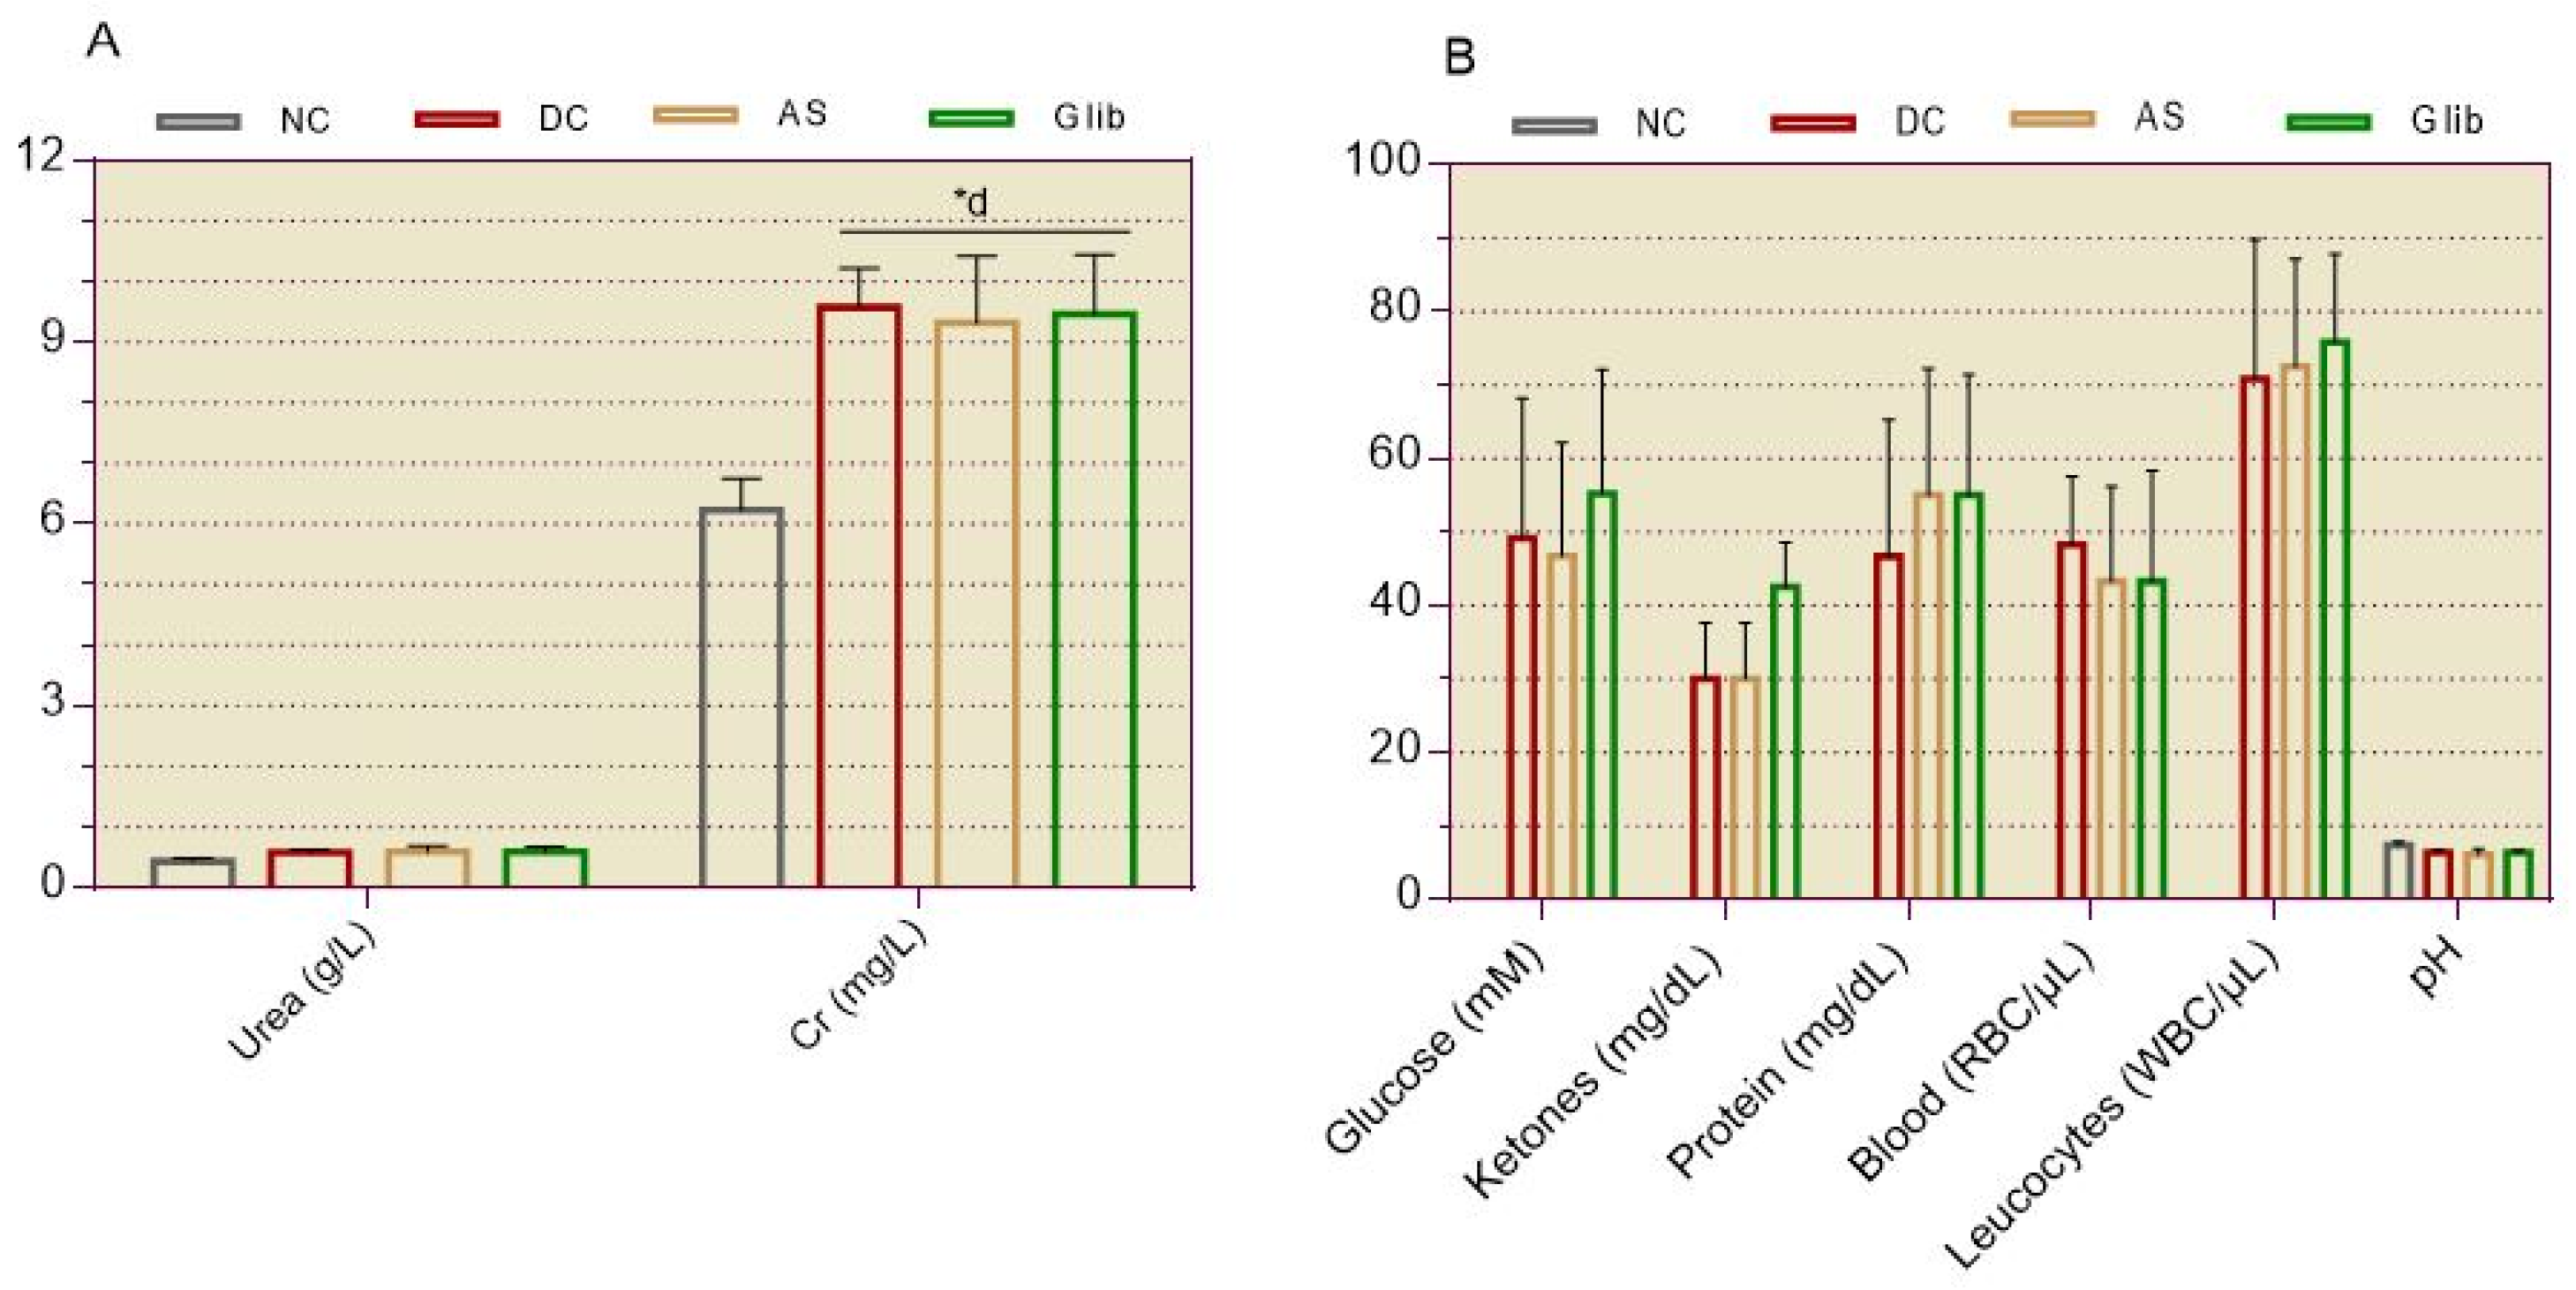
Compared to NC, all pretreated groups showed an increase in serum urea and creatinine levels. However, only the increase in creatinine remained significant (p < 0.0001) (Figure 4A). At the same time, glucose, ketones, proteins, blood, and leukocytes were present in the urine of the pretreated groups. In contrast, these urinary markers were absent in NC (Figure 4B).

2.2. Treatment

2.2.1. Diabetic Syndrome Markers

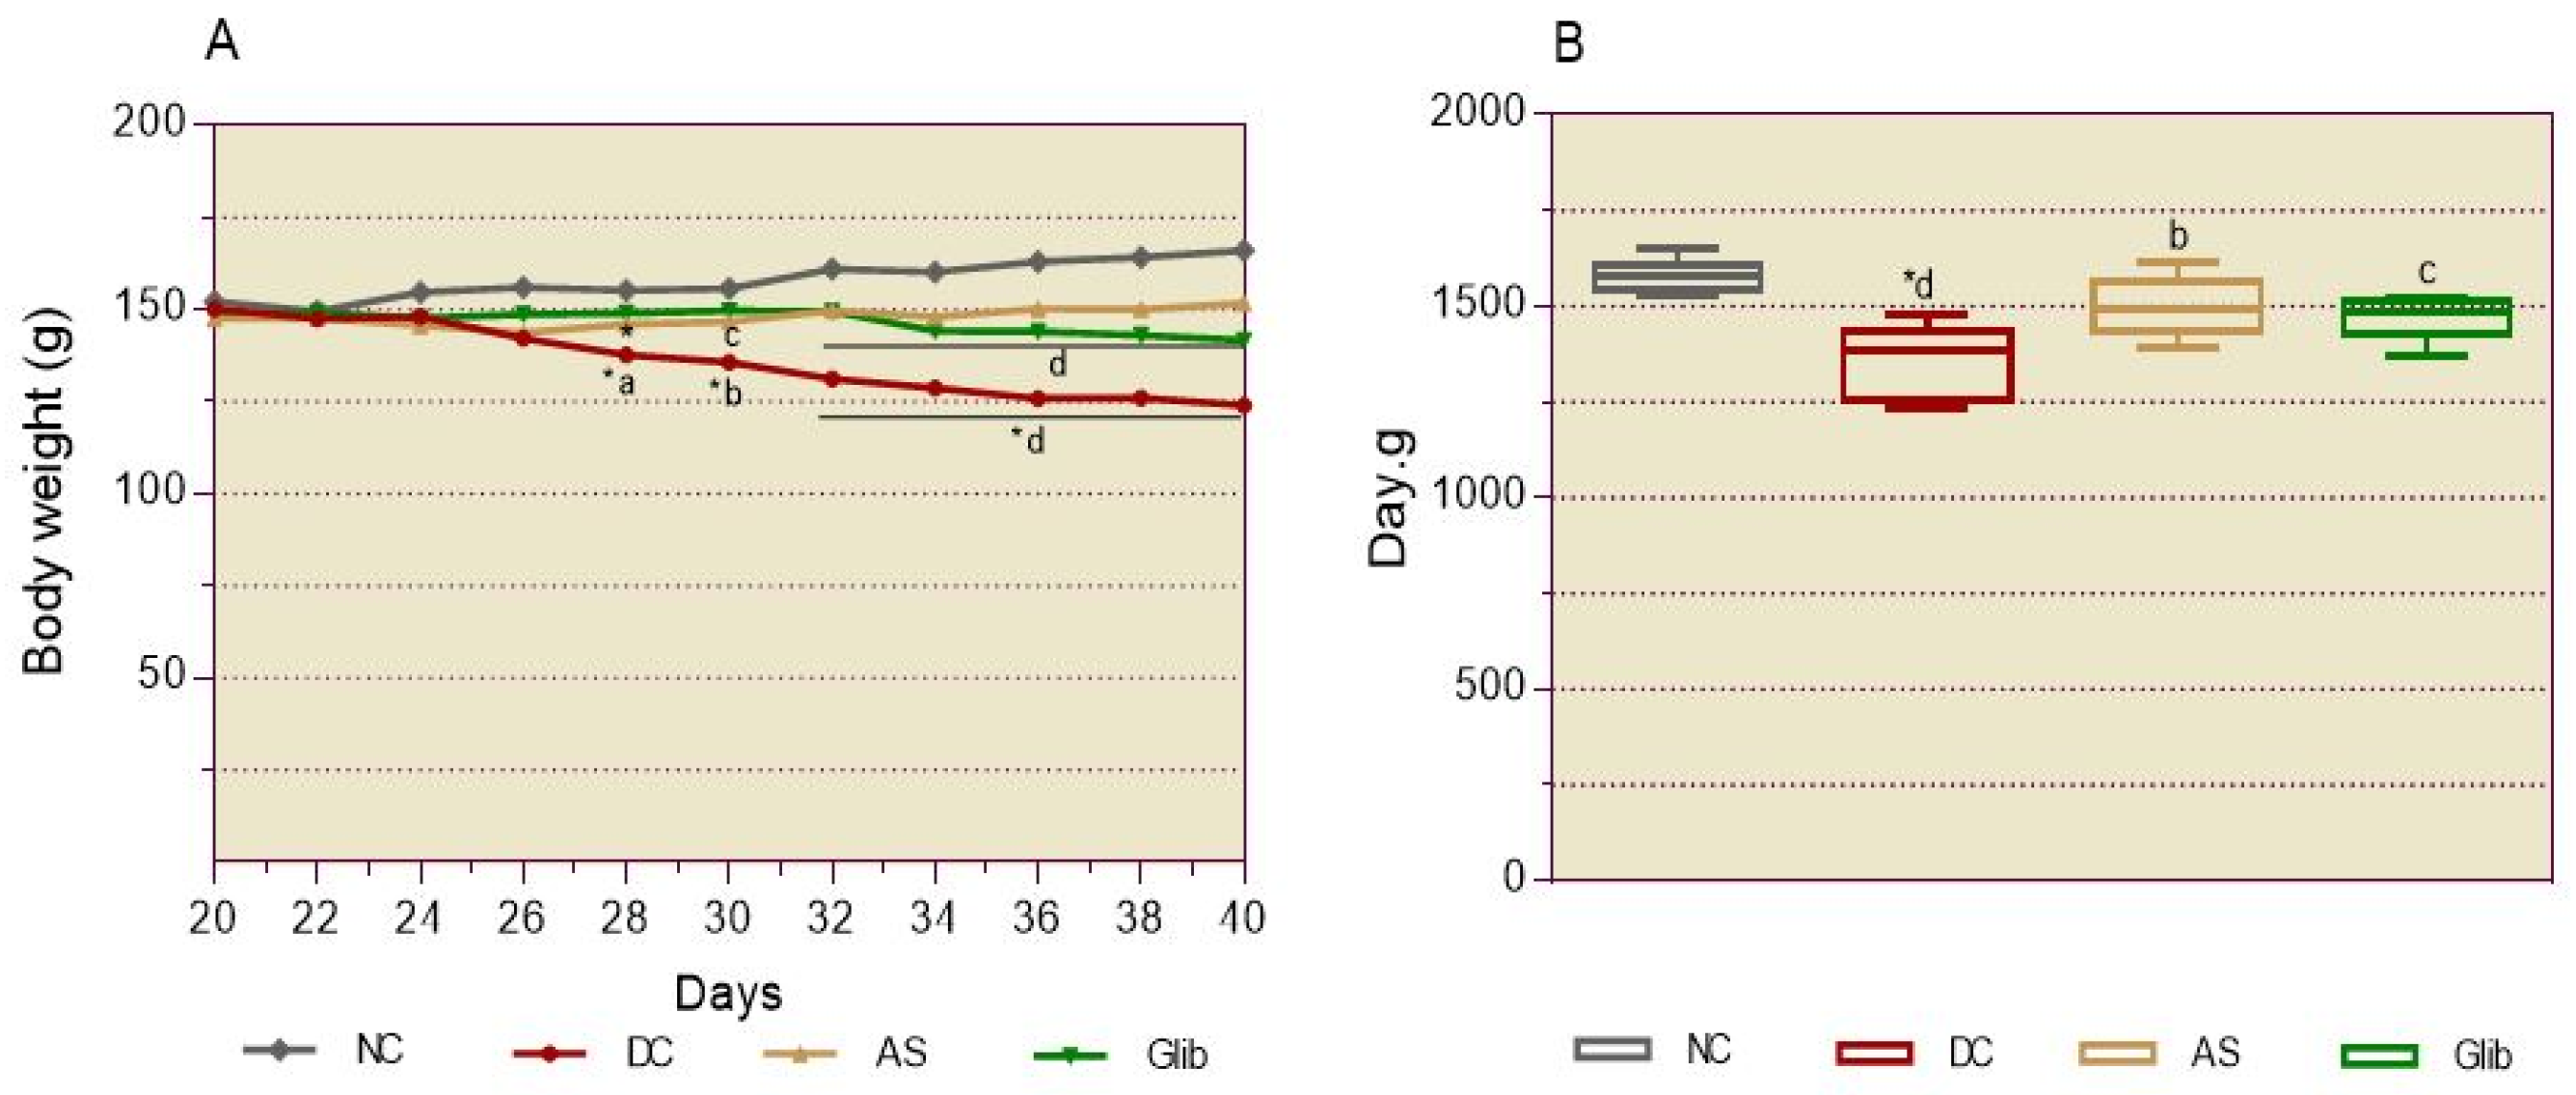
Daily recording of physical parameters showed significant (p < 0.0001) and progressive weight loss in the diabetic control group (DC) compared to the normal control group (NC) (Figure 5A). The extract and glibenclamide-treated group experienced significant (p < 0.0001) body weight gain during the last week of treatment completion, compared to the DC (Figure 5A). The area under the curve (AUC), expressed as daily weight loss or gain per g of body weight, confirmed a significant (p < 0.01–0.0001) decrease and increase in body weight respectively in the DC and treated groups during the three-week treatment (Figure 5B).
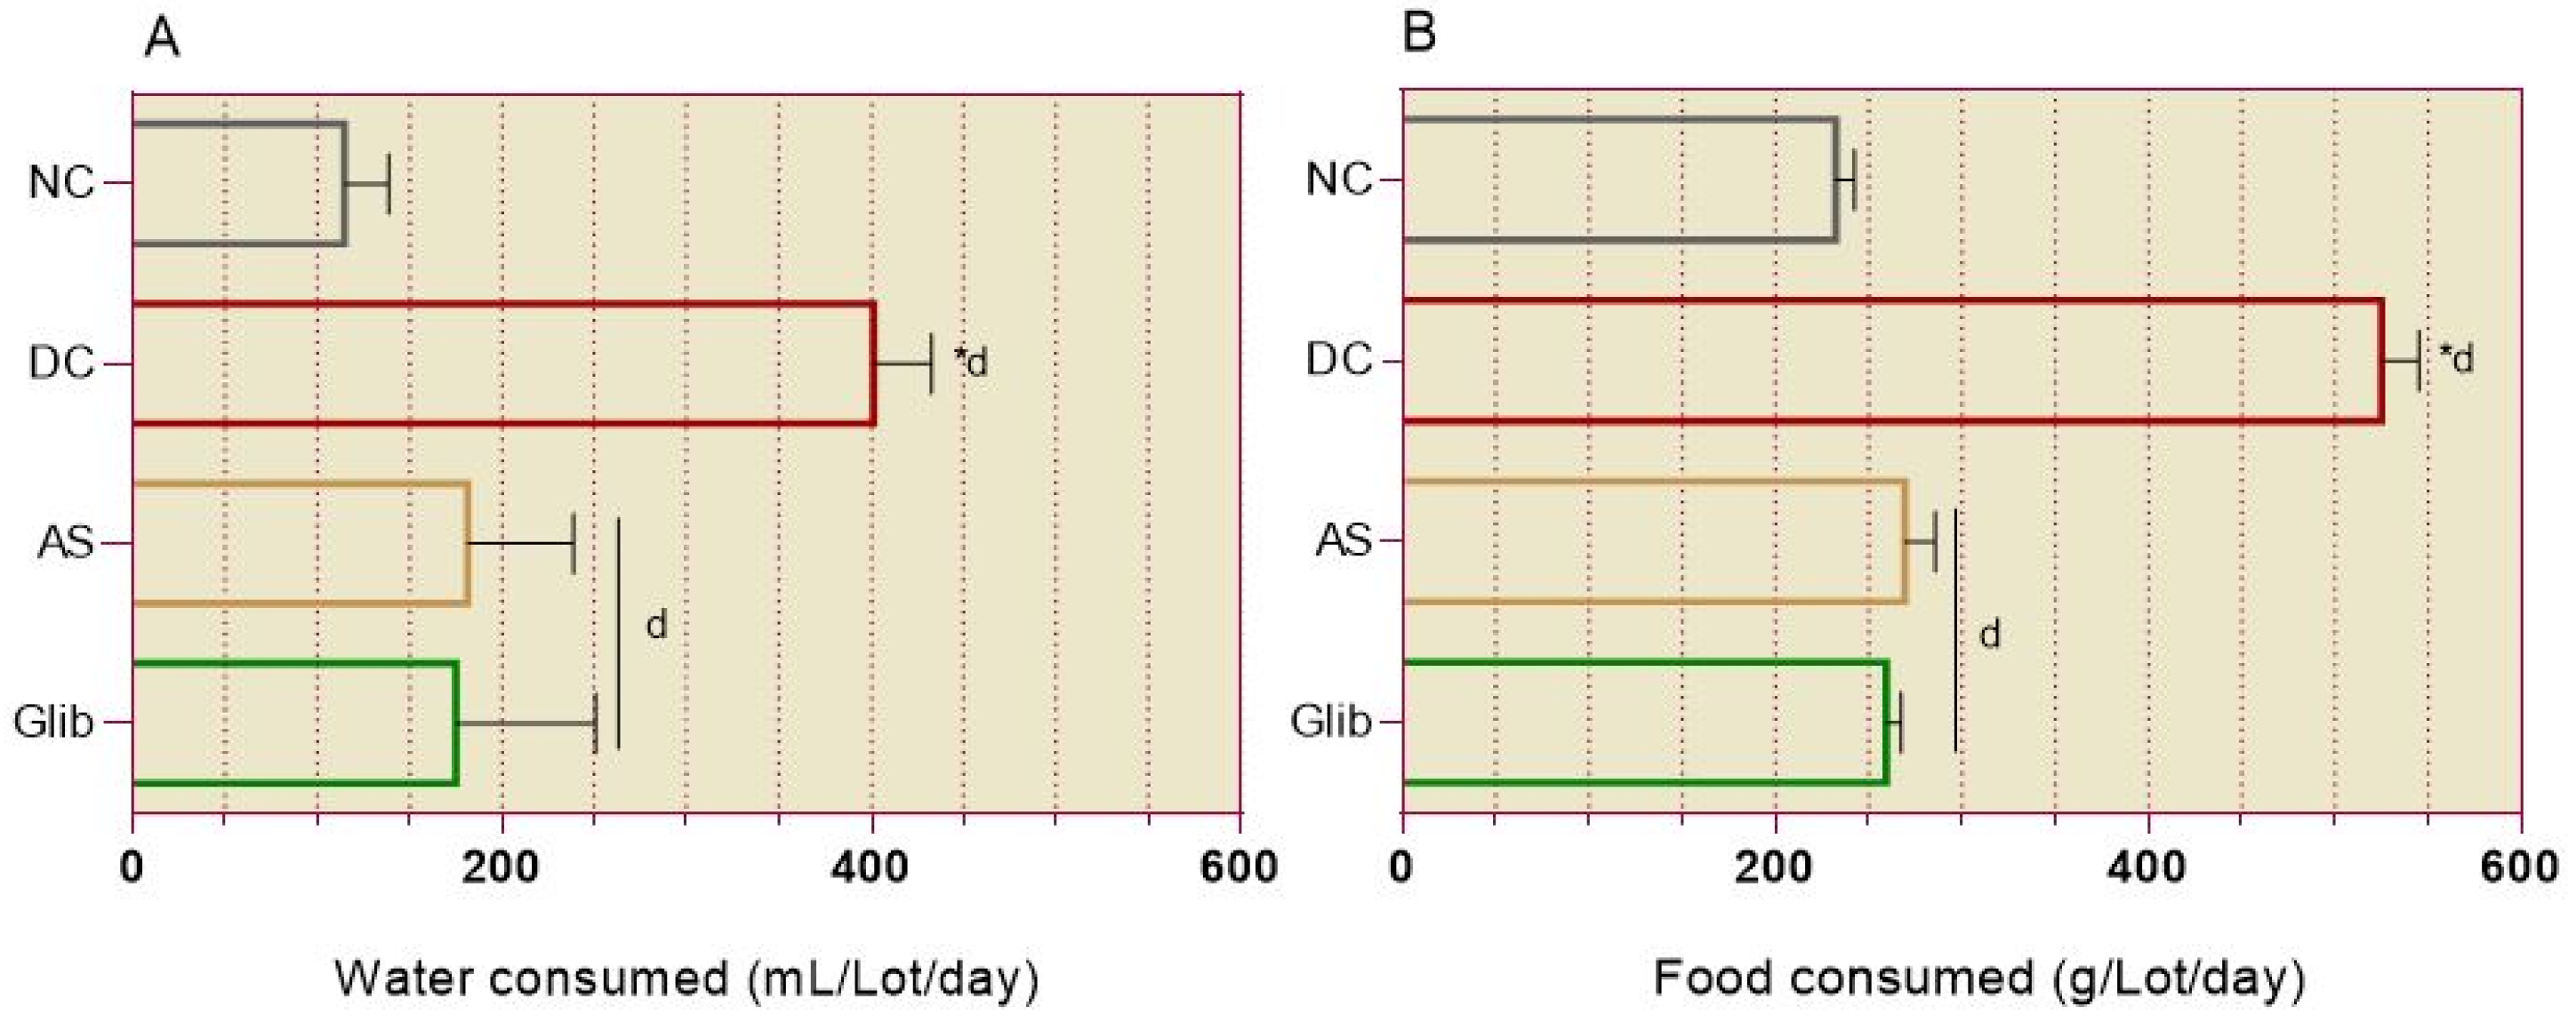
Compared to the NC, the DC experienced a significant (p < 0.0001) increase in water (Figure 6A) and food (Figure 6B) consumption. In the groups treated with the extract and glibenclamide, there was instead a significant (p < 0.0001) reduction in water and food consumption during the three weeks of treatment (Figure 6).

2.2.2. Basal Blood Glucose

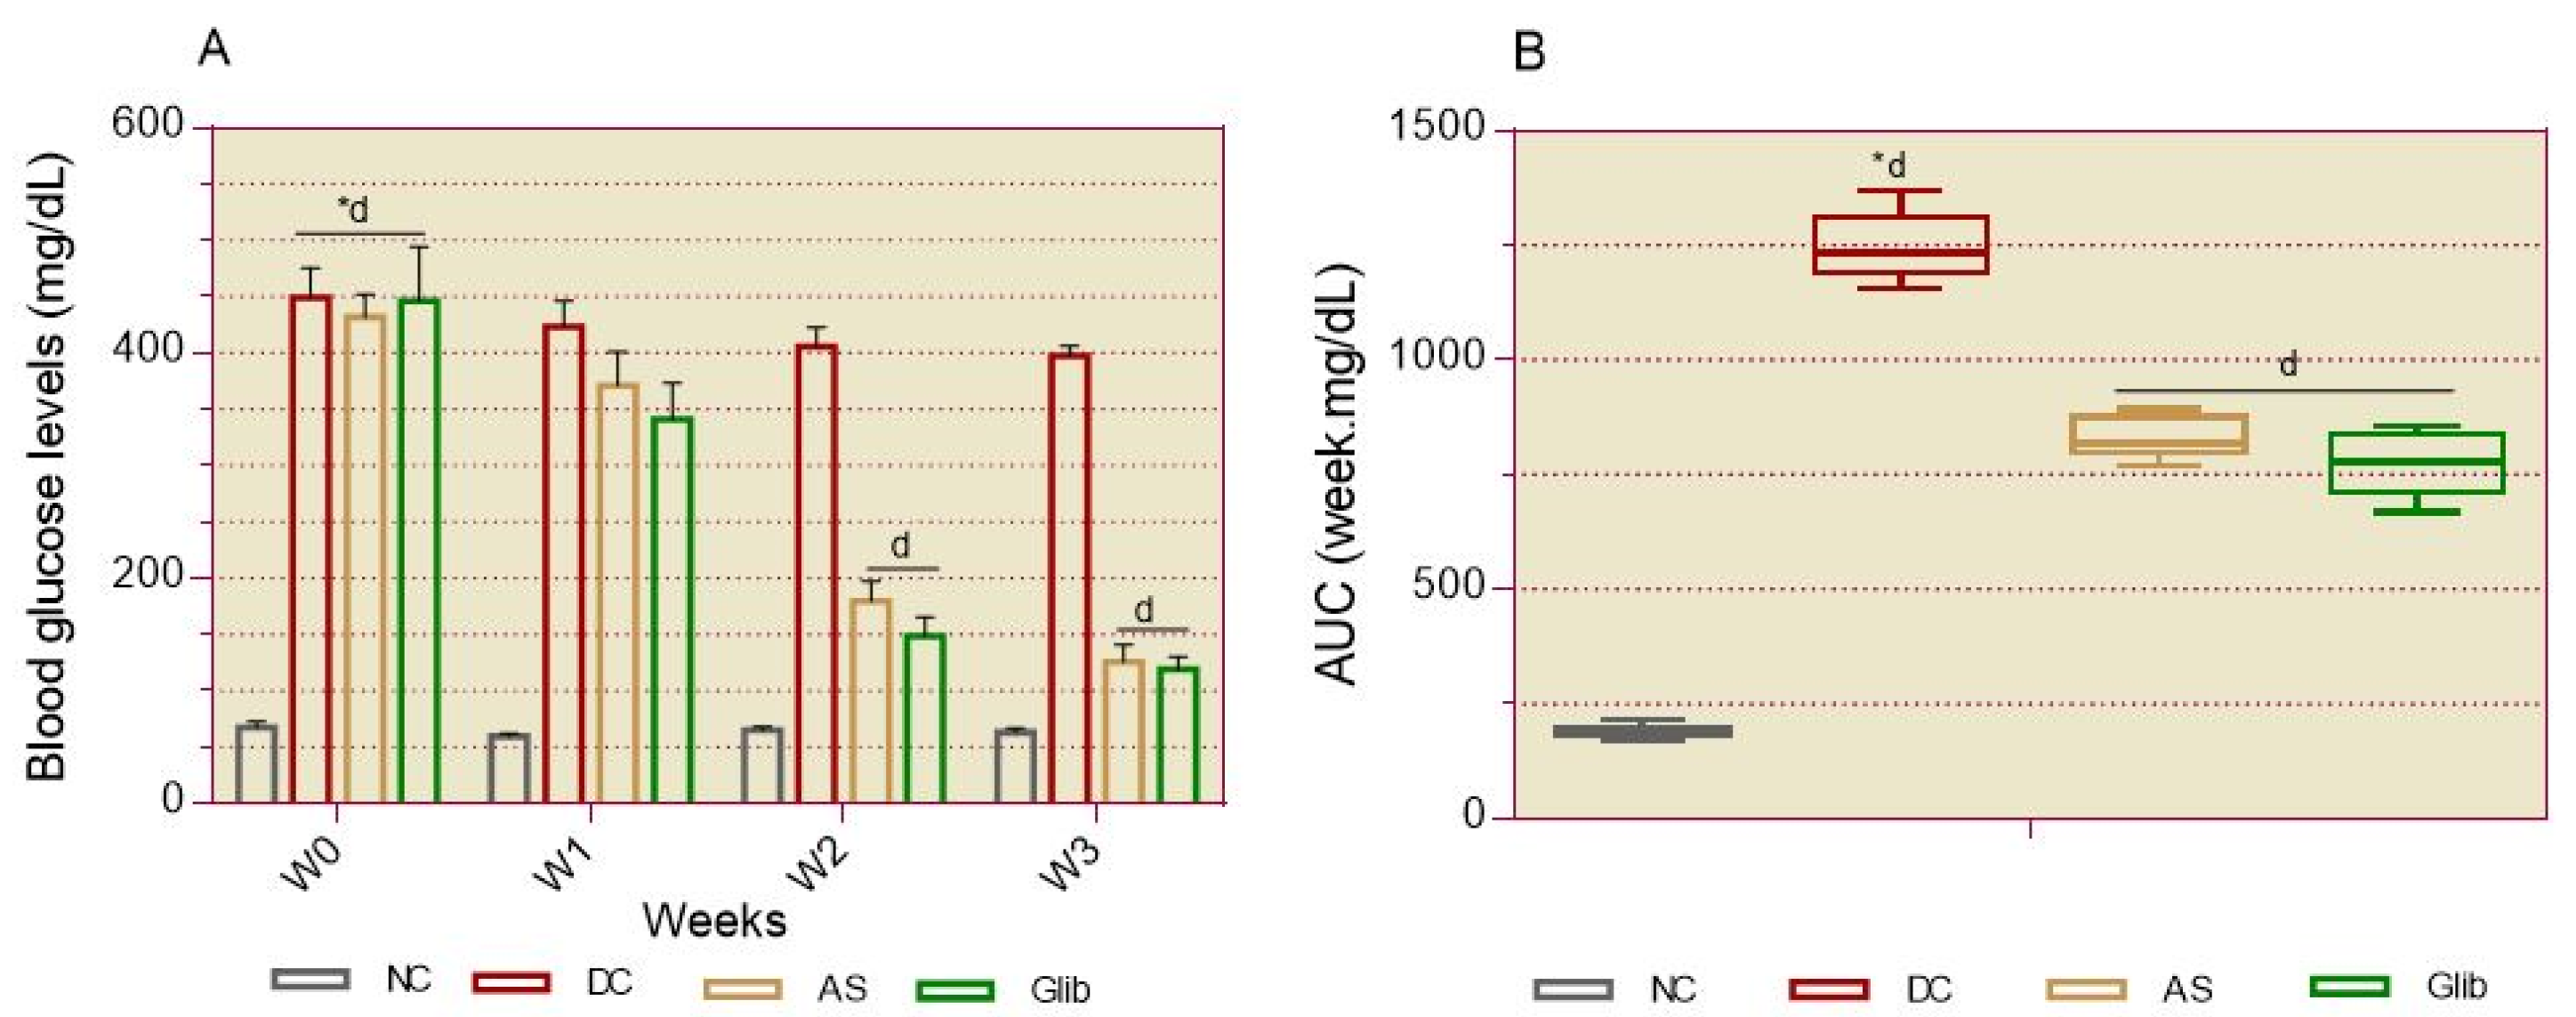
Basal blood glucose was significantly increased (p < 0.0001) in the DC group compared to the NC group. Both the extract- and glibenclamide-treated groups showed a significant decrease (p < 0.0001) in basal blood glucose during the last 2 weeks of treatment (Figure 7A). The amount of available glucose in the blood, expressed as AUC, confirmed this significant reduction (p < 0.0001) in basal blood glucose in the treated rats (Figure 7B).

2.2.3. Oral Glucose Intolerance

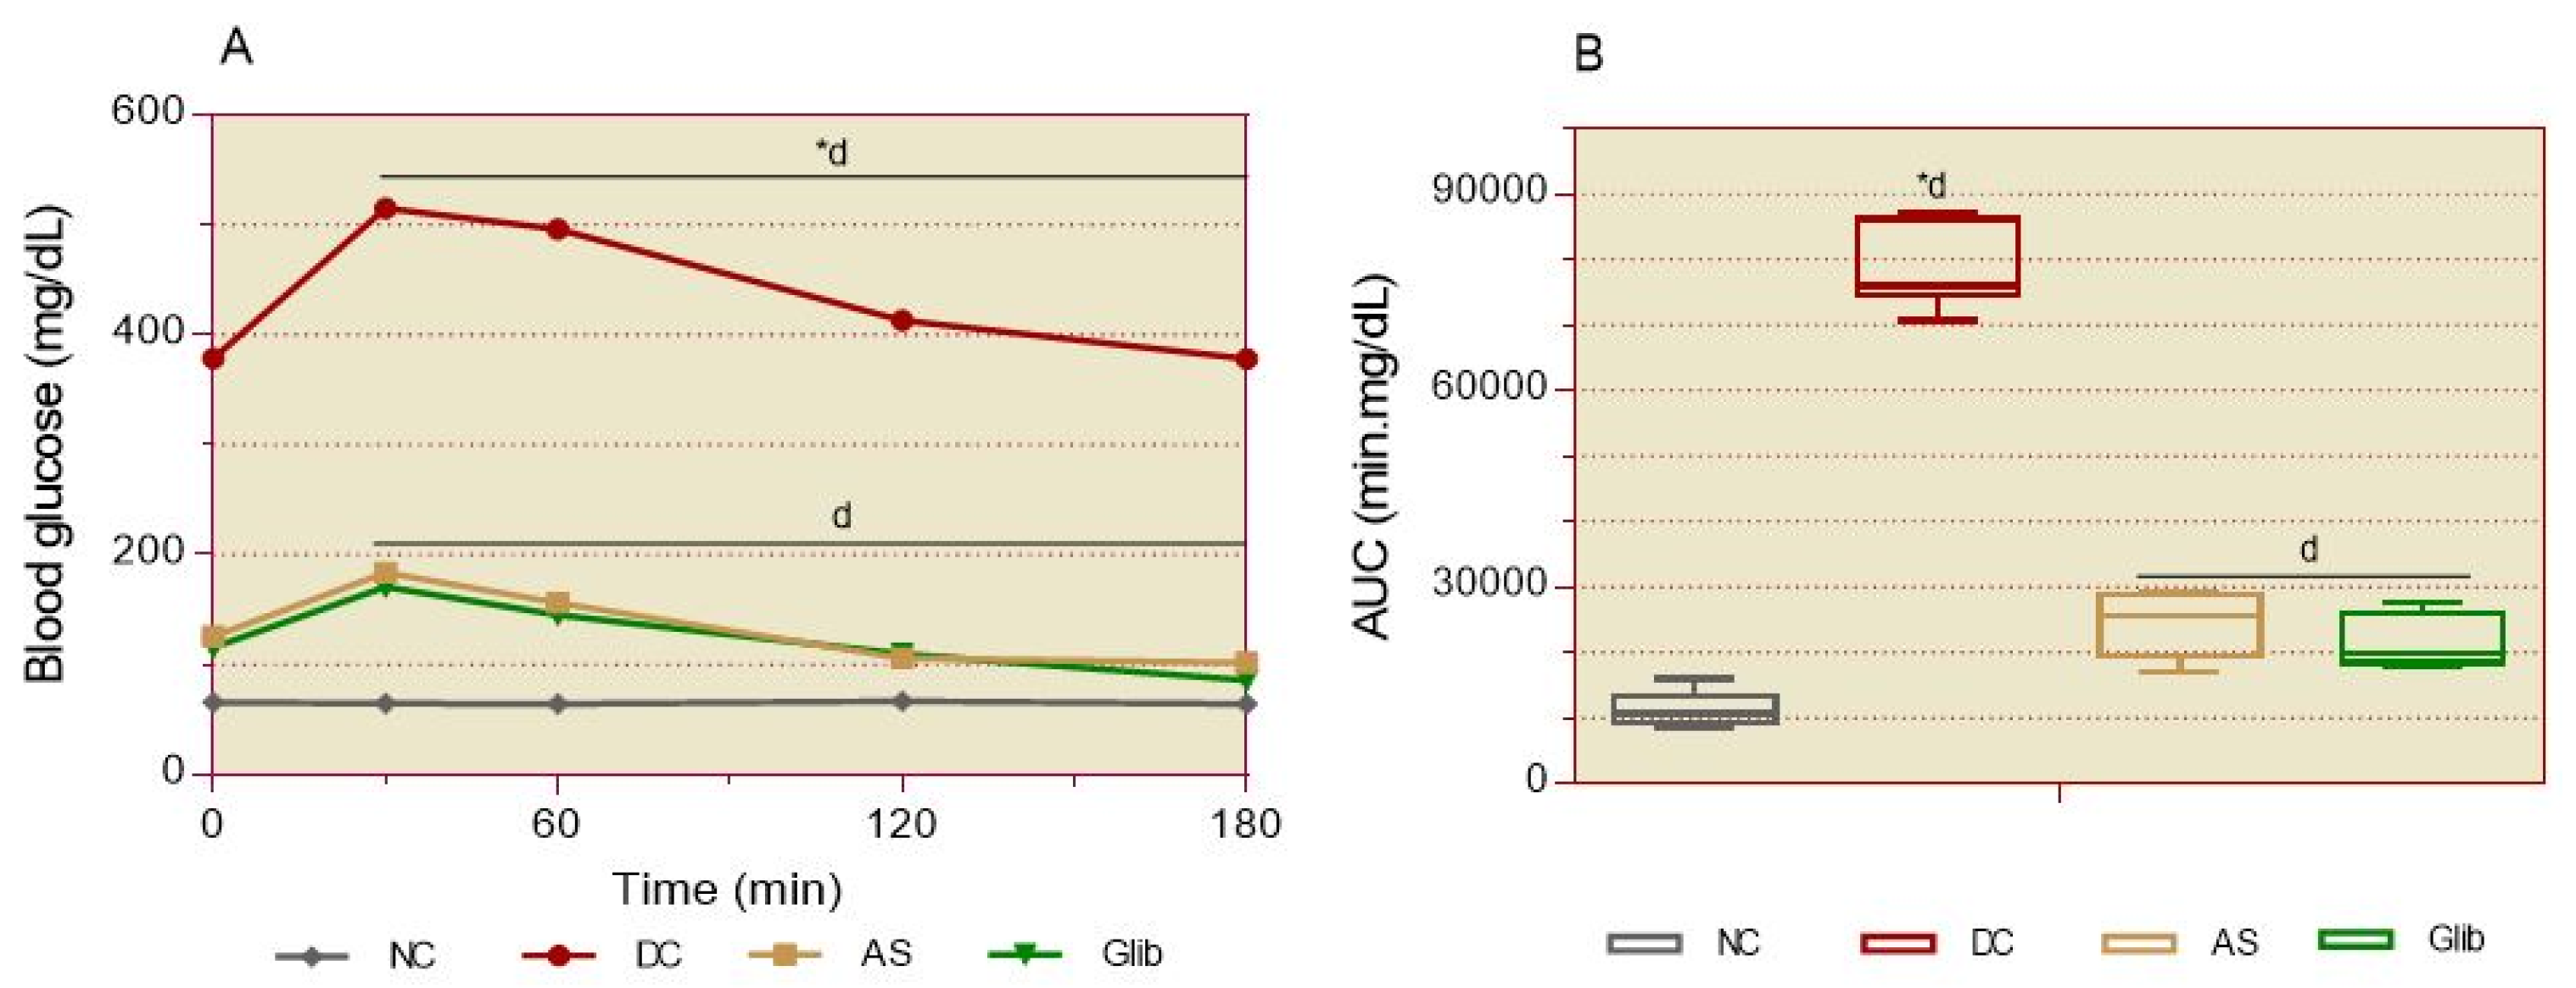
The oral glucose tolerance test (OGTT) showed that treatment of diabetic rats with the extract and glibenclamide before oral administration of 2 g/kg bw of glucose, caused 30 min later, a significant (p < 0.0001) reduction of postprandial blood glucose (Figure 8A). This decrease in blood glucose continued until 180 min with a glycemia below the initial value in the treated groups (Figure 8A). The reduction of oral glucose intolerance in the treated groups was confirmed by AUC; a reduction of about 2/3 compared to DC (Figure 8B).

2.2.4. Markers of Oxidative Stress in Tissues

Measurement of oxidative stress markers in tissues after three weeks of treatment, revealed in DC a significant increase (0.0001) in MDA and a depletion in GSH in the tissues of the liver, kidneys and eyes, compared to the NC (Figure 9A,B,C). In the extract- and glibenclamide-treated groups, there was a significant (0.0001) decrease in MDA and an increase in GSH in liver, eye and kidney tissues, compared to DC (Figure 9A,B,C).

2.2.5. Cardiovascular System Markers

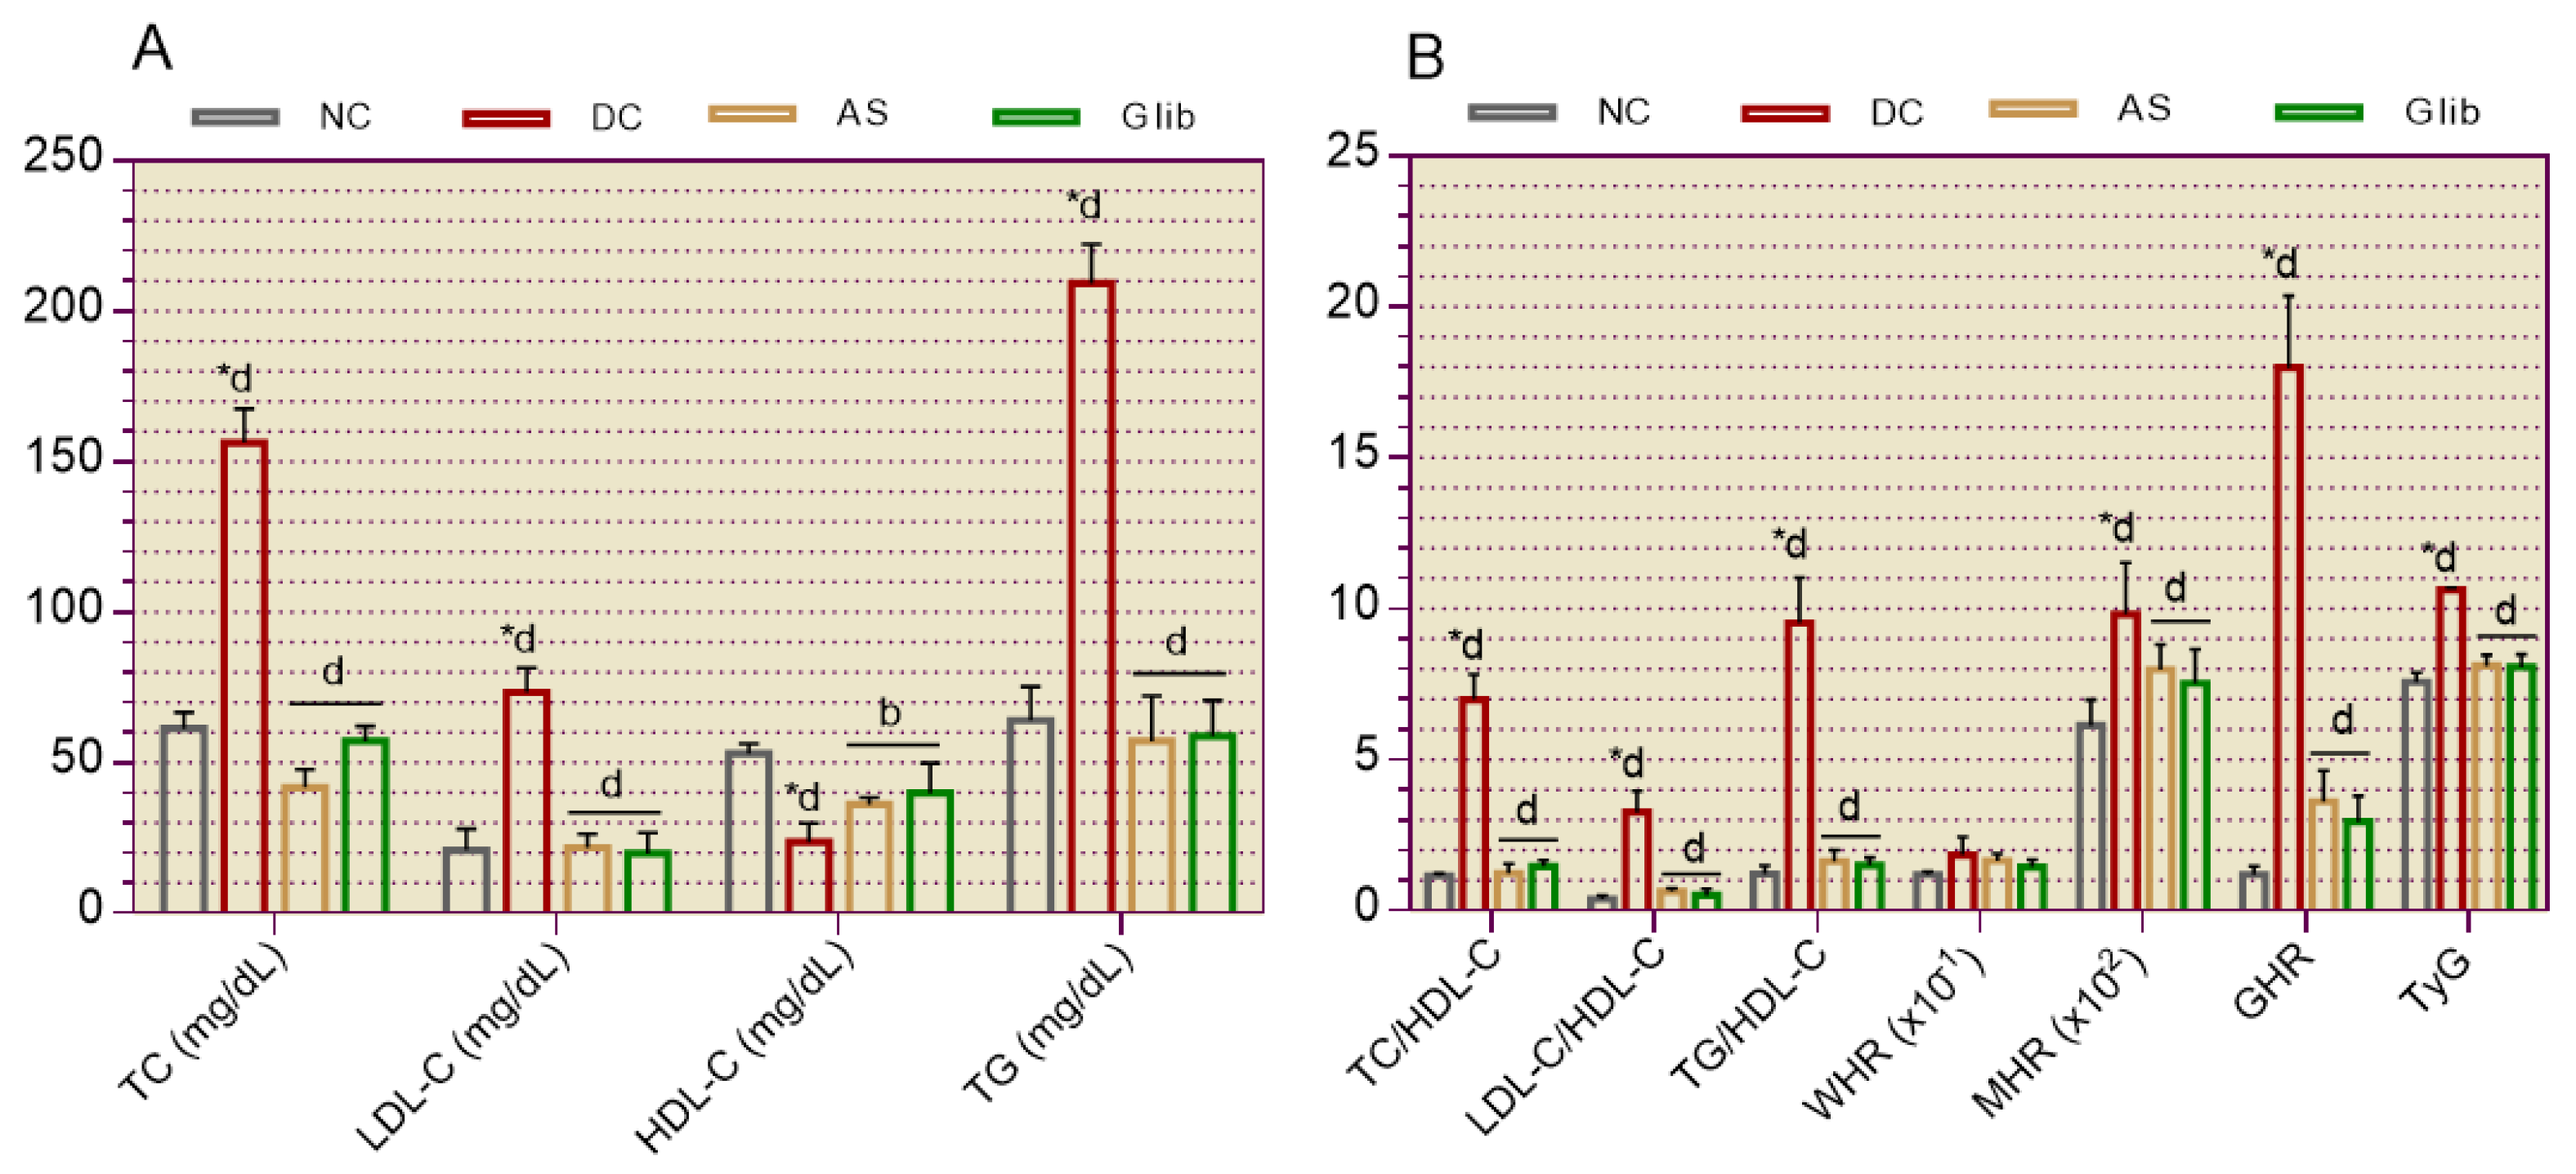
At the end of three weeks of treatment, total cholesterol (TC), LDL cholesterol (LDL-C), and triglycerides (TG) remained significantly (0.0001) elevated in the diabetic control group (DC), compared to the normal control group (NC). At the same time, DCs show a significant decrease (0.001) in HDL cholesterol (Figure 10A). In the groups treated with the extract and glibenclamide, there was a significant (0.0001) reduction in TC, LDL-C, TG and a significant increase (0.01) in serum HDL-C, compared to the NC (Figure 10A). These imbalances were better revealed by cardiovascular indices, including TC/HDL-C ratio, LDL-C/HDL-C ratio, TG/HDL-C ratio, white blood cell count to HDL-C ratio (WHR), monocyte count to HDL-C ratio (MHR), fasting blood glucose to HDL-C ratio (GHR), and triglyceride-glucose index (TyG). Compared to DC, the groups treated with the extract of A. spinosus and glibenclamide showed a significant reduction (p < 0.0001) in cardiovascular indices, except the white blood cell count to the HDL-C ratio (WHR) which remained non-significant (p > 0.05) (Figure 10B).

2.2.6. Serum Biochemical Markers for Hepatic and Cardiac

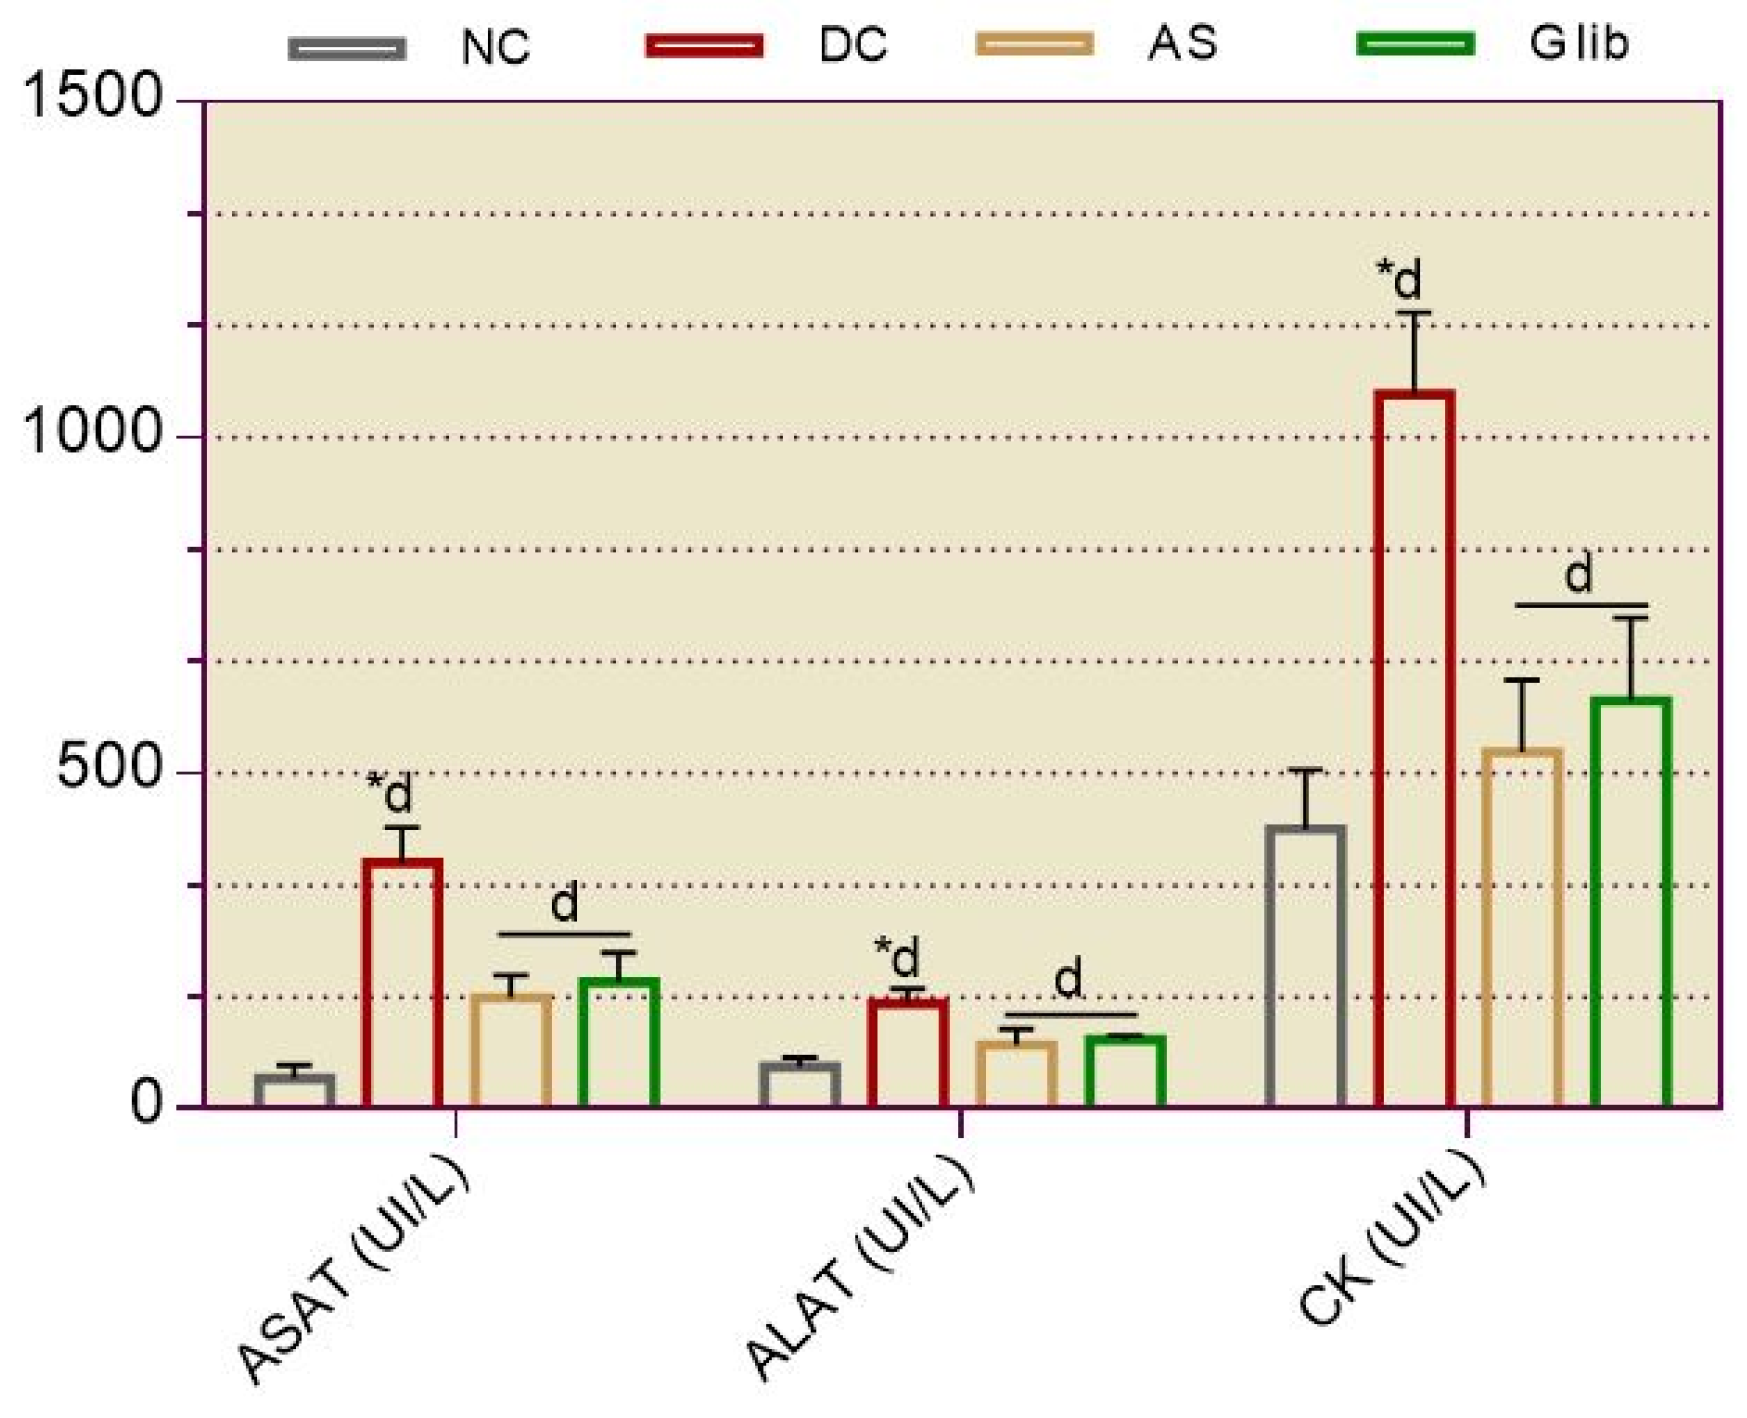
Compared to the NC, serum aspartate aminotransferases (AST), alanine aminotransferases (ALAT) and creatine kinase (CK) were significantly (p < 0.0001) elevated in the DC (Figure 11). All treated groups showed a significant (p < 0.0001) decrease in these hepatic and cardiac markers at the end of three weeks of the treatment, compared to DC (Figure 11).

2.2.7. Serum and Urine Biochemical Markers for Kidneys

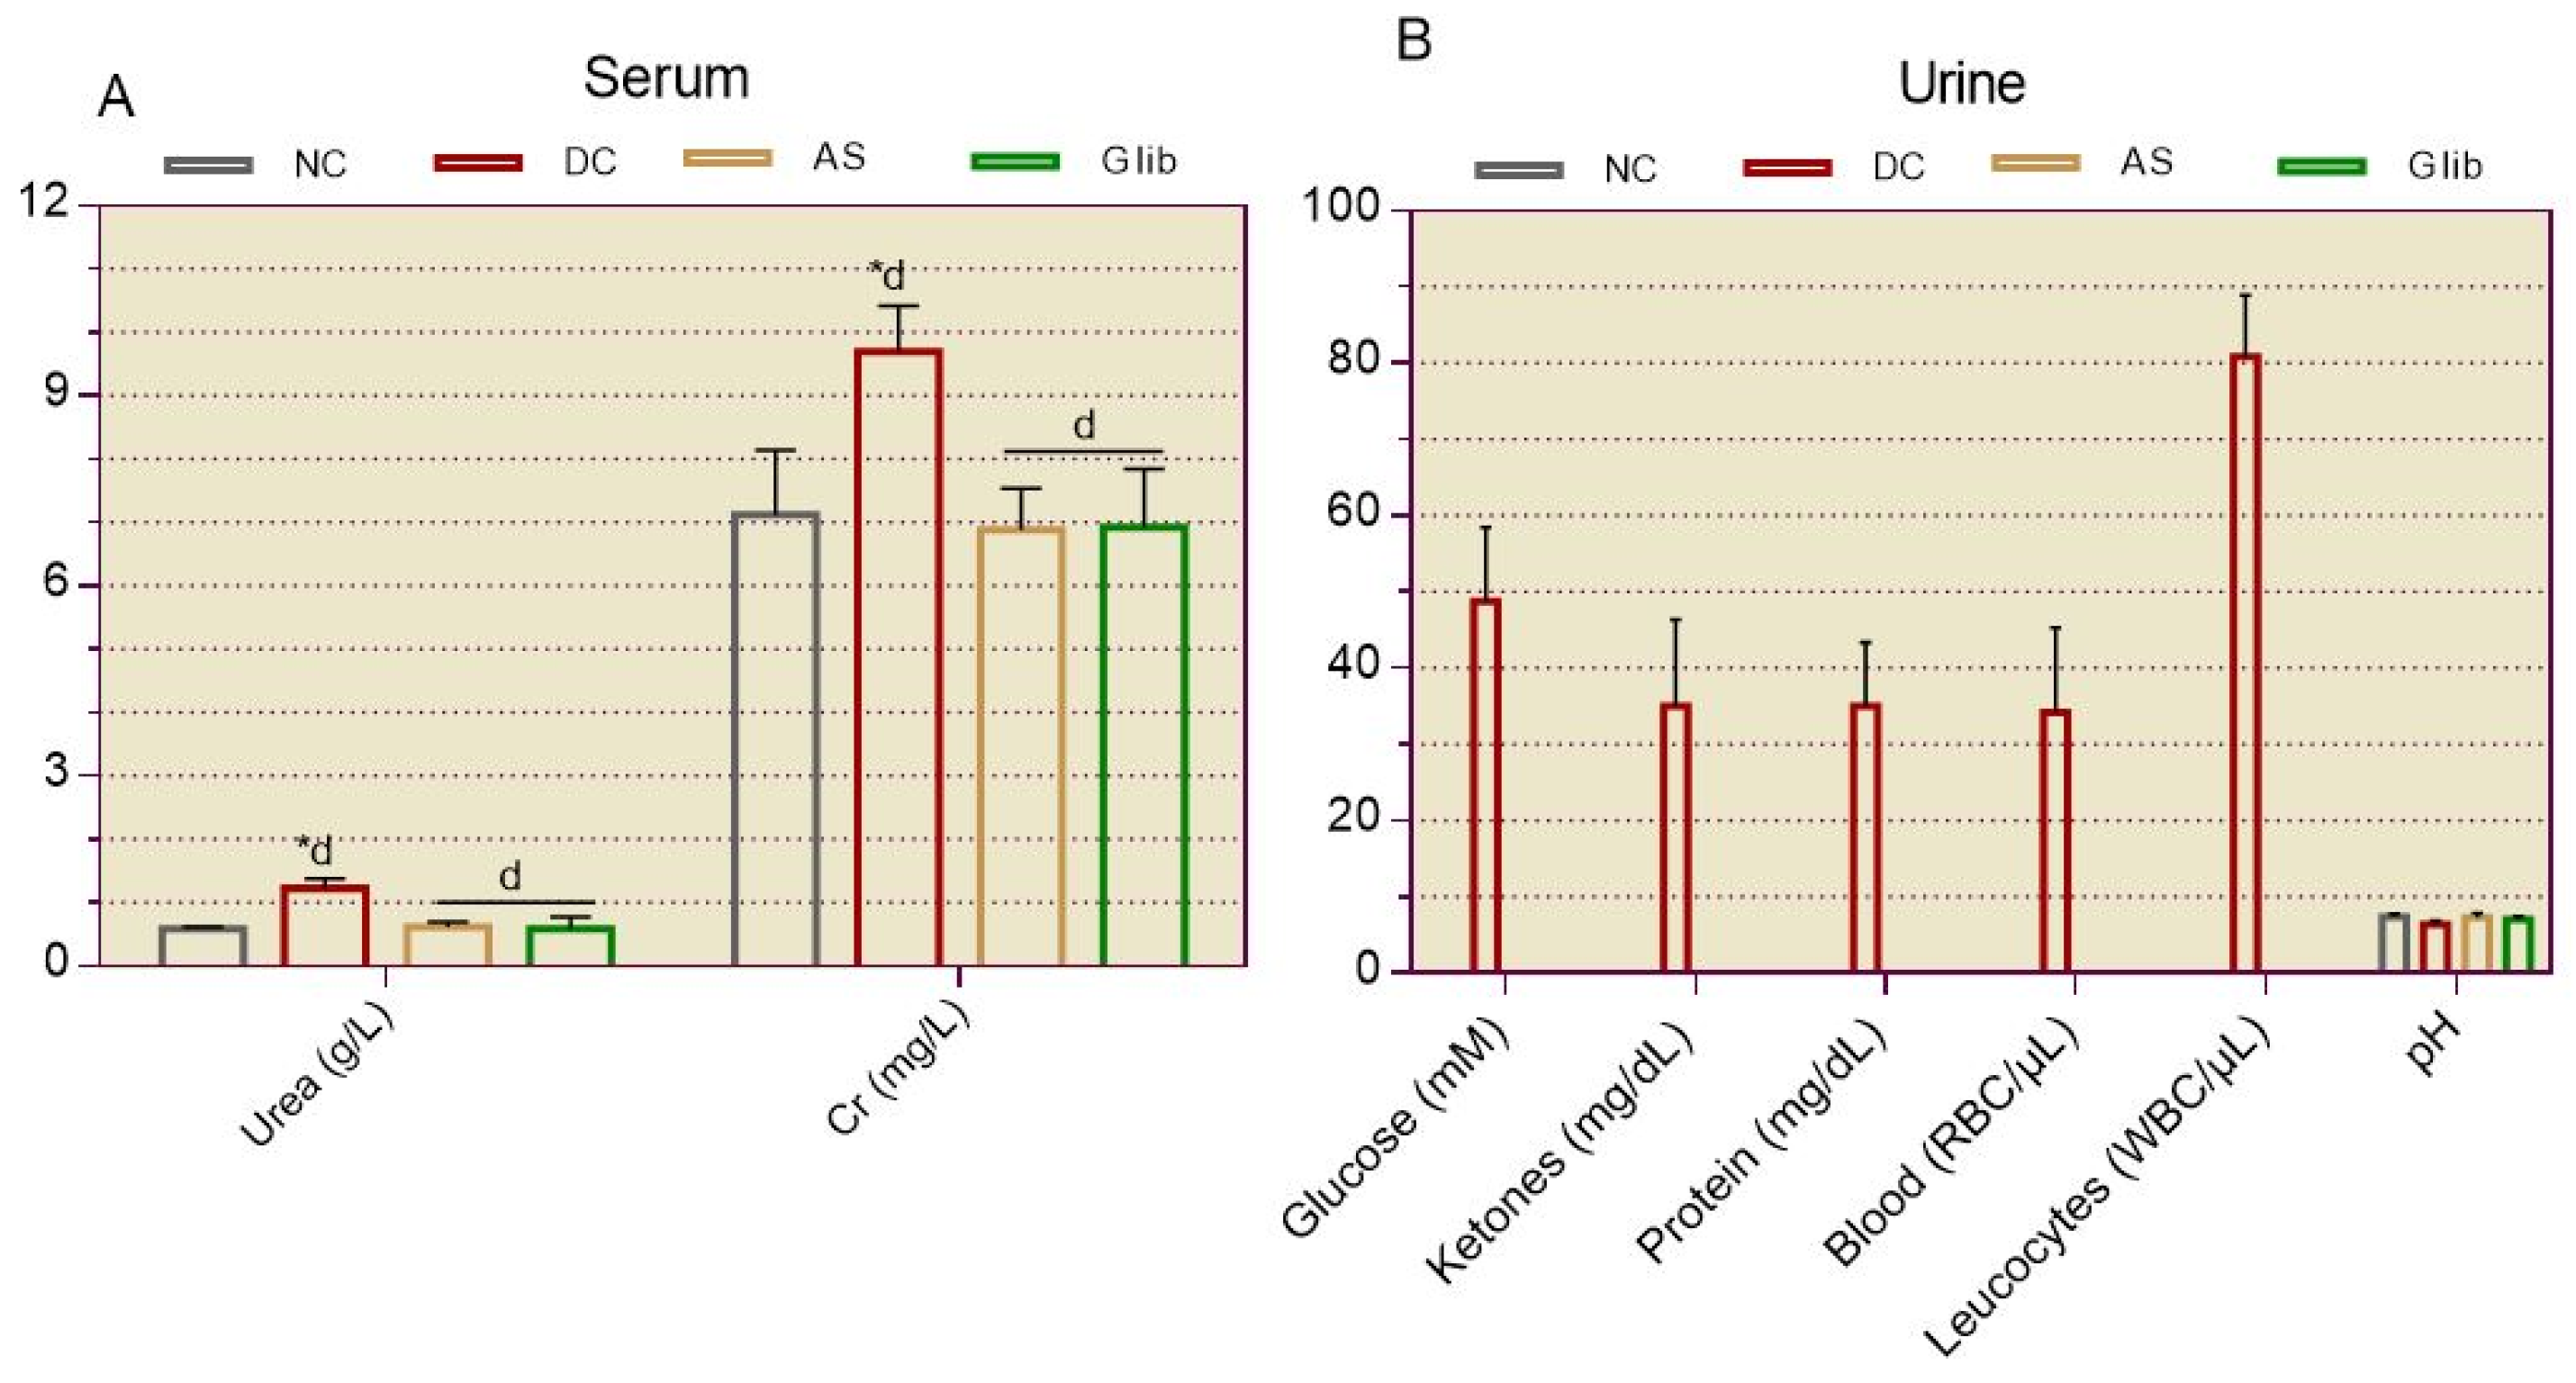
After three weeks of treatment, serum urea, and creatinine remained significantly (p < 0.0001) elevated in DC and decreased in the treated groups (Figure 12A). In DC, the presence of glucose, ketones, proteins, blood, and white blood cells in the urine was observed (Figure 12B). DC also showed a decrease in urinary pH (Figure 12B), compared to NC. In the treated groups, a significant decrease (p < 0.0001) in serum markers and a normalization of urinary markers were observed, compared to DC (Figure 12).

2.2.7. Blood Cells Profile

The complete blood count showed at the end of treatment a significant (0.0001) decrease in the number of platelets, leukocytes, neutrophils and lymphocytes in the DC, compared to the NC (Table 1). However, in the extract- and glibenclamide-treated groups, there was a significant (p < 0.0001) increase toward normal in platelets and leukocytes, compared to DC (Table 1).

2.2.8. Anatomopathological Studies

2.2.8.1. Gross Observations

At the time of sacrifice, rats in the diabetic control group (DC) were cachectic compared with the normal control group (NC). In contrast, the groups treated with the extract (AS) and glibenclamide (Glib) had similar shapes and weights to those of the NC. The autopsy performed after the sacrifice revealed no significant changes in organ weights, except for the liver. Compared to the NC, there was a significant increase (p < 0.0001) in liver weight in the DC group (Table 2). At the same time, AS and Glib groups showed a significant decrease (p < 0.0001) in liver weight, compared to DC (Table 2).

2.2.8.2. Histological Determination of Retinopathy

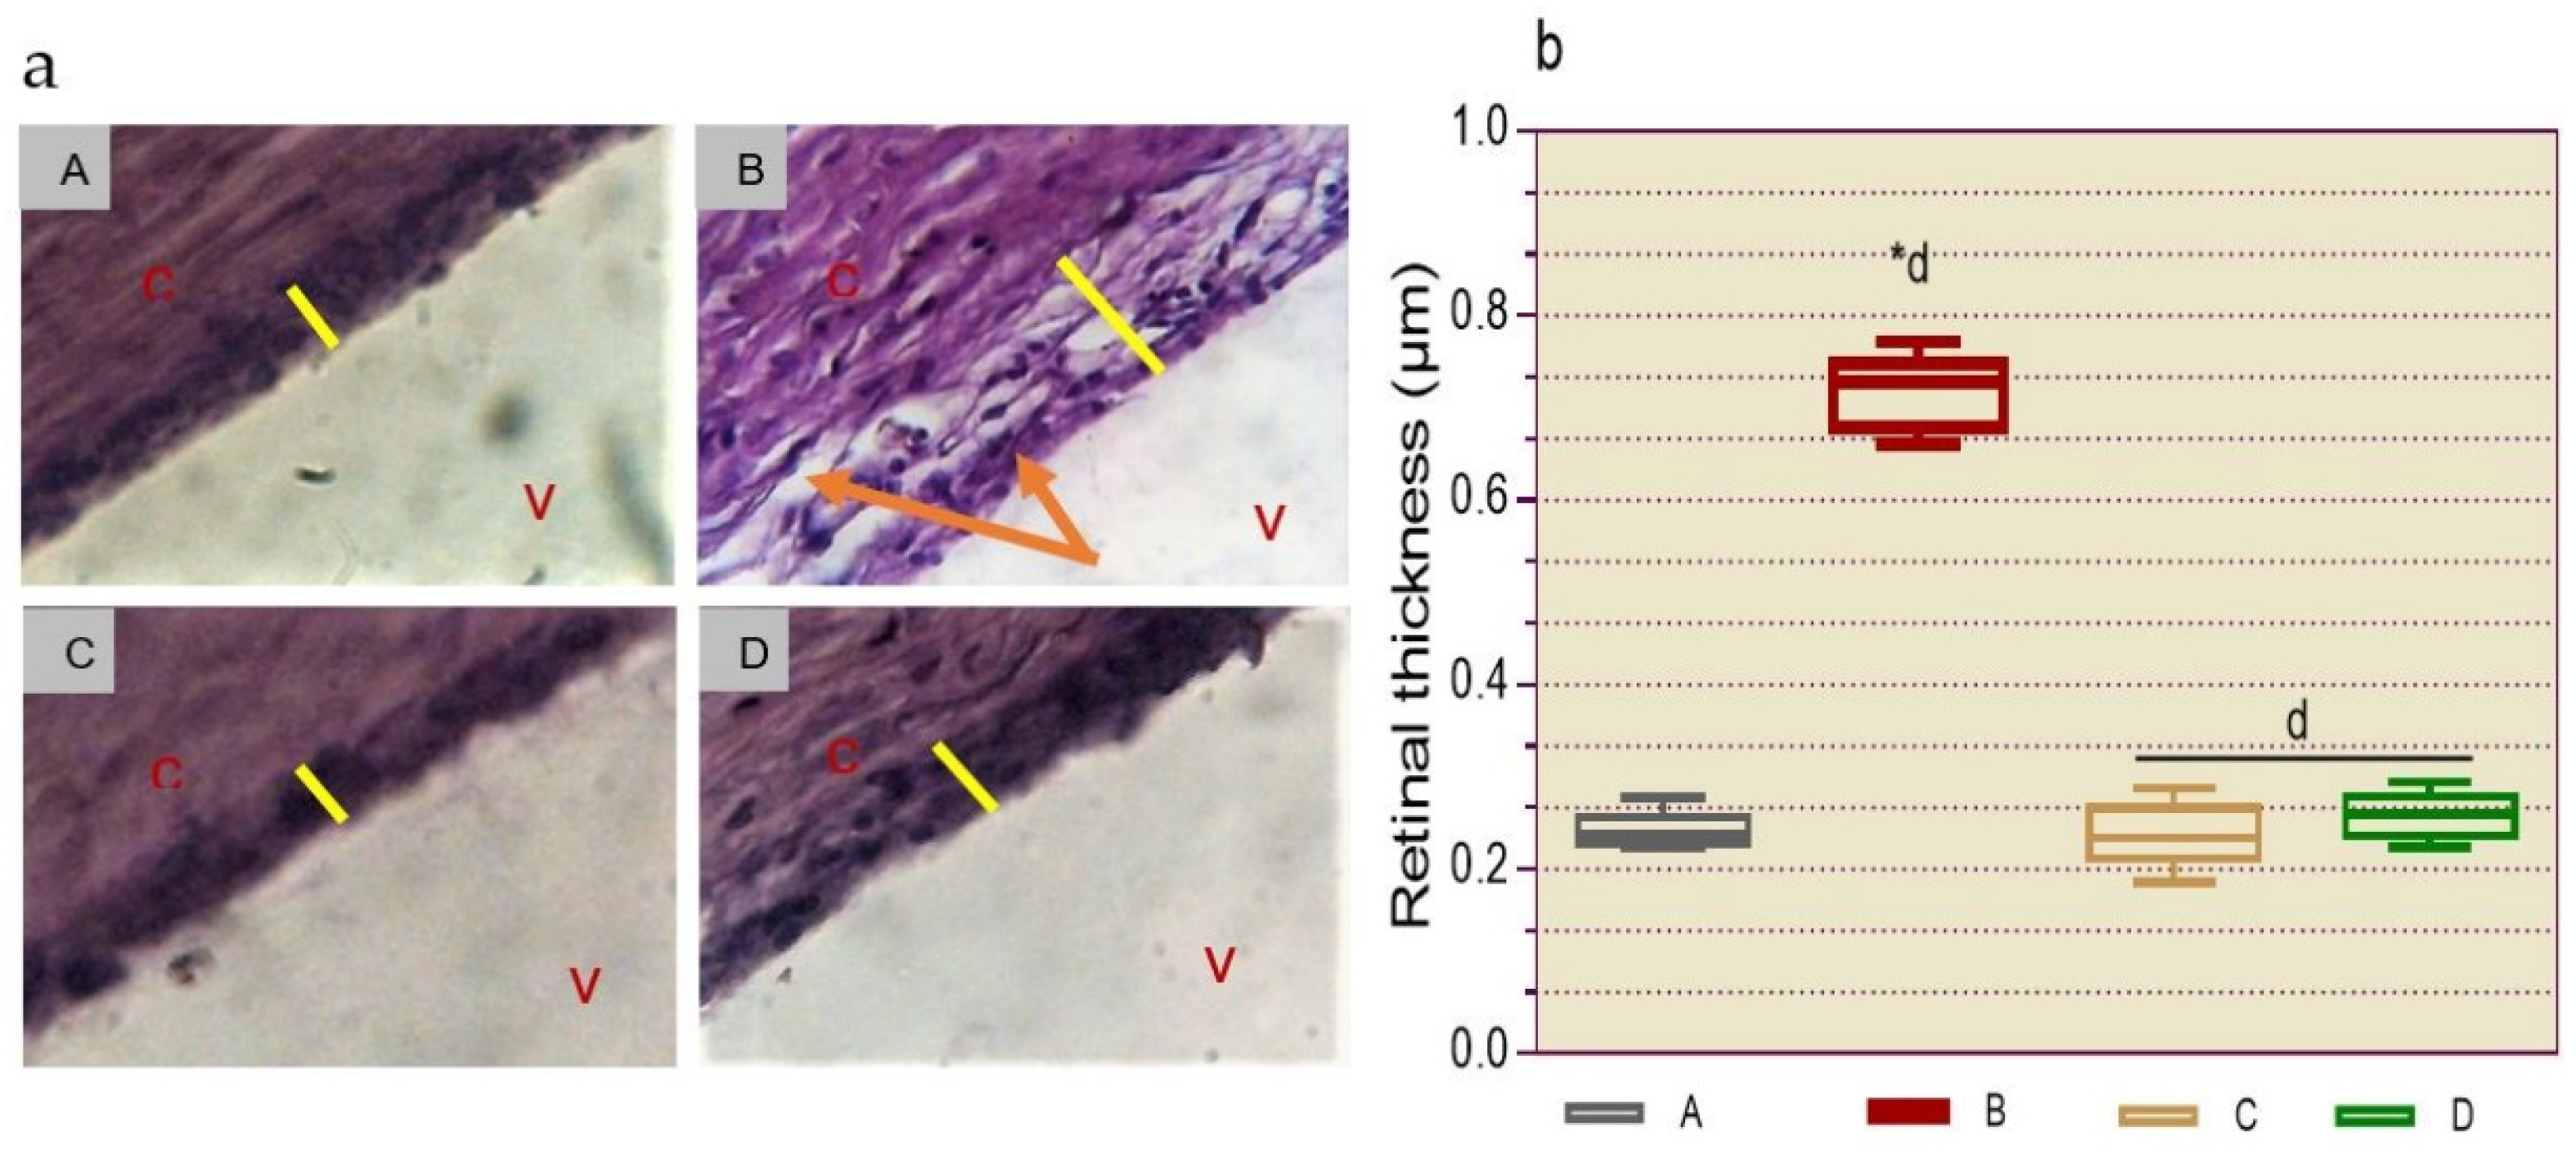
Microscopic observation of histological sections of the retina at the end of the experiment showed a normal architecture, without abnormalities in the normal control group (Figure 13aA) and in the groups treated with the extract (Figure 13aC) and glibenclamide (Figure 13aD). However, in the diabetic control group (Figure 13aB), an abnormality characterized by an increase in volume and retinal detachment, with alteration of the surface membrane, was observed.
Measurement of retinal thickness showed that the groups treated with the extract and glibenclamide (Figure 13bC,D) had retinal thickness similar to that of normal controls (Figure 13bA). However, the increase in retinal thickness observed in the diabetic control group (13bB) was approximately three times, compared to normal controls (Figure 13bA).

2.2.8.3. Histological Determination of Renal Fibrosis

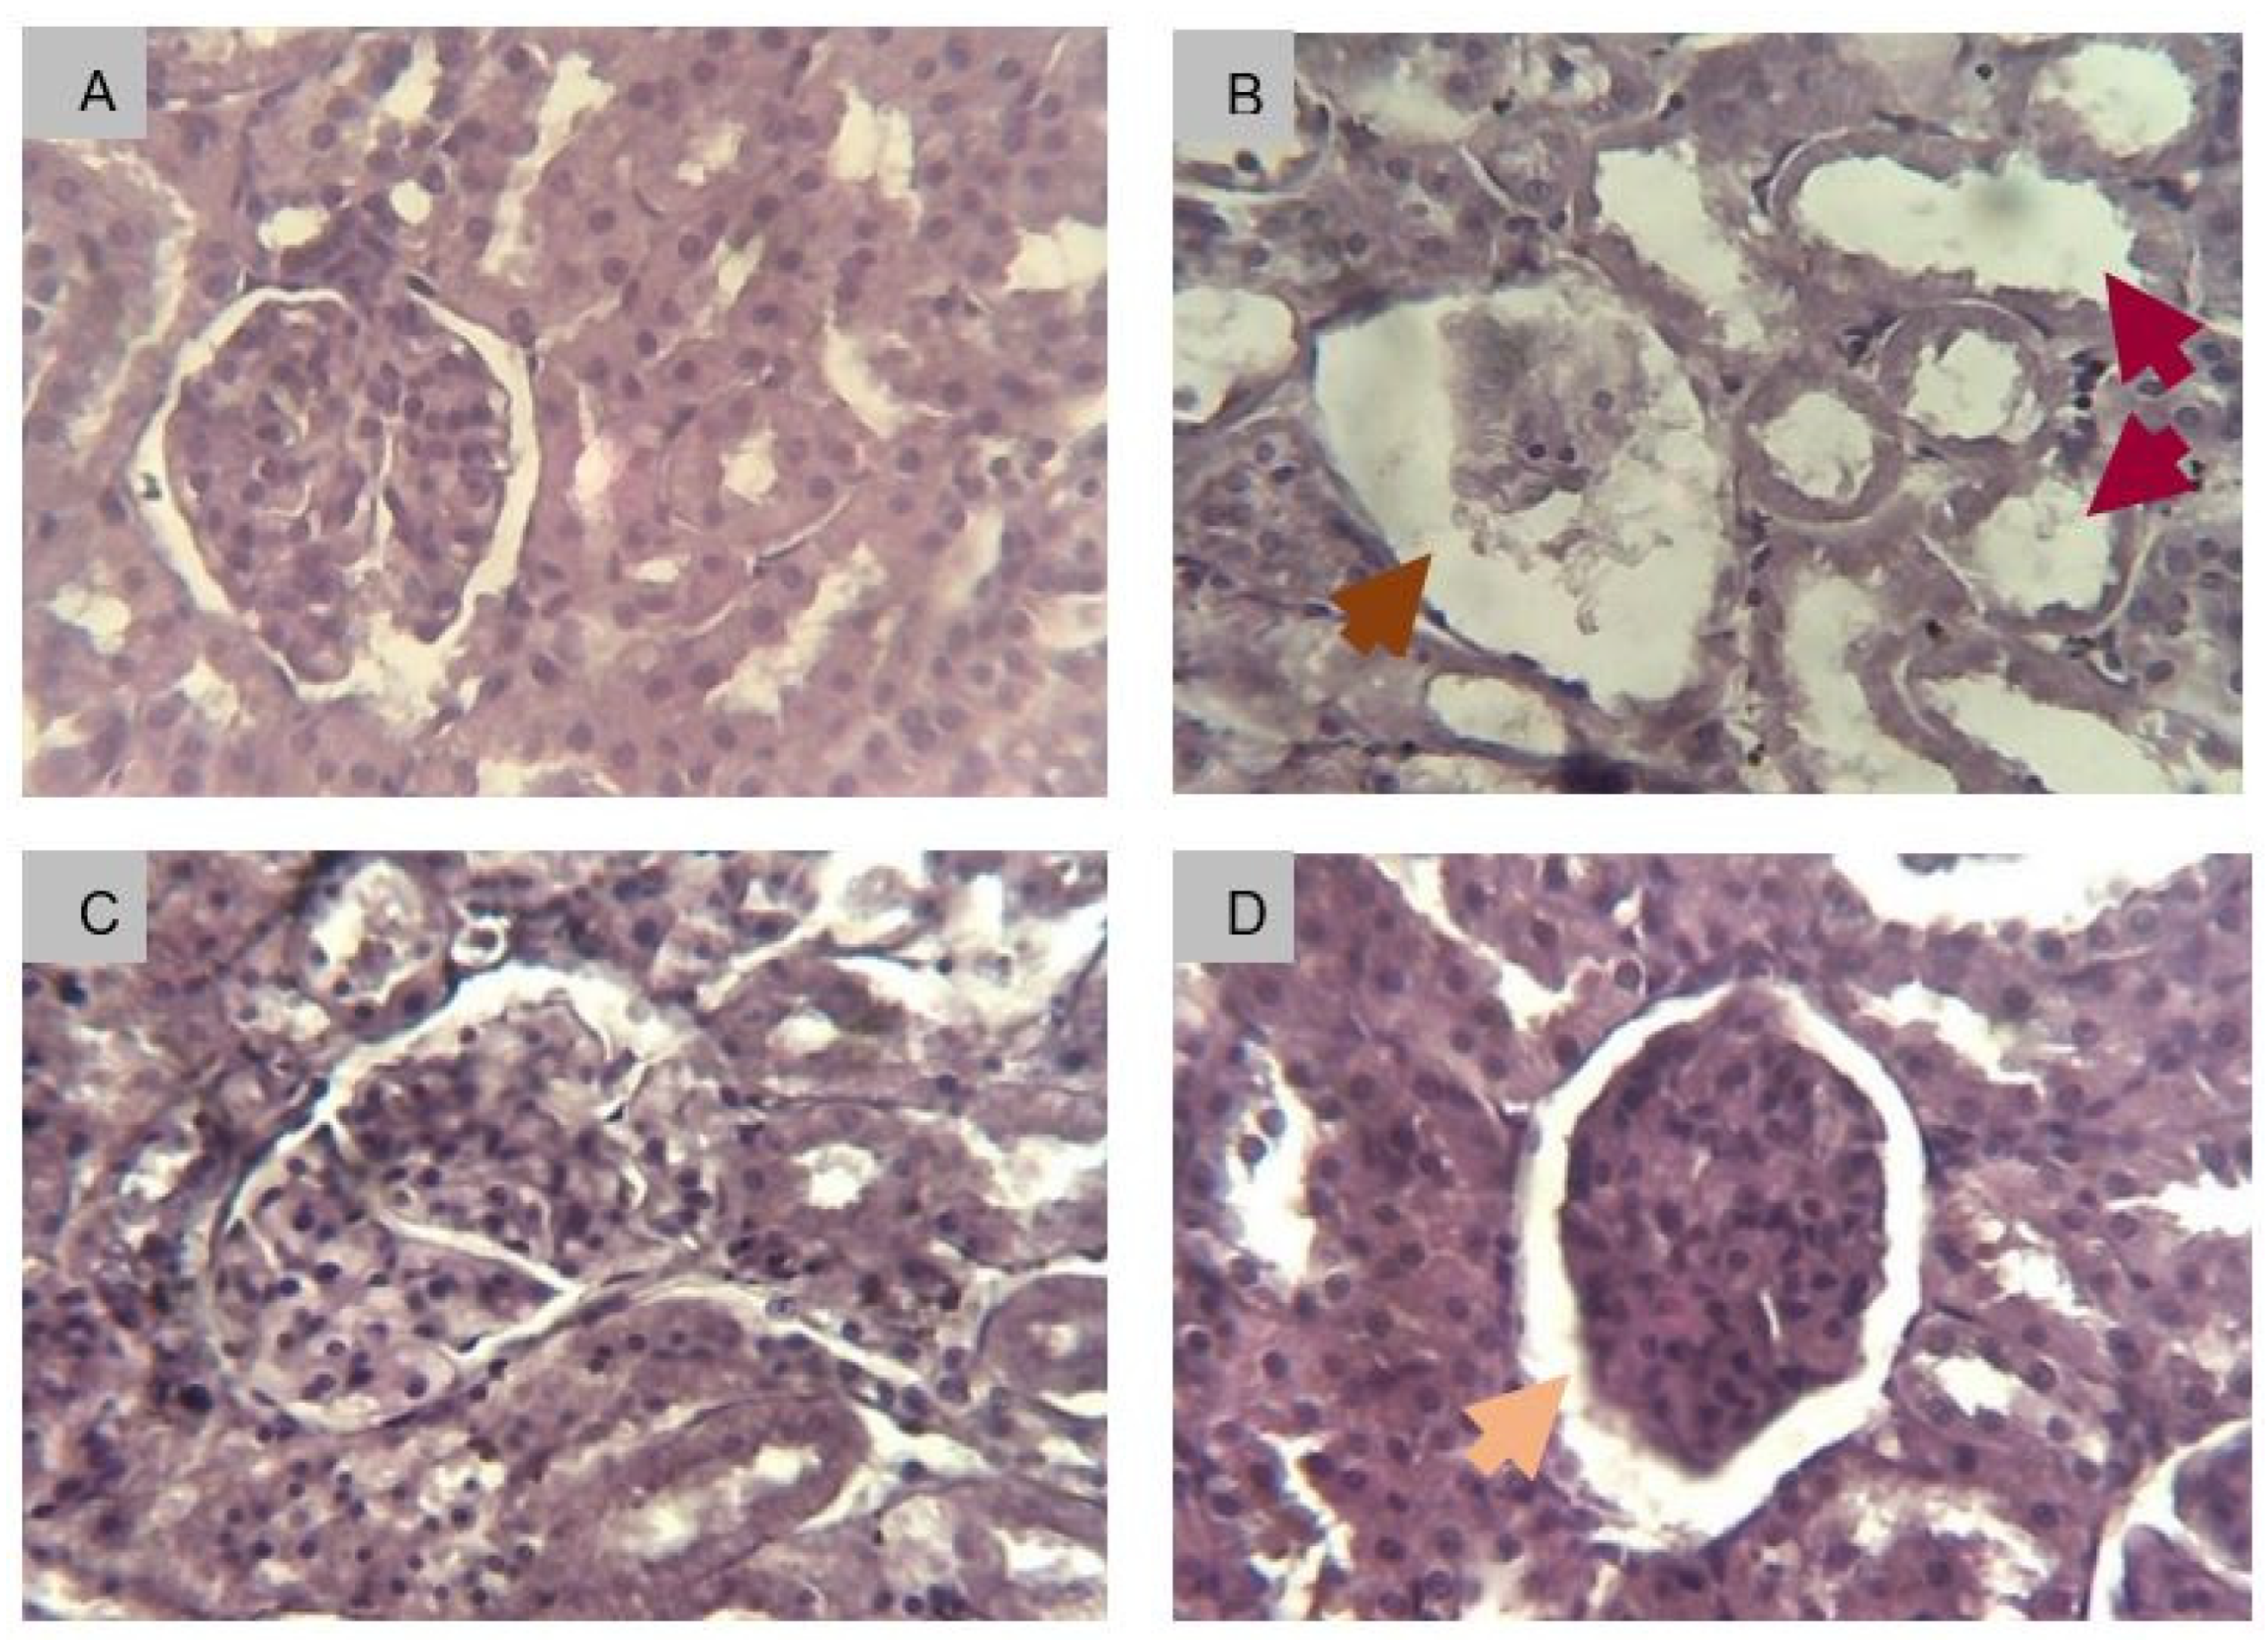
Microscopic observation at the end of the experiment showed normal architectures in the kidney sections without abnormalities in the group treated with the extract (Figure 14C), as in the normal control group (Figure 14A). In the glibenclamide-treated group, normal tubular architecture with enlarged glomeruli and enlargement of Bowman’s space was observed (Figure 14D). In contrast, in the diabetic control group (Figure 14B), nodular glomerulosclerosis, followed by progressive loss of glomeruli and fibrosis of the tubules was observed.

3. Discussion

The efficacy of A. spinosus roots was evaluated on diabetic complications, retinopathy, and renal fibrosis for 41 days in rats. The animal model was validated for 20 days before applying a three-week treatment.
The use of high-fat diet and low-dose streptozocin resulted in a rat model developing symptoms of type 2 diabetes (T2D) characterized by hyperglycemia and insulin resistance (Furman 2021). Administration of fructose and lard to rats for 20 days caused an imbalance in the lipid profile. However, it was the injection of streptozocin (STZ) on day 12 that rapidly led to significant hyperglycemia (p < 0.0001) in rats previously fed a fatty diet. Dyslipidemia is one of the main causes of metabolic syndrome (MetS) and insulin resistance in T2DM [21,22]. These disorders were evidenced by abnormal levels of serum triglycerides and cholesterol, which are reliable markers of MetS and cardiovascular complications [23]. The significant increase (p < 0.0001) in LDL cholesterol and the decrease in HDL cholesterol in pretreated rats, alert to the development of cardiovascular complications [23,24]. Plasma cholesterol and triglyceride levels are markers of atherosclerosis that increase the occurrence of cardiovascular events [25,26]. These biochemical markers were significantly altered in our T2D rat model. In addition, the significant elevation (p < 0.0001) of creatinine kinase (CK) alerts to a risk of myocardial infarction in these rats [27]. The significant increase (p < 0.0001) in aspartate aminotransferase (AST) observed after pretreatment of the animal model reveals hepatic insufficiency which may be associated with insulin resistance and a reduction in glucose storage. This liver disorder may also be linked to non-alcoholic fatty liver disease (NAFLD) due to hypertriglyceridemia [28]. Consequently, hepatic dysfunction contributes to hyperglycemia which causes angiopathy in diabetes [3,29]. Indeed, chronic hyperglycemia activates certain metabolic pathways and causes oxidative stress that damages blood vessels [30]. The resulting microvascular damage leads to blindness and chronic kidney disease (CKD) [3,31]. Serum and urinary biochemical markers were thus evaluated to predict these syndromes in pretreated rats. The significant (p < 0.0001) increase in serum creatinine and the appearance of glucose, ketones, proteins, blood, and leukocytes in the animals’ urine were arguments in favor of nephropathy. Microalbuminuria (proteinuria) is a reliable marker in the diagnosis of diabetic retinopathy and nephropathy [32,33]; thus, its detection in the urine of rats attests to the presence of these two microvascular complications. Ketoacidosis characterized by the presence of ketones in the urine, and a decrease in pH are other complications that lead to insulinopinia, a consequence of insulin resistance [34,35]. By considering all parameters, we validated our animal model for the study of complications associated with T2D.
The treatment of the animal model for three weeks proved the effectiveness of the roots of A. spinosus extract on diabetes and its complications. Diabetes symptoms previously observed were significantly (p < 0.0001) regulated at the end of treatment. This improvement in diabetic syndrome in treated rats correlated with blood glucose regulation. In our study, the extract and glibenclamide significantly decreased (p < 0.0001) basal blood glucose and improved oral glucose tolerance. The regulation of ketoacidosis after treatment proved that insulin secretion was improved [34]. A previous study found that A. spinosus improves insulin secretion [36]. Insulin promotes peripheral glucose utilization and storage by increasing glucose transport and regulating gene expression [37]. A normalization of blood glucose therefore leads to restorations of body weight, water, and food consumption. This process is responsible for the reduction until the total disappearance of the symptoms of diabetes in treated rats. The significant reduction (p < 0.0001) in basal glucose levels in treated rats could also be associated with a decrease in markers of oxidative stress. Since chronic hyperglycemia leads to oxidative stress that affects multiple organs [38], animals with low basal blood glucose levels close to average will have low oxidative markers and increased content of endogenous antioxidants. This was confirmed in the present study which showed a significant decrease (p < 0.0001) in MDA and an increase in GSH levels in the liver, eye, and kidney tissues of treated rats.
After blood glucose normalization, the onset and progression of complications remain a problem to be addressed in diabetes [10]. It should be remembered that diabetes complications appear with the chronicity of hyperglycemia and the duration of the disease; and that current available therapies do not stop the progression towards complications [10,39,40]. The study of A. spinosus initiated in this study was promising in the prevention of diabetes-related microvascular complications.
A. spinosus extract was effective in preventing atherosclerosis and hepatic steatosis associated with diabetes during treatment. This effectiveness of the extract was confirmed by a significant reduction (p < 0.0001) in serum triglycerides, total cholesterol, LDL cholesterol and an increase in HDL cholesterol in the treated rats. Prevention of cardiovascular and hepatic diseases associated with diabetes complications can also be observed by the extract’s ability to significantly (p < 0.0001) decrease serum AST, ALT and CK.
People with diabetes are constantly subject to immune system disruption and activation of inflammation [40,41]. Their diagnosis can be made by looking for immune cells and biochemical markers in blood and urine. According to the complete blood count, the extract significantly (p < 0.0001) normalized white blood cells and platelets. The presence of blood and leukocytes in urine is associated with immune cell response and tissue damage in chronic inflammation of diabetic nephropathy [41]. This nephrotic syndrome was prevented in rats treated with A. spinosus extract and glibenclamide.
Analysis of correlations between lipid profiles, blood glucose levels, and immune cells allowed us to evaluate the predictive indices of cardiovascular events. Ratios of TC/HDL-C, LDL-C/HDL-C, TG/HDL-C, monocyte count/HDL-C, fasting blood glucose/HDL-C, and triglyceride-glucose index proved that A. spinosus root extract and glibenclamide significantly (p < 0.0001) reduced the occurrence of cardiovascular events in treated rats by mechanisms previously mentioned.
Proteinuria (albuminuria) is a reliable predictor of common microvascular lesions associated with diabetes [42,43], and its disappearance at the end of treatment was a significant predictor of prevention of retinopathy and nephropathy in rats treated with A. spinosus and glibenclamide. In diabetes, retinopathy and nephropathy are closely correlated and their severities are revealed by albuminuria [44,45]. The significant reductions (p < 0.0001) in urea, creatinine, and absence of glucose in the urine provided additional arguments in favor of nephroprotection. However, retinopathy and nephropathy were confirmed by histological studies.
Retinal inflammation associated with diabetes leads to macular edema and irreversible damage to the retinal structure preceded by impairment of the retinal vasculature and the blood-retinal barrier (BRB) [46]. This pathology was confirmed in our study by histological examination in the diabetic control group (DC). During the three weeks of treatment, the extract and glibenclamide worked to protect against any damage to the retina. Therefore, no macular edema was observed in treated rats. Histological examination also confirmed nephroprotection in treated rats. The process of renal fibrosis begins early with several changes in glomerular cells before leading to renal failure [47]. Early stages of nephropathy include increased GFR with enlargement of the Bowman space and glomerular hypertrophy [48]. Gradually, GFR decreases, albuminuria appears, and glomerulosclerosis progresses [47]. Irreversible tubulointerstitial fibrosis occurs later and marks the end-stage renal disease (ESRD) [49]. Rats treated with the extract and glibenclamide were protected, and no renal fibrosis was observed on histological examination. However, the enlargement of Bowman space observed in the glibenclamide-treated group is due to an increase in GFR commonly observed in the early stage of chronic kidney disease (CKD), and is reversible [47].
In conclusion, the three-week treatment of the T2D animal model proved that A. spinosus root extract possesses bioactive molecules or compounds effective against diabetes and its complications. Treated rats showed normalization of diabetes symptoms and protection against complications including macular edema, and renal fibrosis. This evidence was revealed by the presence of biochemical, and cellular markers in blood, serum, and urine; then confirmed by a histological study. Although histopathological examinations provided evidence of protection against diabetic retinopathy and nephropathy, further molecular studies can be conducted to determine the phytochemical profile of the extract and the exact mechanisms by which it acts to reverse these complications. However, it is interesting to note that the dried hydroethanolic extract of A. spinosus at the dose of 500 mg/kg body weight was found to be effective, and safe for animal health [19,50]; and thus can be used to produce phytomedicines for managing diabetes, and preventing or reversing diabetic complications including retinopathy, and renal fibrosis.

4. Materials and Methods

4.1. Materials

4.1.1. Chemicals and Reagents

Chemicals were from Sigmax and reagents were from Cypress Diagnostics. Specific reagents and strips were used with CYAN equipment, in Germany (CYAN SMART CY009 spectrophotometer, CYANCyte 560 automatic hematology analyzer, CYANStrip Mini urine strip reader, CYAN optical microscope). The extract of A. spinosus root was prepared locally.

4.1.2. Plant Material

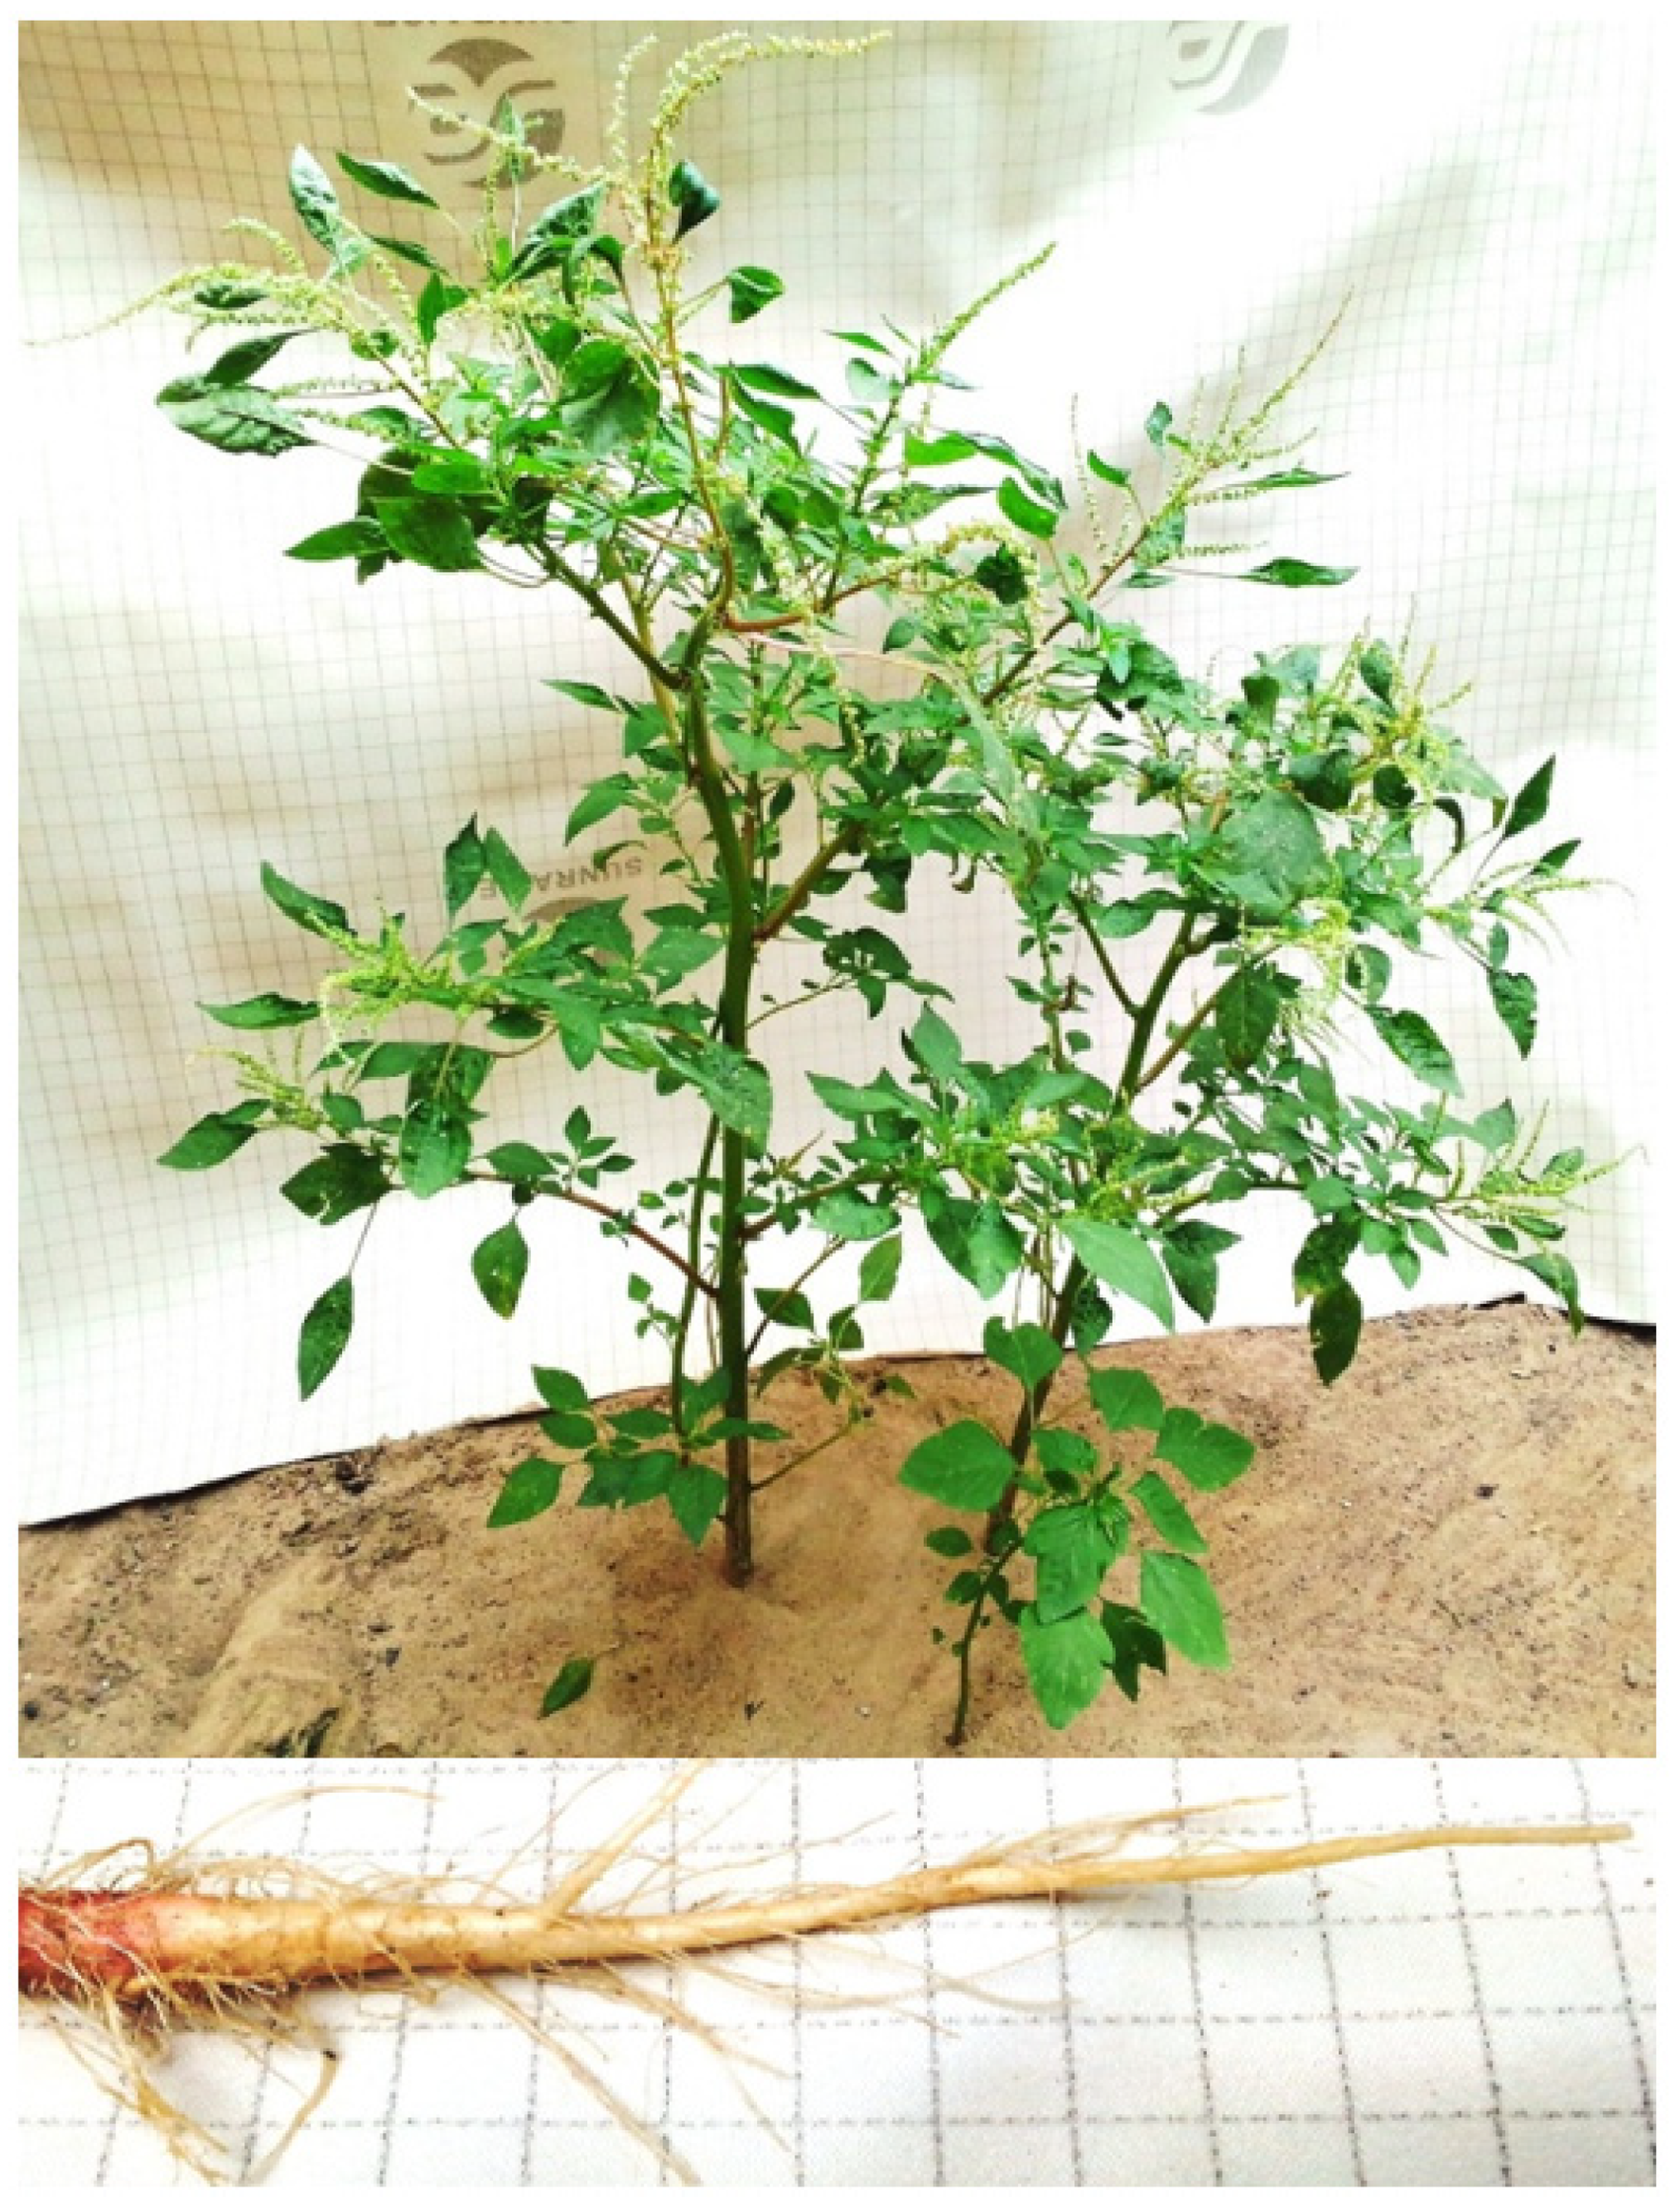
The whole fresh plant of A. spinosus was harvested in Lome and identified in the herbarium of the Department of Botany and Plant Ecology, University of Lome, Togo, where a voucher specimen was deposited under the number 15516 Togo. World Flora Online (WFO) (http://www.worldfloraonline.org) was used on October 19, 2024, to check the plant name and status was Amaranthus spinosus L., family Amaranthaceae (Figure 15).

4.1.3. Animals

Sprague Dawley (SD) rats (220 ± 20 g) of both sexes were used for in vivo studies. Rats were obtained from the Department of Animal Physiology at the University of Lome and randomized by sex in cages. The animals were acclimatized in the animal facility of the said department at a temperature of 25 ± 2 °C under standard conditions (~50% relative humidity and light/dark cycle of 12/12 h) for two weeks. They had access to food and water ad libidum.

4.2. Methods

4.2.1. Extract Preparation

The hydroethanolic extract of A. spinosus was prepared according to the previous method [20]. The roots of the whole plant were removed, rinsed under running water, and then dried at laboratory temperature (20 ± 2 °C) for two weeks, protected from light. The dried roots were ground and the powder was macerated in a mixture of water and ethanol at equal volume (v/v) for 72 hours. The macerate was filtered through Whatman filter paper (Ø 150 mm), then evaporated to dryness under vacuum at a temperature of 45°C using a rotary evaporator. The dried hydroethanolic extract was collected in glass bottles and then stored in the refrigerator at a temperature of 4 ± 2 °C.

4.2.2. Study Design

The experiments were carried out in two stages for a total of 41 days, according to the method used in our previous study [51]. In the first step, we validated the animal for the study for 20 days and in the second step we proved the effectiveness of the A. spinosus root extract on diabetes and its complications by treating the animal model for three weeks.

4.2.3. Validation of the Animal Model

The animal model was validated for 20 days using a high-fat diet (HFD) and low-dose streptozocin [52]. Normal rats were randomized by sex and orally administered 10 mL/kg bw of a mixture of fructose and lard (6 g: 50 mL, in 100 mL), twice daily, for 20 days. Streptozocin (STZ) was injected intraperitoneally (ip) into rats at a dose of 50 mg/kg body weight on the 12th day. At the same time, a normal control group (NC) was introduced and was administered orally with distilled water and ip with physiological saline solution. Blood glucose was measured on the 1st, 12th, 15th, and 20th days directly from the caudal tail blood of the 14-h fasted rats, using a glucometer (Accu check active, Germany). At the end of the 20th day, rats were fasted for 14 hours and blood was collected in hemolysis tubes from the same caudal veins for measurement of serum urea, creatinine, aspartate aminotransferase (ASAT), alanine aminotransferase (ALAT), creatine kinase (CK), triglycerides, total cholesterol (Total-C), high-density lipoprotein cholesterol (HDL-C) and low-density lipoprotein cholesterol (LDL) using specific kits from Cypress diagnosis. Multiparameter urine strips were used to determine glucose, ketones, proteins, blood, leukocytes, and pH in urine. Rats with blood sugar levels ≥ 350 mg/mL, proteinuria, and significant imbalance of hepato-cardio-renal markers were selected and validated as an animal model for the study of microvascular complications of diabetes [51].

4.2.4. Evaluation of the Effectiveness of the Extract

Validated animals of both sexes were randomized into groups of 6 rats and orally administered with the dried hydroethanolic extract of A. spinosus at a dose of 500 mg/kg body weight, and glibenclamide at a dose of 0.6 mg/kg body weight as the reference drug for 3 weeks. Controls include diabetic rats with complications and a previous normal control group. The diabetes control group (DC) and normal control group (NC) were orally administered 10 mL/kg body weight of distilled water for three weeks. The dose of 500 mg/kg bw of the extract was chosen for this study based on its effectiveness in reducing hyperglycemia and its safety for animal health in our previous work [19,20].
Water and food consumption were recorded daily and basal blood glucose was measured at the end of each week by the method mentioned previously. At the end of the three weeks of treatment, the rats fasted for 14 hours. Then, urine was collected to determine urinary parameters as before and rats underwent an oral glucose tolerance test (OGTT). The OGTT was carried out by oral administration of 2 mg/kg glucose to fasted rats, and then blood glucose was measured from the caudal vein of the animals at times t = 0, 30, 60, 120, and 180 min after carbohydrate overload. After this test, the rats were anesthetized with sodium pentobarbital, and then sacrificed by decapitation. Blood was collected in EDTA and hemolysis tubes for complete blood count, and previously listed biochemical analyses. Finally, an autopsy was performed and the organs (heart, liver, lungs, kidneys, eyes, and brain) were removed, and weighed. One kidney and one eye from each animal were fixed in 10% formalin for histopathological examinations by hematoxicillin and eosin (H&E) staining [53]. The rest of the kidneys, eyes, and liver were frozen for the determination of oxidative stress markers in tissues (MDA, GSH, proteins) [54,55,56].

4.3. Statistical Analysis

Data were analysed with GraphPad Prism 6 software using one-way and two-way analysis of variance (ANOVA). The difference between groups was considered significant at p < 0.05. Values were analysed and presented as mean ± standard error of the mean (SEM).

Author Contributions

Conceptualization, K.A.; Formal analysis, K.A.; Methodology, K.A.; Project administration, K.E-G.; Supervision, P.L-E.; Validation, P.L-E. and K.E-G.; Writing—original draft, K.A.

Funding

This research received no external funding.

Institutional Review Board Statement

This study was carried out by directives 001/2012/CB-MSDS-UL of the Department of Animal Physiology of the University of Lome and directive 86/609/EEC, governing the protection of animals used for scientific purposes.

Informed Consent Statement

Not applicable.

Data Availability Statement

The data presented in this study are available on request from the corresponding author.

Acknowledgments

The authors thank the University of Lome, Togo, for providing laboratory space and equipment for this work.

Conflicts of Interest

The authors declare no conflicts of interest.

References

  1. Zheng, Y.; Ley, S.H.; Hu, F.B. Global aetiology and epidemiology of type 2 diabetes mellitus and its complications. Nat Rev Endocrinol 2018, 14, 88–98. [Google Scholar] [CrossRef] [PubMed]
  2. American Diabetes Association Professional Practice Committee. 2. Diagnosis and Classification of Diabetes: Standards of Care in Diabetes—2024. Diabetes Care 2024, 47 (Suppl. 1), S20–S42. [CrossRef] [PubMed]
  3. Wright, W.S.; Eshaq, R.S.; Lee, M.; Kaur, G.; Harris, N.R. Retinal Physiology and Circulation: Effect of Diabetes. Compr. Physiol. 2020, 10, 933–974. [Google Scholar] [CrossRef] [PubMed]
  4. International Diabetes Federation (IDF). IDF Diabetes Atlas, 10th ed. Brussels, Belgium: International Diabetes Federation 2021. https://www.diabetesatlas.org.
  5. Ting, D.S.W.; Cheung, G.C.M.; Wong, T.Y. Diabetic retinopathy: global prevalence, major risk factors, screening practices and public health challenges: a review. Clin Exp Ophthalmol. 2016, 44, 260–277. [Google Scholar] [CrossRef] [PubMed]
  6. Hussain, S.; Jamali, M.C.; Habib, A.; Hussain, M.S.; Akhtar, M.; Najmi, A.K. Diabetic kidney disease: An overview of prevalence, risk factors, and biomarkers. Clin Epidemiol Glob Health 2021, 9, 2–6. [Google Scholar] [CrossRef]
  7. Nanayakkara, N.; Curtis, A.J.; Heritier, S.; Gadowski, A.M.; Pavkov, M.E.; Kenealy, T.; Owens, D.R.; Thomas, R.L.; Song, S.; Wong, J.; Chan, J.C.; Luk, A.O.; Penno, G.; Ji, L.; Mohan, V.; Amutha, A.; Romero-Aroca, P.; Gasevic, D.; Magliano, D.J.; Teede, H.J.; et al. Impact of age at type 2 diabetes mellitus diagnosis on mortality and vascular complications: systematic review and meta-analyses. Diabetologia 2021, 64, 275–287. [Google Scholar] [CrossRef]
  8. Cioana, M.; Deng, J.; Nadarajah, A.; Hou, M.; Qiu, Y.; Chen, S.S.J.; Rivas, A.; Toor, P.P.; Banfield, L.; Thabane, L.; Chaudhary, V.; Samaan, M.C. Global Prevalence of Diabetic Retinopathy in Pediatric Type 2 Diabetes: A Systematic Review and Meta-analysis. JAMA Netw. Open 2023, 6, e231887. [Google Scholar] [CrossRef]
  9. Demir, S.; Nawroth, P.P.; Herzig, S.; Ekim Üstünel, B. Emerging targets in type 2 dia-betes and diabetic complications. Adv Sci. 2021, 8, 2100275. [Google Scholar] [CrossRef]
  10. Meir, J.; Huang, L.; Mahmood, S.; Whiteson, H.; Cohen, S.; Aronow, W.S. The vascular complications of diabetes: a review of their management, pathogenesis, and prevention. Expert Rev. Endocrinol. Metab. 2024, 19, 11–20. [Google Scholar] [CrossRef]
  11. Chhetri, B.K.; Ali, N.A.A0; Setzer, W.N. A Survey of Chemical Compositions and Biological Activities of Yemeni Aromatic Medicinal Plants. Medicines 2015, 2, 67–92. [Google Scholar] [CrossRef]
  12. Szopa, A.; Ekiert, R.; Ekiert, H. Current knowledge of Schisandra chinensis (Turcz.) Baill. (Chinese magnolia vine) as a medicinal plant species: a review on the bioactive components, pharmacological properties, analytical and biotechnological studies. Phytochem Rev 2017, 16, 195–218. [Google Scholar] [CrossRef] [PubMed]
  13. Moradi, F.; Sedaghat, S.; Moradi, O.; Arab Salmanabadi, S. Review on green nano-biosynthesis of silver nanoparticles and their biological activities: With an emphasis on medicinal plants. Inorg. Nano-Met. Chem. 2021, 51, 133–142. [Google Scholar] [CrossRef]
  14. Iamonico, D. Taxonomic revision of the genus Amaranthus (Amaranthaceae) in Italy. Phytotaxa 2015, 199, 1–84. [Google Scholar] [CrossRef]
  15. Bavarva, J.H.; Narasimhacharya, A.V. Systematic study to evaluate anti-diabetic potential of Amaranthus spinosus on type-1 and type-2 diabetes. Cell Mol Biol (Noisy-le-grand). 2013, 59, OL1818–OL1825. [Google Scholar] [PubMed]
  16. Mondal, A.; Guria, T.; Maity, T.K. A new ester of fatty acid from a methanol extract of the whole plant of Amaranthus spinosus and its α-glucosidase inhibitory activity. Pharm Biol. 2015, 53, 600–604. [Google Scholar] [CrossRef]
  17. Phoswa, W.N.; Mokgalaboni, K. Comprehensive Overview of the Effects of Amaranthus and Abelmoschus esculentus on Markers of Oxidative Stress in Diabetes Mellitus. Life (Basel). 2023, 13, 1830. [Google Scholar] [CrossRef]
  18. Prince, M.R.U.; Zihad, S.M.N.K.; Ghosh, P.; Sifat, N.; Rouf, R.; Al Shajib, G.M.; Alam, M.A.; Shilpi, J.A.; Uddin, S.J. Amaranthus spinosus Attenuated Obesity-Induced Metabolic Disorders in High-Carbohydrate-High-Fat Diet-Fed Obese Rats. Front nutr.. 2021, 8, 653918. [Google Scholar] [CrossRef]
  19. Atchou, K.; Lawson-Evi, P.; Metowogo, K.; Eklu-Gadegbeku, K.; Aklikokou, K.; Gbeassor, M. Hypoglycemic effect and antioxidant potential of Pterocarpus erinaceus Poir. stem bark and Amaranthus spinosus L. roots extracts. Int. J. Pharm. Sci. 2020, 12, 340–350. [Google Scholar]
  20. Atchou, K.; Lawson-Evi, P.; Eklu-Gadegbeku, K. In vitro study of protective effect of Pterocarpus erinaceus Poir. stem bark and Amaranthus spinosus L. root extracts on cataractogenesis and glomerulopathy. Bull. Natl Res Cent 2021, 45, 1–9. [Google Scholar] [CrossRef]
  21. Iqbal, J.; Al Qarni, A.; Hawwari, A.; Alghanem, A.F.; Ahmed, G. Metabolic Syndrome, Dyslipidemia and Regulation of Lipoprotein Metabolism. Curr. Diabetes Rev. 2018, 14, 427–433. [Google Scholar] [CrossRef]
  22. Kerr, A.G.; Andersson, D.P.; Dahlman, I.; Rydén, M.; Arner, P. Adipose Insulin Resistance Associates With Dyslipidemia Independent of Liver Resistance and Involves Early Hormone Signaling. Arterioscler., Thromb., Vasc. Biol. 2023, 43, 1054–1065. [Google Scholar] [CrossRef] [PubMed]
  23. Pirillo, A.; Casula, M.; Olmastroni, E.; Norata, G.D.; Catapano, A.L. Global epidemiology of dyslipidaemias. Nat. Rev. Cardiol. 2021, 18, 689–700. [Google Scholar] [CrossRef]
  24. Zhang, T.; Duan, F.; Qian, Y.; Zhang, J.; Sun, H.; Wan, N. TG/HDL-C Ratio for Predicting Insulin Resistance in Obese Children from Beijing, China. Endocr Metab Immune Disord Drug Targets 2023, 24, 1101–1109. [Google Scholar] [CrossRef]
  25. Haghikia, A.; Landmesser, U. Lipoproteins and Cardiovascular Redox Signaling: Role in Atherosclerosis and Coronary Disease. Antioxid Redox Signal. 2018, 29, 337–352. [Google Scholar] [CrossRef] [PubMed]
  26. Ferraro, F.; Martín, M.; Verona, J.; Gilligan, L.; Verona, M.F.; Botta, E.; Tetzlaff, W.; Lozano Chiappe, E.; Boero, L.; Brites, F. Increased Cholesteryl Ester Transfer Protein and Lipoprotein-Associated Phospholipase A2 Activities in Children and Adolescents Presenting High Triglyceride/High-Density Lipoprotein Cholesterol (TG/HDL-C) Ratio. “Indian J. Pediatr. 2021, 88, 1180–1186. [Google Scholar] [CrossRef] [PubMed]
  27. Soumya, R.S.; Raj, K.B.; Abraham, A. Passiflora edulis (var. Flavicarpa) Juice Supplementation Mitigates Isoproterenol-induced Myocardial Infarction in Rats. Plant Foods Hum Nutr 2021, 76, 189–195. [Google Scholar] [CrossRef]
  28. Minato-Inokawa, S.; Tsuboi-Kaji, A.; Honda, M.; Takeuchi, M.; Kitaoka, K.; Kurata, M.; Wu, B.; Kazumi, T.; Fukuo, K. Associations of alanine aminotransferase/aspartate aminotransferase with insulin resistance and β-cell function in women. Sci. Rep. 2023, 13, 7853. [Google Scholar] [CrossRef]
  29. Fletcher, J.A.; Deja, S.; Satapati, S.; Fu, X.; Burgess, S.C.; Browning, J.D. Impaired ketogenesis and increased acetyl-CoA oxidation promote hyperglycemia in human fatty liver. JCI insight 2019, 5, e127737. [Google Scholar] [CrossRef]
  30. An, Y.; Xu, B.T.; Wan, S.R.; Ma, X.M.; Long, Y.; Xu, Y.; Jiang, Z.Z. The role of oxidative stress in diabetes mellitus-induced vascular endothelial dysfunction. Cardiovasc. Diabetol. 2023, 22, 237. [Google Scholar] [CrossRef]
  31. Sagoo, M.K.; Gnudi, L. Diabetic Nephropathy: An Overview. Methods Mol Biol 2020, 2067, 3–7. [Google Scholar] [CrossRef]
  32. Chawla, S.; Trehan, S.; Chawla, A.; Jaggi, S.; Chawla, R.; Kumar, V.; Singh, D. Relationship between diabetic retinopathy microalbuminuria and other modifiable risk factors. Prim. Care Diabetes 2021, 15, 567–570. [Google Scholar] [CrossRef]
  33. Thipsawat, S. Early detection of diabetic nephropathy in patient with type 2 diabetes mellitus: A review of the literature. Diabetes Vasc Dis Res. 2021, 18, 14791641211058856. [Google Scholar] [CrossRef] [PubMed]
  34. Perry, R.J.; Rabin-Court, A.; Song, J.D.; Cardone, R.L.; Wang, Y.; Kibbey, R.G.; Shulman, G.I. Dehydration and insulinopenia are necessary and sufficient for euglycemic ketoacidosis in SGLT2 inhibitor-treated rats. Nat. Commun. 2019, 10, 548. [Google Scholar] [CrossRef] [PubMed]
  35. Shum, M.; Segawa, M.; Gharakhanian, R.; Viñuela, A.; Wortham, M.; Baghdasarian, S.; Wolf, D.M.; Sereda, S.B.; Nocito, L.; Stiles, L.; Zhou, Z.; Gutierrez, V.; Sander, M.; Shirihai, O.S.; Liesa, M. Deletion of ABCB10 in beta-cells protects from high-fat diet induced insulin resistance. Mol. Metab. 2022, 55, 101403. [Google Scholar] [CrossRef] [PubMed]
  36. Lawson-Evi, P.; Motto, A.E.; Atchou, K.; Tona, K.; Eklu-Gadegbeku, K.; Aklikokou, K. Insulinomimetic activity assessment of antidiabetic plants used in togolese pharmacopoeia, in ovo and ex vivo study. Int J Biol Sci. 2021, 21, 1–9. [Google Scholar] [CrossRef]
  37. Park, S.Y.; Gautier, J.F.; Chon, S. Assessment of Insulin Secretion and Insulin Resistance in Human. Diabetes Metab J 2021, 45, 641–654. [Google Scholar] [CrossRef]
  38. Caturano, A.; D’Angelo, M.; Mormone, A.; Russo, V.; Mollica, M.P.; Salvatore, T.; Galiero, R.; Rinaldi, L.; Vetrano, E.; Marfella, R.; Monda, M.; Giordano, A.; Sasso, F.C. Oxidative Stress in Type 2 Diabetes: Impacts from Pathogenesis to Lifestyle Modifications. Curr. Issues Mol. Biol. 2023, 45, 6651–6666. [Google Scholar] [CrossRef]
  39. Sun, Y.; Tao, Q.; Wu, X.; Zhang, L.; Liu, Q.; Wang, L. The Utility of Exosomes in Diagnosis and Therapy of Diabetes Mellitus and Associated Complications. Front. endocrinol. 2021, 12, 756581. [Google Scholar] [CrossRef]
  40. Zhu, J.; Hu, Z.; Luo, Y.; Liu, Y.; Luo, W.; Du, X.; Luo, Z.; Hu, J.; Peng, S. Diabetic peripheral neuropathy: pathogenetic mechanisms and treatment. Front. Endocrinol. 2024, 14, 1265372. [Google Scholar] [CrossRef]
  41. Chen, J.; Liu, Q.; He, J.; Li, Y. Immune responses in diabetic nephropathy: Pathogenic mechanisms and therapeutic target. Front. immunol. 2022, 13, 958790. [Google Scholar] [CrossRef]
  42. Ria, P.; De Pascalis, A.; Zito, A.; Barbarini, S.; Napoli, M.; Gigante, A.; Sorice, G.P. Diet and Proteinuria: State of Art. Int. J. Mol. Sci. 2022, 24, 44. [Google Scholar] [CrossRef] [PubMed]
  43. Gibelalde, A.; Amenabar Alonso, A.; Pinar-Sueiro, S.; Bilbao-Garay, I.; Juaristi Eizmendi, L.; Sampedro, A. Albuminuria as a biomarker of severity in diabetic retinopathy and in the response to intravitreal treatment in diabetic macular edema. Int. Ophthalmol. 2023, 43, 2049–2056. [Google Scholar] [CrossRef] [PubMed]
  44. Dash, S.; Chougule, A.; Mohanty, S. Correlation of Albuminuria and Diabetic Retinopathy in Type-II Diabetes Mellitus Patients. Cureus 2022, 14, e21927. [Google Scholar] [CrossRef]
  45. Chen, X.; Zhang, X.; Gong, Z.; Yang, Y.; Zhang, X.; Wang, Q.; Wang, Y.; Xie, R. The link between diabetic retinal and renal microvasculopathy is associated with dyslipidemia and upregulated circulating level of cytokines. Front. Public Health 2023, 10, 1040319. [Google Scholar] [CrossRef] [PubMed]
  46. Zhu, Y.; Xu, M.; Li, J.; Li, J.; Li, L.; Zhou, Y.; Song, Y.; Cai, Q. Peripheral white blood cell subtypes and the development/progression of diabetic macular edema in type 2 diabetic patients: a comparative study. Ann. Palliat. Med. 2022, 11, 2887–2896. [Google Scholar] [CrossRef]
  47. Xiang, E.; Han, B.; Zhang, Q.; Rao, W.; Wang, Z.; Chang, C.; Zhang, Y.; Tu, C.; Li, C.; Wu, D. Human umbilical cord-derived mesenchymal stem cells prevent the progression of early diabetic nephropathy through inhibiting inflammation and fibrosis. Stem Cell Res Ther 2020, 11, 336. [Google Scholar] [CrossRef] [PubMed]
  48. Mohandes, S.; Doke, T.; Hu, H.; Mukhi, D.; Dhillon, P.; Susztak, K. Molecular pathways that drive diabetic kidney disease. J Clin Invest. 2023, 133, e165654. [Google Scholar] [CrossRef]
  49. Tampe, D.; Schridde, L.; Korsten, P.; Ströbel, P.; Zeisberg, M.; Hakroush, S.; Tampe, B. Different Patterns of Kidney Fibrosis Are Indicative of Injury to Distinct Renal Compartments. Cells 2021, 10, 2014. [Google Scholar] [CrossRef]
  50. Atchou, K.; Lawson-Evi, P.; Diallo, A.; Eklu-Gadegbeku, K. Toxicological evaluation of the dried hydroethanolic extract of Amaranthus spinosus L. roots in Artemia salina larvae and Sprague Dawley rats. Clin. phytosci. 2021, 7, 1–9. [Google Scholar] [CrossRef]
  51. Atchou, K.; Lawson-Evi, P.; Eklu-Gadegbeku, K. Improvement of microvascular complications in STZ-diabetic rats treated with Pterocarpus erinaceus Poir. extract. Biochem. Biophys. Rep. 2023, 35, 101541. [Google Scholar] [CrossRef]
  52. Furman, B.L. Streptozotocin-Induced Diabetic Models in Mice and Rats. Curr. Protoc. 2021, 1, e78. [Google Scholar] [CrossRef] [PubMed]
  53. Feldman, A.T.; Wolfe, D. Tissue processing and hematoxylin and eosin staining. Methods Mol Biol. 2014, 1180, 31–43. [Google Scholar] [CrossRef] [PubMed]
  54. Patlolla, A.K.; Barnes, C.; Yedjou, C.; Velma, V.R.; Tchounwou, P.B. 2009 Oxidative stress, DNA damage, and antioxidant enzyme activity induced by hexavalent chromium in Sprague-Dawley rats. J. Environ. Toxicol. 2021, 24, 66–73. [Google Scholar] [CrossRef] [PubMed]
  55. Ellman, G.L. Tissue sulfhydryl groups. Arch. Biochem. Biophys. 1959, 82, 70–77. [Google Scholar] [CrossRef]
  56. Bradford, M.M. A rapid and sensitive method for the quantitation of microgram quantities of protein utilizing the principle of protein-dye binding. Anal. Biochem. 1976, 72, 248–254. [Google Scholar] [CrossRef]
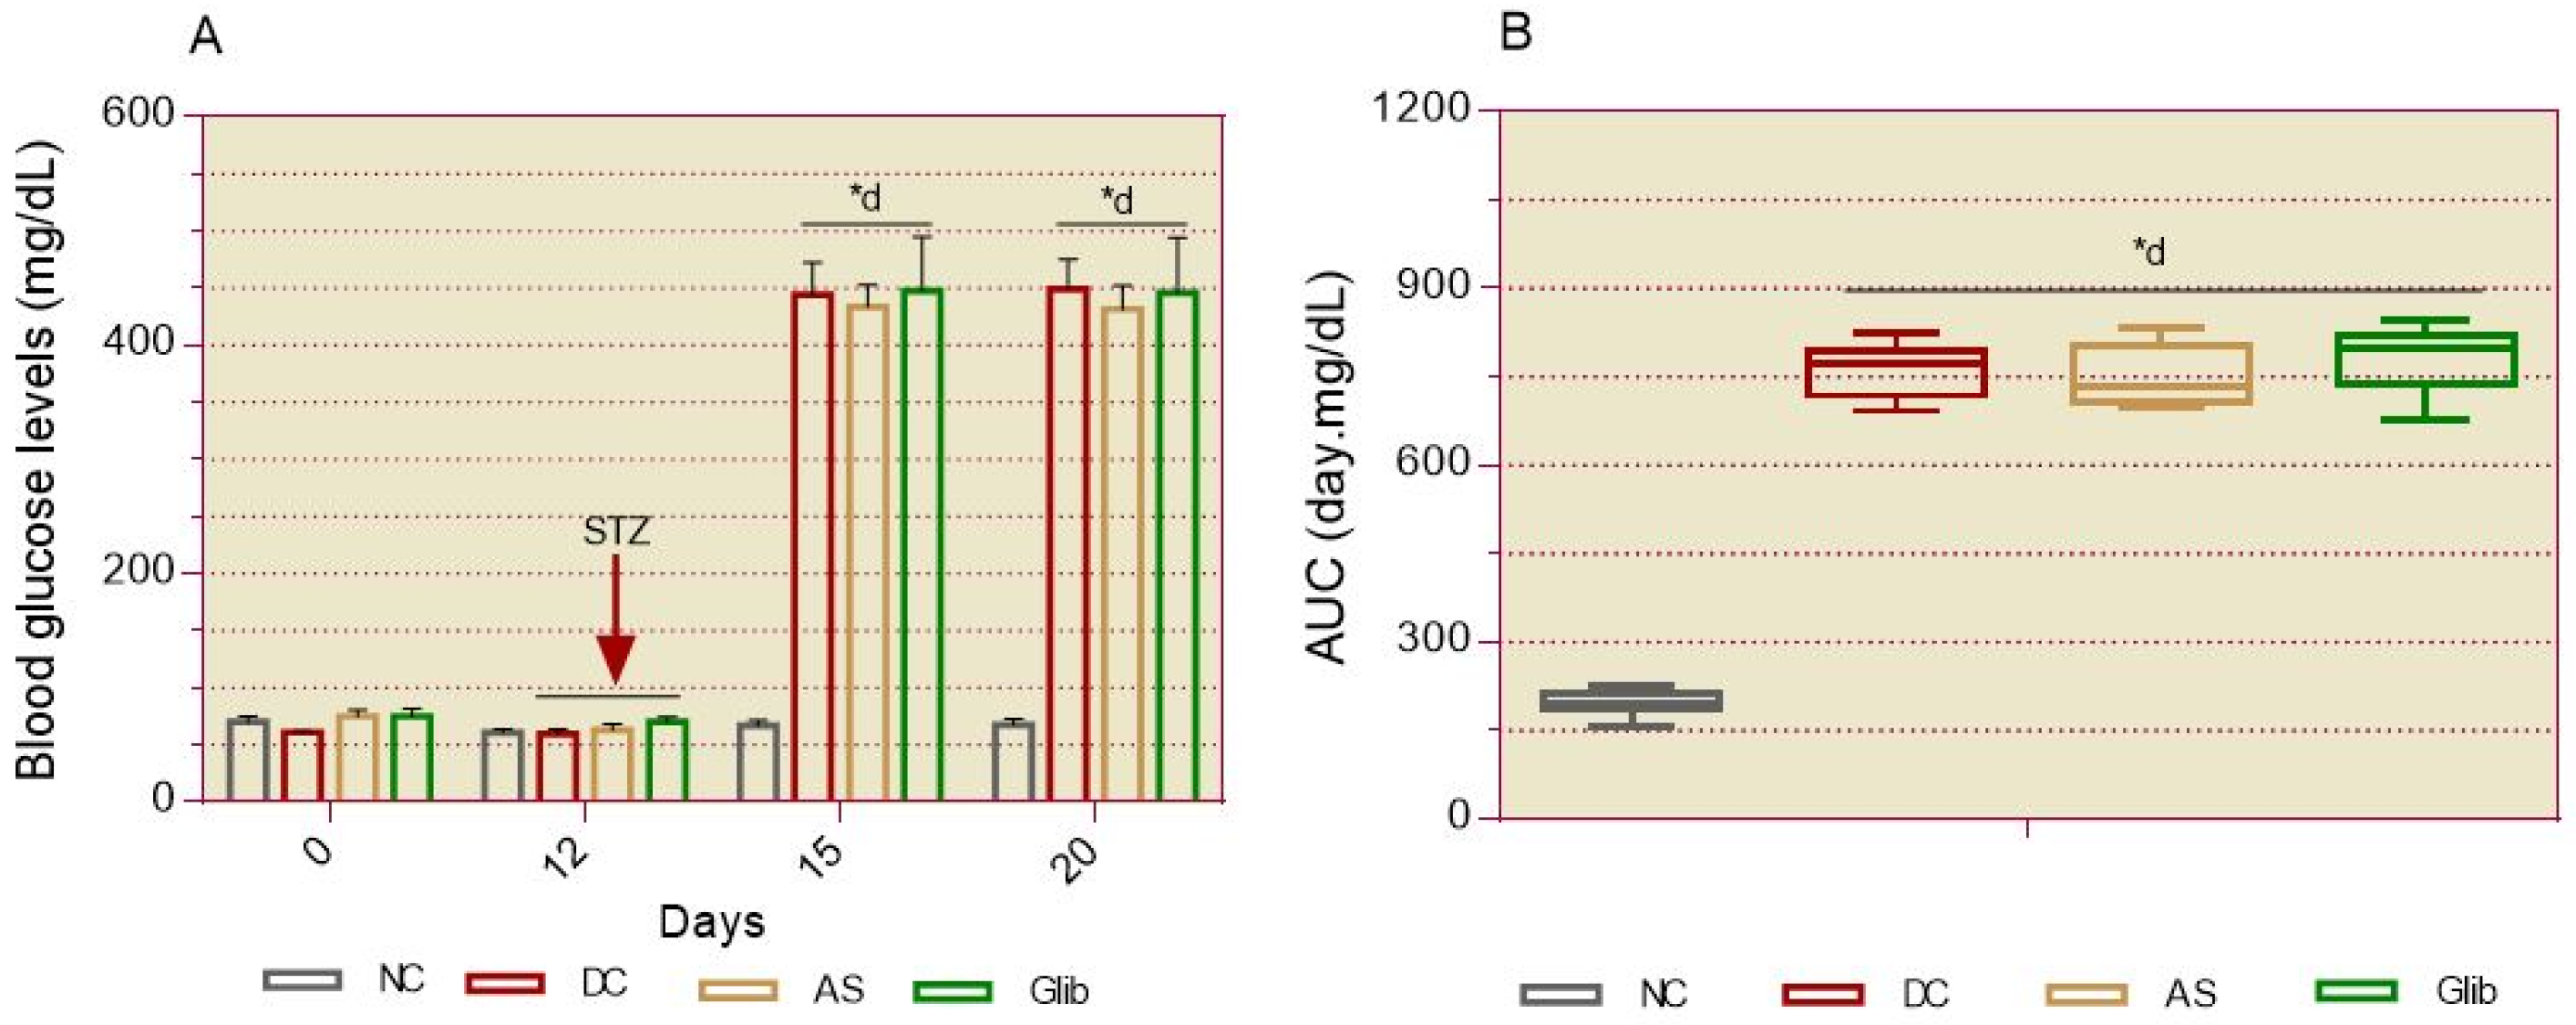
Figure 1. Effect of A. spinosus root extract on basal blood glucose in pretreated rats. A = blood glucose versus day; B = area under the curve of blood glucose. Glucose was recorded in rats fasted for 14 h from caudal vein blood for 20 days. NC = normal control; DC = diabetic control; AS 500 = treated with A. spinosus root extract at a dose of 500 mg/kg bw; Glib = treated with glibenclamide at a dose of 0.6 mg/kg bw. Values were analysed with two-way ANOVA and presented as mean ± SEM. *dp < 0.0001 vs. NC. n = 6.
Preprints 121860 g001
Figure 2. Effect of A. spinosus root extract on cardiovascular markers. A = lipid profile; B = cardiovascular indices. Serum biochemical markers were measured at the end of day 20 in all groups . TC = total cholesterol; LDL-C = low-density lipoprotein cholesterol; HDL-C = high-density lipoprotein cholesterol; TG = triglycerides; GHR = Fasting blood glucose to HDL-C ratio; TyG = triglyceride-glucose index. NC = normal control; DC = diabetic control; AS 500 = treated with A. spinosus root extract at a dose of 500 mg/kg bw; Glib = treated with glibenclamide at a dose of 0.6 mg/kg bw. Values were analysed with 2-way ANOVA and presented as mean ± SEM. *dp < 0.0001, *cp < 0.001 vs. NC. n = 6.
Preprints 121860 g002
Figure 3. Effect of A. spinosus root extract on hepatic and cardiac serum biochemical markers in pretreated rats. Serum biochemical markers were measured at the end of day 20 in all groups. ASAT = aspartate aminotransferase; ALAT = alanine aminotransferase; CK = creatine kinase. NC = normal control; DC = diabetic control; AS 500 = treated with A. spinosus root extract at a dose of 500 mg/kg bw; Glib = treated with glibenclamide at a dose of 0.6 mg/kg bw. Values were analysed with 2-way ANOVA and presented as mean ± SEM. *dp < 0.0001 vs. NC. n = 6.
Preprints 121860 g003
Figure 4. Effect of A. spinosus root extract on renal serum and urine biochemical markers in pretreated rats. Serum and urine biochemical markers were measured at the end of day 20 in all groups. Cr = creatinine; RBC = red blood cells; WBC = white blood cells. NC = normal control; DC = diabetic control; AS 500 = treated with A. spinosus root extract at a dose of 500 mg/kg bw; Glib = treated with glibenclamide at a dose of 0.6 mg/kg bw. Values were analysed with 2-way ANOVA and presented as mean ± SEM. *dp < 0.0001 vs. NC. n = 6.
Preprints 121860 g004
Figure 5. Effect of A. spinosus root extract on body weight change in diabetic rats. A = body weight change versus day; B = area under the curve of daily body weight change. Body weight was recorded daily in rats for 3 weeks during treatment. NC = normal control; DC = diabetic control; AS 500 = treated with A. spinosus root extract at a dose of 500 mg/kg bw; Glib = treated with glibenclamide at a dose of 0.6 mg/kg bw. Values were analysed with 2-way ANOVA and presented as mean ± SEM. *ap < 0.05; *bp < 0.01; *dp < 0.0001 vs. NC. cp < 0.001; dp < 0.0001 vs. DC. n = 6.
Preprints 121860 g005
Figure 6. Effect of A. spinosus root extract on water and food consumption in diabetic rats. Water and food consumed (A & B) were recorded daily for 3 weeks during the treatment in all groups. NC = normal control; DC = diabetic control; AS 500 = treated with A. spinosus root extract at a dose of 500 mg/kg bw; Glib = treated with glibenclamide at a dose of 0.6 mg/kg bw. Values were analysed with 2-way ANOVA and presented as mean ± SEM. *dp < 0.0001 vs. NC. dp < 0.0001 vs. DC. n = 6.
Preprints 121860 g006
Figure 7. Effect of A. spinosus root extract on basal blood glucose in diabetic rats. A = blood glucose versus day, B = area under the curve of blood glucose. Blood glucose was recorded in rats fasted for 14 h from caudal vein blood for three weeks. NC = normal control, DC = diabetic control; AS 500 = treated with A. spinosus root extract at a dose of 500 mg/kg bw; Glib = treated with glibenclamide at a dose of 0.6 mg/kg bw. Values were analysed with 2-way ANOVA and presented as mean ± SEM. *dp < 0.0001 vs. NC. dp < 0.0001 vs. DC. n = 6.
Preprints 121860 g007
Figure 8. Effect of A. spinosus root extract on oral glucose intolerance in diabetic rats. A = blood glucose versus time, B = area under the curve of blood glucose. The rats were subjected to the oral glucose tolerance test at the end of 3-week treatment. After 14 hours of fasting, rats were orally administered 2 g/kg glucose, and blood glucose was measured from caudal vein blood for 180 minutes. NC = normal control, DC = diabetic control; AS 500 = treated with A. spinosus root extract at a dose of 500 mg/kg bw; Glib = treated with glibenclamide at a dose of 0.6 mg/kg bw. Values were analysed with 2-way ANOVA and presented as mean ± SEM. *dp < 0.0001 vs. NC. dp < 0.0001 vs. DC. n = 6.
Preprints 121860 g008
Figure 9. Effect of A. spinosus root extract of on oxidative stress markers in diabetic rats. MDA and GSH were measured in the liver, eye, and kidney tissues (A, B , C) at the end of 3-week treatment in all groups. NC = normal control, DC = diabetic control; AS 500 = treated with A. spinosus root extract at a dose of 500 mg/kg bw; Glib = treated with glibenclamide at a dose of 0.6 mg/kg bw. Values were analysed with 2-way ANOVA and presented as mean ± SEM. *dp < 0.0001 vs. NC. dp < 0.0001 vs. DC. n = 6.
Preprints 121860 g009
Figure 10. Effect of A. spinosus root extract on cardiovascular markers at the end of treatment. A = lipid profile; B = cardiovascular indices. Serum biochemical markers were measured at the end of 3-week treatment in all groups. NC = normal control, DC = diabetic control; AS 500 = treated with A. spinosus root extract at a dose of 500 mg/kg bw; Glib = treated with glibenclamide at a dose of 0.6 mg/kg bw. TC = total cholesterol; LDL-C = low-density lipoprotein cholesterol; HDL-C = high-density lipoprotein cholesterol; TG = triglycerides; WHR = white blood cell counts to HDL-C ratio; MHR = monocyte counts to HDL-C ratio; GHR = Fasting blood glucose to HDL-C ratio; TyG = triglyceride-glucose index. Values were analysed with 2-way ANOVA and presented as mean ± SEM. *cp < 0.001, *dp < 0.0001 vs. NC. bp < 0.01, dp < 0.0001 vs. DC. n = 6.
Preprints 121860 g010
Figure 11. Effect of A. spinosus root extract on hepatic and cardiac serum biochemical markers in diabetic rats. Serum biochemical markers were measured at the end of the 3-week treatment in all groups. NC = normal control; DC = diabetic control; AS 500 = treated with A. spinosus root extract at a dose of 500 mg/kg bw; Glib = treated with glibenclamide at a dose of 0.6 mg/kg bw. ASAT = serum aspartate aminotransferases; ALAT = alanine aminotransferases; CK = creatine kinase. Values were analysed with 2-way ANOVA and presented as mean ± SEM. *dp < 0.0001 vs. NC. dp < 0.0001 vs. DC. n = 6.
Preprints 121860 g011
Figure 12. Effect of A. spinosus root extract on renal biochemical markers in diabetic rats. A = serum biochemical markers, B = urine biochemical markers. Urinary and serum biochemical markers were measured at the end of the 3-week treatment in all groups. NC = normal control, DC = diabetic control; AS 500 = treated with A. spinosus root extract at a dose of 500 mg/kg bw; Glib = treated with glibenclamide at a dose of 0.6 mg/kg bw. Values were analysed with 2-way ANOVA and presented as mean ± SEM. *ap < 0.05, *dp < 0.0001 vs. NC. dp < 0.0001 vs. DC. n = 6.
Preprints 121860 g012
Figure 13. Histological study of retinopathy in diabetic rats. a = histological section; b = retinal thickness. An autopsy was performed at the end of the 3-week treatment, then the eyes were removed and fixed in 10% formalin for histological studies. Histological sections were stained with H&E and observed under the light microscope at 400x magnification. A = normal control, B = diabetic control; C = treated with A. spinosus root extract at a dose of 500 mg/kg bw; D = treated with glibenclamide at a dose of 0.6 mg/kg bw; v = vitreous body; c = choroid; yellow line = retinal thickness; orange arrow = macular edema. Values were analysed with 1-way ANOVA and presented as mean ± SEM. *dp < 0.0001 vs. NC. dp < 0.0001 vs. DC. n = 6.
Preprints 121860 g013
Figure 14. Histological study for renal fibrosis in diabetic rats. An autopsy was performed at the end of the 3-week treatment, and then the kidneys were removed and fixed in 10% formalin for histological studies. Histological sections were stained with H&E and observed under a light microscope at 400x magnification. A = normal control, B = diabetic control; C = treated with A. spinosus root extract at a dose of 500 mg/kg bw; D = treated with glibenclamide at a dose of 0.6 mg/kg bw. Brown arrow = diabetic nodular glomerulosclerosis; dark red arrow = tubular fibrosis; orange arrow = enlarged Bowman’s space.
Preprints 121860 g014
Figure 15. Photograph of aerial parts and root of Amaranthus spinosus L. harvested in Lome, Togo.
Preprints 121860 g015
Table 1. Effect of A. spinosus root extract on blood cell profile in diabetic rats.
Parameters NC DC AS Glib
Red blood cells
RBC (106/µL) 6.543 ± 0.109 5.807 ± 0.175 6.507 ± 0.139 6.202 ± 0.160
HGB (g/dL) 14.100 ± 0.191 13.217 ± 0.358 14.300 ± 0.211 13.467 ± 0.184
HCT (%) 37.433 ± 0.493 35.100 ± 0.334 39.317 ± 0.248 35.683 ± 0.363
MCV (fl) 57.017 ± 0.594 57.333 ± 0.285 57.265 ± 0.162 58.863 ± 0.397
MCH (pg) 21.500 ± 0.279 21.100 ± 0.231 21.195 ± 0.108 22.567 ± 0.213
MCHC (g/dL) 37.650 ± 0.437 36.583 ± 0.207 36.835 ± 0.176 38.213 ± 0.398
White blood cells
WBC (103/µL) 6.383 ± 0.190 3.417 ± 0.145*d 6.173 ± 0.281d 5.550 ± 0.118d
Neutrophils (103/µL) 2.568 ± 0.142 1.286± 0.087*b 2.474 ± 0.096c 2.165 ± 0.063c
Eosinophils (103/µL) 0.170 ± 0.030 0.073 ± 0.013*a 0.173 ± 0.017a 0.153 ± 0.019a
Basophils (103/µL) 0.010 ± 0.001 0.009 ± 0.001 0.011 ± 0.001 0.008 ± 0.001
Lymphocytes (103/µL) 3.234 ± 0.137 1.798 ± 0.083*c 3.191 ± 0.126c 2.909 ± 0.090c
Monocytes (103/µL) 0.402 ± 0.018 0.251 ± 0.032*a 0.326 ± 0.027 0.315 ± 0.031
Platelets
Platelets (106/µL) 0.609 ± 0.025 0.295 ± 0.027*c 0.570 ± 0.029b 0.613 ± 0.024b
Complete blood counts were performed at the end of treatment in all rats. NC = normal control; DC = diabetic control; AS = treated with Amaranthus spinosus extract 500 mg/kg bw; Glib = treated with glibenclamide 0.6 mg/kg bw. RBC = red blood cells; HGB = hemoglobin level; HTC = hematocrit; MCV = mean corpuscular volume; MCHC = mean corpuscular hemoglobin content; MCHC = mean corpuscular hemoglobin concentration; WBC = white blood cells. Values were analysed with 1-way ANOVA and then presented as mean ± SEM. *ap < 0.05, *bp < 0.01, *cp < 0.001 *dp < 0.0001, vs. NC. ap < 0.05, bp < 0.01, cp < 0.001 dp < 0.0001, vs. DC. n = 6.
Table 2. Effect of A. spinosus root extract on organ weight.
Organs (mg) NC DC AS Glib
Eyes 0.230 ± 0.012 0.352 ± 0.026 0.222 ± 0.014 0.243 ± 0.012
Kidneys 0.907 ± 0.066 1.110 ± 0.095 0.988 ± 0.044 1.020 ± 0.064
Liver 5.132 ± 0.136 6.448 ± 0.207*d 5.362 ± 0.140d 5.473 ± 0.153d
Heart 0.667 ± 0.046 0.655 ± 0.043 0.627 ± 0.062 0.650 ± 0.044
Lungs 0.950 ± 0.049 1.133 ± 0.037 1.107 ± 0.021 1.013 ± 0.060
Brain 1.560 ± 0.063 1.622 ± 0.032 1.473 ± 0.045 1.402 ± 0.119
The autopsy was performed at the end of the 3-week treatment, then the organs were removed and observed under an anatomical microscope. NC = normal control; DC = diabetic control; AS = treated with Amaranthus spinosus extract 500 mg/kg bw; Glib = treated with glibenclamide 0.6 mg/kg bw. Values were analysed with 1-way ANOVA and then presented as mean ± SEM. *dp < 0.0001, vs. NC; dp < 0.0001, vs. DC. n = 6.
Disclaimer/Publisher’s Note: The statements, opinions and data contained in all publications are solely those of the individual author(s) and contributor(s) and not of MDPI and/or the editor(s). MDPI and/or the editor(s) disclaim responsibility for any injury to people or property resulting from any ideas, methods, instructions or products referred to in the content.
Copyright: This open access article is published under a Creative Commons CC BY 4.0 license, which permit the free download, distribution, and reuse, provided that the author and preprint are cited in any reuse.
Prerpints.org logo

Preprints.org is a free preprint server supported by MDPI in Basel, Switzerland.

Subscribe

© 2024 MDPI (Basel, Switzerland) unless otherwise stated