1. Introduction
Pulmonary arterial hypertension (PAH) is a complex and fatal emergency of vascular disorder which affects more than 100 million people worldwide, and mainly found in neonates [
1,
2]. Compared with oral medicine or injection, inhaled nitric oxide (iNO), a pulmonary vasodilator approved by the Food and Drug Administration (FDA), offers several advantages in the PAH treatment such as noninvasive, targeted fast onset of action and less severe systemic adverse effect [
3,
4,
5]. This method, depending on the severity of disease, usually involves the continuous administration of NO gas in the range of 100 ppm by nasal plug or mask [
6,
7]. However, during treatment the concentration of NO delivered needs to be tightly controlled in the first place, otherwise it may cause a rebound in pulmonary arterial pressure and endanger the patient's life [
8]. Additionally, a certain amount of low concentration NO
2 may be generated during the transport of NO, which also should be precisely detected timely because such a toxic gas can directly endanger patient’s health when the concentration is above 3 ppm [
9,
10].
It’s worth noting that commercialized iNO systems generally using chemiluminescence devices to measure NO and NO
2, which limits the portability and leads to very high cost [
3,
11]. In recent years, with the rapid development of gas sensors, NOx gas sensors based on solid state YSZ (yttria-stabilized zirconia)-based electrolyte have received extensive attention from researchers due to their high selectivity, desirable sensitivity and satisfactory stability [
12,
13,
14,
15,
16,
17,
18]. Besides, YSZ-based sensors can be fabricated in planar configuration, greatly simplifying the structure of the sensor and facilitating the development of integration for commercially available products [
13,
19,
20]. However, currently reported mixed-potential NOx gas sensors mainly focus on the detection of NO and NO
2 in the middle-to-high concentration range of 100-500 ppm in automotive and industrial contexts [
21,
22,
23,
24,
25], while the iNO treatment instrument normally requires relatively low NOx detection limit. What’s more, it’s a great challenge to selectively detect 3 ppm NO
2 with 100 ppm NO interference, tens of times the difference in concentration. Herein, we proposed high performance YSZ-based NOx sensors by screening out optimal sensing materials. Sensing characteristics of the developed sensors were systematically studied. Besides, adsorption capabilities and electrochemical reactivity of these sensors were characteristics to clarified the working principle
2. Experimental
2.1. Fabrication of Sensors
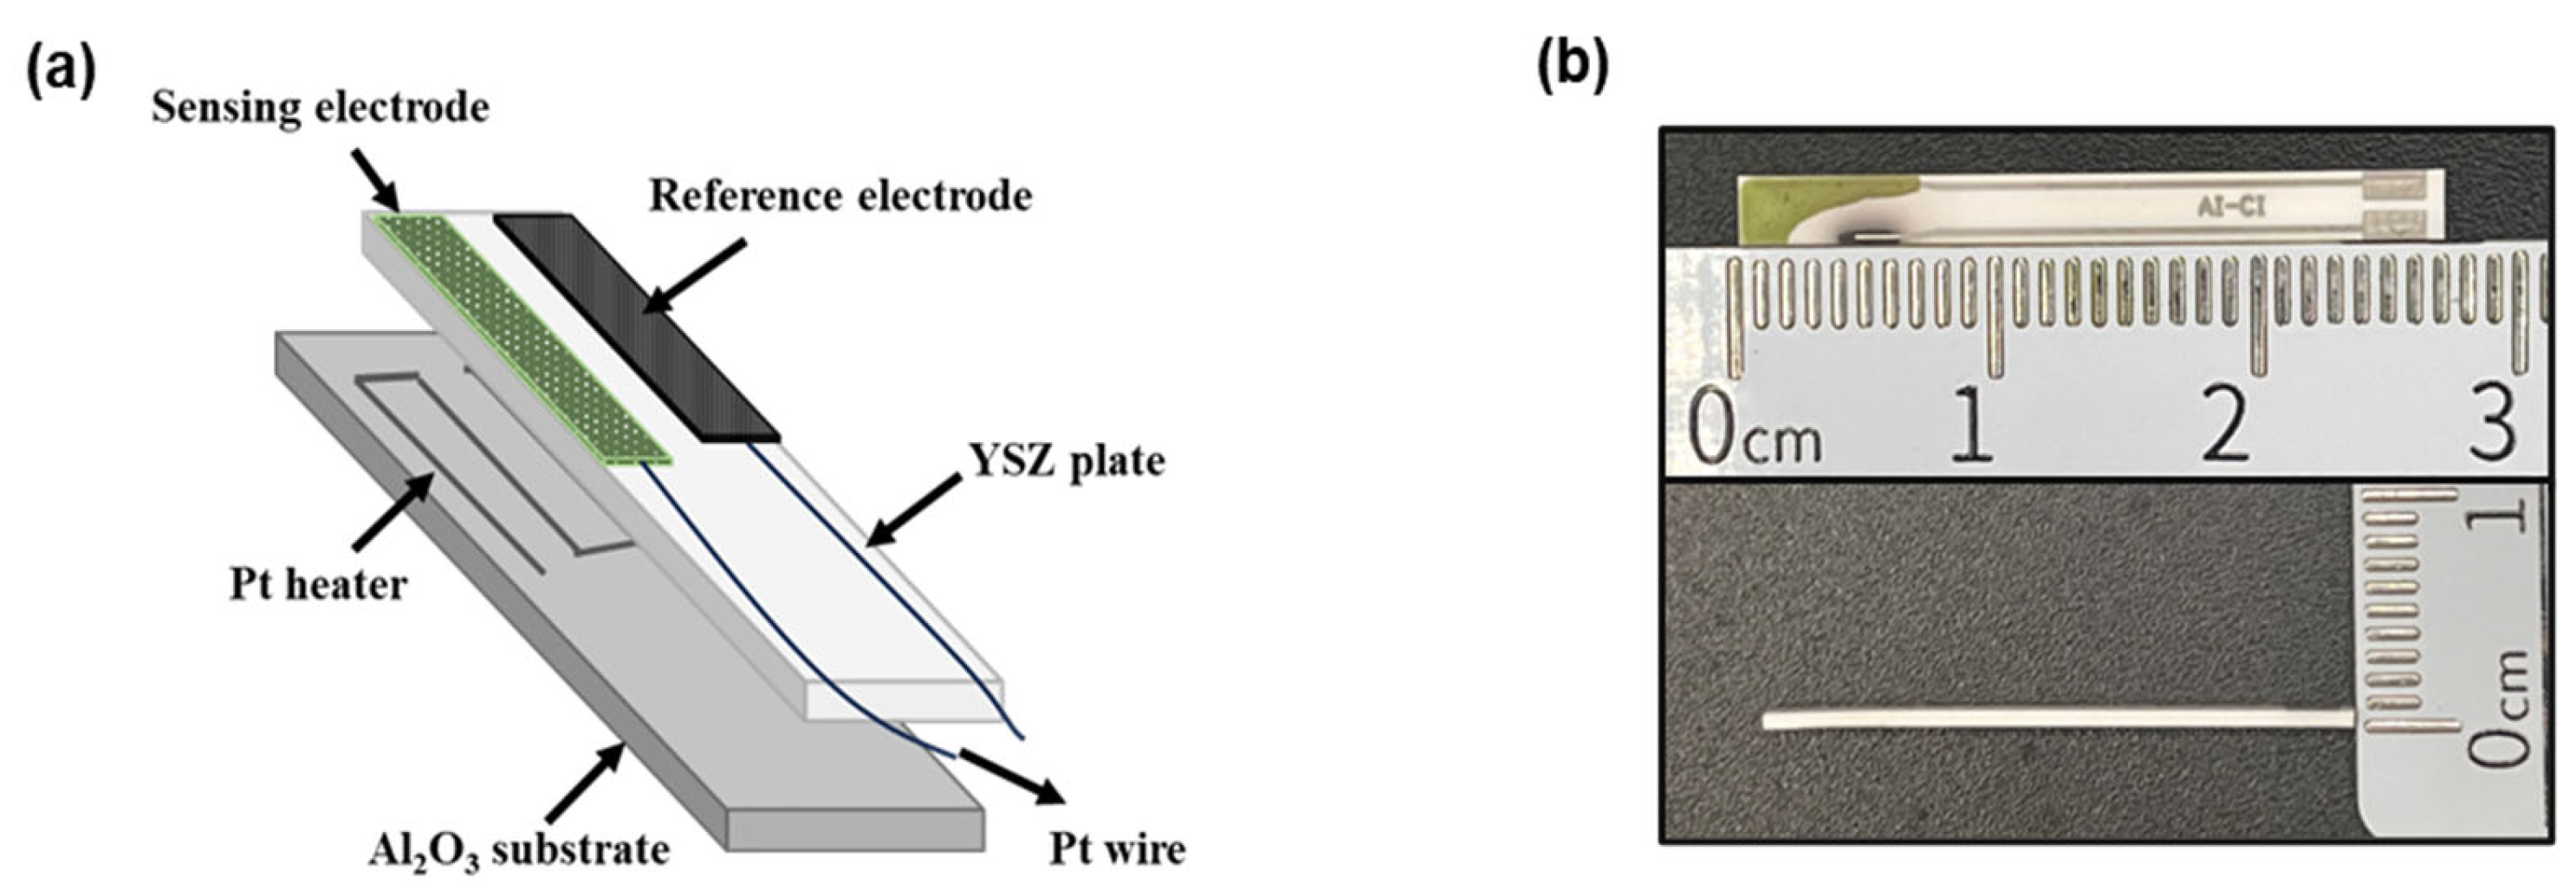
Figure 1 depicted the schematic components of the planar sensor. Initially, commercial MnO
2 powder (99% purity, Sigma-Aldrich Chemie GmbH, Taufkirchen, Germany) was thoroughly mixed with α-terpineol and the obtained paste was painted on the YSZ plate (length × width × thickness: 2.75 × 0.5 × 0.1 cm
3; NIKKATO CORPORATION, Osaka, Japan) , after drying at 130
oC for 4h, the YSZ plate attached with the MnO
2 layer was calcined at 1400
oC for 2h in a muffle furnace to form the Mn-based reference electrode (RE). Various commercial metal oxides (Sigma Aldrich Chemie GmbH, with a purity of 99%) were fabricated with the similar procedure and both calcined at high temperature for 2h to form the sensing electrodes (SE).
2.2. Evaluation of Sensing Characteristics
The fabricated sensor was set in a quartz tube, and alternatively exposed to the base gas (21 vol.% O2, N2 balance) or the sample gas containing NO, NO2 (total flow rate: 100 mL·min-1) for 5 minutes. The NO tested concentration range was 10-100 ppm in 21 vol% O2, N2 balance and the NO2 tested concentration range was 1.5-10 ppm in 21 vol% O2, N2 balance. An adjustable DC power supply (SS-3305D, A-BF, China) controls the Pt heater’s working voltage to provide a high working temperature for the sensors. The electrochemical signals were recorded by a Data Acquisition/Switch Unit (34970A, Agilent, China) via Pt wire connected and the potential difference ΔV (ΔV=VSample gas – VBase gas) represented the sensor’s response to sample gas. The surface morphology of calcined powders was observed by Atomic Force Scanning Electron Microscope (Gemini 360, Carl Zeiss, Germany) with an excitation voltage of 15 kV and the crystalline phase was characterized by X-ray diffraction (D8 DaVinci, Bruker, Germany). Finally, microcantilever chips and an integrated Gas Sensing System (LoC-GSS 1000, High-End MEMS Technology, China) were utilized to test the sensing materials’ gas adsorption.
3. Results and Discussion
3.1. Screening of Nitric Oxide Sensing Materials and Developing High Performance NO Sensor
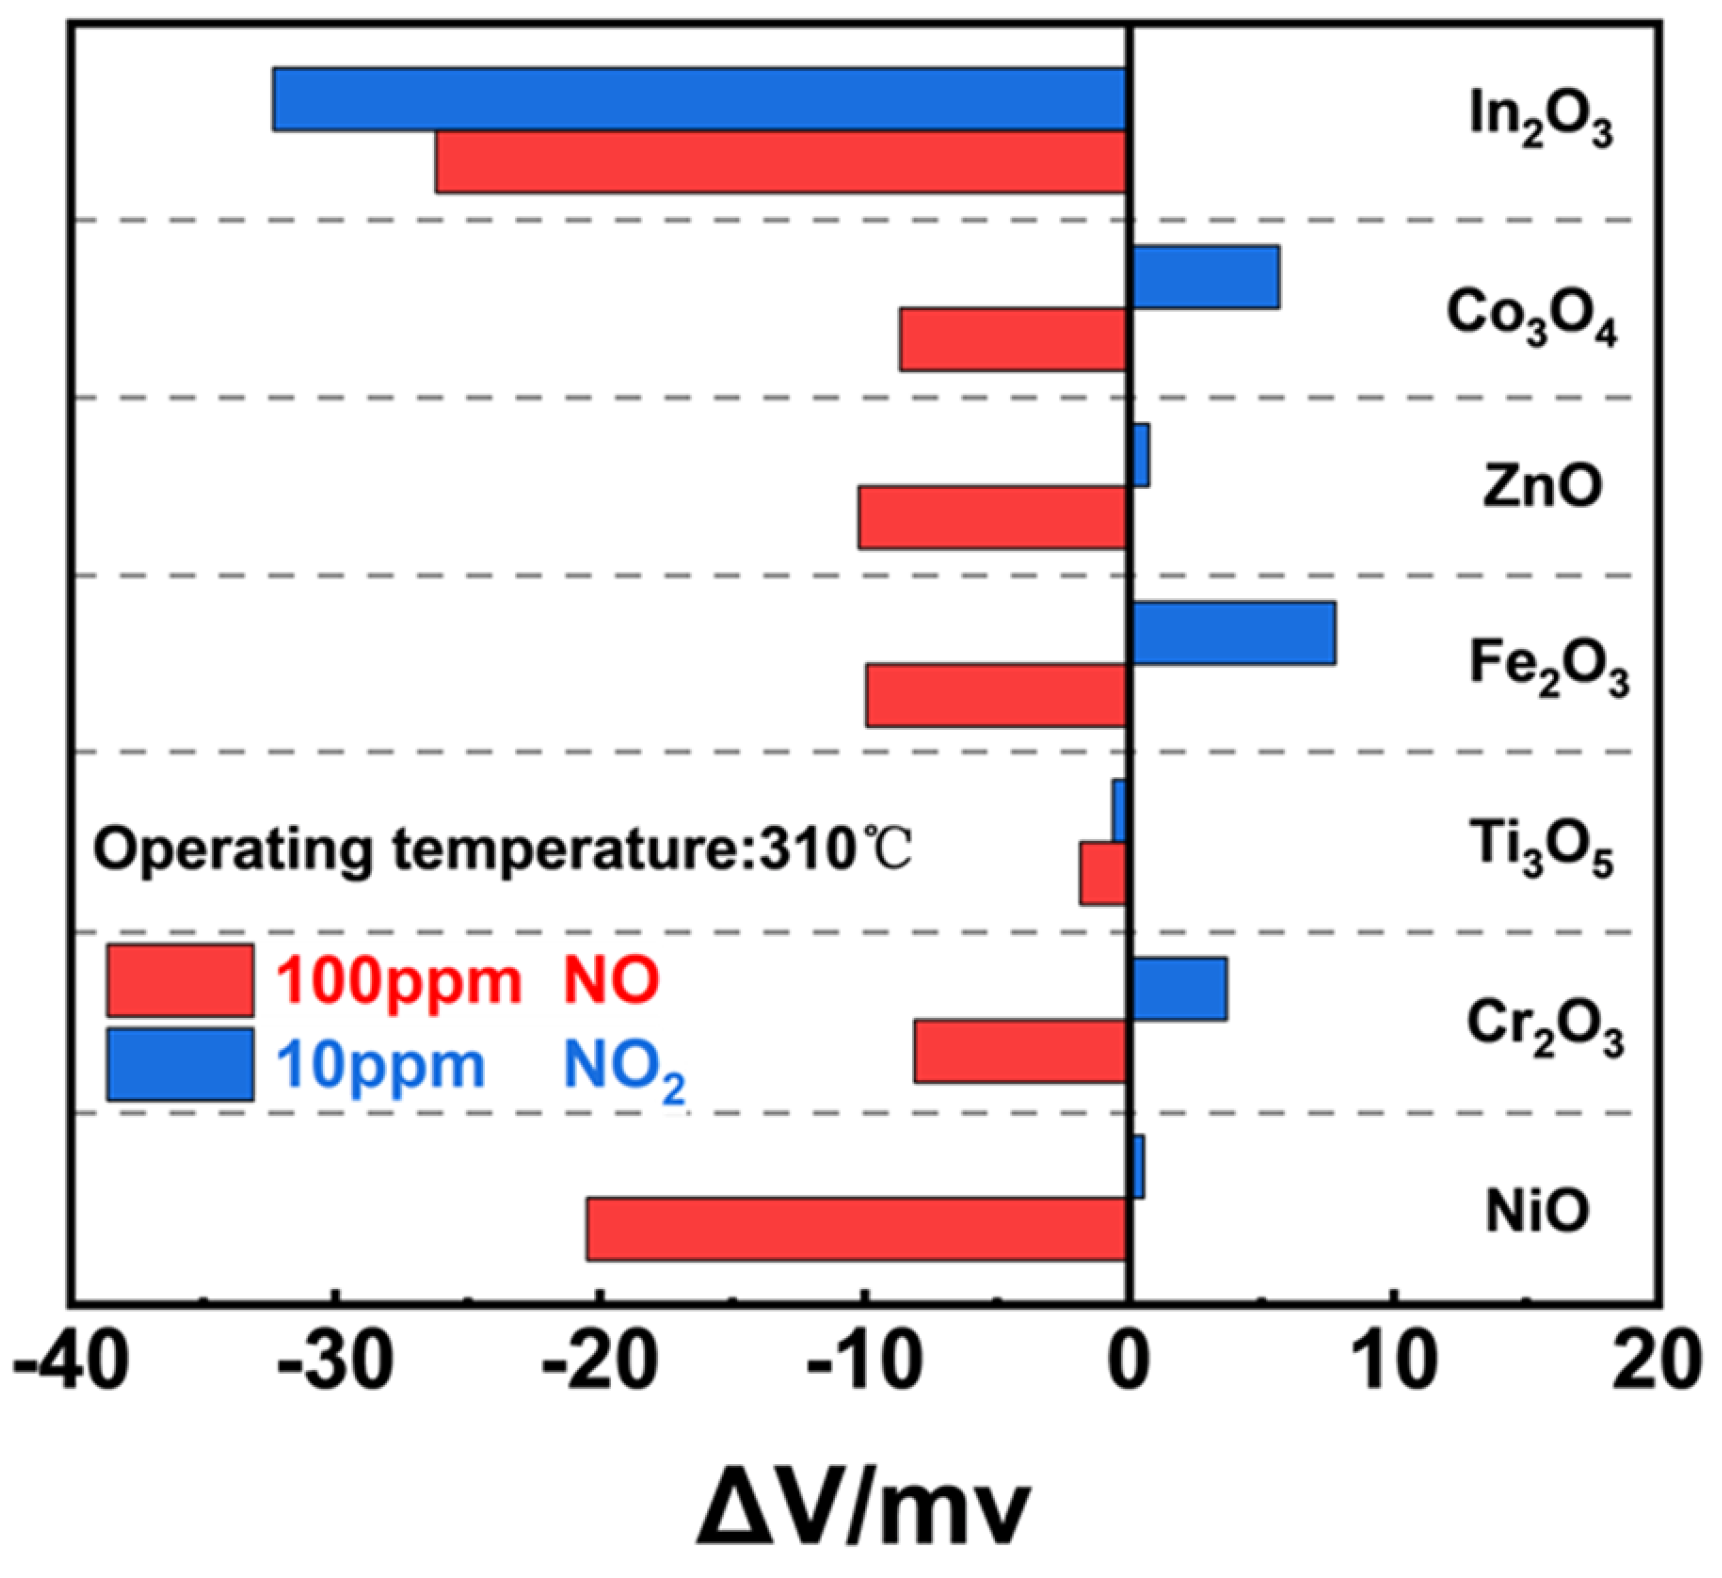
Several metal oxides were selected as potential candidate for NO sensing material and among the examined SEs, In
2O
3-SE gave not only the highest potential value to 100 ppm NO but also higher potential value to 10 ppm NO
2, resulting in poor NO selectivity (
Figure 2). In contrast, NiO-SE showed both desirable NO sensitivity and selectivity in compared with other examined materials. Consequently, NiO was pretended to be the optimal materials for NO detection due to the higher sensitivity and selectivity.
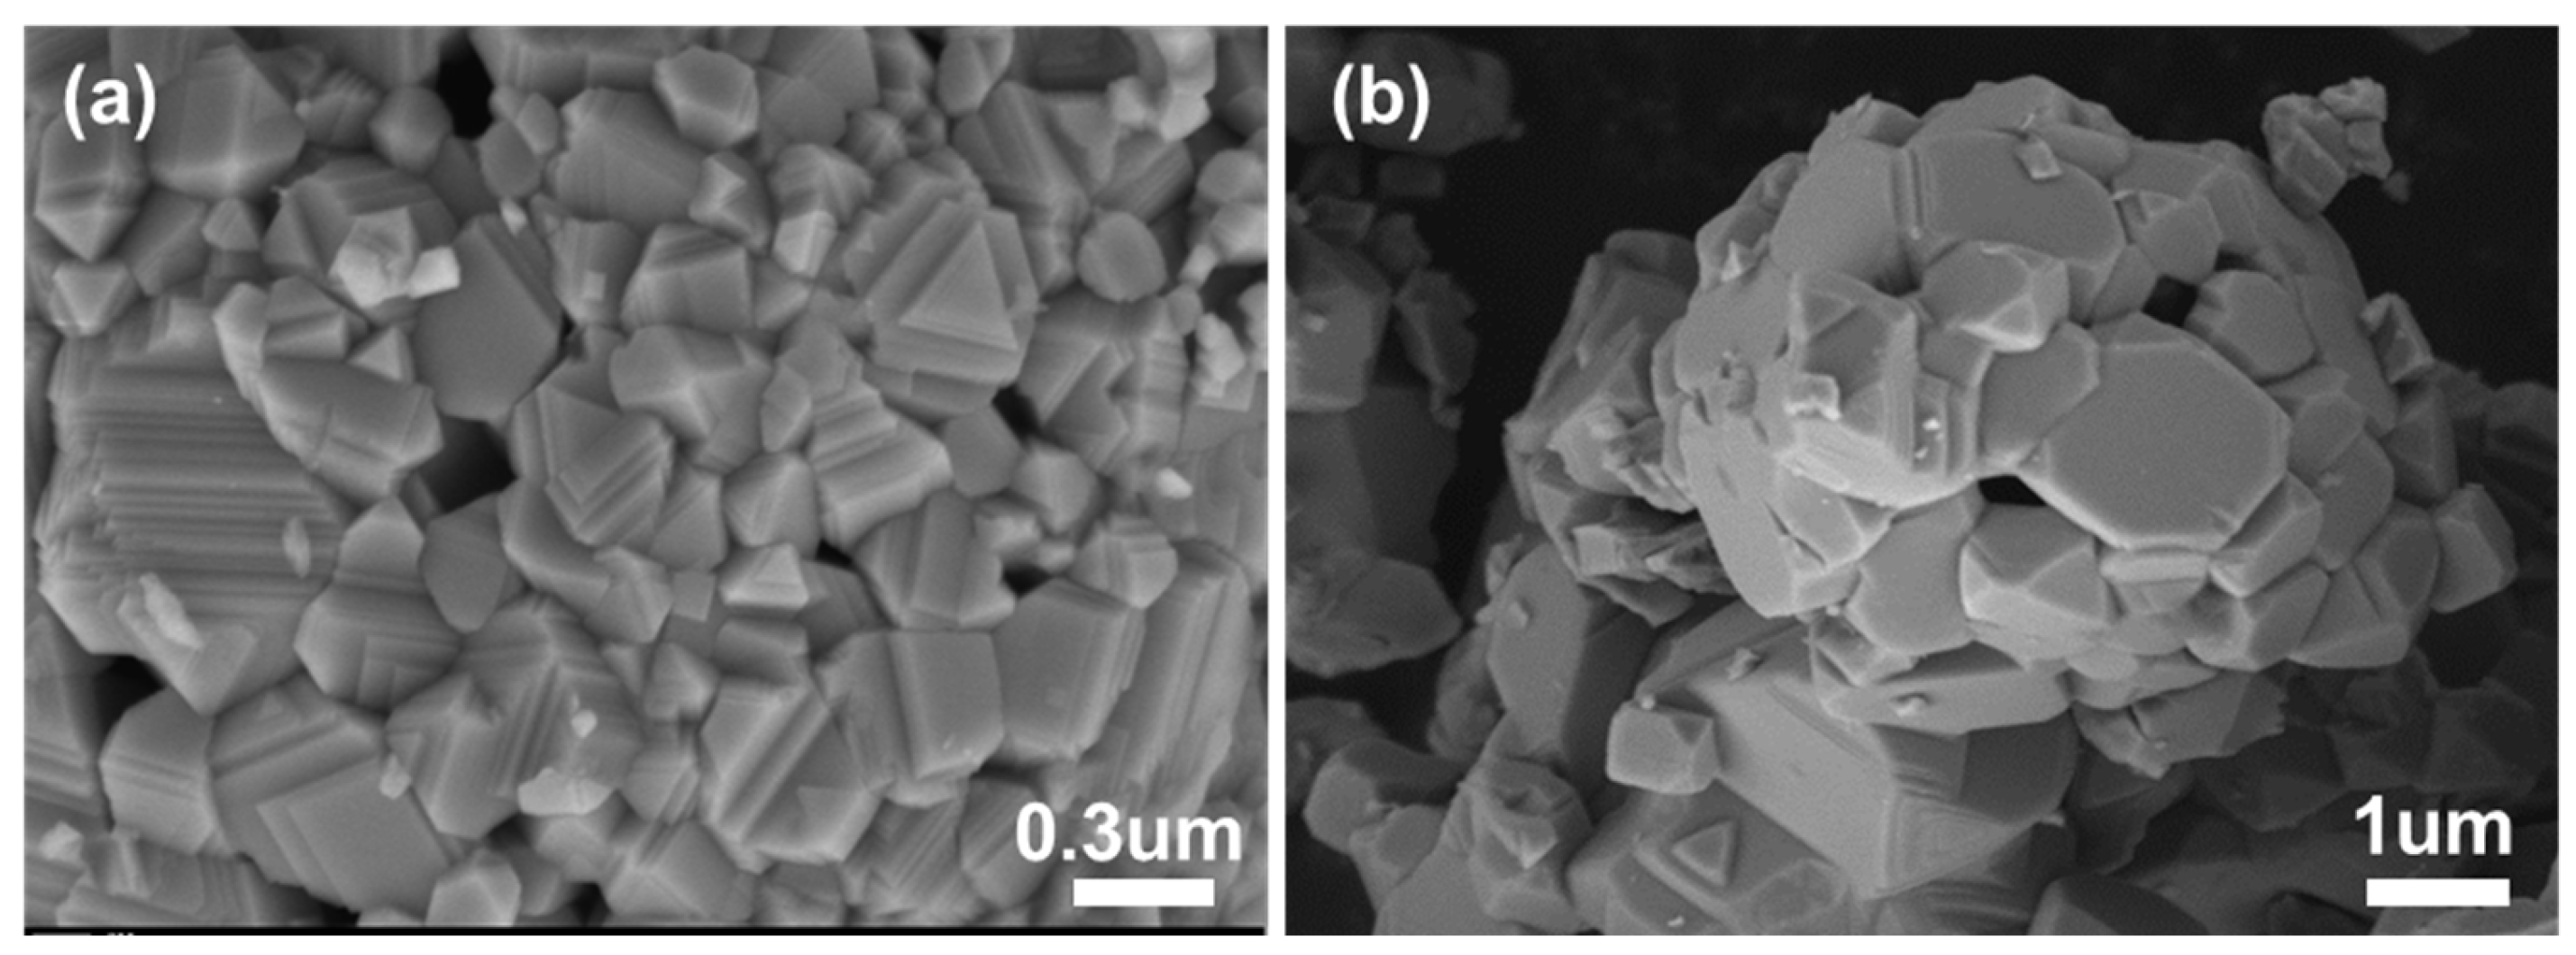
The SEM image in
Figure 3 showed that the NiO powder annealed at 1200℃ were plate-like and relatively compact. According to former research that plate-like metal oxides normally exhibited better selectivity to NO [
26,
27], we anticipated desirable selectivity for NiO towards NO when against NO
2.
To confirm the practicability of using NiO tracking high level of NO with high selectivity against 10 ppm NO
2, sensing characteristics of the YSZ-based gas sensor comprised of NiO-SE vs. Mn-based RE was studied.
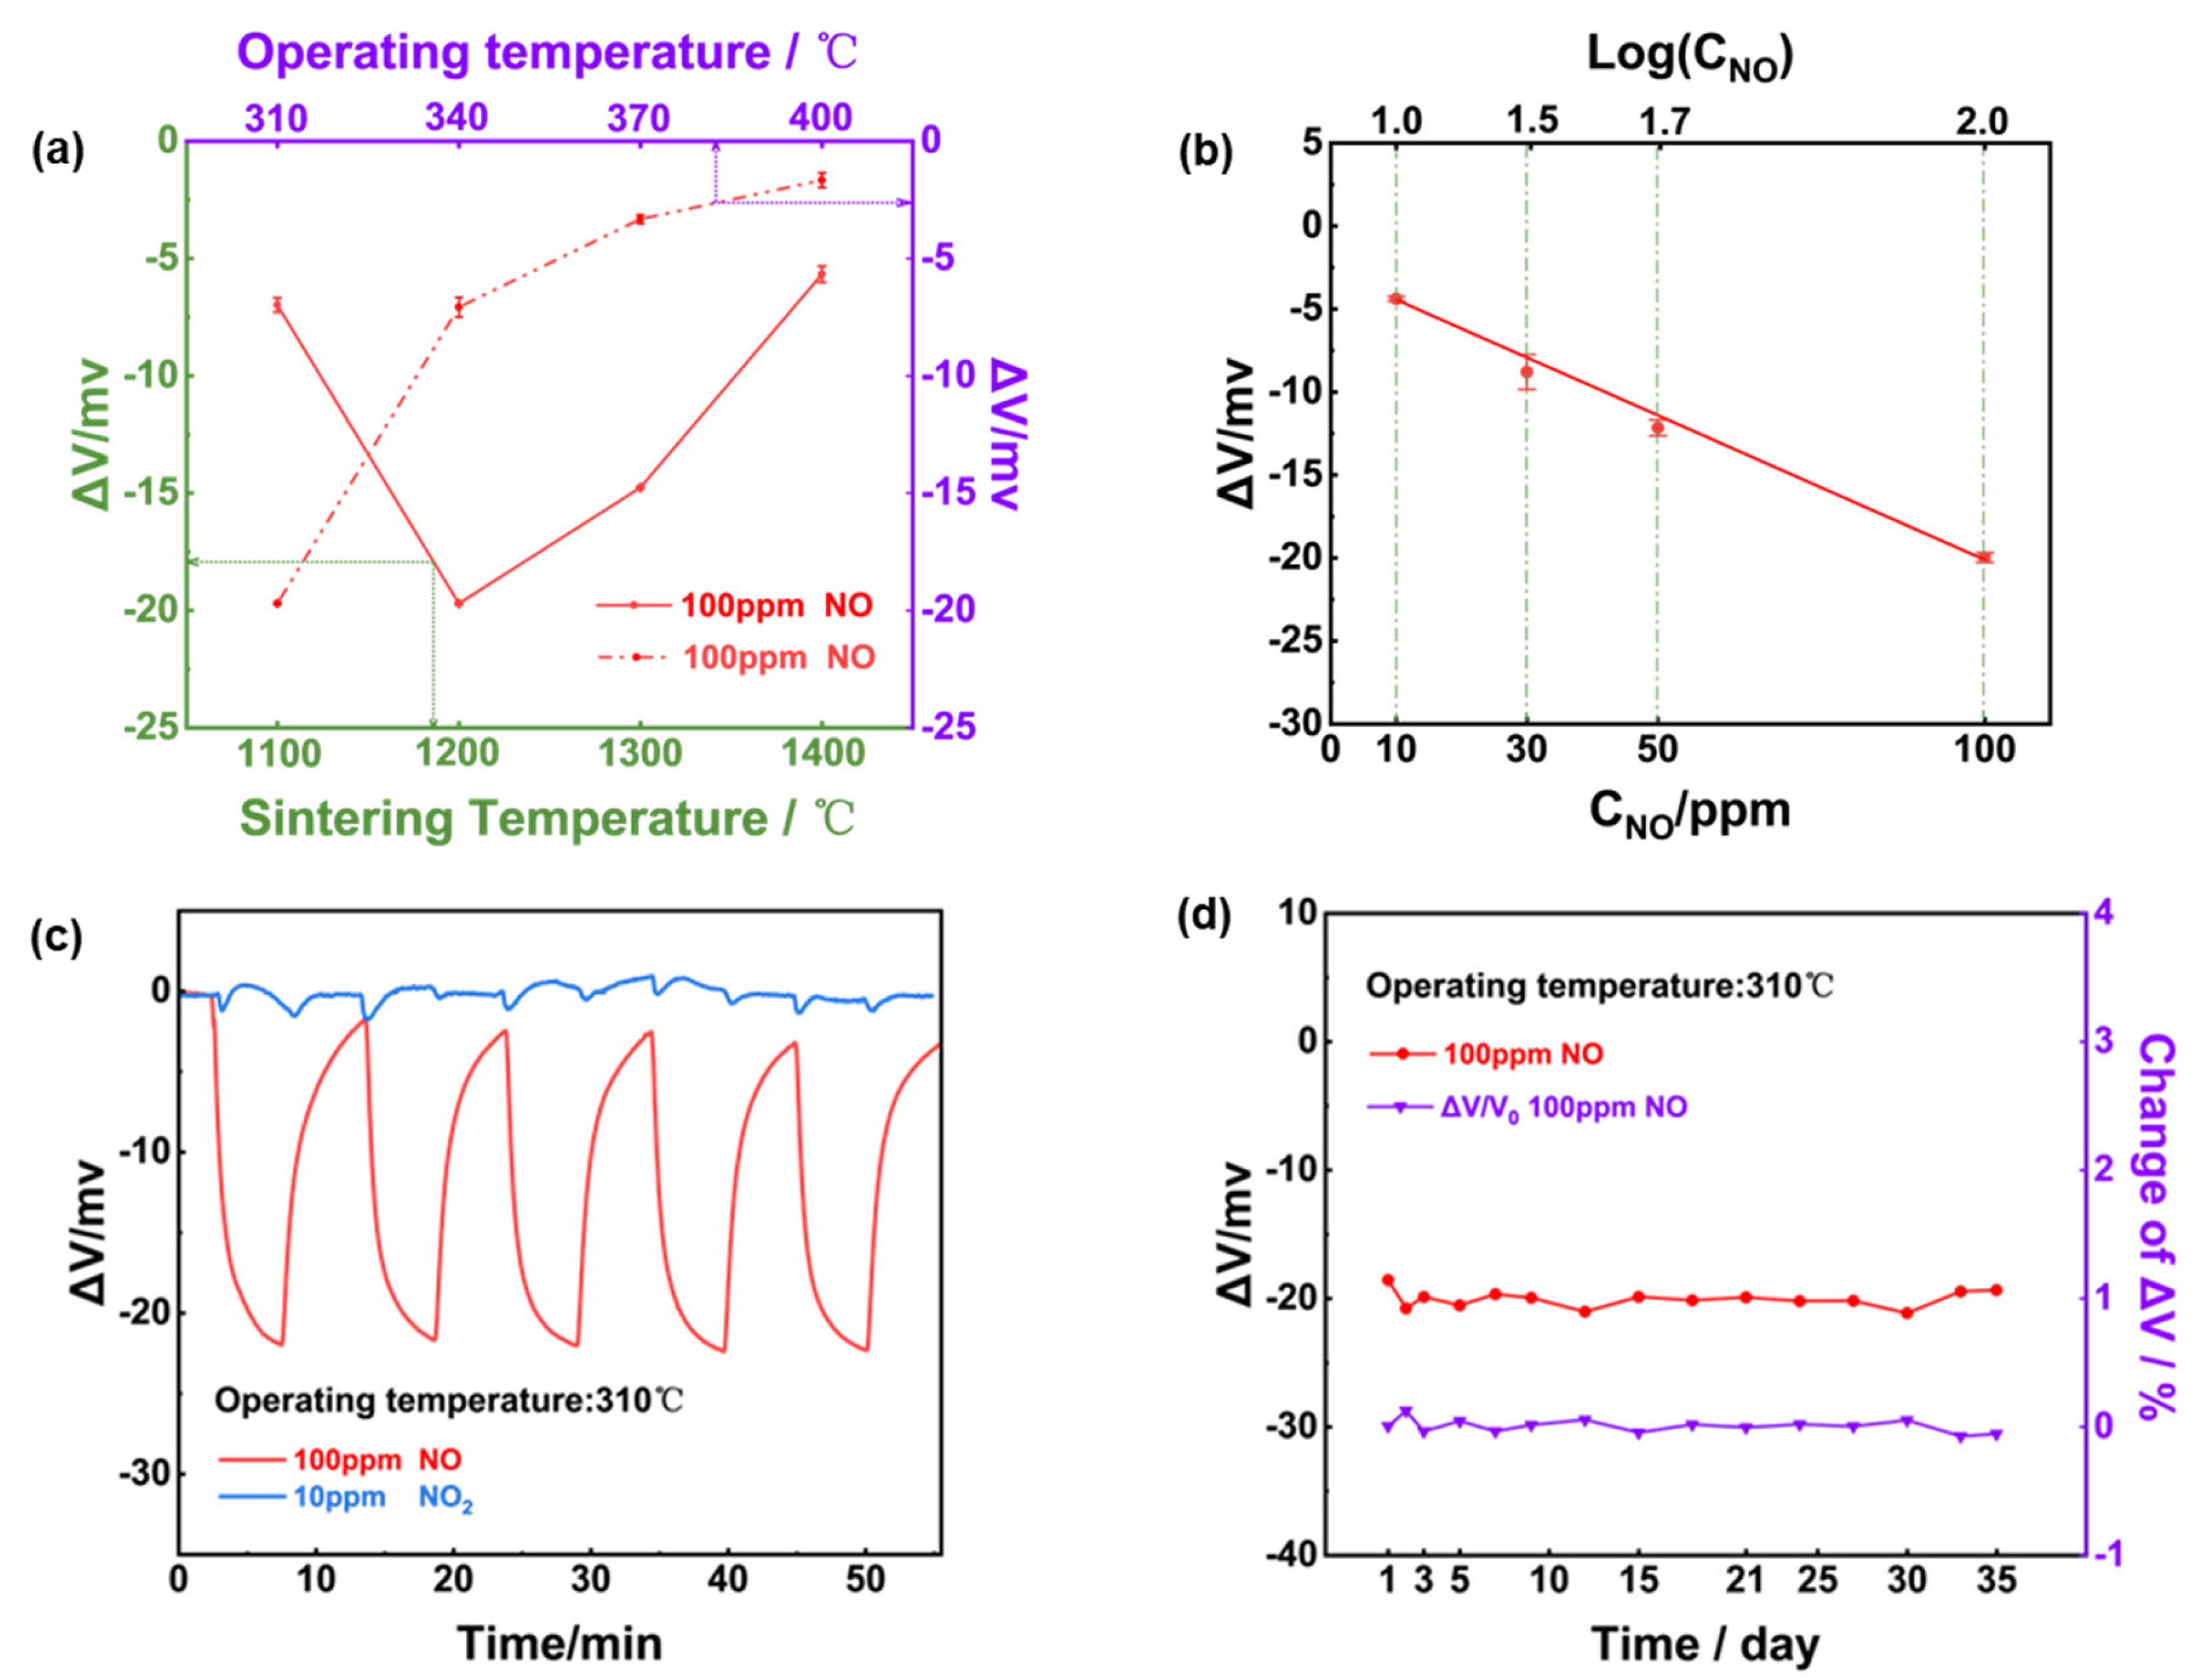
Figure 4(a) depicted the relationship between sensor’s response and the operating/calcination temperature for the NiO-SE, it can be confirmed that optimal response signal was observed for the sensor fabricated at 1200
oC and operated at 310
oC. Consequently, the optimal operating/calcination temperature was selected at 310
oC and 1200
oC for the following study. As shown in
Figure 4(b), response signal of the sensor varied linearly to the logarithm of the NO concentration in the range of 10-100 ppm. According to the repeated response transients of the sensor that exposed to 100 ppm NO and 10 ppm NO
2 (Figure4(c)), it can be concluded that the sensor gave excellent repeatability in the successive runs and high selectivity to 100 ppm NO (24.7 mV) against 10 ppm NO
2 (less than 1 mV). In light of the long-term stability is crucial factor in practical applications. A 35-days test to 100 ppm NO was further measured under 310
oC, as shown in
Figure 4(d), variation of the response value during the tested period was roughly estimated to be less than 3 mV, indicating satisfactory stability of the sensor using NiO-SE and Mn-based RE.
3.2. Screening of Nitric Dioxide Sensing Materials and Developing High Performance NO2 Sensor
It’s a great challenge to detect low concentration of NO
2 compared to tenth times concentration of NO, and pure metal oxides as sensing materials are hardly to realize the research target. Recently, spinel-based oxides have been proved to be good candidates for NO
x sensing. For instance, NiFe
2O
4 was reported to be a potential NO
2 sensing material but the inadequate detection limit (LOD) down to 5 ppm limits its application in iNO treatment technologies [
23,
28,
29]. In order to improve the sensing behavior to NO
2, it is believed that adding additives or dopants to NiFe
2O
4 would effectively extend the LOD [
30,
31]. In the meantime, Fe
2O
3 was announced that not only exhibited the same trivalent cation as the NiFe
2O
4’s AB
2O
4 general formula but also demonstrated acceptable capability to detect NO
2 [
32]. Thus, we added Fe
2O
3 into NiFe
2O
4 in an attempt to enhance the NO
2 detection capacity.
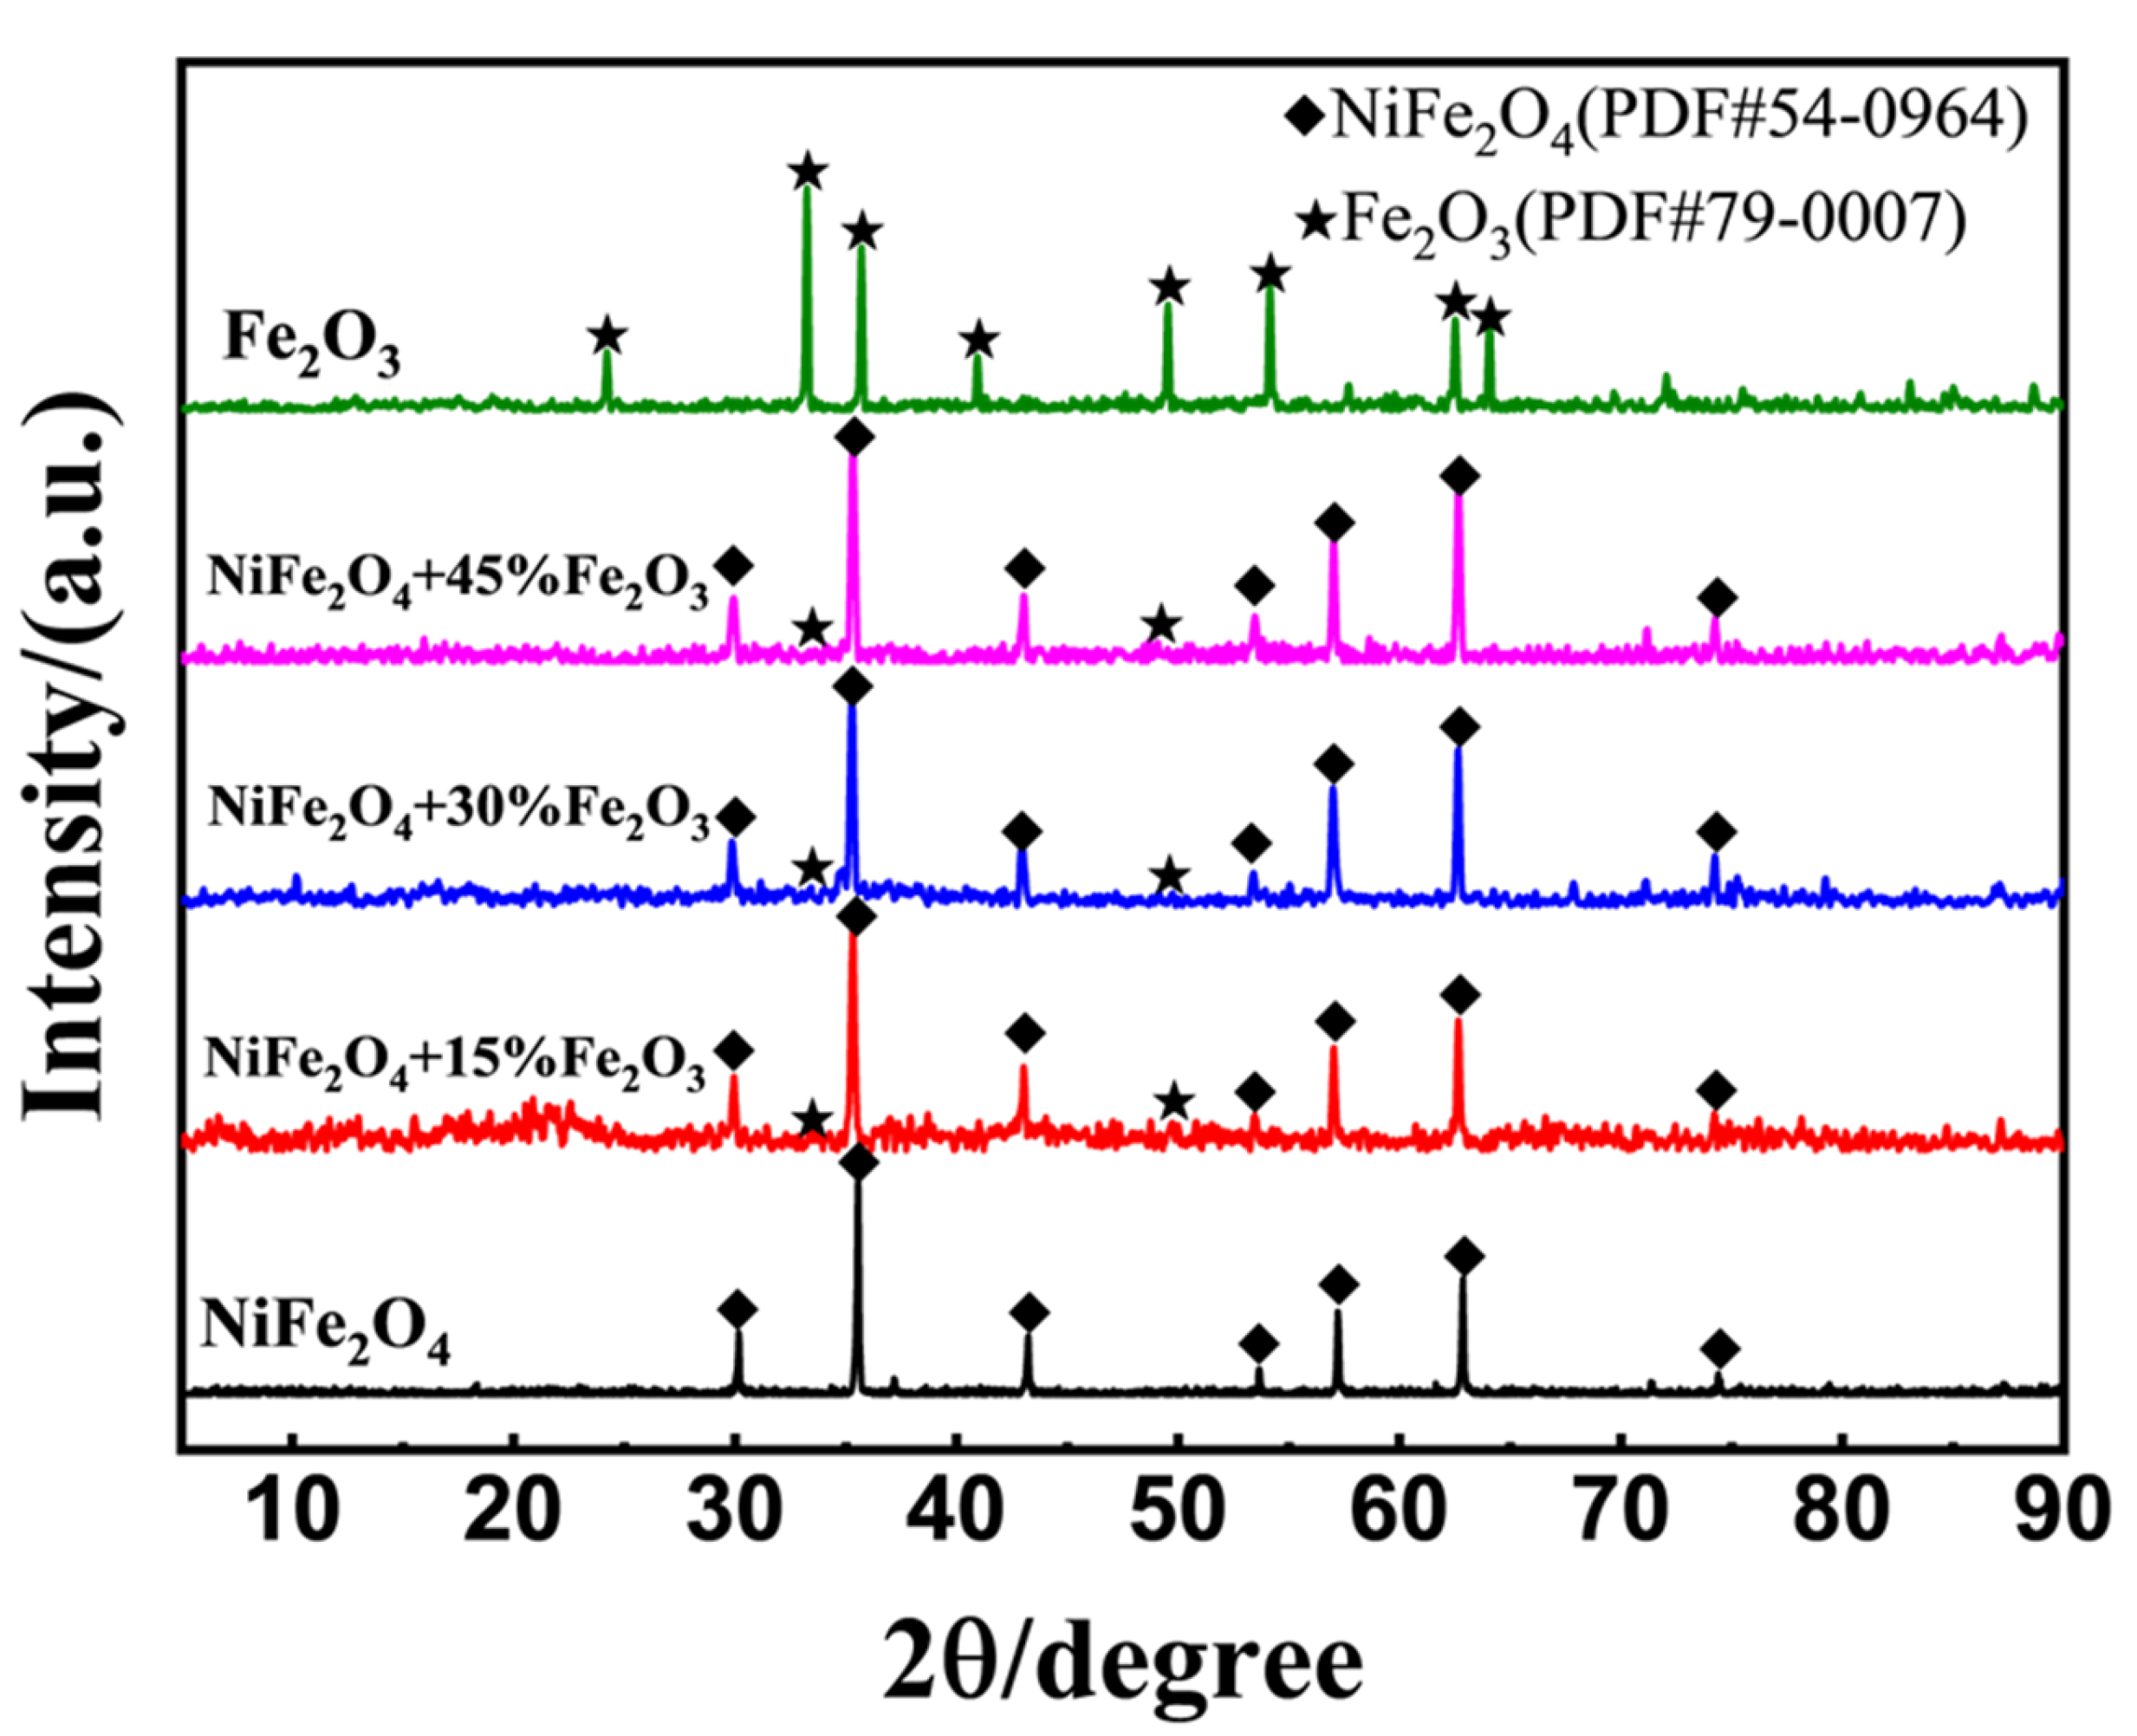
Figure 5 demonstrated the XRD patterns for NiFe
2O
4, Fe
2O
3 and (NiFe
2O
4+x wt.% Fe
2O
3) composites after calcined at 1200
oC for 2h. It is confirmed that the prepared composites at the different ratio of Fe
2O
3 were found to be highly crystalline without impurity, as all the XRD peak can be indexed to the pure NiFe
2O
4, Fe
2O
3 without the formation of new phase.
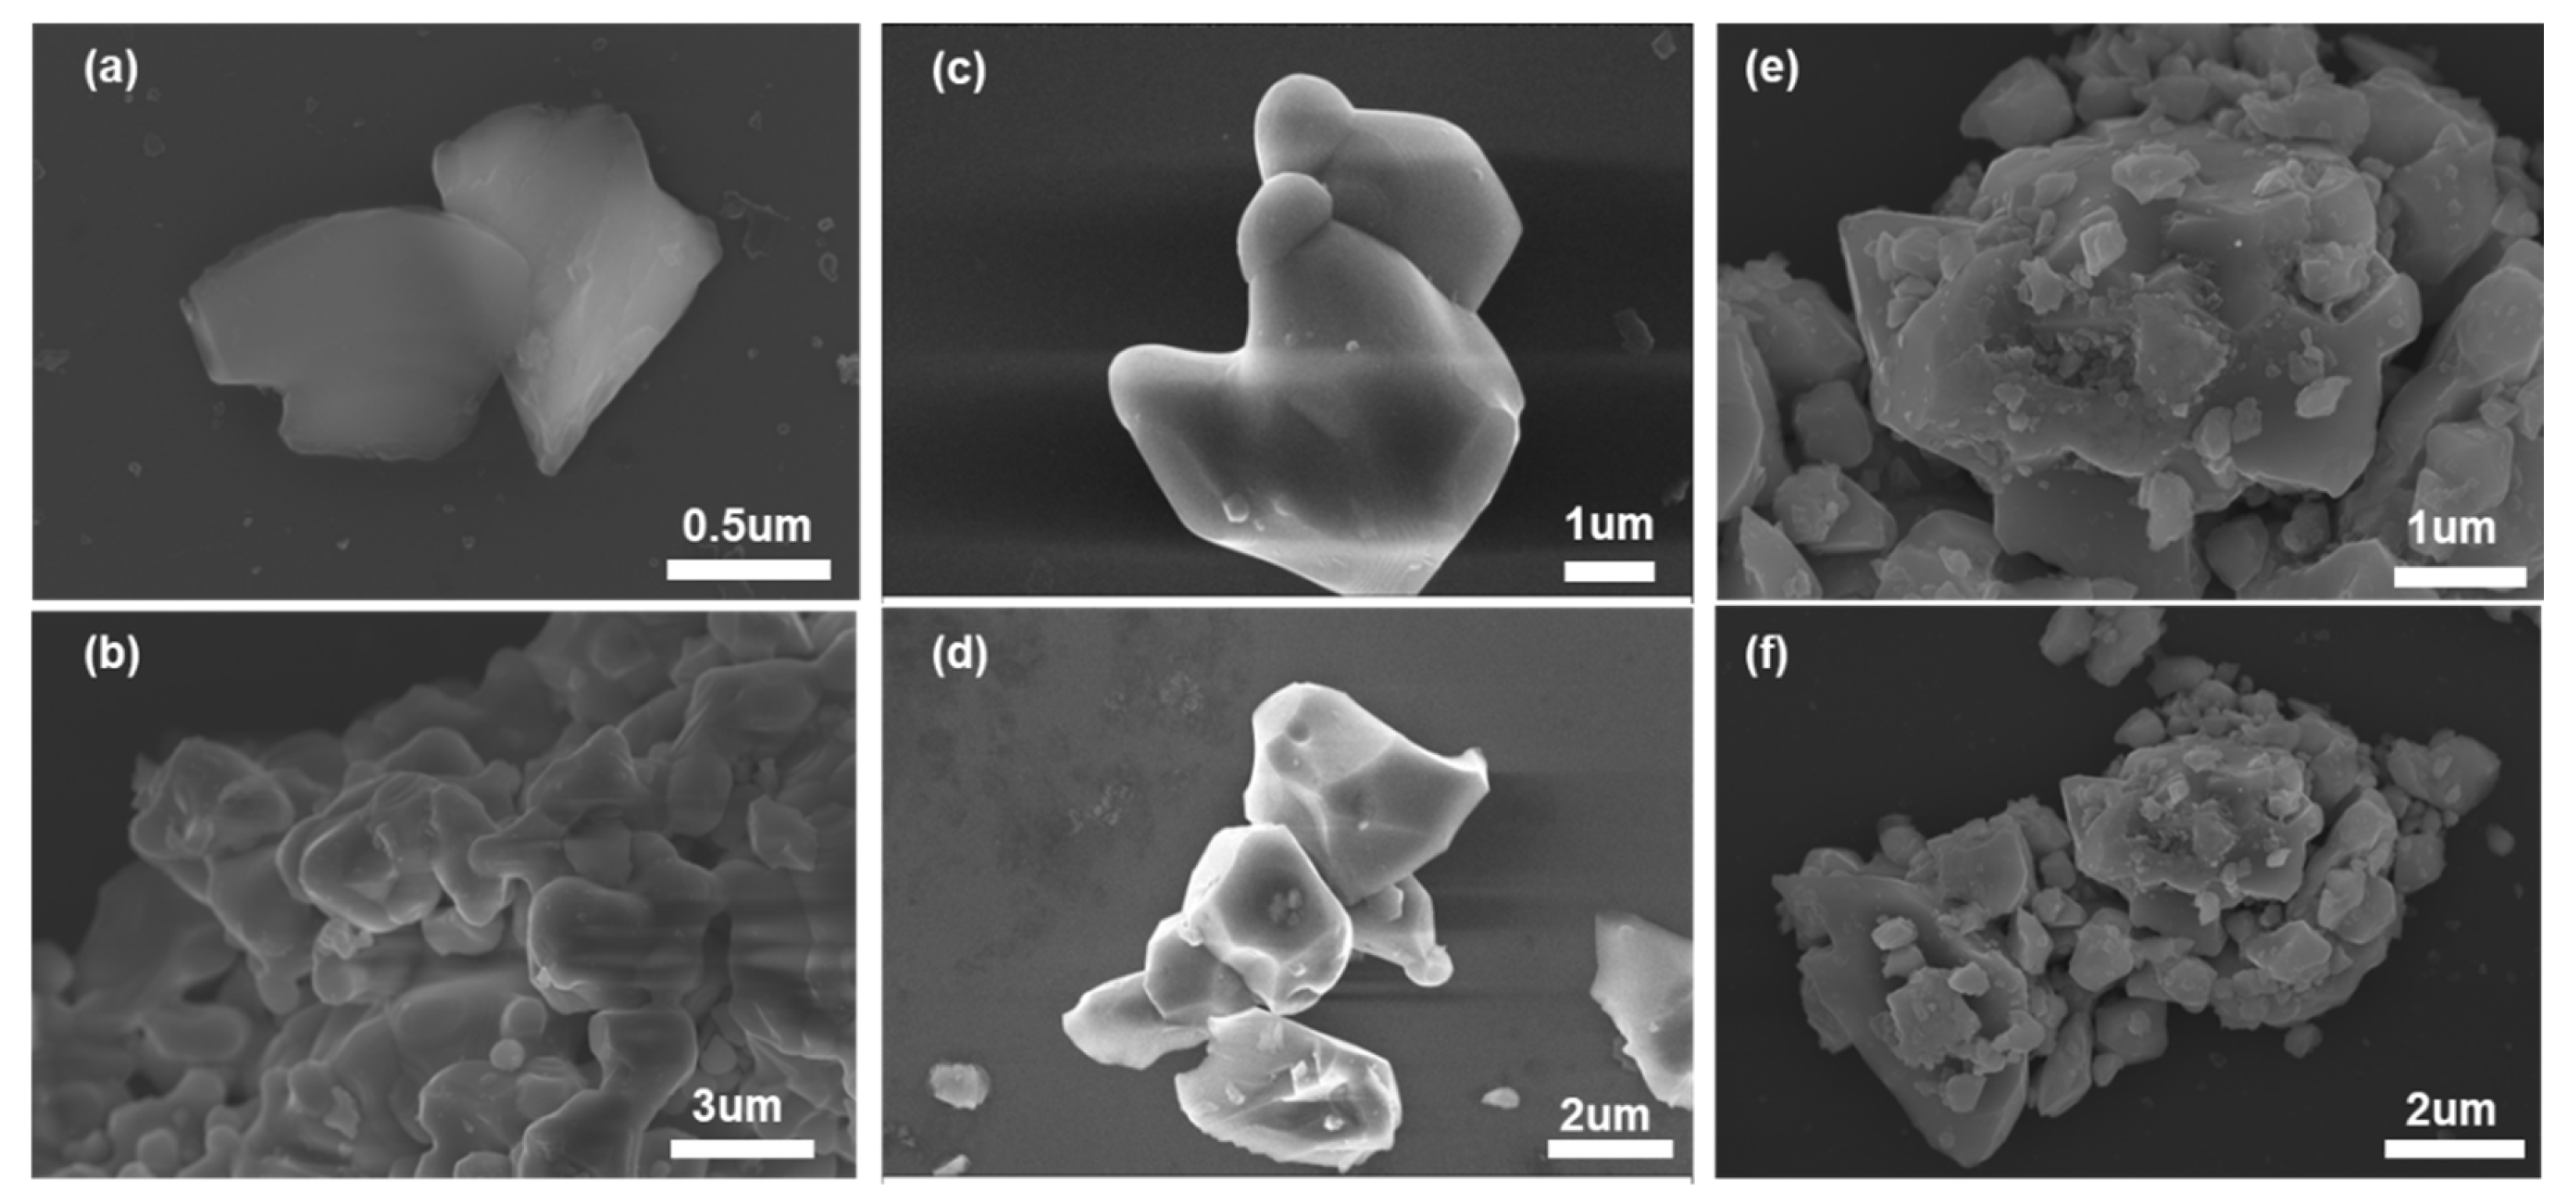
Furthermore, micro-structure of NiFe
2O
4, Fe
2O
3 and their composite (e.g. NiFe
2O
4+30 wt.% Fe
2O
3) were characterized via scanning electron microscope (SEM) and presented in
Figure 6. In comparison with NiFe
2O
4 (Figure6(a), (b)) and Fe
2O
3 (Figure6(c), (d)), a certain amount of grains (with the diameter of around 0.6 μm) which could be assigned to NiFe
2O
4 were observed in the NiFe
2O
4+30 wt.% Fe
2O
3 composite. Besides, it is reasonable to deduce that the formed composite owned more porous and three-dimensional (3D) structure when compared with that of NiFe
2O
4. The porous 3D micro-structure would offered more active reaction sites for NO
2.
Accordingly, sensing behavior to detect 3 ppm NO
2 and 100 ppm NO for the YSZ-based gas sensor utilizing NiFe
2O
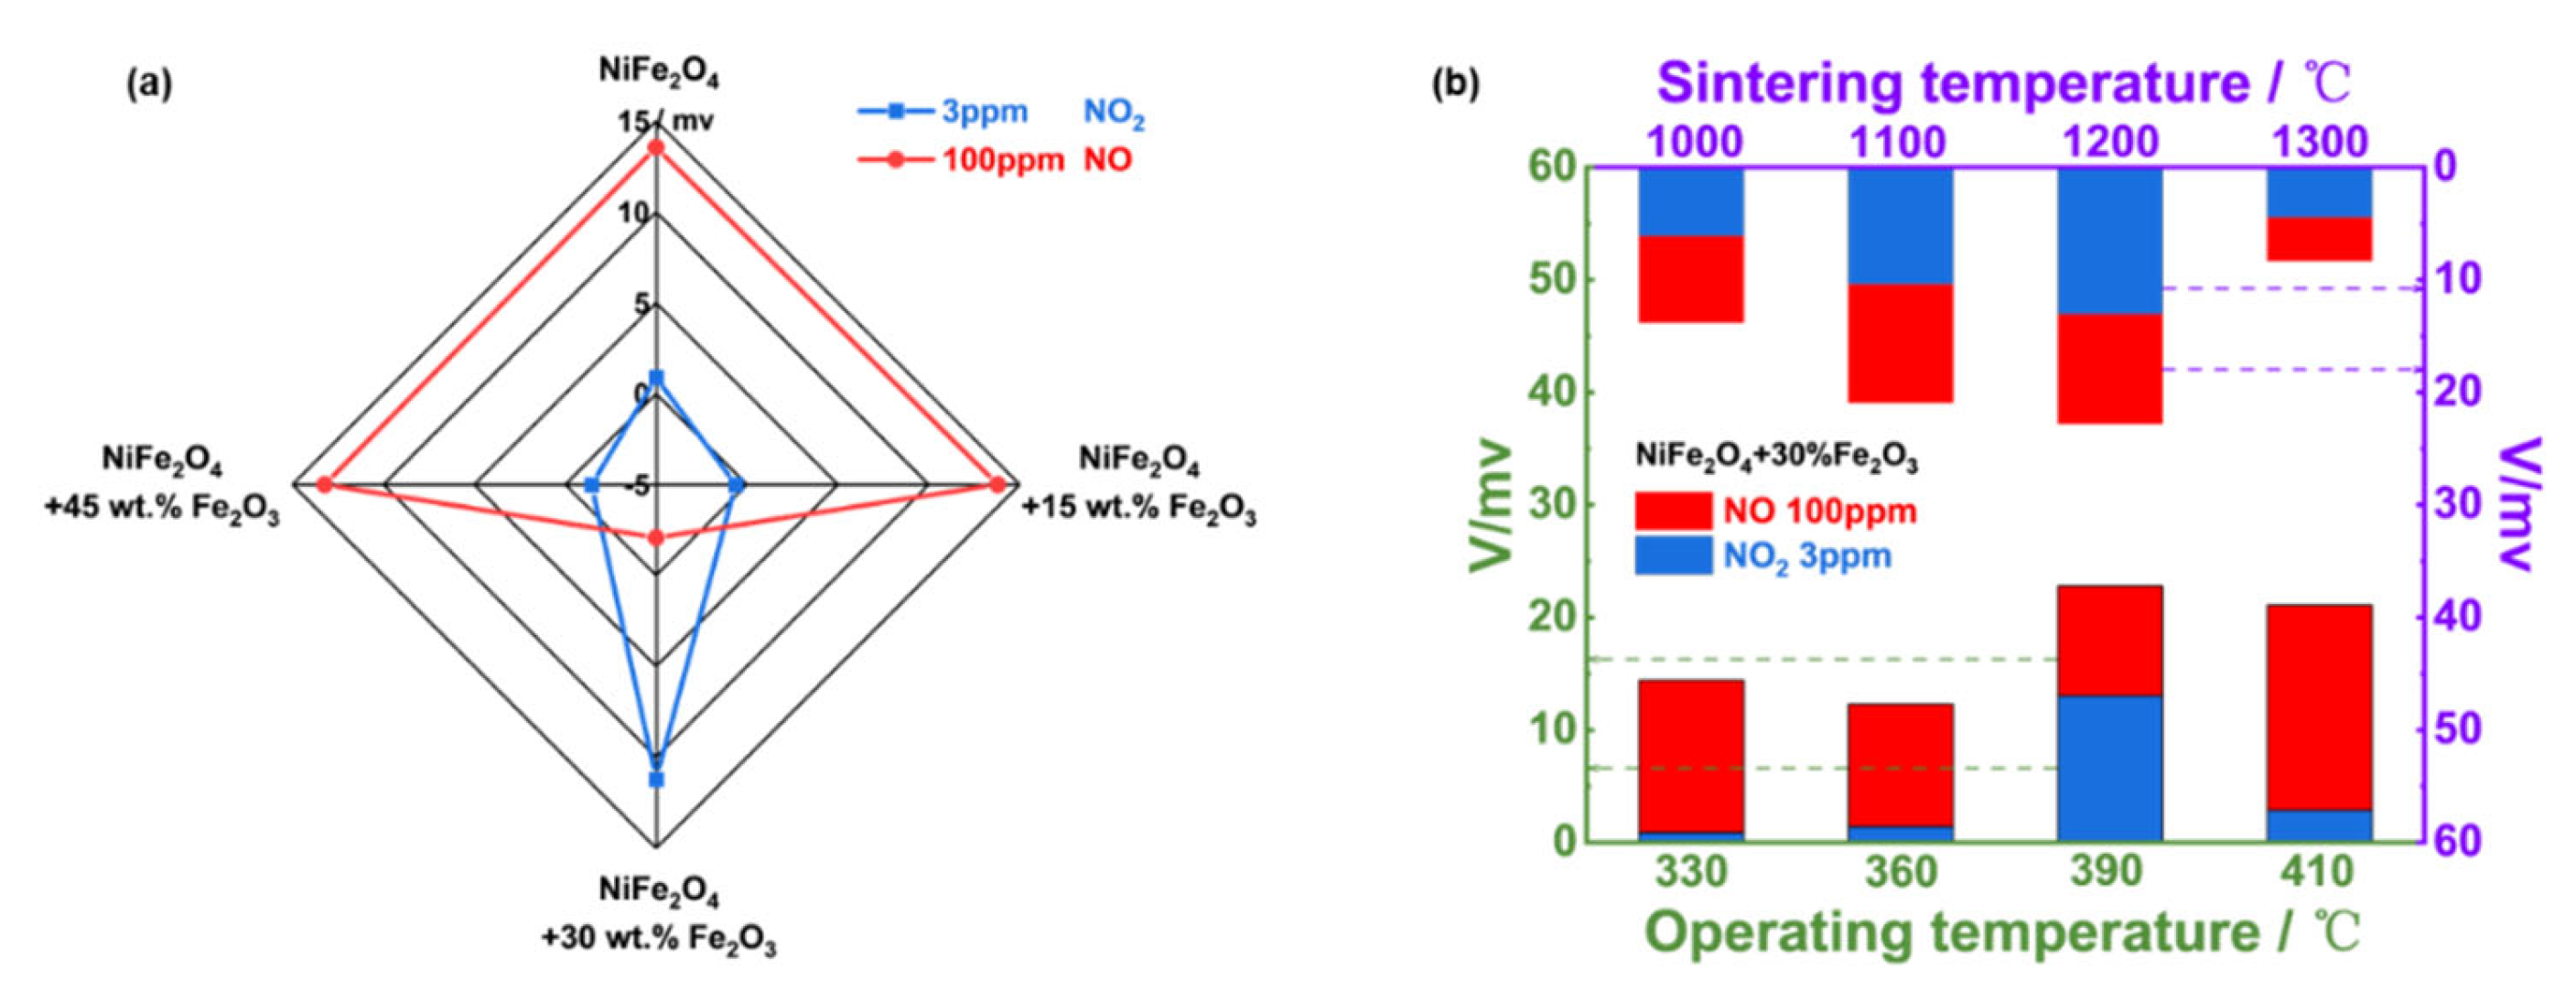
4 and its composite-SEs (vs. Mn-based RE) was examined. As shown in
Figure 7(a), when the amount of of Fe
2O
3 reaches 30%, the sensor gave superior selectivity and sensitivity to 3 ppm NO
2 against 100 ppm NO. In other words, the YSZ-based gas sensor using (NiFe
2O
4+30 wt.% Fe
2O
3)-SE is a good candidate to tracking the trace amount of NO
2.
Figure 7(b) suggested the optimal operating/calcination temperature was 390
oC/1200
oC.
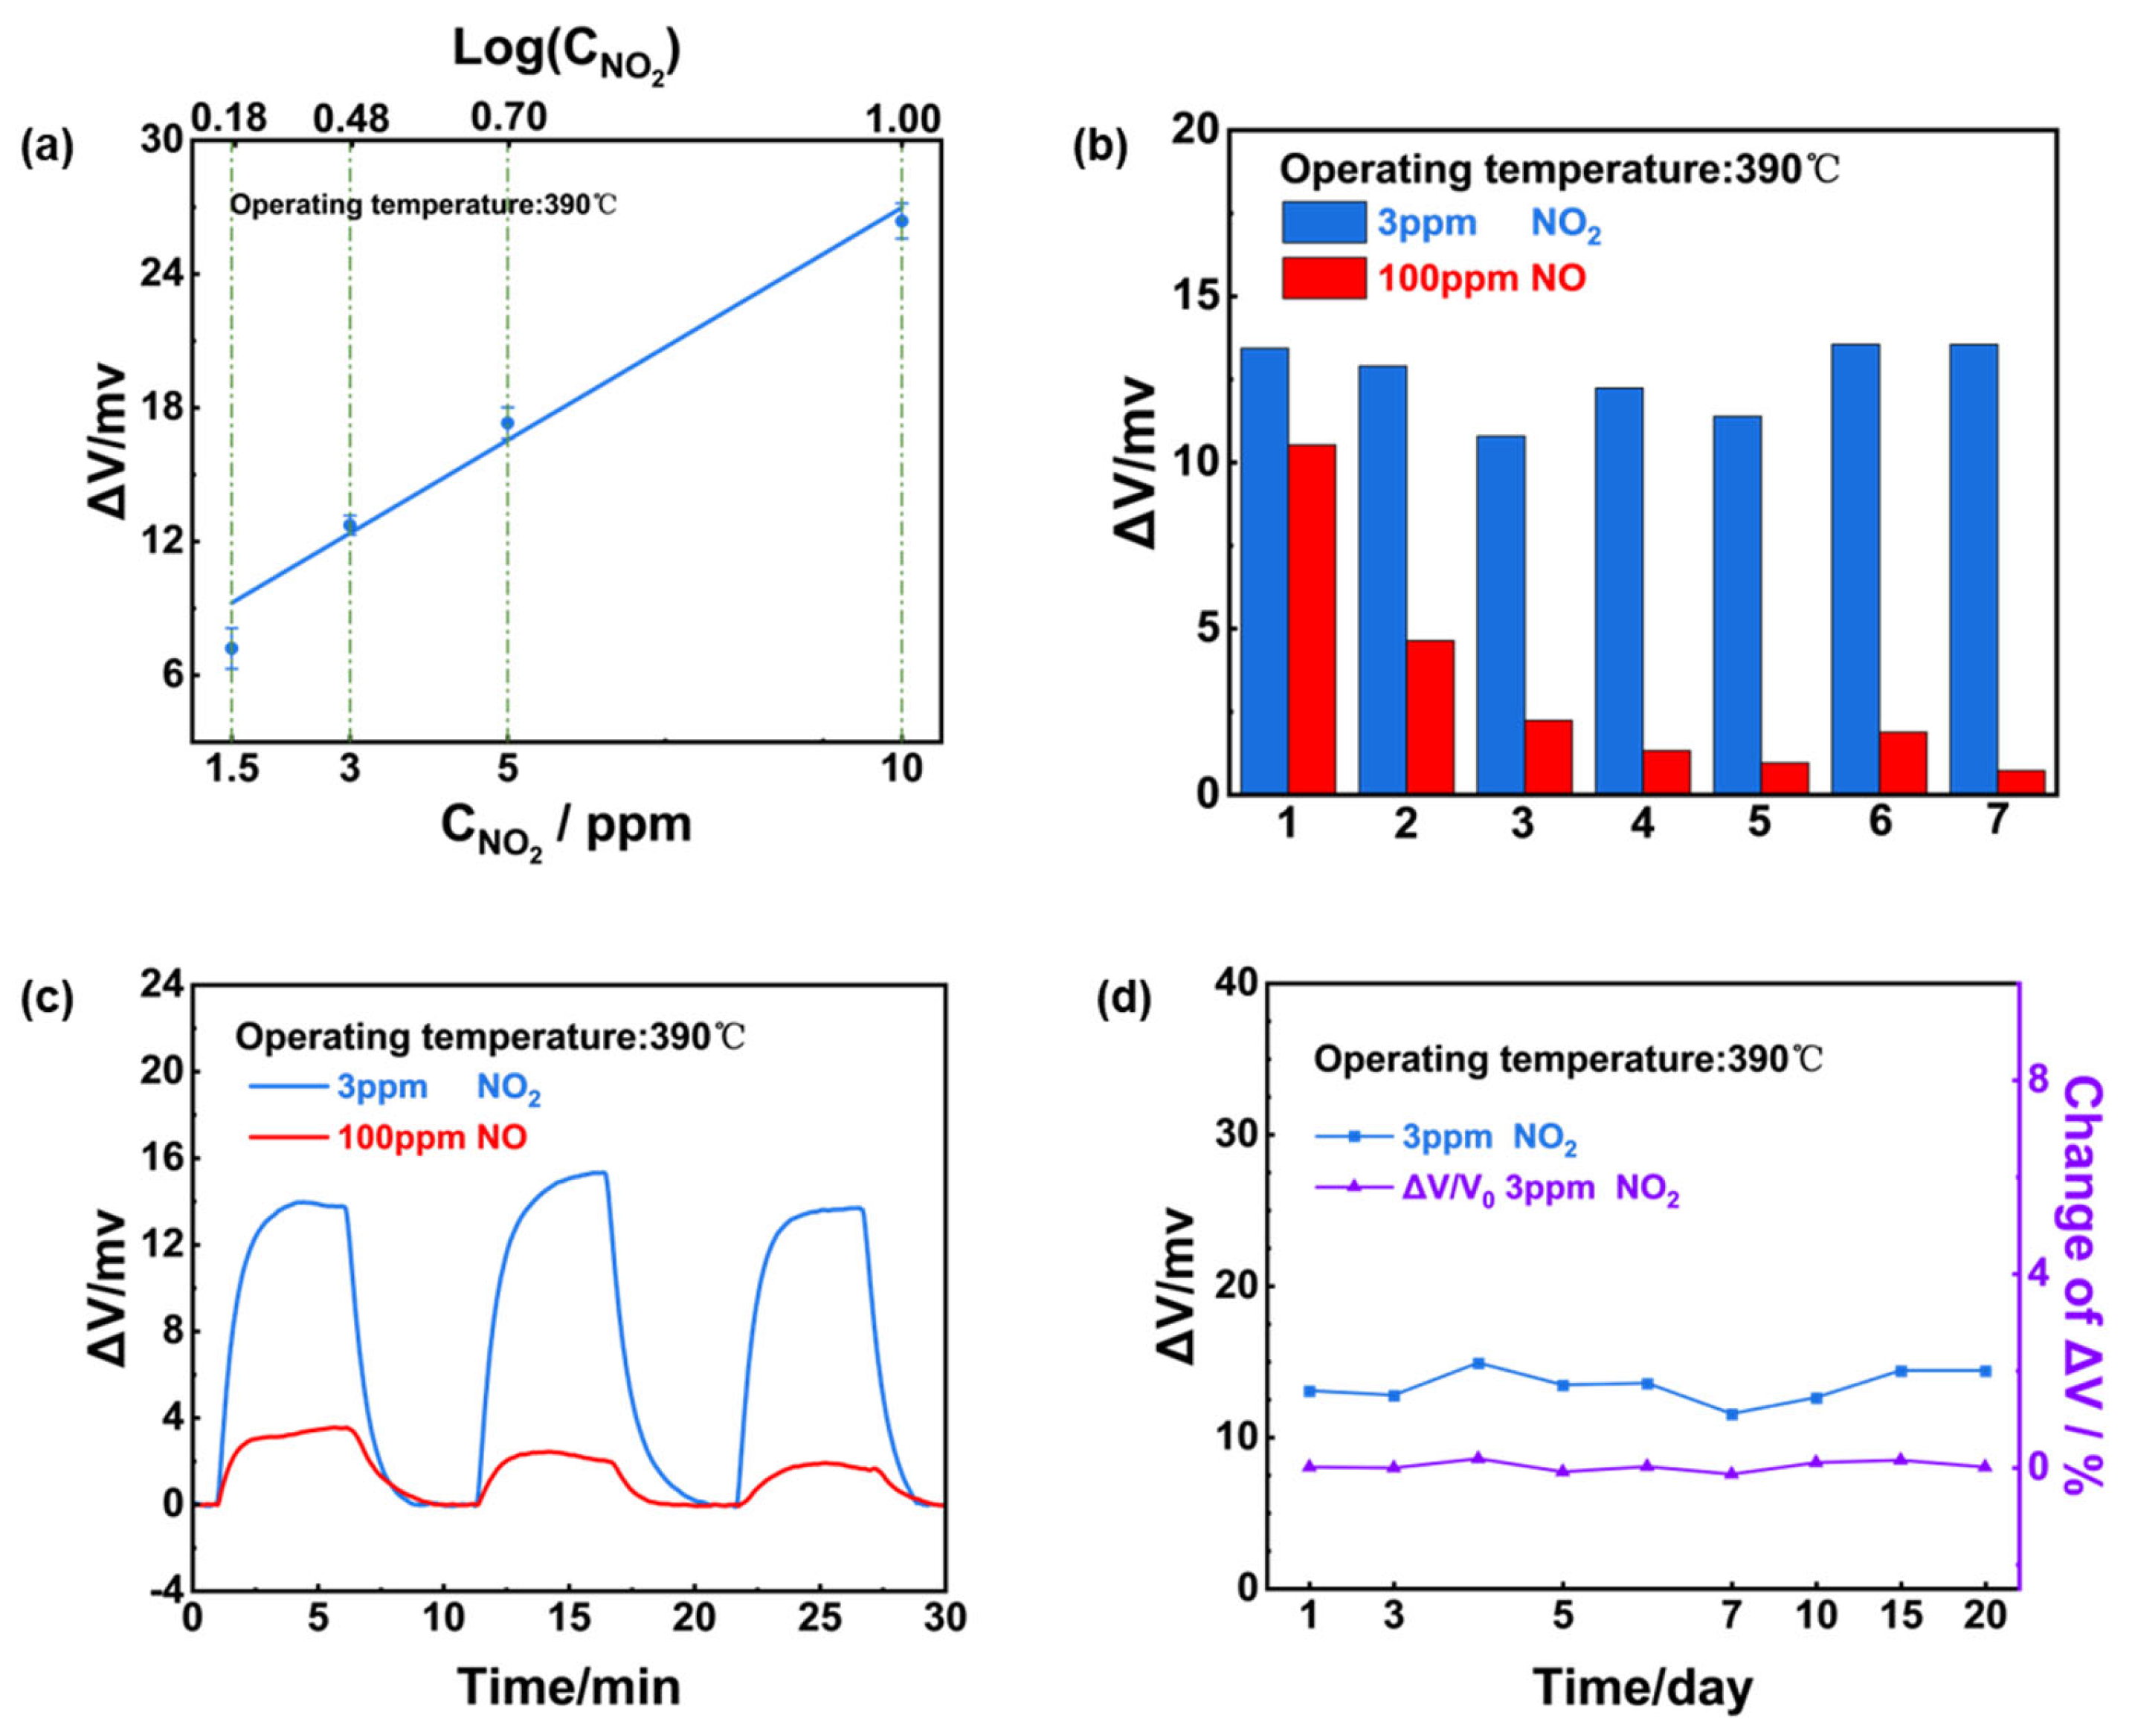
The dependence of the sensing response on the NO
2 concentration in the range of 1.5-10 ppm was examined and a linear relationship between response value and NO
2 concentration on a logarithmic scale (
Figure 8(a)). Notably, it can be concluded that after aging for several days (2-3 days), response signal of the sensor to 100 ppm NO significantly decreased whereas maintained a high response value to 3 ppm NO
2 (
Figure 8(b)).
Figure 8(c, d) further indicated the sensor’s excellent repeatability and stability as well as ultra-high selectivity to 3 ppm NO
2.
3.3. Study on the Sensing Mechanism
According to the working principle of electrochemical gas sensor, target gas initially selective adsorbs on the surface of the sensing material and then participates the followed electrochemical reaction. In this case, both adsorption capabilities and electrochemical reactivity contribute the final response selectivity and response value. To understand which step primary determine the widely concerned selectivity during NO
x sensing, we initially used microgravimetric technology [
33,
34] to comparing the NO
x adsorption capabilities of each sensing material. In this study, changes in the the microcantilever’s vibration frequency directly reflects the difference in the adsorption capabilities to NO and NO
2.
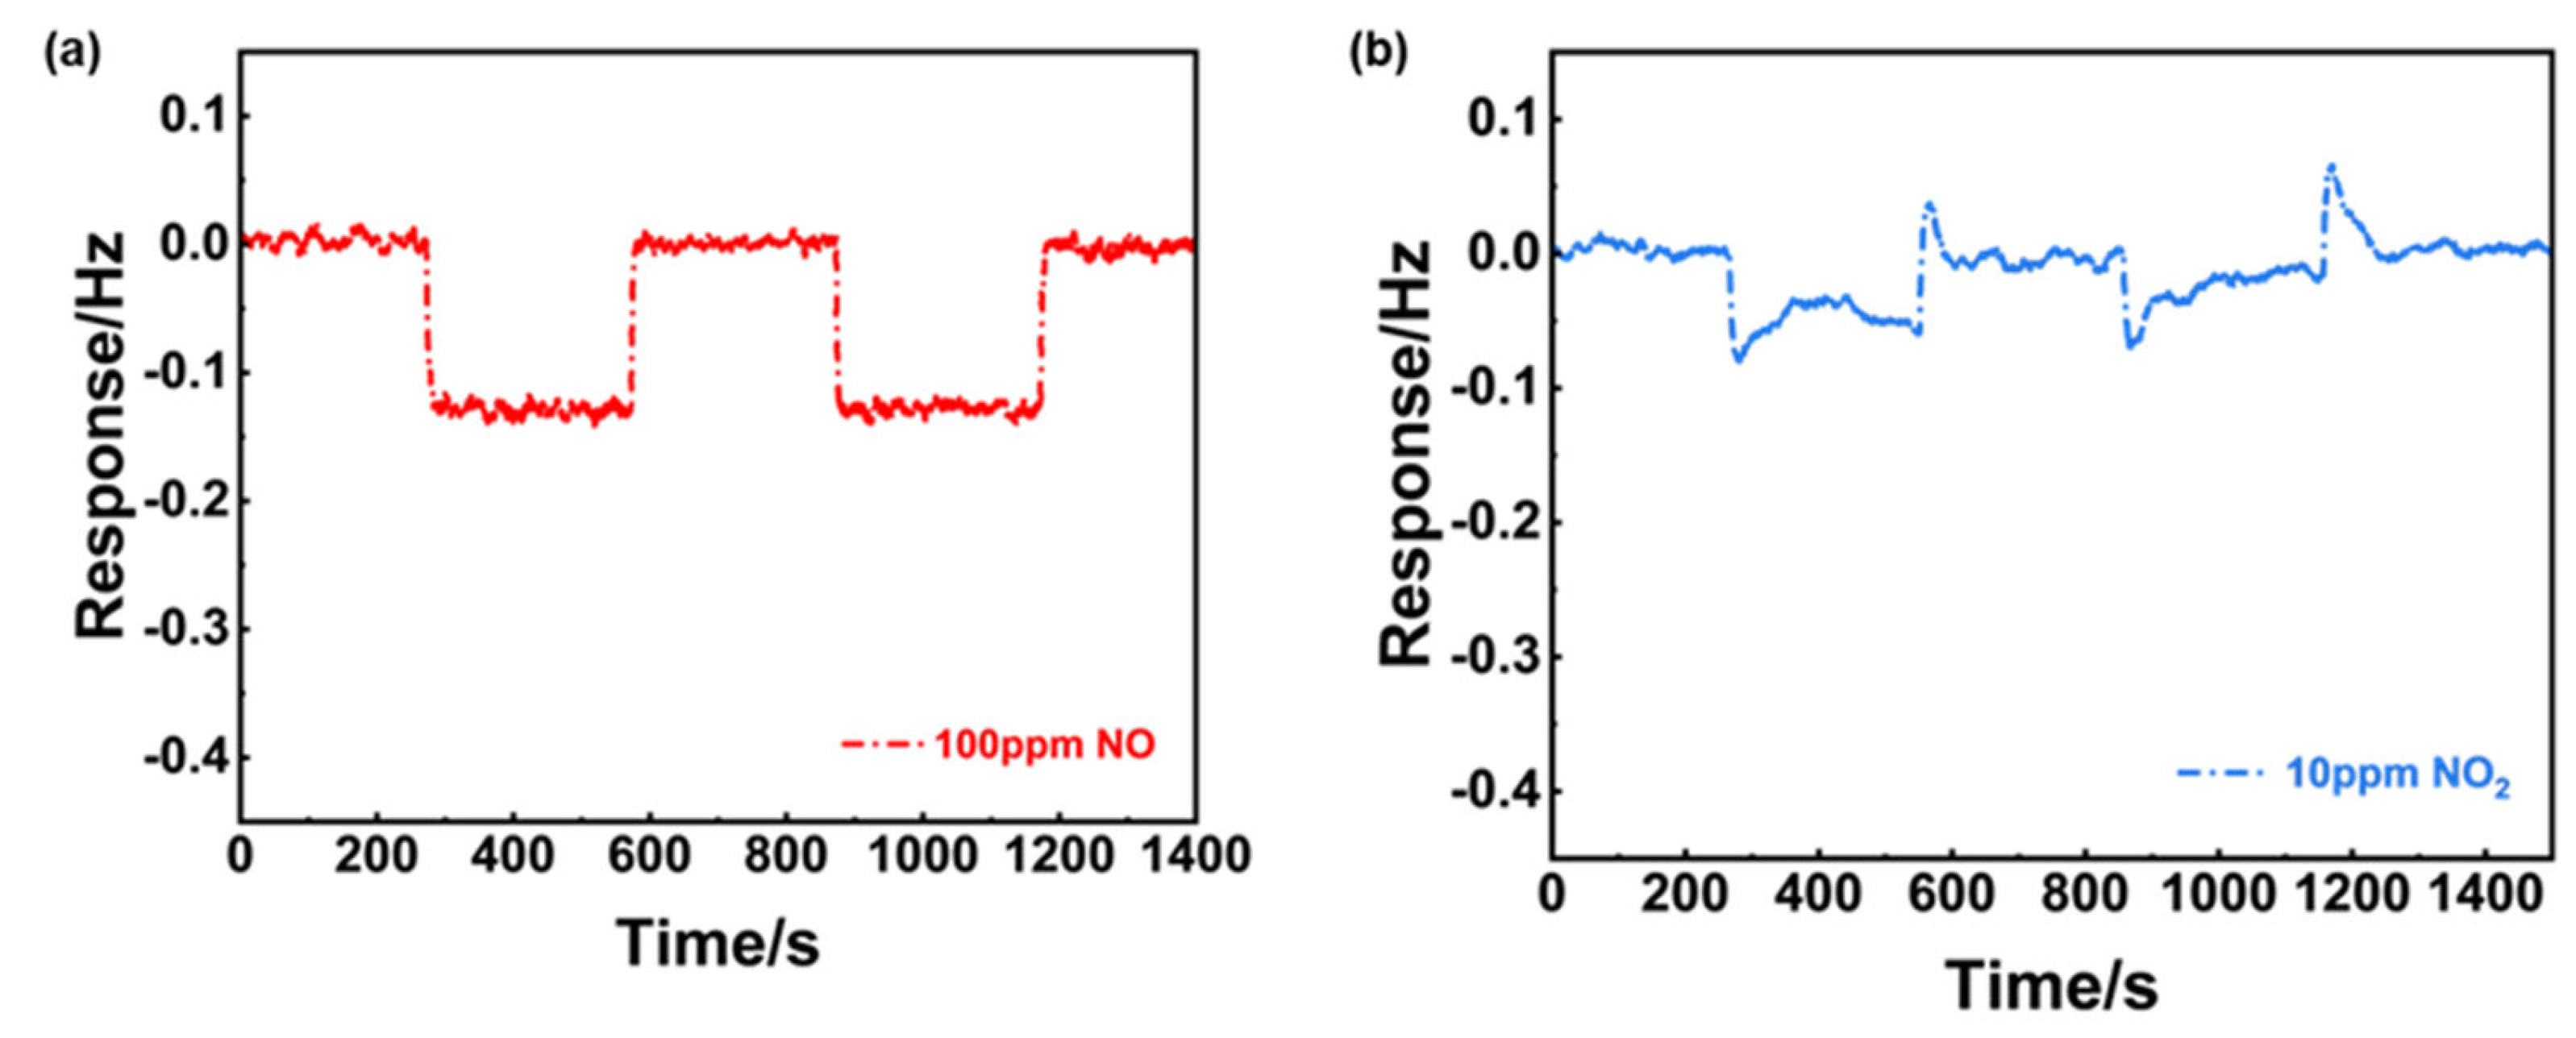
Figure 9(a), (b) showed the frequency shift to 100 ppm NO and 10 ppm NO
2 of NiO, respectively. In repeated tests, the frequency shit to NO was greater than that of NO
2, implying NiO preferred to adsorb NO molecules when exposed to NO
x mixture. In a similar manner way, gas adsorption capabilities of NiFe
2O
4(+30 wt.% Fe
2O
3) was examined and presented in
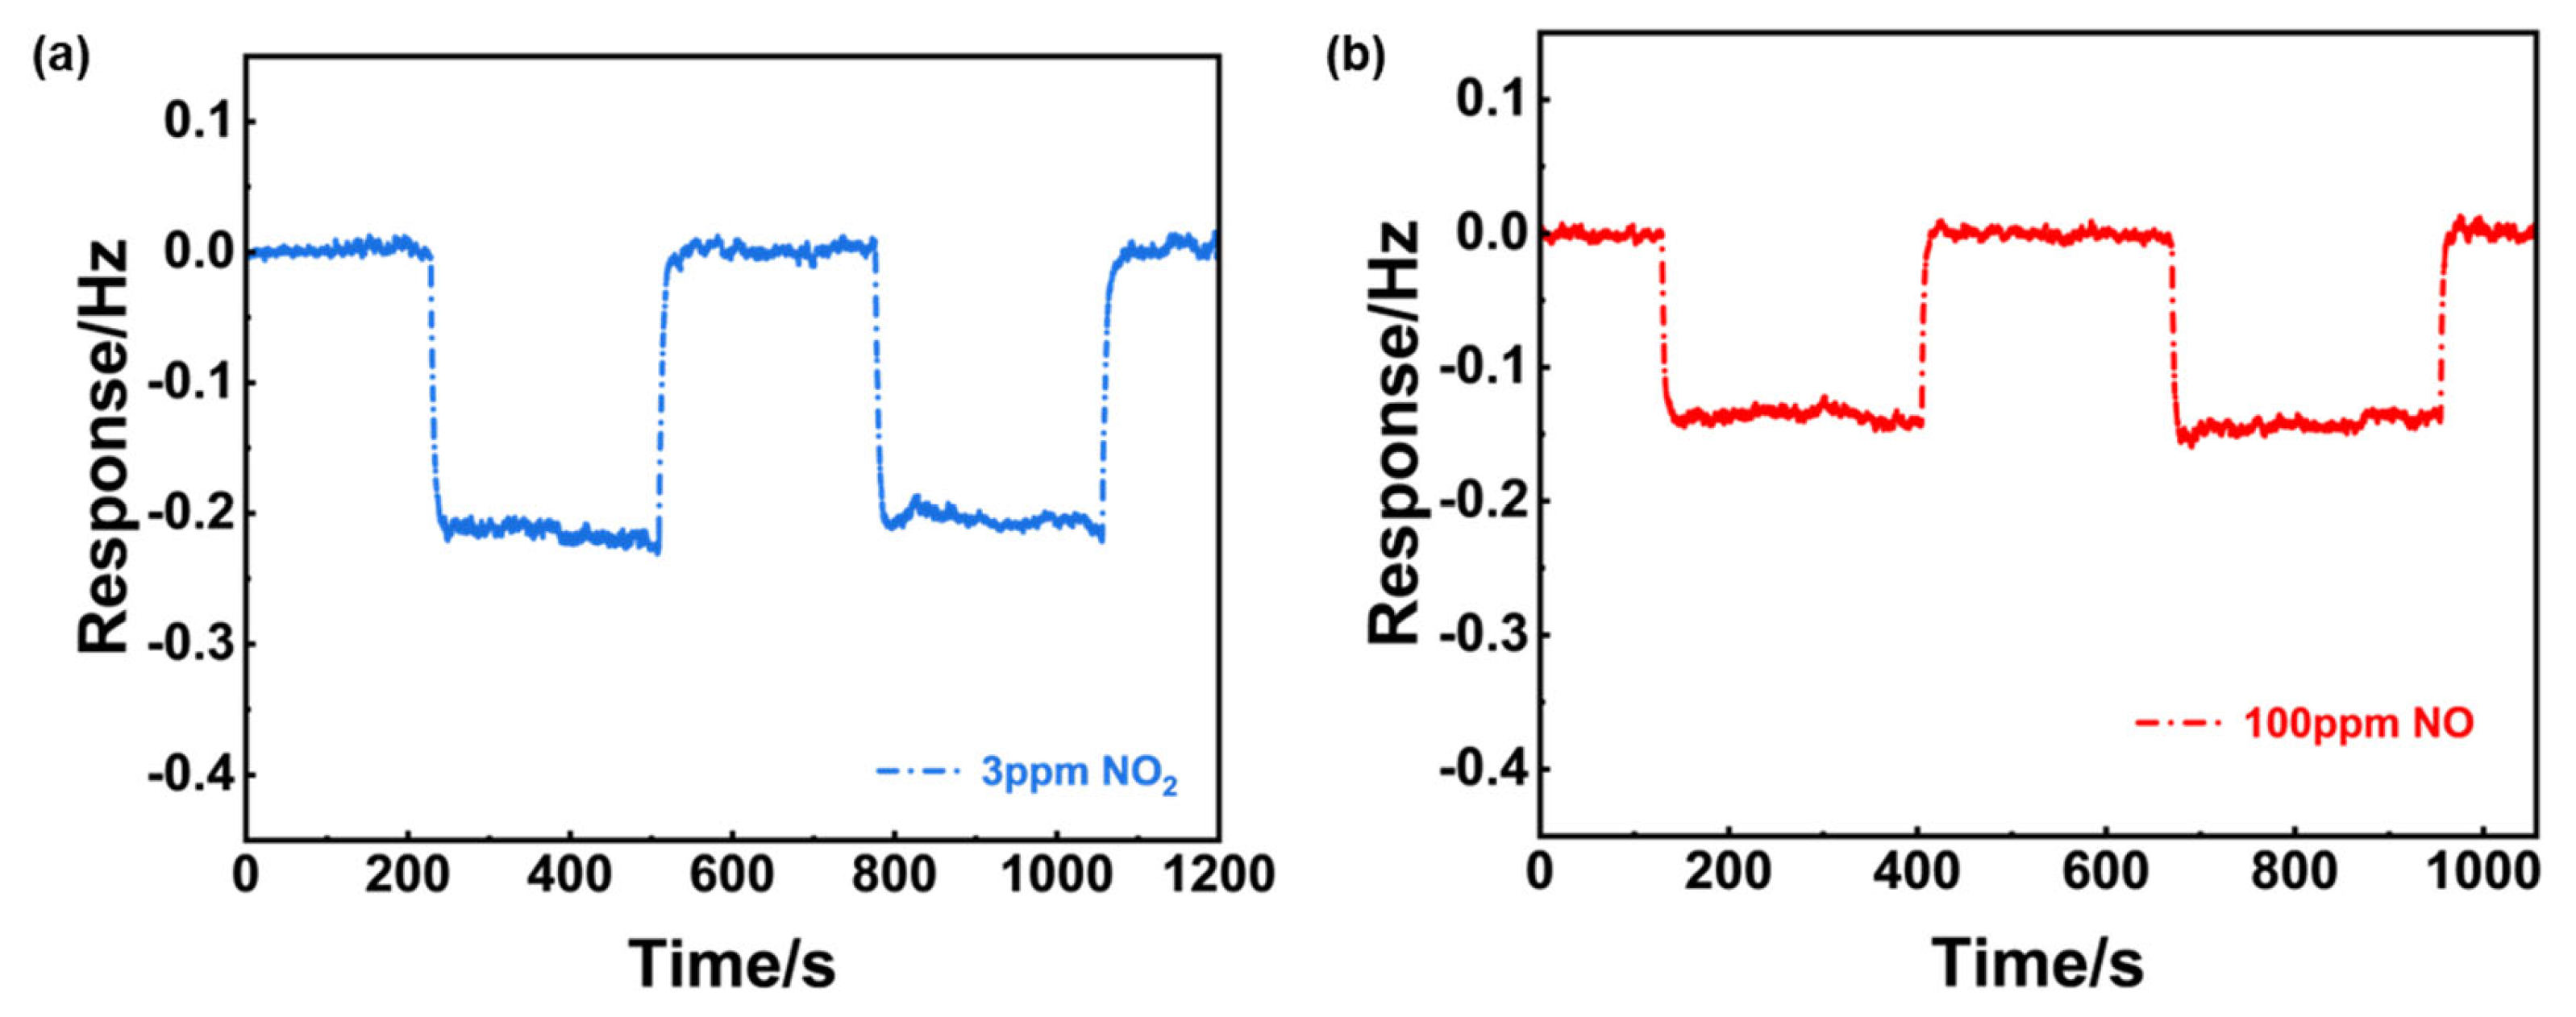
Figure 10. It is reasonable to concluded that (NiFe
2O
4+30 wt.% Fe
2O
3) exhibits similar adsorption capability to both 3 ppm NO
2 and 100 ppm NO, since minor difference in the frequency shit to NO and NO
2 was observed.
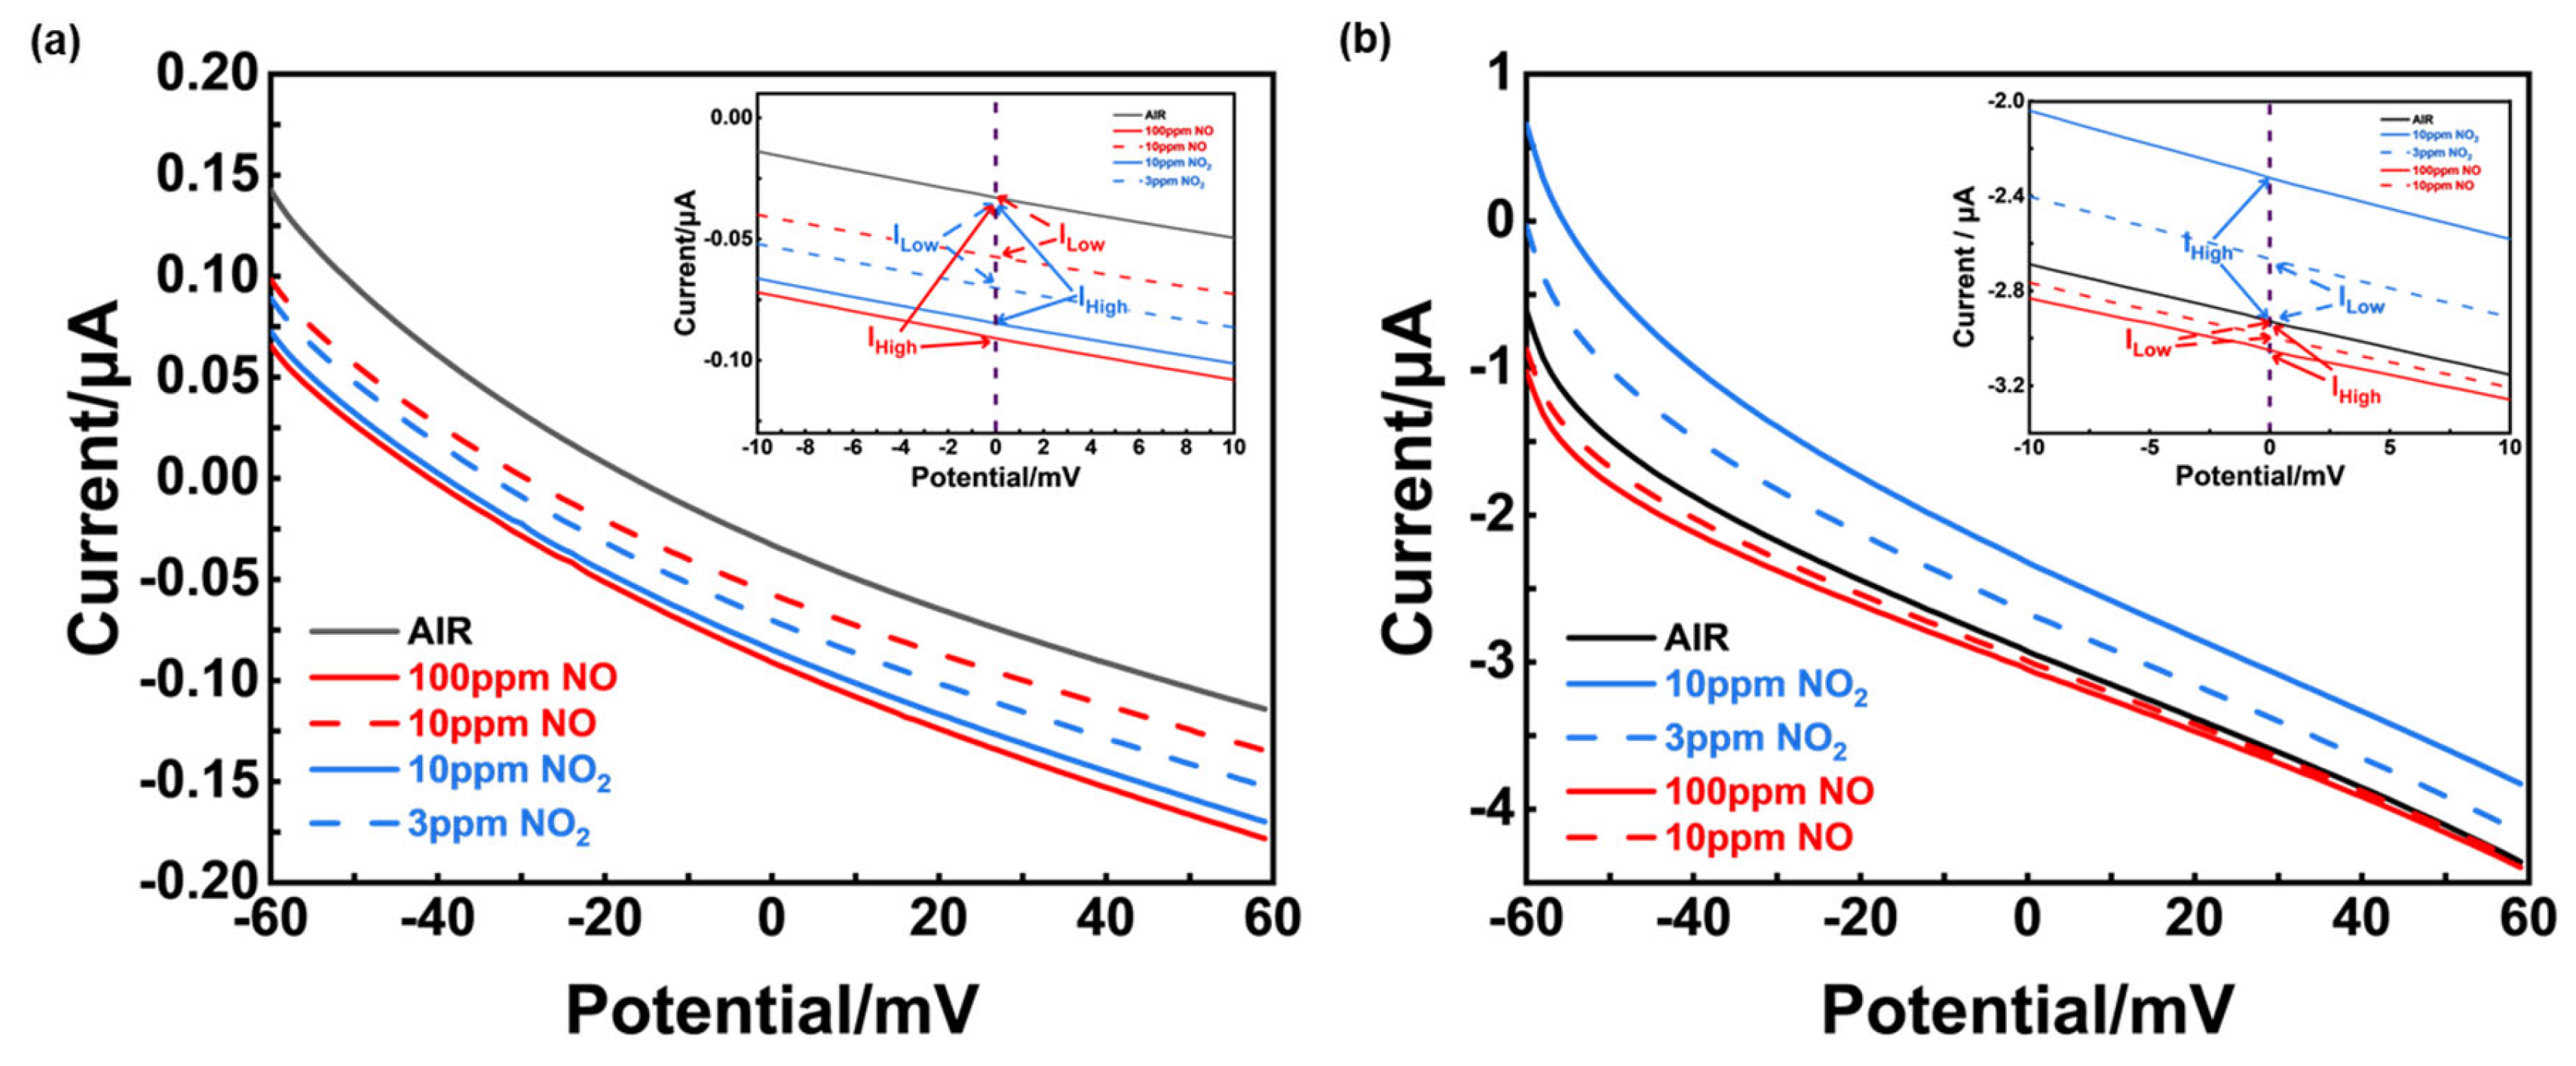
To further understand the mechanism for the sensors’ different selectivity, polarization curves were measured in the sample gas (3 ppm NO
2, 10 ppm NO
2, 10 ppm NO and 100 ppm NO, in 21% O
2, with N
2 balanced) and air, which could reflect the reaction rate for electrochemical reaction that occurred in TPB (triple phase boundary).
Figure 11(a) showed that when the bias voltage was 0 mV, the current value difference between various sample gases at different concentration and air was small, it can be inferred that NiO-SE had poor electrochemical catalytic activity to NO and NO
2. On the contrary, an obvious current difference between NO
2 and NO was given in
Figure 11(b). What’s more, a higher current value of NO
2 suggested that the (NiFe
2O
4+30 wt.% Fe
2O
3)-SE had better electrochemical catalytic activity of NO
2, compared with NO.
Through a comparative analysis of gas adsorption capabilities and electrochemical reactivity, we can conclude that the response selectivity of the sensor using NiO-SE primarily arises from its strong adsorption affinity for NO (confirmed by
Figure 9). Although NiO exhibits similar electrochemical catalytic activity towards both NO and NO
2 (
Figure 11(a)), it demonstrates a significant difference in the adsorption of these gases. Conversely, for the sensor utilizing (NiFe
2O
4 + 30 wt.% Fe
2O
3)-SE, the notable selectivity for NO
2 can be attributed to the high electrochemical reactivity of NiFe
2O
4 + 30 wt.% Fe
2O
3 with NO
2, as only a minor difference was observed in its adsorption capabilities (as presented in
Figure 10 and
Figure 11(b)).
4. Conclusions
For the purpose of precisely tracking the level of NOx during iNO treatment, we developed YSZ-based gas sensors comprised of Ni-based SEs and Mn-based RE. These sensors using NiO or (NiFe2O4+30 wt.% Fe2O3)-SE demonstrated high selectivity, desirable stability and excellent repeatability to high level NO or low level NO2. The working principle of these sensors can be summarized that NO preferred to adsorbed on the surface of NiO while NiFe2O4+30 wt.% Fe2O3 composite demonstrate high electrochemical reactivity to NO2, resulting in satisfactory sensing characteristics for these sensors in tracking the variation of NOx. However, it should be noted that due to the high operational temperature of these sensors, it is necessary to overcome the limitations of high power consumption in practical application. In summary, these findings mark a bright future for the application of the robust and high performance NOx sensors in innovative iNO treatment technologies.
Author Contributions
Conceptualization, Tao Chen, YangBo Zhao, YanYu Zhang and Han Jin; Data curation, ZhengHu Zhang and ChengHan Yi; Formal analysis, ZhengHu Zhang, ChengHan Yi and Han Jin; Investigation, ZhengHu Zhang, ChengHan Yi and Han Jin; Methodology, Han Jin; Project administration, Han Jin; Resources, Tao Chen and Han Jin; Supervision, Han Jin; Validation, ZhengHu Zhang; Visualization, ZhengHu Zhang; Writing – original draft, ZhengHu Zhang; Writing – review & editing, Han Jin.
Data Availability Statement
Correspondence and requests for materials should be addressed to H. Jin.
Acknowledgement
The authors gratefully acknowledge the financial support for this research from the National Natural Science Foundation of China (Grant No. 2022YFE0118800, 62227815, 52000133), “the Belt and Road” young scientist exchange program of the Science and Technology Commission of Shanghai (Grant No. 20490743000), Shanghai Natural Science Foundation (Grant No. WF220403061), Sichuan Natural Science Foundation (Grant No. 2022NSFSC0390, KX002), Oceanic Interdisciplinary Program of Shanghai Jiao Tong University (Grant No. SL2020MS014) and Program of National Key Laboratory (SKLPBS2249).
Conflicts of Interest
The author declare no conflict of interest.
References
- S. H. Abman, G. Hansmann, S.L. Archer, D.D. Ivy, I. Adatia, W.K. Chung, et al., Pediatric Pulmonary Hypertension. Circulation 2015, 132, 2037–2099. [Google Scholar]
- A. Keshavarz, H. Kadry, A. Alobaida, F. Ahsan, Newer approaches and novel drugs for inhalational therapy for pulmonary arterial hypertension. Expert Opinion on Drug Delivery 2020, 17, 439–461. [Google Scholar] [CrossRef]
- J. P. Kinsella, T.A. Parker, D.D. Ivy, S.H. Abman, Noninvasive delivery of inhaled nitric oxide therapy for late pulmonary hypertension in newborn infants with congential diaphragmatic hernia. The Journal of Pediatrics 2003, 142, 397–401. [Google Scholar] [CrossRef] [PubMed]
- F. Ichinose, J.D. Roberts, W.M. Zapol, Inhaled Nitric Oxide. Circulation 2004, 109, 3106–3111. [Google Scholar]
- I. R. Preston, K.D. Sagliani, K.E. Roberts, A.M. Shah, S.A. DeSouza, W. Howard, et al., Comparison of Acute Hemodynamic Effects of Inhaled Nitric Oxide and Inhaled Epoprostenol in Patients with Pulmonary Hypertension. Pulmonary Circulation 2013, 3, 68–73. [Google Scholar] [CrossRef]
- R. J. Barst, R. Channick, D. Ivy, B. Goldstein, Clinical Perspectives with Long-Term Pulsed Inhaled Nitric Oxide for the Treatment of Pulmonary Arterial Hypertension. Pulmonary Circulation 2012, 2, 139–147. [Google Scholar] [CrossRef]
- M.L. Bernier, L.H. M.L. Bernier, L.H. Romer, M.M. Bembea, Spectrum of Current Management of Pediatric Pulmonary Hypertensive Crisis. Critical Care Explorations.
- R. M. DiBlasi, T.R. Myers, D.R. Hess, Evidence-based clinical practice guideline: inhaled nitric oxide for neonates with acute hypoxic respiratory failure. Respir Care 2010, 55, 1717–1745. [Google Scholar]
- B. Weinberger, D.L. Laskin, D.E. Heck, J.D. Laskin, The toxicology of inhaled nitric oxide. Toxicol Sci 2001, 59, 5–16. [Google Scholar] [CrossRef]
- D. M. McMullan, J.M. Bekker, M.J. Johengen, K. Hendricks-Munoz, R. Gerrets, S.M. Black, et al., Inhaled nitric oxide-induced rebound pulmonary hypertension: role for endothelin-1. American Journal of Physiology-Heart and Circulatory Physiology 2001, 280, H777–H85. [CrossRef]
- Y. Liu, Y. Zhu, C. Jiang, Z. Su, Y. Yan, B. Feng, et al., An electrochemical nitric oxide generator for in-home inhalation therapy in pulmonary artery hypertension. BMC Medicine 2022, 20, 481. [Google Scholar]
- Q. Li, W. Q. Li, W. Zeng, Y. Li, Metal oxide gas sensors for detecting NO2 in industrial exhaust gas: Recent developments. Sensors and Actuators B: Chemical 2022, 359. [Google Scholar]
- N. Miura, T. Sato, S.A. Anggraini, H. Ikeda, S. Zhuiykov, A review of mixed-potential type zirconia-based gas sensors. Ionics 2014, 20, 901–925. [Google Scholar] [CrossRef]
- J. Zou, X. Liu, H. Jin, Z. Zhan, J. Jian, NO2 sensing properties of electrode-supported sensor by tape casting and co-firing method. Ionics 2015, 21, 2655–2662. [Google Scholar] [CrossRef]
- J. Fergus, Materials for high temperature electrochemical NOx gas sensors. Sensors and Actuators B: Chemical 2007, 121, 652–663. [Google Scholar] [CrossRef]
- C. O. Park, N. Miura, Absolute potential analysis of the mixed potential occurring at the oxide/YSZ electrode at high temperature in NO -containing air. Sensors and Actuators B: Chemical 2006, 113, 316–319. [Google Scholar] [CrossRef]
- K. P. Ramaiyan, R. Mukundan, Editors’ Choice—Review—Recent Advances in Mixed Potential Sensors. Journal of The Electrochemical Society 2020, 167, 037547. [Google Scholar] [CrossRef]
- Romanytsia, J.-P. Viricelle, P. Vernoux, C. Pijolat, Application of advanced morphology Au–X (X=YSZ, ZrO2) composites as sensing electrode for solid state mixed-potential exhaust NOx sensor. Sensors and Actuators B: Chemical 2015, 207, 391–397. [Google Scholar] [CrossRef]
- F. Liu, J. Wang, L. Jiang, R. You, Q. Wang, C. Wang, et al., Compact and planar type rapid response ppb-level SO2 sensor based on stabilized zirconia and SrMoO4 sensing electrode. Sensors and Actuators B: Chemical 2020, 307, 127655. [Google Scholar] [CrossRef]
- Y. Xu, Z. Liu, J. Lin, J. Zhao, N.D. Hoa, N.V. Hieu, et al., Integrated Smart Gas Tracking Device with Artificially Tailored Selectivity for Real-Time Monitoring Food Freshness. Sensors 2023, 23. [Google Scholar]
- S. Lv, Y. Zhang, L. Jiang, L. Zhao, J. Wang, F. Liu, et al., Mixed potential type YSZ-based NO2 sensors with efficient three-dimensional three-phase boundary processed by electrospinning. Sensors and Actuators B: Chemical 2022, 354, 131219. [Google Scholar] [CrossRef]
- C. Zhang, C. Jiang, X. Zheng, X. Hong, Medium-Low-Temperature NO2 Sensor Based on YSZ Solid Electrolyte and Mesoporous WO3 Sensing Electrode for Detection of Vehicle Emissions. Nano 2021, 16. [Google Scholar]
- J. Xu, C. Wang, B. Yang, H. Yu, F. Xia, J. Xiao, Superior sensitive NiFe2O4 electrode for mixed-potential NO2 sensor. Ceramics International 2019, 45, 2962–2967. [Google Scholar] [CrossRef]
- J. Wang, C. Wang, A. Liu, R. You, F. Liu, S. Li, et al., High-response mixed-potential type planar YSZ-based NO2 sensor coupled with CoTiO3 sensing electrode. Sensors and Actuators B: Chemical 2019, 287, 185–190. [Google Scholar] [CrossRef]
- Y. Chen, Effects of Electrode Microstructures on the Sensitivity and Response Time of Mixed-Potential NO2 Sensor Based on La0.6Sr0.4CoO3 Sensing Electrode. IEEE Sensors Journal 2021, 21, 8621–8626. [Google Scholar] [CrossRef]
- H. Jin, Y. Huang, J. Jian, Plate-like Cr2O3 for highly selective sensing of nitric oxide. Sensors and Actuators B: Chemical 2015, 206, 107–110. [Google Scholar] [CrossRef]
- H. Jin, Y. Huang, J. Jian, Sensing mechanism of the zirconia-based highly selective NO sensor by using a plate-like Cr2O3 sensing electrode. Sensors and Actuators B: Chemical 2015, 219, 112–118. [Google Scholar] [CrossRef]
- Y. -L. Liu, H. Wang, Y. Yang, Z.-M. Liu, H.-F. Yang, G.-L. Shen, et al., Hydrogen sulfide sensing properties of NiFe2O4 nanopowder doped with noble metals. Sensors and Actuators B: Chemical 2004, 102, 148–154. [Google Scholar] [CrossRef]
- S. Zhuiykov, M. Muta, T. Ono, M. Hasei, N. Yamazoe, N. Miura, Stabilized Zirconia-Based NO x Sensor Using ZnFe2 O 4 Sensing Electrode. Electrochemical and Solid-State Letters 2001, 4, H19. [Google Scholar] [CrossRef]
- H. Liu, J. Wang, H. Yu, H. Xiong, Y. Chen, C. Wang, et al., Promoted Carbon Monoxide Sensing Performance of a Bi2Mn4O10-Based Mixed-Potential Sensor by Regulating Oxygen Vacancies. ACS Sensors 2022, 7, 2978–2986. [Google Scholar] [CrossRef]
- C. Zheng, Y. Shi, B. Tang, J. Zhang, Black Phosphorus–Tungsten Oxide Sandwich-like Nanostructures for Highly Selective NO2 Detection. Sensors 2024. [Google Scholar]
- (!!! INVALID CITATION !!! [33, 34]).
- K. M. Goeders, J.S. Colton, L.A. Bottomley, Microcantilevers: Sensing Chemical Interactions via Mechanical Motion. Chemical Reviews 2008, 108, 522–542. [Google Scholar] [CrossRef] [PubMed]
- T. Xu, P. Xu, D. Zheng, H. Yu, X. Li, Metal–Organic Frameworks for Resonant-Gravimetric Detection of Trace-Level Xylene Molecules. Analytical Chemistry 2016, 88, 12234–12240. [Google Scholar] [CrossRef] [PubMed]
Figure 1.
(a) Schematic illustration of the planar YSZ-based gas sensor; (b) the fabricated miniaturized YSZ-based sensor.
Figure 1.
(a) Schematic illustration of the planar YSZ-based gas sensor; (b) the fabricated miniaturized YSZ-based sensor.
Figure 2.
Comparison of sensing responses to 100 ppm NO and 10 ppm NO2 in air.
Figure 2.
Comparison of sensing responses to 100 ppm NO and 10 ppm NO2 in air.
Figure 3.
SEM image of NiO powder calcined at 1200℃ in different scale.
Figure 3.
SEM image of NiO powder calcined at 1200℃ in different scale.
Figure 4.
Sensing characteristics of the NiO-SE NO sensor in 21% O2 with N2 balance. (a) variation of the response signal to 100 ppm NO on the operational/calcination temperature; (b) dependence of the response signal on the logarithm of the NO concentration in the range of 10-100 ppm at 310oC; (c) repeated response transients to 100 ppm NO and 10 ppm NO2 of the sensor at at 310oC; (d) long-term stability of the sensor to 100 ppm NO within 35-days.
Figure 5.
XRD patterns of NiFe2O4, Fe2O3 and (NiFe2O4+x wt.% Fe2O3) composites (x=15%, 30%, 45%), with calcined at 1200oC for 2h.
Figure 5.
XRD patterns of NiFe2O4, Fe2O3 and (NiFe2O4+x wt.% Fe2O3) composites (x=15%, 30%, 45%), with calcined at 1200oC for 2h.
Figure 6.
SEM images of (a), (b) NiFe2O4; (c), (d) Fe2O3; (e), (f) NiFe2O4+30 wt.% Fe2O3 composite sensing electrode prepared at 1200℃ in different scale.
Figure 6.
SEM images of (a), (b) NiFe2O4; (c), (d) Fe2O3; (e), (f) NiFe2O4+30 wt.% Fe2O3 composite sensing electrode prepared at 1200℃ in different scale.
Figure 7.
(a) Response magnitude to 3 ppm NO2 and 100 ppm NO in 21% O2 with N2 balance respectively for the YSZ-based sensors comprising NiFe2O4/Fe2O3 composite SEs and Mn-based RE, operated at 390℃; (b) effect of change in operating/sintering temperature on the sensing characteristic of the sensor using (NiFe2O4+30 wt.% Fe2O3)-SE in 21% O2 with N2 balance.
Figure 8.
Sensing characteristics of the YSZ-based gas sensor using (NiFe2O4+30 wt.% Fe2O3)-SE. (a) Dependence of the response signal on the logarithm of the NO2 concentration in the range of 1.5-10 ppm at 390oC; (b) repeated response to 3 ppm NO2 and 100 ppm NO during aging process; (c) repeated response transients to 3 ppm NO2 and 100 ppm NO; (d) long-term stability of the sensor to 3 ppm NO2 within 20-days.
Figure 9.
Comparison of the NO and NO2 gas adsorption for NiO using the resonant microcantilever. (a) response frequency difference of 100 ppm NO; (b) response frequency difference of 10 ppm NO2.
Figure 9.
Comparison of the NO and NO2 gas adsorption for NiO using the resonant microcantilever. (a) response frequency difference of 100 ppm NO; (b) response frequency difference of 10 ppm NO2.
Figure 10.
Comparison of the NO and NO2 gas adsorption for (NiFe2O4+30 wt.% Fe2O3) calcined at 1200℃ using the resonant microcantilever. (a) response frequency difference of 3 ppm NO2; (b) response frequency difference of 100 ppm NO.
Figure 10.
Comparison of the NO and NO2 gas adsorption for (NiFe2O4+30 wt.% Fe2O3) calcined at 1200℃ using the resonant microcantilever. (a) response frequency difference of 3 ppm NO2; (b) response frequency difference of 100 ppm NO.
Figure 11.
Polarization curves in different concentration of NO and NO2 using different sensors. (a) Sensor using NiO-SE, operated at 310oC; (b) Sensor using (NiFe2O4+30 wt.%Fe2O3)-SE, operated at 390oC. (IHigh and ILow represent the current value generated from high concentration or low concentration of NO or NO2, respectively.).
|
Disclaimer/Publisher’s Note: The statements, opinions and data contained in all publications are solely those of the individual author(s) and contributor(s) and not of MDPI and/or the editor(s). MDPI and/or the editor(s) disclaim responsibility for any injury to people or property resulting from any ideas, methods, instructions or products referred to in the content. |
© 2024 by the authors. Licensee MDPI, Basel, Switzerland. This article is an open access article distributed under the terms and conditions of the Creative Commons Attribution (CC BY) license (http://creativecommons.org/licenses/by/4.0/).
