Submitted:
23 October 2024
Posted:
24 October 2024
You are already at the latest version
Abstract
Keywords:
1. Introduction
2. Materials and Methods
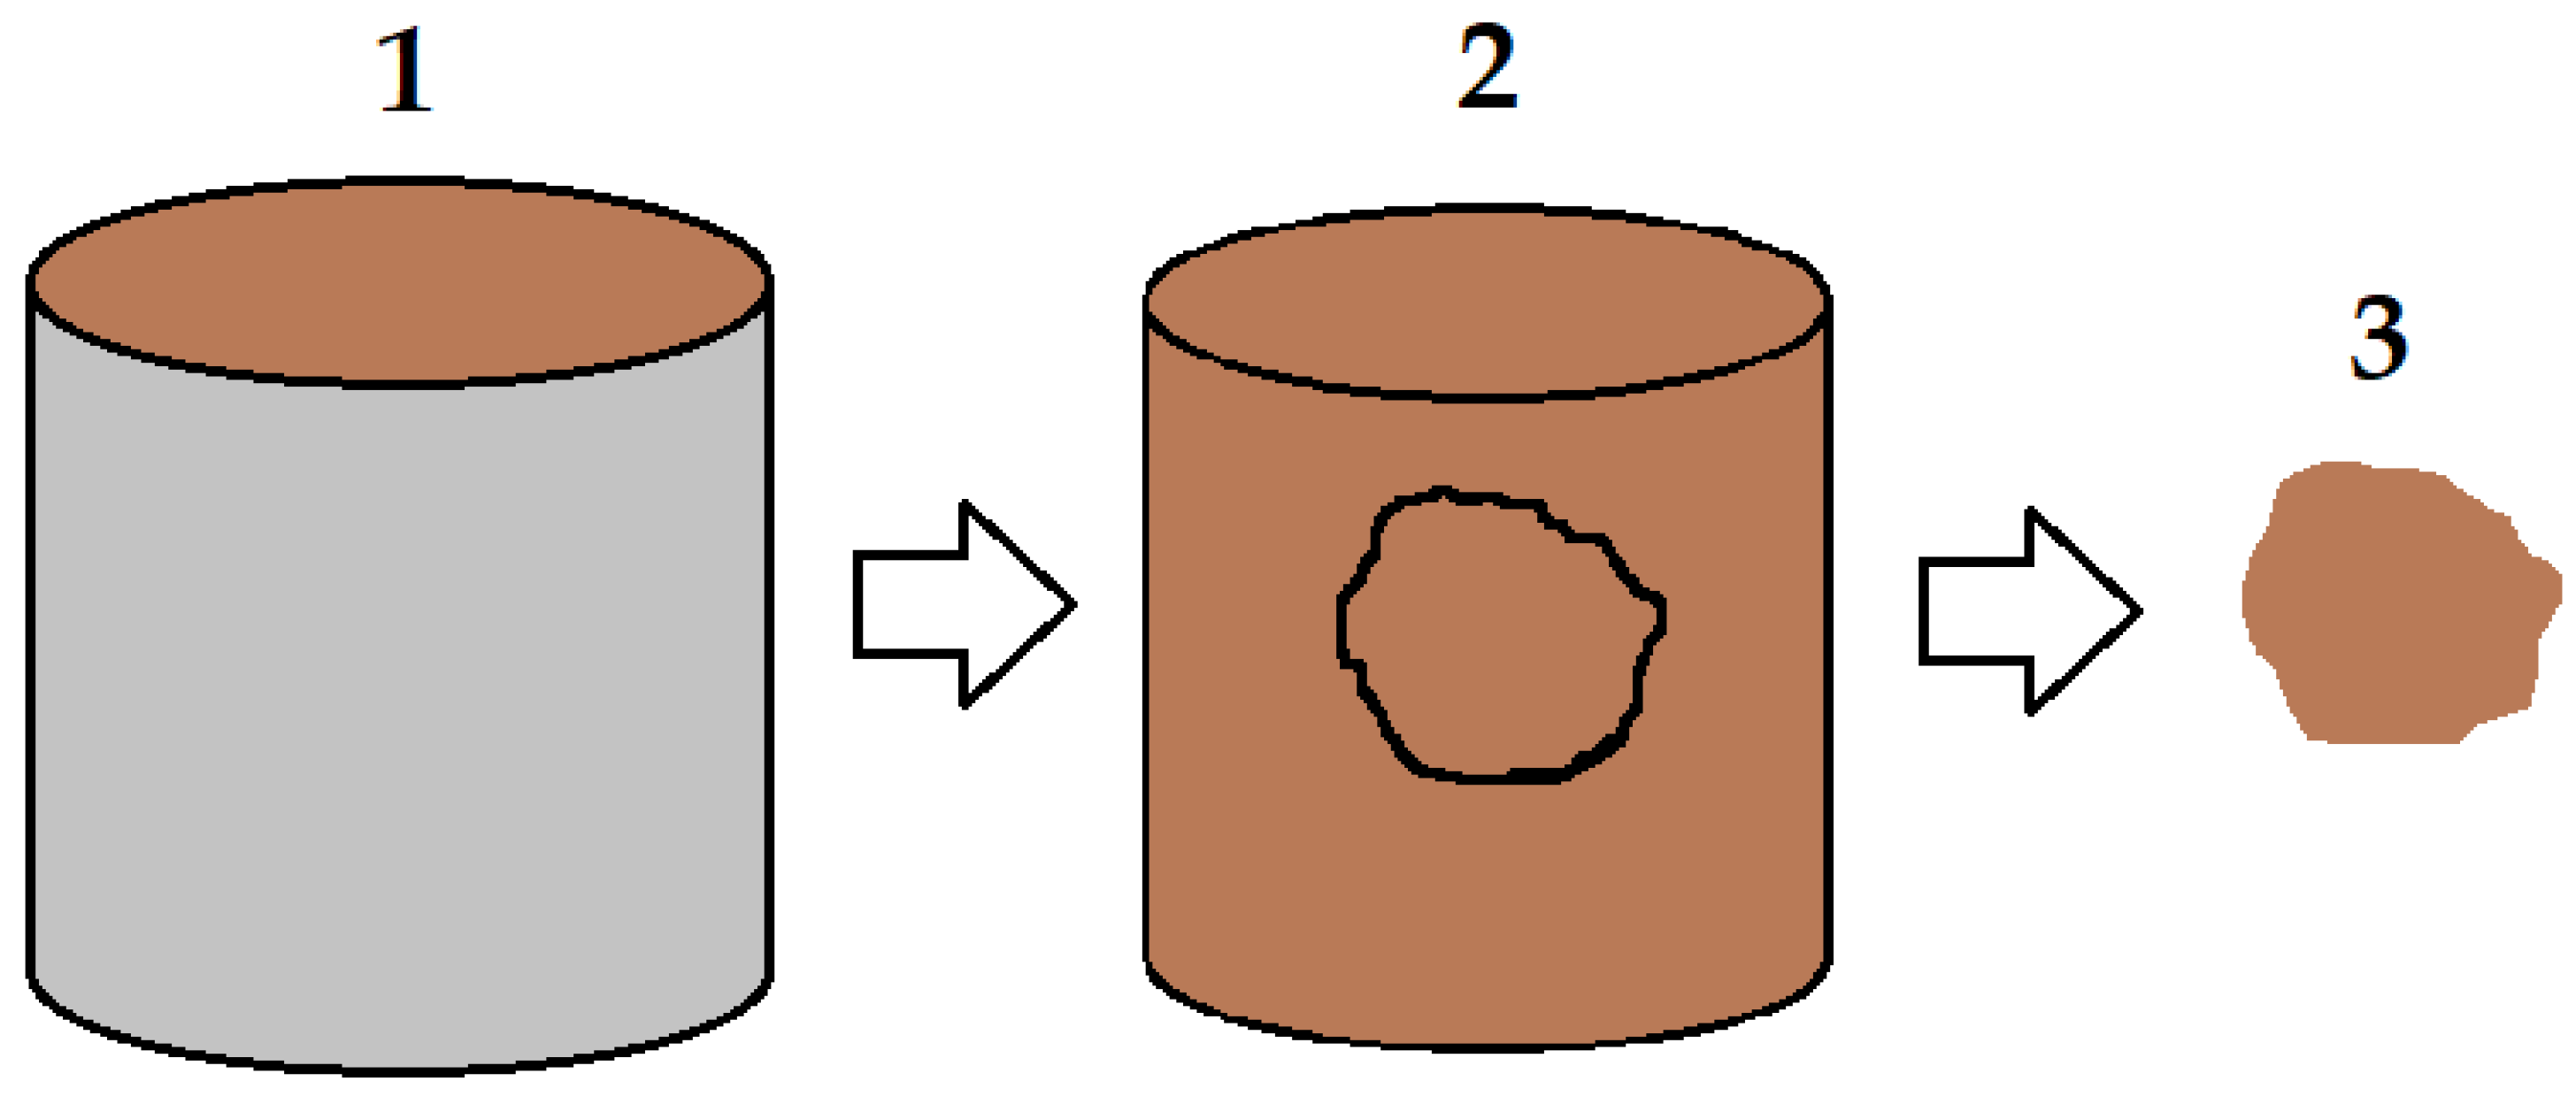
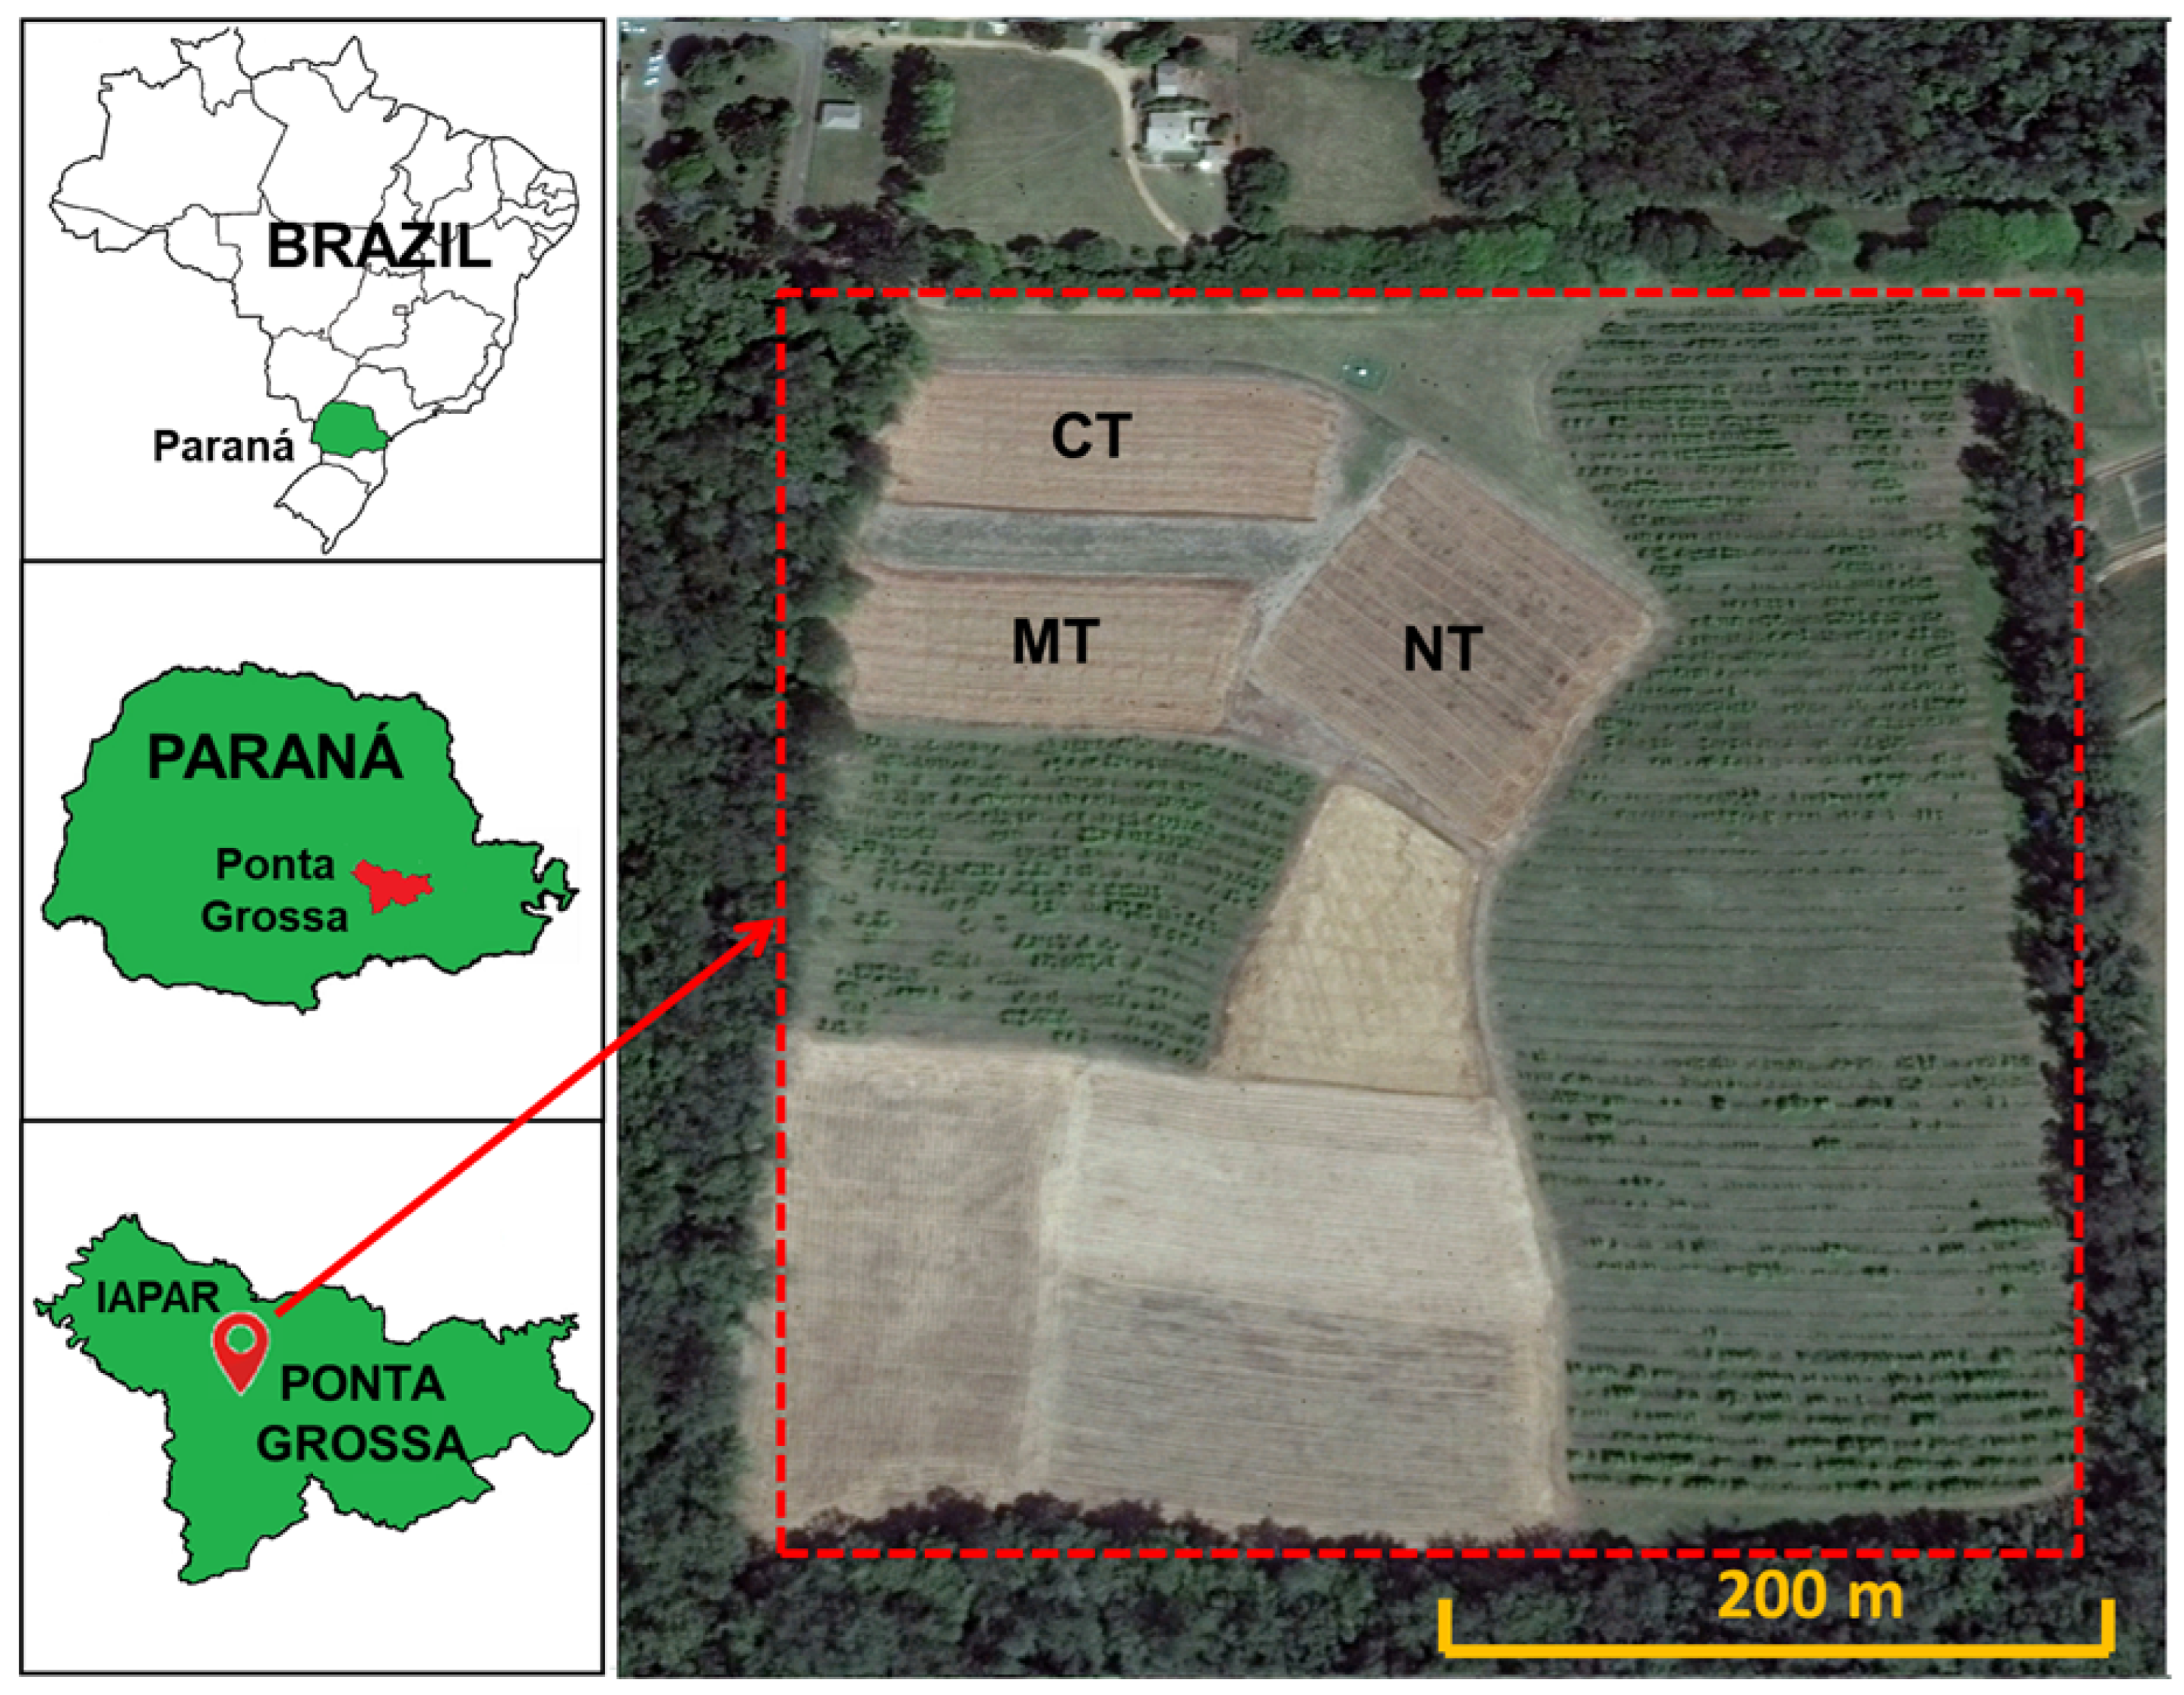
2.1. Experimental Area and Soil Sampling
2.2. Wetting and Drying (W-D) Cycles
2.3. X-ray Micro-Computed Tomography (X-CT)
2.4. Quantification of Physical and Morphometric Properties Analyzed Using 3D Imaging
3. Results
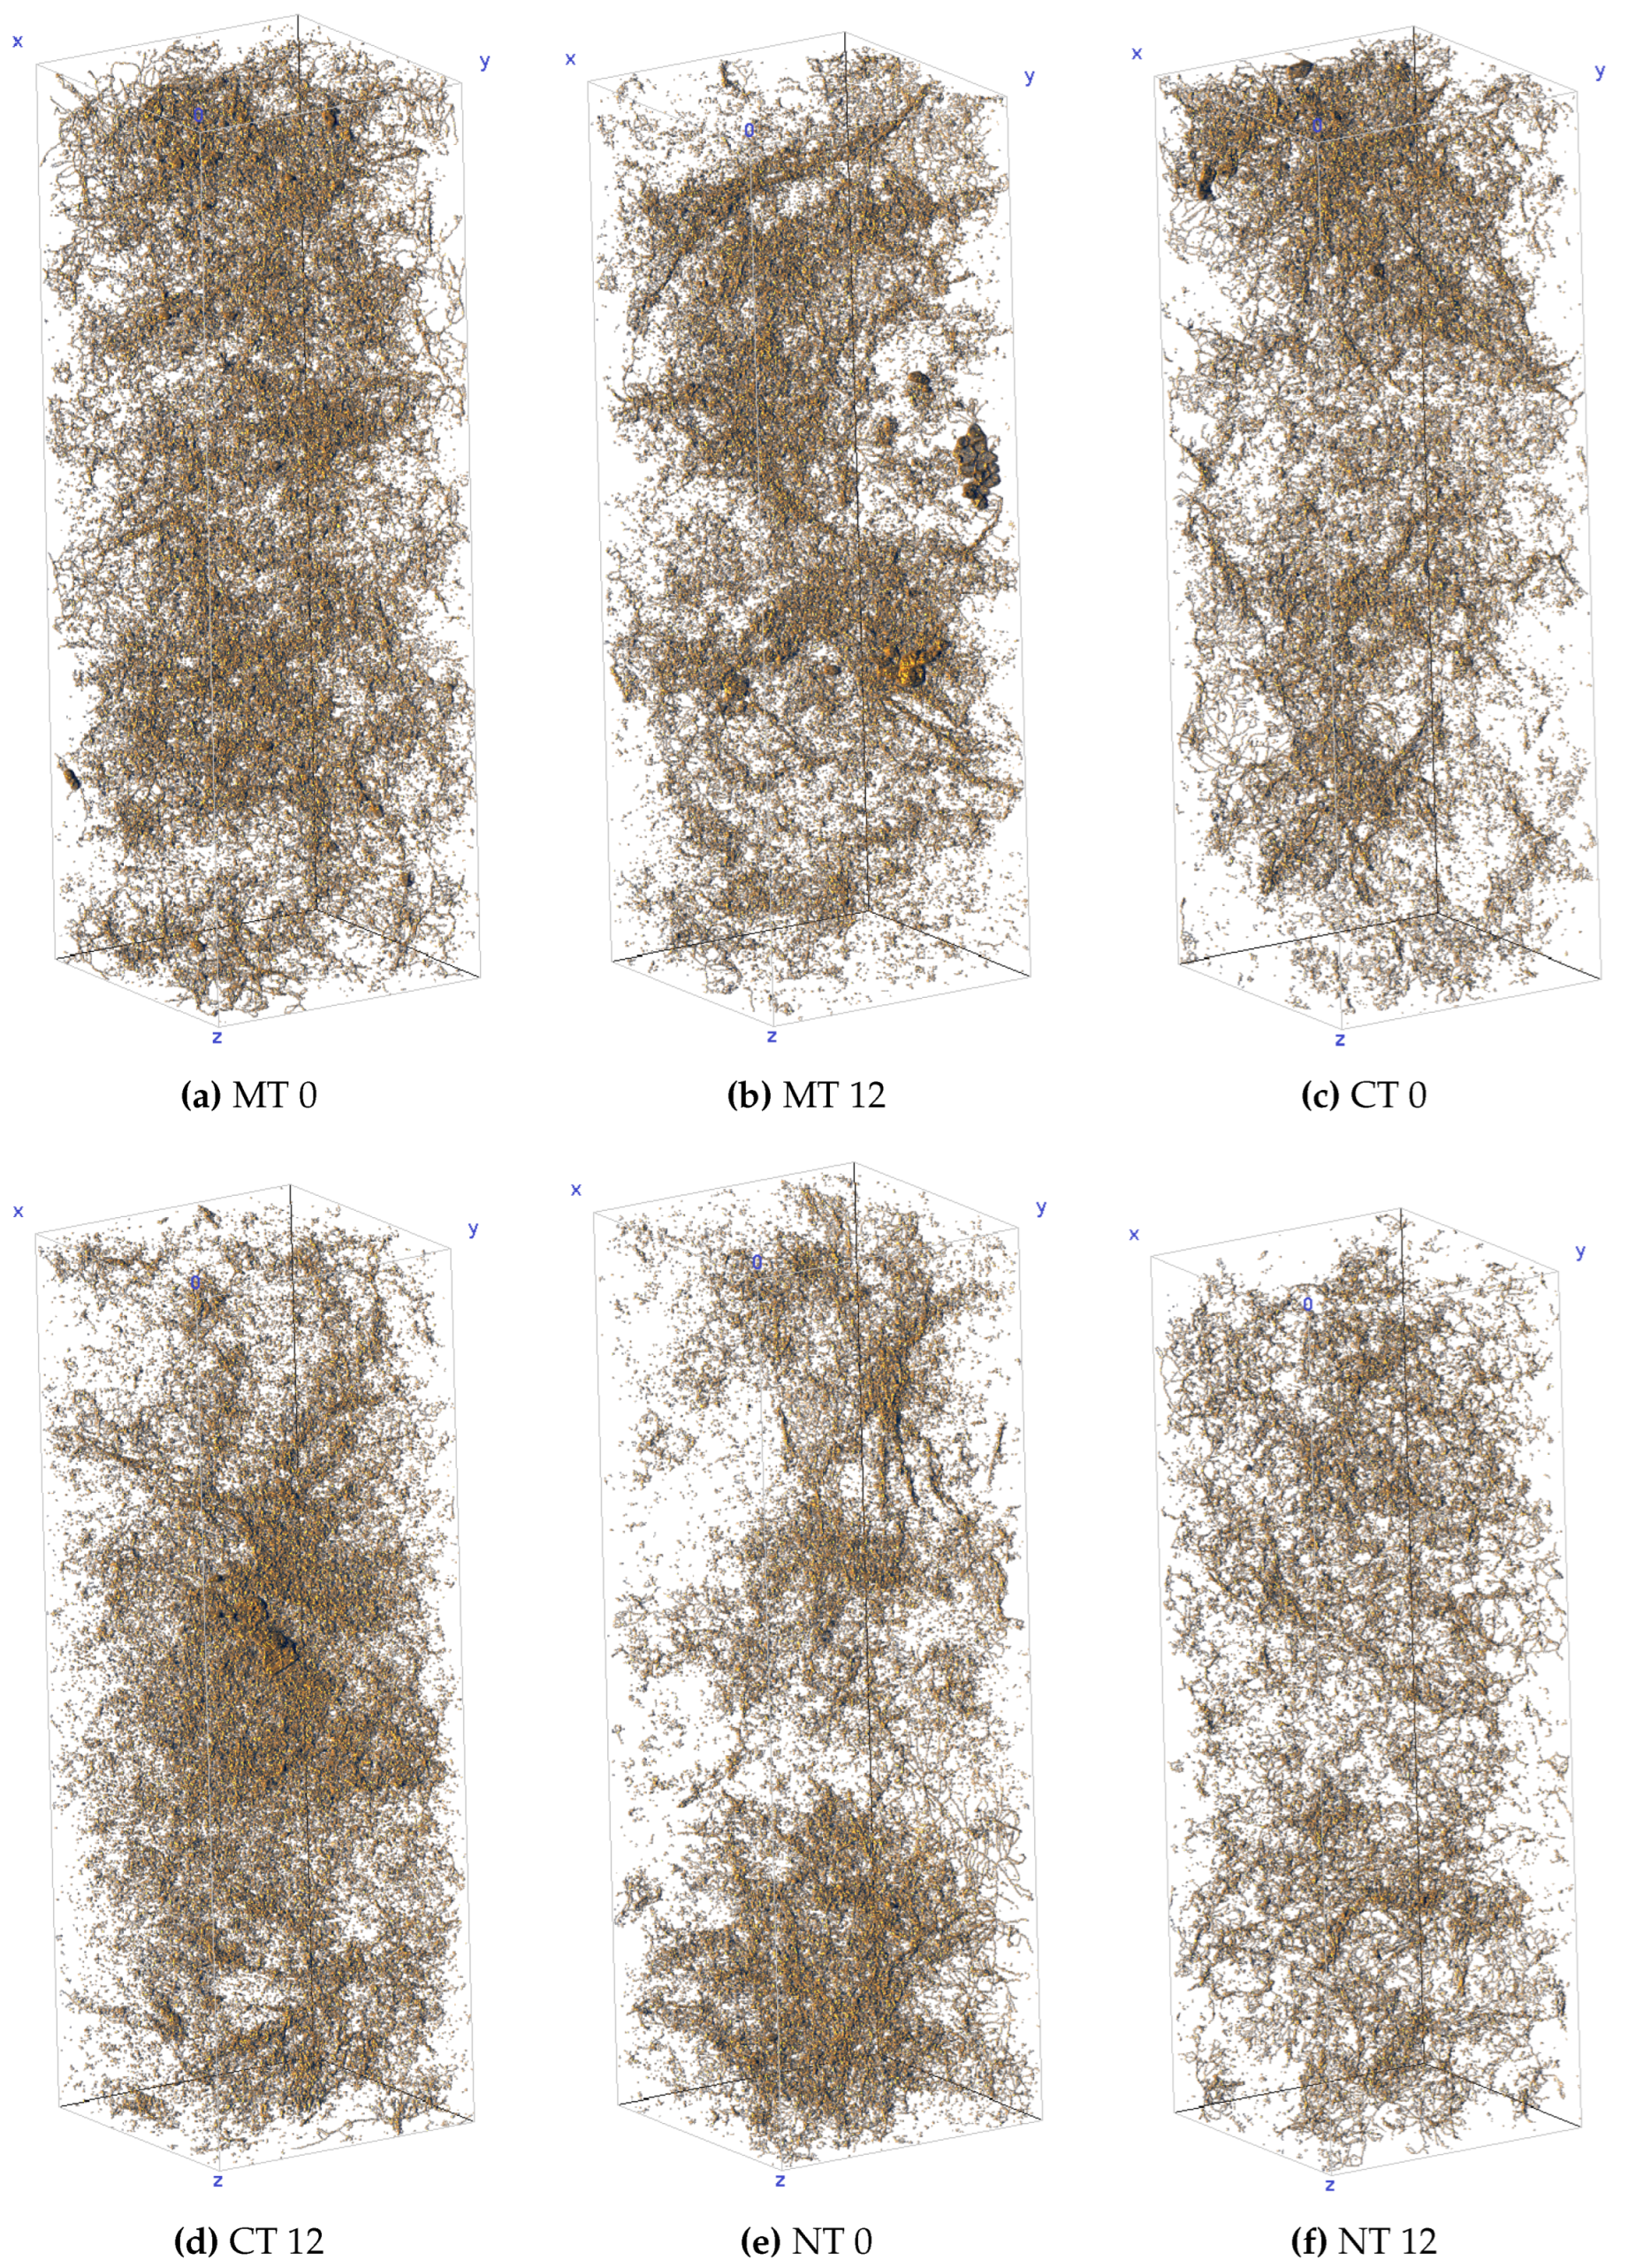
3.1. Image Analysis
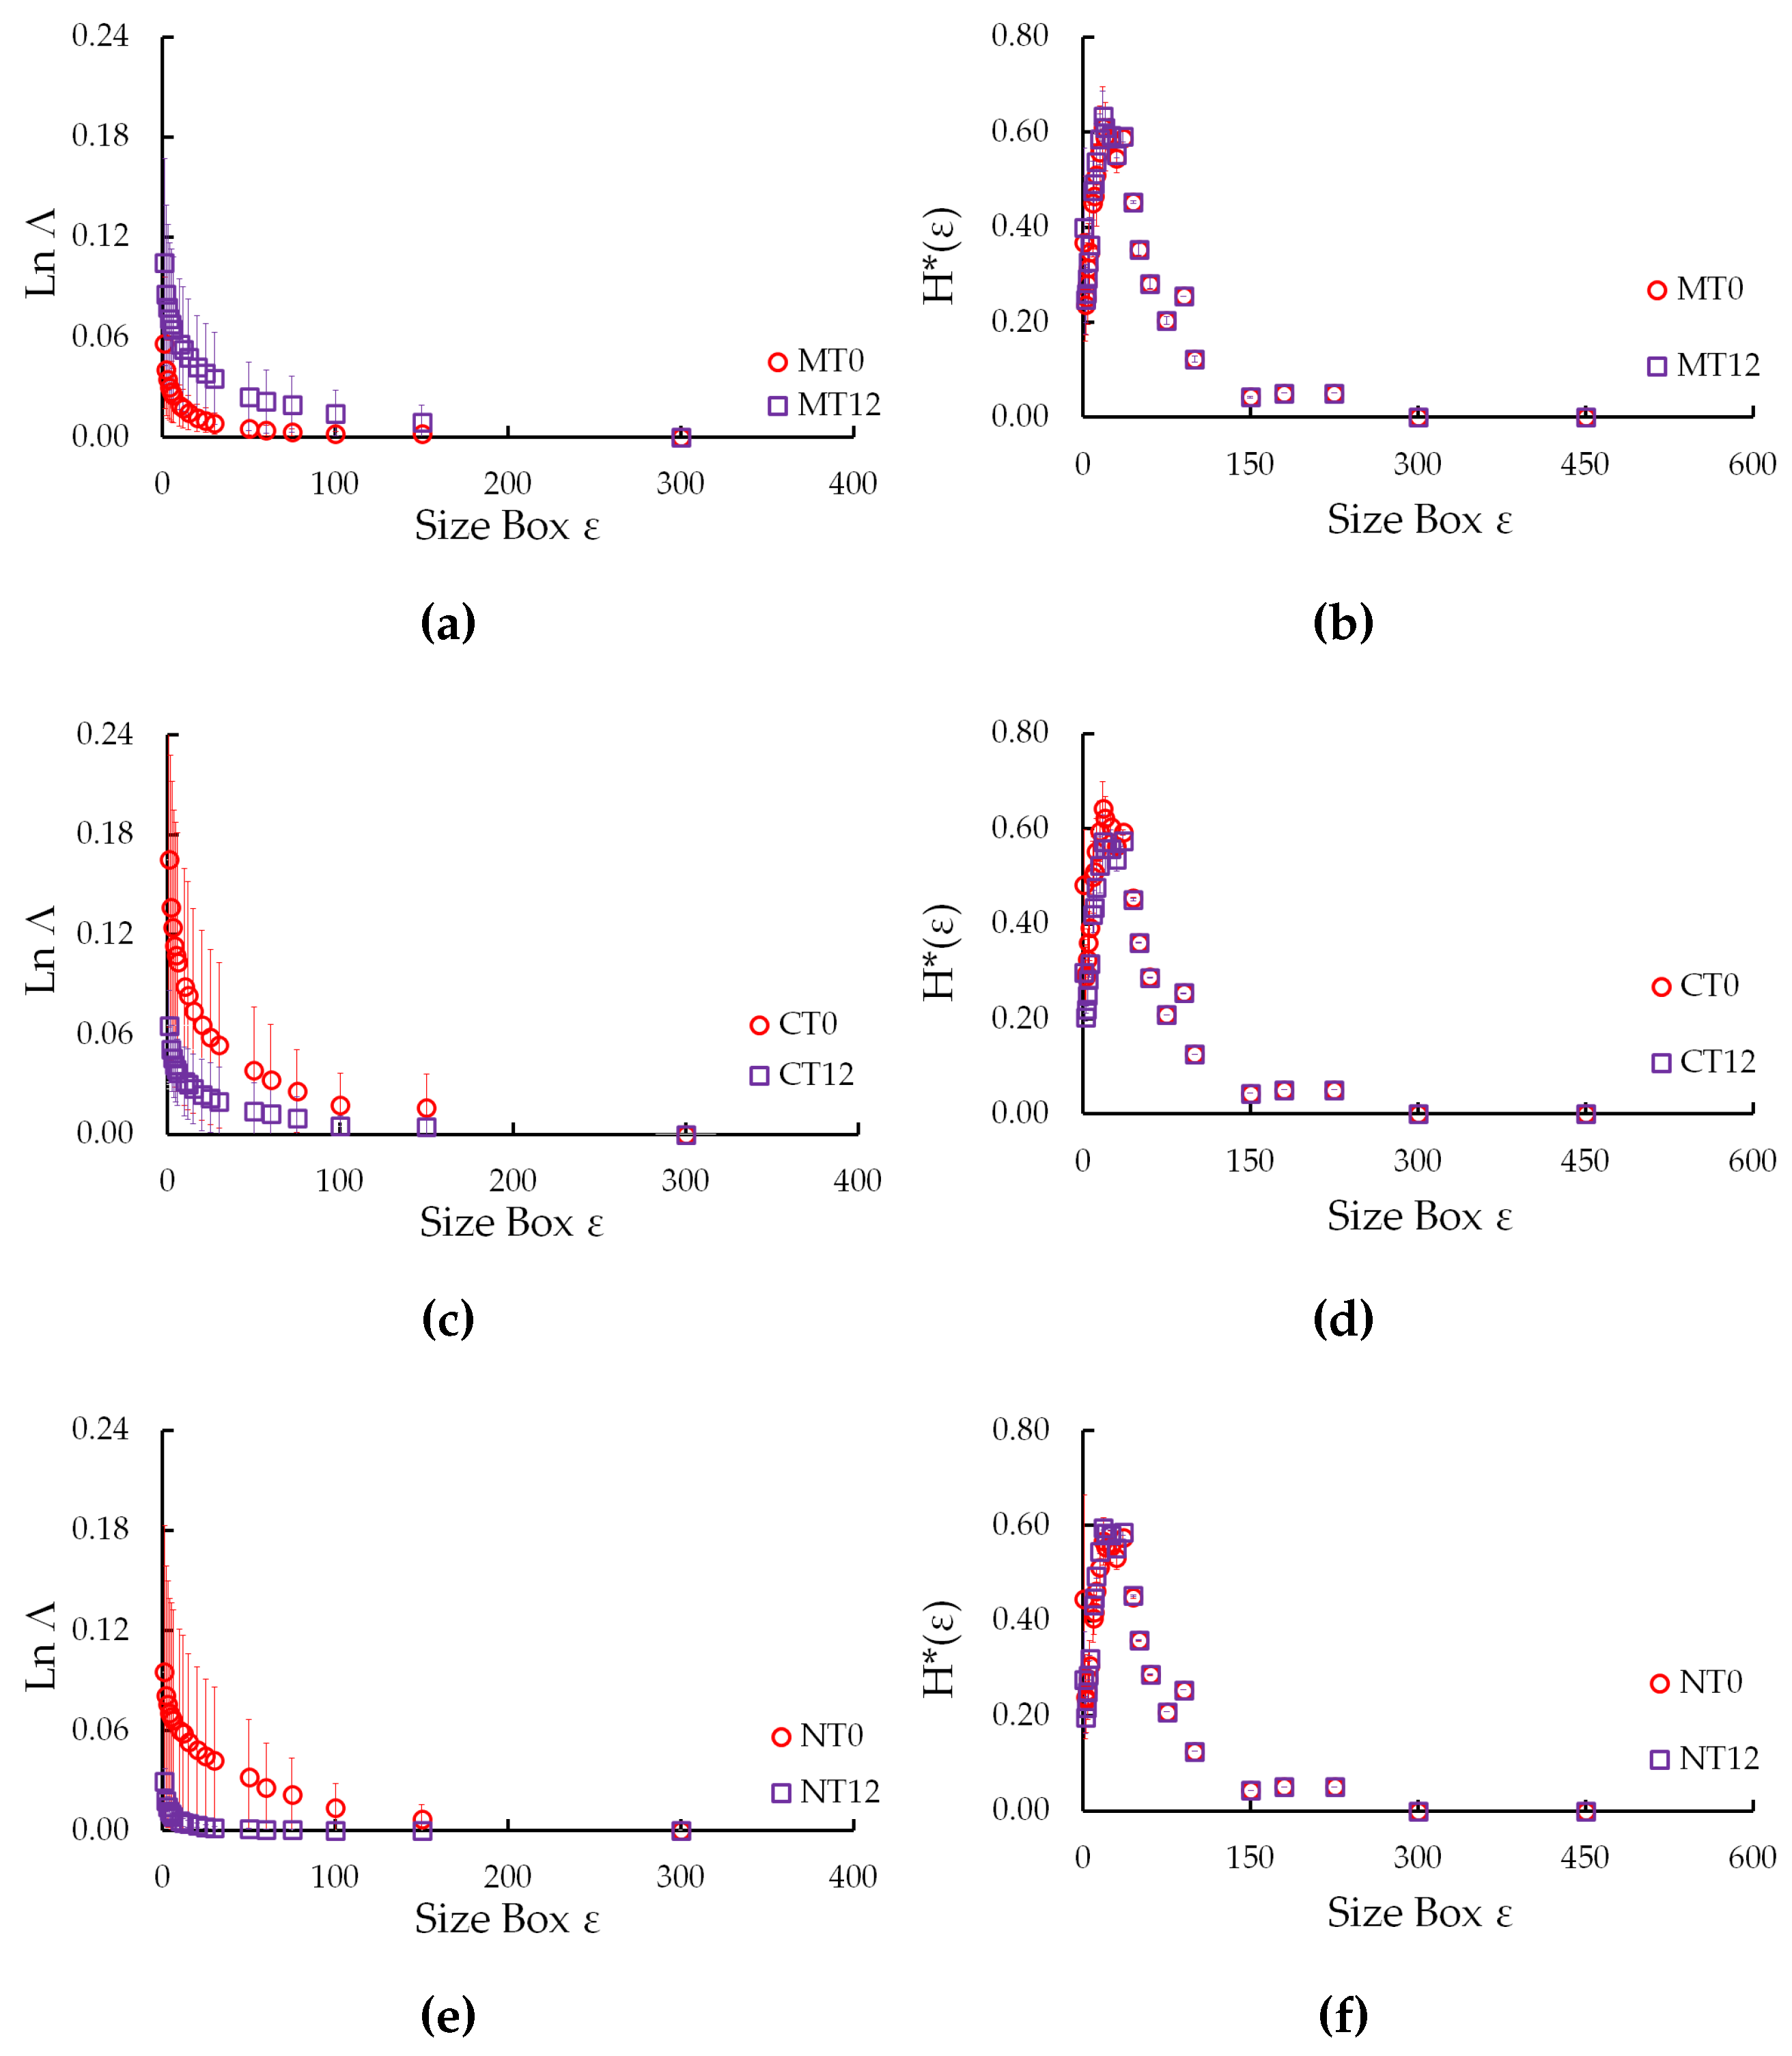
3.2. 3D Lacunarities, 3D Multifractal Spectra, Normalized Shannon Entropy, and Generalized Fractal Dimensions
3.3. Physical Properties: Porosity, Degree of Anisotropy and Number of Pores
3.4. Morphometric Properties: Connectivity of Pores, Tortuosity, Volume and Number of Pores by Shape
4. Discussion
5. Conclusions
Author Contributions
Funding
Institutional Review Board Statement
Data Availability Statement
Acknowledgments
Conflicts of Interest
Abbreviations
| W-D | wetting-drying |
| NT | no-tillage |
| MT | minimum tillage |
| CT | conventional tillage |
| X-CT | X-ray micro-computed tomography |
| IAPAR | Instituto de Desenvolvimento Rural do Paraná |
| 3D | three dimensional |
| TIFF | Tag Image File Format |
| NASS | Non-linear Analysis Scaling System |
Appendix A
| Management | Cycles | Parameters | |||||||
|---|---|---|---|---|---|---|---|---|---|
| Replicates | A | f() | |||||||
| CT | 0 | R1 | 0.26 | 0.40 | 2.77 | 2.99 | 2.77 | 2.75 | 2.73 |
| R2 | 0.07 | 1.51 | 2.77 | 2.81 | 2.77 | 2.75 | 2.75 | ||
| R3 | 0.06 | 1.64 | 2.77 | 2.81 | 2.77 | 2.75 | 2.74 | ||
| 12 | R1 | 0.05 | 1.59 | 2.77 | 2.80 | 2.77 | 2.76 | 2.75 | |
| R2 | 0.05 | 1.64 | 2.77 | 2.82 | 2.77 | 2.75 | 2.75 | ||
| R3 | 0.08 | 1.21 | 2.77 | 2.82 | 2.77 | 2.75 | 2.75 | ||
| MT | 0 | R1 | 0.05 | 1.69 | 2.77 | 2.80 | 2.77 | 2.76 | 2.75 |
| R2 | 0.05 | 1.54 | 2.77 | 2.81 | 2.77 | 2.75 | 2.75 | ||
| R3 | 0.08 | 1.64 | 2.77 | 2.81 | 2.77 | 2.75 | 2.74 | ||
| 12 | R1 | 0.10 | 1.34 | 2.77 | 2.79 | 2.77 | 2.75 | 2.74 | |
| R2 | 0.05 | 1.57 | 2.77 | 2.80 | 2.77 | 2.75 | 2.75 | ||
| R3 | 0.06 | 1.59 | 2.77 | 2.81 | 2.77 | 2.75 | 2.75 | ||
| NT | 0 | R1 | 0.06 | 1.38 | 2.77 | 2.81 | 2.77 | 2.75 | 2.74 |
| R2 | 0.25 | 0.77 | 2.77 | 2.96 | 2.77 | 2.75 | 2.74 | ||
| R3 | 0.08 | 1.50 | 2.77 | 2.82 | 2.77 | 2.75 | 2.74 | ||
| 12 | R1 | 0.05 | 1.52 | 2.77 | 2.80 | 2.77 | 2.76 | 2.75 | |
| R2 | 0.05 | 1.55 | 2.77 | 2.80 | 2.77 | 2.75 | 2.75 | ||
| R3 | 0.05 | 1.52 | 2.77 | 2.80 | 2.77 | 2.76 | 2.75 | ||

References
- Bronick, C.; Lal, R. Soil structure and management: a review. Geoderma 2005, 124, 3–22. [Google Scholar] [CrossRef]
- Alaoui, A.; Lipiec, J.; Gerke, H. A review of the changes in the soil pore system due to soil deformation: A hydrodynamic perspective. Soil and Tillage Research 2011, 115–116, 1–15. [Google Scholar] [CrossRef]
- Schlüter, S.; Sammartino, S.; Koestel, J. Exploring the relationship between soil structure and soil functions via pore-scale imaging. Geoderma 2020, 370, 114370. [Google Scholar] [CrossRef]
- Weidhuner, A.; Hanauer, A.; Krausz, R.; Crittenden, S.J.; Gage, K.; Sadeghpour, A. Tillage impacts on soil aggregation and aggregate-associated carbon and nitrogen after 49 years. Soil and Tillage Research 2021, 208, 104878. [Google Scholar] [CrossRef]
- Aziz, I.; Mahmood, T.; Islam, K.R. Effect of long term no-till and conventional tillage practices on soil quality. Soil and Tillage Research 2013, 131, 28–35. [Google Scholar] [CrossRef]
- Diel, J.; Vogel, H.J.; Schlüter, S. Impact of wetting and drying cycles on soil structure dynamics. Geoderma 2019, 345, 63–71. [Google Scholar] [CrossRef]
- Hochman, D.; Dor, M.; Mishael, Y. Diverse effects of wetting and drying cycles on soil aggregation: Implications on pesticide leaching. Chemosphere 2021, 263, 127910. [Google Scholar] [CrossRef] [PubMed]
- Leij, F.J.; Ghezzehei, T.A.; Or, D. Modeling the dynamics of the soil pore-size distribution. Soil and Tillage Research 2002, 64, 61–78. [Google Scholar] [CrossRef]
- Ma, R.; Cai, C.; Li, Z.; Wang, J.; Xiao, T.; Peng, G.; Yang, W. Evaluation of soil aggregate microstructure and stability under wetting and drying cycles in two Ultisols using synchrotron-based X-ray micro-computed tomography. Soil and Tillage Research 2015, 149, 1–11. [Google Scholar] [CrossRef]
- Yudina, A.; Klyueva, V.; Romanenko, K.; Fomin, D. Micro- within macro: How micro-aggregation shapes the soil pore space and water-stability. Geoderma 2022, 415, 115771. [Google Scholar] [CrossRef]
- Wang, W.; Kravchenko, A.N.; Smucker, A.J.M.; Liang, W.; Rivers, M.L. Intra-aggregate Pore Characteristics: X-ray Computed Microtomography Analysis. Soil Science Society of America Journal 2012, 76, 1159–1171. [Google Scholar] [CrossRef]
- Singh, N.; Kumar, S.; Udawatta, R.P.; Anderson, S.H.; de Jonge, L.W.; Katuwal, S. X-ray micro-computed tomography characterized soil pore network as influenced by long-term application of manure and fertilizer. Geoderma 2021, 385, 114872. [Google Scholar] [CrossRef]
- Meira Cássaro, F.A.; Posadas Durand, A.N.; Gimenez, D.; Pedro Vaz, C.M. Pore-Size Distributions of Soils Derived using a Geometrical Approach and Multiple Resolution MicroCT Images. Soil Science Society of America Journal 2017, 81, 468–476. [Google Scholar] [CrossRef]
- Ngom, N.F.; Garnier, P.; Monga, O.; Peth, S. Extraction of three-dimensional soil pore space from microtomography images using a geometrical approach. Geoderma 2011, 163, 127–134. [Google Scholar] [CrossRef]
- Ferreira, T.R.; Pires, L.F.; Wildenschild, D.; Heck, R.J.; Antonino, A.C. X-ray microtomography analysis of lime application effects on soil porous system. Geoderma 2018, 324, 119–130. [Google Scholar] [CrossRef]
- Pachepsky, Y.; Crawford, J. Fractal analysis of soils. Encyclopedia of Soils in the Environment.
- Posadas, A.N.D.; Giménez, D.; Quiroz, R.; Protz, R. Multifractal Characterization of Soil Pore Systems. Soil Science Society of America Journal 2003, 67, 1361–1369. [Google Scholar] [CrossRef]
- Chun, H.C.; Giménez, D.; Yoon, S.W. Morphology, lacunarity and entropy of intra-aggregate pores: Aggregate size and soil management effects. Geoderma 2008, 146, 83–93. [Google Scholar] [CrossRef]
- Nitsche, P.; Caramori, P.; Ricce, W.; Pinto, L. Atlás Climático do Estado do Paraná. IAPAR, Londrina, 2019.
- The University of Nottingham. Our facilities: Nanotom microCT scanner. https://www.nottingham.ac.uk/microct/facilities/nanotom.aspx, accessed on 16.10.2024.
- Schneider, C.A.; Rasband, W.S.; Eliceiri, K.W. NIH Image to ImageJ: 25 years of image analysis. Nature Methods 2012, 9, 671–675. [Google Scholar] [CrossRef] [PubMed]
- Otsu, N. A Threshold Selection Method from Gray-Level Histograms. IEEE Transactions on Systems, Man, and Cybernetics 1979, 9, 62–66. [Google Scholar] [CrossRef]
- The MathWorks, I. MATLAB. https://www.mathworks.com, 2018. Version R2018a.
- Dong, P. Lacunarity analysis of raster datasets and 1D, 2D, and 3D point patterns. Computers & Geosciences 2009, 35, 2100–2110. [Google Scholar] [CrossRef]
- Monreal, J.C.; Martínez, F.S.J.; Martí, J.I.; Pérez-Gómez, R. Lacunarity of the Spatial Distributions of Soil Types in Europe. Vadose Zone Journal 2013, 12, 1–9. [Google Scholar] [CrossRef]
- Posadas, A.N.D.; Lourenço, A.L.F. NASS: Non-linear Analysis Scaling System, 2019. Software developed with the support of the Department of Environmental Science, Rutgers, The State University of New Jersey, USA.
- Andraud, C.; Beghdadi, A.; Haslund, E.; Hilfer, R.; Lafait, J.; Virgin, B. Local entropy characterization of correlated random microstructures. Physica A: Statistical Mechanics and its Applications 1997, 235, 307–318. [Google Scholar] [CrossRef]
- Bullock, P.; Fedoroff, N.; Jongerius, A.; Stoops, G.; Tursina, T. Handbook for soil thin section description.; Waine Research: Albrighton, UK, 1985. [Google Scholar]
- Galdos, M.; Pires, L.; Cooper, H.; Calonego, J.; Rosolem, C.; Mooney, S. Assessing the long-term effects of zero-tillage on the macroporosity of Brazilian soils using X-ray Computed Tomography. Geoderma 2019, 337, 1126–1135. [Google Scholar] [CrossRef] [PubMed]
- Odgaard, A.; Gundersen, H. Quantification of connectivity in cancellous bone, with special emphasis on 3-D reconstructions. Bone 1993, 14, 173–182. [Google Scholar] [CrossRef] [PubMed]
- Roque, W.L.; Costa, R.R. A plugin for computing the pore/grain network tortuosity of a porous medium from 2D/3D MicroCT image. Applied Computing and Geosciences 2020, 5, 100019. [Google Scholar] [CrossRef]
- de Oliveira, J.A.T.; Cássaro, F.A.M.; Posadas, A.N.D.; Pires, L.F. Soil Pore Network Complexity Changes Induced by Wetting and Drying Cycles—A Study Using X-ray Microtomography and 3D Multifractal Analyses. International Journal of Environmental Research and Public Health 2022, 19, 10582. [Google Scholar] [CrossRef] [PubMed]
- Tang, C.S.; Shi, B. Swelling and shrinkage behaviour of expansive soil during wetting-drying cycles. Chinese Journal of Geotechnical Engineering 2011, 33, 1376–1384. [Google Scholar]
- Fomin, D.S.; Yudina, A.V.; Romanenko, K.A.; Abrosimov, K.N.; Karsanina, M.V.; Gerke, K.M. Soil pore structure dynamics under steady-state wetting-drying cycle. Geoderma 2023, 432, 116401. [Google Scholar] [CrossRef]
- Kravchenko, A.; Wang, A.N.W.; Smucker, A.J.M.; Rivers, M.L. Long-term Differences in Tillage and Land Use Affect Intra-aggregate Pore Heterogeneity. Soil Science Society of America Journal 2011, 75, 1658–1666. [Google Scholar] [CrossRef]
- Cheik, S.; Jouquet, P.; Maeght, J.; Capowiez, Y.; Tran, T.; Bottinelli, N. X-ray tomography analysis of soil biopores structure under wetting and drying cycles. European Journal of Soil Science 2021, 72, 2128–2132. [Google Scholar] [CrossRef]
- Galdos, M.V.; Brown, E.; Rosolem, C.A.; Pires, L.F.; Hallett, P.D.; Mooney, S.J. Brachiaria species influence nitrate transport in soil by modifying soil structure with their root system. Scientific Reports 2020, 10. [Google Scholar] [CrossRef]
- Tang, C.S.; Wang, D.Y.; Shi, B.; Li, J. Effect of wetting–drying cycles on profile mechanical behavior of soils with different initial conditions. CATENA 2016, 139, 105–116. [Google Scholar] [CrossRef]
- Caniego, F.; Martí, M.; San José, F. Rényi dimensions of soil pore size distribution. Geoderma 2003, 112, 205–216. [Google Scholar] [CrossRef]
- Vázquez, E.V.; Ferreiro, J.P.; Miranda, J.G.V.; González, A.P. Multifractal Analysis of Pore Size Distributions as Affected by Simulated Rainfall. Vadose Zone Journal 2008, 7, 500–511. [Google Scholar] [CrossRef]
- Soto-Gómez, D.; Pérez-Rodríguez, P.; Vázquez Juíz, L.; Paradelo, M.; López-Periago, J.E. 3D multifractal characterization of computed tomography images of soils under different tillage management: Linking multifractal parameters to physical properties. Geoderma 2020, 363, 114129. [Google Scholar] [CrossRef]
- Sartori, G.; Ferrari, G.; Pagliai, M. Changes in soil porosity and surface shrinkage in a remolded, saline clay soil treated with compost. Soil Science 1985, 139, 523. [Google Scholar] [CrossRef]
- Zemenu, G.; Martine, A.; Roger, C. Analyse du comportement d’un sol argileux sous sollicitations hydriques cycliques. Bulletin of Engineering Geology and the Environment 2009, 68, 421–436. [Google Scholar] [CrossRef]
- Pires, L.F.; Auler, A.C.; Roque, W.L.; Mooney, S.J. X-ray microtomography analysis of soil pore structure dynamics under wetting and drying cycles. Geoderma 2020, 362, 114103. [Google Scholar] [CrossRef] [PubMed]
- Guo, X.M.; Guo, N.; Liu, L. Effects of Wetting-Drying Cycles on the CT-Measured Macropore Characteristics under Farmland in Northern China. Eurasian Soil Science 2023, 56, 747–755. [Google Scholar] [CrossRef]
- Bodner, G.; Scholl, P.; Kaul, H.P. Field quantification of wetting–drying cycles to predict temporal changes of soil pore size distribution. Soil and Tillage Research 2013, 133, 1–9. [Google Scholar] [CrossRef]
- Wen, T.; Chen, X.; Shao, L. Effect of multiple wetting and drying cycles on the macropore structure of granite residual soil. Journal of Hydrology 2022, 614, 128583. [Google Scholar] [CrossRef]
- Pires, L.F.; Villanueva, F.C.; Dias, N.M.; Bacchi, O.O.S.; Reichardt, K. Chemical migration during soil water retention curve evaluation. Anais da Academia Brasileira de Ciências 2011, 83, 1097–1108. [Google Scholar] [CrossRef] [PubMed]
- An, R.; Kong, L.; Zhang, X.; Li, C. Effects of dry-wet cycles on three-dimensional pore structure and permeability characteristics of granite residual soil using X-ray micro computed tomography. Journal of Rock Mechanics and Geotechnical Engineering 2022, 14, 851–860. [Google Scholar] [CrossRef]
- Dhaliwal, J.K.; Kumar, S. 3D-visualization and quantification of soil porous structure using X-ray micro-tomography scanning under native pasture and crop-livestock systems. Soil and Tillage Research 2022, 218, 105305. [Google Scholar] [CrossRef]
- Tang, C.S.; Cheng, Q.; Gong, X.; Shi, B.; Inyang, H.I. Investigation on microstructure evolution of clayey soils: A review focusing on wetting/drying process. Journal of Rock Mechanics and Geotechnical Engineering 2023, 15, 269–284. [Google Scholar] [CrossRef]
- Ye, W.m.; Qi, Z.y.; Chen, B.; Xie, J.; Huang, Y.; Lu, Y.r.; Cui, Y.J. Mechanism of cultivation soil degradation in rocky desertification areas under dry/wet cycles. Environmental Earth Sciences 2010, 64, 269–276. [Google Scholar] [CrossRef]
- Peth, S.; Horn, R.; Beckmann, F.; Donath, T.; Fischer, J.; Smucker, A.J.M. Three-Dimensional Quantification of Intra-Aggregate Pore-Space Features using Synchrotron-Radiation-Based Microtomography. Soil Science Society of America Journal 2008, 72, 897–907. [Google Scholar] [CrossRef]
- Chakraborty, P.; Singh, N.; Bansal, S.; Sekaran, U.; Sexton, P.; Bly, A.; Anderson, S.H.; Kumar, S. Does the duration of no-till implementation influence depth distribution of soil organic carbon, hydro-physical properties, and computed tomography-derived macropore characteristics? Soil and Tillage Research 2022, 222, 105426. [Google Scholar] [CrossRef]
- Pagliai, M.; Vignozzi, N.; Pellegrini, S. Soil structure and the effect of management practices. Soil and Tillage Research 2004, 79, 131–143. [Google Scholar] [CrossRef]
- Mady, A.Y.; Shein, E.V. Assessment of pore space changes during drying and wetting cycles in hysteresis of soil water retention curve in Russia using X-ray computed tomography. Geoderma Regional 2020, 21, e00259. [Google Scholar] [CrossRef]
- Hillel, D. Introduction to environmental soil physics; Elsevier, 2003.
- Ambus, J.V.; Awe, G.O.; Faccio Carvalho, P.C.d.; Reichert, J.M. Integrated crop-livestock systems in lowlands with rice cultivation improve root environment and maintain soil structure and functioning. Soil and Tillage Research 2023, 227, 105592. [Google Scholar] [CrossRef]

Disclaimer/Publisher’s Note: The statements, opinions and data contained in all publications are solely those of the individual author(s) and contributor(s) and not of MDPI and/or the editor(s). MDPI and/or the editor(s) disclaim responsibility for any injury to people or property resulting from any ideas, methods, instructions or products referred to in the content. |
© 2024 by the authors. Licensee MDPI, Basel, Switzerland. This article is an open access article distributed under the terms and conditions of the Creative Commons Attribution (CC BY) license (http://creativecommons.org/licenses/by/4.0/).


