Preprint
Article

Investigating the Role of SPP1 (Osteopontin) in the Progression of Breast and other Cancers

Altmetrics

Downloads

52

Views

26

Comments

0

This version is not peer-reviewed

Submitted:

23 October 2024

Posted:

24 October 2024

You are already at the latest version

Alerts
Abstract
Background/Objectives: Cancer is caused by disruptions in the homeostatic state of normal cells, which results in dysregulation of the cell cycle, and uncontrolled growth and proliferation in affected cells to form tumors. Successful development of tumorous cells proceeds through the activation of pathways promoting cell development and functionality, as well as the suppression of immune signaling pathways; thereby providing these cells with proliferative advantages, which subsequently metastasize into surrounding tissues. These effects are primarily caused by the upregulation of oncogenes, of which SPP1 is one of the most well-known. Methods: In this study, we conducted a further examination of the transcriptomic expression profile of SPP1 (Osteopontin) during the progression of cancer in four human tissues, in order to understand the circumstances conducive to its activation and dysregulation, the biological pathways and other mechanisms involved, as well as differences in its splicing patterns influencing its expression and functionality. Results: A significant overexpression of SPP1 as well as a set of other highly correlated genes, was seen in a majority of tissues, indicating their extensive implication in cancer. Increased expression was observed with higher tumor stages, while applying therapeutic modalities targeting these genes dampened this effect. Pathway analyses showed gene signatures related to cell growth and development enriched in tumorigenic conditions and earlier cancer stages, while later stages of cancer showed pathways associated with weakened immune response. Moreover, the utilization of therapeutic methods showed the activation of immunogenic pathways, thereby confirming their viability. Further analyses of differential transcript expression levels in these oncogenes showed their exonic regions to be selectively overexpressed similarly in tumorigenic samples, while also displaying significant differences in exon selectivity between constituent transcripts, providing a basis for their high degree of multifunctionality in cancer. Conclusions: Overall, this study corroborates the entrenched role of SPP1 in cancer, while also highlighting its promising role in therapeutic development.
Keywords: 
Subject: Medicine and Pharmacology  -   Oncology and Oncogenics

1. Introduction

Cancer is one of the most globally prevalent diseases currently, affecting millions of individuals worldwide. It is primarily characterized by the abnormal and uncontrolled growth and division of cells, which results in the creation of aggregates of cells known as tumors, in affected tissues. Tumorous cells are capable of proliferating irrepressibly and subsequently migrating into neighboring tissue to affect healthy cells, and inducing similar actions in them, in a condition known as malignancy; following which fully developed tumors invade other tissues via circulatory and lymphatic systems, causing metastasis [1]. The principal mechanism causing initial tumor formation is the disruption of equilibrium in expression between two classes of genes: Proto-oncogenes, which are positive regulators of DNA replication and cell division, and tumor-suppressor genes which negatively regulate these processes in cells containing any defects or putative tumor-affected cells, thereby preventing them from undergoing division. The action of various external carcinogenic factors, such as chromosomal translocations, genetic mutations and amplifications, or epigenetic changes [2]; causes the activation and transformation of proto-oncogenes into oncogenes displaying abnormally higher expression. This is typically accompanied by the downregulation of tumor-suppressor genes, leading to the loss of homeostatic balance in affected cells and commencing in their unrestrained cell division and resultant tumor formation and growth facilitated by angiogenesis, while inhibiting normal cell apoptosis, thus promoting the growth and proliferation of tumors. Fully metastasized tumors, which represent later stages of cancer and during which symptoms are most apparent, are highly resistant to regular treatment methods. This causes cancer to have a very low survival rate, as well as an unequal global distribution, with higher prevalence in countries with low socio-economic development, mainly contributed to by a lack of access to adequate diagnostic and treatment facilities.
One of the most well-known oncogenes in cancer is SPP1 (secreted phosphoprotein 1, which encodes the protein Osteopontin, a non-collagenous bone matrix protein belonging to the Small Integrin-Binding Ligand N-linked Glycoprotein (SIBLING) family of glycoproteins, which plays an extensive role in several stages of tumor development [3], wherein its increased secretion has been found to be correlated with higher risks of malignancy in various forms of cancer [4]. It binds to the plasma membrane through its signaling receptors CD44 & αvβ3 integrin and has a diverse range of cellular functionalities. SPP1 is involved in the development of the conducive tumor microenvironment (TME) during initial tumor formation through angiogenesis and upregulation of various cellular processes including cell proliferation, adhesion, migration and inter-cellular communication [5]. Epithelial-mesenchymal transition (EMT) has been found to be mediated by SPP1, especially in its type 3 form, through the upregulation of transcription factors such as TWIST [6,7], SNAIL1 [7] and SNAIL2 [7], as well as activation of pathways such as PI3K-AKT-TWIST and hypoxia-inducible factor-1 alpha (HIF-1α) in various cancer models. It has been found to promote endothelial cell selection and migration during tumor angiogenesis [8,9]. Another of its mechanisms of action in cancer includes the negative regulation of T-cell activation through the overexpression of inhibitory molecules such as PD-L1, which results in T-cell exhaustion and apoptosis, causing immunosuppression in the tumor microenvironment and promoting tumor growth [10,11]. Finally, it has also been found to play an important role in the development of tumor resistance to treatment by chemotherapy and radiotherapy through the regulation of several pathways such as autophagy, PI3K/Akt signaling, MAPK signaling and EGFR pathways [12]. All these properties of SPP1 make it an interesting target with a large range of purposes, including as a useful biomarker for diagnosis of tumor aggressiveness and disease stage and survival in affected individuals [4,13,14]; as well as the development of therapeutic approaches involving SPP1 inhibition to suppress tumor growth, proliferation, and metastasis in patients.
The perturbation of proto-oncogenes and their conversion into oncogenes, as well as their subsequent role in cancer progression, is typically governed by the activity of a variety of biological pathways involving them, which principally enable their functionality. The positive regulation of several tumorigenic pathways associated with cell cycle progression, cell proliferation and cell apoptosis, is brought about through the overexpression and genetic alterations occurring in specific ‘driver’ genes, with many of them being co-occurrent in multiple forms of cancer [15]. Of note, SPP1 is found to make use of a large repertoire of biological pathways for the same, during which it is highly correlated with a set of specific other oncogenes in tumorous cells [7]. Gaining further insight into their pathway enrichment profiles is therefore crucial in order to investigate the precise mechanisms of oncogenic activity in disease progression within human tissues.
Additionally, the functionality of genes is also determined by the expression profiles of their constituent ‘transcripts’, or isoforms created by splicing patterns. Due to the high variability of the RNA splicing process, there exists the possibility of a gene having multiple splice variants or protein isoforms, occurring due to selective inclusions and deletions in exonic regions within each isoform, causing them to vary in sequence composition and length after undergoing translation to proteins. As a result, there can be a differential expression between spliced isoforms for the same gene, which ultimately influences their functionality as well as factors such as stability, localization within the genome and liability to transcriptional regulation [16]. Oncogenic activity in cancer has also been found to be associated with abnormalities in the regulation of alternative splicing, forming larger numbers of differentially expressed transcripts and thereby driving higher protein diversity and functionality in cancer progression [17], as well as the development of resistance to treatment modalities such as chemotherapy and radiotherapy [18]. A primary factor driving these variations in splicing events is differential exon usage occurring during the splicing process, which is observed in 90-95% of all genes with multiple transcripts [19]. Therefore, analyzing DEU patterns in oncogenes occurring during tumorigenesis can potentially provide greater insights into their functions and roles in cancer progression.
In this study, we have conducted a detailed investigation of the extensive role of SPP1 in four particular types of cancer in humans: Breast, Prostate, Renal and Skin; by analyzing its expression profile in these tissues during tumor occurrence and progression, its effects on the enrichment of related cellular pathways, as well as the examining differences in the expression of its splicing variants as a potential cause of modifications in its functionality during tumorigenesis.

2. Materials and Methods

Bulk transcriptomic (paired-end total RNA-Seq) data was collected from the Gene Expression Omnibus (GEO) repositories of 17 previous cancer studies in the aforementioned four types of tissues. Sequenced data was obtained in the form of sequence read archive (SRA) files, which were then processed using a transcriptomic analysis pipeline (Figure 1), using a set of specific bioinformatic tools. SRA files were converted into the FASTQ format using the NCBI tool ‘fasterq-dump’ (v2.9.1) [20], followed by trimming using Trimmomatic (v0.39) [21] in order to remove adapter sequences and filter out reads having a Phred quality score (Q) below 30 and lengths shorter than 50 base pairs. Quality scores were verified using FASTQC (v0.11.8) [22], which showed all reads to have good quality (Q > 30). Reads were aligned using Hisat2 (v2.1.0) [23] to the human genome (Hg38 Ensembl v97) in paired-end unstranded mode, following which uniquely mapped reads were quantified for gene & transcript features in the human genome using Subread featureCounts (v1.6.4) [24].
Read counts obtained were normalized using the TMM method and subjected to differential gene expression (DEG) using the R package ‘edgeR’ [25]. Genes having uniformly low expression across samples were removed using the default filtering method in edgeR (count ≥ 10 in at least 15 samples). Specific blacklisted genes such as intronic genes, pseudogenes and non-coding RNA, whose expression might correspond to background noise arising due to biological variation, were also excluded from count matrices. Samples were classified into groups based on conditions in their study of origin, representing tumor occurrence, grade, disease stage, treatment modalities or other physiological factors. Count matrices were fit onto generalized linear models and comparisons between categorized sample groups were performed using QLF (quasi-likelihood F) tests, obtaining genes showing dysregulation in either direction. Highly significant genes were selected using cutoff values of absolute FC > 1.5 along with nominal p-value < 0.05. Gene set enrichment analyses (GSEA v4.0) [26] were conducted with the normalized counts for determining pathways (represented by gene signatures) showing enrichment in each sample group; using the c2 (canonical pathways) and c6 (oncogenic signatures) gene set families obtained from the MSigDB database [27]. Since SPP1 has been found to interact with specific other oncogenes during cancer progression, we also used a set of six highly correlated genes found in a breast cancer study (FAP, ACTA2, TWIST1, ITGB1, S100A4 and CXCL12) [7], and looked for enrichment of MSigDB gene sets which involved SPP1 and at least one among these interacting genes. Significantly enriched pathways were determined using cutoff values of absolute NES (normalized enrichment score) > 1.4 along with nominal p-value < 0.05. Lists of the top 100 significantly dysregulated genes obtained in each DEG comparison per study, which showed patterns of co-expression with SPP1, were selected for analysis using Metascape (v3.5.20240101) [28] in order to identify the top 20 functionally enriched pathways by their Gene Ontology (GO) terms, as well as the interactions between them listed in order of significance. Differential splicing analyses were performed using the R package ‘DEXSEQ’ [29], in which reads were quantified for exonic regions within Ensembl transcripts per gene and compared using a negative binomial likelihood ratio test (LRT) between the categorized DEG groups, to examine differences in selective utilization of regions between the constituent transcripts per gene. Regions with significant differential exon usage (DEU) were quantified using a threshold of Benjamini-Hochberg (FDR) corrected p-value of less than 0.05.

3. Results

A total of 390 samples were processed successfully using the described pipeline (Figure 1), for 4 types of cancer-affected human tissue (Table 1). Quality control metrics displayed an average of 90% reads retained after filtering for low-quality bases, out of which around 75% reads were uniquely mapped to the Hg38 genome. Assignment of reads showed more than 70% mapped reads matching genomic features. Normalized and filtered count matrices obtained were grouped according to sample metadata for breast cancer (Table 2), prostate cancer (Table 3), renal cancer (Table 4) and skin cancer (Table 5) for downstream comparisons. During the final qualitative filtering for undesirable genes and those with uniformly low expression, about 75-80% genes with retained in the count matrix.
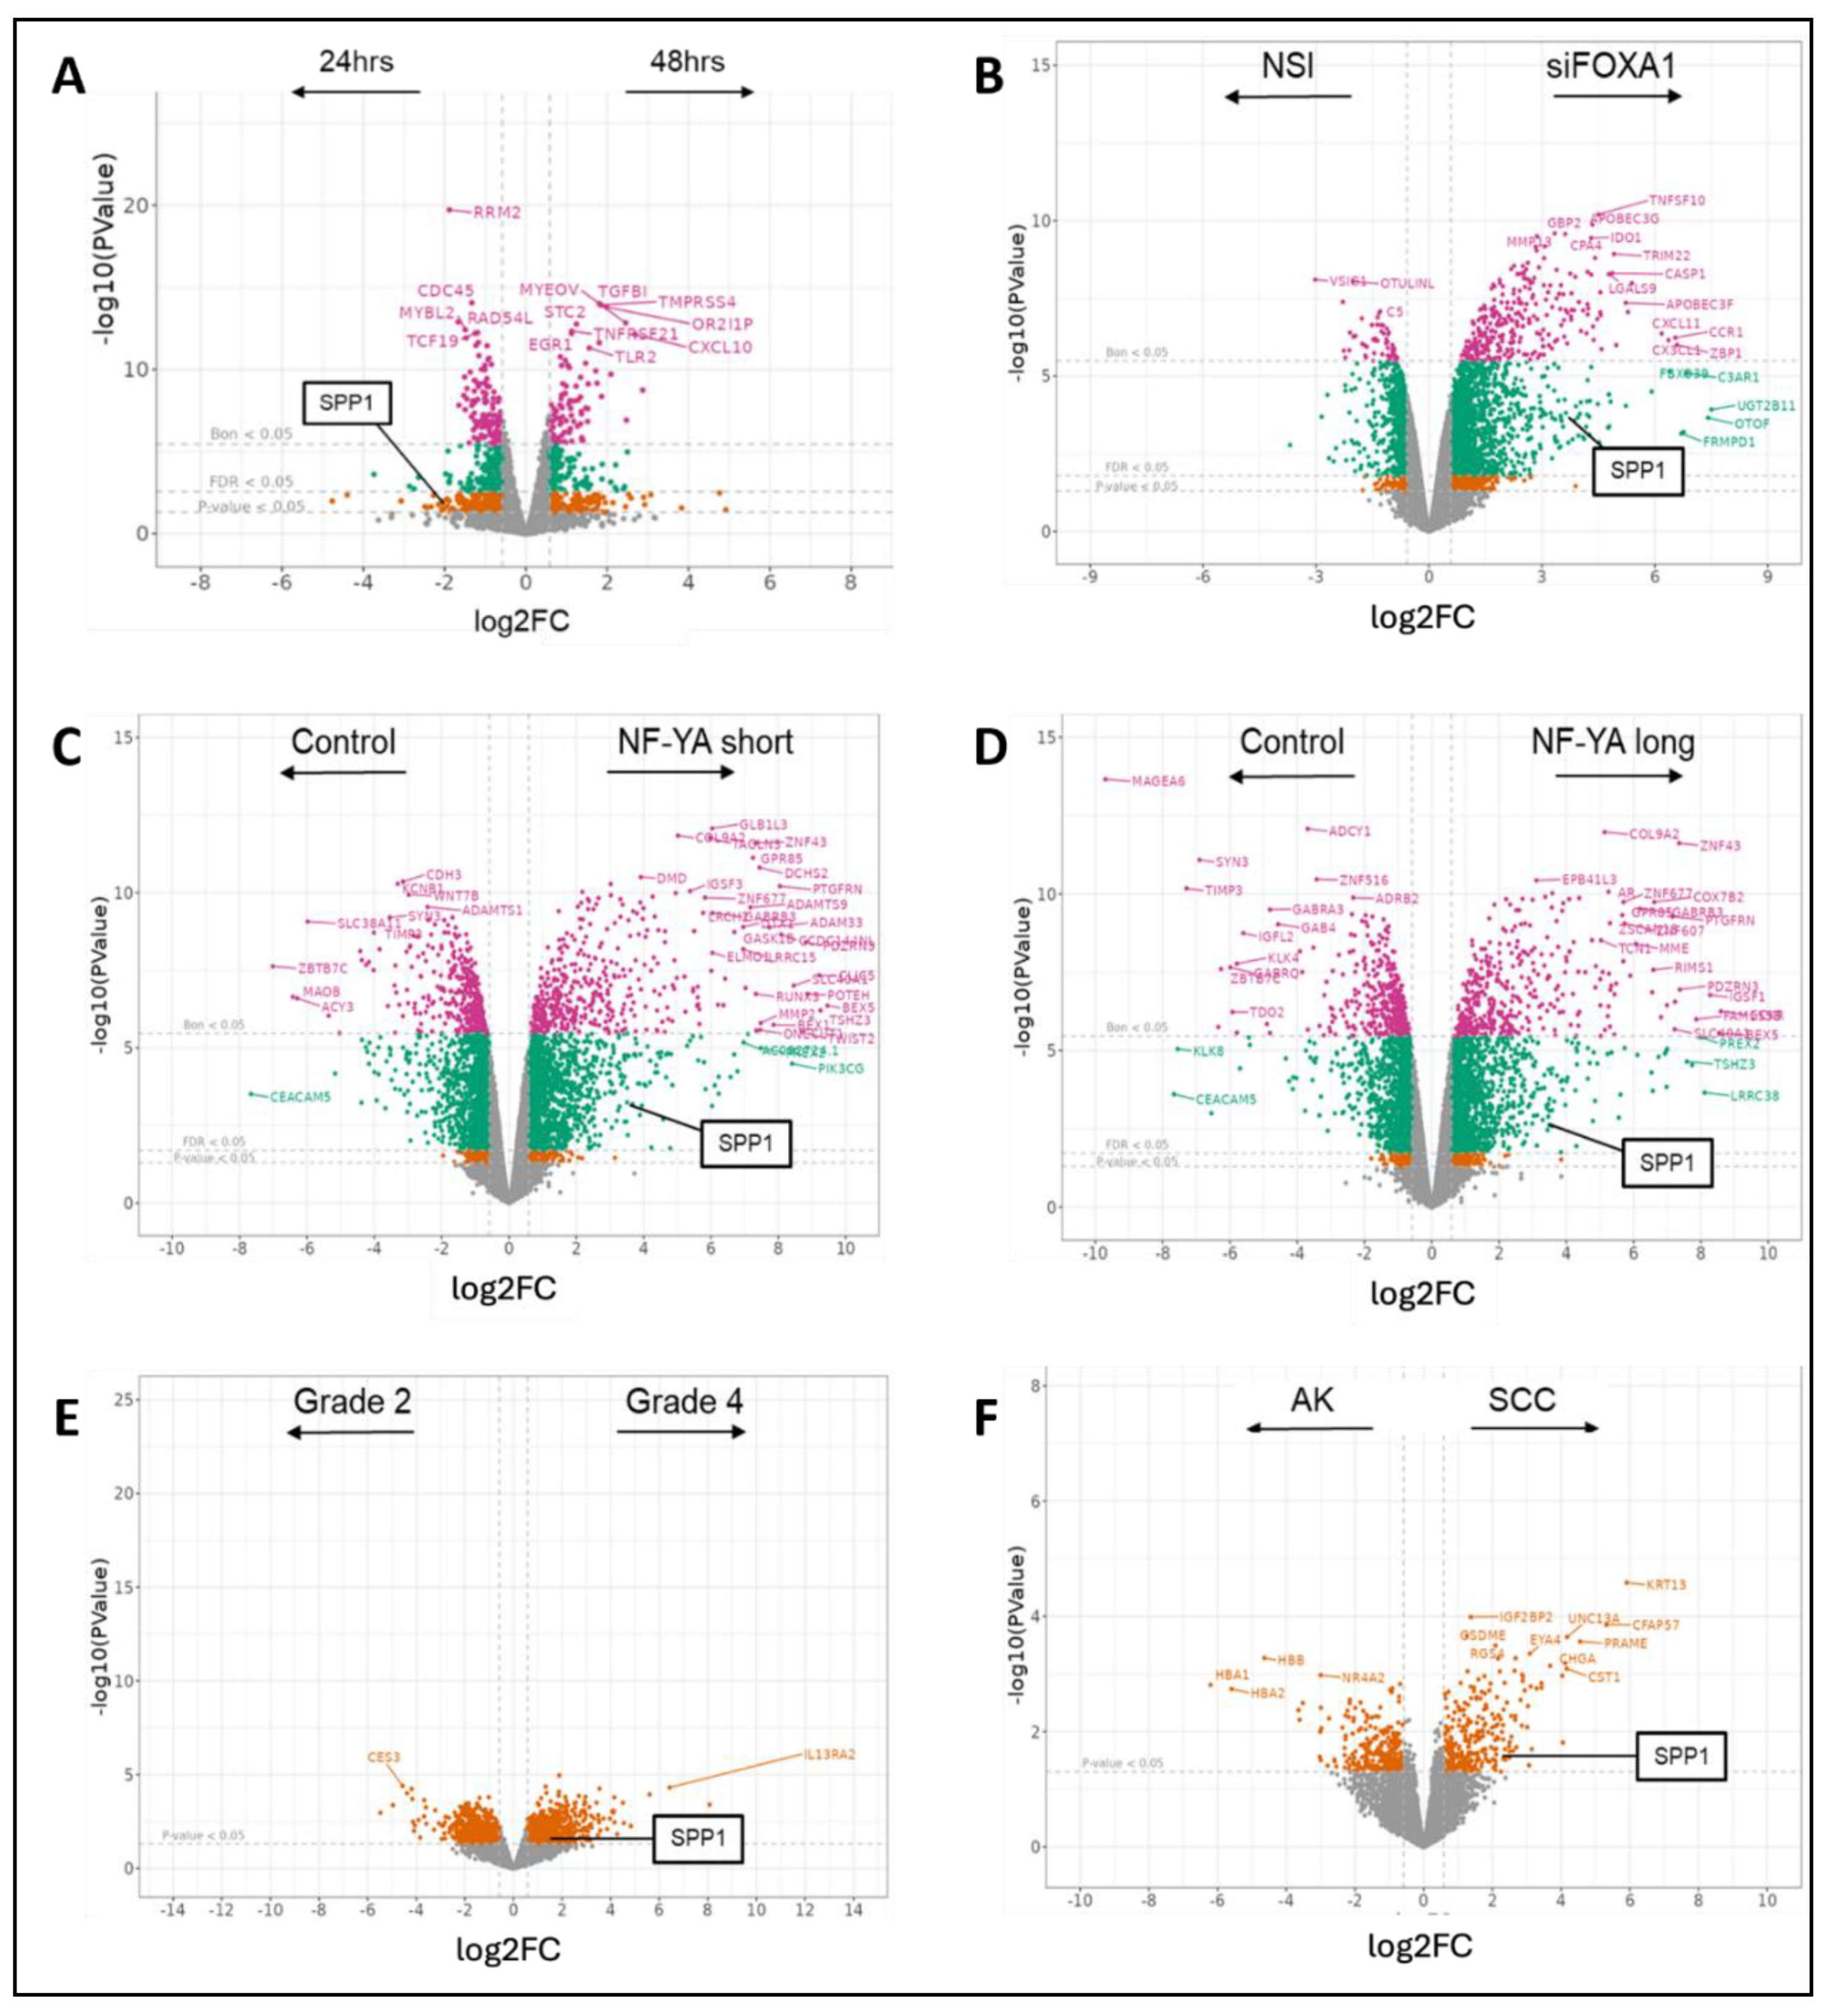
In the breast cancer study GSE213474 [30], MCF7 cells treated with IFN-γ stimulation showed SPP1 to be significantly downregulated in samples (log2FC = -2.067, p-value = 0.038), when the treatment was applied for a longer duration (48 hours v/s 24 hours) (Figure 2A). When analyzing PC-3 cell samples in the prostate cancer study GSE193127 [38] which were transfected with siRNAs targeting FOXA1, a known prostate oncogene, SPP1 was expressed significantly higher (log2FC = 4.005, p-value = 1.658e-04), as compared to control samples which were transfected with non-targeting siRNA (Figure 2B). Prostate PC-3 cells in the study GSE179990 [39] showing an overexpression for nuclear transcription factor NF-YA, in both its long and short alternatively spliced isoforms also displayed higher SPP1 levels; with the shorter isoform ‘NF-YAs’ or ‘NFYAv2’, of length 318bp, having greater significance (log2FC = 3.673, p-value = 6.501e-04) (Figure 2C), than the longer isoform ‘NF-YAl’ or ‘NFYAv1’, of length 347bp (log2FC = 3.578, p-value = 7.989e-04) (Figure 2D).
When comparing renal cell carcinoma (RCC) tissue samples from the dataset GSE151419 [42] with increasing Fuhrman grades, there was a significantly large difference observed in SPP1 expression between grade 4 and grade 2 cancer-affected samples (log2FC = 1.590, p-value = 0.046) (Figure 2E). Finally, it was showed an upregulation in a skin cancer dataset (GSE84293) [46], within samples affected by cutaneous squamous cell carcinoma (cuSCC) (log2FC = 2.603, p-value = 0.022), as compared to samples affected by actinic keratosis (AK) (Figure 2F), which is a benign condition characterized by skin lesions, and may act as a precursor to cancer.
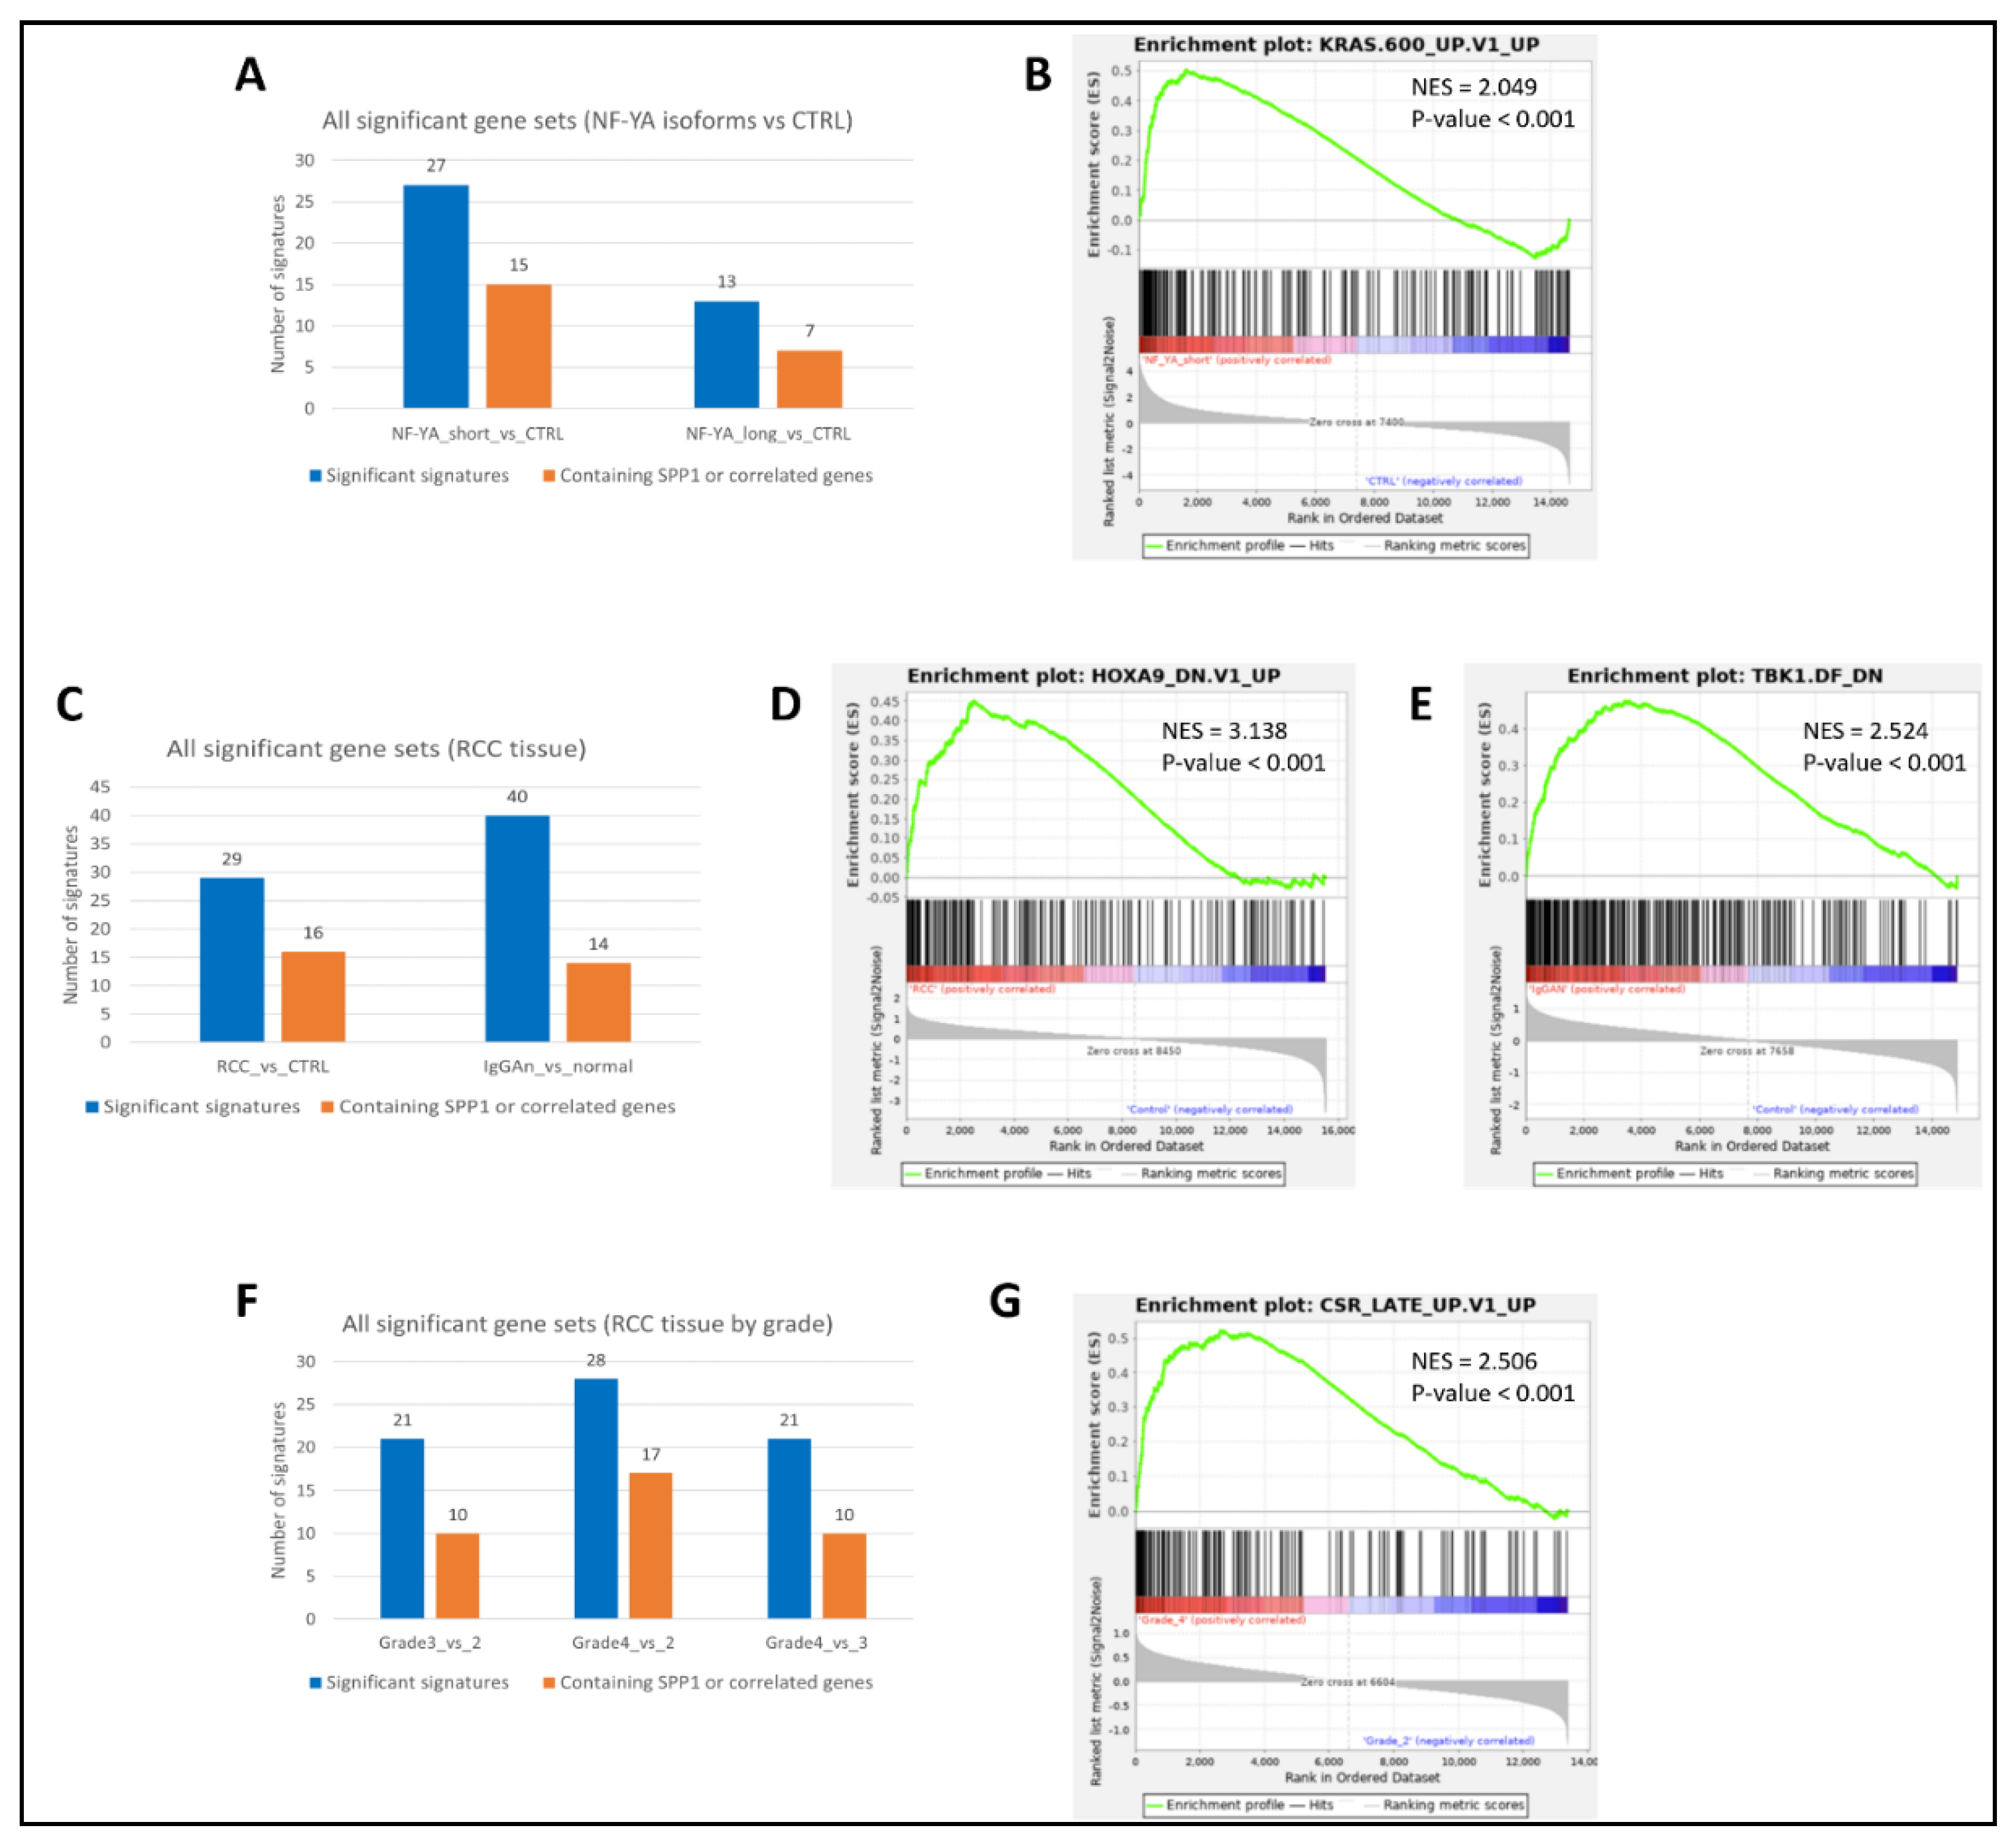
Our GSEA analyses confirmed patterns of significant enrichment for significant pathways (gene signatures) in samples showing high dysregulation in SPP1 and other oncogenes, concordantly as found in DEG analyses. PC-3 cells in the prostate cancer dataset GSE179990 [39] showed greater overall enrichment in samples expressing the shorter isoform (318 bp long) of NF-YA, than its longer isoform (347 bp long) (Figure 3A), with the top signature being ‘KRAS.600_UP.V1_UP’ (NES = 2.049, p-value < 0.001) (Figure 3B). In renal cancer, tumorous samples from RCC tissue in the dataset GSE167573 [40] enriched a larger number of signatures than controls (Figure 3C), with the highest being ‘HOXA9_DN.V1_UP’ (NES = 3.138, p-value < 0.001) (Figure 3D); while samples affected by IgA nephropathy in GSE141295 [41] also showed more enrichment than unaffected controls (Figure 3C), with the top signature being ‘TBK1.DF_DN’ (NES = 2.524, p-value < 0.001) (Figure 3E). In another renal cancer dataset, GSE151419 [42], samples showed a general surge in number of enriched signatures with higher tumor grades, from grade 2 to grade 4 (Figure 3F). The signature ‘CSR_LATE_UP.V1_UP’ was highly enriched at grade 4 (NES = 2.506, p-value < 0.001) (Figure 3G).
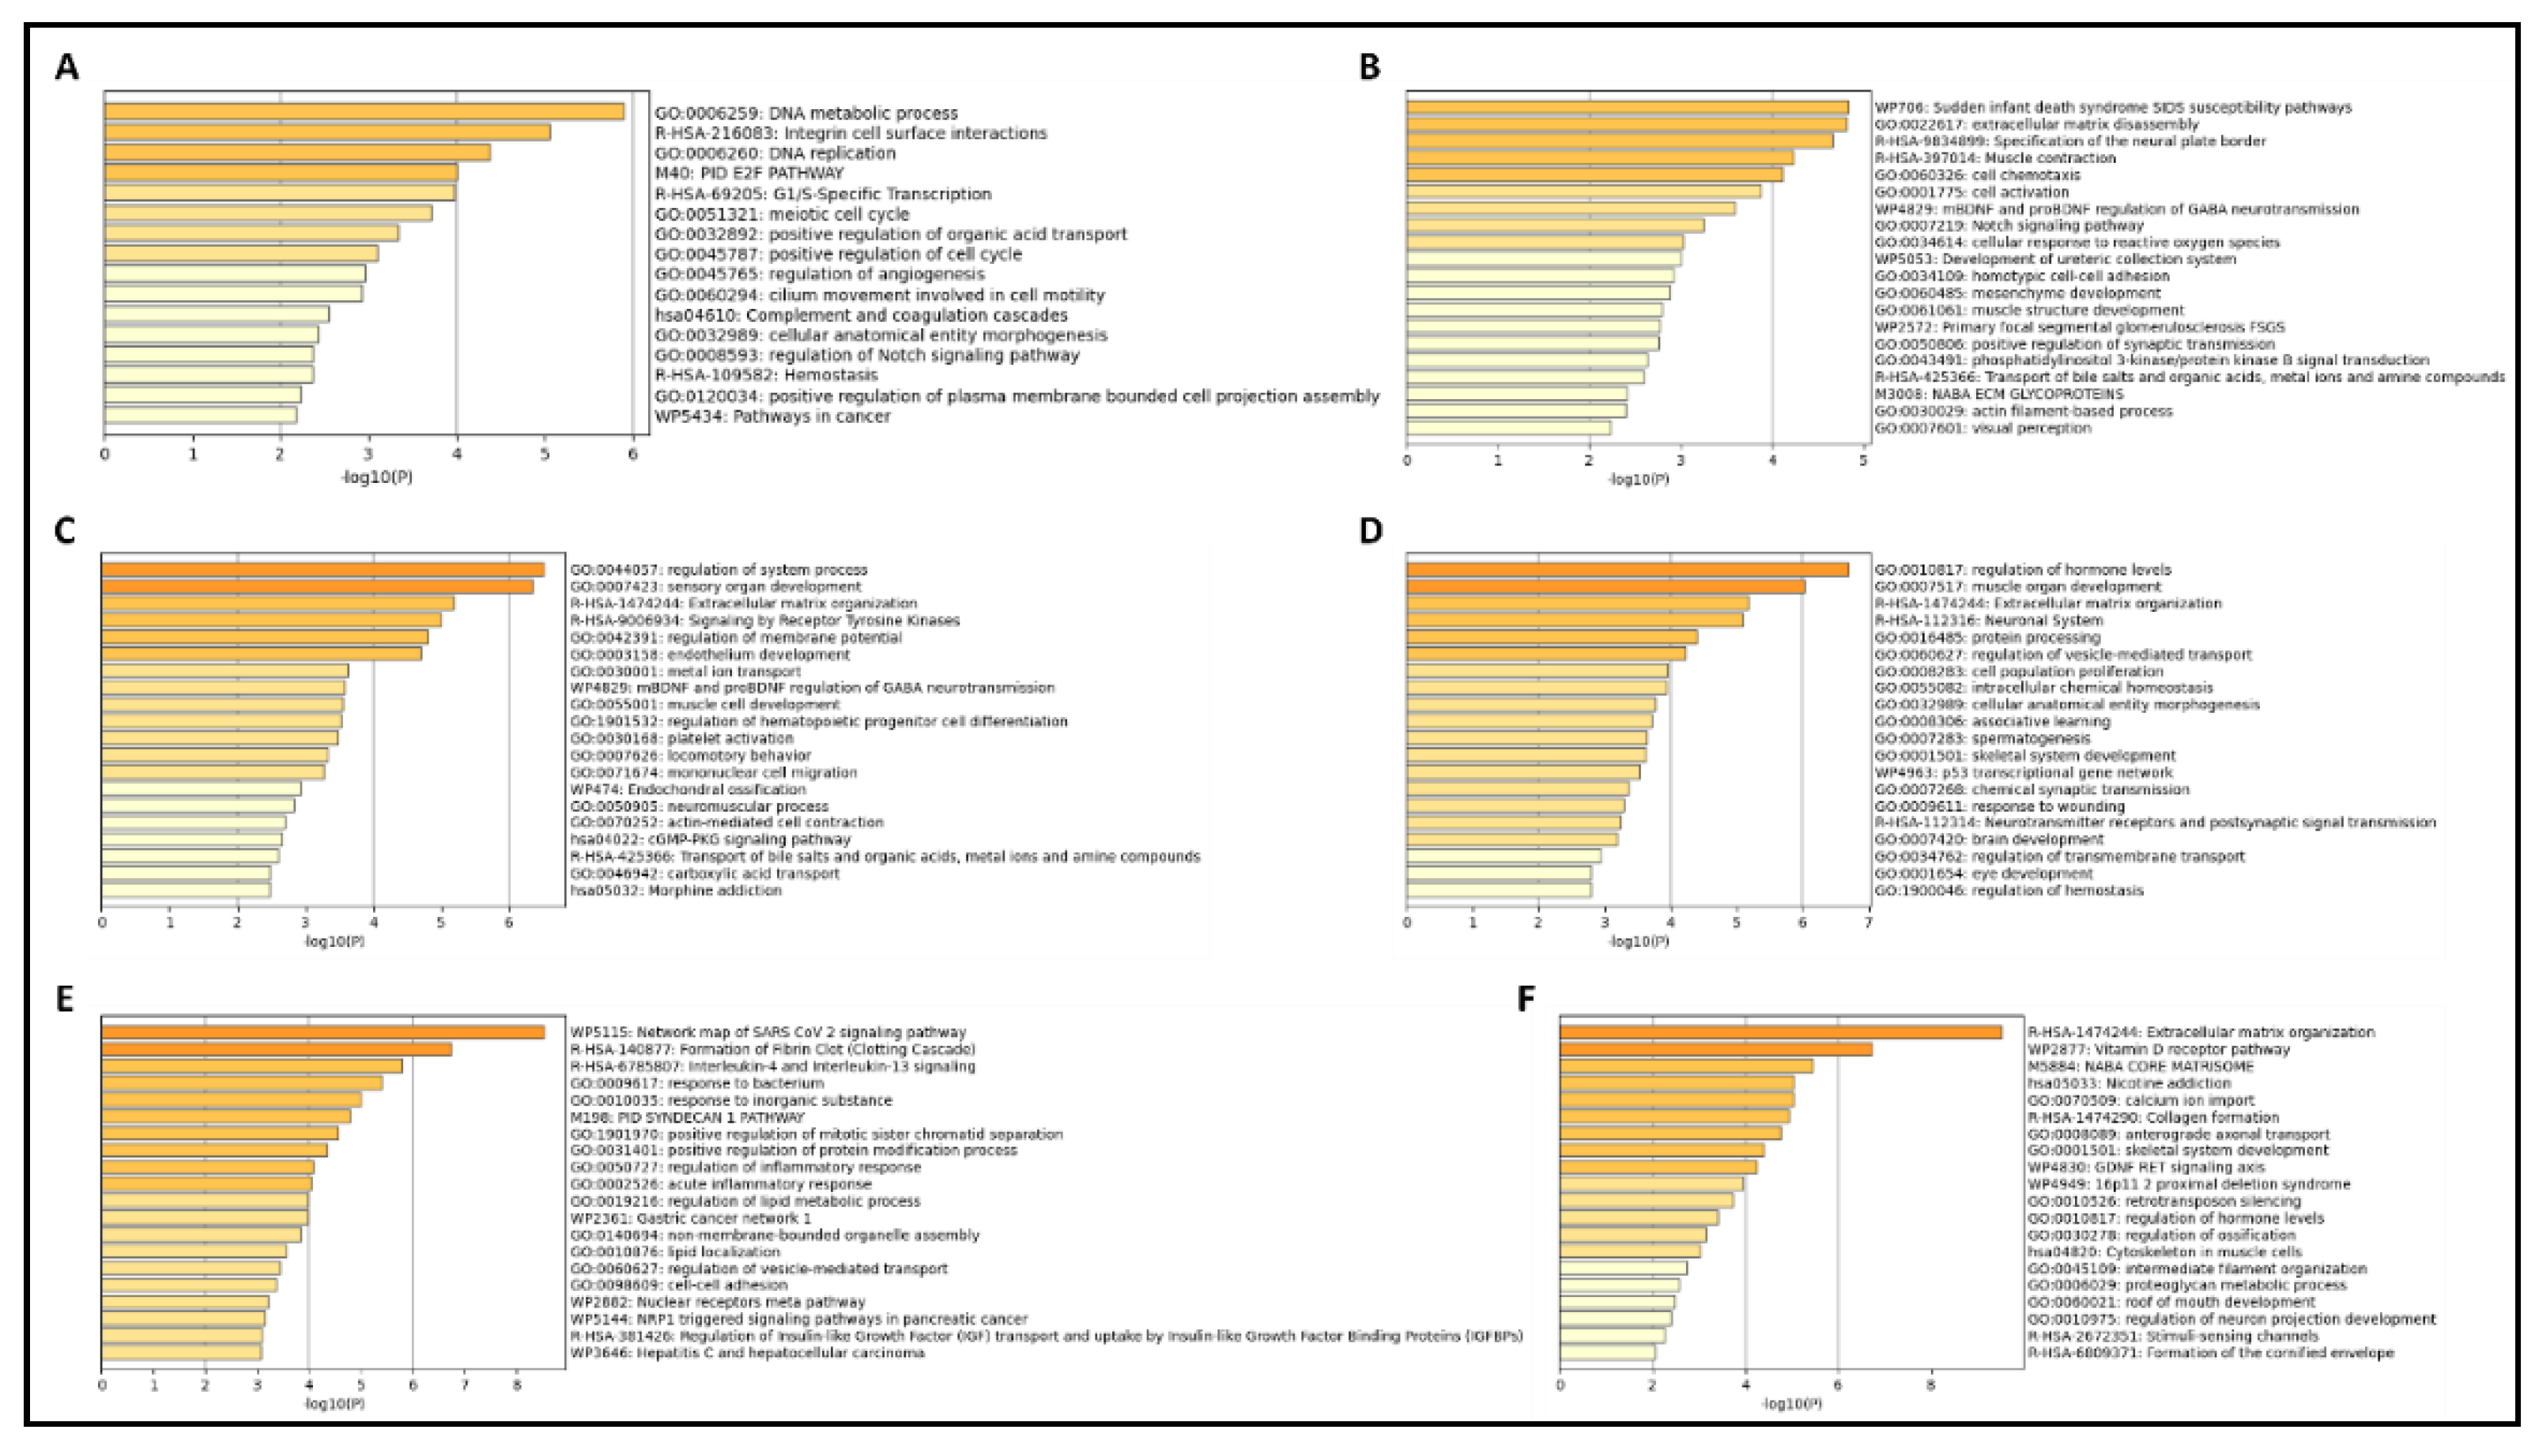
Metascape analyses using top significant DEGs expressed unidirectionally with SPP1, and its interacting partner genes also showed similar results in pathway involvement. In the breast cancer dataset GSE213474 [30], many pathways related to cell growth and division to be involved in genes that had shown a significant downregulation with the application of IFN-γ treatment (Figure 4A), including integrin cell surface interactions, a significant hallmark of SPP1 action. Prostate cancer samples in GSE179990 [39], with high expression for NFYA (both its long and short isoforms), showed similar pathways to be present within highly upregulated genes (Figure 4B and Figure 4C, respectively). In renal cancer, tumorous samples in GSE167573 [40] displayed a large number of cellular developmental pathways (Figure 4D), including extracellular matrix organization, another key feature of SPP1 functionality. Samples in GSE151419 [41] affected by renal tumors of higher grades also had similar effects, with several pathways within genes higher in Grade 4 RCC being related to regulation of cellular processes (Figure 4E). Finally, similar effects were seen in the skin cancer dataset GSE113113 [44,45], within genes expressed higher in SCC samples (Figure 4F) as compared to samples with actinic keratosis (AK).
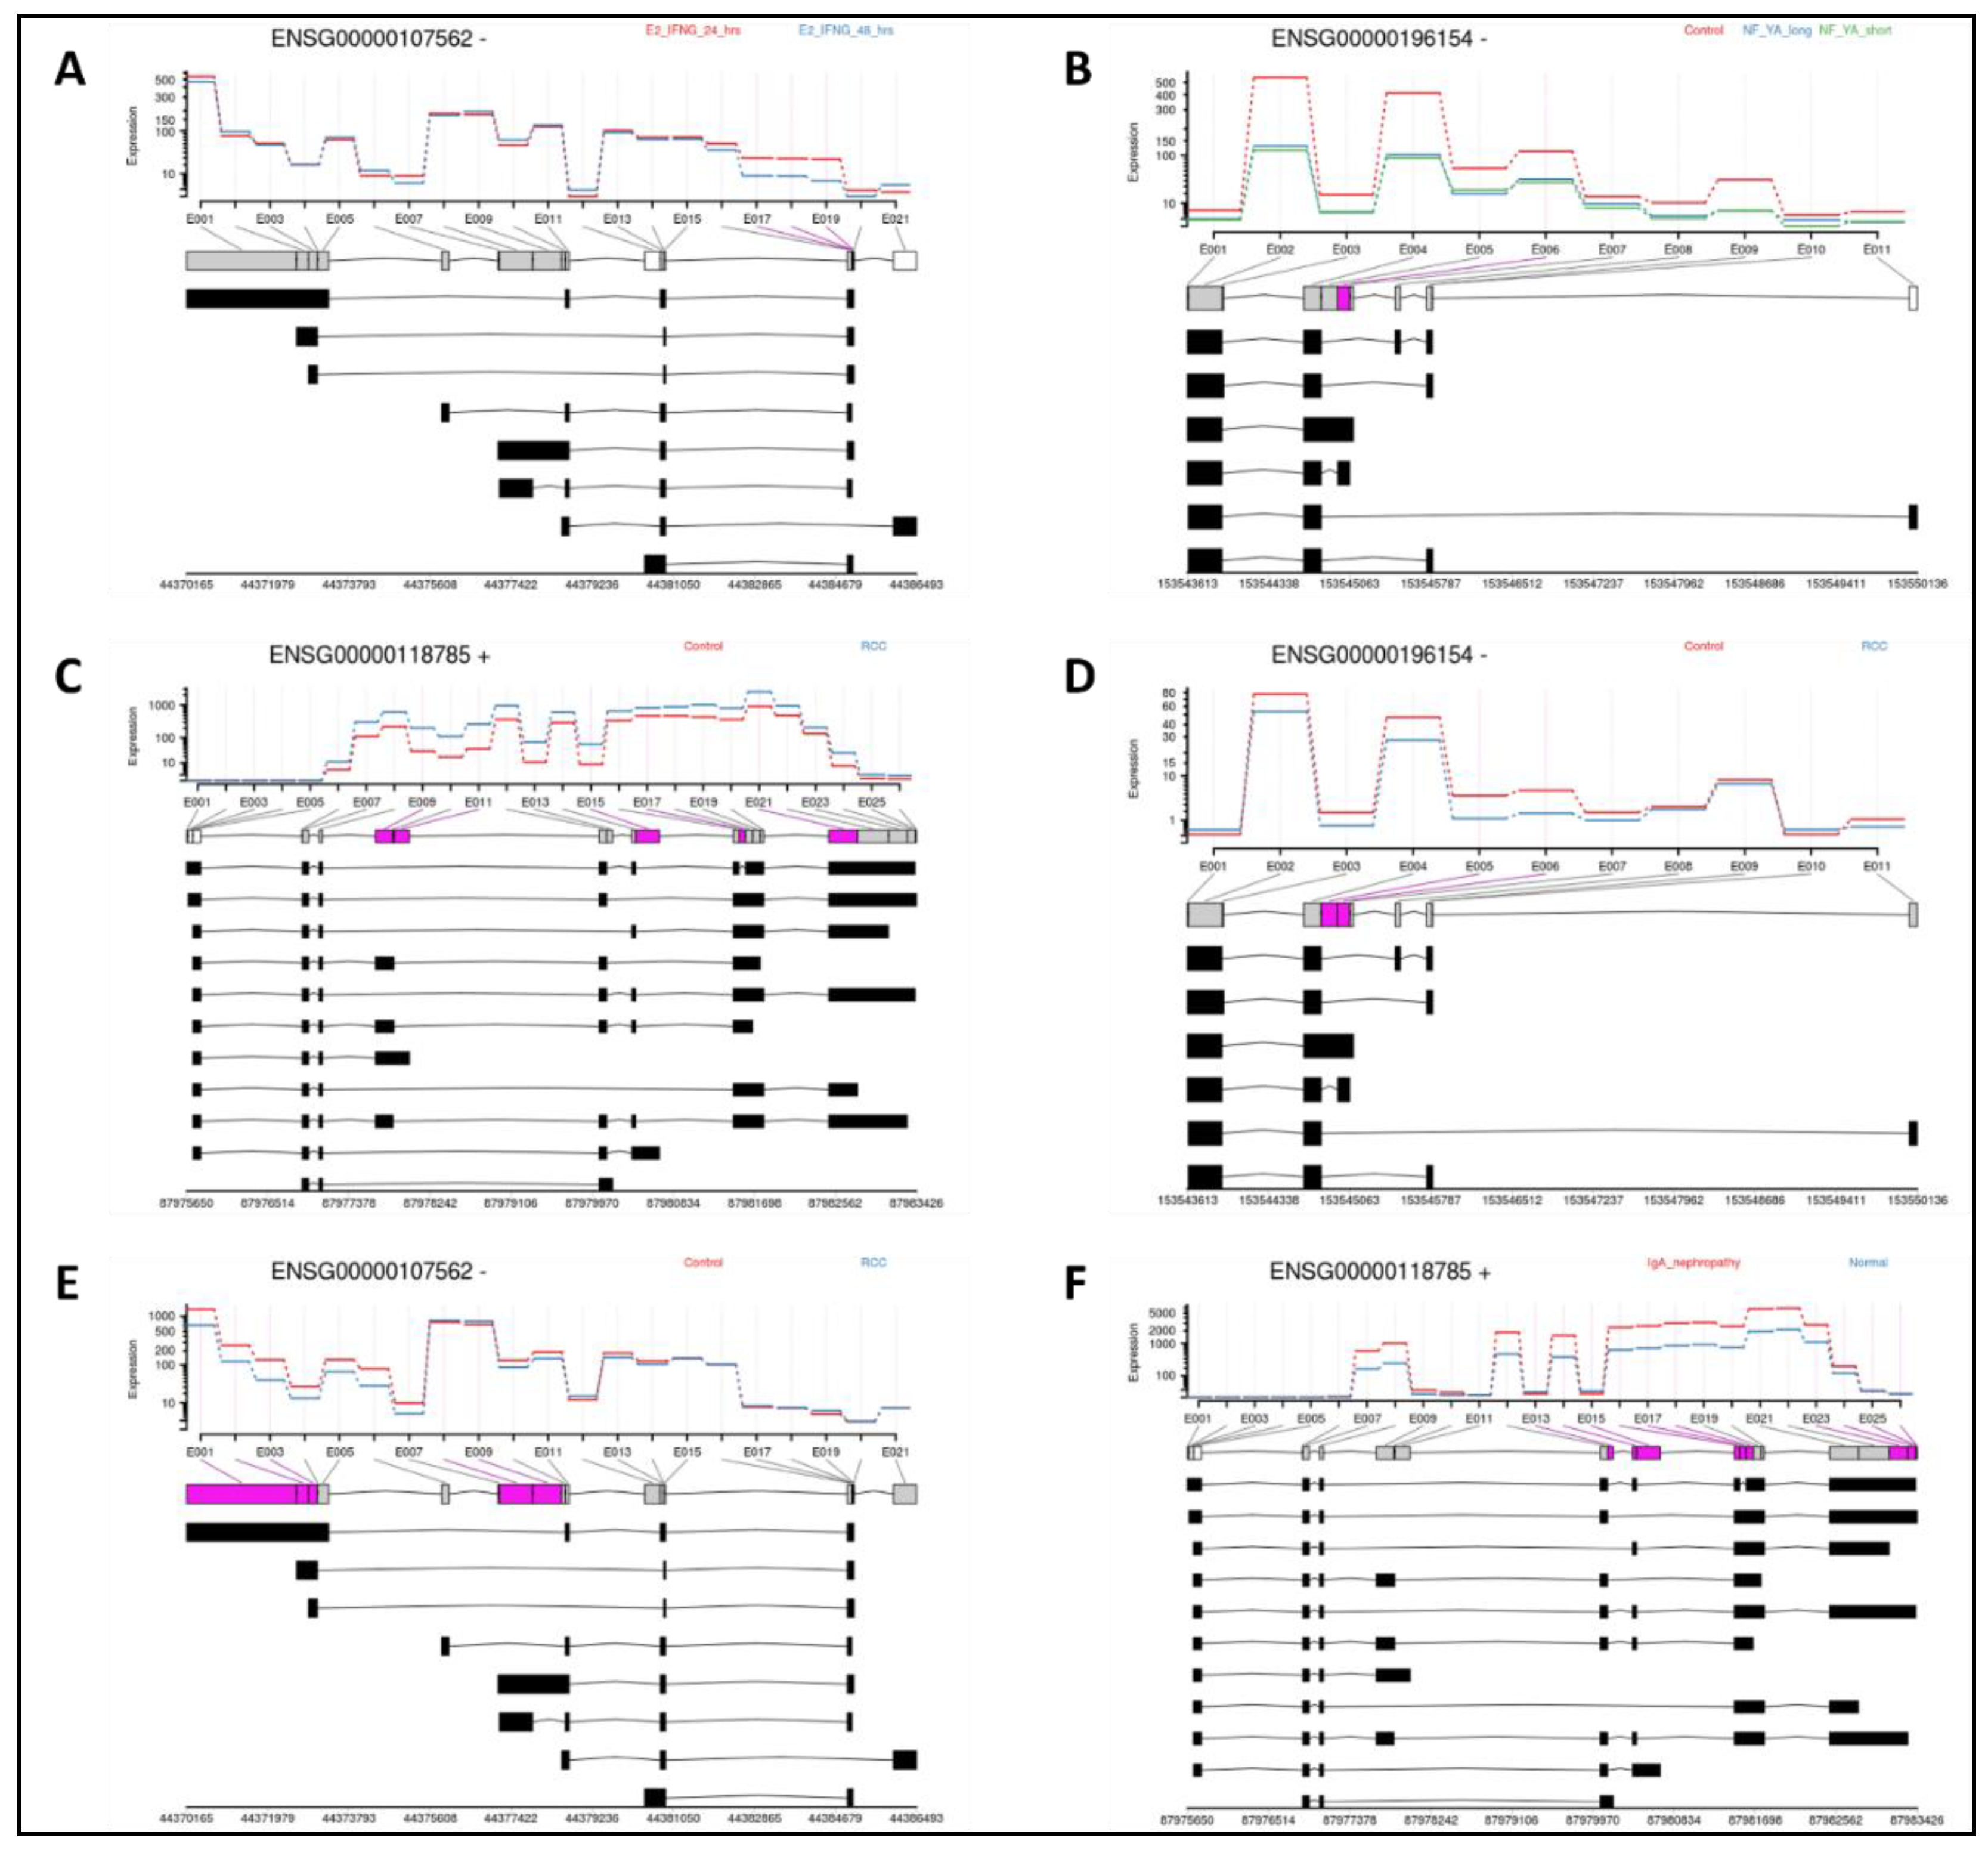
In differential exon usage (DEU) analyses, significant changes in selectivity were observed for SPP1 and many of its interacting partner genes, in conditions consistent with DEG and pathway analysis results. In the breast cancer study GSE213474 [30], the second set of MCF7 cell samples, which were supplemented with heat-inactivated FBS (HD) along with estradiol (E2), showed 3 exonic regions (E017, E018 and E019) of CXCL12 or ‘ENSG00000107562’, to differ significantly with longer time under treatment using IFN-γ stimulation (Figure 5A). In the prostate cancer dataset GSE179990 [39], PC-3 cells overexpressing NF-YA (both its short and long isoforms) showed 1 exon (E006) to be changed across transcripts of S100A4, or ‘ENSG00000196514’ (Figure 5B). Cells from renal cell carcinoma (RCC) tissue in the dataset GSE167573 [40] showed tumorous samples to have multiple exonic regions in several genes, among them SPP1 or ‘ENSG00000118785’ with 5 exons (Figure 5C), S100A4 with 2 exons (Figure 5D) and CXCL12 with 5 exons (Figure 5E). SPP1 was also observed to have 10 exons significantly different in IgA nephropathy-affected samples from RCC tissue in the dataset GSE141295 [41] (Figure 5F) compared to normal cortex samples.

4. Discussion

The activation of proto-oncogenes by external carcinogenic factors and their resultant conversion into tumor-causing oncogenes has been well-observed to be the root cause of the development and subsequent progression of cancer in various human tissues. It can be brought about by their overexpression in tumorous cells, as well as other effects such as the presence of mutations or genetic alterations, or fusions occurring with other genes. They also have the ability to influence normal cellular pathways and capture them, utilizing their activity to facilitate critical cellular functions which promote their selective initial growth and development in tumorous cells, provide themselves with a proliferative advantage, maintain a supportive tumor environment and ultimately favor tumor invasion and metastasis to other cells and tissues [48]. Here we sought to further investigate the multidimensional role of one of the most prominent oncogenes, SPP1, that encodes the protein Osteopontin in human tissues, including its functional mechanisms during cancer progression, its pathway enrichment landscape, as well as structural and other changes occurring in this gene and some of its highly co-expressed genes interacting with it that drive the same processes. Finally, we also wanted to determine these changes occurring in response to particular therapeutic modalities of cancer treatment.
Our transcriptomics analyses confirmed that SPP1 was significantly overexpressed not only in tumorous cells but also displayed changes with higher disease stage and tumor grades, in the case of renal and skin cancer. This effect was also observed in prostate cancer cells which overexpressed the oncogene NF-YA, thus indicating a synergistic co-expression with SPP1 during cancer progression; while transfection with FOXA1, another oncogene, showed it to be significantly upregulated as well. Application of treatment also produced a significant response in it, for example in breast cancer samples receiving IFN-γ stimulation, wherein samples on long-term treatment had a significant reduction of SPP1 expression. Treatment in prostate and skin cancer samples using modalities such as enzymatic inhibition and oncogenic suppression was also able to reduce SPP1 activation. In results from GSEA analyses, pathways involving SPP1, and its interacting partner oncogenes were seen to comprise the majority of all pathways showing activation with cancer progression or repression with therapeutic intervention. The existence of external conditions conducive to tumorigenesis, such as the occurrence of IgA nephropathy in renal tissue, was able to confirm the simultaneous involvement of other oncogenes such as KRAS contributing towards the upregulation of several other host genes, indicated by common pathways. Higher disease stages also influenced the activation of pathways implicated in reduced serum response in renal and skin cancer, which potentially indicated a weakening of the immune system in cases of late-stage cancer, wherein tumor cells have already undergone metastasis. Additional findings using Metascape supported these results as well, with genes upregulated in tumorigenic conditions and/or downregulated in response to treatment mostly being related to normal cell cycle, growth and functionality, also confirming results from previous studies which showed SPP1 to play a role in the enrichment of cellular development and signaling pathways [7]. On the other hand, the application of treatment modalities was able to induce a number of immune response pathways, implying a restoration of the natural immune system, thereby validating immunotherapy to be a promising method of cancer treatment.
Lastly, analyses of differential isoform expression in oncogenes showed changes in exon selectivity within their constituent ‘transcripts’ or spliced isoforms, to occur concurrently with their patterns of dysregulation and functional enrichment; as well as indicated them as significant drivers of these effects. Variations in exonic region usage between transcripts of several oncogenes were seen to correspond well with changes in their actual expression levels. Since even minor changes in exonic expression have been observed to correlate with considerable differences in overall gene expression and resultant functionality, it also highlights the potential use of therapeutic methods such as exon and gene therapy, to target these effects and induce selective splicing within specific oncogenes and editing their transcriptional ability in cells.
In summary, the results of our analyses confirmed the multifaceted role of SPP1 in several aspects of cancer progression, thus establishing it as one of the most potent oncogenes, while also opening new avenues for its diagnostic utilization as a biomarker and in the development of novel therapeutic modalities.

Author Contributions

Conceptualization, GK and SE; methodology, GK; validation, GK and SE; analysis, GK and SE; writing-original draft preparation, GK; writing-review and editing, GK and SE; supervision, SE; project administration, SE; All authors have read and agreed to the published version of the manuscript.

Funding

This research received no external funding

Institutional Review Board Statement

Not applicable.

Informed Consent Statement

Not applicable.

Data Availability Statement

The data generated in this study are available from the corresponding author upon reasonable request.

Acknowledgments

Not applicable.

Conflicts of Interest

The authors declare no conflicts of interest.

References

  1. Cooper GM. The Cell: A Molecular Approach. 2nd edition. Sunderland (MA): Sinauer Associates; 2000. The Development and Causes of Cancer.
  2. Vicente-Dueñas, C., Romero-Camarero, I., Cobaleda, C., & Sánchez-García, I. (2013). Function of oncogenes in cancer development: a changing paradigm. The EMBO journal, 32(11), 1502–1513. [CrossRef]
  3. Zhao, H., Chen, Q., Alam, A., Cui, J., Suen, K. C., Soo, A. P., Eguchi, S., Gu, J., & Ma, D. (2018). The role of osteopontin in the progression of solid organ tumour. Cell death & disease, 9(3), 356. [CrossRef]
  4. Wei, R., Wong, J. P. C., & Kwok, H. F. (2017). Osteopontin -- a promising biomarker for cancer therapy. Journal of Cancer, 8(12), 2173–2183. [CrossRef]
  5. Rangaswami, H., Bulbule, A. & Kundu, G. C. Osteopontin: role in cell signaling and cancer progression. Trends Cell. Biol. 16, 79–87 (2006). [CrossRef]
  6. Tan, Y., Zhao, L., Yang, Y. G., & Liu, W. (2022). The Role of Osteopontin in Tumor Progression Through Tumor-Associated Macrophages. Frontiers in oncology, 12, 953283. [CrossRef]
  7. Butti, R., Nimma, R., Kundu, G., Bulbule, A., Kumar, T. V. S., Gunasekaran, V. P., Tomar, D., Kumar, D., Mane, A., Gill, S. S., Patil, T., Weber, G. F., & Kundu, G. C. (2021). Tumor-derived osteopontin drives the resident fibroblast to myofibroblast differentiation through Twist1 to promote breast cancer progression. Oncogene, 40(11), 2002–2017. [CrossRef]
  8. Wang, C., Ying, J., Nie, X. et al. Targeting angiogenesis for fracture nonunion treatment in inflammatory disease. Bone Res 9, 29 (2021). [CrossRef]
  9. Wein, M., Huelter-Hassler, D., Nelson, K. et al. Differential osteopontin expression in human osteoblasts derived from iliac crest and alveolar bone and its role in early stages of angiogenesis. J Bone Miner Metab 37, 105–117 (2019). [CrossRef]
  10. Wei, T., Bi, G., Bian, Y., Ruan, S., Yuan, G., Xie, H., Zhao, M., Shen, R., Zhu, Y., Wang, Q., Yang, Y., & Zhu, D. (2020). The Significance of Secreted Phosphoprotein 1 in Multiple Human Cancers. Frontiers in molecular biosciences, 7, 565383. [CrossRef]
  11. Shurin M. R. (2018). Osteopontin controls immunosuppression in the tumor microenvironment. The Journal of clinical investigation, 128(12), 5209–5212. [CrossRef]
  12. Hao, C., Lane, J., & Jiang, W. G. (2023). Osteopontin and Cancer: Insights into Its Role in Drug Resistance. Biomedicines, 11(1), 197. [CrossRef]
  13. Zeng, P., Zhang, X., Xiang, T., Ling, Z., Lin, C., & Diao, H. (2022). Secreted phosphoprotein 1 as a potential prognostic and immunotherapy biomarker in multiple human cancers. Bioengineered, 13(2), 3221–3239. [CrossRef]
  14. Weber, G. F., Lett, G. S., & Haubein, N. C. (2010). Osteopontin is a marker for cancer aggressiveness and patient survival. British journal of cancer, 103(6), 861–869. [CrossRef]
  15. Sanchez-Vega, F., Mina, M., Armenia, J., Chatila, W. K., Luna, A., La, K. C., Dimitriadoy, S., Liu, D. L., Kantheti, H. S., Saghafinia, S., Chakravarty, D., Daian, F., Gao, Q., Bailey, M. H., Liang, W. W., Foltz, S. M., Shmulevich, I., Ding, L., Heins, Z., Ochoa, A., … Schultz, N. (2018). Oncogenic Signaling Pathways in The Cancer Genome Atlas. Cell, 173(2), 321–337.e10. [CrossRef]
  16. Ergun A, Doran G, Costello JC, Paik HH, Collins JJ, Mathis D, Benoist C & ImmGen Consortium (2013). Differential splicing across immune system lineages. PNAS, 110(35), 14324-14329. https://doi/10.1073/pnas.1311839110.
  17. Zhang, Y., Qian, J., Gu, C., & Yang, Y. (2021). Alternative splicing and cancer: a systematic review. Signal transduction and targeted therapy, 6(1), 78. [CrossRef]
  18. Gimba ERP, Brum MCM, Nestal De Moraes G. (2019). Full-length osteopontin and its splice variants as modulators of chemoresistance and radioresistance (Review). Int J Oncol. 54(2):420-430. [CrossRef]
  19. Do, H. T. T., Shanak, S., Barghash, A., & Helms, V. (2023). Differential exon usage of developmental genes is associated with deregulated epigenetic marks. Scientific reports, 13(1), 12256. [CrossRef]
  20. SRA Toolkit Development Team. https://trace.ncbi.nlm.nih.gov/Traces/sra/sra.cgi?view=software.
  21. Bolger, A. M., Lohse, M., & Usadel, B. (2014). Trimmomatic: a flexible trimmer for Illumina sequence data. Bioinformatics (Oxford, England), 30(15), 2114–2120. [CrossRef]
  22. Andrews, S. (2010). FastQC: A Quality Control Tool for High Throughput Sequence Data [Online]. http://www.bioinformatics.babraham.ac.uk/projects/fastqc/.
  23. Kim, D., Paggi, J. M., Park, C., Bennett, C., & Salzberg, S. L. (2019). Graph-based genome alignment and genotyping with HISAT2 and HISAT-genotype. Nature biotechnology, 37(8), 907–915. [CrossRef]
  24. Liao, Y., Smyth, G. K., & Shi, W. (2014). featureCounts: an efficient general purpose program for assigning sequence reads to genomic features. Bioinformatics (Oxford, England), 30(7), 923–930. [CrossRef]
  25. Robinson, M. D., McCarthy, D. J., & Smyth, G. K. (2010). edgeR: a Bioconductor package for differential expression analysis of digital gene expression data. Bioinformatics (Oxford, England), 26(1), 139–140. [CrossRef]
  26. Subramanian, A., Tamayo, P., Mootha, V. K., Mukherjee, S., Ebert, B. L., Gillette, M. A., Paulovich, A., Pomeroy, S. L., Golub, T. R., Lander, E. S., & Mesirov, J. P. (2005). Gene set enrichment analysis: a knowledge-based approach for interpreting genome-wide expression profiles. Proceedings of the National Academy of Sciences of the United States of America, 102(43), 15545–15550. [CrossRef]
  27. Liberzon, A., Birger, C., Thorvaldsdóttir, H., Ghandi, M., Mesirov, J. P., & Tamayo, P. (2015). The Molecular Signatures Database (MSigDB) hallmark gene set collection. Cell systems, 1(6), 417–425. [CrossRef]
  28. Zhou, Y., Zhou, B., Pache, L., Chang, M., Khodabakhshi, A. H., Tanaseichuk, O., Benner, C., & Chanda, S. K. (2019). Metascape provides a biologist-oriented resource for the analysis of systems-level datasets. Nature communications, 10(1), 1523. [CrossRef]
  29. Anders, S., Reyes, A., & Huber, W. (2012). Detecting differential usage of exons from RNA-seq data. Genome research, 22(10), 2008–2017. [CrossRef]
  30. Hermida-Prado, F., Xie, Y., Sherman, S., Nagy, Z., Russo, D., Akhshi, T., Chu, Z., Feit, A., Campisi, M., Chen, M., Nardone, A., Guarducci, C., Lim, K., Font-Tello, A., Lee, I., García-Pedrero, J., Cañadas, I., Agudo, J., Huang, Y., Sella, T., … Jeselsohn, R. (2023). Endocrine Therapy Synergizes with SMAC Mimetics to Potentiate Antigen Presentation and Tumor Regression in Hormone Receptor-Positive Breast Cancer. Cancer research, 83(19), 3284–3304. [CrossRef]
  31. Hölzen, L., Mitschke, J., Schönichen, C., Hess, M. E., Ehrenfeld, S., Boerries, M., Miething, C., Brummer, T., & Reinheckel, T. (2022). RNA interference screens discover proteases as synthetic lethal partners of PI3K inhibition in breast cancer cells. Theragnostics, 12(9), 4348–4373. [CrossRef]
  32. Saotome, M., Poduval, D. B., Nair, R., Cooper, M., & Takaku, M. (2022). GATA3 Truncation Mutants Alter EMT Related Gene Expression via Partial Motif Recognition in Luminal Breast Cancer Cells. Frontiers in genetics, 13, 820532. [CrossRef]
  33. Qiu, Z., Guo, W., Dong, B., Wang, Y., Deng, P., Wang, C., Liu, J., Zhang, Q., Grosschedl, R., Yu, Z., Deng, J., & Wu, Y. (2022). EBF1 promotes triple-negative breast cancer progression by surveillance of the HIF1α pathway. Proceedings of the National Academy of Sciences of the United States of America, 119(28), e2119518119. [CrossRef]
  34. Ma, S., Tang, T., Probst, G., Konradi, A., Jin, C., Li, F., Gutkind, J. S., Fu, X. D., & Guan, K. L. (2022). Transcriptional repression of estrogen receptor alpha by YAP reveals the Hippo pathway as therapeutic target for ER+ breast cancer. Nature communications, 13(1), 1061. [CrossRef]
  35. Han, H., Wang, Y., Curto, J., Gurrapu, S., Laudato, S., Rumandla, A., Chakraborty, G., Wang, X., Chen, H., Jiang, Y., Kumar, D., Caggiano, E. G., Capogiri, M., Zhang, B., Ji, Y., Maity, S. N., Hu, M., Bai, S., Aparicio, A. M., Efstathiou, E., … Giancotti, F. G. (2022). Mesenchymal and stem-like prostate cancer linked to therapy-induced lineage plasticity and metastasis. Cell reports, 39(1), 110595. [CrossRef]
  36. Basil, P., Robertson, M. J., Bingman, W. E., 3rd, Dash, A. K., Krause, W. C., Shafi, A. A., Piyarathna, B., Coarfa, C., & Weigel, N. L. (2022). Cistrome and transcriptome analysis identifies unique androgen receptor (AR) and AR-V7 splice variant chromatin binding and transcriptional activities. Scientific reports, 12(1), 5351. [CrossRef]
  37. Kumar, A., Kasikci, Y., Badredine, A., Azzag, K., Quintyn Ranty, M. L., Zaidi, F., Aragou, N., Mazerolles, C., Malavaud, B., Mendoza-Parra, M. A., Vandel, L., & Gronemeyer, H. (2021). Patient-matched analysis identifies deregulated networks in prostate cancer to guide personalized therapeutic intervention. American journal of cancer research, 11(11), 5299–5318.
  38. Del Giudice, M., Foster, J. G., Peirone, S., Rissone, A., Caizzi, L., Gaudino, F., Parlato, C., Anselmi, F., Arkell, R., Guarrera, S., Oliviero, S., Basso, G., Rajan, P., & Cereda, M. (2022). FOXA1 regulates alternative splicing in prostate cancer. Cell reports, 40(13), 111404. [CrossRef]
  39. Belluti, S., Semeghini, V., Rigillo, G., Ronzio, M., Benati, D., Torricelli, F., Reggiani Bonetti, L., Carnevale, G., Grisendi, G., Ciarrocchi, A., Dominici, M., Recchia, A., Dolfini, D., & Imbriano, C. (2021). Alternative splicing of NF-YA promotes prostate cancer aggressiveness and represents a new molecular marker for clinical stratification of patients. Journal of experimental & clinical cancer research: CR, 40(1), 362. [CrossRef]
  40. Sun, G., Chen, J., Liang, J., Yin, X., Zhang, M., Yao, J., He, N., Armstrong, C. M., Zheng, L., Zhang, X., Zhu, S., Sun, X., Yang, X., Zhao, W., Liao, B., Pan, X., Nie, L., Yang, L., Chen, Y., Zhao, J., … Zeng, H. (2021). Integrated exome and RNA sequencing of TFE3-translocation renal cell carcinoma. Nature communications, 12(1), 5262. Sun, G., Chen, J., Liang, J. et al. Integrated exome and RNA sequencing of TFE3-translocation renal cell carcinoma. Nat Commun 12, 5262 (2021). [CrossRef]
  41. Park, S., Yang, S. H., Jeong, C. W., Moon, K. C., Kim, D. K., Joo, K. W., Kim, Y. S., Lee, J. W., & Lee, H. (2020). RNA-Seq profiling of microdissected glomeruli identifies potential biomarkers for human IgA nephropathy. American journal of physiology. Renal physiology, 319(5), F809–F821. [CrossRef]
  42. Kajdasz, A., Majer, W., Kluzek, K., Sobkowiak, J., Milecki, T., Derebecka, N., Kwias, Z., Bluyssen, H. A. R., & Wesoly, J. (2021). Identification of RCC Subtype-Specific microRNAs-Meta-Analysis of High-Throughput RCC Tumor microRNA Expression Data. Cancers, 13(3), 548. [CrossRef]
  43. Yao, X., Hong, J. H., Nargund, A. M., Ng, M. S. W., Heng, H. L., Li, Z., Guan, P., Sugiura, M., Chu, P. L., Wang, L. C., Ye, X., Qu, J., Kwek, X. Y., Lim, J. C. T., Ooi, W. F., Koh, J., Wang, Z., Pan, Y. F., Ong, Y. S., Tan, K. Y., … Teh, B. T. (2023). PBRM1-deficient PBAF complexes target aberrant genomic loci to activate the NF-κB pathway in clear cell renal cell carcinoma. Nature cell biology, 25(5), 765–777. [CrossRef]
  44. Querfeld, C., Leung, S., Myskowski, P. L., Curran, S. A., Goldman, D. A., Heller, G., Wu, X., Kil, S. H., Sharma, S., Finn, K. J., Horwitz, S., Moskowitz, A., Mehrara, B., Rosen, S. T., Halpern, A. C., & Young, J. W. (2018). Primary T Cells from Cutaneous T-cell Lymphoma Skin Explants Display an Exhausted Immune Checkpoint Profile. Cancer immunology research, 6(8), 900–909. [CrossRef]
  45. Di Raimondo, C., Han, Z., Su, C., Wu, X., Qin, H., Sanchez, J. F., Yuan, Y. C., Martinez, X., Abdulla, F., Zain, J., Chen, C. W., Rosen, S. T., & Querfeld, C. (2021). Identification of a Distinct miRNA Regulatory Network in the Tumor Microenvironment of Transformed Mycosis Fungoides. Cancers, 13(22), 5854. [CrossRef]
  46. Park, D. E., Cheng, J., McGrath, J. P., Lim, M. Y., Cushman, C., Swanson, S. K., Tillgren, M. L., Paulo, J. A., Gokhale, P. C., Florens, L., Washburn, M. P., Trojer, P., & DeCaprio, J. A. (2020). Merkel cell polyomavirus activates LSD1-mediated blockade of non-canonical BAF to regulate transformation and tumorigenesis. Nature cell biology, 22(5), 603–615. [CrossRef]
  47. Chitsazzadeh, V., Coarfa, C., Drummond, J. A., Nguyen, T., Joseph, A., Chilukuri, S., Charpiot, E., Adelmann, C. H., Ching, G., Nguyen, T. N., Nicholas, C., Thomas, V. D., Migden, M., MacFarlane, D., Thompson, E., Shen, J., Takata, Y., McNiece, K., Polansky, M. A., Abbas, H. A., … Tsai, K. Y. (2016). Cross-species identification of genomic drivers of squamous cell carcinoma development across preneoplastic intermediates. Nature communications, 7, 12601. [CrossRef]
  48. Fu, D., Hu, Z., Xu, X., Dai, X., & Liu, Z. (2022). Key signal transduction pathways and crosstalk in cancer: Biological and therapeutic opportunities. Translational oncology, 26, 101510. [CrossRef]
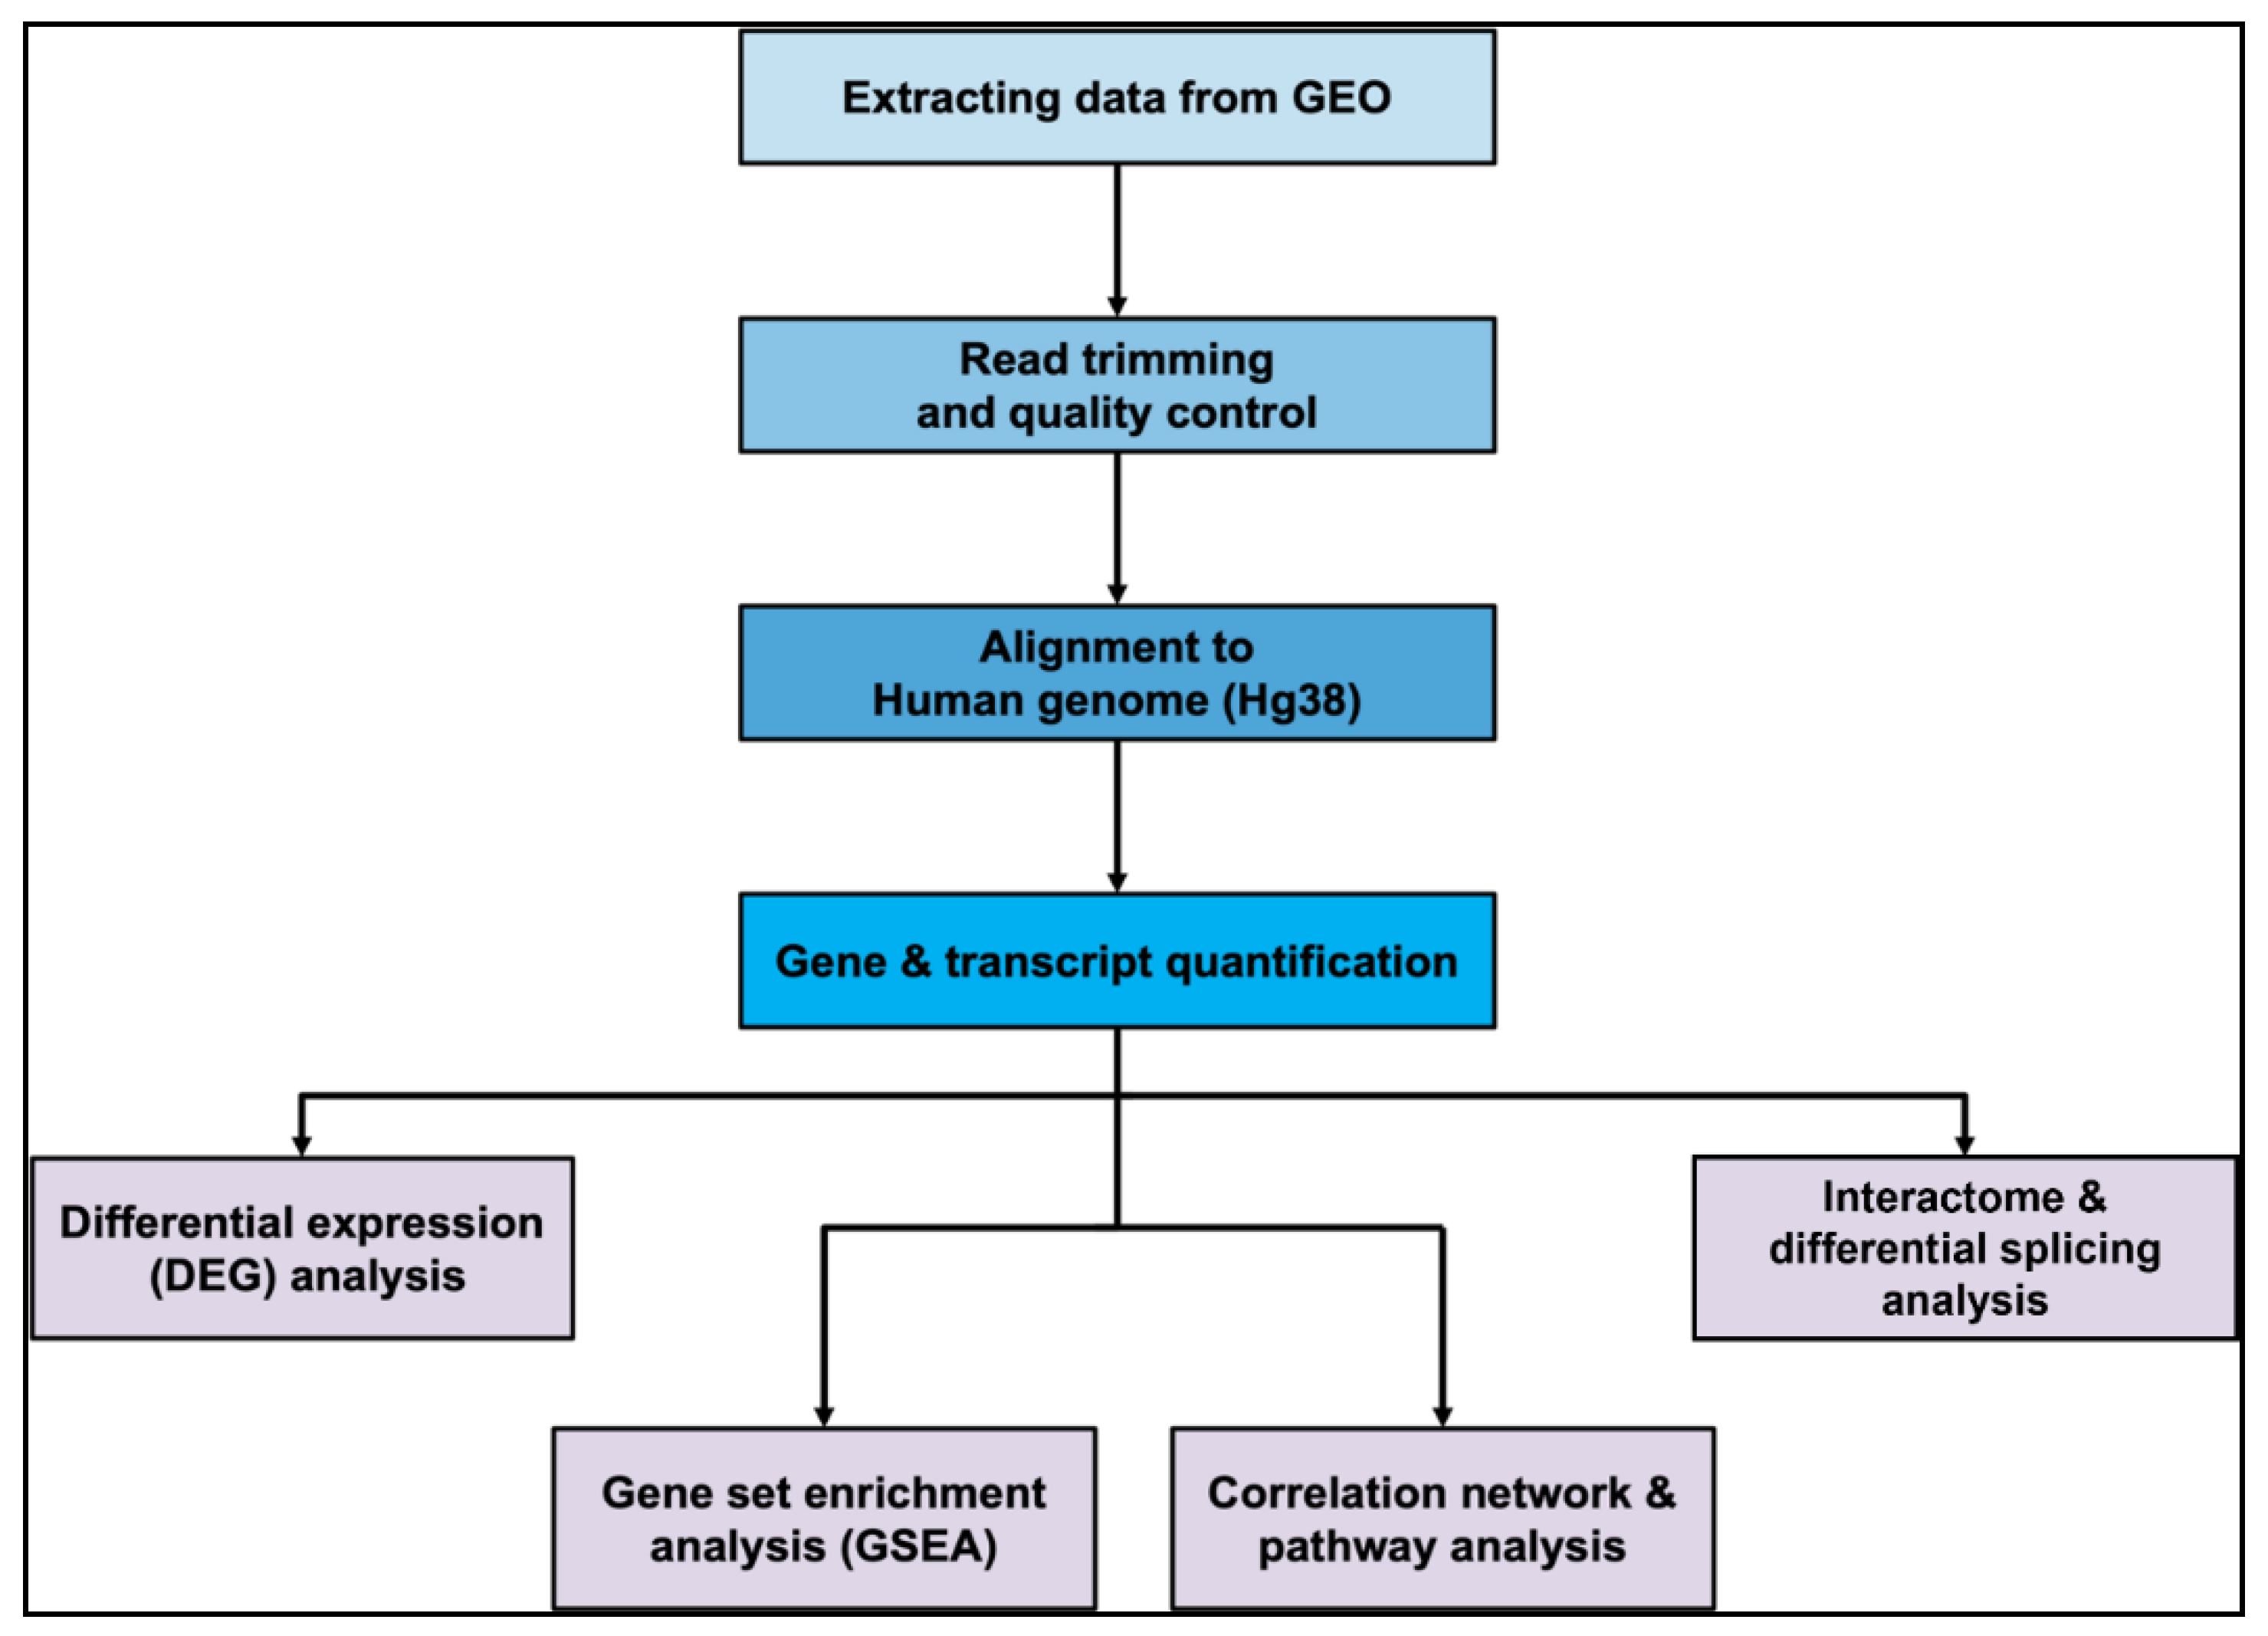
Figure 1. Pipeline for transcriptomic data analyses.
Preprints 122138 g001
Figure 2. Significant genes using differential gene expression (DEG) analyses in (A) Breast cancer; (B), (C) and (D) Prostate cancer; (E) Renal cancer; and (F) Skin cancer datasets. Colors indicate significance categories: Genes showing no significant change in expression (gray), genes with nominal p-value < 0.05 (orange), Benjamini-Hochberg (FDR) corrected p-value < 0.05 (green), Bonferroni corrected p-value < 0.05 (purple).
Preprints 122138 g002
Figure 3. Results from GSEA analyses: (A): Significantly enriched signatures in a prostate cancer dataset; (B) Top signature in NFYA (short isoform) expressing cells v/s controls; (C) Signatures in two renal cancer datasets; (D) and (E) Top signatures in RCC cells v/s controls, and IgA nephropathy v/s normal tissue, respectively; (F) Significantly enriched signatures with increasing tumor grades in RCC tissue; (G) Top signature in Grade 4 RCC v/s Grade 2. Colors in bar plots indicate the total number of signatures (blue) and number of signatures containing SPP1 and at least one of its six top interacting genes (orange). Enrichment plots from GSEA show the enrichment score (ES) obtained per gene in the signature, with the location of the peak ES value indicating the direction of overall enrichment for the signature.
Preprints 122138 g003
Figure 4. Results from Metascape analyses showing pathways involving significant DEGs, in (A): Breast cancer; (B) and (C): Prostate cancer; (D) and (E): Renal cancer; and (F): Skin cancer datasets. The top 20 pathways are shown in descending order of significance, ranked by p-value, with darker-colored bars indicating pathways with greater significance.
Preprints 122138 g004
Figure 5. Results from DEU analyses showing exonic regions present selectively across transcripts for: (A): CXCL12 in breast cancer; (B) S100A4 in prostate cancer; (C) SPP1; (D) S100A4 and (E) CXCL12, in renal cancer (RCC); and (F) SPP1 in another renal cancer dataset (IgA nephropathy). Graphs show expression levels in exonic regions for each pair of conditions (colored red and blue) per gene, and lines beneath denote the primary gene and its constituent transcripts (spliced isoforms). Boxes within each line indicate exonic regions per transcript, and are colored by significance categories: Exons with non-significant DEU (gray), exons absent in the primary gene but present in any transcript, and with significant DEU (white); and those with presence in the primary gene and significant DEU (pink).
Preprints 122138 g005
Table 1. Bulk RNA-seq samples used in analyses per tissue type.
Tissue Number of studies Samples obtained
Breast 5 78
Prostate 5 101
Renal 4 96
Skin 3 115
Total 17 390
Table 2. Samples analyzed for breast cancer.
Study Cell types Samples Comparisons
GSE213474 [30] MCF7 cells supplemented with heat-inactivated charcoal stripped FBS (HD); and HD with estradiol (E2) 30 Stimulation with IFN-γ for 6, 12, 24 and 48 hours v/s control
GSE186196 [31] MCF7 and MDA-MB231 cells 18 Treatment with BKM and DMSO v/s control
GSE195816 [32] MDA157 and MDA436 cells 12 Treatment with EBF1 shRNA v/s control
GSE190381 [33] T47D cells containing 3 types of mutations (GATA splice-site deletion, C321 frame-shift, A333 frame-shift) 12 Mutated v/s control
GSE181460 [34] T47D cells 6 LATS1/2 knockout v/s control
Table 3. Samples analyzed for prostate cancer.
Study Cell types Samples Comparisons
GSE162294 [35] LNCap (prostate adenocarcinoma) cells 36 Treatment with enzalutamide for 1, 3, 5, 7 and 14 days v/s control
Treatment with shTP53 (oligo #1 and #2) v/s control
Treatment with shBRCA1 (oligo #1 and #2) v/s control
GSE184676 [36] LN95 (CPRC) cells 28 Treatment with R1881, exon7-targeted siRNA and AR-V7 exon-targeted siRNA v/s control
GSE133626 [37] Prostate cancer tissue 16 Tumorous v/s control
GSE193127 [38] VCaP and PC-3 cells 12 Transfected with FOXA1-targeting siRNA v/s non-targeting siRNA
GSE179990 [39] PC-3 cells 9 Expressing NF-YA (short and long isoforms) v/s control
Table 4. Samples analyzed for renal cancer.
Study Cell types Samples Comparisons
GSE167573 [40] Renal cell carcinoma (RCC) tissue 28 Tumorous v/s control
GSE141295 [41] Renal cell carcinoma (RCC) tissue 24 Affected by IgA nephropathy v/s control
GSE151419 [42] Renal cell carcinoma (RCC) tissue 24 Tumor grade 2 v/s grade 3 and grade 4
GSE222245 [43] 786-O cells (wild-type and PBRM1 knockout) 20 Treatment with bortezomib (BTZ) for 9 hours v/s DMSO control
Treatment with SMARC2/4 ATPase inhibitor (BRM014) for 24 hours v/s DMSO control
Table 5. Samples analyzed for skin cancer.
Study Cell types Samples Comparisons
GSE113113 [44,45] Cutaneous T-cell lymphoma (cuTCL) tissue 47 Tumor stage IA v/s IB, II and IVA2
GSE124857 [46] MKL-1, MKL-2, MS-1, WaGa, PeTa, BroLi and UISO cells 42 Treatment with GSK-LSD1 inhibitor for 3 days, or CPI-670242 antibody for 1 day v/s control
GSE84293 [47] Cutaneous squamous cell carcinoma (cuSCC) tissue 26 Non-lesional (NS) v/s actinic keratosis (AK) and cutaneous squamous cell carcinoma (SCC)
Disclaimer/Publisher’s Note: The statements, opinions and data contained in all publications are solely those of the individual author(s) and contributor(s) and not of MDPI and/or the editor(s). MDPI and/or the editor(s) disclaim responsibility for any injury to people or property resulting from any ideas, methods, instructions or products referred to in the content.
Copyright: This open access article is published under a Creative Commons CC BY 4.0 license, which permit the free download, distribution, and reuse, provided that the author and preprint are cited in any reuse.
Prerpints.org logo

Preprints.org is a free preprint server supported by MDPI in Basel, Switzerland.

Subscribe

© 2024 MDPI (Basel, Switzerland) unless otherwise stated