Submitted:
24 October 2024
Posted:
24 October 2024
You are already at the latest version
Abstract

Keywords:
1. Introduction
2. Materials and Methods
2.1. Experimental Material
2.2. Experimental Instruments
2.3. Parameters of Electrochemical Experiments
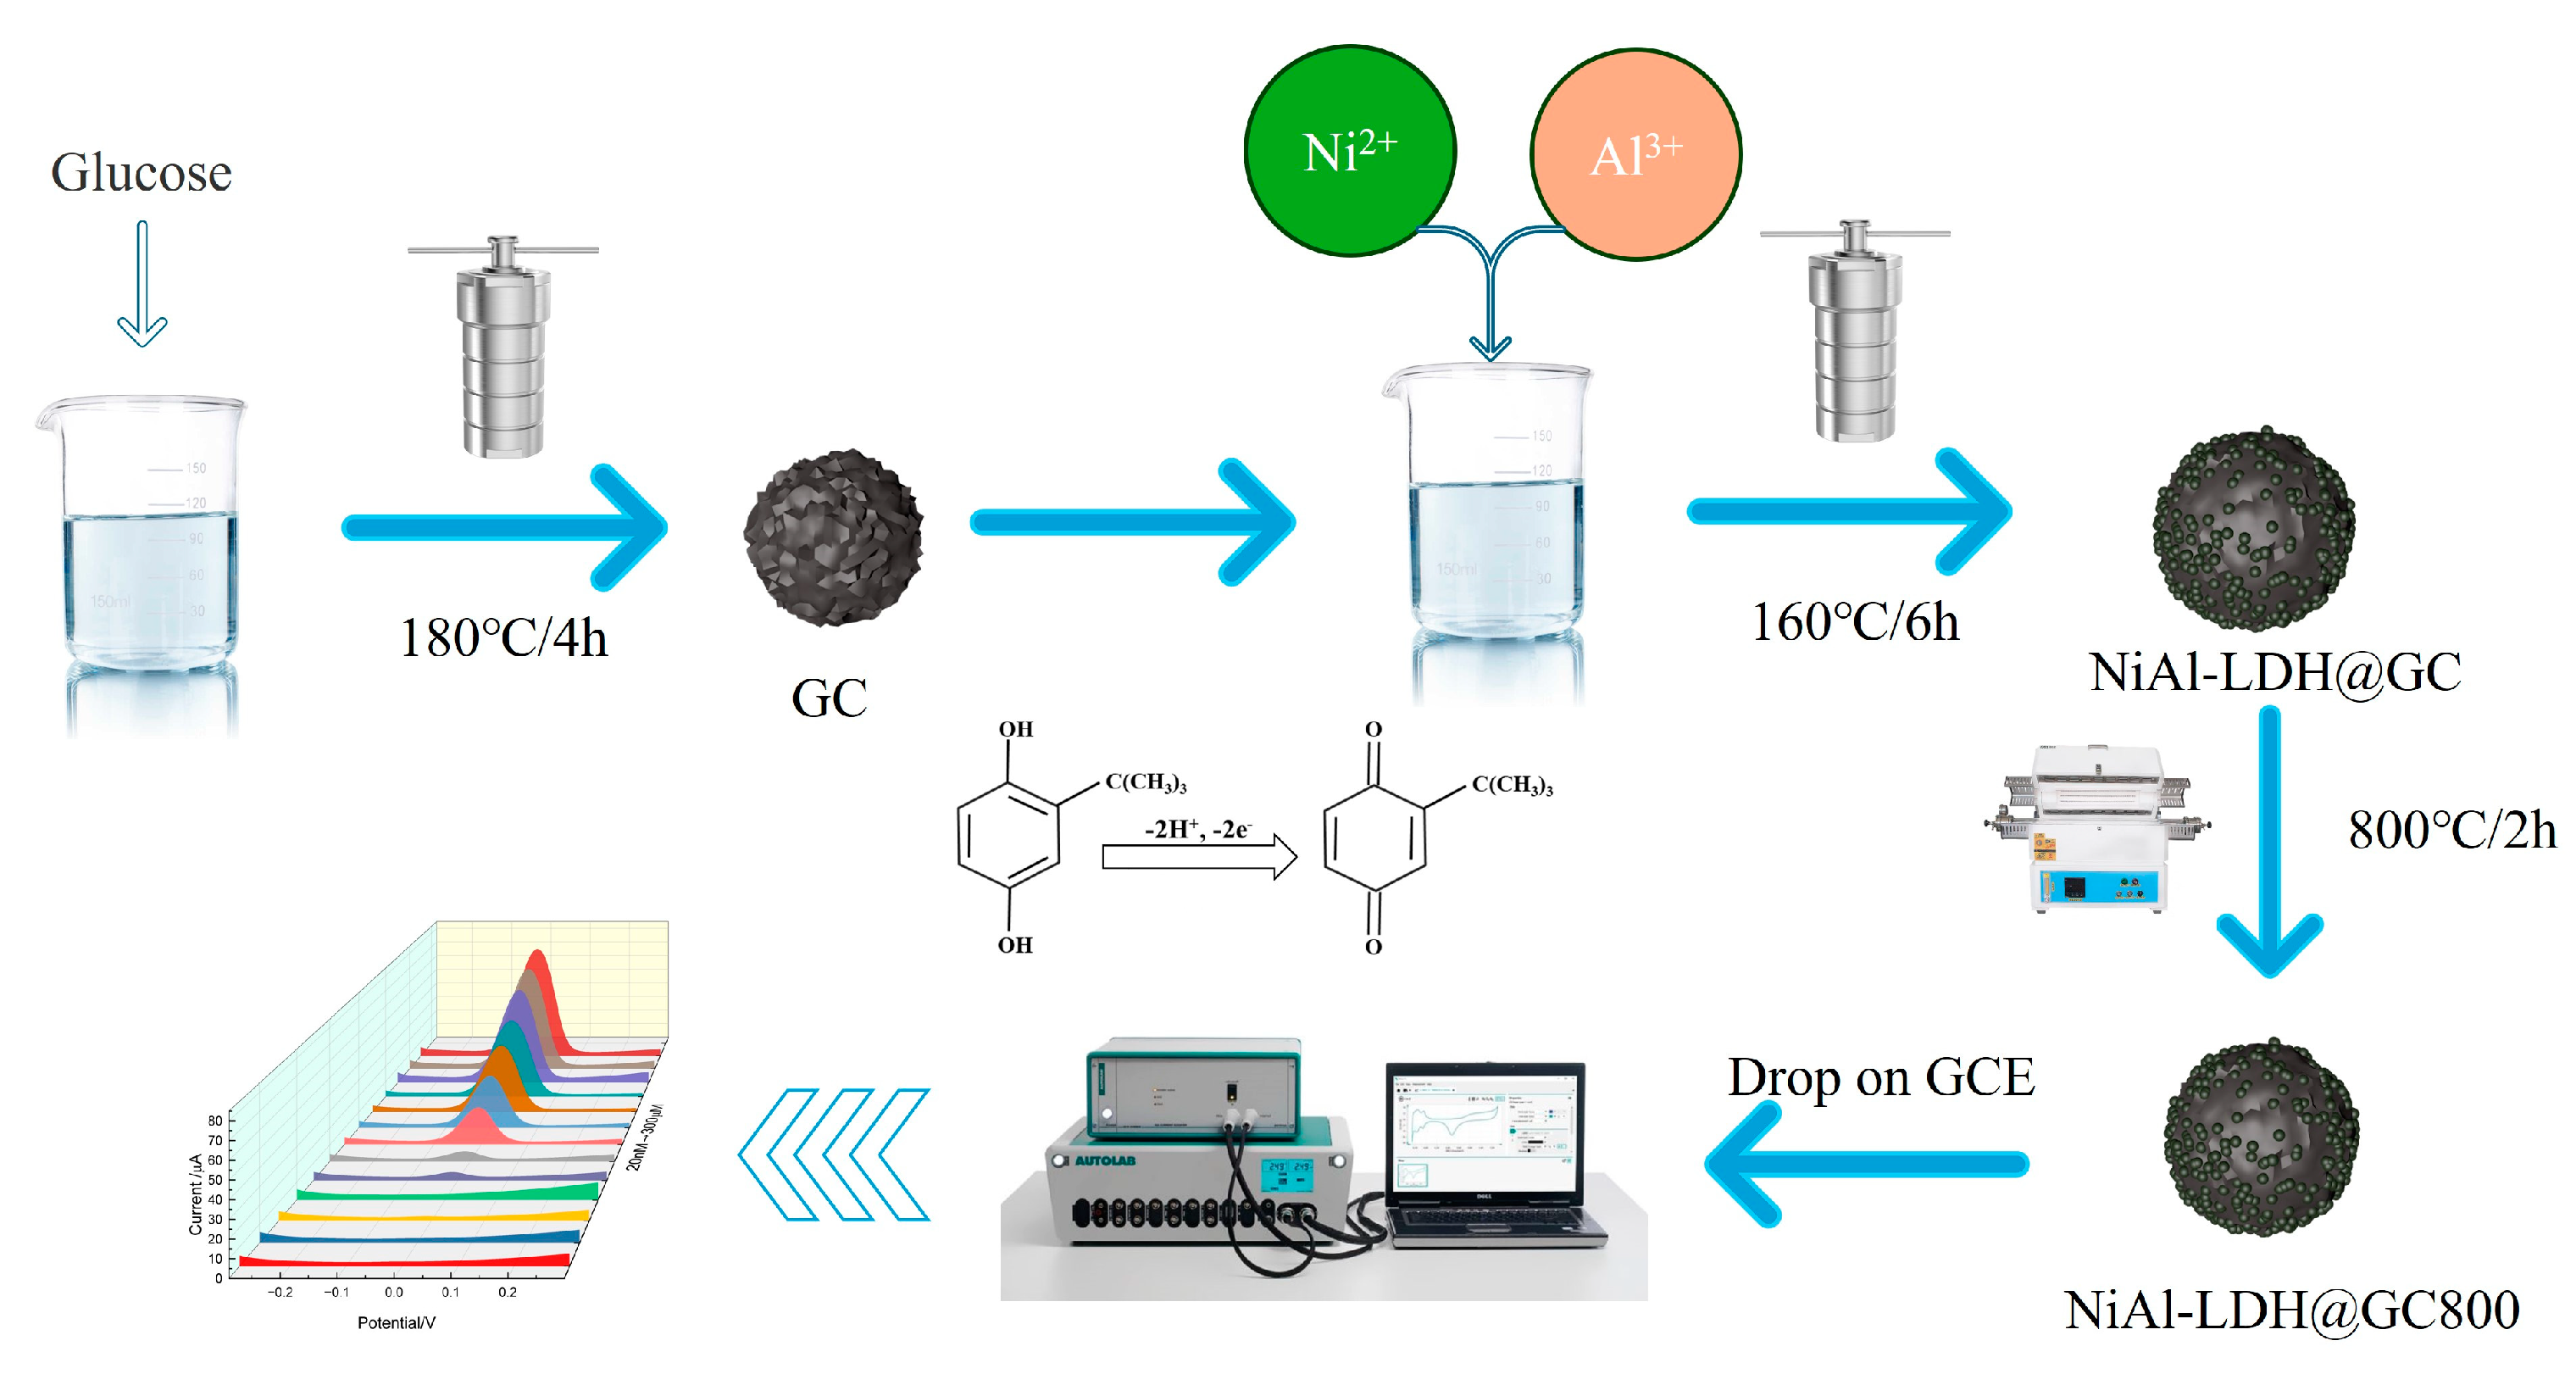
2.4. Synthesis Process
2.5. Preparation of NiAl-LDH@GC-800/GCE
2.6. Preparation of Test Samples
3. Results and Discussion
3.1. Materials Characterization
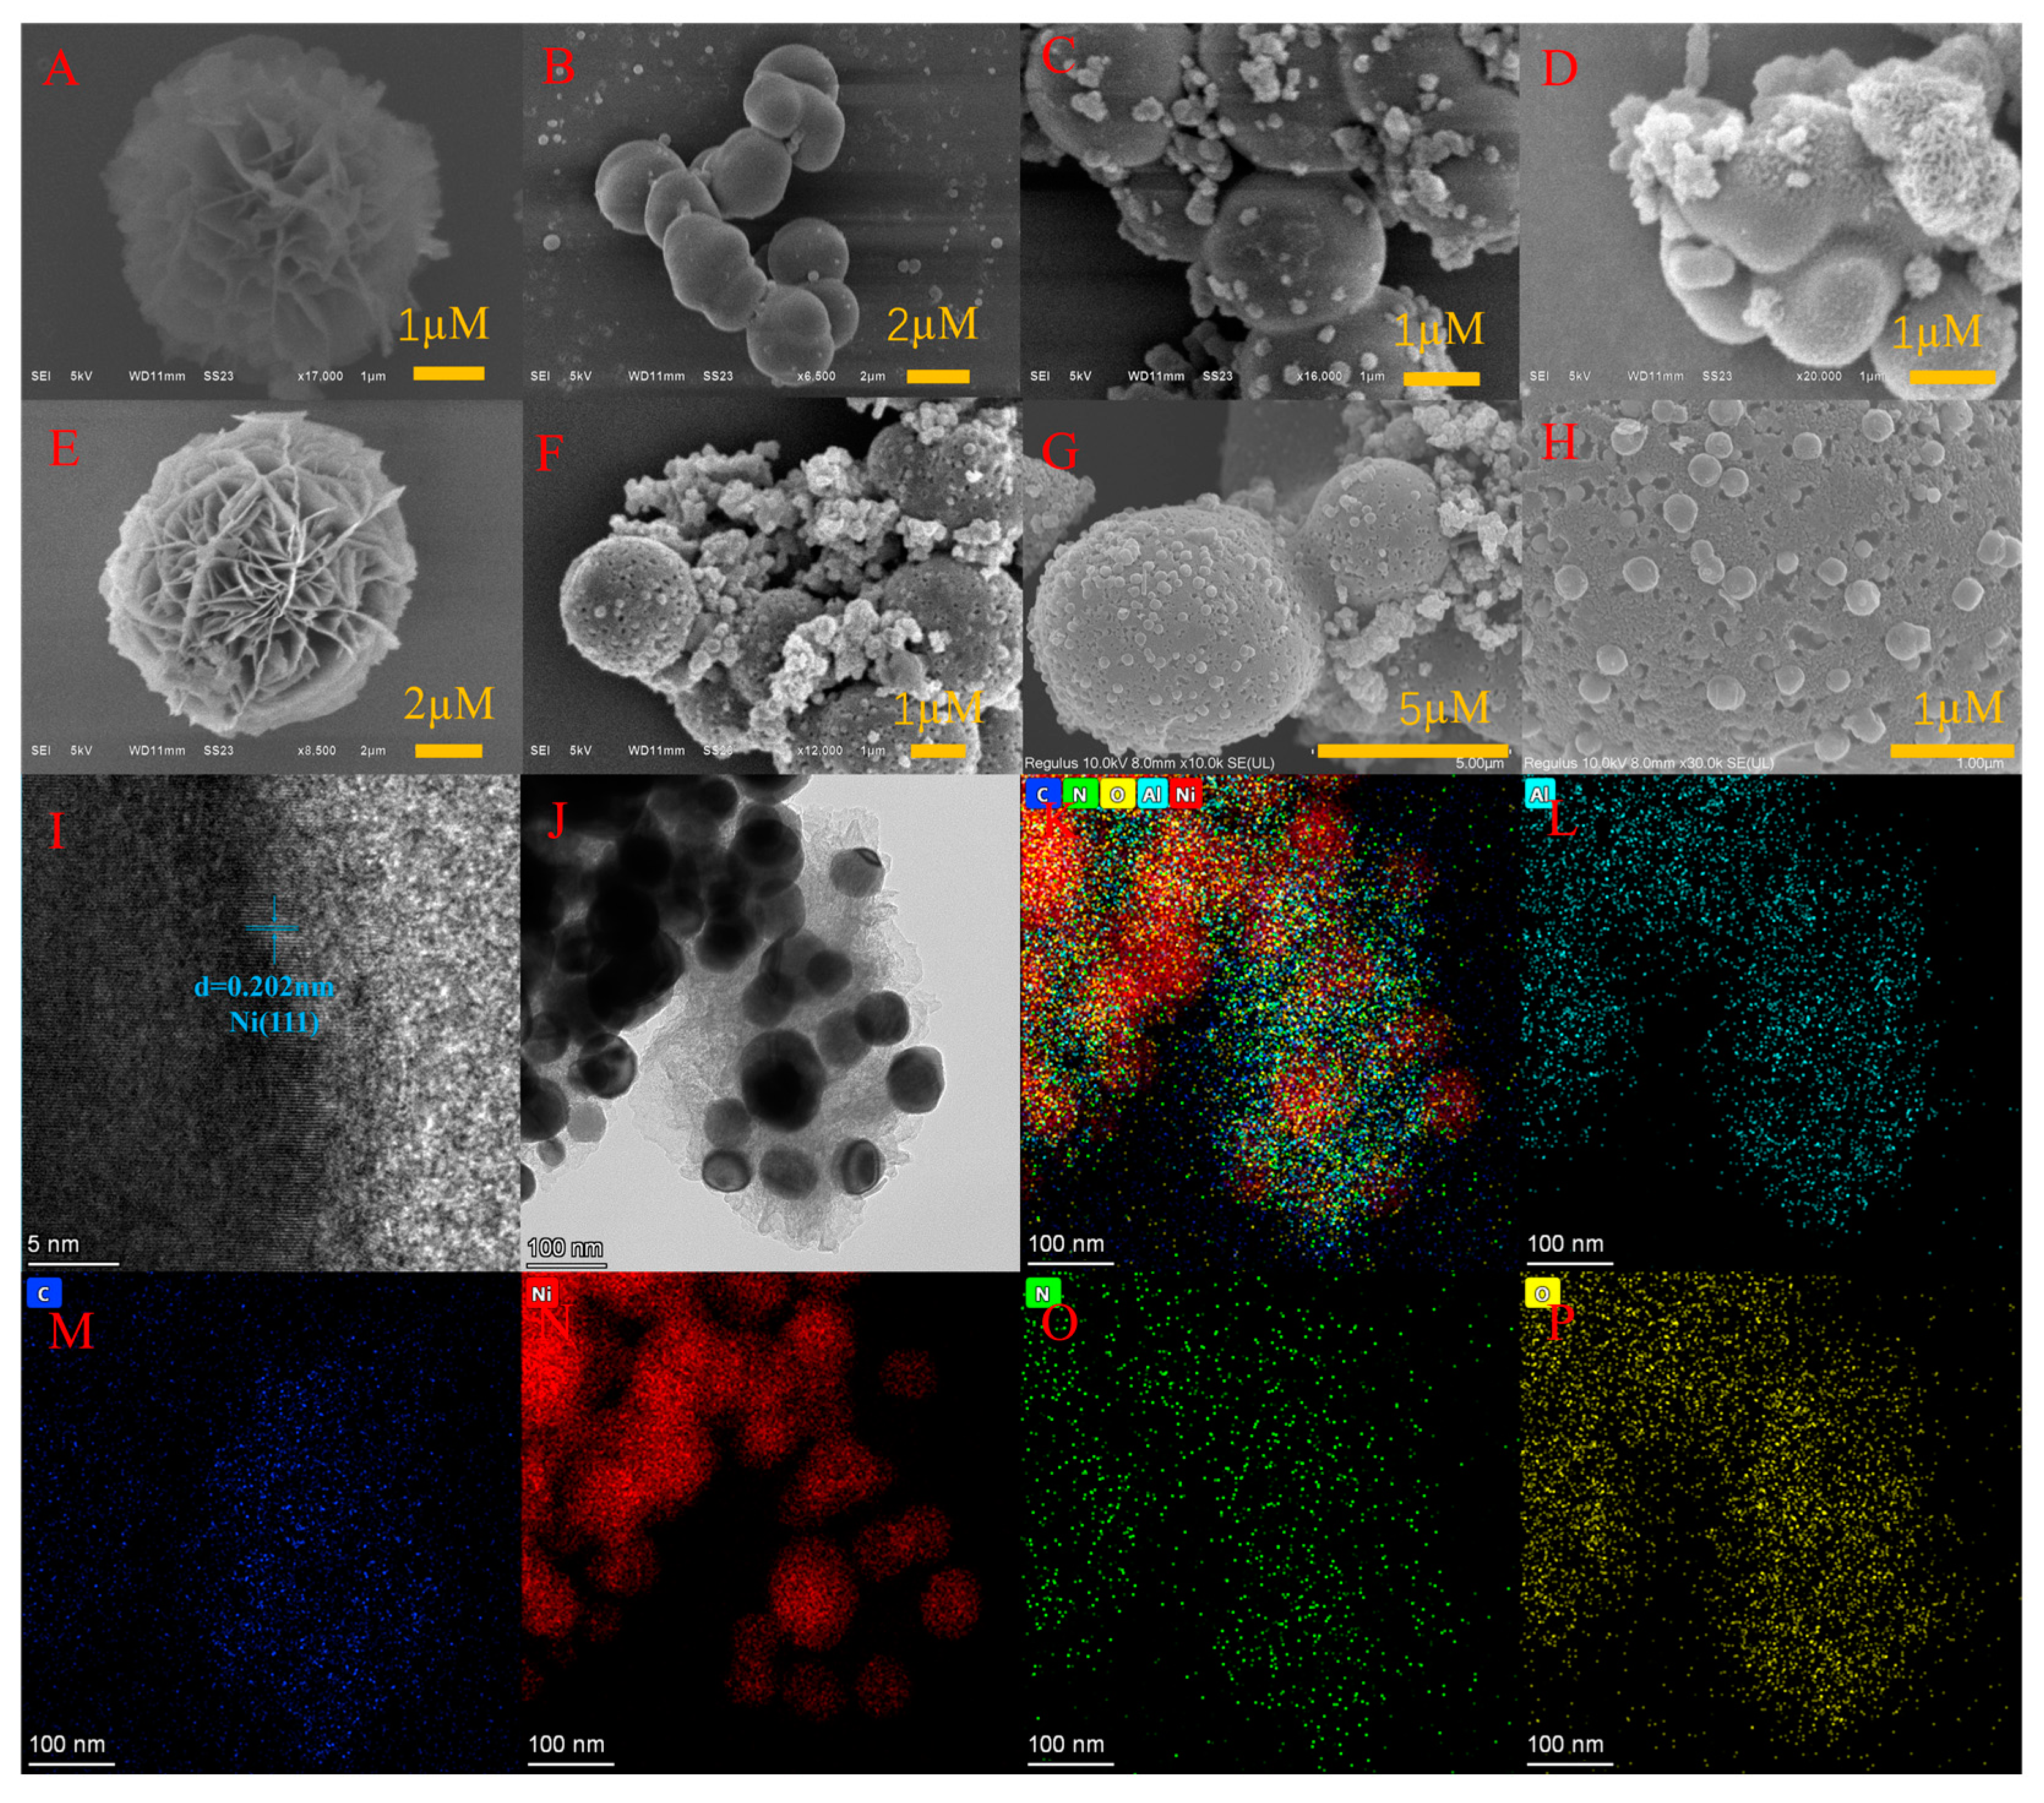
3.1.1. SEM Characterization
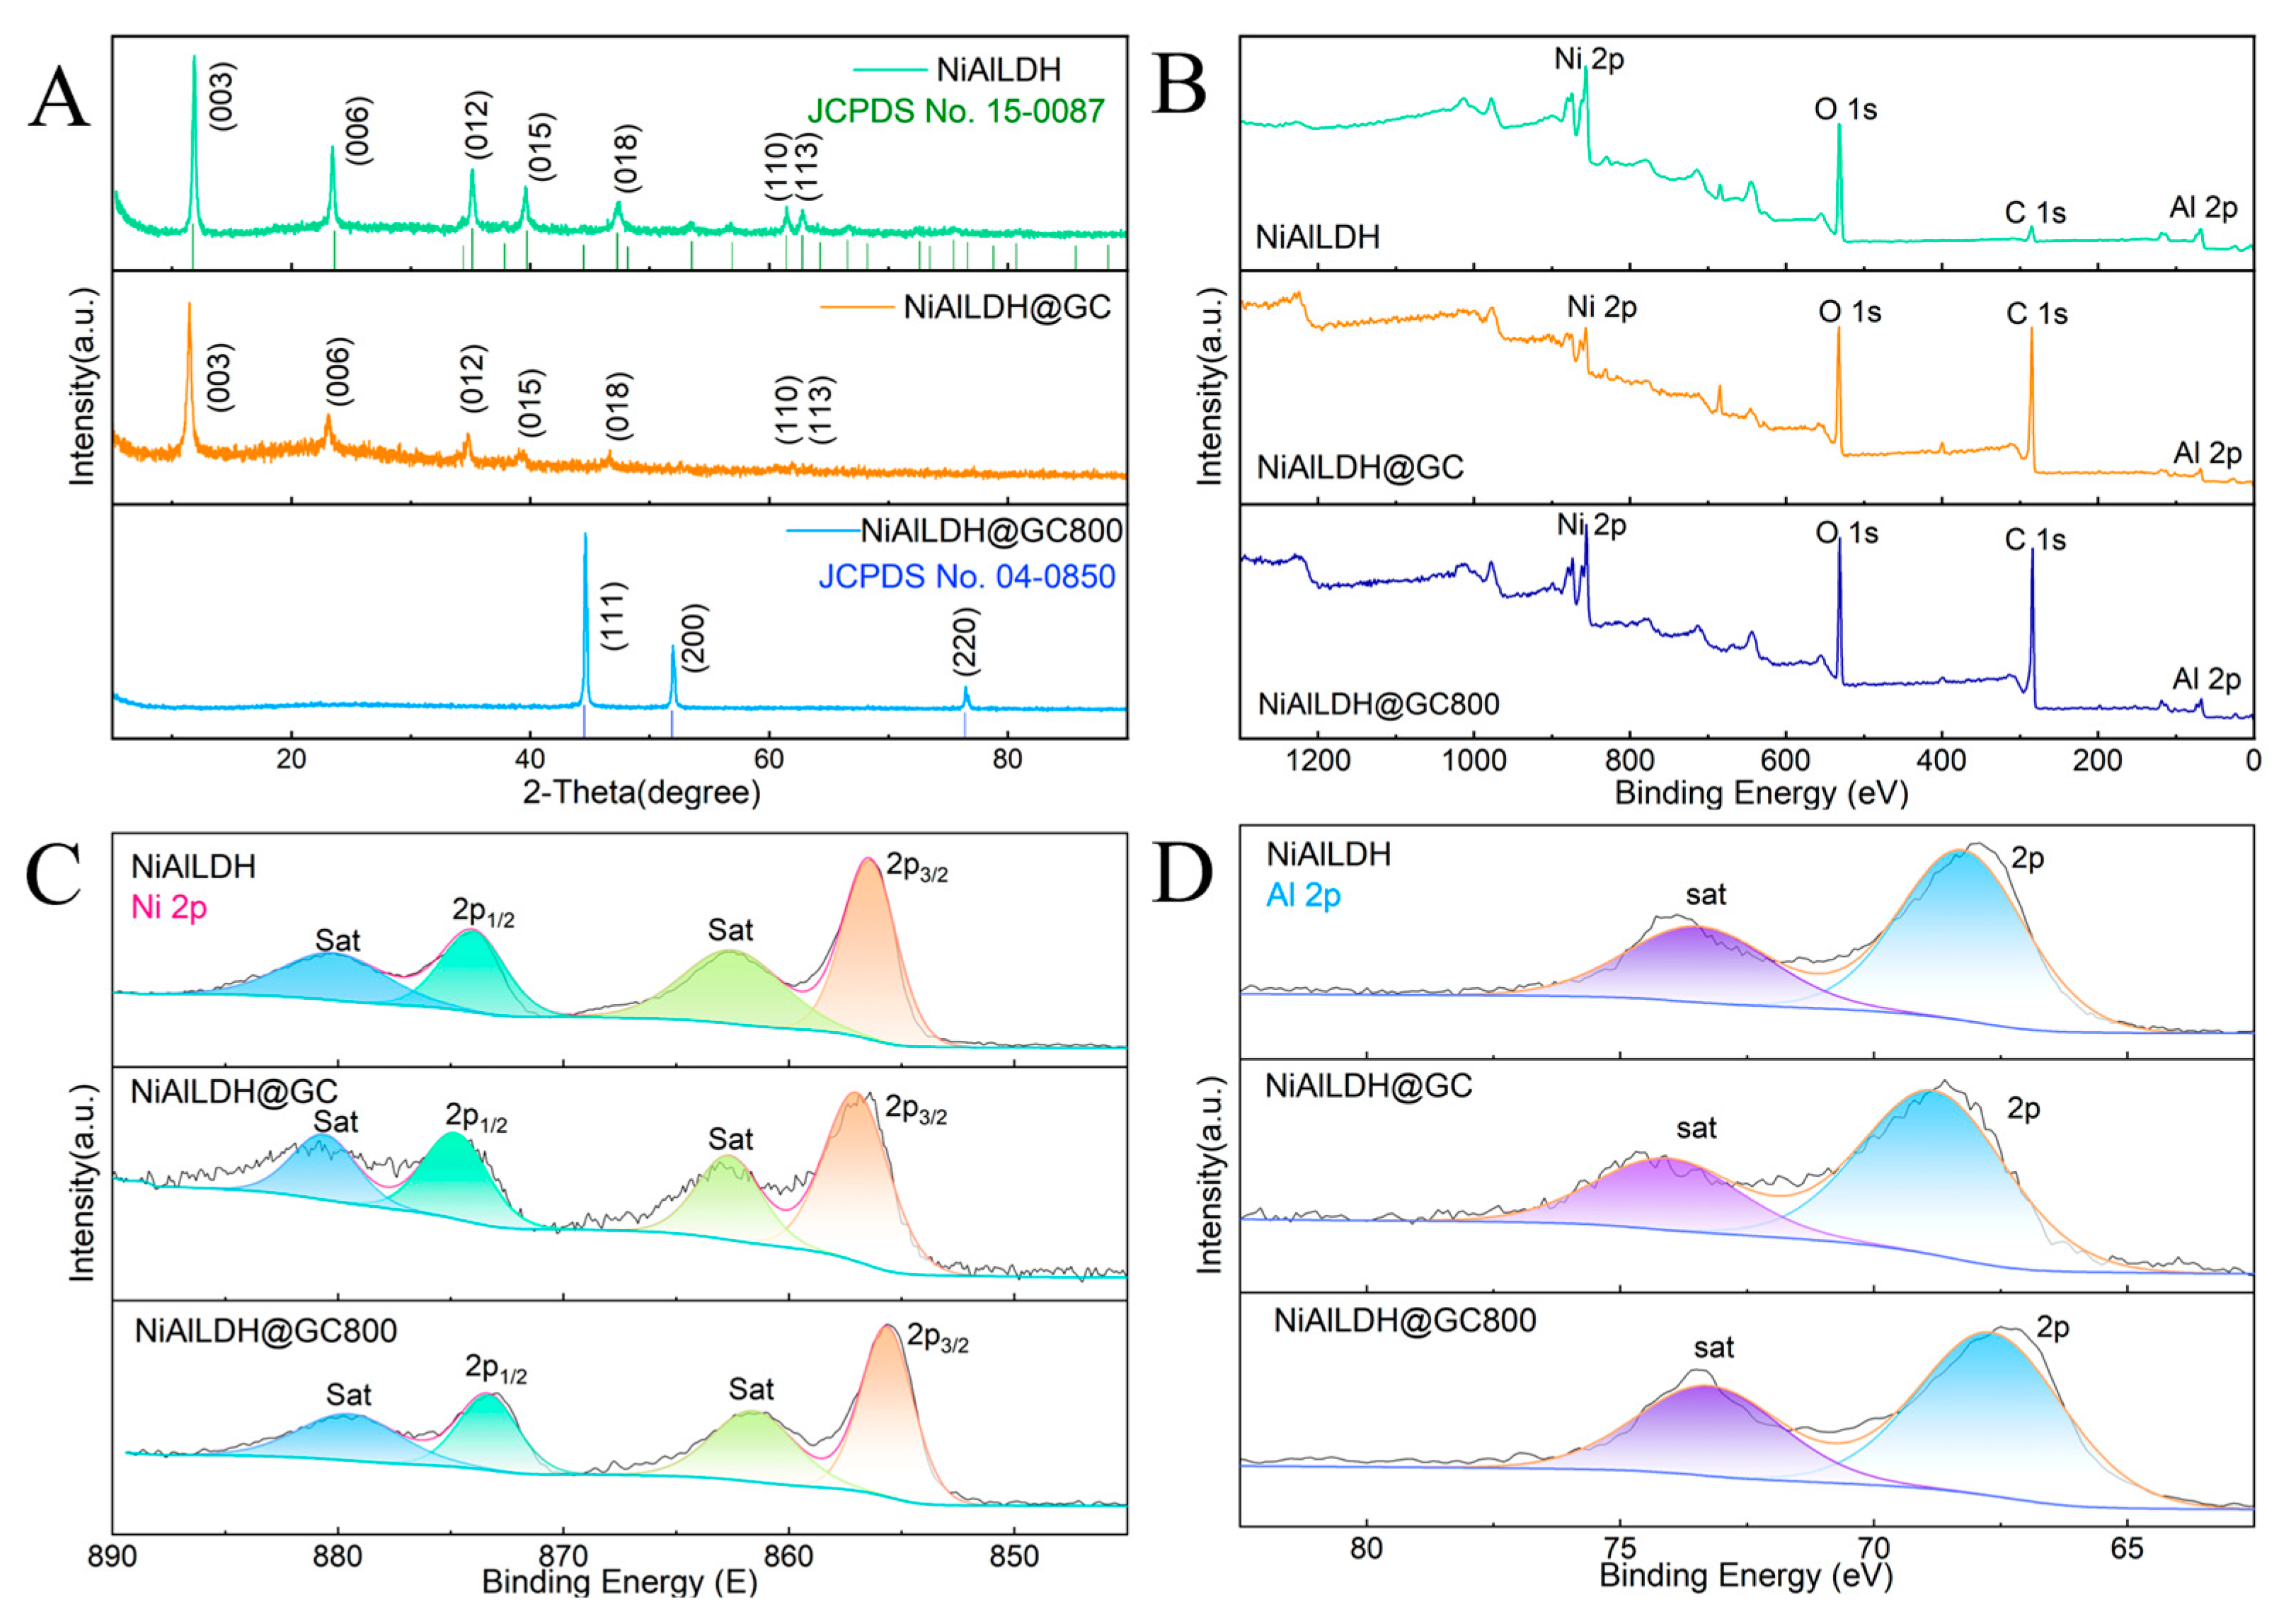
3.1.2. XRD and XPS Characterization
3.1.3. FTIR Analysis
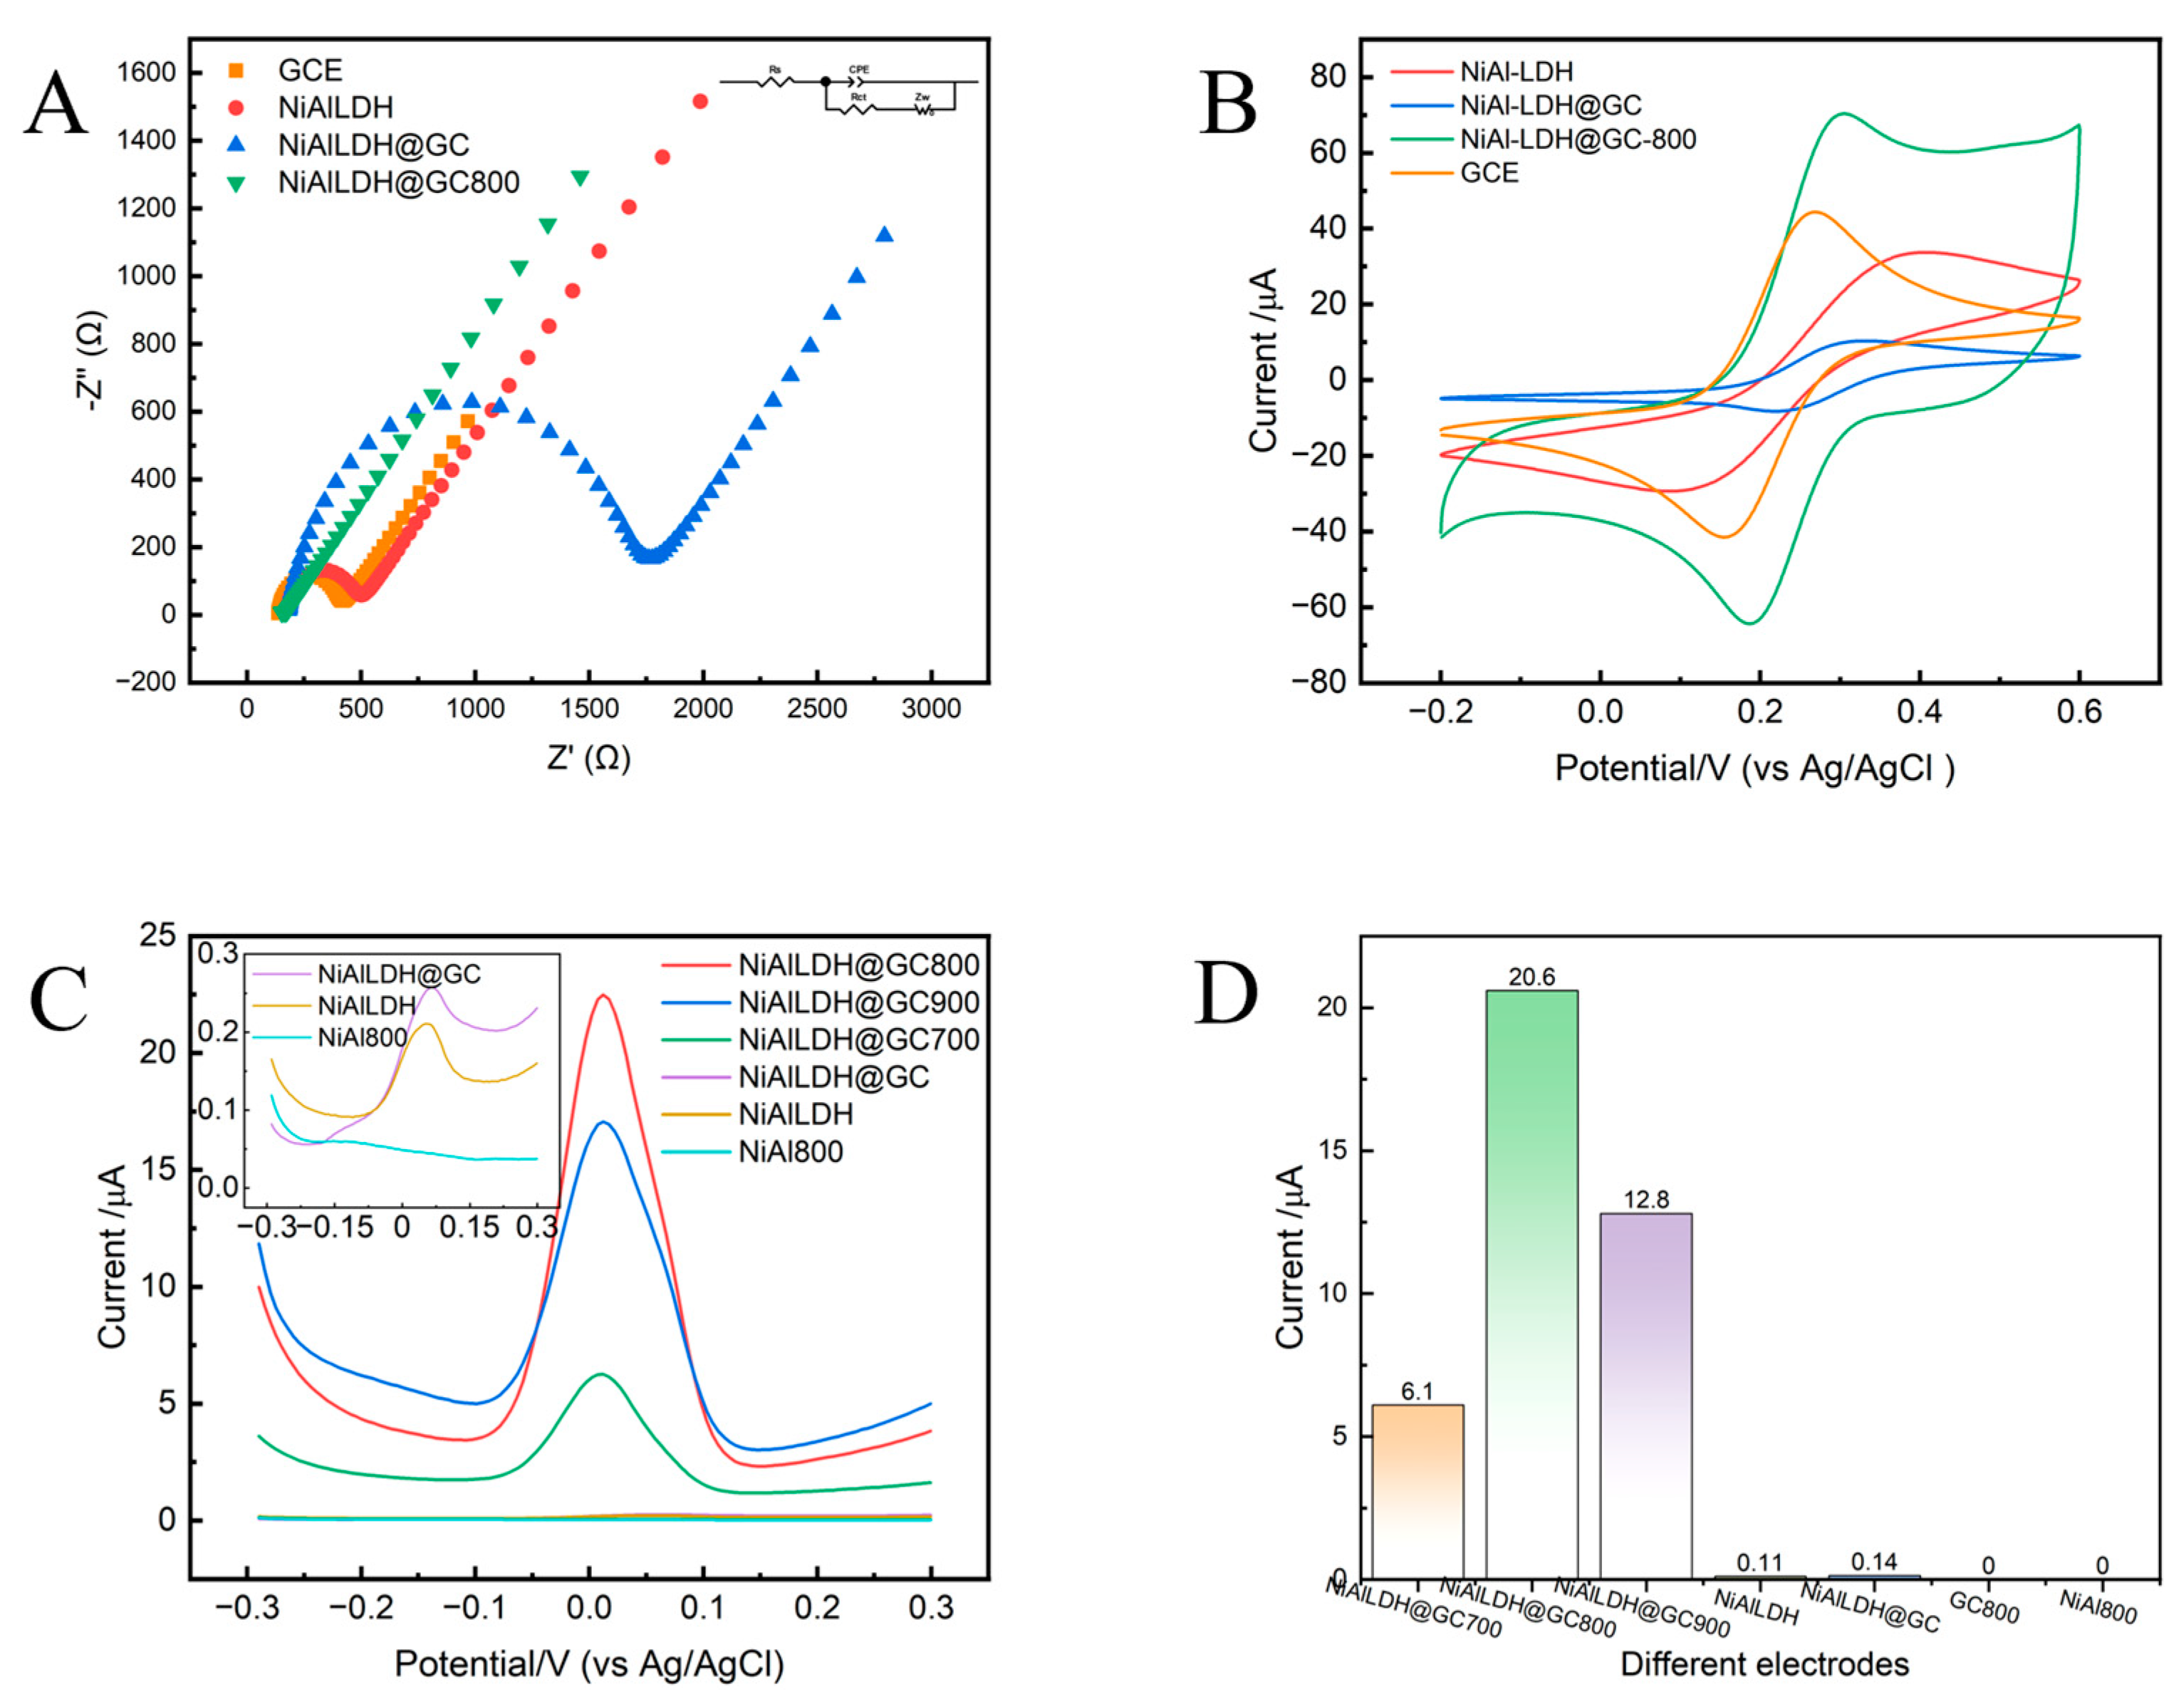
3.2. Comparative Electrochemical Performance Analysis of Different Modified Electrodes
3.3. Optimisation of Experimental Conditions
3.4. pH Effect on the Electrochemical Behavior of TBHQ in NiAl-LDH@GC-800/GCE
3.5. Effect of Scan Rate on the Electrochemical Behavior of TBHQ in NiAl-LDH@GC-800/GCE
3.6. Detection Performance of TBHQ at NiAl-LDH@GC-800/GCE
3.7. The Anti-Interference Ability, Stability, and Reproducibility of the Sensor
3.8. The Real Sample Analysis
4. Conclusions
Supplementary Materials
Author Contributions
Funding
Data Availability Statement
Conflicts of Interest
References
- Choe, E.; Min, D.B. Mechanisms and Factors for Edible Oil Oxidation. Comprehensive Reviews in Food Science and Food Safety 2006, 5, 169–186. [Google Scholar] [CrossRef]
- da Silva, A.F.F.; Winiarski, J.P.; Santana, E.R.; Benetoli, L.O.d.B.; Debacher, N.A.; Vieira, I.C. Sulfur-functionalized graphene obtained by a non-thermal plasma process for simultaneous electrochemical determination of tert-butylhydroquinone and bisphenol A. Materials Research Bulletin 2024, 177, 112875. [Google Scholar] [CrossRef]
- Sebastian, N.; Yu, W.-C.; Balram, D.; Al-Mubaddel, F.S.; Tayyab Noman, M. Nanomolar detection of food additive tert-butylhydroquinone in edible oils based on novel ternary metal oxide embedded β-cyclodextrin functionalized carbon black. Food Chemistry 2022, 377, 131867. [Google Scholar] [CrossRef] [PubMed]
- Chi, H.; Yang, C.; Liu, G. An electrochemical sensor based on electrochemically activated carbon cloth and poly (o-aminothiophenol) cross-linked nanogold imprinted layer for the determination of tert-butylhydroquinone. Food Chemistry 2024, 452, 139548. [Google Scholar] [CrossRef] [PubMed]
- João, A.F.; Matias, T.A.; Gomes, J.S.; Guimaraes, R.R.; Sousa, R.M.F.; Muñoz, R.A.A. An Environmentally Friendly Three-Dimensional Printed Graphene-Integrated Polylactic Acid Electrochemical Sensor for the Quality Control of Biofuels. ACS Sustainable Chemistry & Engineering 2021, 9, 16052–16062. [Google Scholar] [CrossRef]
- Daisy Priscillal, I.J.; Wang, S.-F. Hierarchically Ordered Tungsten Antimonate Nanoflowers Anchored on Carbon Nanofibers for Electrochemical Detection of a Food Additive. ACS Applied Nano Materials 2022, 5, 10331–10340. [Google Scholar] [CrossRef]
- Zhang, Y.; Liu, X.; Tian, Y.; Geng, Y.; Wang, J.; Ma, M. A ratiometric electrochemical sensing strategy based on the self-assembly of Co NC/CNT and methylene blue for effective detection of the food additive tert-butylhydroquinone. Talanta 2024, 266, 125024. [Google Scholar] [CrossRef]
- Liu, W.; Zong, B.; Wang, X.; Yang, G.; Yu, J. Deep eutectic solvents as switchable solvents for highly efficient liquid–liquid microextraction of phenolic antioxidant: Easily tracking the original TBHQ in edible oils. Food Chemistry 2022, 377, 131946. [Google Scholar] [CrossRef]
- Ding, M.; Zou, J. Rapid micropreparation procedure for the gas chromatographic–mass spectrometric determination of BHT, BHA and TBHQ in edible oils. Food Chemistry 2012, 131, 1051–1055. [Google Scholar] [CrossRef]
- Yue, X.; Zhu, W.; Ma, S.; Yu, S.; Zhang, Y.; Wang, J.; Wang, Y.; Zhang, D.; Wang, J. Highly Sensitive and Selective Determination of Tertiary Butylhydroquinone in Edible Oils by Competitive Reaction Induced “On–Off–On” Fluorescent Switch. Journal of Agricultural and Food Chemistry 2016, 64, 706–713. [Google Scholar] [CrossRef]
- Yang, Y.; Wang, P.; Luo, Z.; Li, J.; Wang, Y.; Li, Z.; Chen, C.; Xie, Y.; Zhao, P.; Fei, J. Enhanced electrocatalytic activity of 2D ordered mesoporous nitrogen-rich carbon nanosheets functional NiFe2O4 nanospheres for ultrasensitive detection of chlorogenic acid in natural samples. Chemical Engineering Journal 2023, 468. [Google Scholar] [CrossRef]
- Kajal, N.; Singh, V.; Gupta, R.; Gautam, S. Metal organic frameworks for electrochemical sensor applications: A review. Environmental Research 2022, 204, 112320. [Google Scholar] [CrossRef] [PubMed]
- Li, S.; Jiang, Q.; Ge, L.; Yang, X.; Wang, H.; Wu, S.; Song, H.; Zhang, Z.; Shen, G.; Hou, X.; et al. One-step electrodeposition of a novel gold nanoparticles/MoS2-graphene nanocomposite based electrochemical sensor for simultaneous determination of tert-butylhydroquinone and butylated hydroxyanisole. Microchemical Journal 2024, 204, 111046. [Google Scholar] [CrossRef]
- Monteiro, T.O.; Tanaka, A.A.; Damos, F.S.; Luz, R.d.C.S. Photoelectrochemical determination of tert-butylhydroquinone in edible oil samples employing CdSe/ZnS quantum dots and LiTCNE. Food Chemistry 2017, 227, 16–21. [Google Scholar] [CrossRef]
- Yue, X.; Luo, X.; Zhou, Z.; Bai, Y. Selective electrochemical determination of tertiary butylhydroquinone in edible oils based on an in-situ assembly molecularly imprinted polymer sensor. Food Chemistry 2019, 289, 84–94. [Google Scholar] [CrossRef]
- Ning, X.; Du, P.; Han, Z.; Chen, J.; Lu, X. Insight into the Transition-Metal Hydroxide Cover Layer for Enhancing Photoelectrochemical Water Oxidation. Angewandte Chemie International Edition 2021, 60, 3504–3509. [Google Scholar] [CrossRef]
- Kim, A.; Varga, I.; Adhikari, A.; Patel, R. Recent Advances in Layered Double Hydroxide-Based Electrochemical and Optical Sensors. In Nanomaterials, 2021; Vol. 11.
- Sohrabi, H.; Dezhakam, E.; Khataee, A.; Nozohouri, E.; Majidi, M.R.; Mohseni, N.; Trofimov, E.; Yoon, Y. Recent trends in layered double hydroxides based electrochemical and optical (bio)sensors for screening of emerging pharmaceutical compounds. Environmental Research 2022, 211, 113068. [Google Scholar] [CrossRef]
- Ren, H.; Zou, L.; Zhou, Z.; Li, Z.; Niu, H.; Liao, H.; Zhang, X.; Liu, Y.; Zhang, X.; Huang, X.; et al. Layered double hydroxides-based DNA sensors for analytical detection. Microchemical Journal 2024, 204, 111153. [Google Scholar] [CrossRef]
- Fu, R.; Lu, Y.; Ding, Y.; Li, L.; Ren, Z.; Si, X.; Wu, Q. A novel non-enzymatic glucose electrochemical sensor based on CNF@Ni-Co layered double hydroxide modified glassy carbon electrode. Microchemical Journal 2019, 150, 104106. [Google Scholar] [CrossRef]
- Zhu, Y.; Dong, X.; Cheng, J.; Wang, L.; Zhao, C.; Deng, Y.; Xie, S.; Pan, Y.; Zhao, Y.; Sun, G.; et al. Ultra-thin CoAl layered double hydroxide nanosheets for the construction of highly sensitive and selective QCM humidity sensor. Chinese Chemical Letters 2023, 34, 107930. [Google Scholar] [CrossRef]
- Cui, L.; Meng, X.; Xu, M.; Shang, K.; Ai, S.; Liu, Y. Electro-oxidation nitrite based on copper calcined layered double hydroxide and gold nanoparticles modified glassy carbon electrode. Electrochimica Acta 2011, 56, 9769–9774. [Google Scholar] [CrossRef]
- Sriram, B.; Baby, J.N.; Hsu, Y.-F.; Wang, S.-F.; George, M. Surfactant-Assisted Synthesis of Praseodymium Orthovanadate Nanofiber-Supported NiFe-Layered Double Hydroxide Bifunctional Catalyst: The Electrochemical Detection and Degradation of Diphenylamine. Inorganic Chemistry 2022, 61, 5824–5835. [Google Scholar] [CrossRef] [PubMed]
- Qiao, J.; Wang, Y.; Liang, Q.; Dong, S.; Zeng, Z.; Shao, S. A Photoelectrochemical Sensor Based on TiO2 Nanotube Arrays Decorated with Nickel-Cobalt Layered Double Hydroxides for the Effective and Sensitive Detection of Chromium(VI). ACS Applied Nano Materials 2022, 5, 5535–5543. [Google Scholar] [CrossRef]
- Rossini, P.d.O.; Laza, A.; Azeredo, N.F.B.; Gonçalves, J.M.; Felix, F.S.; Araki, K.; Angnes, L. Ni-based double hydroxides as electrocatalysts in chemical sensors: A review. TrAC Trends in Analytical Chemistry 2020, 126, 115859. [Google Scholar] [CrossRef]
- Adampourezare, M.; Nikzad, B. Layered double hydroxide nanoparticles as signal-amplification elements in DNA biosensors: Recent progress and challenges. Microchemical Journal 2024, 199, 110151. [Google Scholar] [CrossRef]
- Gibi, C.; Liu, C.-H.; Barton, S.C.; Anandan, S.; Wu, J.J. Carbon Materials for Electrochemical Sensing Application – A Mini Review. Journal of the Taiwan Institute of Chemical Engineers 2024, 154, 105071. [Google Scholar] [CrossRef]
- Mohanty, A.K.; Vivekanandhan, S.; Das, O.; Romero Millán, L.M.; Klinghoffer, N.B.; Nzihou, A.; Misra, M. Biocarbon materials. Nature Reviews Methods Primers 2024, 4, 19. [Google Scholar] [CrossRef]
- Yang, K.; Yang, H.; Zheng, Y.; Chen, H.; Liu, W.; Yang, X. Electrochemical sensor based on cobalt single-atom anchored porous carbon composite for sensitive detection of acetaminophen. Microchemical Journal 2024, 203, 110874. [Google Scholar] [CrossRef]
- Pu, H.; Ruan, S.; Yin, M.; Sun, Q.; Zhang, Y.; Gao, P.; Liang, X.; Yin, W.; Fa, H.-b. Performance comparison of simultaneo us detection Heavy-Metal ions based on carbon materials electrochemical sensor. Microchemical Journal 2022, 181, 107711. [Google Scholar] [CrossRef]
- Tran, H.L.; Dang, V.D.; Dega, N.K.; Lu, S.-M.; Huang, Y.-F.; Doong, R.-a. Ultrasensitive detection of breast cancer cells with a lectin-based electrochemical sensor using N-doped graphene quantum dots as the sensing probe. Sensors and Actuators B: Chemical 2022, 368, 132233. [Google Scholar] [CrossRef]
- Justino, C.I.L.; Gomes, A.R.; Freitas, A.C.; Duarte, A.C.; Rocha-Santos, T.A.P. Graphene based sensors and biosensors. TrAC Trends in Analytical Chemistry 2017, 91, 53–66. [Google Scholar] [CrossRef]
- Choi, E.J.; Drago, N.P.; Humphrey, N.J.; Van Houten, J.; Ahn, J.; Lee, J.; Kim, I.-D.; Ogata, A.F.; Penner, R.M. Electrodeposition-enabled, electrically-transduced sensors and biosensors. Materials Today 2023, 62, 129–150. [Google Scholar] [CrossRef]
- Li, Y.; Yang, Y.; Li, J.; Zhang, L.; Zhao, P.; Fei, J.; Xie, Y. Ultrasensitive Luteolin Electrochemical Sensor Based on Novel Lamellar CuZn@ Nitrogen-Containing Carbon Nanosheets. In Nanomaterials, 2023; Vol. 13.
- Li, J.; Yang, Y.; Li, Y.; Zhao, P.; Fei, J.; Xie, Y. Detection of gallic acid in food using an ultra-sensitive electrochemical sensor based on glass carbon electrode modified by bimetal doped carbon nanopolyhedras. Food Chemistry 2023, 429, 136900. [Google Scholar] [CrossRef] [PubMed]
- Yang, Y.; Li, J.; Luo, Z.; Li, X.; Zou, J.; Li, C.; Chen, C.; Xie, Y.; Zhao, P.; Fei, J. 1D-ordered mesoporous corncob-like Mo2C carbon nanotubes loaded with FeMnO3 hollow porous nanospheres as an efficient electrochemical sensing platform for rutin detection. Sensors and Actuators B: Chemical 2023, 394, 134366. [Google Scholar] [CrossRef]
- Zhang, L.; Li, J.; Zhao, P.; Wang, C.; Wang, Y.; Yang, Y.; Xie, Y.; Fei, J. Ultrasensitive baicalin electrochemical sensor based on molybdenum trioxide nanowires-poly (3,4-ethylenedioxythiophene)/cobalt-nitrogen co-doped carbon nanotube (CoNC) composites. Microchemical Journal 2022, 182, 107873. [Google Scholar] [CrossRef]
- Baye, A.F.; Han, D.-H.; Kassahun, S.K.; Appiah-Ntiamoah, R.; Kim, H. Improving the reduction and sensing capability of Fe3O4 towards 4-nitrophenol by coupling with ZnO/Fe0/Fe3C/graphitic carbon using ZnFe-LDH@carbon as a template. Electrochimica Acta 2021, 398, 139343. [Google Scholar] [CrossRef]
- Shen, M.; Zhang, Z.; Ding, Y. Synthesizing NiAl-layered double hydroxide microspheres with hierarchical structure and electrochemical detection of hydroquinone and catechol. Microchemical Journal 2016, 124, 209–214. [Google Scholar] [CrossRef]
- Zhao, P.; Hao, J. Tert-butylhydroquinone recognition of molecular imprinting electrochemical sensor based on core–shell nanoparticles. Food Chemistry 2013, 139, 1001–1007. [Google Scholar] [CrossRef] [PubMed]
- Fan, M.; Zhu, S.; Zhang, Q.; Wang, X.; Zhang, L.; Chang, Z.; Chong, R. Sensitive photoelectrochemical sensing of glucose using hematite decorated with NiAl-layered double hydroxides. Food Chemistry 2023, 405, 134883. [Google Scholar] [CrossRef]
- Yan, X.; Yang, X.; Sun, Z.; Hu, Z.; Zhang, Y.; Pan, G.; Cheng, Y. Nickle ion surface engineered MOF derived α-Fe2O3 octahedrons for high efficiency toluene detection with high moisture resistance and long-term stability. Sensors and Actuators B: Chemical 2024, 412, 135840. [Google Scholar] [CrossRef]
- Xu, X.; Shi, S.; Tang, Y.; Wang, G.; Zhou, M.; Zhao, G.; Zhou, X.; Lin, S.; Meng, F. Growth of NiAl-Layered Double Hydroxide on Graphene toward Excellent Anticorrosive Microwave Absorption Application. Advanced Science 2021, 8, 2002658. [Google Scholar] [CrossRef]
- Ragumoorthy, C.; Nataraj, N.; Chen, S.-M.; Tharuman, S. Facile Electrochemical Determination of Nilutamide with the Fabrication of Nickel-Aluminum Layered Double Hydroxide as an Efficient Electrocatalyst. Journal of The Electrochemical Society 2023, 170, 117515. [Google Scholar] [CrossRef]
- Wang, L.; Chen, X.; Liu, C.; Yang, W. Non-enzymatic acetylcholine electrochemical biosensor based on flower-like NiAl layered double hydroxides decorated with carbon dots. Sensors and Actuators B: Chemical 2016, 233, 199–205. [Google Scholar] [CrossRef]
- Dong, Z.; Torbati-Sarraf, H.; Hussein, H.Z.; Poursaee, A. Harmonic analysis on the effect of potential perturbations and electrodes arrangements on the electrochemical impedance (EIS) measurement of cementitious material. Construction and Building Materials 2021, 273, 121701. [Google Scholar] [CrossRef]
- Yokoshima, T.; Mukoyama, D.; Nakazawa, K.; Gima, Y.; Isawa, H.; Nara, H.; Momma, T.; Osaka, T. Application of Electrochemical Impedance Spectroscopy to Ferri/Ferrocyanide Redox Couple and Lithium Ion Battery Systems Using a Square Wave as Signal Input. Electrochimica Acta 2015, 180, 922–928. [Google Scholar] [CrossRef]
- Niu, X.; Yang, J.; Ma, J.-F. Ni/MoN nanoparticles embedded with mesoporous carbon as a high-efficiency electrocatalyst for detection of nitroimidazole antibiotics. Sensors and Actuators B: Chemical 2023, 387, 133819. [Google Scholar] [CrossRef]
- Li, J.; Li, Y.; Yang, Y.; Zhao, P.; Fei, J.; Xie, Y. Detection of luteolin in food using a novel electrochemical sensor based on cobalt-doped microporous/mesoporous carbon encapsulated peanut-like FeOx composite. Food Chemistry 2024, 435, 137651. [Google Scholar] [CrossRef]
- Li, Y.; Tang, J.; Lin, Y.; Li, J.; Yang, Y.; Zhao, P.; Fei, J.; Xie, Y. Ultrasensitive Determination of Natural Flavonoid Rutin Using an Electrochemical Sensor Based on Metal-Organic Framework CAU−1/Acidified Carbon Nanotubes Composites. In Molecules, 2022; Vol. 27.
- Wang, W.; Marshall, M.; Collins, E.; Marquez, S.; Mu, C.; Bowen, K.H.; Zhang, X. Intramolecular electron-induced proton transfer and its correlation with excited-state intramolecular proton transfer. Nature Communications 2019, 10, 1170. [Google Scholar] [CrossRef]
- Shih, Y.; Zen, J.-M.; Kumar, A.S.; Chen, P.-Y. Flow injection analysis of zinc pyrithione in hair care products on a cobalt phthalocyanine modified screen-printed carbon electrode. Talanta 2004, 62, 912–917. [Google Scholar] [CrossRef]
- Laviron, E. General expression of the linear potential sweep voltammogram in the case of diffusionless electrochemical systems. Journal of Electroanalytical Chemistry and Interfacial Electrochemistry 1979, 101, 19–28. [Google Scholar] [CrossRef]
Disclaimer/Publisher’s Note: The statements, opinions and data contained in all publications are solely those of the individual author(s) and contributor(s) and not of MDPI and/or the editor(s). MDPI and/or the editor(s) disclaim responsibility for any injury to people or property resulting from any ideas, methods, instructions or products referred to in the content. |
© 2024 by the authors. Licensee MDPI, Basel, Switzerland. This article is an open access article distributed under the terms and conditions of the Creative Commons Attribution (CC BY) license (http://creativecommons.org/licenses/by/4.0/).


