1. Introduction
A promising method for sequestration of atmospheric carbon is the injection of reactive fluids containing
into mafic or ultramafic rocks because it promotes reactions with silicates and the precipitation of carbonate minerals in the pores [
1,
2,
3,
4,
5]. However, the success of this method is still limited and the pathways to improve it are unclear due to the large number of open questions ranging from the transport of solutions in time-evolving porous media to the distribution of the carbonates in those media [
1]. Similar questions appear in natural processes of mineral dissolution and precipitation that affect porosity and fluid transport [
6,
7]. These phenomena motivated a large number of experimental and modeling studies in the last decades [
8,
9,
10,
11,
12,
13,
14,
15,
16,
17].
The initial steps of carbonate growth in rock pores or rock fractures consist of nucleation of crystals on surfaces of primary or secondary minerals [
10,
11,
12,
13,
14,
15,
16,
18,
19,
20,
21,
22]. A variety of crystal morphologies may appear, such as compact layers that cover the entire pore surface, isolated growing crystals, or disordered layers with nanoporosity. For instance, in experiments with the flow of supersaturated solutions in microporous quartz columns [
12] and in 1 mm diameter plexiglass tubes [
23], calcite grains with sizes
mm were deposited. However, there are also column experiments showing the growth of calcite coatings around sand grains [
13,
24] and barite layers covering
particles [
10], which shows that nontrivial mineral-substrate interactions control the shapes of the deposits. Other problems with nontrivial interactions are those with injection of supersaturated solutions of
and
and calcite growth: the injection into fractured samples containing calcite and dolomite predominantly leads to mineral grain formation on the calcite substrates [
14], but the flow in columns with calcite and aragonite grains mixed with glass beads leads to preferential growth of homogeneous layers on those substrates [
11]. In these and other column experiments, preferential growth at the column inlets is generally observed, possibly with fracture sealing, which means that obtaining significant mineralization in the whole pore space may be a difficult task.
The growth of calcite, quartz, and barite on fracture surfaces has been previously addressed with reactive transport models based on hydrodynamic equations of fluid or solute transport and on reaction rate laws obtained in laboratory works [
14,
17,
25,
26,
27,
28,
29,
30]. Some of these studies discuss growth patterns formed in the individual pores. The reactive transport equations are very useful to relate observations in several lengthscales, but they do not represent molecular scale processes at crystal surfaces which may be crucial in the initial steps of the mineralization when wetting layers or isolated mineral grains are formed. There are cases in which reactive transport equations cannot properly describe the patterns of dissolving surfaces at nano or microscale even if those equations account for the local surface slope [
31]. Instead, techniques such as kinetic Monte Carlo (KMC) simulations and scaling approaches are suitable for the description of crystal growth and dissolution at those scales [
32,
33]. For instance, they have successfully described stepwaves in dissolving etch pits [
34], smoothening of rough surfaces [
35], and dissolution rate spectra [
36].
Here we address a simple but nontrivial problem of calcite growth in conditions that may be relevant to technological and natural processes: the growth on fracture walls formed by the same mineral and in contact with a solution with approximately uniform saturation. This initial condition of the walls may occur either because a mineral layer has formerly precipitated on those walls or because that was the primary mineral in the sample. The uniform saturation is possible if the advective transport in the fracture gap is sufficiently fast to homogeneize the solution while precipitation occurs; this corresponds to a Damköhler number
[
37]. Although this is a relatively simple case in the scenario of mineral growth in rock fractures, it is an essential step before attempting to model more complex problems.
A combination of kinetic Monte Carlo (KMC) simulations and scaling methods will be used here to determine the evolution of the wall profiles until the growth ceases, the resulting fracture profiles (which are possibly sealed), and the time to attain these final configurations. The nanoscale model considers the random aggregation of molecules coming from the solution and a stochastic model that accurately represents molecule detachment from calcite surfaces [
38,
39]. The model parameters are calibrated by laboratory values of velocities of propagation of monolayer steps [
40,
41,
42]. The results are upscaled by considering the crystallographic orientations of the initial wall profiles and those velocities.
2. Materials and Methods
2.1. Approximation of the Calcite Crystal Structure
The structure of calcite crystals is simplified using the Kossel crystal approximation (simple cubic lattice) [
43], in which the lowest energy planes mimic the (10
4) surface of calcite. This approximation was recently used to determine far from equilibrium dissolution rates in alkaline environment which were in excellent agreement with experimental data [
38,
39]. Each lattice site represents one molecule with an edge length
nm in order to match the molar volume
/mol of the mineral in normal temperature and pressure. The rates of molecule detachment from a surface, given in Sec. 2.3, depend on the numbers
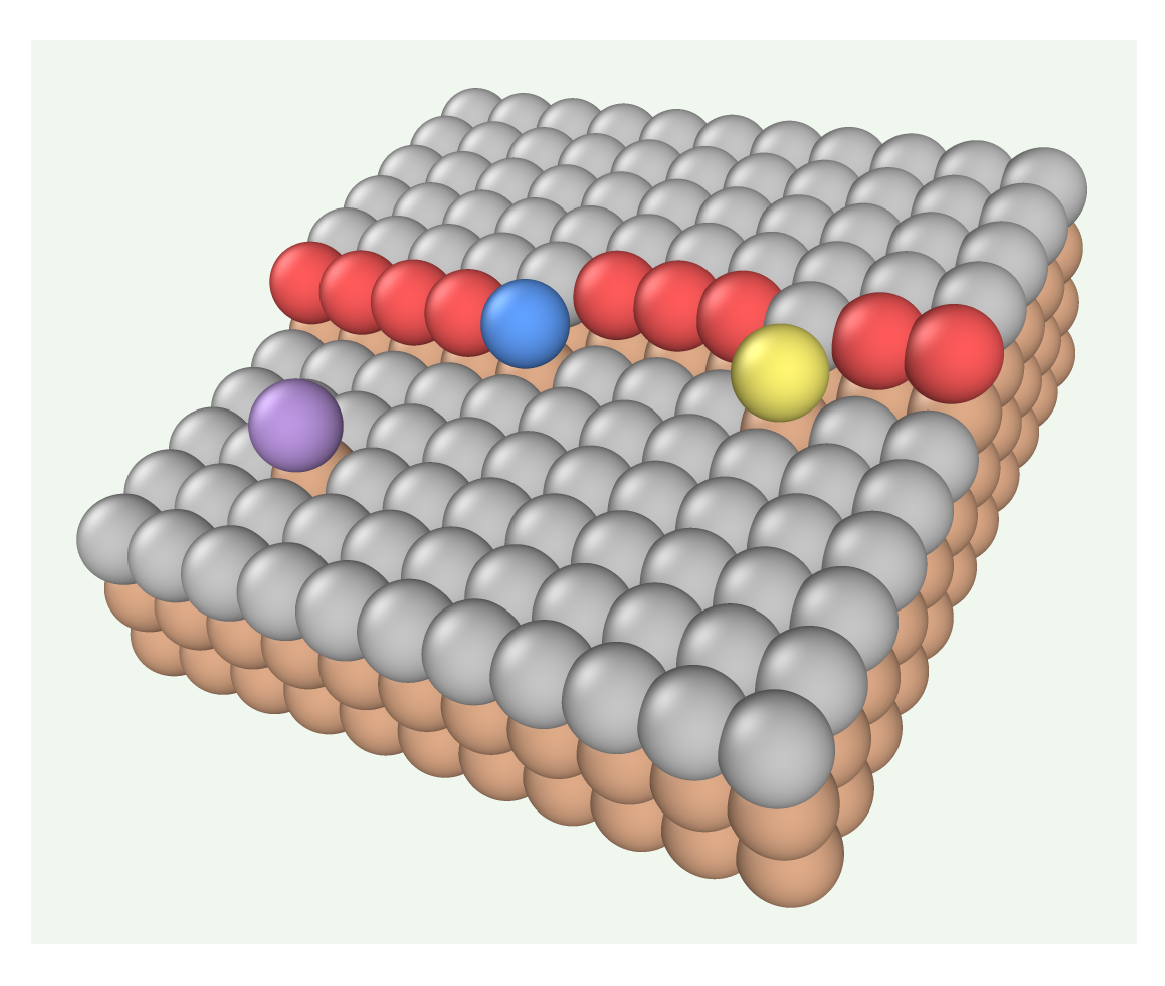
n of nearest neighbors (NNs) which are illustrated in
Figure 1. The terms kink, step, and terrace sites are used throughout the text to refer to sites with
, 4, and 5, respectively.
2.2. Fractures with Rough Walls
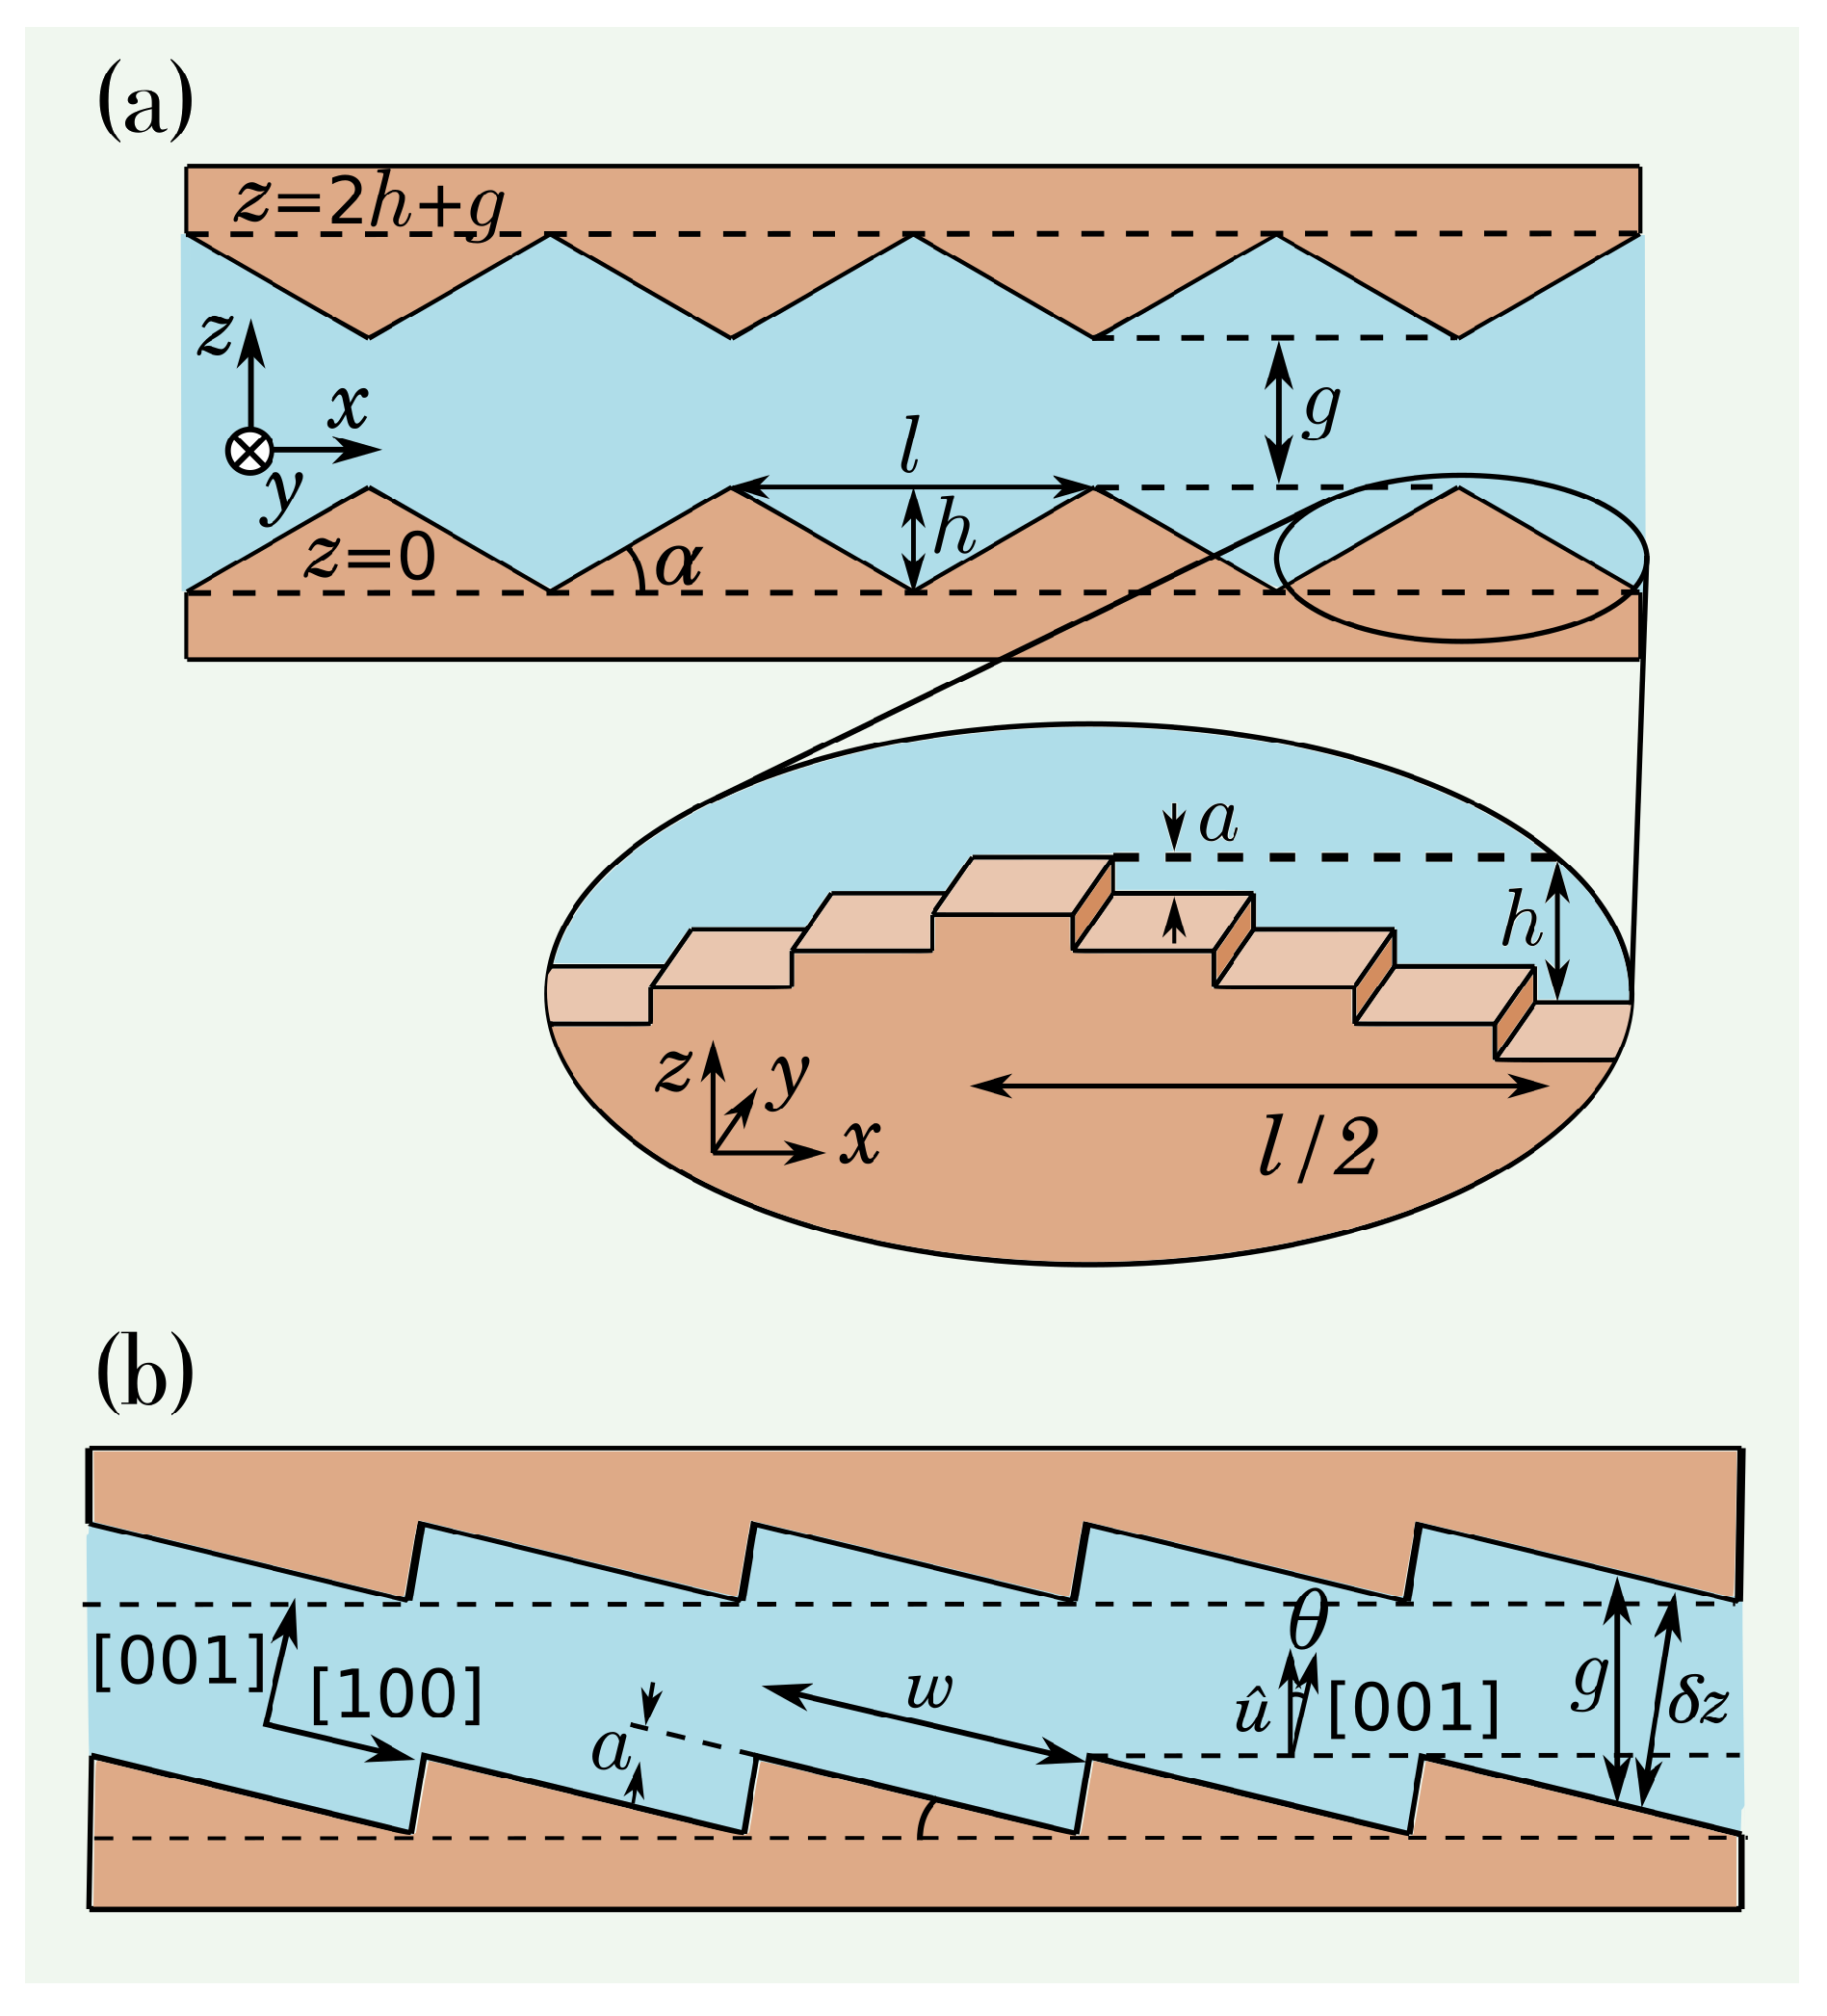
In the first model, the walls have a sequence of wedges whose
sections are schematically illustrated in
Figure 2(a). Each wedge has base length
l (
x direction), height
h (
z direction), and is symmetric under translation in the
y direction. The reference planes
and
are indicated at the bases and at the tips of the wedges in
Figure 2(a), where
g is the width of the gap between the tips. The wedge angle
is given by
The magnified zoom of
Figure 2(a) shows that wedges with small slopes (
or
) are formed by low energy (0,0,
) terraces separated by monolayer steps of height
a. The terraces at the wedge tips belong to the same low-energy planes (0,0,
) and the same occurs with the terraces at the wedge valleys.
The second model considers that the fracture walls are vicinal surfaces with equally separated monolayer steps and terraces of length
w oriented in [0,0,
] directions, as illustrated in
Figure 2(b). This is a typical configuration of cleaved calcite surfaces [
40]. The wall roughness is smaller than
nm. The vector normal to the bottom surface is denoted as
and forms an angle
with the [00
] direction, so that
Here we consider only cases of small angles:
. The gap
g between the walls is measured along the direction of
, as shown in
Figure 2(b). The separation
between the terraces in the same
x position is
In all geometries, we use the term column to denote the set of molecules of a wall with the same coordinates
and varying
z. For small slopes, only the molecule with the largest (smallest)
z of the bottom (top) wall is in contact with the solution.
In Sec. 3.3, a third model with fracture walls with random fluctuations and different crystallographic orientations is analyzed.
2.3. Model of Calcite Dissolution and Precipitation
We simulate the dynamics of calcite dissolution and precipitation by sequential events of detachment of calcite molecules (sites) from the crystal surface and attachment of new molecules at that surface.
The detachment model was formerly used to predict accurate values of the far-from-equilibrium dissolution rate of calcite grains and defect-free surfaces [
38,
39]. The detachment rate depends on the coordination number
n as
where
is a characteristic frequency,
,
E is an activation energy,
is the Boltzmann constant, and
T is the temperature. The room temperature parameters considered here are [
38]
The precipitation is assumed to occur through the random incidence of molecules on the columns
of the crystal surface. The flow rate
is defined as the average number of incident molecules on each column (bottom or top) per unit of time. This rate depends on the properties of the solution and is expected to be proportional to the product of activities of calcium and carbonate ions. However, the probability that an incident molecule actually attaches to the crystal is the sticking coefficient
s[
44], which depends on the properties of the surface and of the incoming ions; with probability
, the aggregation attempt is rejected. Thus, the attachment rate is
, where
s may depend on
. This dependence is determined in the Appendix using step propagation velocities from AFM studies.
Chemical equilibrium is achieved when the attachment rate matches the detachment rate of kink sites because the latter dominates the detachment processes [
45]. Assuming
in this equilibrium condition, we have
. The saturation ratio
of the solution indicates the depletion or excess of calcium and carbonate ions relatively to the equilibrium and is expected to be proportional to the flow rate
[
45], so that
Here the
model index indicates that this saturation is defined in terms of kinetic parameters which are expected to be proportional to thermodynamic activities.
The assumption of uniform attachment rates on the crystal surface is reasonable if a solution with constant ion concentrations is flowing through the fracture and if diffusion of those ions is sufficiently fast to homogeneize the solution between the surface protrusions and valleys. If the height difference between protrusions and valleys is of m and if a diffusion coefficient in solution of order is considered, the diffusion time across that height is of the order of one millisecond. However, the growth time of a calcite monolayer in our simulations is s, which is sufficiently long to warrant the solution equilibration between those points. This justifies the assumption of uniform attachment rates.
2.4. Quantities of Interest and Methods of Solution
The simulations of the lattice model are performed with an extension of the kinetic Monte Carlo algorithm by Meakin and Rosso [
46], which is summarized in Ref. [
35].
The wedge-shaped fractures typically have 4 wedges with angles from to and base length l from 40 nm to 4 m. The total length of the simulation cell is in the x direction and the width in the y direction is a constant nm. Periodic boundaries are considered in the x and y direction to avoid spurious effects of crystal edges. The vicinal surfaces have angles from to and total lengths in the x and y directions of nm.
During the simulations, we compute the numbers of detached and attached molecules, which give the net change
of the number of molecules in the solid at time
t. The dissolution rate
, in mol/(m
2s), is the change in the number of moles of the solid per unit of time and per unit of planar area, i.e. considering the projected area in the
plane:
where
is the change in
N in the time interval
and
is the Avogadro number.
In the simulations with wedge-shaped walls, we also calculate the ratio between
and the number
of molecules initially located between the reference planes
and
shown in
Figure 2(a). The value of
is given as
In a regime where growth occurs,
is a measure of the fractional filling of the valleys between the surface wedges.
3. Results and Discussion
3.1. Growth in the Fracture with Wedge-Shaped Walls
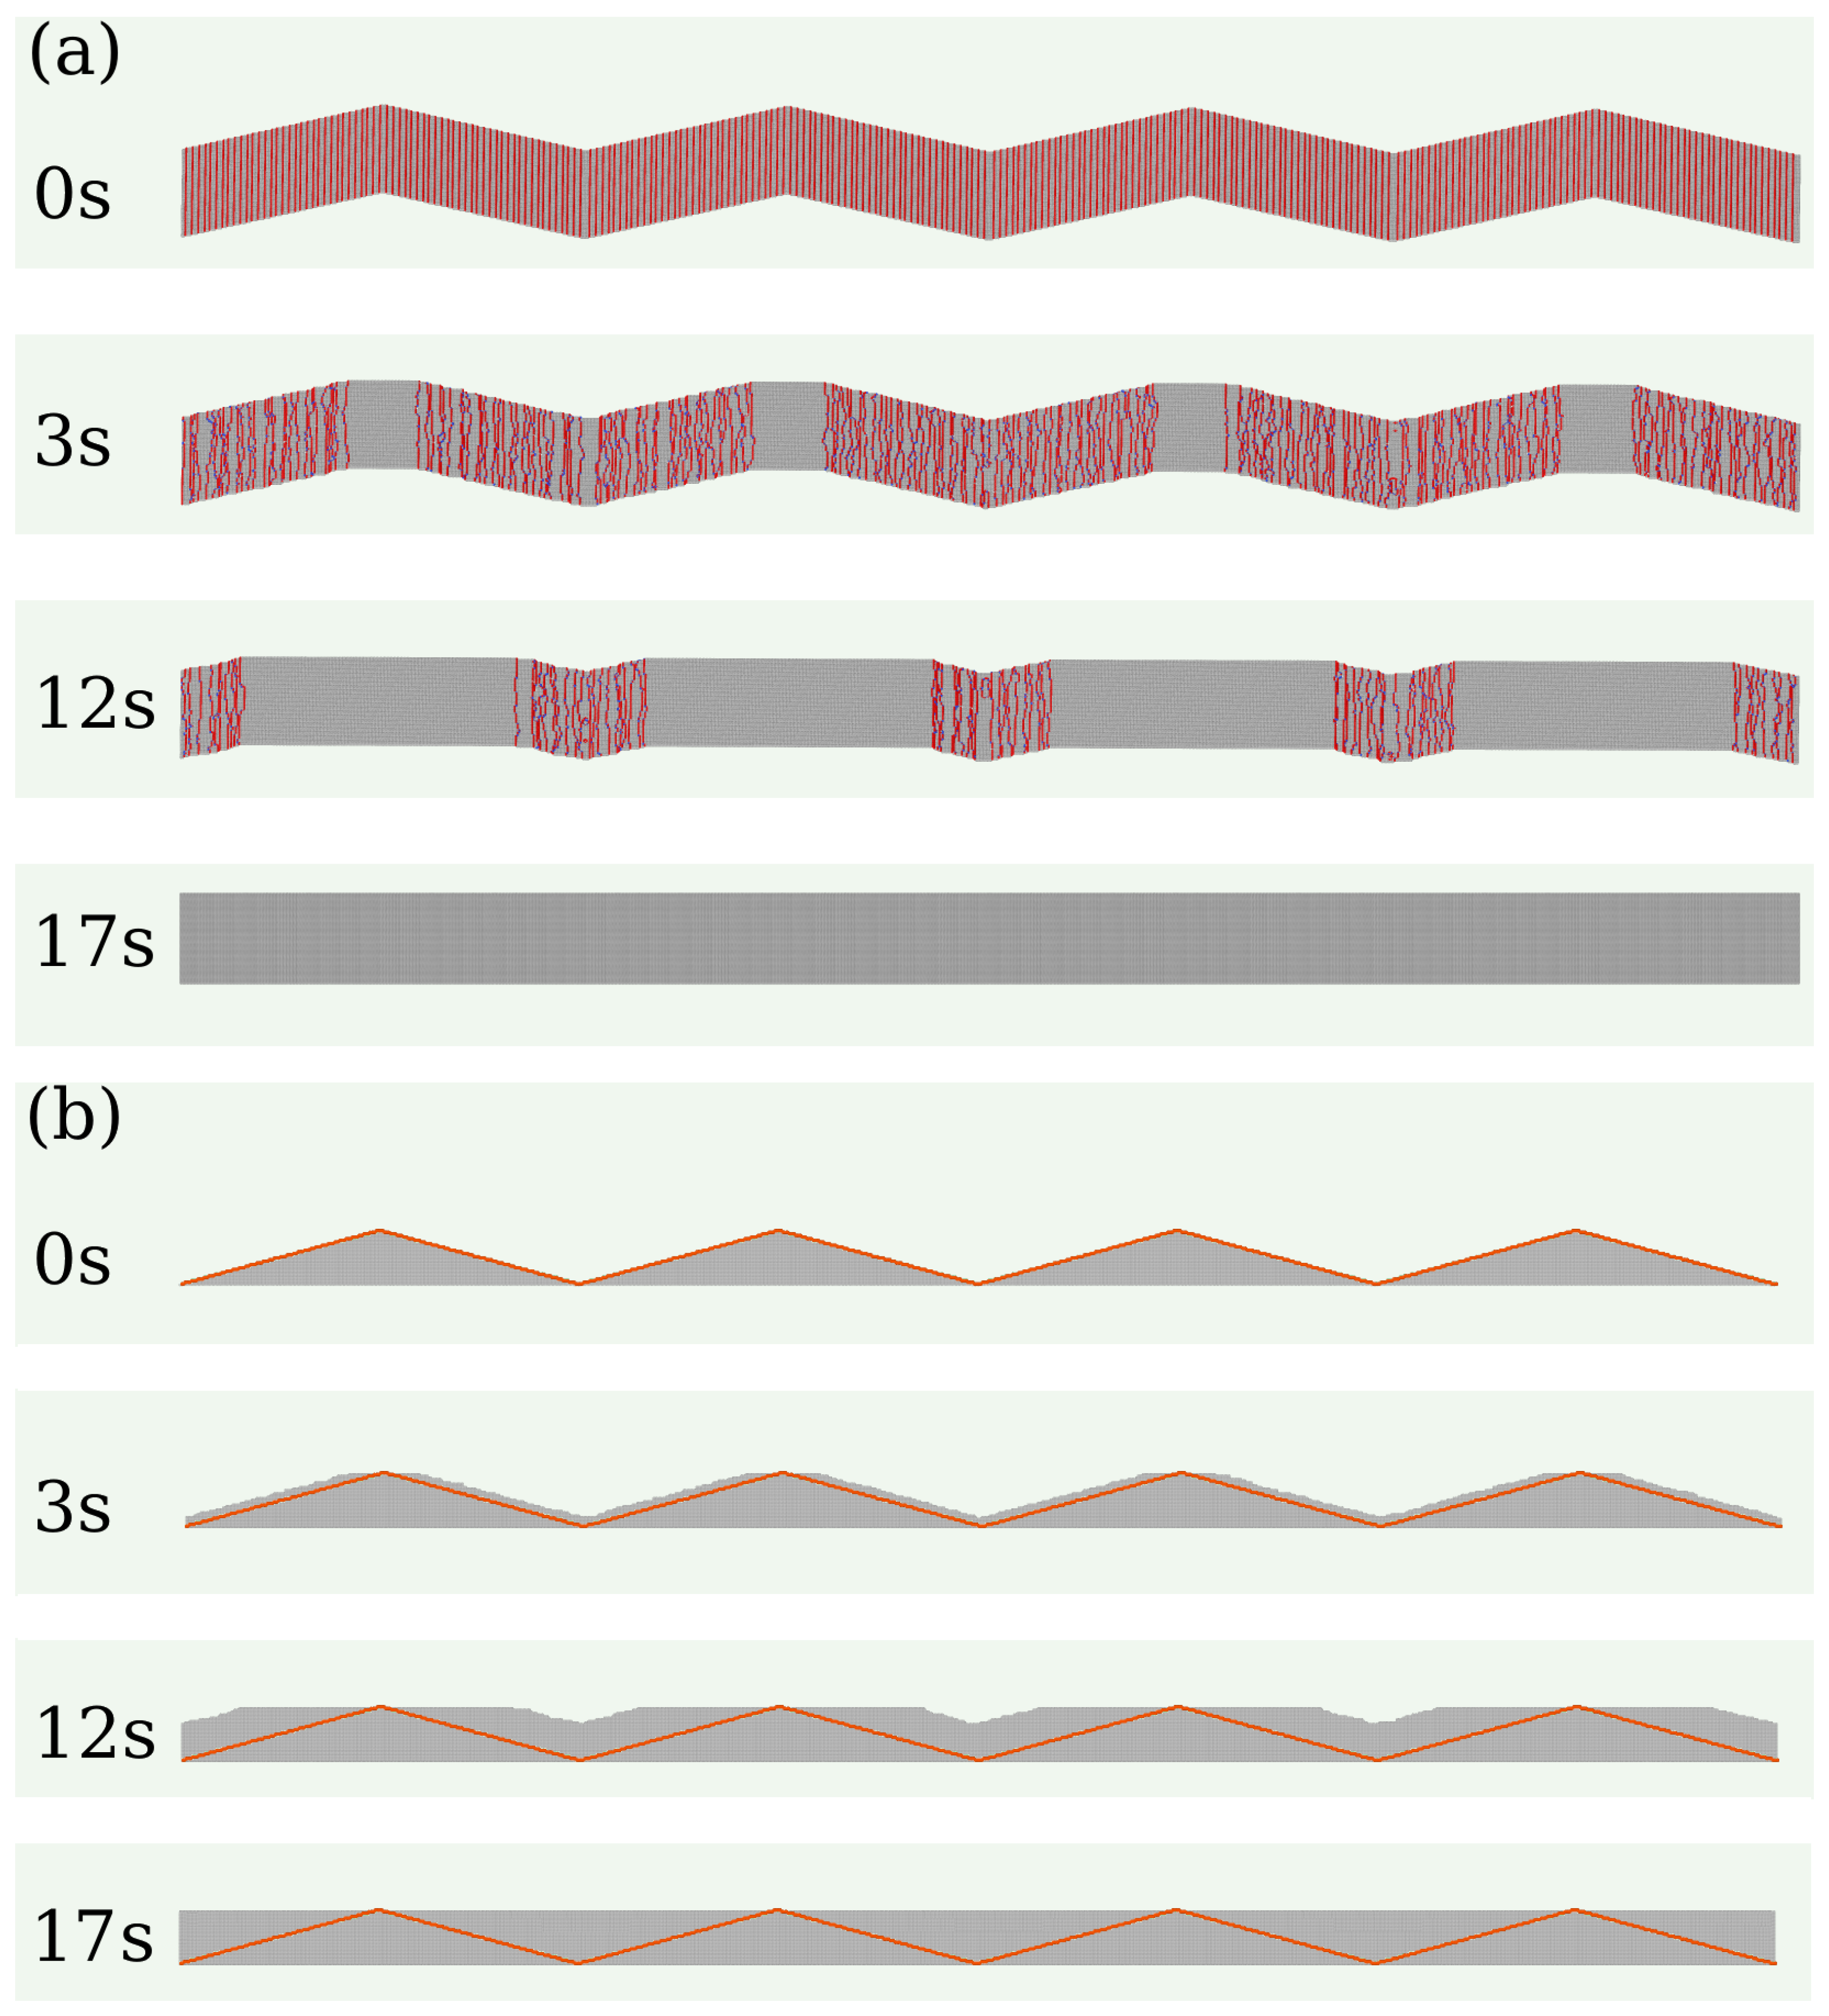
Figure 3(a) shows snapshots of a wedge-shaped wall during calcite growth under supersaturation with
.
Figure 3(b) shows the corresponding vertical cross-sections (
plane). These images show that the initial surface steps propagate laterally towards the center of the valleys between the wedges. This propagation occurs at all depths until opposite steps meet at a valley and form a low-energy plane; the valley then moves up a distance
a (the lattice constant). At the ridges, there is an expansion of the topmost terraces in
directions. The sharp morphology of the valleys does not change because the steps at all depths propagate with approximately the same velocity; this is revealed by comparison of the growing walls with the initial walls in
Figure 3(b). Although the detachment of molecules occurs and competes with the precipitation, no dissolution is visible at the scale of those snapshots.
Figure 4(a) shows the ratio
as a function of time for three saturation ratios near or at equilibrium,
, 1, and
. This shows that the dynamical equilibrium of molecule attachment and detachment is attained with a fine-tuning of the model parameters at
. Small deviations from this value lead to dissolution (
) or growth (
) at a global scale in times of minutes to a few hours, despite the competition between the aggregation and detachment of molecules in both cases.
Figure 4(b) shows
as a function of time for
and
. The positive slopes show that precipitation is dominant over dissolution at all times, but the downward curvatures indicate a slowdown of the growth rate. This occurs because opposite steps are continuously meeting at the valleys between the wedges, so the number of propagating steps that contribute to the growth rate decreases in time; see
Figure 3(a) and
Figure 3(b). The process eventually reaches a stationary state with
, in which the valleys are filled and the walls become flat (0,0,±1) surfaces. The unit value of this ratio corresponds to the full filling of the valleys and negligible dissolution, which is consistent with the longest-time snapshots in
Figure 3(a)-(b).
Figure 4(c) shows the evolution of the growth rate
k for the same parameters of
Figure 4(b) and confirms the decrease of that rate.
The time
in which the stationary state is attained is defined as the first time in which only terrace sites are present on the surface. The stationary value
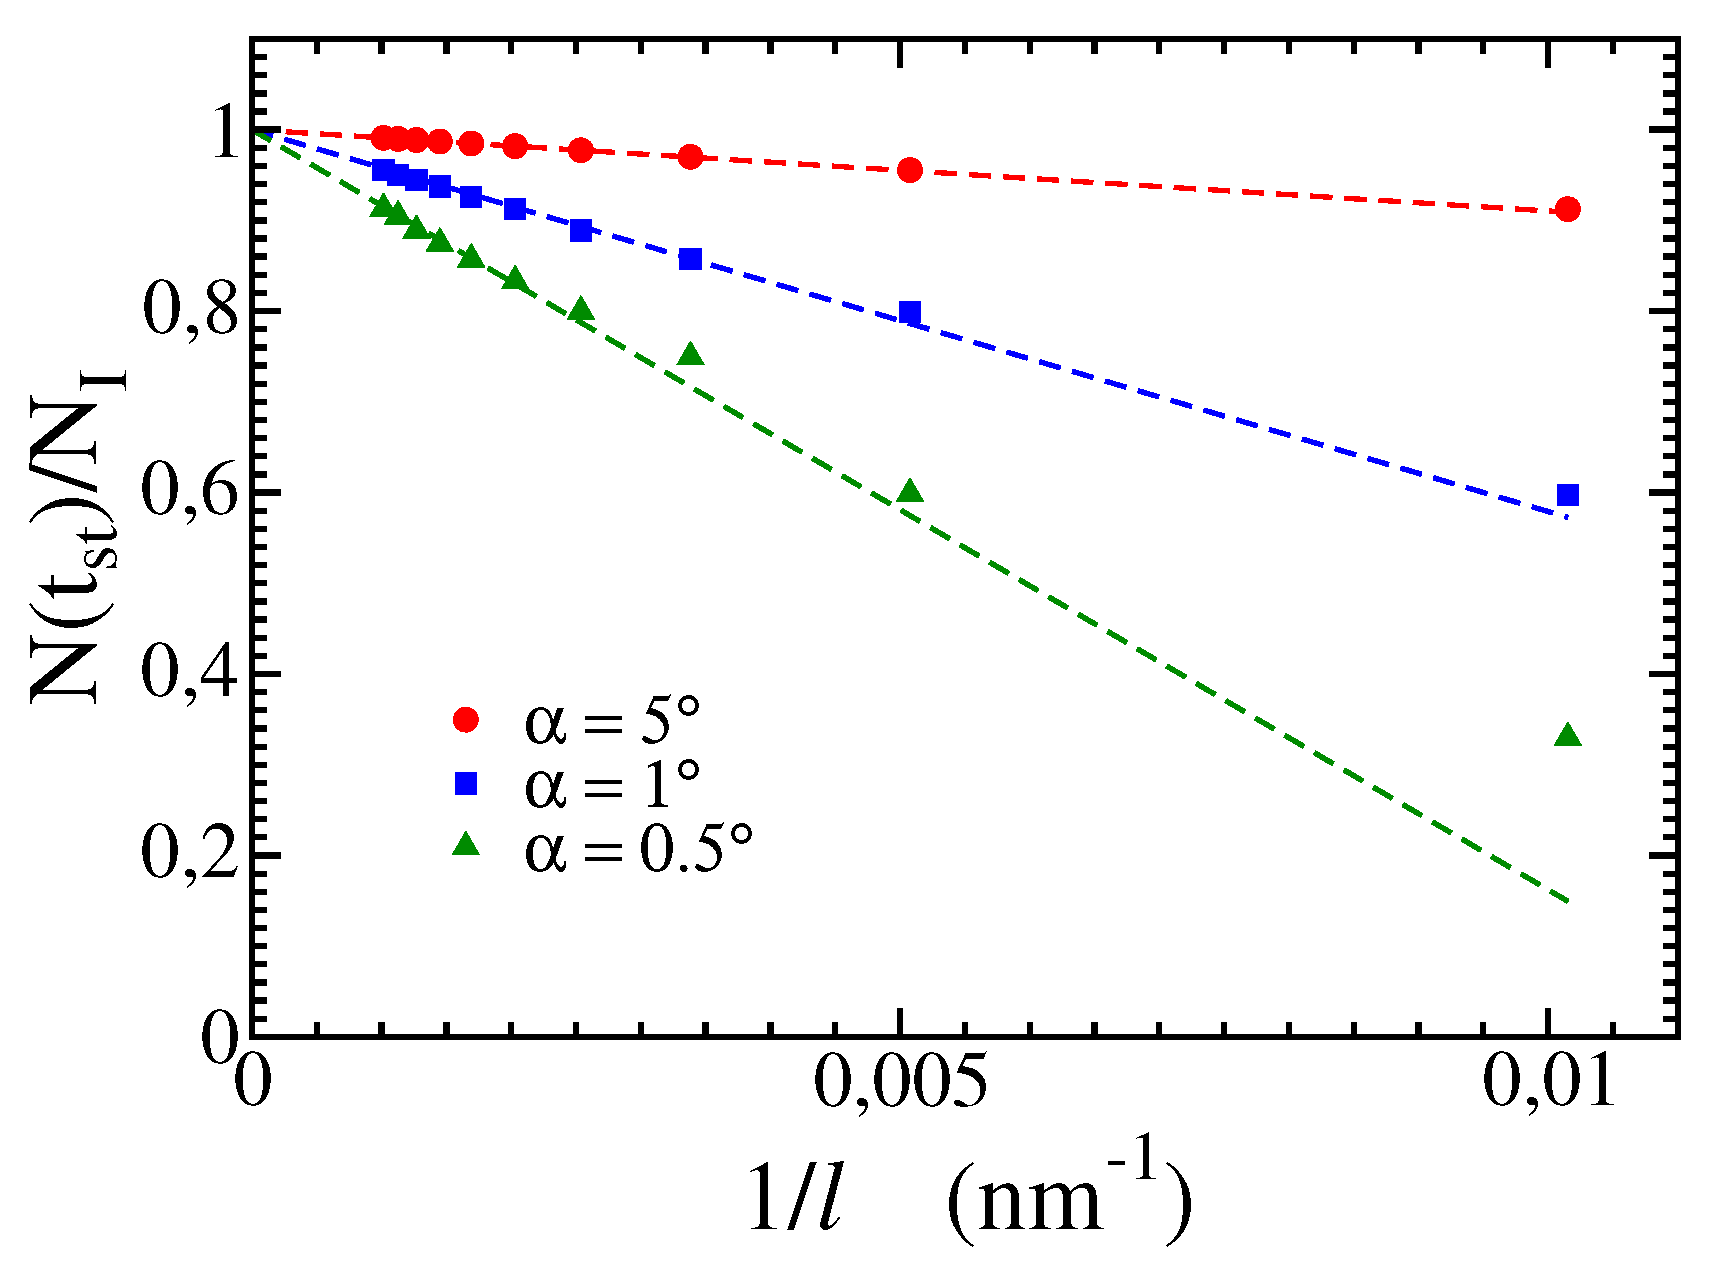
measured at that time is shown in
Figure 5 as a function of
(reciprocal of the length of a wedge) for three wedge angles. The extrapolations to
show that
. This limit is applicable to wedges with microscale lengths, in which
. In these cases, the initial valleys between the edges are fully filled with precipitated mineral, the dissolution of the initial walls is negligible, and the precipitation ceases when the walls become (0,0,
) terraces.
The zero growth rate on (0,0,) surfaces is a consequence of the fast detachment of molecules deposited on terraces, i.e. detachment rate much larger than the attachment rates , as discussed in the Appendix. Sequential deposition of two molecules at neighboring sites is highly unlikely in these conditions, which prevents crystal nucleation.
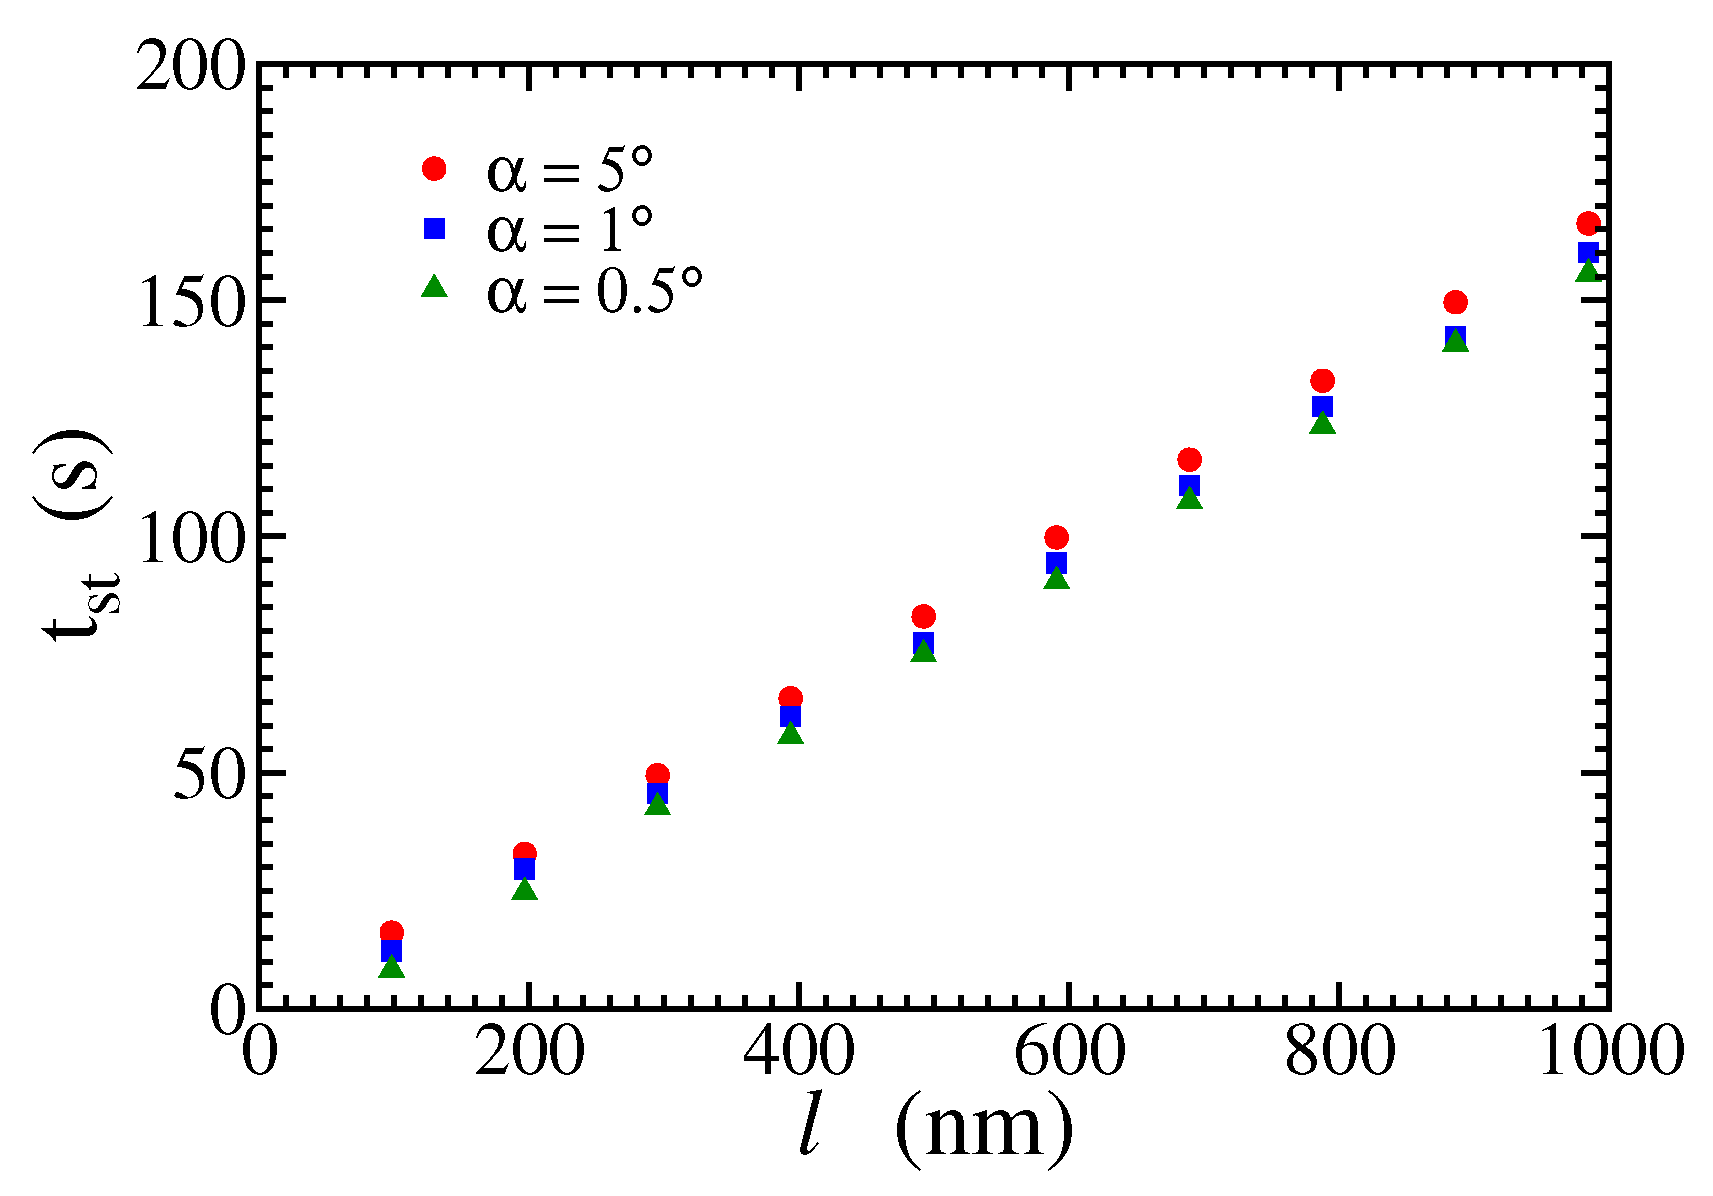
Figure 6 shows the time to reach the stationary state as a function of
l for three angles of the wedges and
. There is a linear relation between these quantities because the complete filling of the gap between two wedges occurs when the monolayer steps at the ridges meet. Denoting the velocity of those steps as
, it can be estimated as
From the reciprocal of the slopes of fits of
Figure 6 and Eq. (
9), we obtain
nm/s for
. This result is in good agreement with direct simulation of step propagation for the same saturation ratio, which gives
nm/s; see Appendix.
These results show that the lateral growth by step propagation occurs with approximately the same velocity at all depths of the wedges, from the tips to the valleys. At a hydrodynamic scale, the valleys have the highest surface curvatures [
Figure 2(a)], but this does not lead to faster growth at those points. Instead, the valleys slowly move up due to the lateral filling. Moreover, the wedge tips have the lowest curvatures at hydrodynamic scale, but this neither prevents the lateral growth nor favors dissolution because the tips are low-energy terraces at nanoscale.
Thus, at the hydrodynamic scale, step propagation is the mechanism that controls the growth, not the surface curvature. Eq. (
9) shows how this mechanism can be used to predict the time in which the precipitation is expected to cease. The mass of deposited material can also be easily calculated from the initial geometry. It is also important to observe that this fracture model [
Figure 2(a)] allows the gap of size
g to remain open for fluid flow after the growth ceases. This occurs because the initial tips are aligned in the same low-energy plane of the crystal. This result is valid even if the initial roughness of the walls is large.
As a final note, the above interpretations based on step propagation features are possible because the separation between the steps is large in the studied models (small angles
). This parallels the interpretations based on the stepwave model [
34], which is able e.g. to describe calcite dissolution rates controlled by etch pitting [
47]. However, when monolayer steps are close to each other, their interaction may lead to curvature effects as those observed when grain edges dissolve and become rounded [
31].
3.2. Growth in the Fracture with Vicinal Surfaces
Here we study mineral growth in fractures whose walls are vicinal surfaces [
Figure 2(b)], which have subnanoscale roughness but are not low energy surfaces.
Figure 7 shows cross sections of a fracture with
nm during the growth. Again, we observe that the gap is slowly filled by the propagation of surface steps, without nucleation of islands or three-dimensional crystals. However, contrary to the previous case, all steps in a wall propagate in the same direction, so they do not meet to form low-energy planes. Thus, the growth ceases only when steps of opposite walls meet and clog the fracture spacing.
The time for the fracture gap to be filled can also be calculated from the initial geometry and the step propagation velocity
at the chosen saturation. The average time for deposition of one layer of molecules in each wall is the time for a step to propagate to a distance
w, which is the distance between consecutive steps [
Figure 2(b)]:
During this time, the walls move a distance
a in the
z direction, so their growth velocity in that direction is
where Eq. (
2) was used. The gap between the walls is filled when the sum of the displacements of the two walls in the
z direction reaches the initial separation
[
Figure 2(b)]; using Eq. (
3) we obtain:
Observe that, for small angles
, the separation
and the gap width
g have approximately the same value [Eq. (
3)].
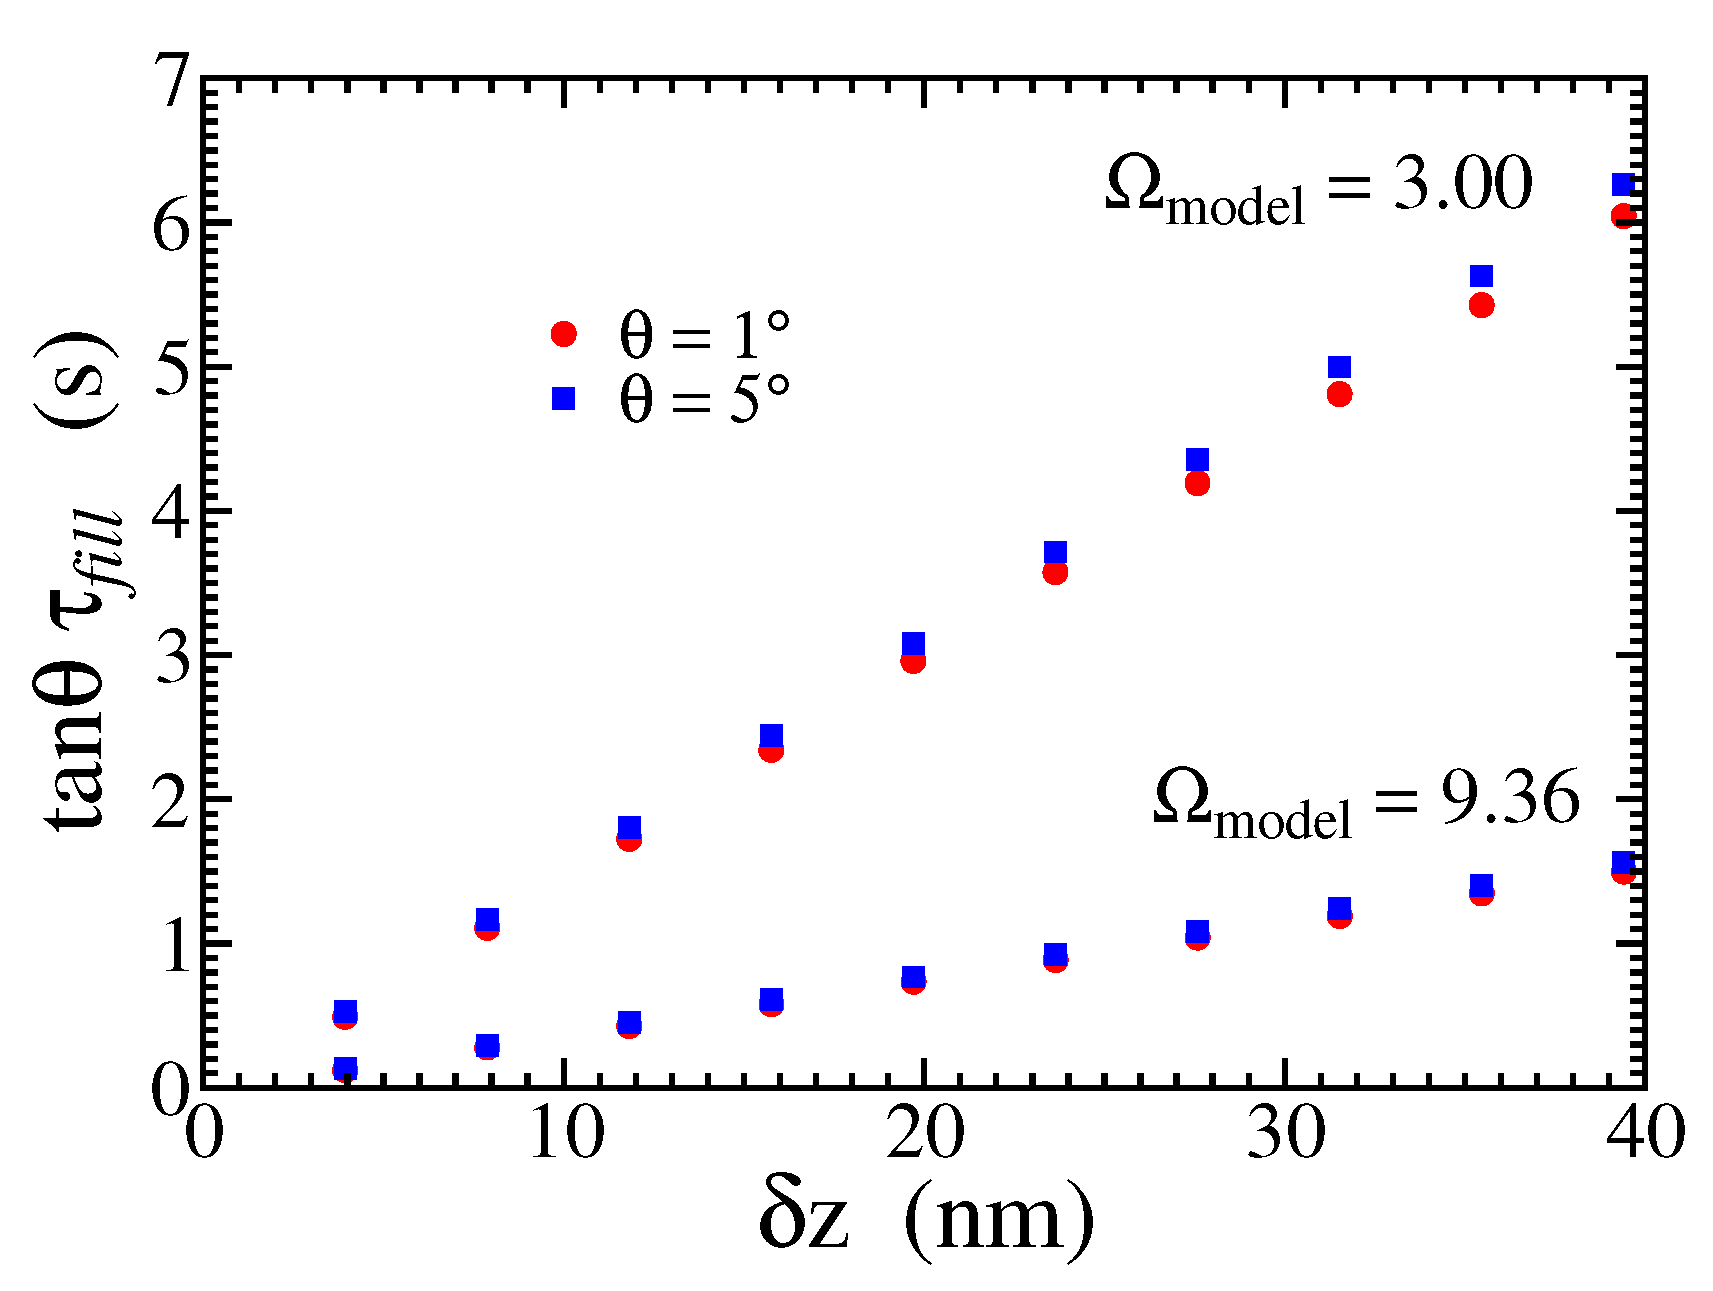
Figure 8 shows the values of the scaled time
as a function of the separation
obtained in KMC simulations for two angles and two saturations. The collapse of the data for the same saturation gives support to the prediction of Eq. (
12). From Eq. (
12), the reciprocal of the slopes of the linear fits of the plots in
Figure 8 are expected to be twice the step propagation velocity. This gives
nm/s and
nm/s for
and
, respectively, both in good agreement with the simulations of step propagation (see Appendix).
These results confirm the leading role of step propagation when a mineral is deposited in fracture walls. More importantly, they show that the fracture spacing is completely filled in conditions of very small initial roughness, in contrast to the case of rough wedge-shaped walls. This shows that the wall crystallography is much more important than the roughness to predict the final pore shape.
3.3. Growth in a Fracture with Rough Surfaces
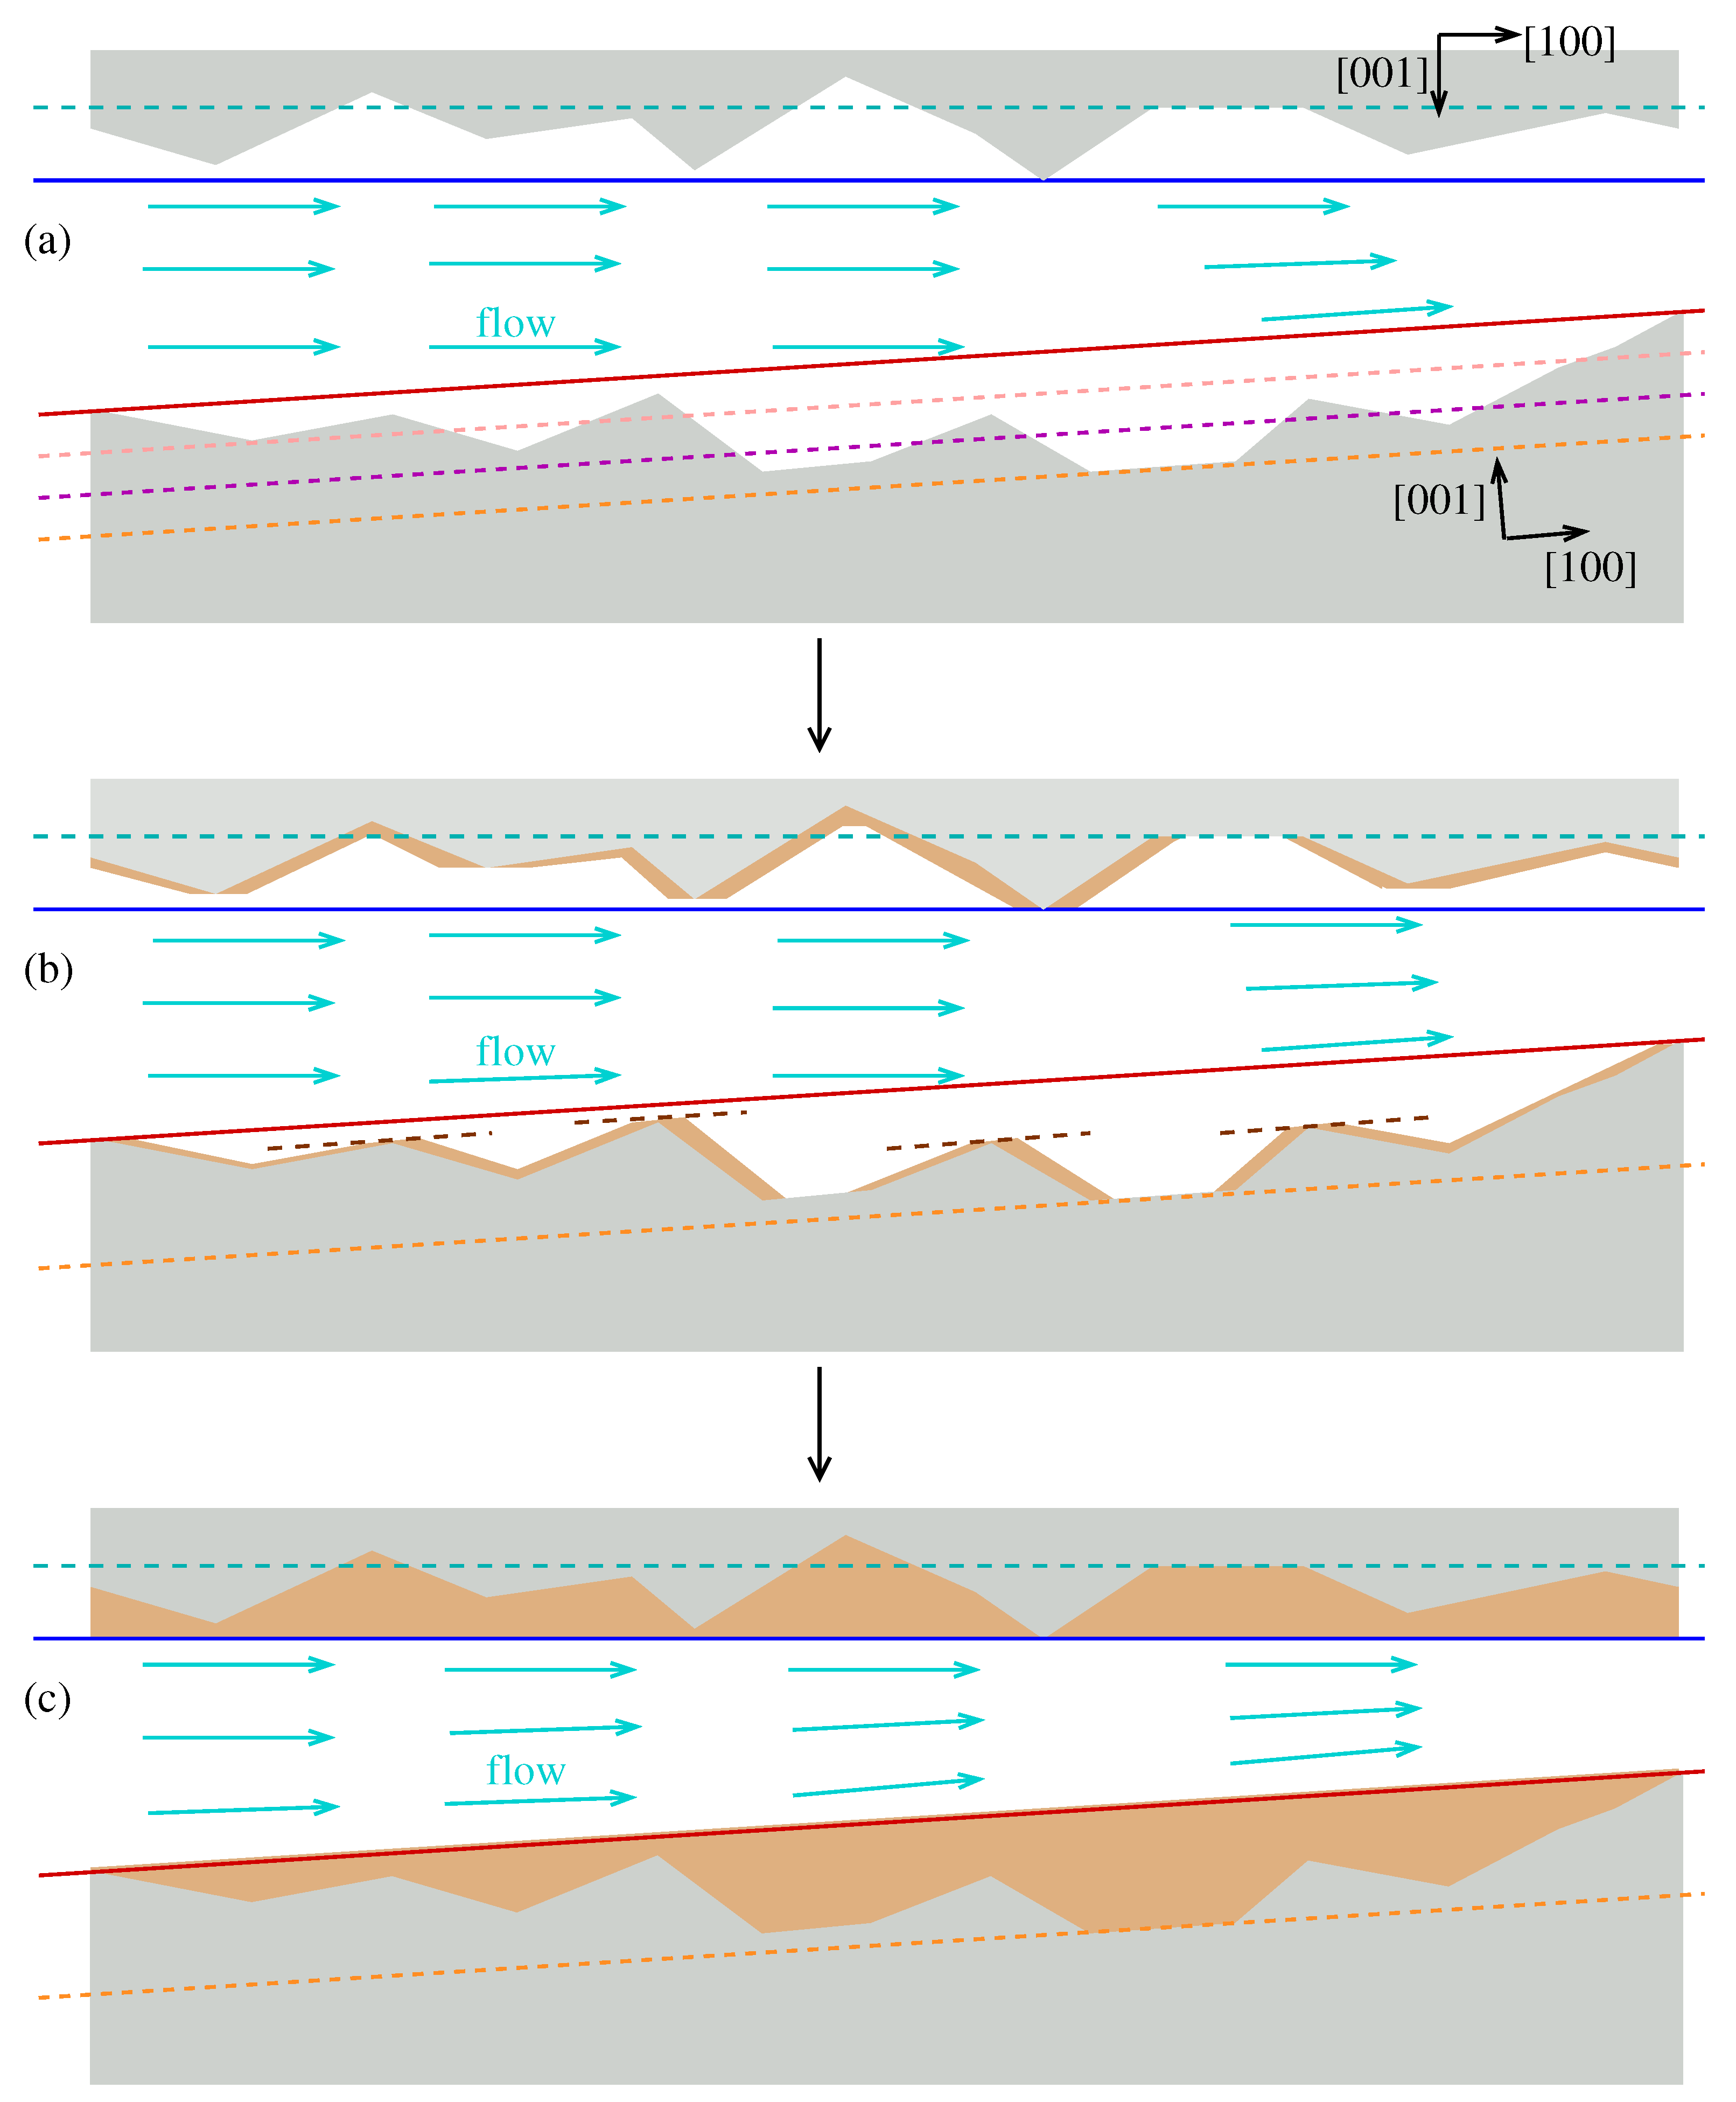
The growth on fracture walls is controlled by step propagation along the main crystallographic directions and this propagation ends only when steps moving in opposite directions meet and form low-energy terraces. A more general case of an initial fracture with the symmetry in the
y direction is shown in
Figure 9(a), with upper and lower crystals aligned in different orientations. The dashed lines across the whole image are some low-energy planes that cross the upper and lower walls. The two solid lines are the low-energy planes that cross the smallest density of molecules of each wall; geometrically, these planes intercept the wall cross sections in a minimal (but non-zero) number of points. The left and right ends of the lower crystal in
Figure 9(a) were chosen at two subsequent intersections with the smallest density plane (red line).
Figure 9(b) shows the walls after some time. In the lowest wall, dashed brown lines passing through the surface tips show that those tips laterally expand to form low-energy terraces, similar to what was observed in the wedge-shaped geometry [
Figure 3(a) and
Figure 3(b)]. The valleys may move up but they remain sharp. Similar features are observed in the upper wall. In both walls, observe that some wide valleys are low-energy planes that remain partially exposed in
Figure 9(b).
Figure 9(c) shows the configuration in which the two walls become low-energy planes and where no growth occurs. Those configurations are the initial low-energy planes with the smallest density of molecules because the most protuberant steps propagate along those planes until covering the intermediate parts of the surfaces. The velocity of step propagation (which depends on the saturation ratio) and the distance between those protuberances can be directly used to estimate the deposition time in that region. The average depth below those protuberances can be used to estimate the mass of deposited material.
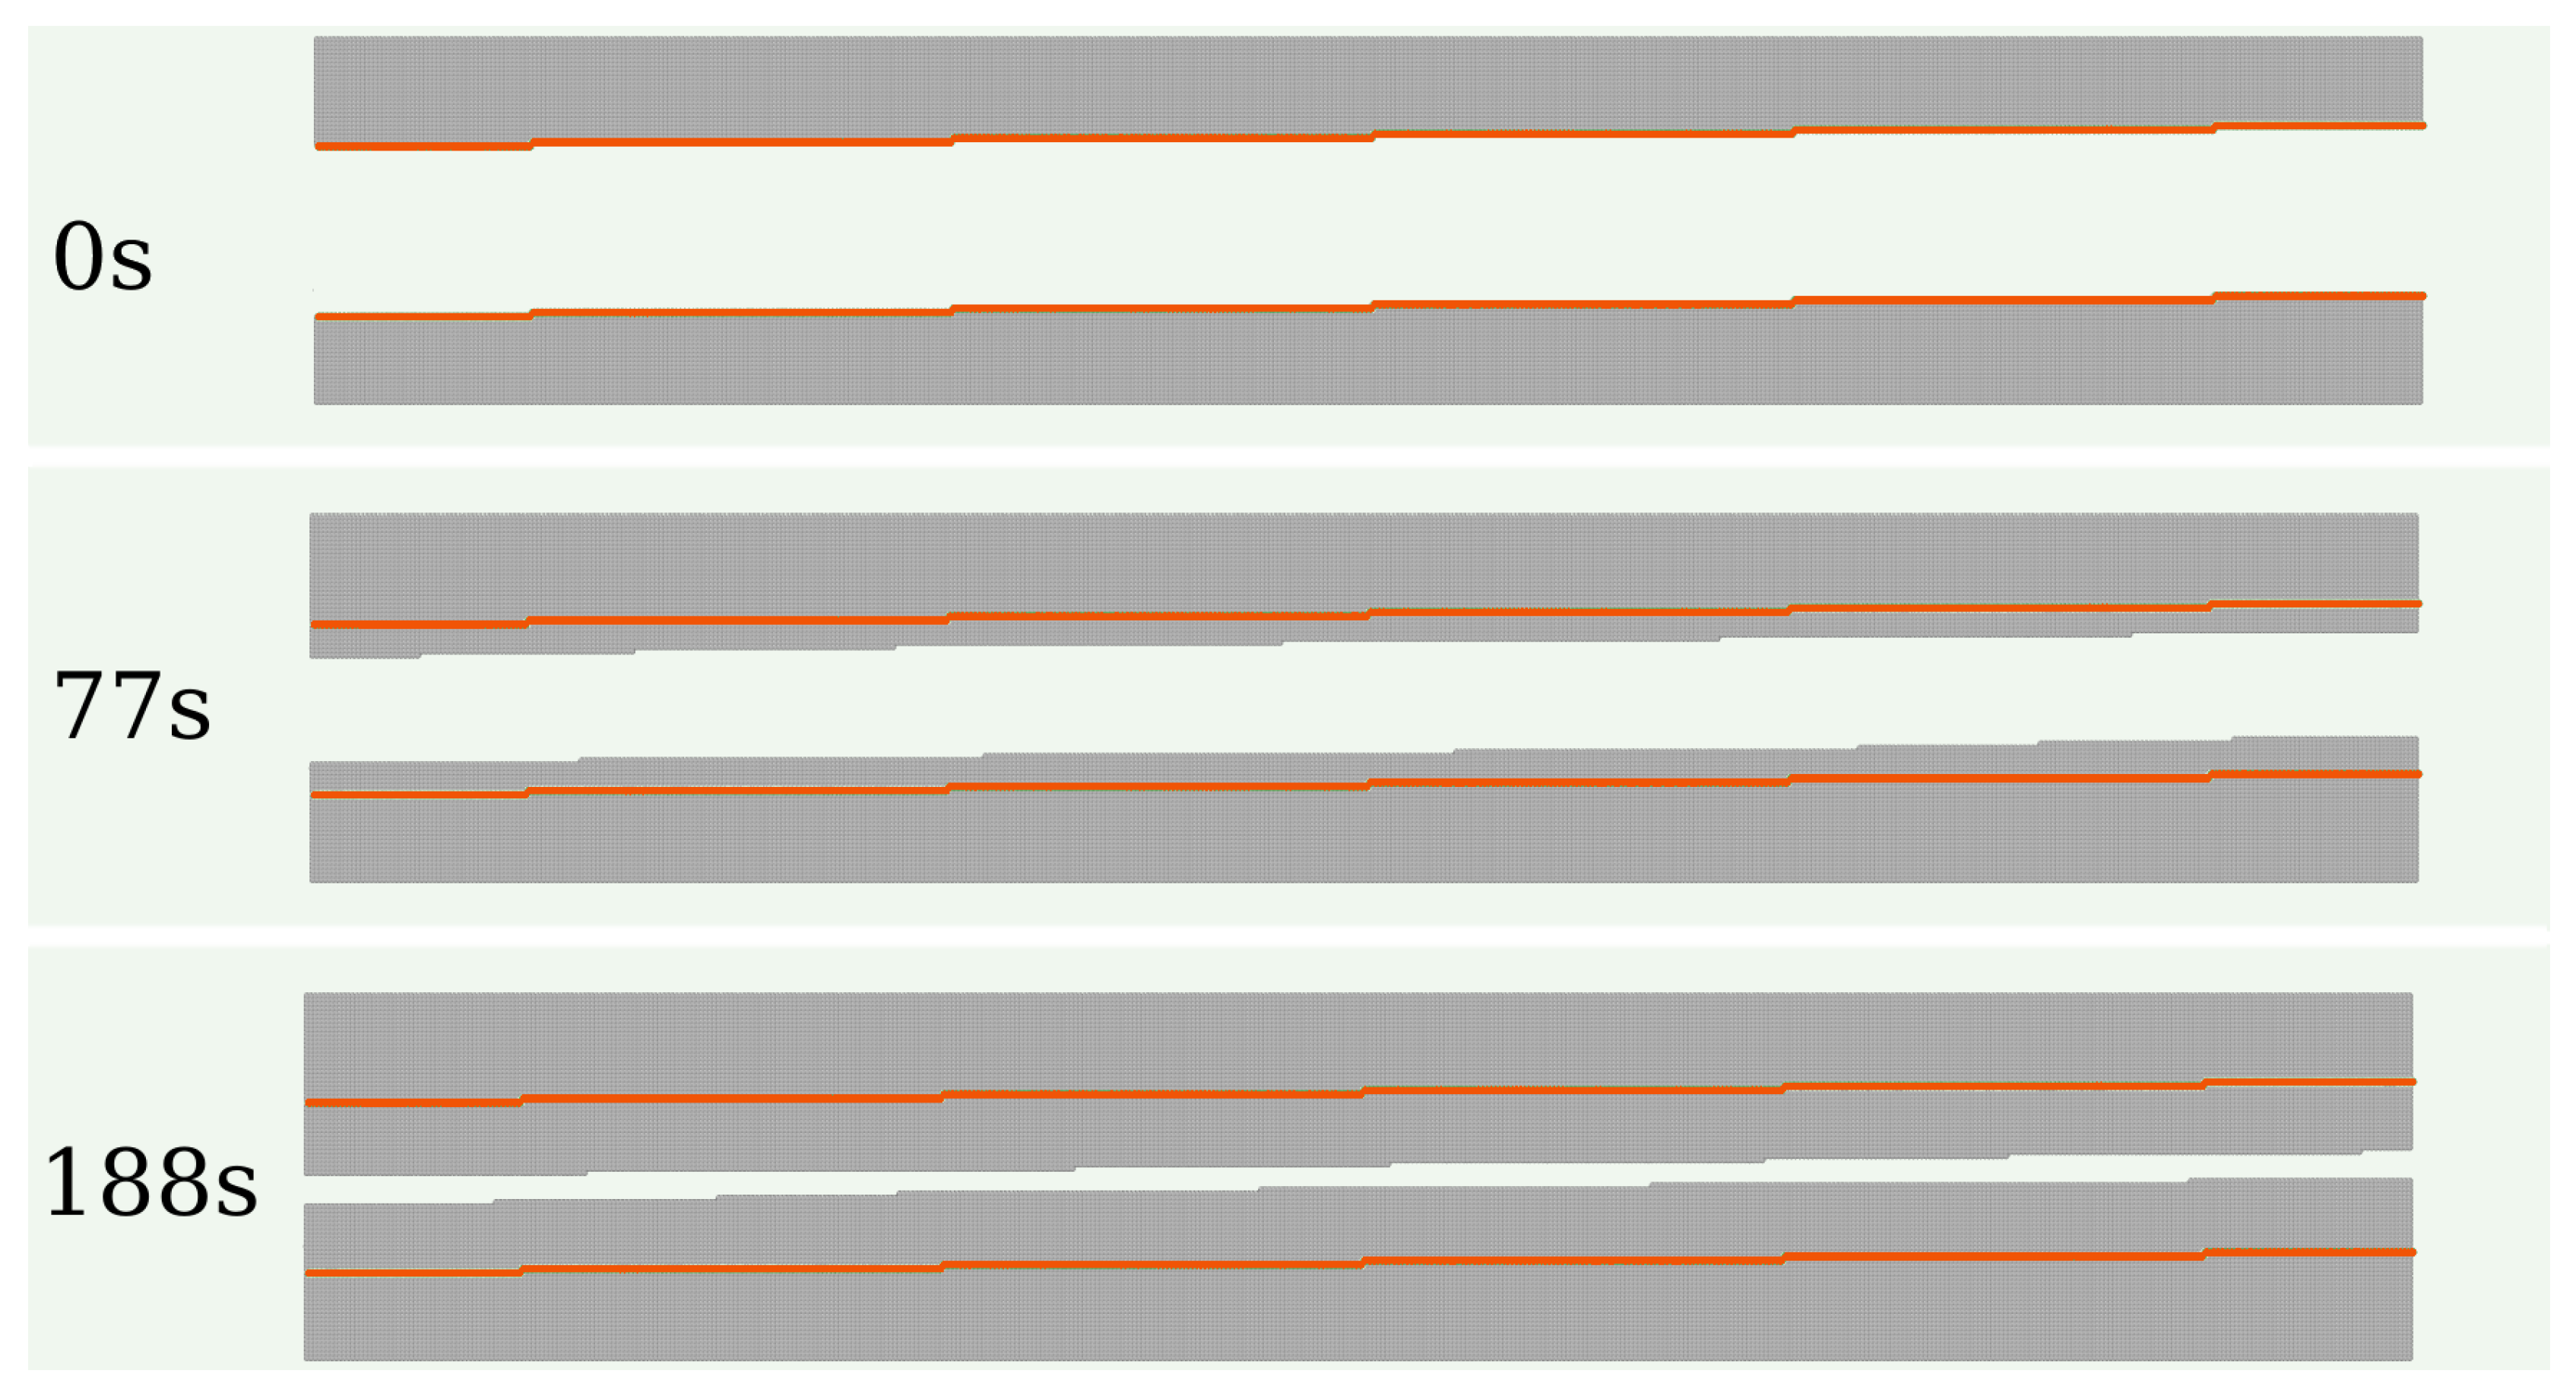
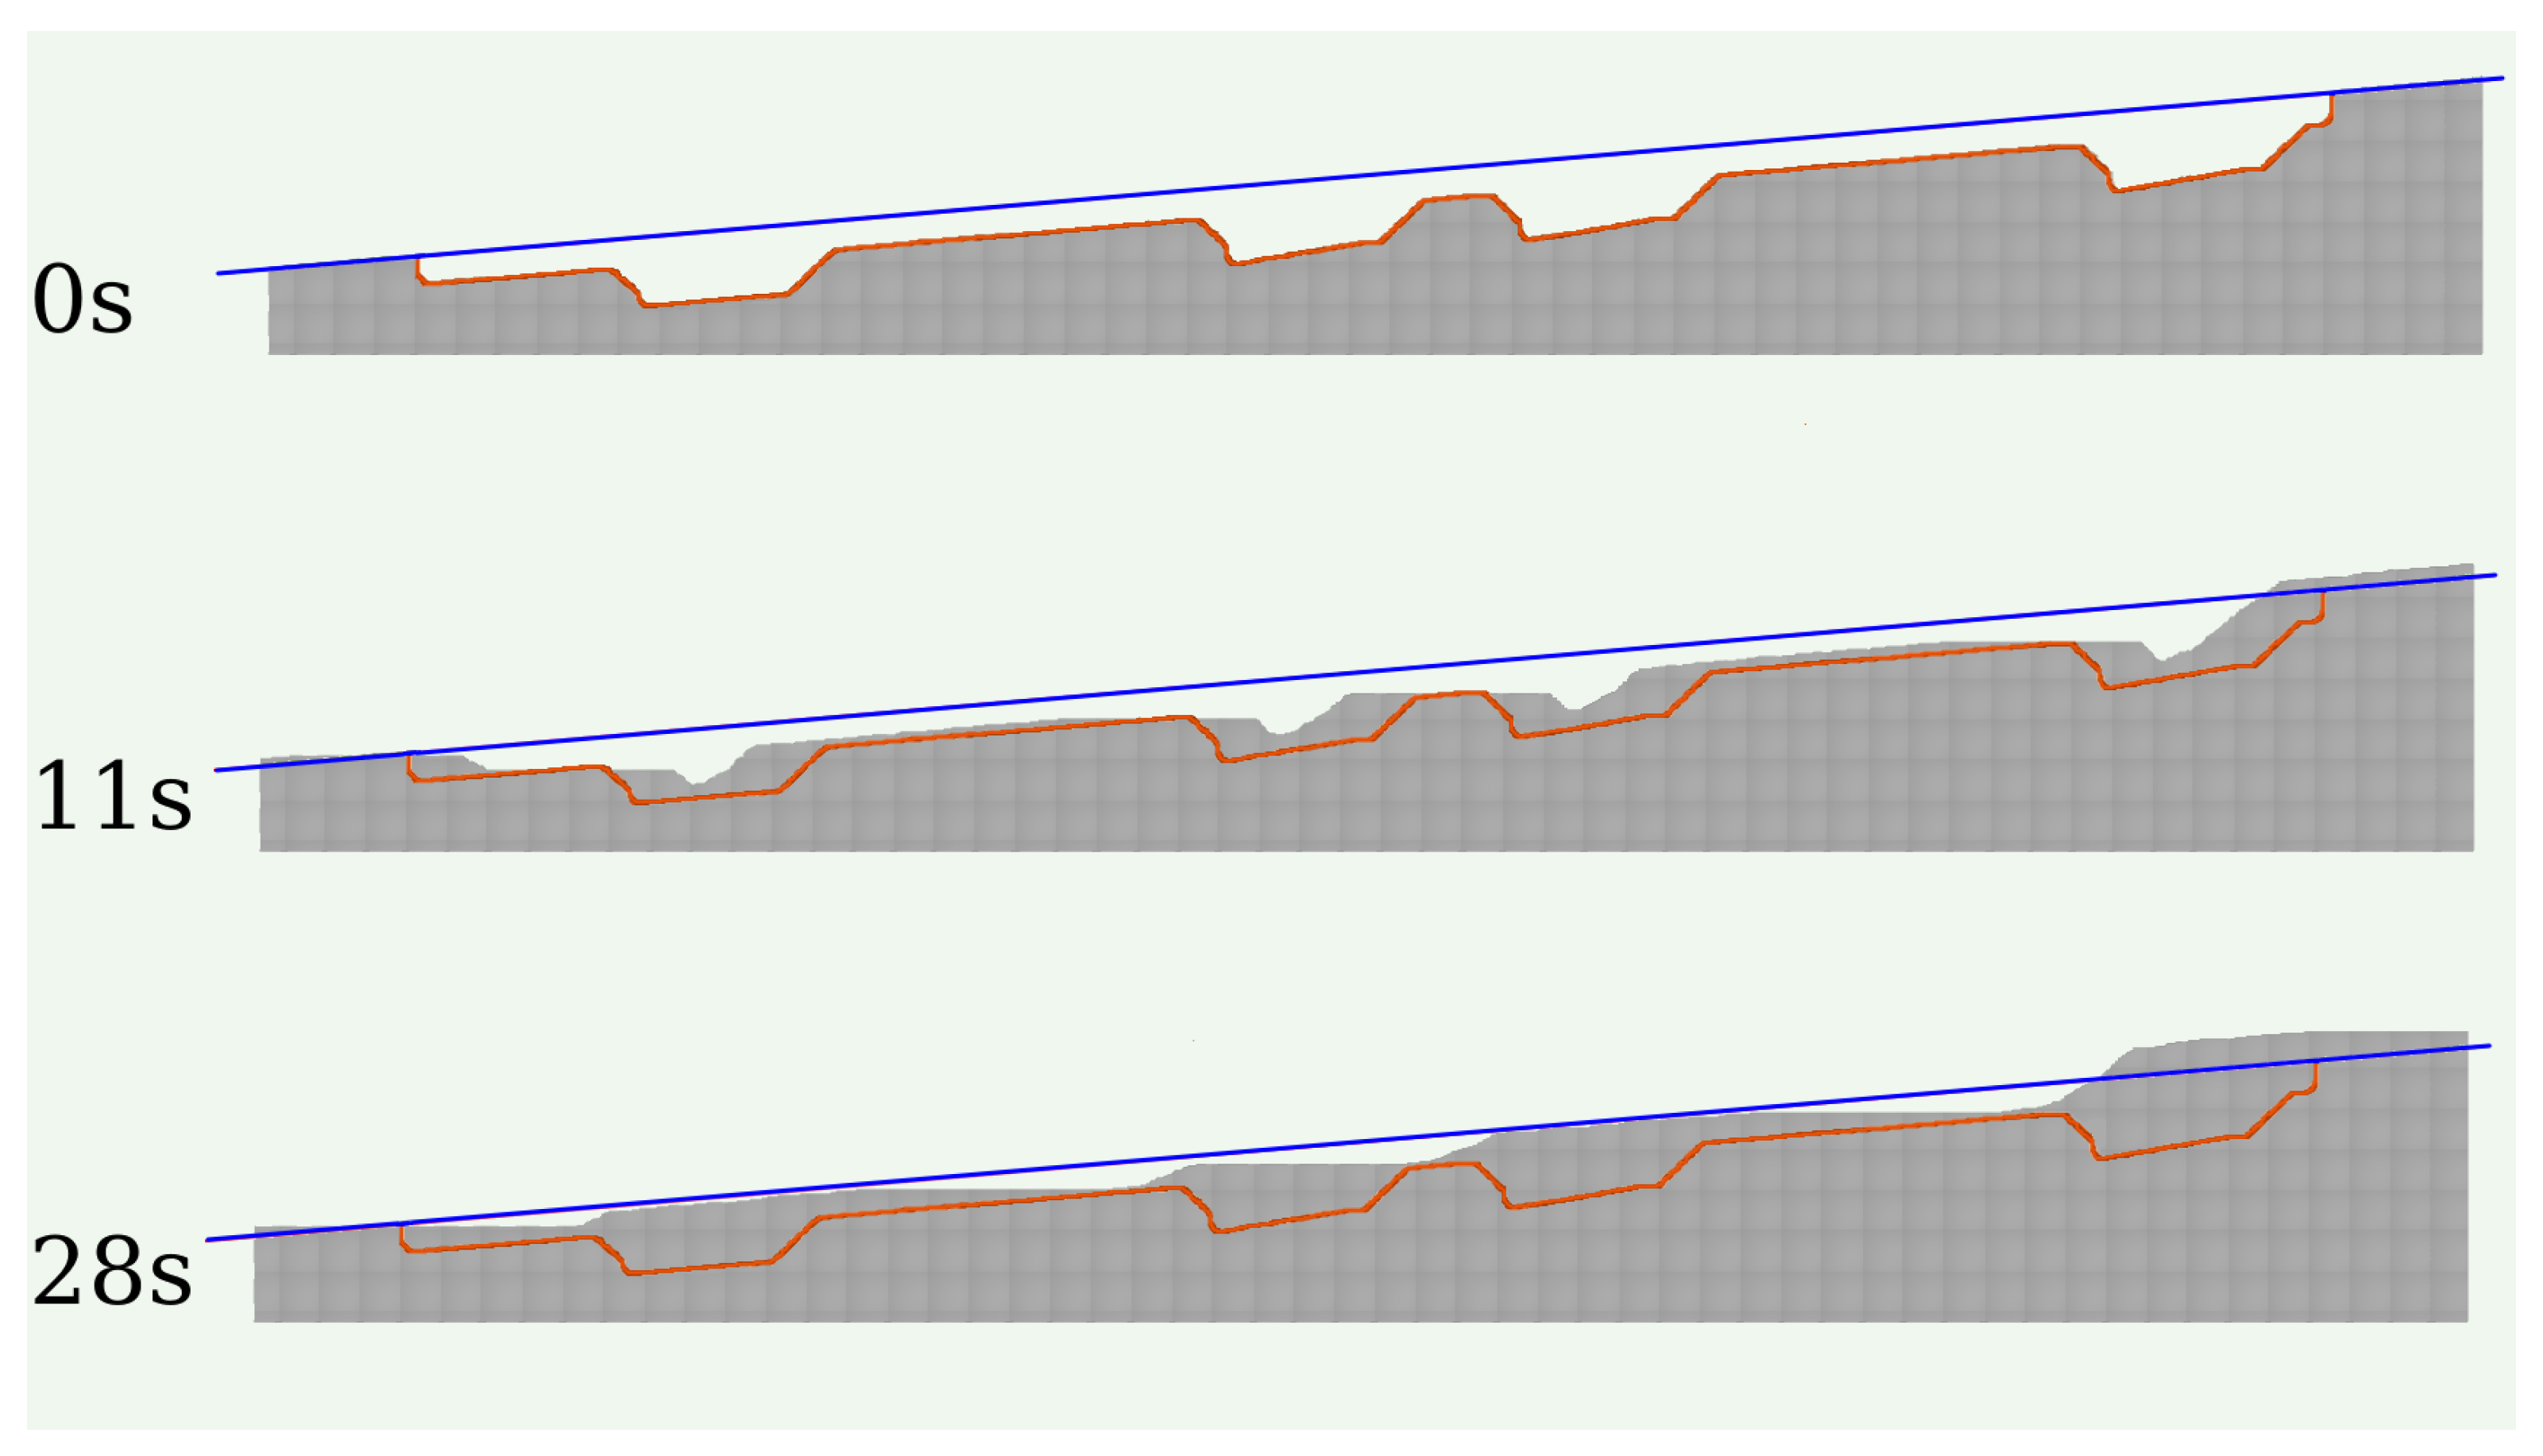
We also performed simulations of calcite growth on a wall with features similar to those of the lower wall of
Figure 9(a). The evolution of this simulated wall is shown in
Figure 10 and confirms the predictions of the previous schematic images. The only difference is that some steps enter at the right side in
Figure 10 because the highlighted region is part of a larger crystal.
4. Conclusions
The success of the permanent carbon sequestration process based on sub-surface mineralization critically depends on the dissolution and precipitation process within the fractures and pores of the host reservoir rocks. Under what conditions will mineralization occur on a given surface? How do these processes modify the transport processes? As mineralization occurs, is the flow of the charge through the rock matrix maintained or is it shut off? The work presented here has provided some initial clues to address these questions, informing potential constitutive relationships at nano and microscale that may be used in large (field) scale models aimed at predicting the permanent storage potential of a given reservoir.
Calcite growth was studied on fractures with walls of the same mineral and different roughness patterns, with special emphasis on (large roughness) wedge-shaped walls and (low roughness) vicinal surfaces. Kinetic Monte Carlo simulations of a model of attachment and detachment of molecules were performed and scaling approaches were used to interpret the numerical data, predict the final configurations of the deposits, and the time to reach them. The Kossel crystal approximation was used, in which the low-energy (104) surface of calcite is represented by (0,0,±1) planes.
The initially wedge-shaped walls had tips in the form of narrow terraces in the same low-energy plane and their lateral sides were terraces separated by monolayer steps (for small wedge angles). Growth took place by propagation of all those steps towards the valleys between the wedges. When opposite steps immediately above a valleys meet, they form a low-energy plane at that valley; the height of the valley is displaced of one lattice constant, while the other steps continue to propagate. The growth ceases when opposite steps coming from consecutive tips meet and the walls form a low-energy plane, possibly leaving an open gap in the center of fracture which allows fluid flow. The time to reach this final configuration can be calculated from the distance between those tips and the velocity of step propagation at the given supersaturation.
The walls with vicinal surfaces have equally separated monolayer steps and roughness below 1 nm. Growth also occurs by step propagation until opposite steps at opposite walls meet, which leads to pore clogging. We showed that the time to reach this configuration can be calculated from the initial distance between the steps, the gap width, and the step velocity.
We finally considered the case of fractures with random wall geometries and with possibly different crystalline orientations in the upper and the lower walls. In each wall, step propagation is also responsible for the lateral filling of surface valleys until the wall reaches the low-energy plane that has the smallest initial density of molecules. The deposited mass may be estimated by the average height of the valleys below this plane. This shows that the wall crystallography controls the growth, while the roughness or the local curvature are not suitable quantities to predict the final configurations at nanoscale. However, the framework based on the step propagation mechanism may be used to determine those configurations, the times to reach them, and the mass of deposited mineral.
Author Contributions
Conceptualization, F.D.A.A.R., V.R.V.; methodology, N.T.R., I.S.S.C., F.D.A.A.R.; software, N.T.R., I.S.S.C.; validation, N.T.R., I.S.S.C.; formal analysis, N.T.R., I.S.S.C., V.R.V. and F.D.A.A.R.; investigation, N.T.R., I.S.S.C., F.D.A.A.R.; resources, F.D.A.A.R., V.R.V.; data curation, N.T.R., I.S.S.C.; writing—original draft preparation, F.D.A.A.R.; writing—review and editing, N.T.R., I.S.S.C., V.R.V. and F.D.A.A.R.; visualization, N.T.R., I.S.S.C., F.D.A.A.R.; supervision F.D.A.A.R.; project administration, F.D.A.A.R.; funding acquisition, F.D.A.A.R., I.S.S.C., V.R.V.. All authors have read and agreed to the published version of the manuscript.
Funding
VRV is supported by the Center on Geo-processes in Mineral Carbon Storage, an Energy Frontier Research Center funded by the U.S. Department of Energy, Office of Science, Basic Energy Sciences at the University of Minnesota under award #DE-SC0023429. NRT is supported by the Brazilian agency FAPERJ (E-26/204.396/2021). ISSC is supported by the Brazilian agency FAPDF (00193-00001817/2023-43). FDAAR is supported by the Brazilian agencies CAPES (PrInt 88887.310427/2018-00), CNPq (442233/2023-0, 305570/2022-6), and FAPERJ (E-26/210.062/2023, E-26/201.050/2022).
Data Availability Statement
The data presented in this study are available on request from the corresponding author.
Conflicts of Interest
The authors declare no conflicts of interest.
Appendix A
Here we determine the sticking coefficient s of the model of molecule aggregation.
The equilibrium of dissolution and precipitation is well established by the relation
[
45], so
is a reasonable assumption in this condition. Growth occurs for
and
s depends on the physical properties of the growing surface. For very rapid growth,
, the surface properties are determined by the freshly deposited material and we assume that those properties become independent of the growth rate in that limit. Thus we propose a simple relation in which
s saturates for large
:
where
c and
are constants and
is given by Eqs. (
4) and (
5). For
,
s converges to the constant value
.
Using several values of
c and
, we performed room temperature simulations on large surfaces with monolayer steps, i.e. surfaces with the initial geometry of the walls in
Figure 2(b) and
.
Figure A1 shows the evolution of a region of the surface for
,
, and
[Eqs. (
6) and (
A1)]; the choice of these parameters will be justified below. The initial surface step propagates independently and has low roughness. There is no observable detachment of molecules on the terraces separating the steps; whenever this occurs, the pit is rapidly filled by attachment of a molecule from the solution. Similar results are obtained in a broad range of model parameters. This is in qualitative agreement with laboratory studies [
41,
42].
Figure A1.
Snapshots of a growing surface with initially separated monolayer steps () for , , and .
Figure A1.
Snapshots of a growing surface with initially separated monolayer steps () for , , and .
Notably, these results are not trivial from the point of view of stochastic growth modeling. If molecule detachment is absent, the random aggregation produces surfaces with Poisson distributions of heights and time increasing roughness (random deposition model) [
48,
49]. Thus, the smooth step propagation and absence of crystal nucleation on terraces is possible only because the detachment rates of molecules with low coordinations (
and 2) are large compared to deposition rates. For instance, the attachment rate is
[Eqs. (
4) and (
6)], which is in the range
for the saturations considered here. However, the molecules attached on the (0,0,
) terraces have a single NN (
), so their detachment rate is
, which is much larger than
. In simple words, in this model with random aggregation, the growth of smooth surfaces is possible only because
in Eq. (
5).
In a recent work [
38], the detachment rates of the model [Eqs. (
4) and (
5)] were determined by the velocities of dissolving monolayer steps of (10
4) calcite surfaces measured by AFM [
40]. Thus, here we will determine the parameters of the sticking coefficient for aggregation [Eq. (
A1)] by velocities of growing steps measured by the same technique [
41,
42]. Since we adopted the Kossel crystal approximation, we will use average values of velocities of acute and obtuse steps of (10
4) surfaces.
The comparison with AFM results of Sand et al [
42] for
and
gives
and
.
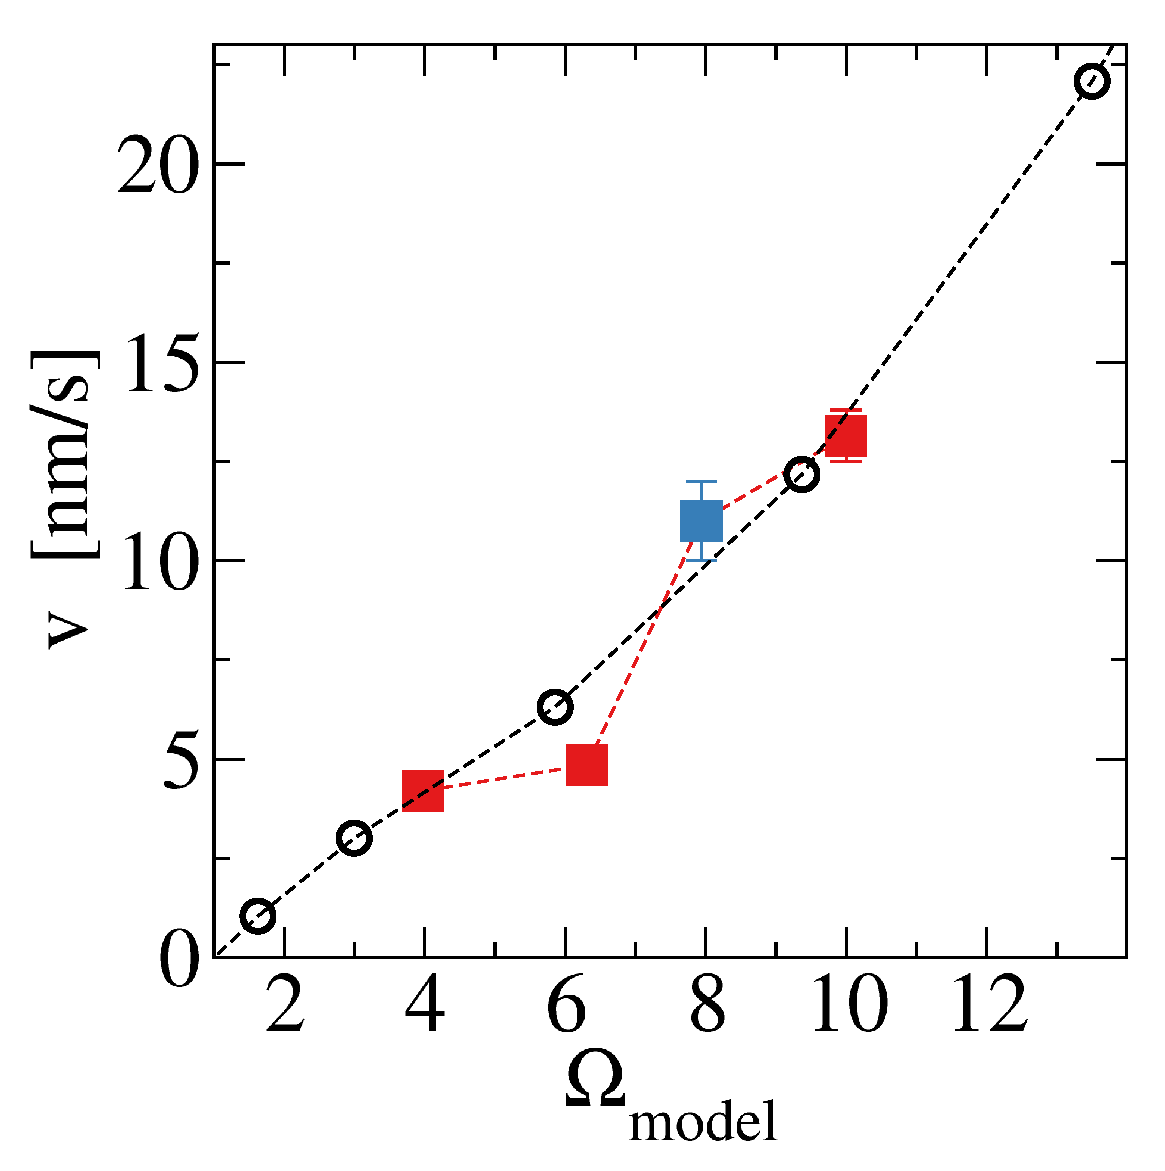
Figure A2 shows the velocities obtained with these parameters as a function of the saturation ratio
, the AFM velocities obtained in that work, and the velocity obtained by Hong et al [
41] for
. The good agreement shows the reliability of the model in the regime where molecule attachment dominates (
).
Figure A2.
Monolayer step velocity as a function of the saturation ratio obtained in simulations (black circles) and in AFM studies (blue filled squares [
41] and red filled squares [
42]).
Figure A2.
Monolayer step velocity as a function of the saturation ratio obtained in simulations (black circles) and in AFM studies (blue filled squares [
41] and red filled squares [
42]).
For the simulation of deposition in rough fractures, the results for two saturation values are particularly important: nm/s for ; nm/s for .
References
- Jun, Y.; Zhang, L.; Min, Y.; Li, Q. Nanoscale Chemical Processes Affecting Storage Capacities and Seals during Geologic CO2 Sequestration. Acc. Chem. Res. 2017, 50, 1521–1529. [Google Scholar] [CrossRef] [PubMed]
- Xu, R.; Li, R.; Ma, J.; He, D.; Jiang, P. Effect of Mineral Dissolution/Precipitation and CO2 Exsolution on CO2 transport in Geological Carbon Storage. Acc. Chem. Res. 2017, 50, 2056–2066. [Google Scholar] [CrossRef] [PubMed]
- Jiang, H.; Economou, I.G.; Panagiotopoulos, A.Z. Molecular Modeling of Thermodynamic and Transport Properties for CO2 and Aqueous Brines. Acc. Chem. Res. 2017, 50, 751–758. [Google Scholar] [CrossRef] [PubMed]
- Linke, T.; Oelkers, E.H.; Möckel, S.C.; Gislason, S.R. Direct evidence of CO2 drawdown through enhanced weathering in soils. Geochem. Persp. Let. 2024, 30, 7–12. [Google Scholar] [CrossRef]
- Oelkers, E.H.; Gislason, S.R. Carbon Capture and Storage: From Global Cycles to Global Solutions. Geochemical Perspectives 2023, 12, 179–349. [Google Scholar] [CrossRef]
- Putnis, A. Transient Porosity Resulting from Fluid-Mineral Interaction and its Consequences. In Reviews in Mineralogy and Geochemistry; Mineralogical Society of America, 2015; Vol. 80, pp. 1–23. [CrossRef]
- Addassi, M.; Hoteit, H.; Oelkers, E.H. The impact of secondary silicate mineral precipitation kinetics on CO2 mineral storage. Int. J. Greenhouse Gas Ctrl. 2024, 131, 104020. [Google Scholar] [CrossRef]
- Luquot, L.; Gouze, P. Experimental determination of porosity and permeability changes induced by injection of CO2 into carbonate rocks. Chem. Geol. 2009, 265, 148–159. [Google Scholar] [CrossRef]
- Luquot, L.; Rodriguez, O.; Gouze, P. Experimental Characterization of Porosity Structure and Transport Property Changes in Limestone Undergoing Different Dissolution Regimes. Transp. Porous Med. 2014, 101, 507–532. [Google Scholar] [CrossRef]
- Godinho, J.R.A.; Gerke, K.M.; Stack, A.G.; Lee, P.D. The dynamic nature of crystal growth in pores. Sci. Rep. 2016, 6, 33086. [Google Scholar] [CrossRef]
- Noiriel, C.; Steefel, C.I.; Yang, L.; Bernard, D. Effects of pore-scale precipitation on permeability and flow. Adv. Water Resour. 2016, 95, 125–137. [Google Scholar] [CrossRef]
- Godinho, J.R.; Withers, P.J. Time-lapse 3D imaging of calcite precipitation in a microporous column. Geochim. Cosmochim. Acta 2018, 222, 156–170. [Google Scholar] [CrossRef]
- Baek, S.; Hong, J.; Kim, K.Y.; Yeom, S.; Kwon, T. X-Ray Computed Microtomography Imaging of Abiotic Carbonate Precipitation in Porous Media From a Supersaturated Solution: Insights Into Effect of CO2 Mineral Trapping on Permeability. Water Resour. Res. 2018, 55, 3835–3855. [Google Scholar] [CrossRef]
- Noiriel, C.; Seigneur, N.; Guern, P.L.; Lagneau, V. Geometry and mineral heterogeneity controls on precipitation in fractures: An X-ray micro-tomography and reactive transport modeling study. Adv. Water Resour. 2021, 152, 103916. [Google Scholar] [CrossRef]
- Nooraiepour, M.; Masoudi, M.; Shokri, N.; Hellevang, H. Probabilistic Nucleation and Crystal Growth in Porous Medium: New Insights from Calcium Carbonate Precipitation on Primary and Secondary Substrates. ACS Omega 2021, 6, 28072–28083. [Google Scholar] [CrossRef]
- Depp, C.T.; Miller, Q.R.S.; Crum, J.V.; Horner, J.A.; Schaef, H.T. Pore-Scale Microenvironments Control Anthropogenic Carbon Mineralization Outcomes in Basalt. ACS Earth Space Chem. 2022, 6, 2836–2847. [Google Scholar] [CrossRef]
- Steefel, C.I.; Hu, M. Reactive transport modeling of mineral precipitation and carbon trapping in discrete fracture networks. Water Resour. Res. 2022, 58, e2022WR032321. [Google Scholar] [CrossRef]
- Cil, M.B.; Xie, M.; Packman, A.I.; Buscarnera, G. Solute mixing regulates heterogeneity of mineral precipitation in porous media. Geophys. Res. Lett. 2017, 44, 6658–6666. [Google Scholar] [CrossRef]
- Wang, Y.; Zeng, M.; Meldrum, F.C.; Christenson, H.K. Using Confinement To Study the Crystallization Pathway of Calcium Carbonate. Cryst. Growth Des. 2017, 17, 6787–6792. [Google Scholar] [CrossRef]
- Seyyedi, M.; Mahmud, H.K.B.; Verrall, M.; Giwelli, A.; Esteban, L.; Ghasemiziarani, M.; Clennell, B. Pore Structure Changes Occur During CO2 Injection into Carbonate Reservoirs. Sci. Rep. 2020, 10, 3624. [Google Scholar] [CrossRef]
- Ozotta, O.; Kolawole, O.; Malki, M.L.; Ore, T.; Gentzis, T.; Fowler, H.; Liu, K.; Ostadhassan, M. Nano- to macro-scale structural, mineralogical, and mechanical alterations in a shale reservoir induced by exposure to supercritical CO2. Applied Energy 2022, 326, 120051. [Google Scholar] [CrossRef]
- Li, X.; Nienhuis, E.T.; Nagurney, A.B.; Miller, Q.R.S.; Zhang, X.; Schaef, H.T. Resolving Nanoscale Processes during Carbon Mineralization Using Identical Location Transmission Electron Microscopy. Environ. Sci. Technol. Lett. 2024, 11, 79–88. [Google Scholar] [CrossRef]
- Jaho, S.; Sygouni, V.; Rokidi, S.G.; Parthenios, J.; Koutsoukos, P.G.; Paraskeva, C.A. Precipitation of Calcium Carbonate in Porous Media in the Presence of n-Dodecane. Cryst. Growth Des. 2016, 16, 6874–6884. [Google Scholar] [CrossRef]
- Li, X.; Yang, X. Effects of physicochemical properties and structural heterogeneity on mineral precipitation and dissolution in saturated porous media. Appl. Geochem. 2022, 146, 105474. [Google Scholar] [CrossRef]
- Li, X.; Huang, H.; Meakin, P. Level set simulation of coupled advection-diffusion and pore structure evolution due to mineral precipitation in porous media. Water Resour. Res. 2008, 44, W12407. [Google Scholar] [CrossRef]
- Deng, H.; Tournassat, C.; Molins, S.; Claret, F.; Steefel, C.I. A pore-scale investigation of mineral precipitation driven diffusivity change at the column-scale. Water Resour. Res. 2021, 57, e2020WR028483. [Google Scholar] [CrossRef]
- Deng, H.; Gharasoo, M.; Zhang, L.; Dai, Z.; Hajizadeh, A.; Peters, C.A.; Soulaine, C.; Thullner, M.; Van Cappellen, P. A perspective on applied geochemistry in porous media: Reactive transport modeling of geochemical dynamics and the interplay with flow phenomena and physical alteration. Appl. Geochem. 2022, 146, 105445. [Google Scholar] [CrossRef]
- Wetzel, M.; Kempka, T.; Kühn, M. Hysteresis in permeability evolution simulated for a sandstone by mineral precipitation and dissolution. Adv. Geosci. 2022, 58, 1–10. [Google Scholar] [CrossRef]
- Yang, F.; Yuan, K.; Stack, A.G.; Starchenko, V. Numerical Study of Mineral Nucleation and Growth on a Substrate. ACS Earth Space Chem. 2022, 6, 1655–1665. [Google Scholar] [CrossRef]
- Späth, M.; Nestler, B. Permeability evolution in open fractures during precipitation and dissolution - A phase-field study. Adv. Water Resour. 2023, 182, 104563. [Google Scholar] [CrossRef]
- Rodrigues, N.T.; Carrasco, I.S.S.; Reis, F. Step propagation controls pore shape evolution when mineral walls dissolve under saturation gradients. Geochim. Cosmochim. Acta 2024, 379, 219–232. [Google Scholar] [CrossRef]
- Michely, T.; Krug, J. Islands, Mounds, and Atoms; Springer, 2003.
- Evans, J.W.; Thiel, P.A.; Bartelt, M.C. Morphological evolution during epitaxial thin film growth: Formation of 2D islands and 3D mounds. Surf. Sci. Rep. 2006, 61, 1–128. [Google Scholar] [CrossRef]
- Lasaga, A.C.; Luttge, A. Variation of Crystal Dissolution Rate Based on a Dissolution Stepwave Model. Science 2001, 291, 2400–2404. [Google Scholar] [CrossRef] [PubMed]
- de Assis, T.A.; Reis, F.D.A.A. Dissolution of minerals with rough surfaces. Geochim. Cosmochim. Acta 2018, 228, 27–41. [Google Scholar] [CrossRef]
- Fischer, C.; Luttge, A. Beyond the conventional understanding of water-rock reactivity. Earth. Planet. Sci. Lett. 2017, 457, 100–105. [Google Scholar] [CrossRef]
- Fogler, H.S. Elements of chemical reaction engineering, 4th ed ed.; Prentice Hall PTR international series in the physical and chemical engineering sciences, Prentice Hall PTR, 2006.
- Carrasco, I.S.S.; Reis, F.D.A.A. Modeling the kinetics of calcite dissolution in neutral and alkaline solutions. Geochim. Cosmochim. Acta 2021, 292, 271–284. [Google Scholar] [CrossRef]
- Carrasco, I.S.S.; Machado, E.A.; Reis, F.D.A.A. Simulations of Dissolution of Initially Flat Calcite Surfaces: Retreat Velocity Control and Surface Roughness Scaling. ACS Earth Space Chem. 2021, 5, 2755–2767. [Google Scholar] [CrossRef]
- Shiraki, R.; Rock, P.A.; Casey, W.H. Dissolution Kinetics of Calcite in 0.1M NaCl Solution at Room Temperature: An Atomic Force Microscopic (AFM) Study. Aquatic Geochem. 2000, 6, 87–108. [Google Scholar] [CrossRef]
- Hong, M.; Teng, H.H. Implications of solution chemistry effects: Direction-specific restraints on the step kinetics of calcite growth. Geochim. Cosmochim. Acta 2014, 141, 228–239. [Google Scholar] [CrossRef]
- Sand, K.K.; Tobler, D.J.; Dobberschütz, S.; Larsen, K.K.; Makovicky, E.; Andersson, M.P.; Wolthers, M.; Stipp, S.L.S. Calcite Growth Kinetics: Dependence on Saturation Index, Ca2+:CO32- Activity Ratio, and Surface Atomic Structure. Cryst. Growth Des. 2016, 16, 3602–3612. [Google Scholar] [CrossRef]
- Lasaga, A.C.; Blum, A.E. Surface chemistry, etch pits and mineral-water reactions. Geochim. Cosmochim. Acta 1986, 50, 2363–2379. [Google Scholar] [CrossRef]
- Kolasinski, K.W. Surface Science: foundations of catalysis and nanoscience, 3rd ed ed.; John Wiley & Sons, 2012.
- Lasaga, A.C.; Luttge, A. Mineralogical approaches to fundamental crystal dissolution kinetics. Am. Mineral. 2004, 89, 527–540. [Google Scholar] [CrossRef]
- Meakin, P.; Rosso, K.M. Simple kinetic Monte Carlo models for dissolution pitting induced by crystal defects. J. Chem. Phys. 2008, 129, 204106. [Google Scholar] [CrossRef] [PubMed]
- Bouissonnié, A.; Daval, D.; Marinoni, M.; Ackerer, P. From mixed flow reactor to column experiments and modeling: Upscaling of calcite dissolution rate. Chem. Geol. 2018, 487, 63–75. [Google Scholar] [CrossRef]
- Barabási, A.L.; Stanley, H.E. Fractal Concepts in Surface Growth; Cambridge University Press: New York, USA, 1995. [Google Scholar]
- Krug, J. Origins of scale invariance in growth processes. Adv. Phys. 1997, 46, 139–282. [Google Scholar] [CrossRef]
Figure 1.
A region of a surface in the Kossel crystal where site colors indicate their coordinations: in purple, in yellow, (kink site) in blue, (step site) in red, (terrace site) in gray, and in brown. The sites surronding this region contain molecules which affect site colors at the boundaries.
Figure 1.
A region of a surface in the Kossel crystal where site colors indicate their coordinations: in purple, in yellow, (kink site) in blue, (step site) in red, (terrace site) in gray, and in brown. The sites surronding this region contain molecules which affect site colors at the boundaries.
Figure 2.
(a) Two-dimensional section of a fracture with wedge-shaped walls. The magnified zoom shows a three-dimensional view of a wedge with a small angle , which is formed by wide terraces separated by monolayer steps (the bottoms and the tips of the wedges belong to two low energy planes of the calcite crystal). (b) Two-dimensional section of a fracture whose walls are vicinal surfaces forming angle with the z direction.
Figure 3.
(a) Snapshots of a wall with initial wedge shape, total length of , and angle , in solution with . (b) Evolution of the cross-section of the crystal in plane. In all panels, the orange lines indicate the projection of the initial walls on the plane.
Figure 3.
(a) Snapshots of a wall with initial wedge shape, total length of , and angle , in solution with . (b) Evolution of the cross-section of the crystal in plane. In all panels, the orange lines indicate the projection of the initial walls on the plane.
Figure 4.
Results for growth or dissolution in wedge-shaped fracture walls: (a) Ratio with nm and for the saturations indicated in the plot. (b) Ratio with m and for the saturations indicated in the plots. (c) Evolution of the growth rate for the same walls and saturations of (b).
Figure 4.
Results for growth or dissolution in wedge-shaped fracture walls: (a) Ratio with nm and for the saturations indicated in the plot. (b) Ratio with m and for the saturations indicated in the plots. (c) Evolution of the growth rate for the same walls and saturations of (b).
Figure 5.
Stationary value of as function of for different angles .
Figure 5.
Stationary value of as function of for different angles .
Figure 6.
Stationary times as function of l for and .
Figure 6.
Stationary times as function of l for and .
Figure 7.
Evolution of the cross-section of a fracture with vicinal surfaces with terrace length of 40 nm. The orange lines indicate the initial walls.
Figure 7.
Evolution of the cross-section of a fracture with vicinal surfaces with terrace length of 40 nm. The orange lines indicate the initial walls.
Figure 8.
Scaled time to fill the gap between the vicinal surfaces as a function of the gap distance for two different angles and saturation ratios.
Figure 8.
Scaled time to fill the gap between the vicinal surfaces as a function of the gap distance for two different angles and saturation ratios.
Figure 9.
Expected sequence of configurations of a fracture with initially rough walls during calcite growth. Low-energy planes are indicated by parallel lines, with increasing initial density of molecules in the following order in the lower crystal: red solid line; pink dashed line; magenta dashed line; orange dashed line. Brown dashed lines in the intermediate time (b) are drawn through terraces formed around local surface peaks. Flow lines in the fracture spacing are schematically represented.
Figure 10.
Evolution of the cross-section of a rough wall during calcite growth. The initial configuration of the wall is indicated by the orange line.
Figure 10.
Evolution of the cross-section of a rough wall during calcite growth. The initial configuration of the wall is indicated by the orange line.
|
Disclaimer/Publisher’s Note: The statements, opinions and data contained in all publications are solely those of the individual author(s) and contributor(s) and not of MDPI and/or the editor(s). MDPI and/or the editor(s) disclaim responsibility for any injury to people or property resulting from any ideas, methods, instructions or products referred to in the content. |
© 2024 by the authors. Licensee MDPI, Basel, Switzerland. This article is an open access article distributed under the terms and conditions of the Creative Commons Attribution (CC BY) license (https://creativecommons.org/licenses/by/4.0/).

