3. Results
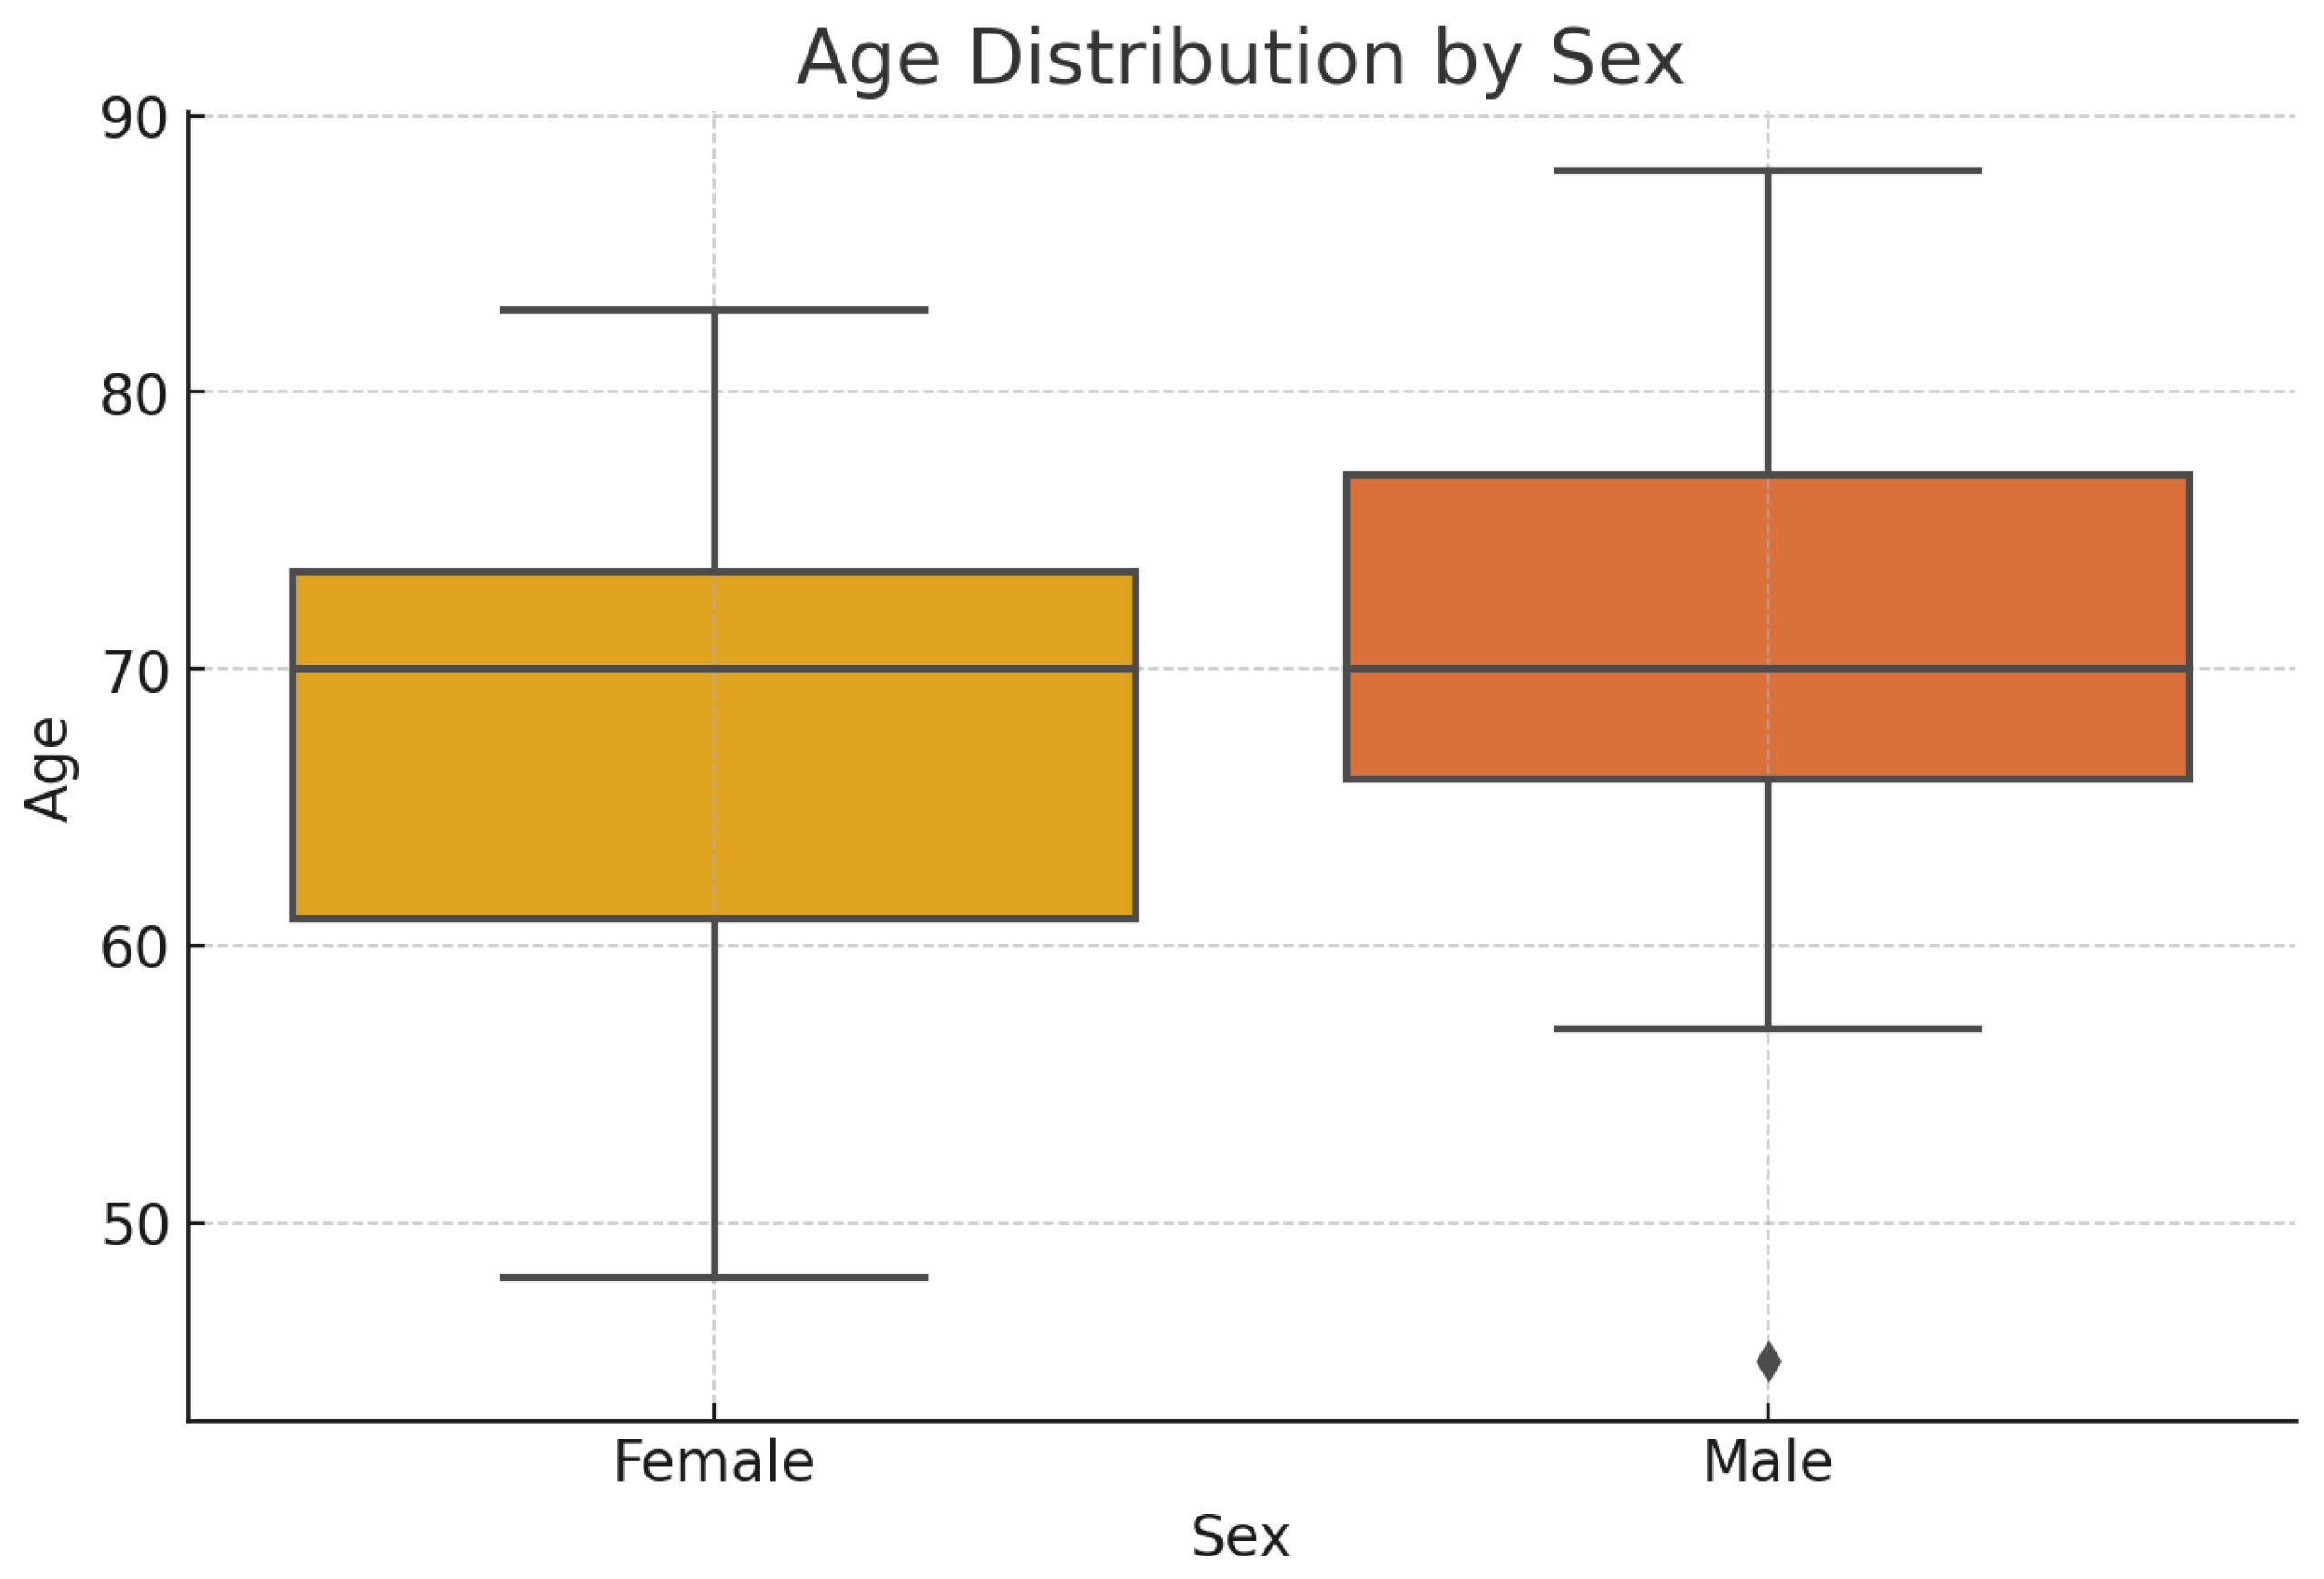
As mentioned above, in our study, a group of 100 patients was examined, with the following epidemiological characteristics- number and age distribution by sex - presented in
Table 1 and
Figure 1:
Table 1.
Distribution of patients by sex
Table 1.
Distribution of patients by sex
| Sex |
Number |
% |
Total |
| Female |
43 |
43 |
43 |
| Male |
57 |
57 |
57 |
| Total |
100 |
100 |
100 |
The age ranges were as follows: females ranged from 48 to 83 years old, and males fro 45 to 88 years old, with a median age 70 years for both sexes.
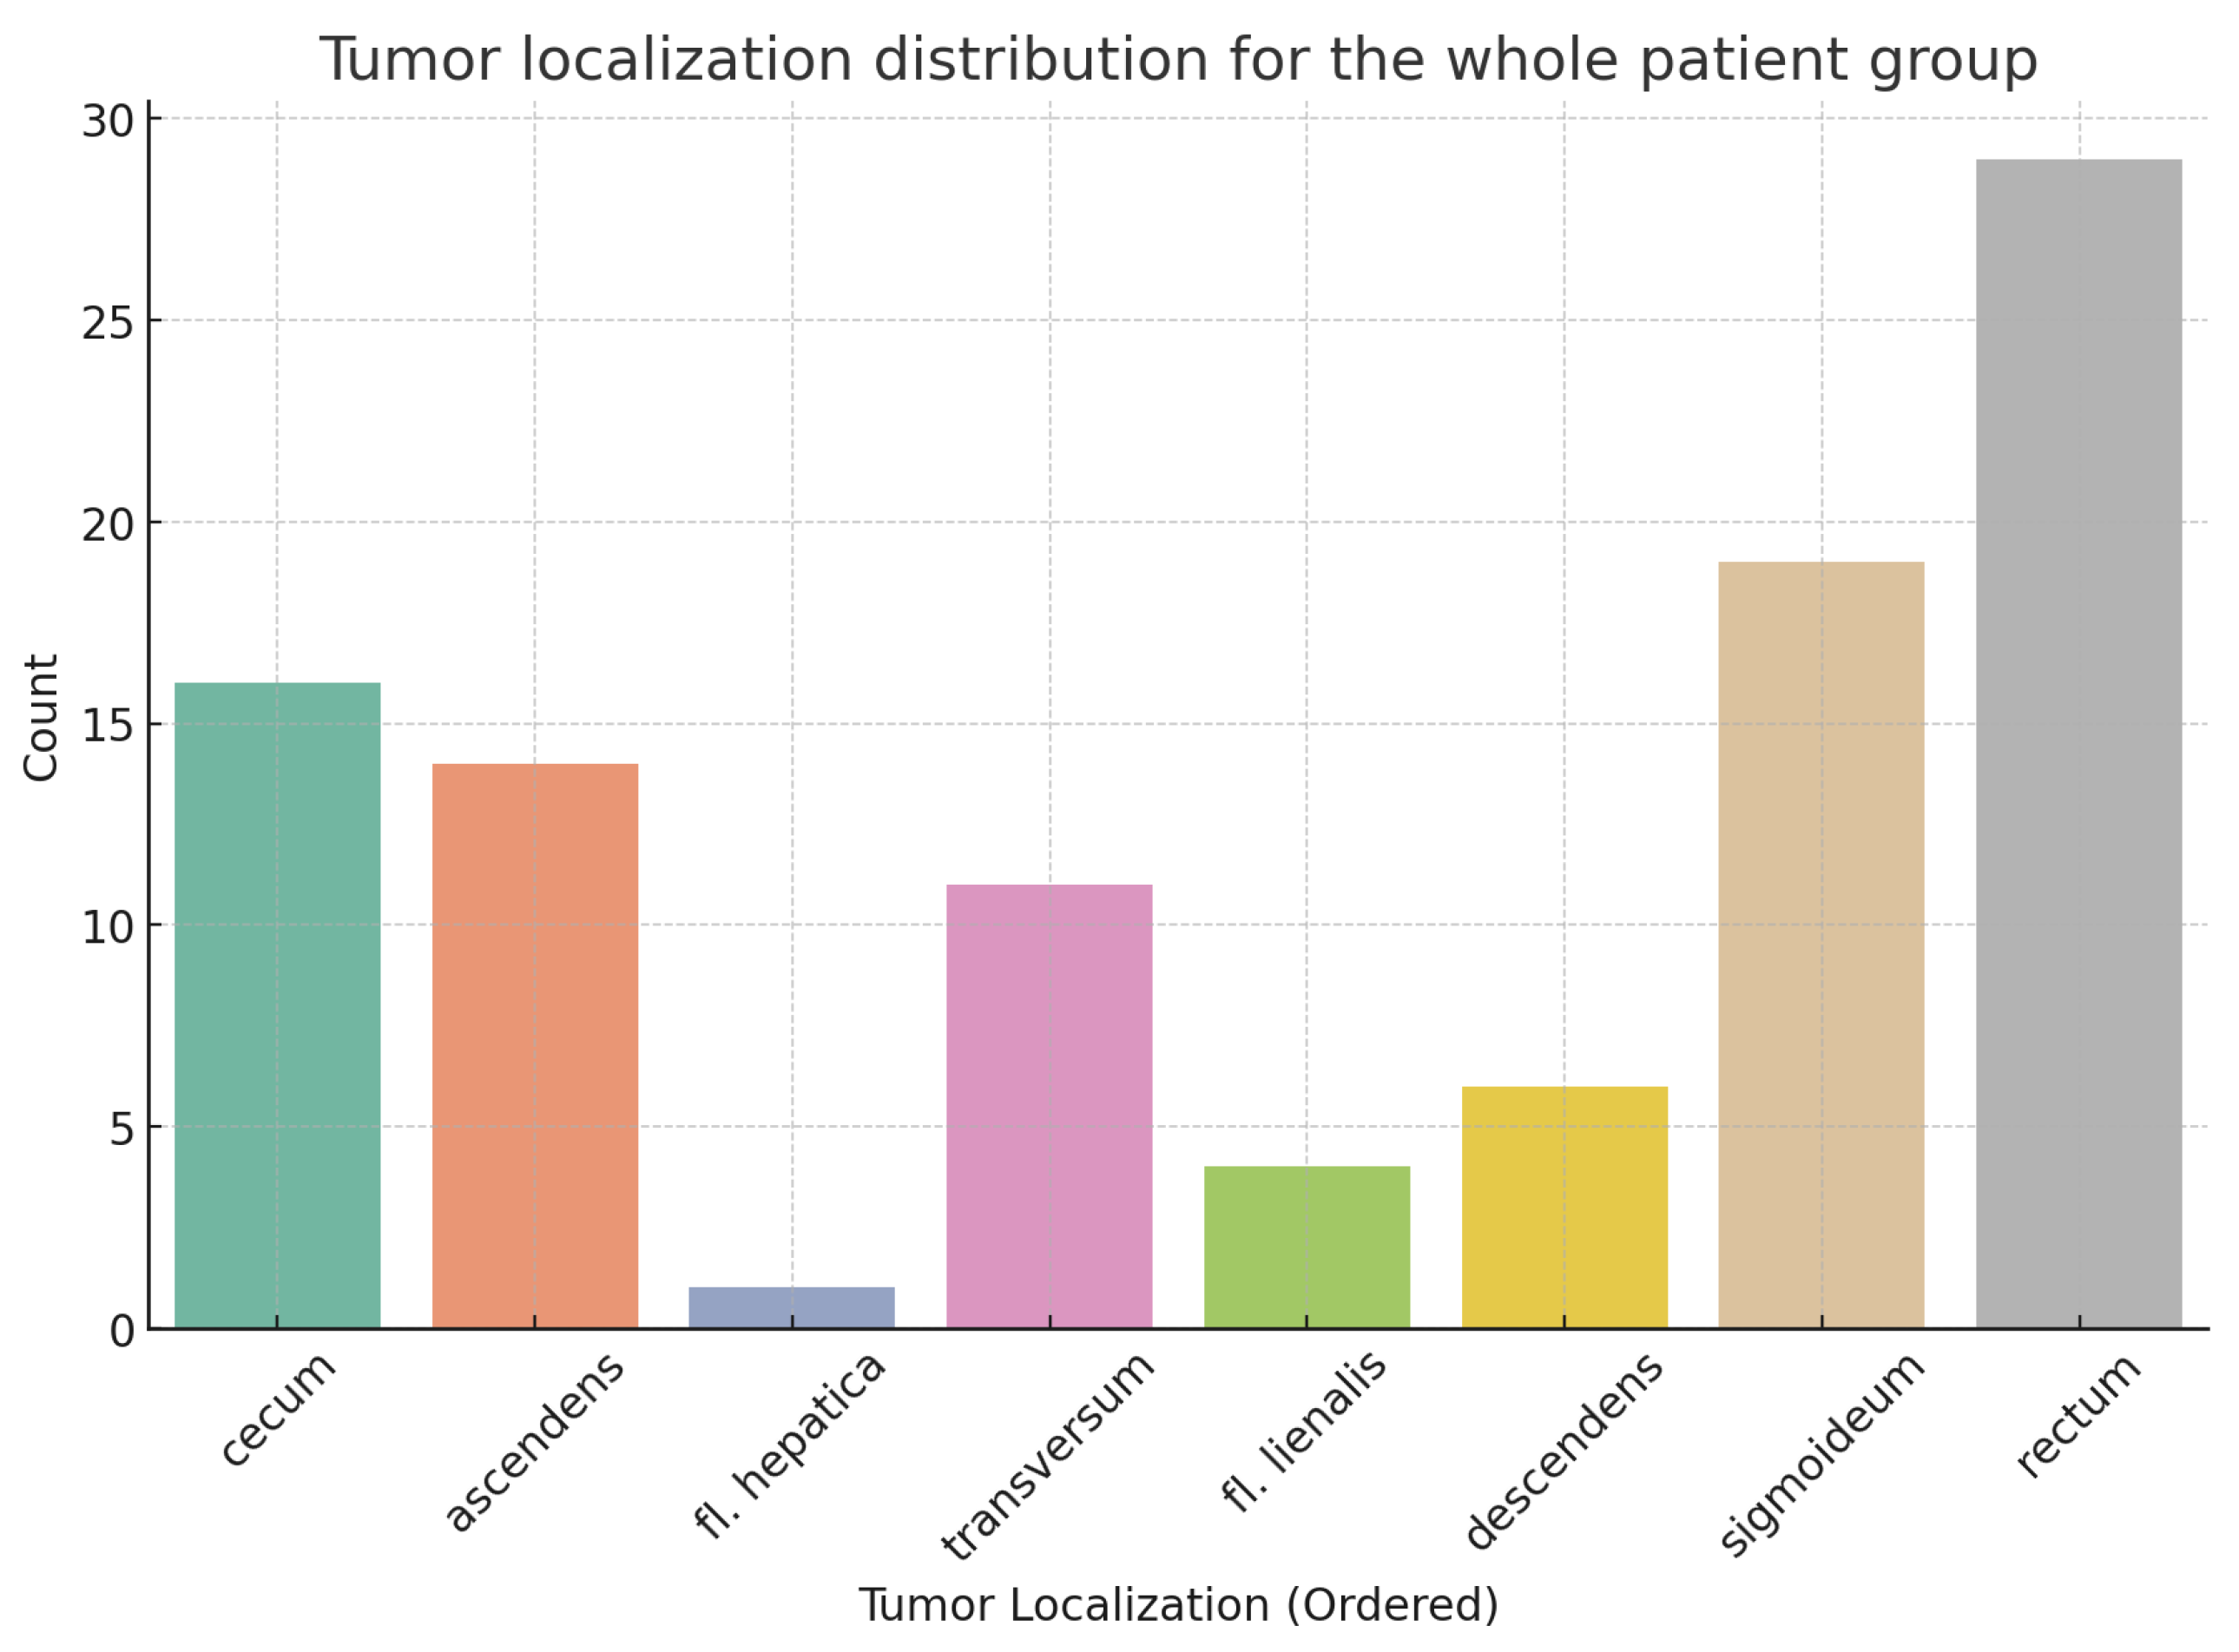
Tumor localization across different anatomical sites for the entire patient group is presented in
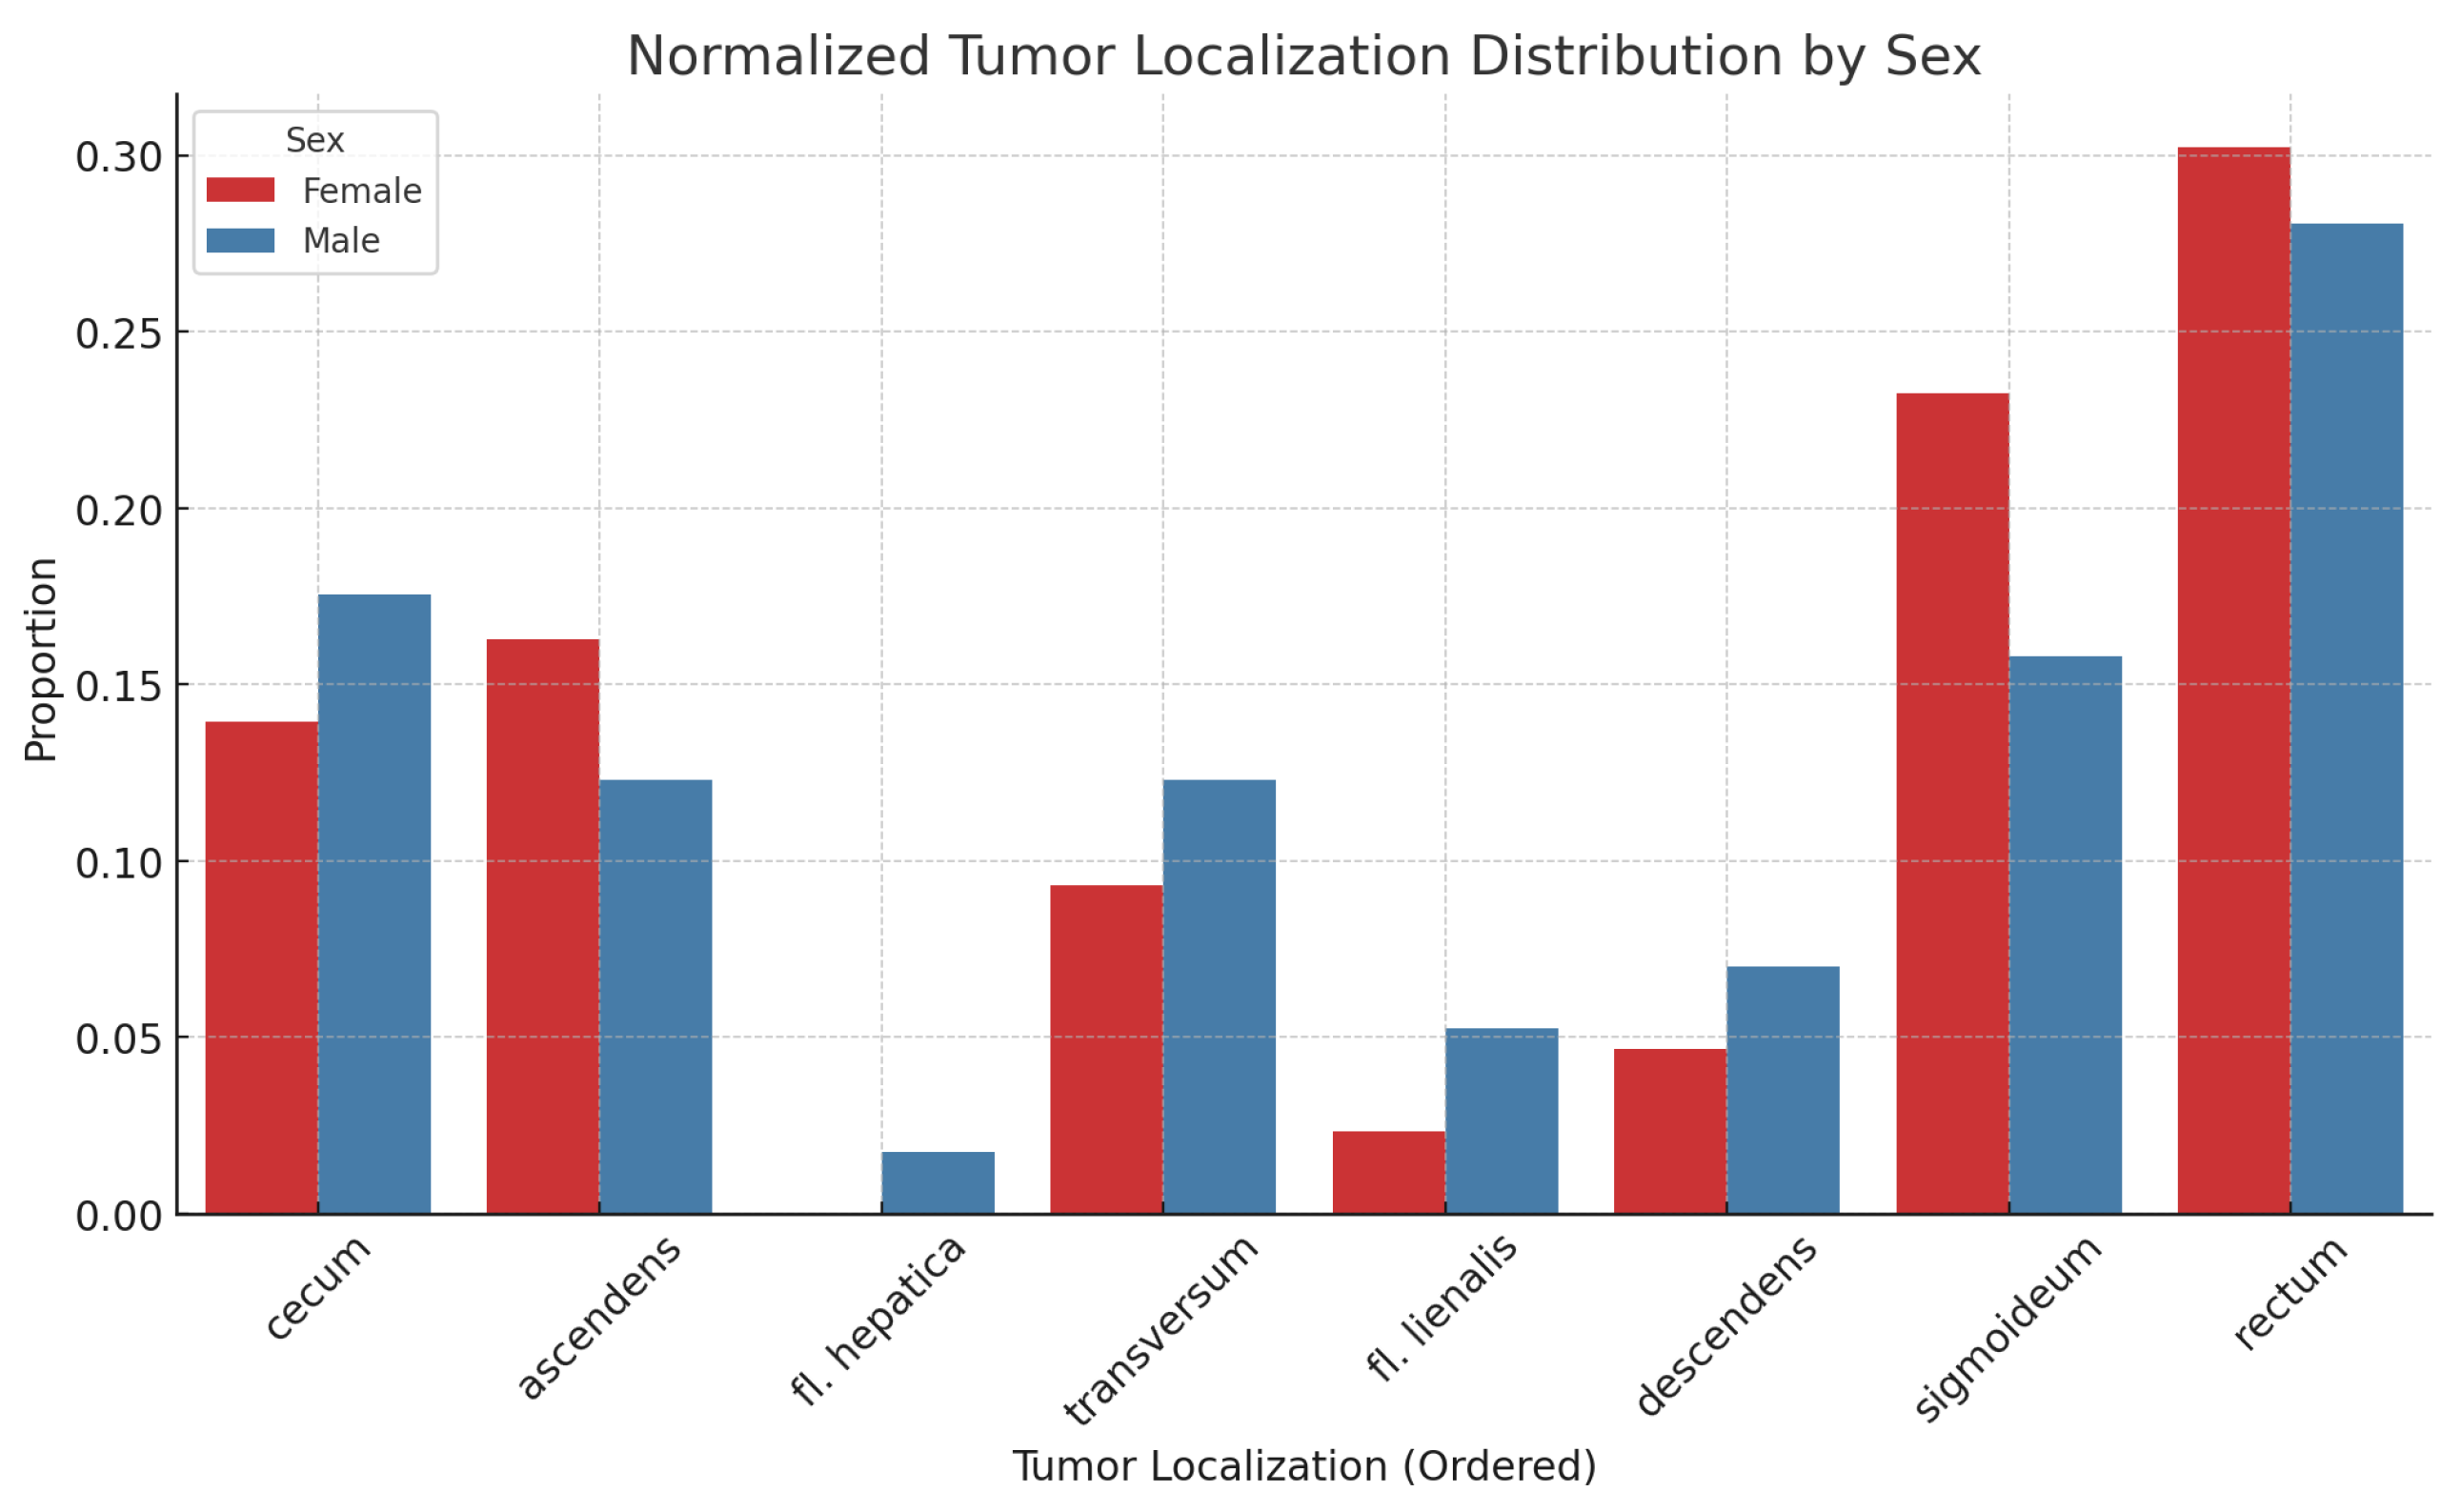
Figure 2, along with the results normalized for sample sizes in
Figure 3. There is no statistically significant association between tumor localization and sex. (
: 2.95; p-value: 0.89; Df : 7)
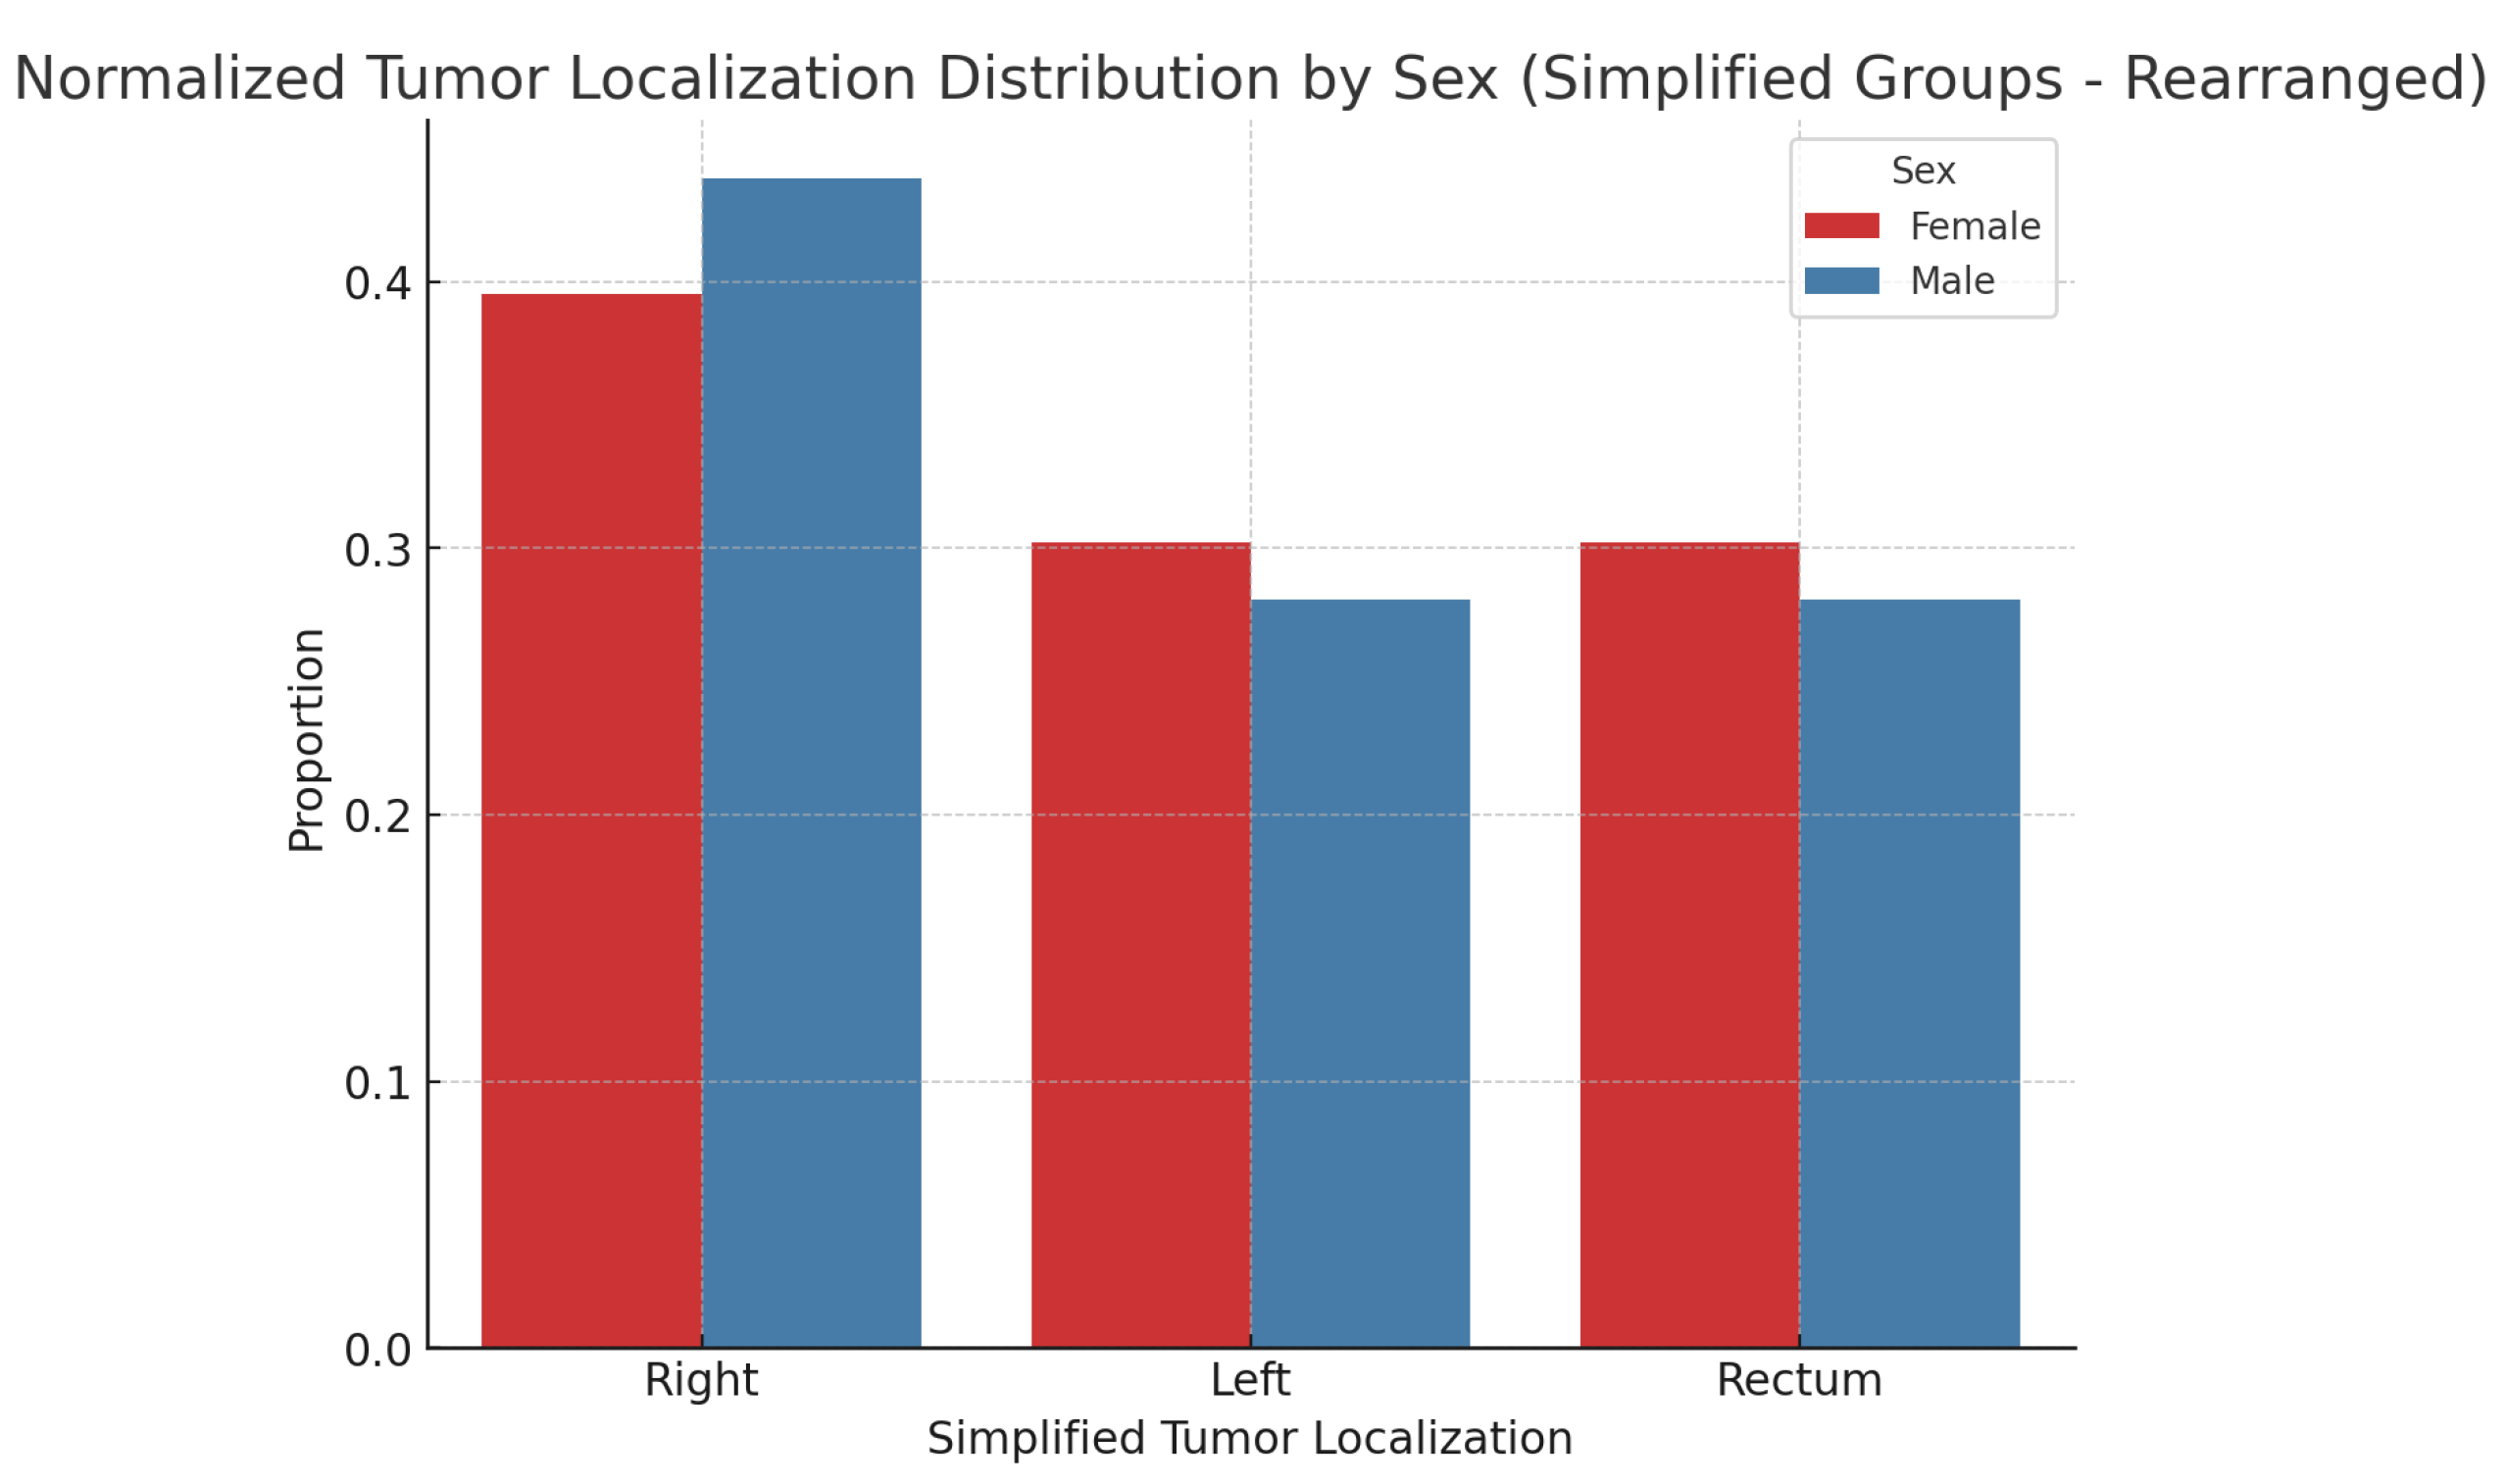
After consolidating the tumor localizations, we formed groups of patients with left-sided, right-sided, and rectal localization of the primary tumor. After normalization, we obtained the following results-
Figure 4.
In the studied patient group, the results regarding some characteristics of the primary tumor are as follows: 1. Primary tumor localization and:
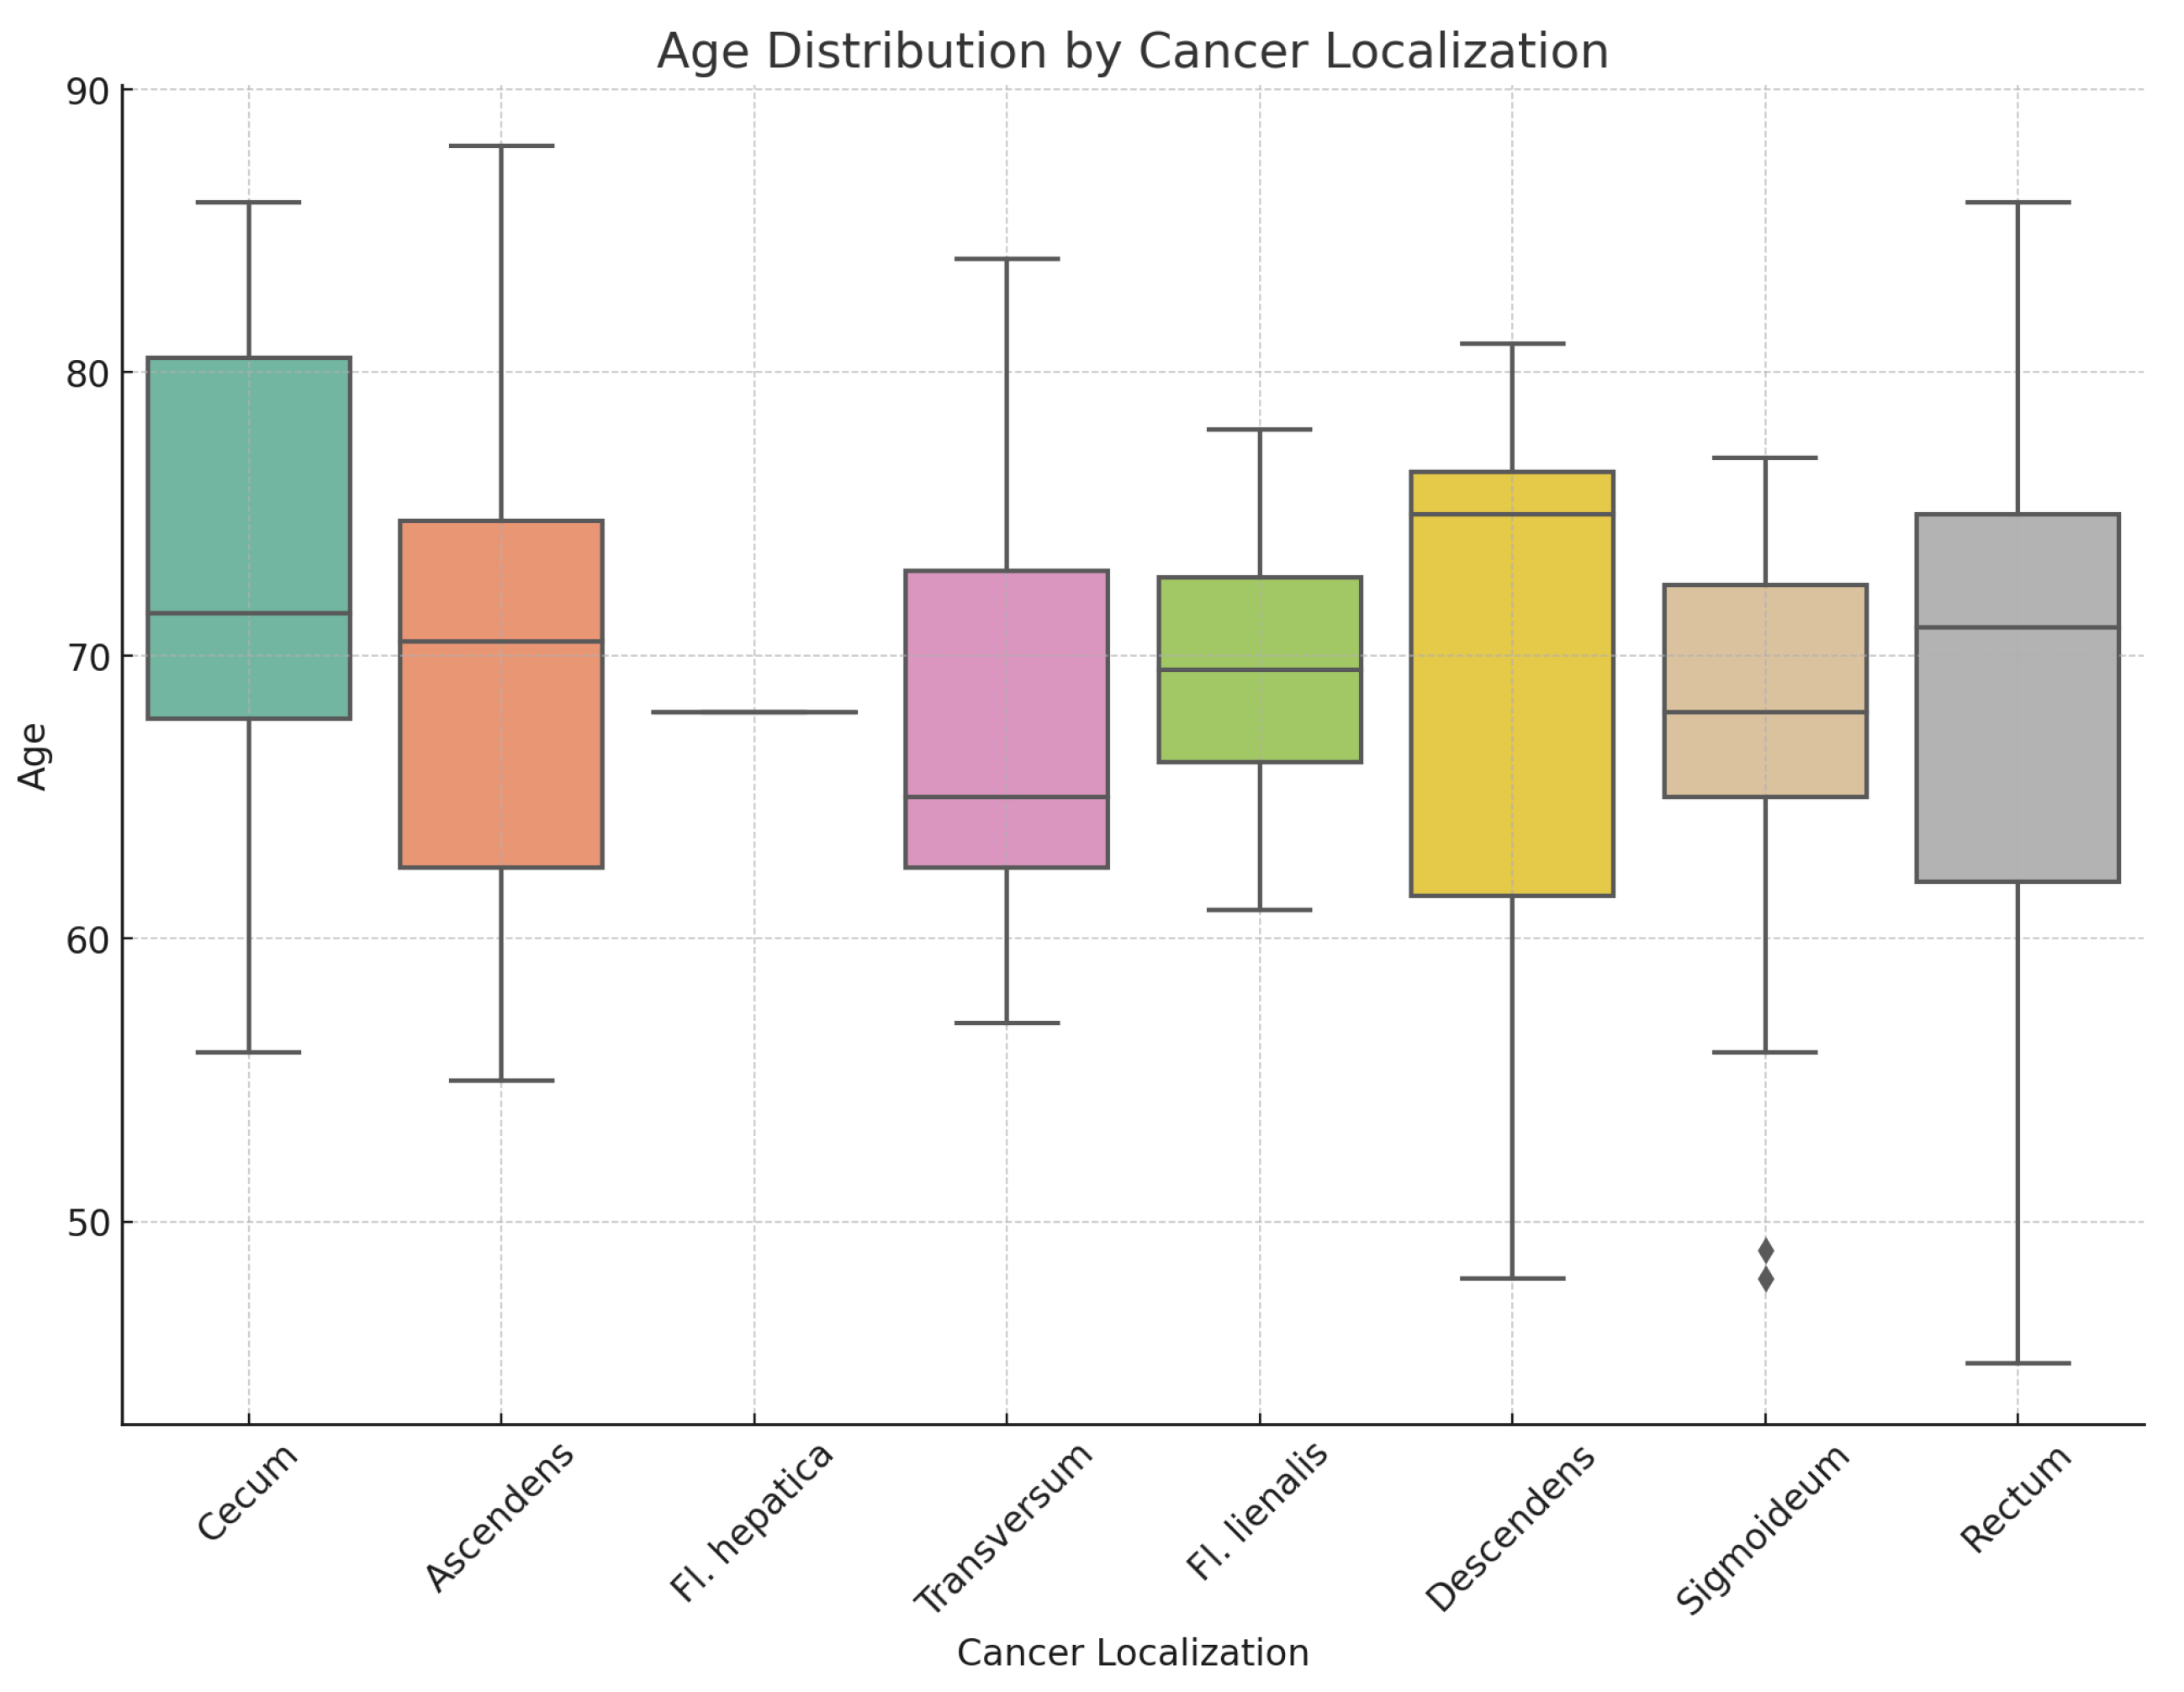
Figure 5 shows a box plot illustrating the distribution of the sample of studied patients based on the location of the primary tumor.
Table 2. provides the median age of patients relative to tumor localization in the overall patient group, and differentiated by sex, as well as age ranges. Statistical analysis indicates no statistically significant differences in the distribution by sex(
: 2.95; p-value: 0.938) and age(Kruskal-Wallis test statistic is approximately 3.25, p-value: 0.777) in relation to different tumor localizations.
Figure 5.
Age distribution by cancer localization
Figure 5.
Age distribution by cancer localization
Table 2.
Distribution of patients by age and sex based on primary tumor localization.
Table 2.
Distribution of patients by age and sex based on primary tumor localization.
| |
Median Age |
Range |
Total Patients |
Median Males |
Range Males |
Total Males |
Median Females |
Range Females |
Total Females |
| Ascendens |
70.5 |
55 - 88 |
14 |
71.0 |
67 - 88 |
7 |
61.0 |
55 - 75 |
7.0 |
| Cecum |
71.5 |
56 - 86 |
16 |
71.5 |
57 - 86 |
10 |
71.5 |
56 - 83 |
6.0 |
| Descendens |
75.0 |
48 - 81 |
6 |
76.0 |
57 - 81 |
4 |
61.5 |
48 - 75 |
2.0 |
| Fl. hepatica |
68.0 |
68 - 68 |
1 |
68.0 |
68 - 68 |
1 |
|
|
|
| Fl. lienalis |
69.5 |
61 - 78 |
4 |
71.0 |
68 - 78 |
3 |
61.0 |
61 - 61 |
1.0 |
| Rectum |
71.0 |
45 - 86 |
29 |
72.5 |
45 - 86 |
16 |
68.0 |
57 - 77 |
13.0 |
| Sigmoideum |
68.0 |
48 - 77 |
19 |
68.0 |
57 - 77 |
9 |
68.5 |
48 - 76 |
10.0 |
| Transversum |
65.0 |
57 - 84 |
11 |
65.0 |
57 - 84 |
7 |
73.0 |
61 - 75 |
4.0 |
| Total |
70.0 |
45 - 88 |
100 |
70.0 |
45 - 88 |
57 |
70.0 |
48 - 83 |
43.0 |
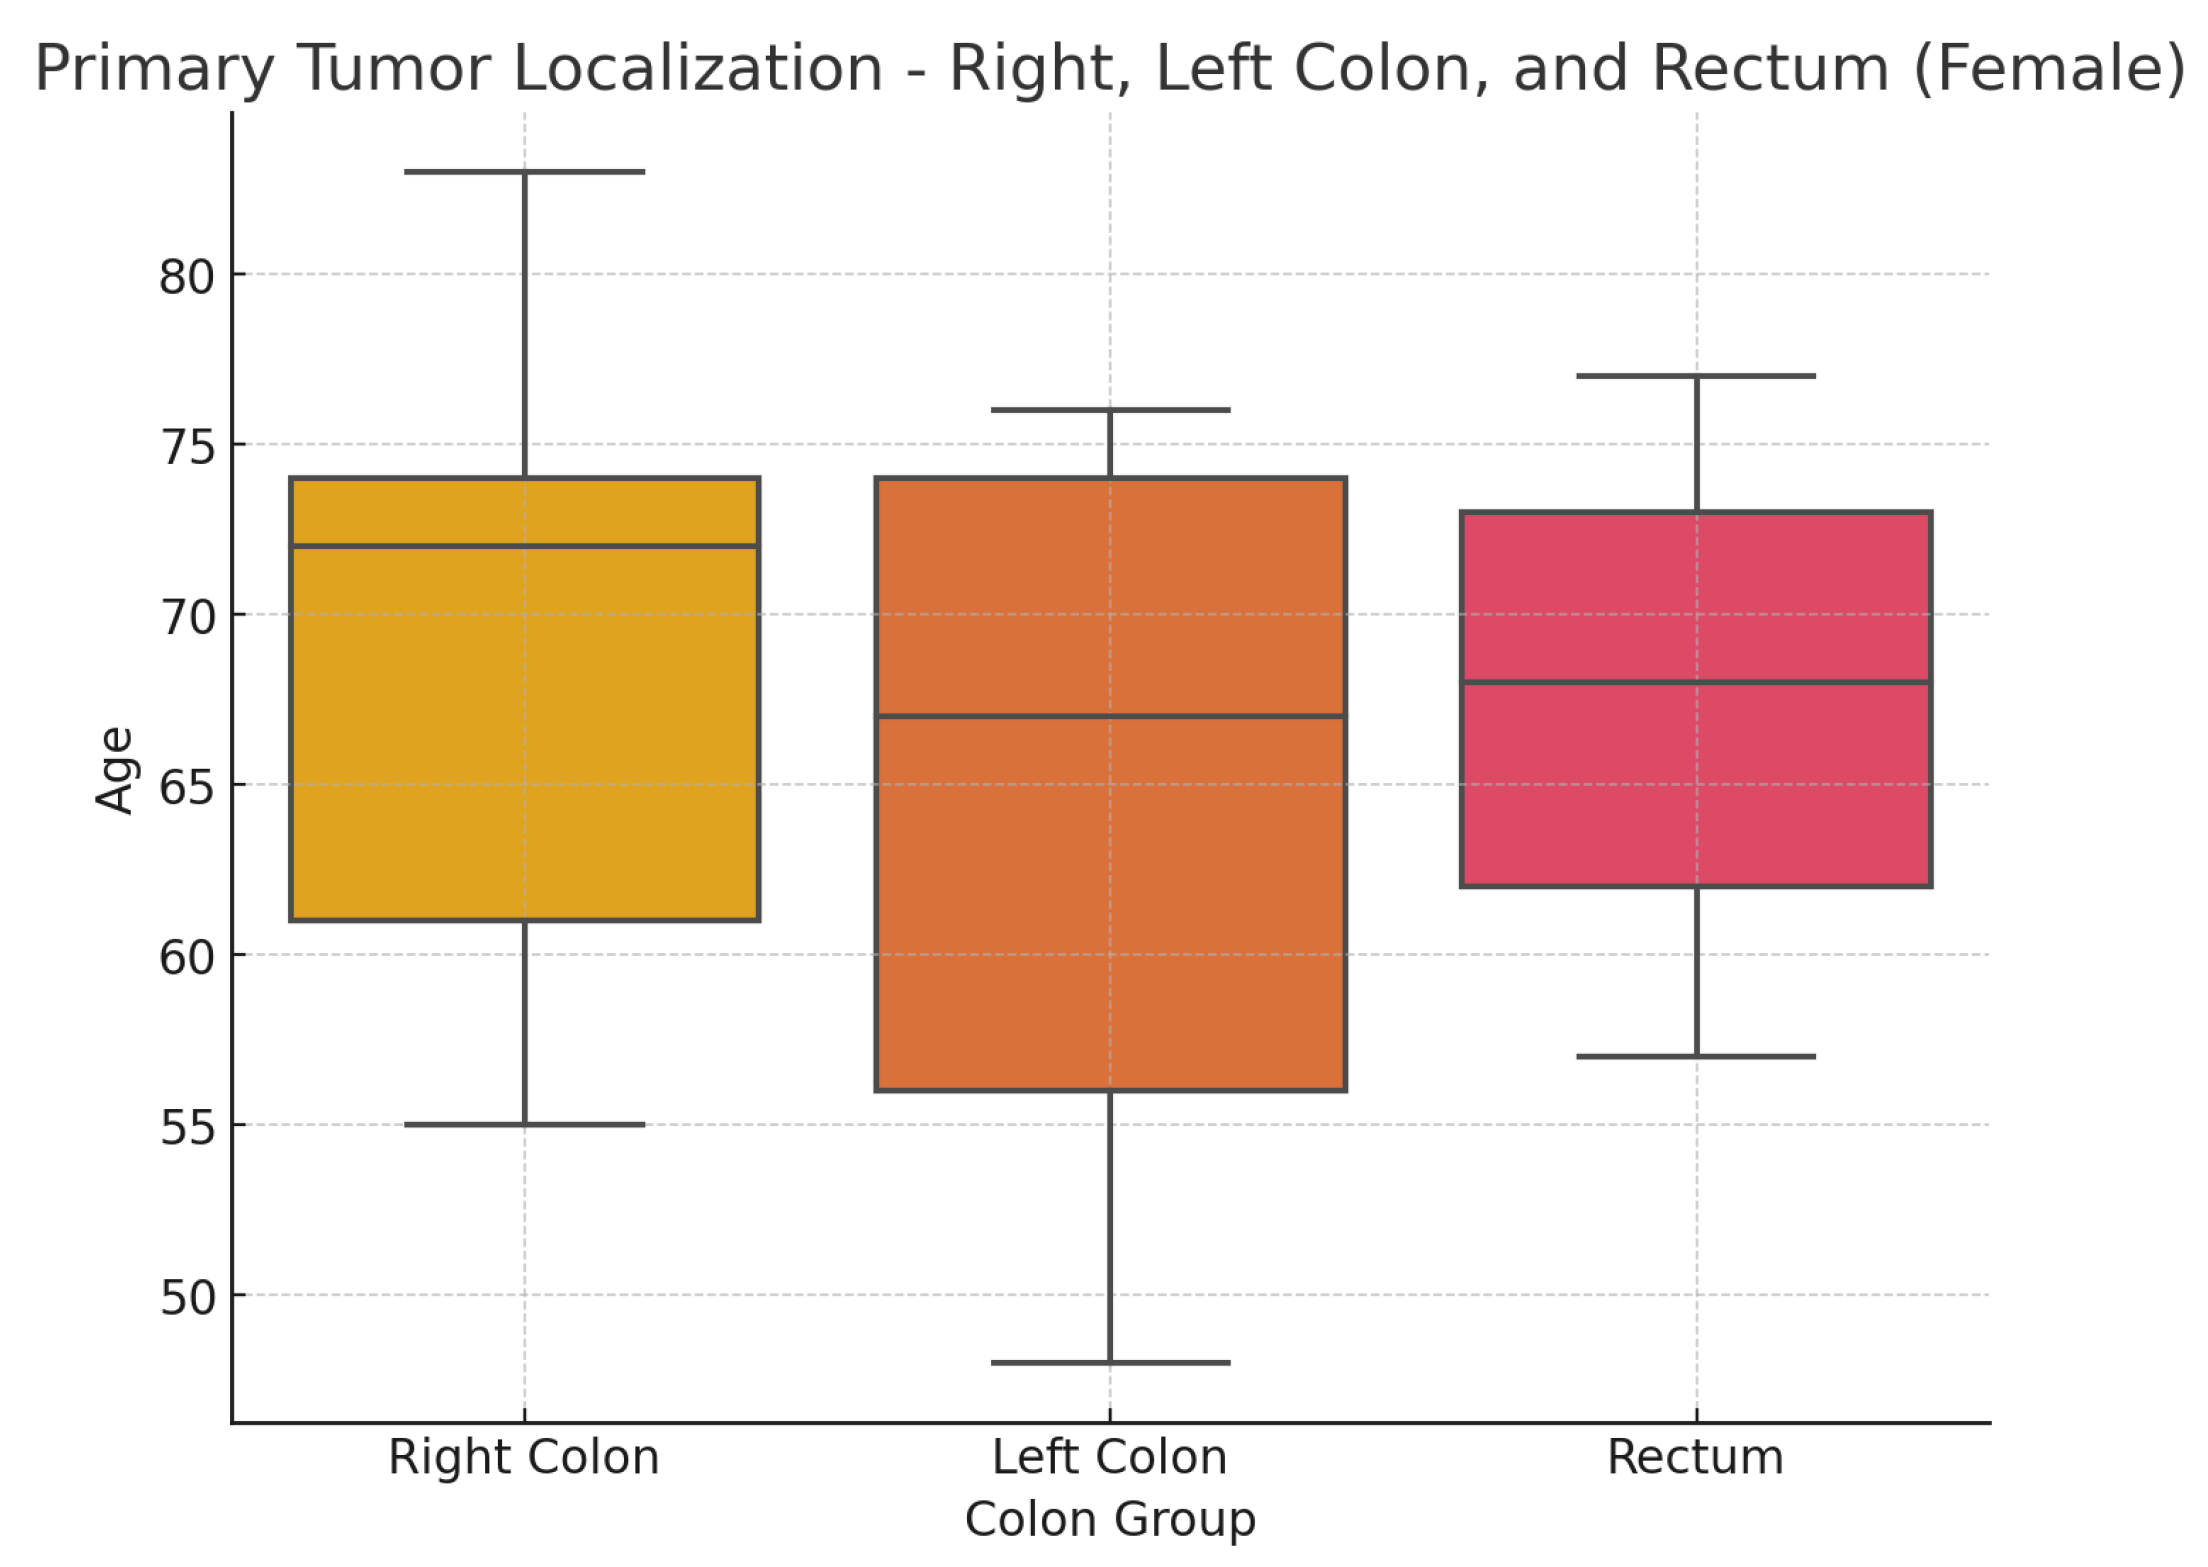
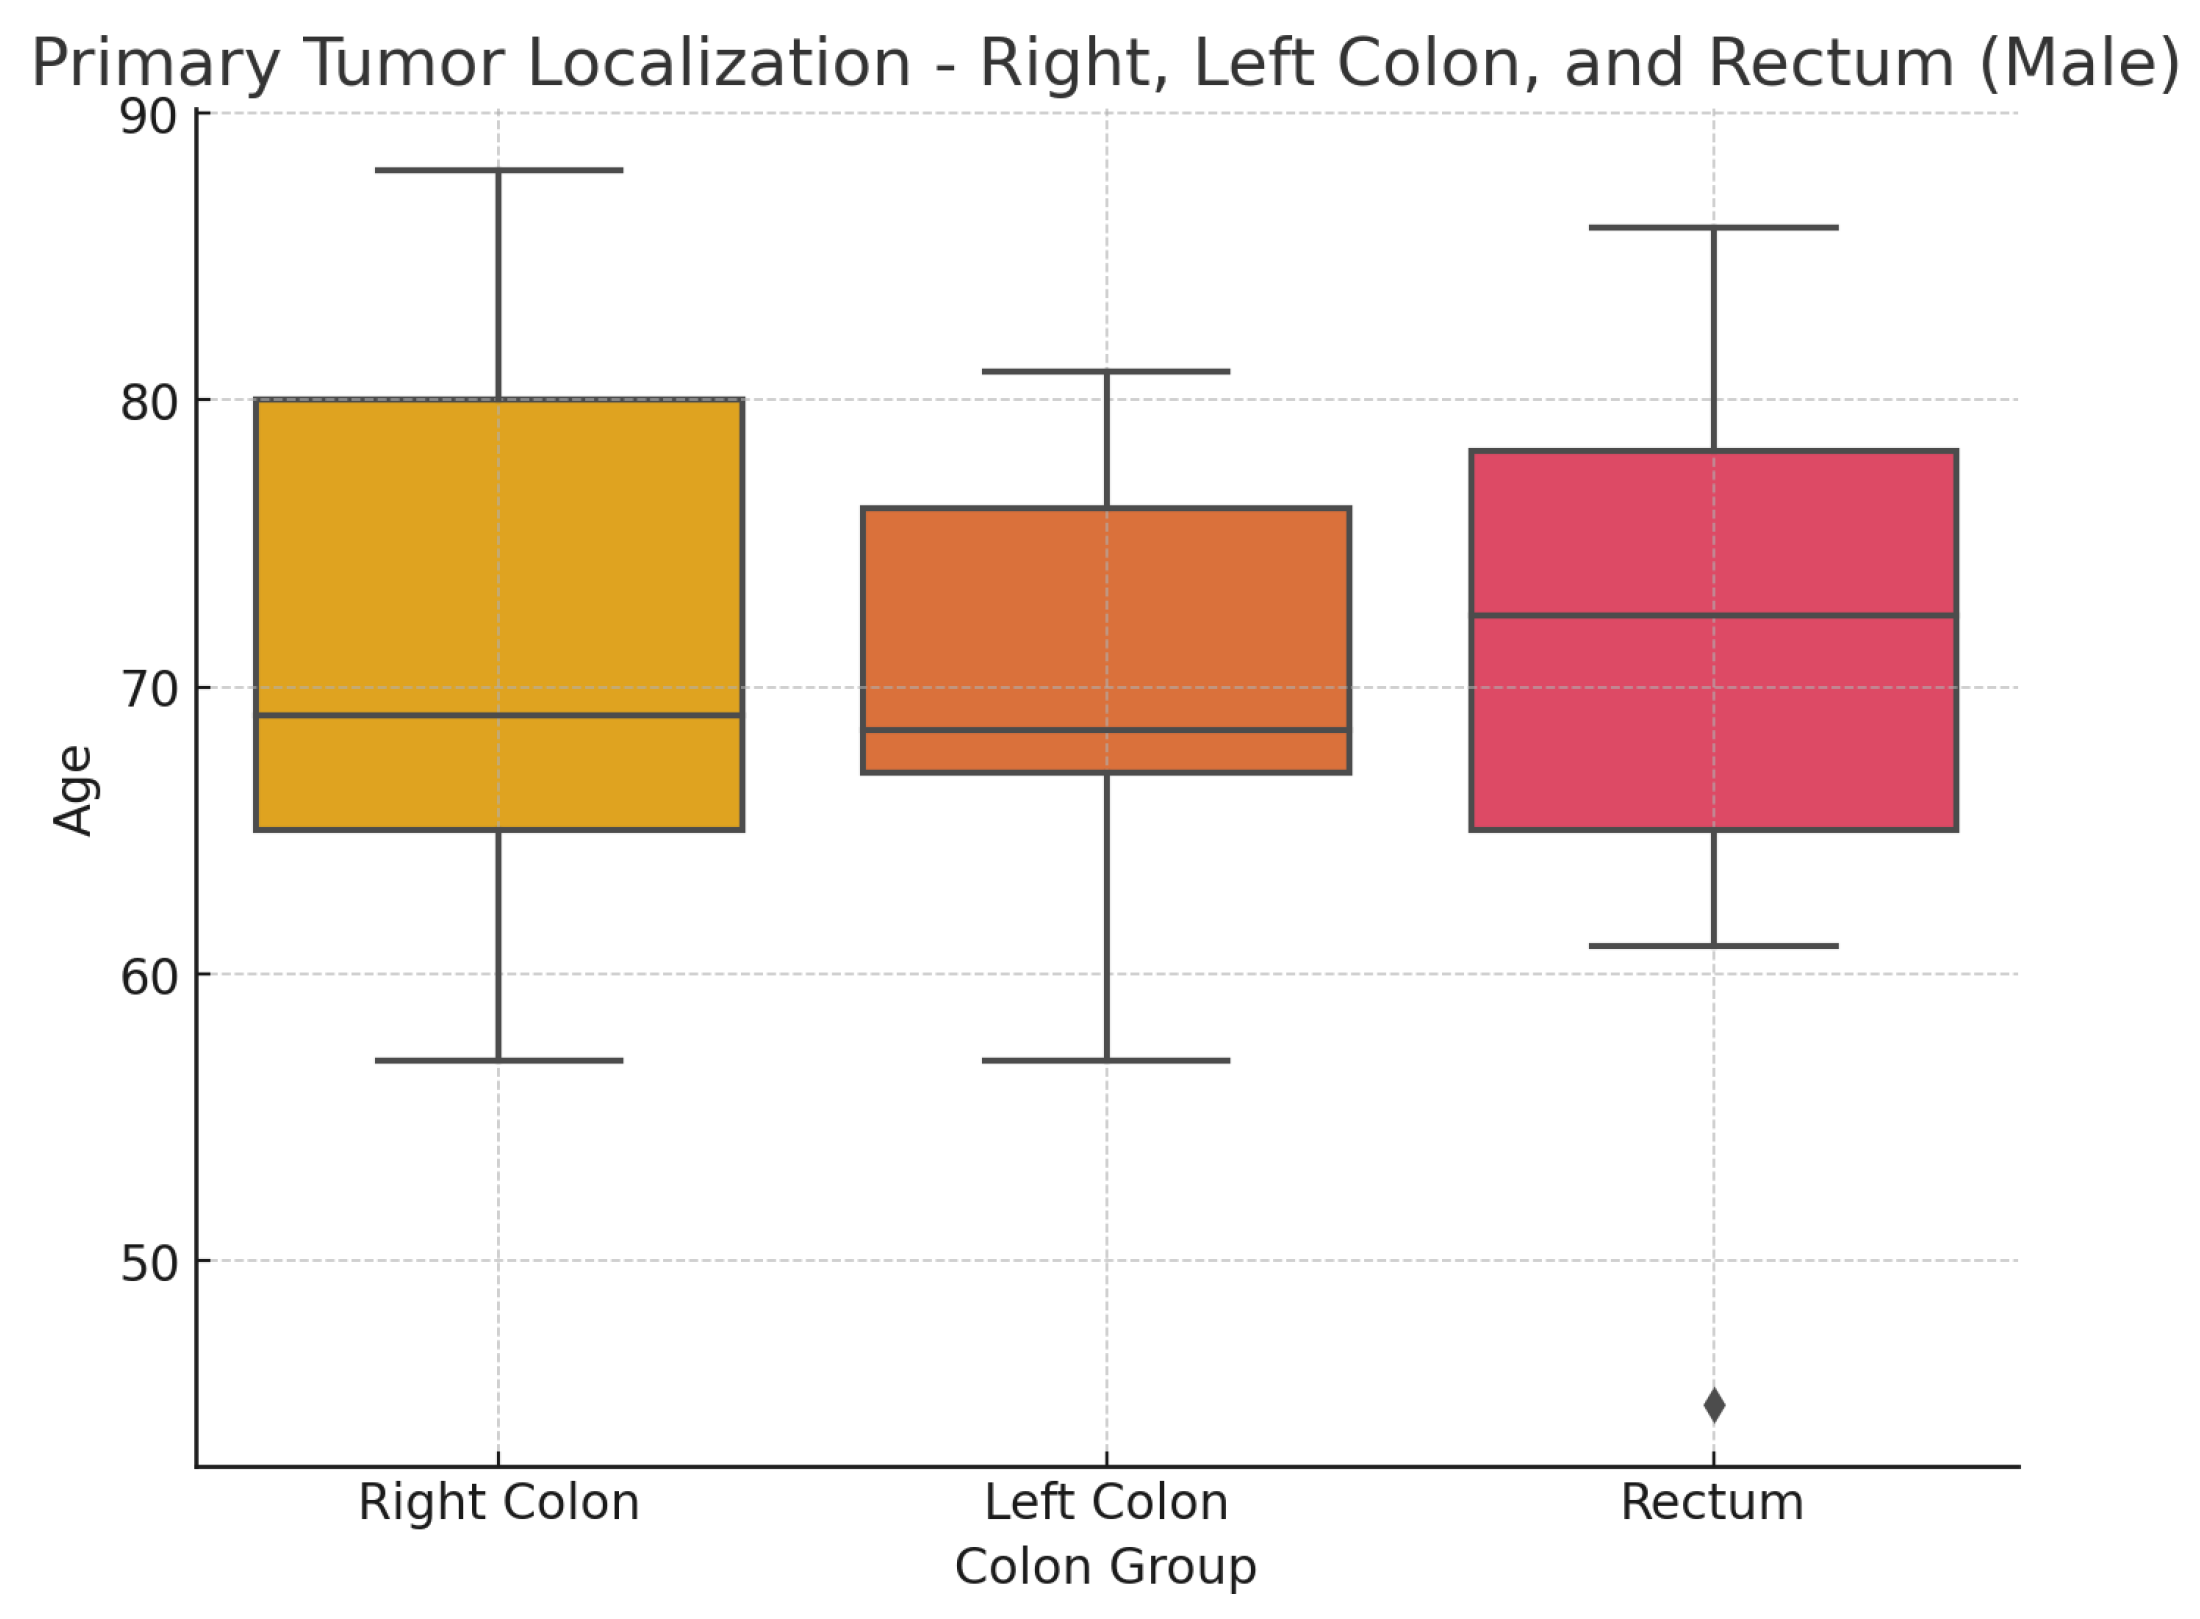
Based on the different embryological origins of the right side of the colon (cecum, ascending colon, hepatic flexure, and the proximal two-thirds of the transverse colon) and its left side (splenic flexure, descending colon, and sigmoid colon), as well as extensive experimental and clinical data on differences in morphology, genetics, and clinical characteristics, we consolidated the primary tumor localizations into three groups: right colon, left colon, and rectum. This approach also facilitated the subsequent statistical analysis to some extent.
Figure 6. and
Figure 7. present the results concerning these three localization groups and their relationship with the age and sex of patients with colorectal carcinoma. The subsequent statistical analysis showed no statistically significant differences regarding the primary tumor localization, age, and sex of the patients.
The results of the Kruskal-Wallis tests are as follows:Females: The test statistic is 0.805 with a p-value of 0.669; Males: The test statistic is 0.418 with a p-value of 0.811.
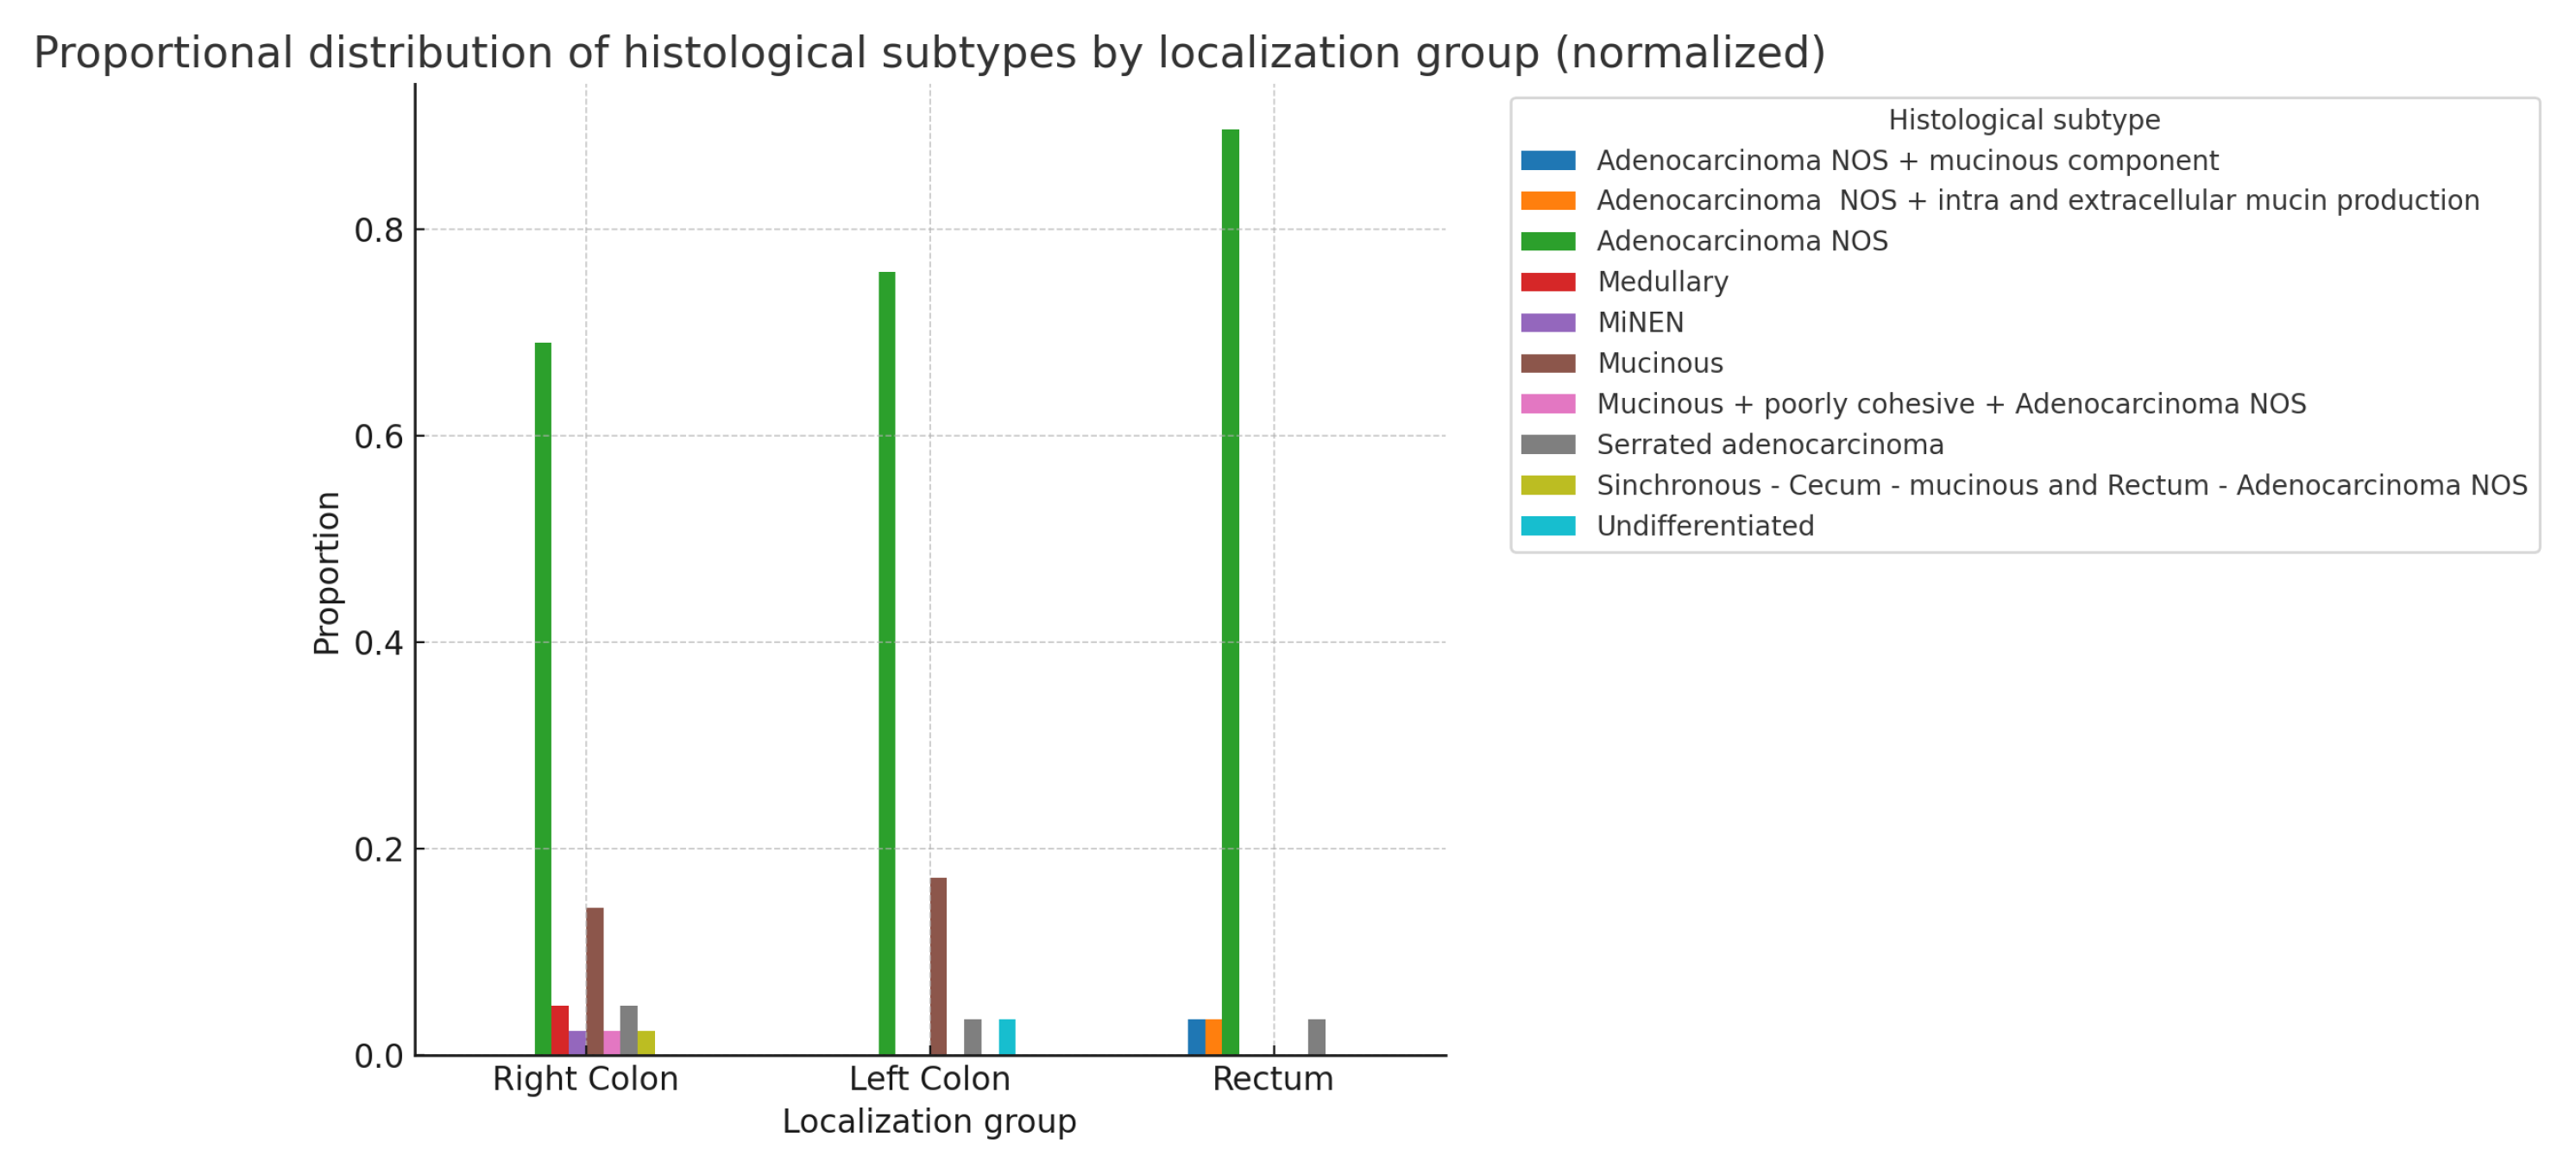
The following bar chart displays the normalized proportions of histological subtypes as a grouped bar chart, with each localization group (Right Colon, Left Colon, and Rectum) represented in
Figure 8. In summary, even with normalized proportions, there is no statistically significant relationship between localization and histological type:(
: 19.937; p-value: 0.336; df=18). The statistical results of the chi-square test for the above indicators, separated by sex (not shown), also do not reveal any statistically significant differences.(Males: p-value: 0.685; Females: p-value: 0.380)
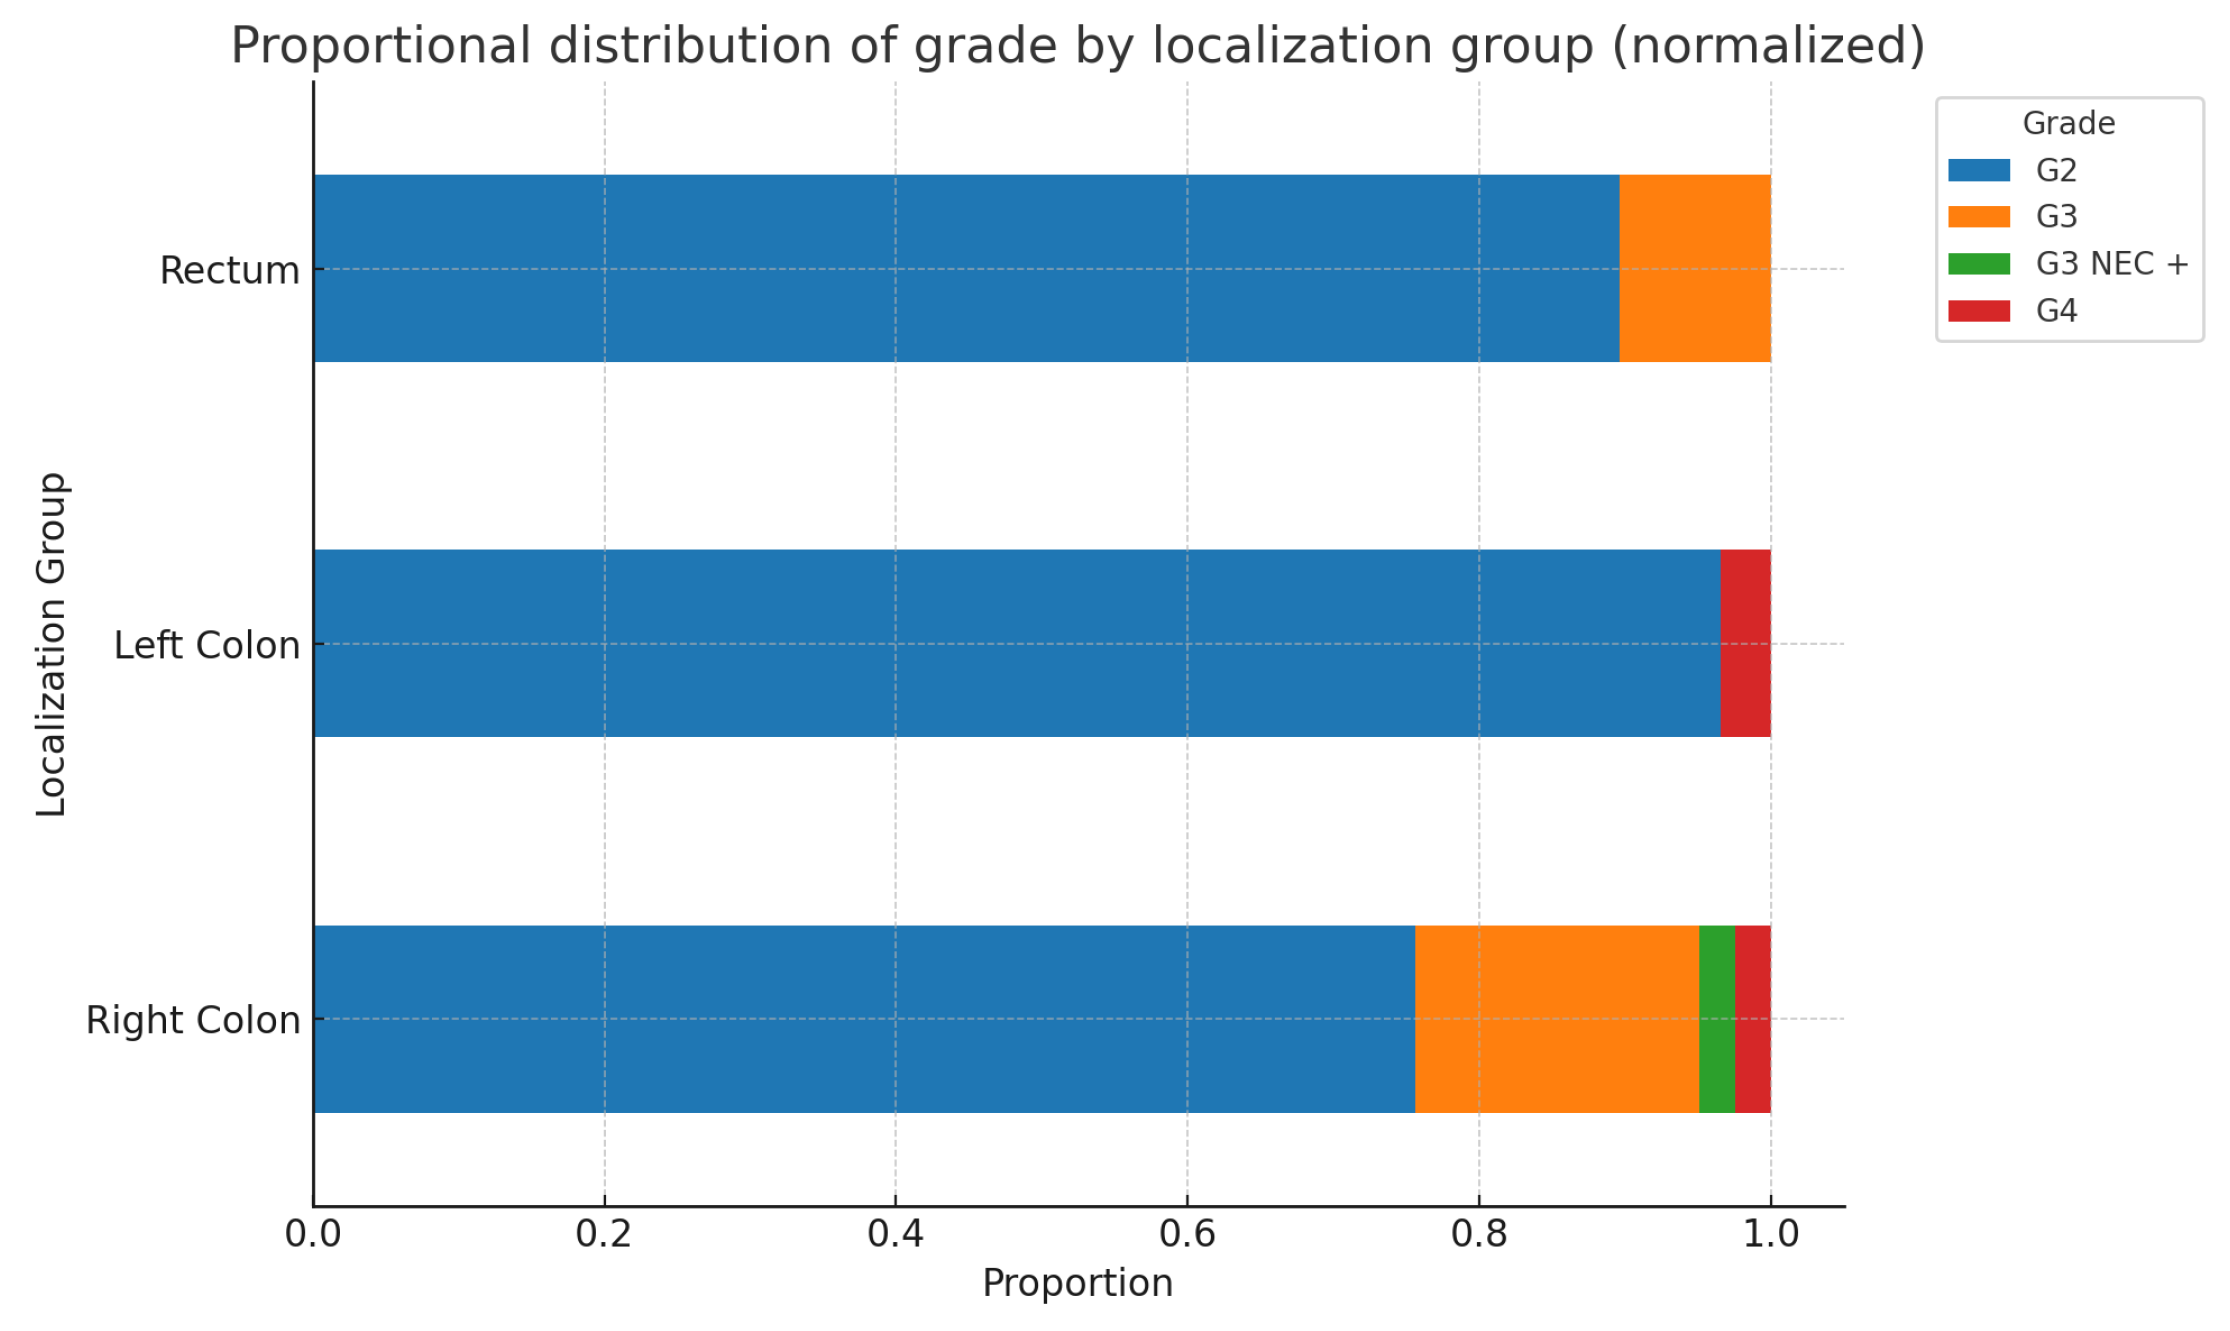
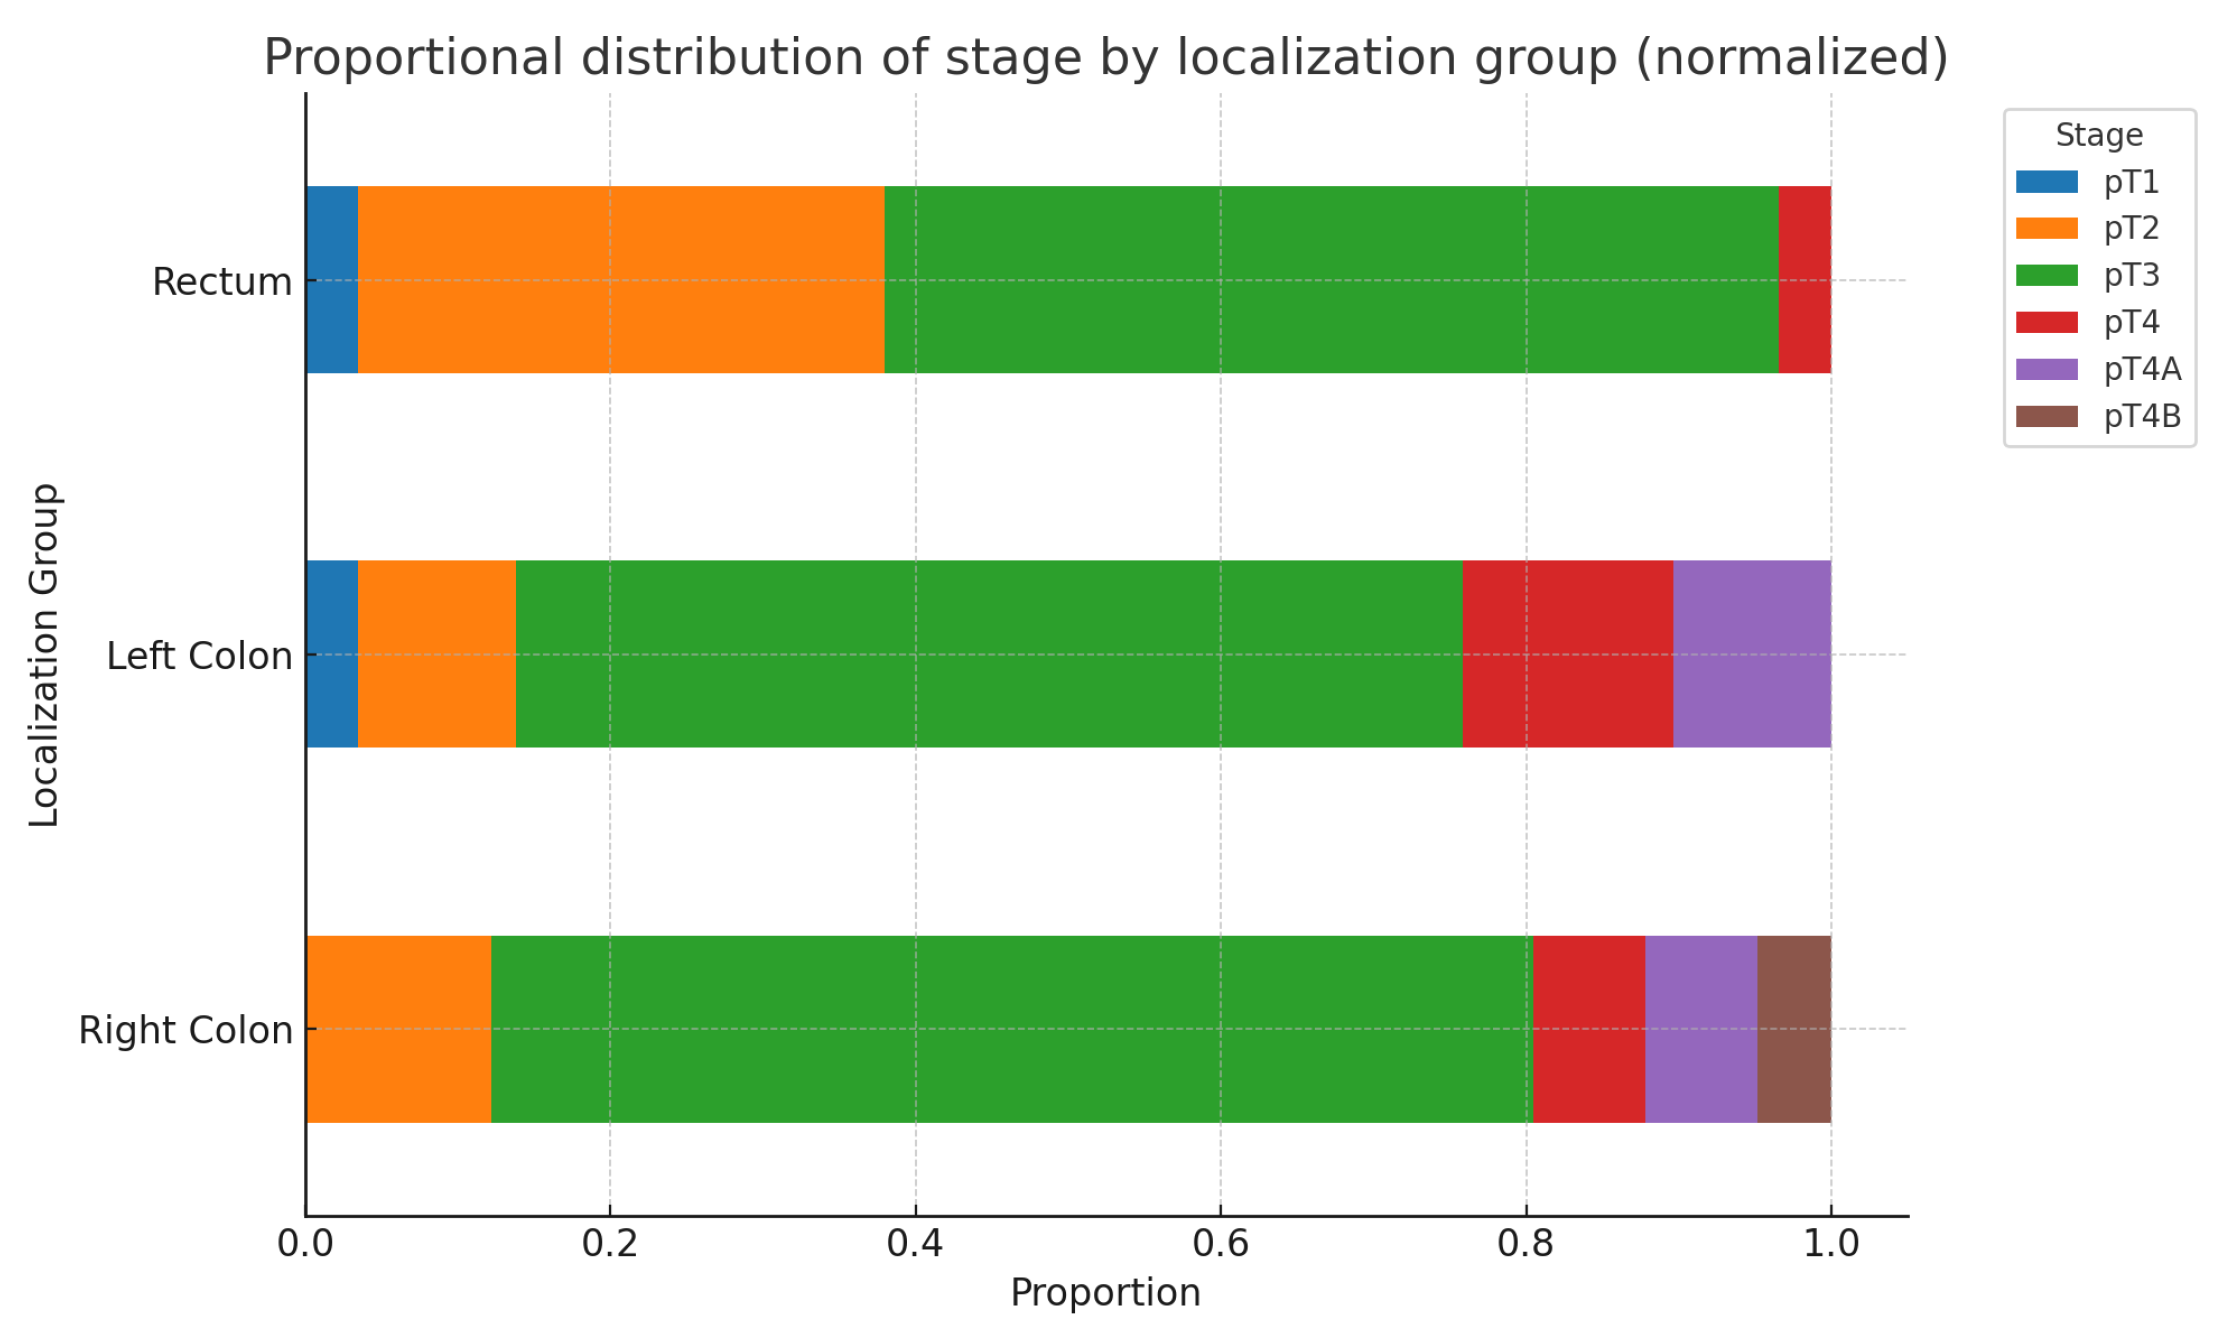
The following two charts in
Figure 9. and
Figure 10*. illustrate the possible relationships between primary tumor localization in the Right colon, Left colon, and Rectum, and the corresponding tumor grade and stage. As seen from the charts and the results of the chi-square test, no statistically significant differences are found. Additionally, when analyzing these parameters separately by sex, no statistically significant differences are detected for either tumor grade(Males: p-value: 0.429, Df=6; Females: p-value: 0.096, Df=4) or stage(Males: p-value: 0.230, Df=8; Females: p-value: 0.154, Df=10).(*The ypT categories were added to their respective T groups).
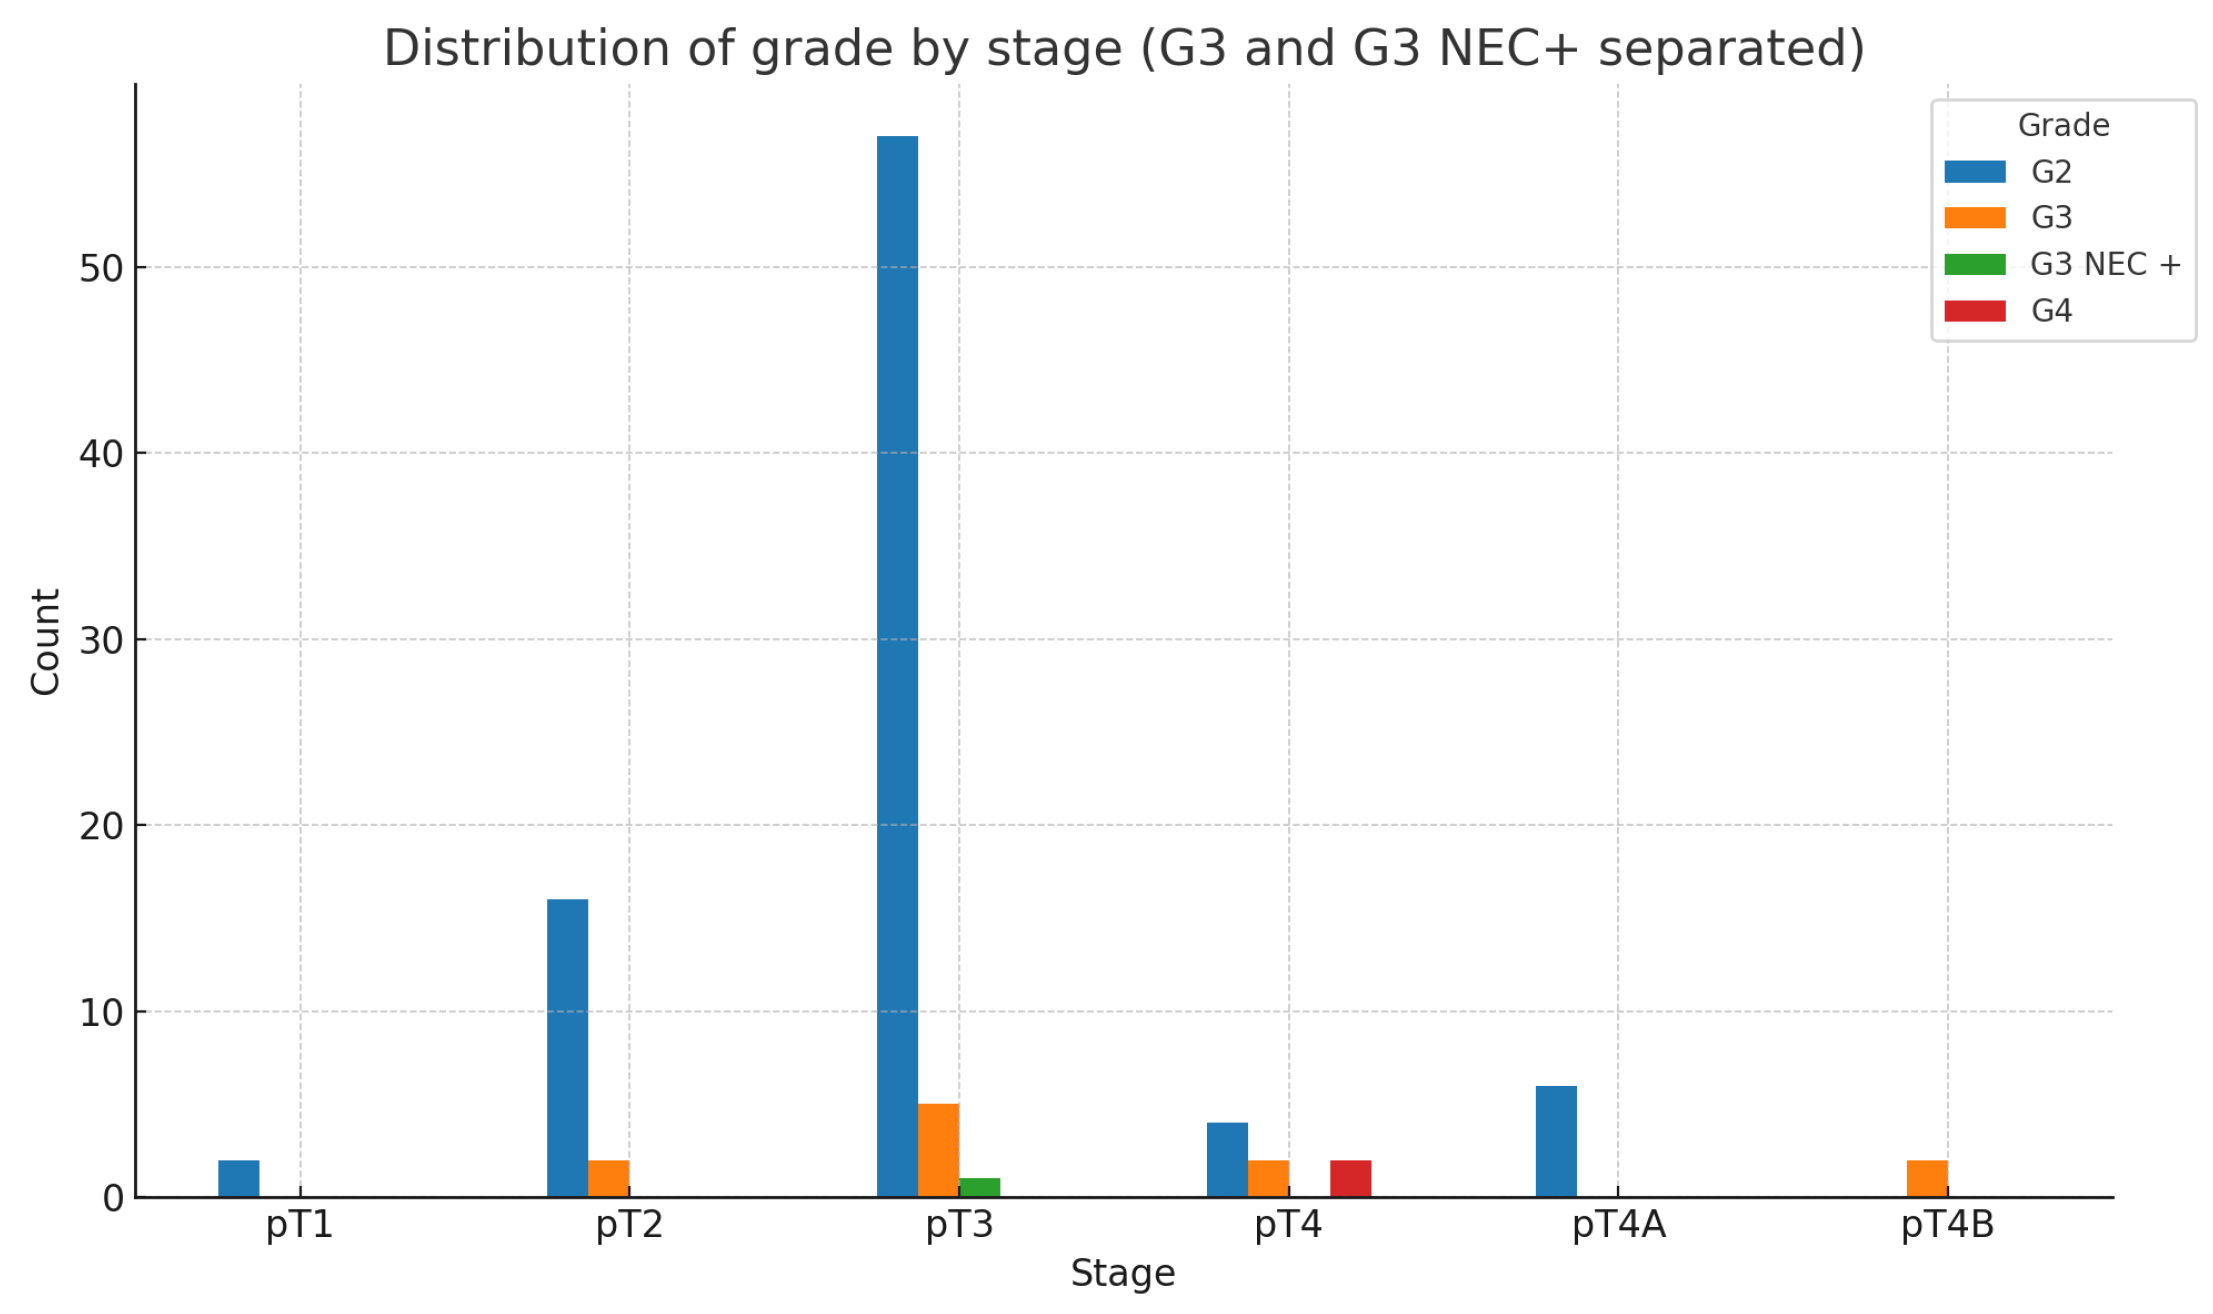
However, when we compare tumor differentiation(G) and tumor stage(pT), the following expected results are obtained-
Figure 11:
As expected, the chi-square test shows that the relationship between grade and stage is highly statistically significant.(: 42.69; p-value:0.00000565; Df=10)
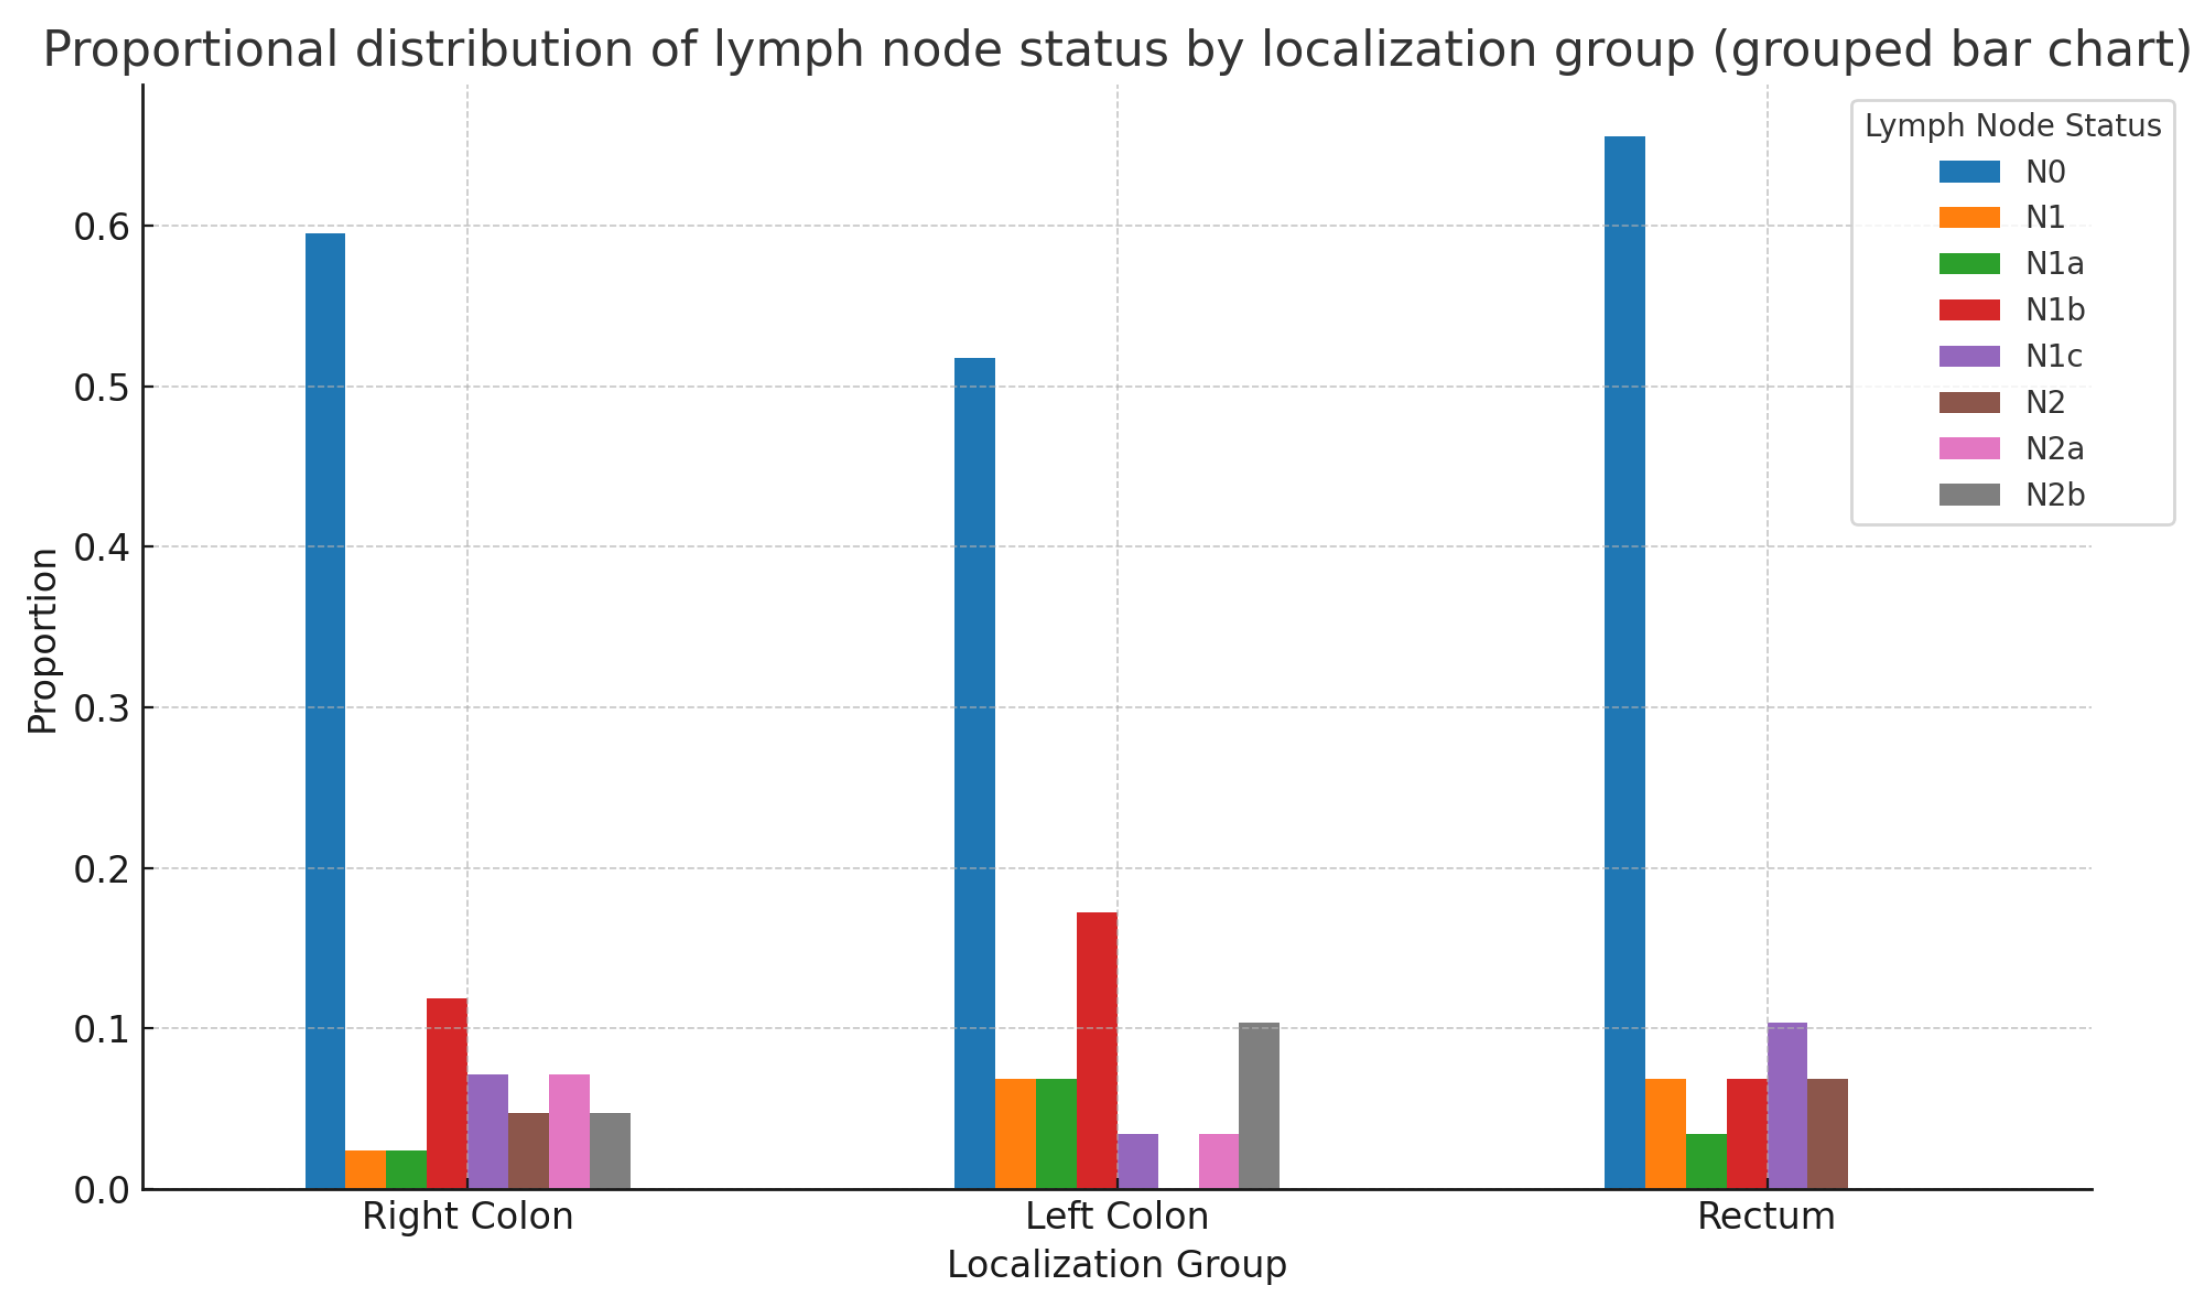
The statistical analysis of the patient sample showed no statistically significant differences in the N status of patients with colorectal adenocarcinoma based on the localization of the primary tumor—Right colon, Left colon, or Rectum—for the entire patient group(
: 11.811; p-value: 0.621; df=14). The same conclusions remain valid when analyzed separately by sex: Males:
: 12.82; p-value: 0.382; df=12; Females:
: 8.38; p-value: 0.869; df=14
Figure 12 represents the whole patient group.
When we compared lymph node status with the degree of tumor differentiation and tumor stage, the results indicated a lack of statistically significant differences once again, as is most clearly seen from the statistical analysis-
Table 3.
In our study, due to the relatively small sample size and the limited number of colorectal cancer patients with observed lymphatic and/or vascular invasion, we did not aim to separately analyze these two morphological characteristics. We also did not focus on distinguishing between so-called intramural and extramural vascular invasion, despite evidence of their negative prognostic significance. For this reason, they will be considered together in the following brief section.
LVI and primary tumor localization: the following
Figure 13 and
Table 4 visually present the relationships between the localization of the primary tumor and lymphovascular invasion (LVI). The results of the chi-square test for the association between LVI status and localization are as follows: Chi-Square value: 2.38; df: 2; p-value: 0.304. The p-value is greater than 0.05, indicating that there is no statistically significant association between LVI status and localization.
LVI and histopatological subtype-
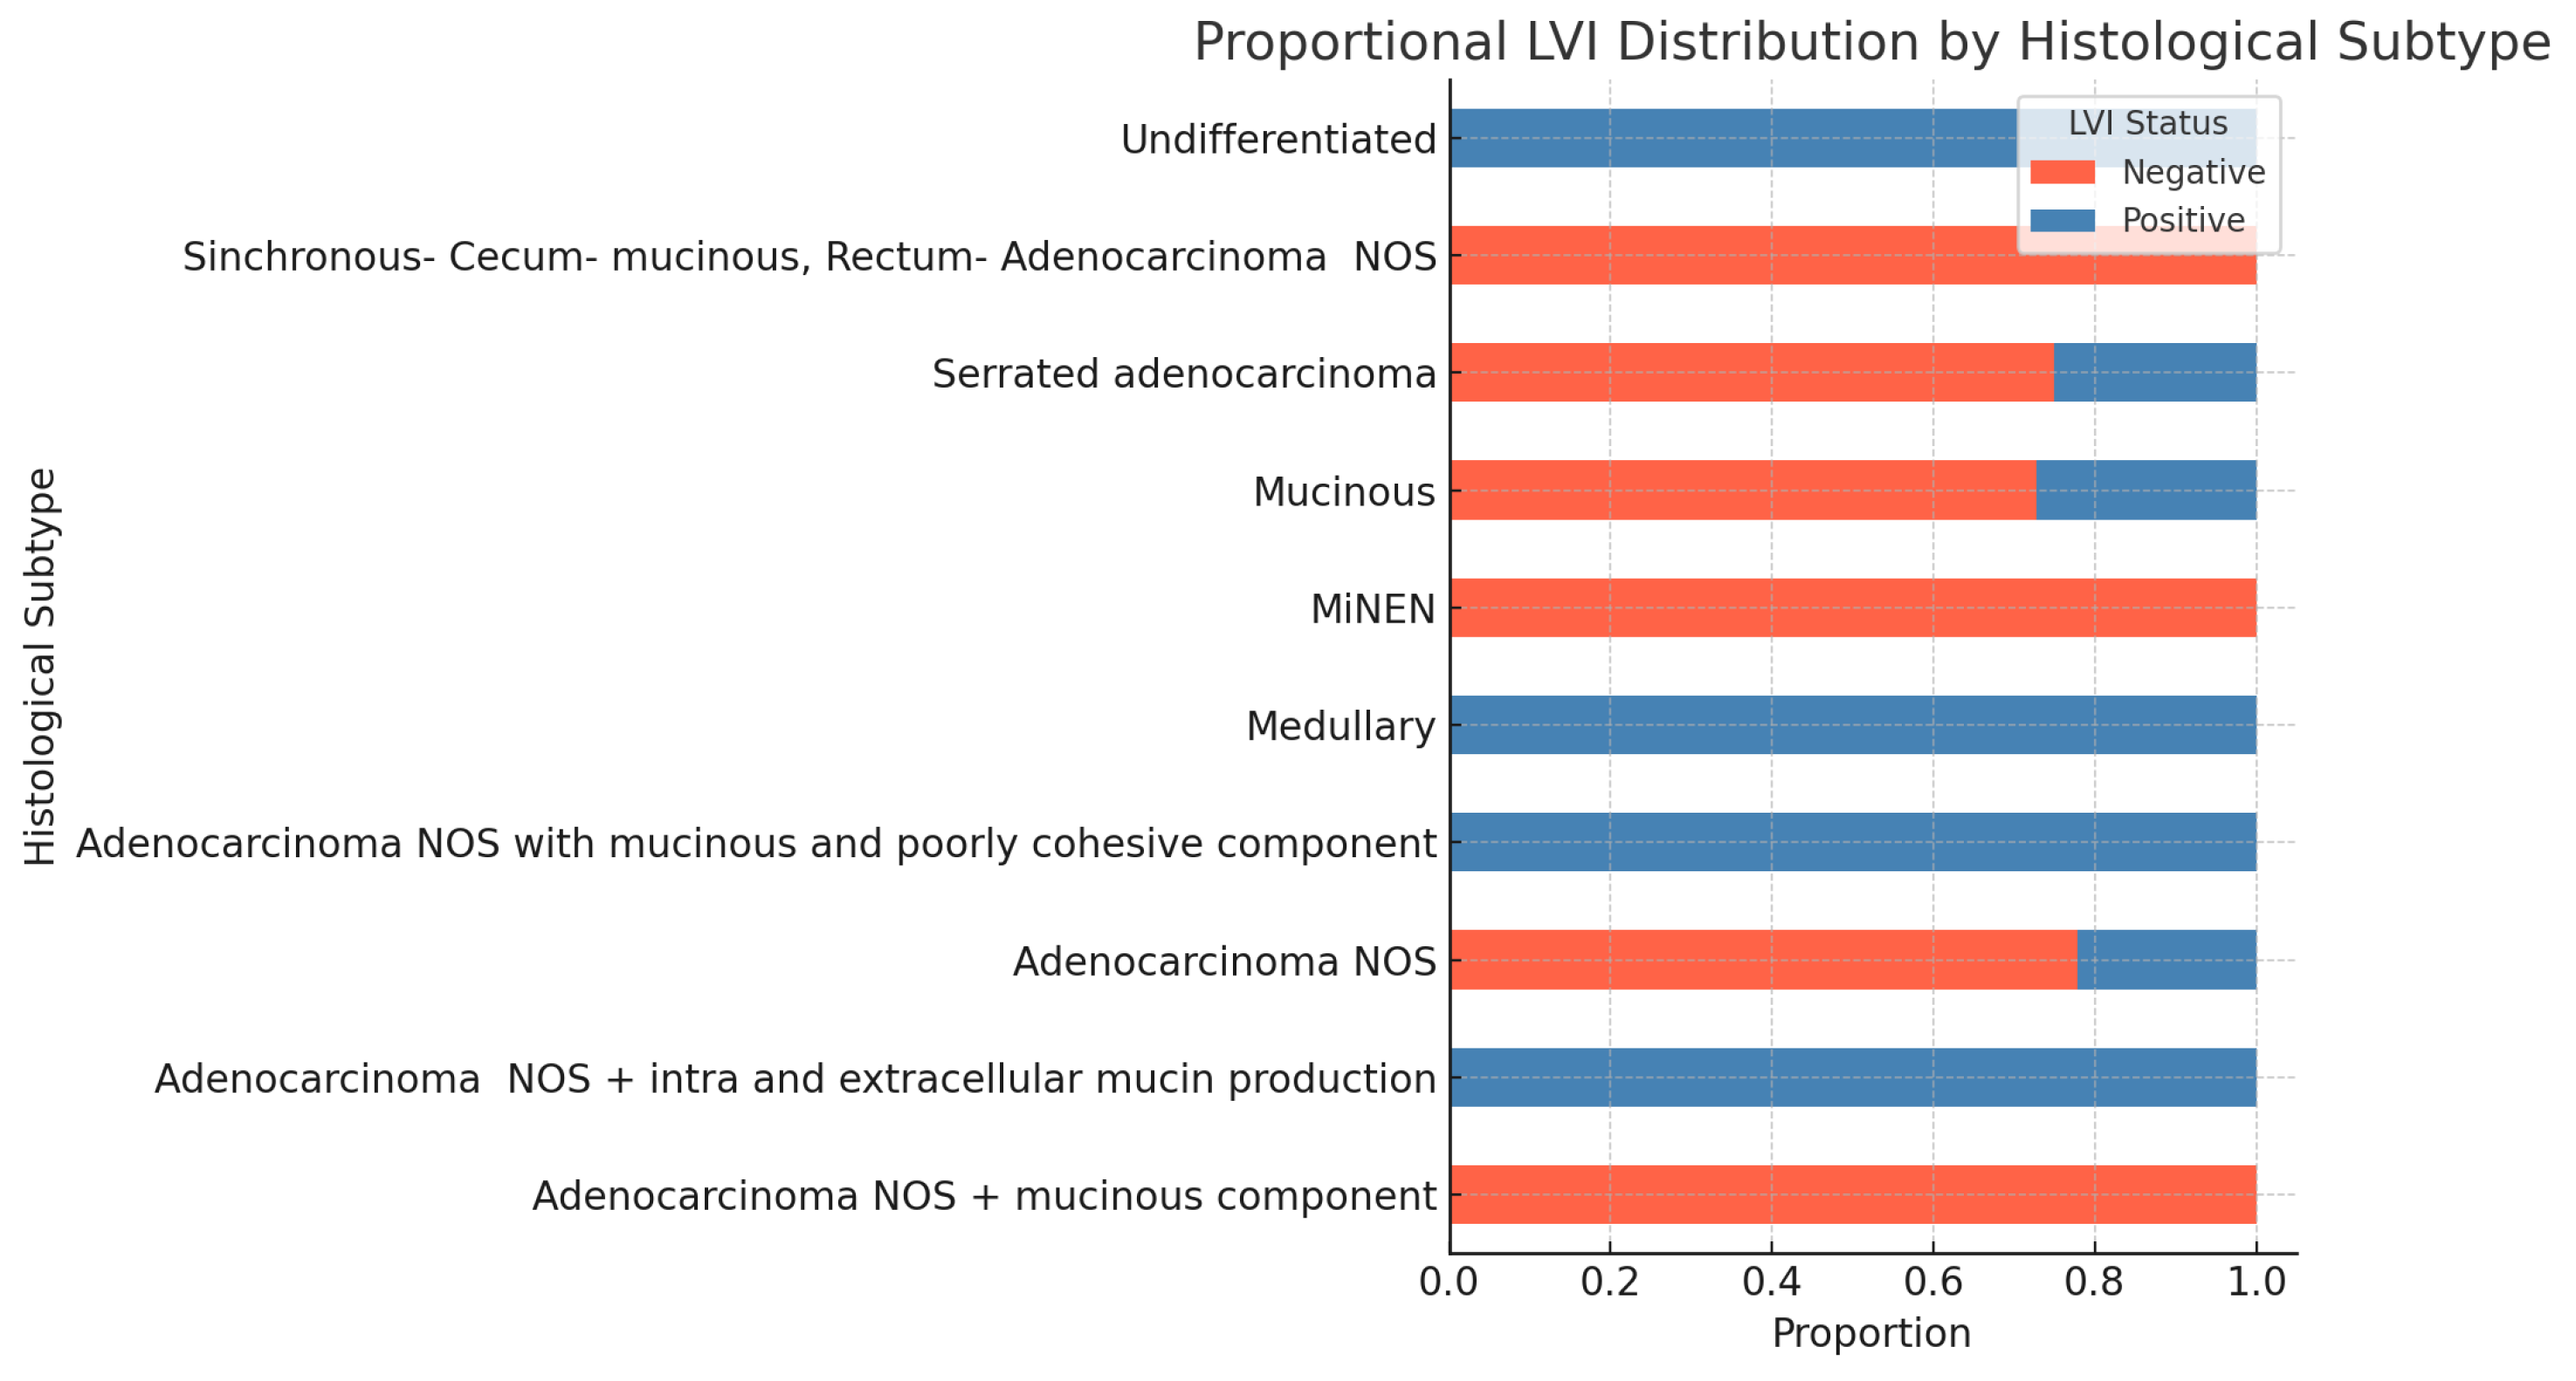
Figure 14 shows the proportion of negative and positive statuses across different tumor histological subtypes. chi-square test The subsequent statistical analysis shows no statistically significant association between lymphovascular invasion (LVI) and histological subtype. The Monte Carlo approximation of the chi-square test for the association between LVI status and histological subtype yields the following results: Chi-Square value: 15.93; df: 9; Monte Carlo p-value: 0.068 However, the p-value is close to significance, suggesting a potential trend that may warrant further investigation.
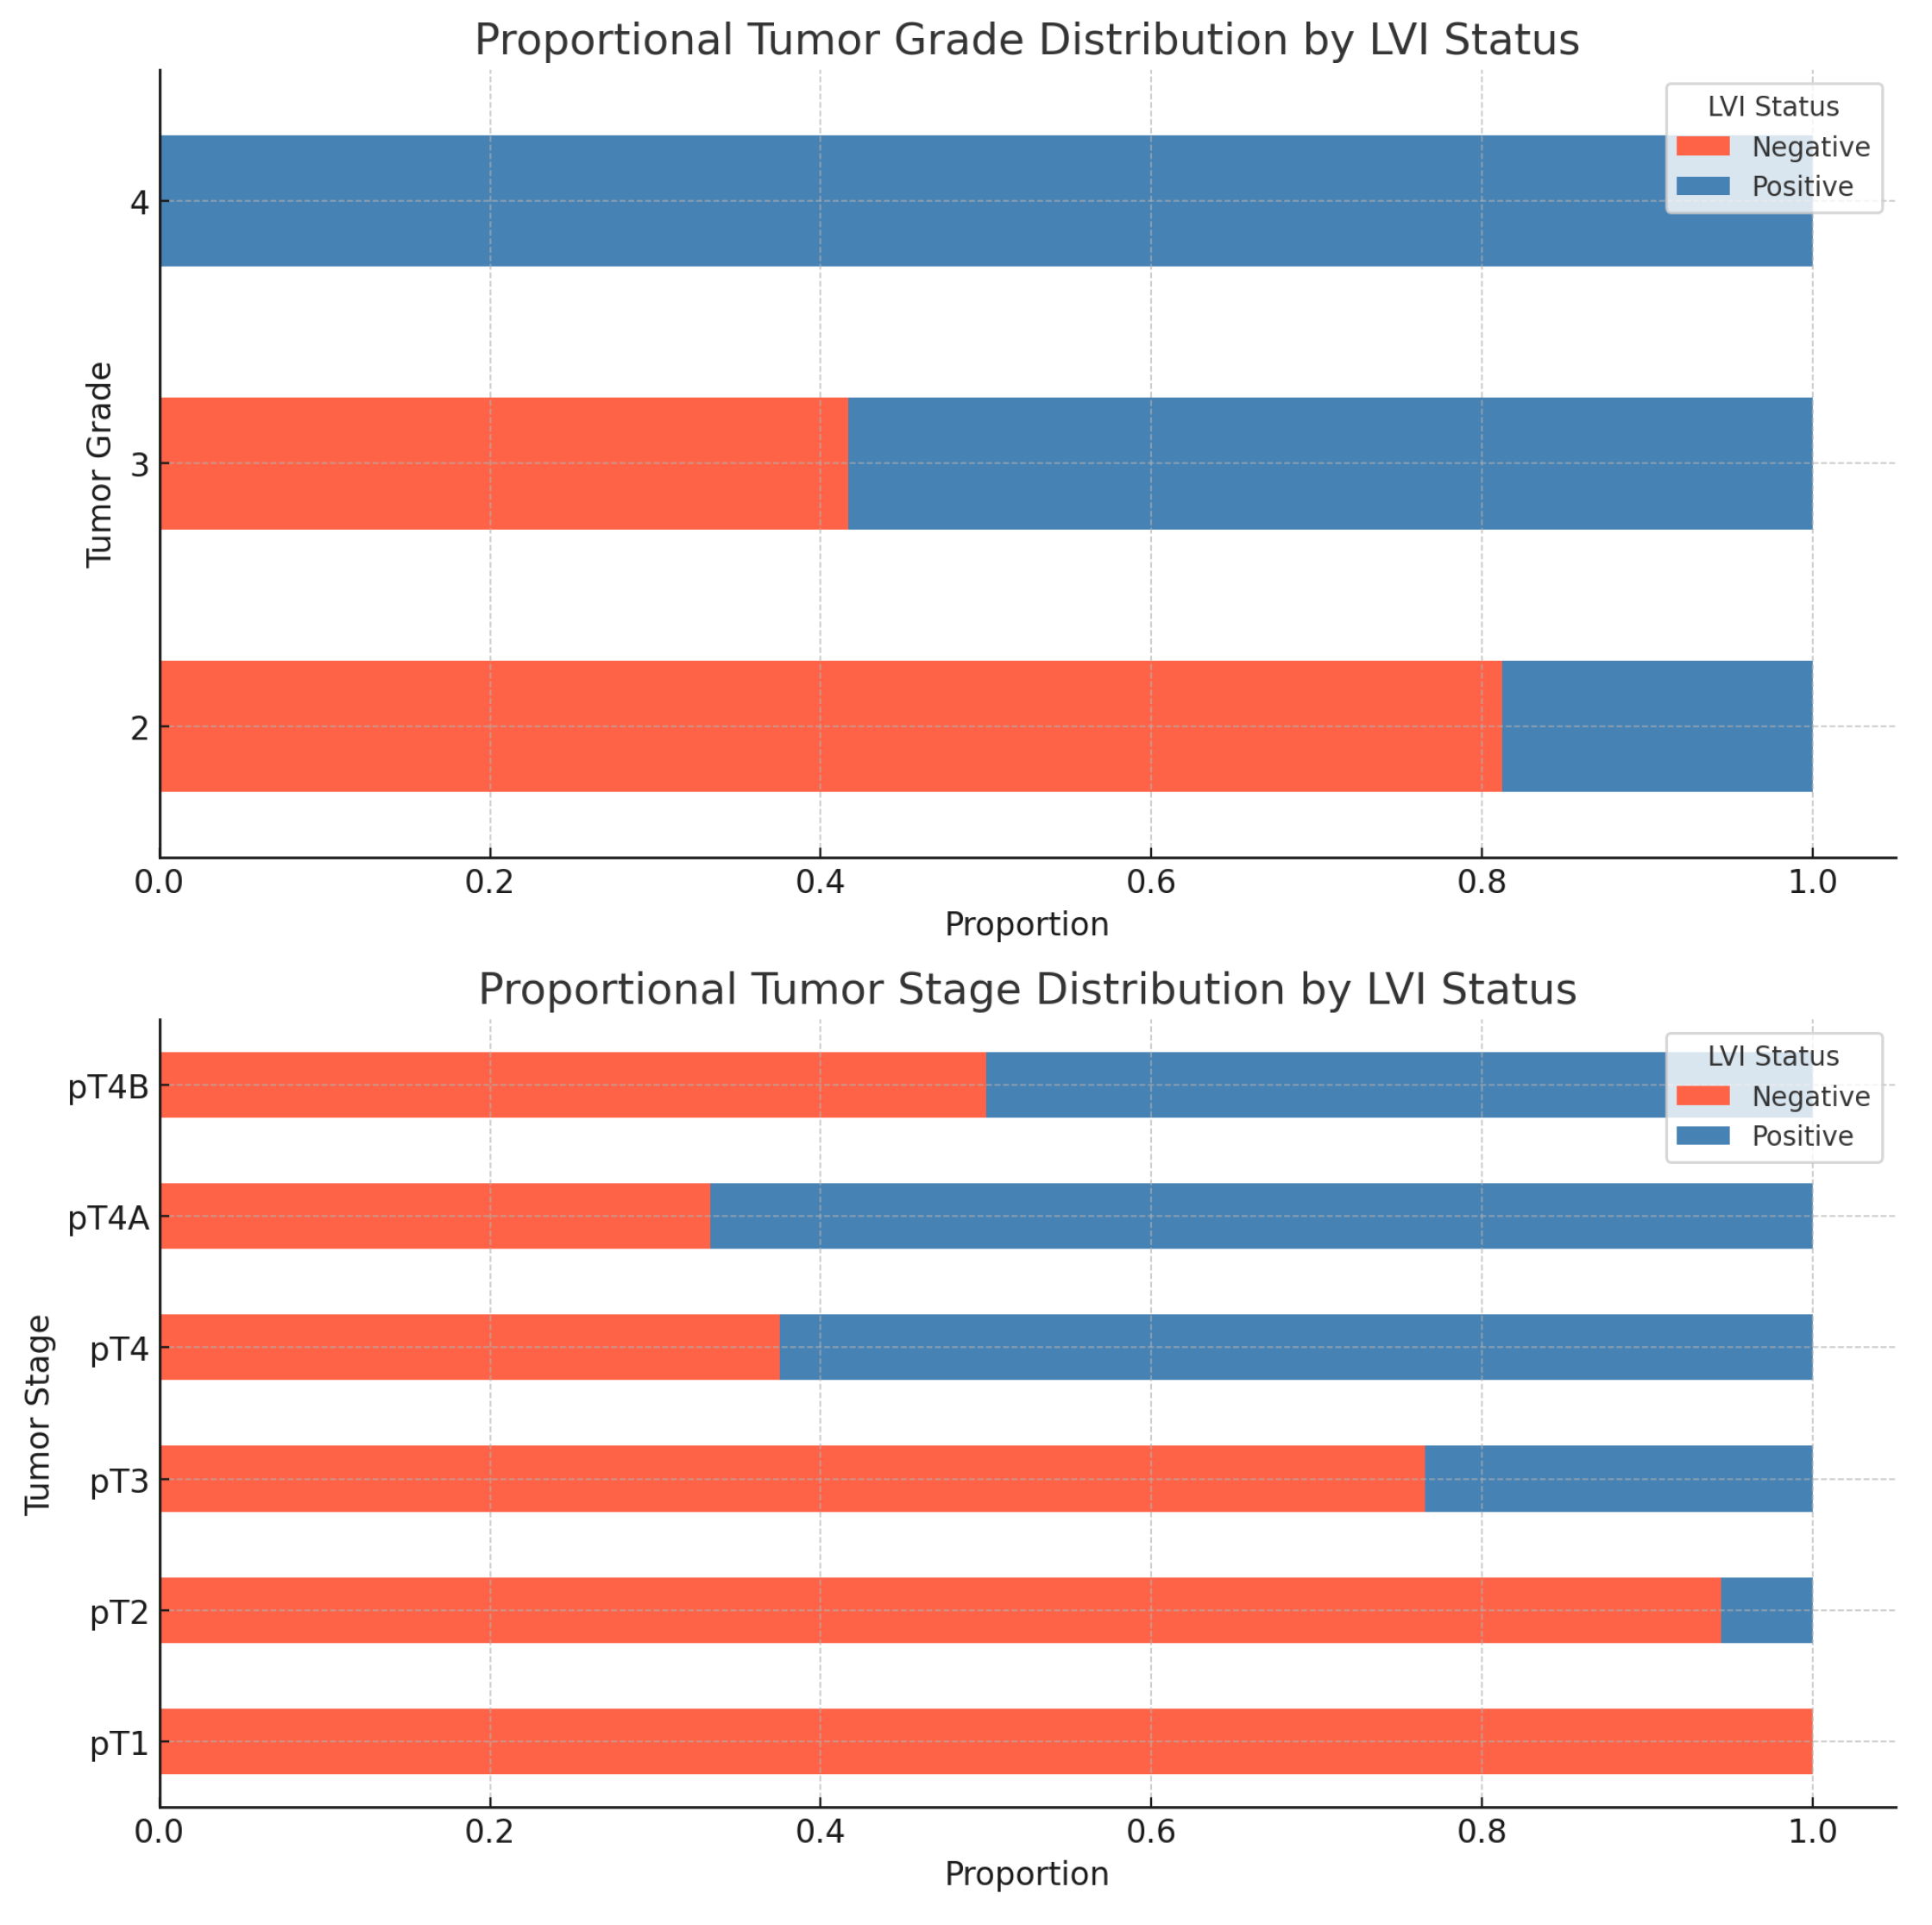
LVI and tumor Grade and Stage- As we expected, there is a statistically significant association between lymphovascular invasion and tumor grade and stage. The results of the chi-square tests are shown in the following
Table 5 and
Figure 15.
The assessment of perineural tumor invasion is based on the presence of tumor cells in any of the three layers of the nerves or tumor cells involving at least one-third of the nerve’s circumference.
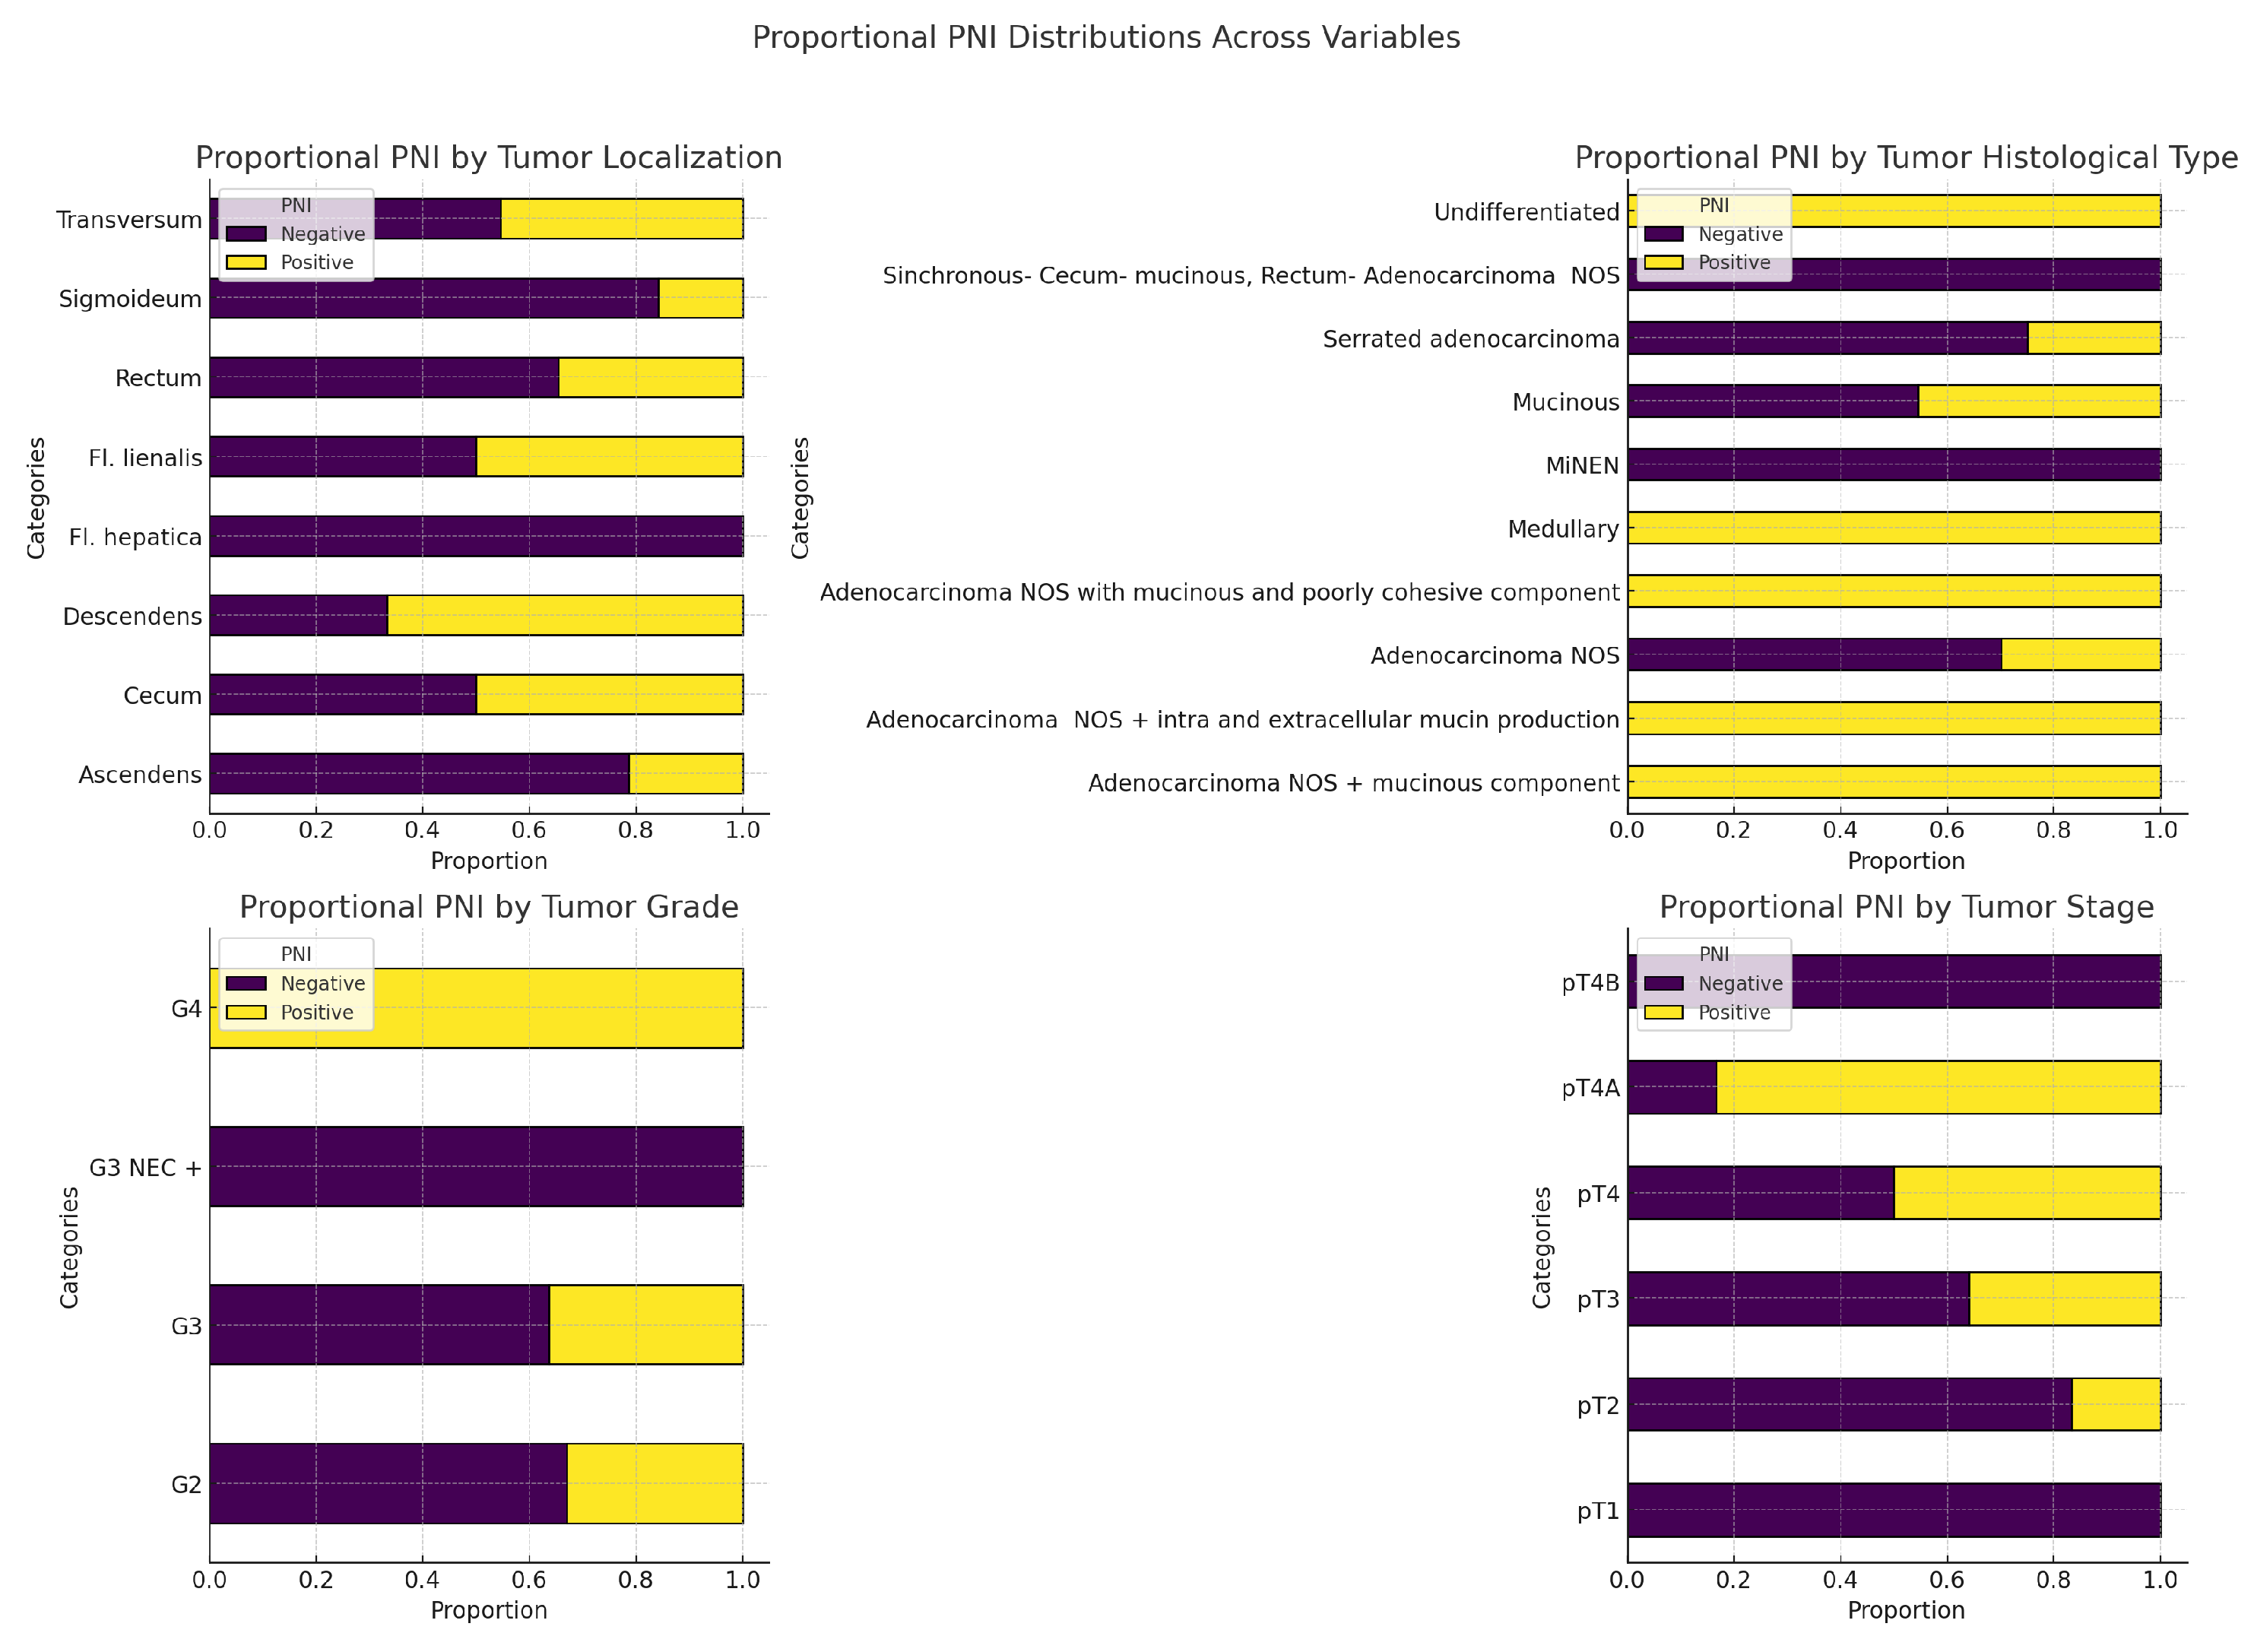
In our study, regarding this tumor characteristic, we observed the following results as shown in
Figure 16 and
Table 6. There are no statistically significant associations between PNI and any of the variables: primary tumor localization, tumor histological subtype, tumor grade, or tumor stage (all p-values > 0.05).
In our study, we focused on evaluating the peritumoral stromal inflammatory reaction at the invasive tumor front, specifically assessing the immune response of the so-called "Crohn-like" type. Our interest lay in investigating the presence or absence of interactions between this immune reaction and other prognostic factors such as tumor budding, MMR status, mutational status, and primary tumor localization, among others. For practical purposes, we conducted a semi-quantitative assessment of the peritumoral stromal inflammatory reaction, categorizing it into three levels: Absent, Moderate, and Marked inflammatory response. After data processing, we obtained the following results:
-Immune response and primary tumor localization-
Figure 17:
The Right Colon has the highest percentage of marked reactions (56.1%), while absent reactions are relatively low.
The Left Colon shows a more balanced distribution, with the majority of cases presenting marked reactions (48%).
The Rectum is unique in having the highest percentage of moderate reactions (55.2%) and the lowest percentage of marked reactions (13.8%).
Results from the Chi-Square test: value: 14.05; (dof): 4; p-value: 0.007. The p-value is statistically significant (below the typical threshold of 0.05). This suggests that there is a strong indication that the distribution of peritumoral stromal immune reactions is not uniform across the three tumor localizations (Right Colon, Left Colon, and Rectum). In other words, the type or intensity of the immune response differs significantly depending on the tumor’s primary location.
-Immune response and histological subtype
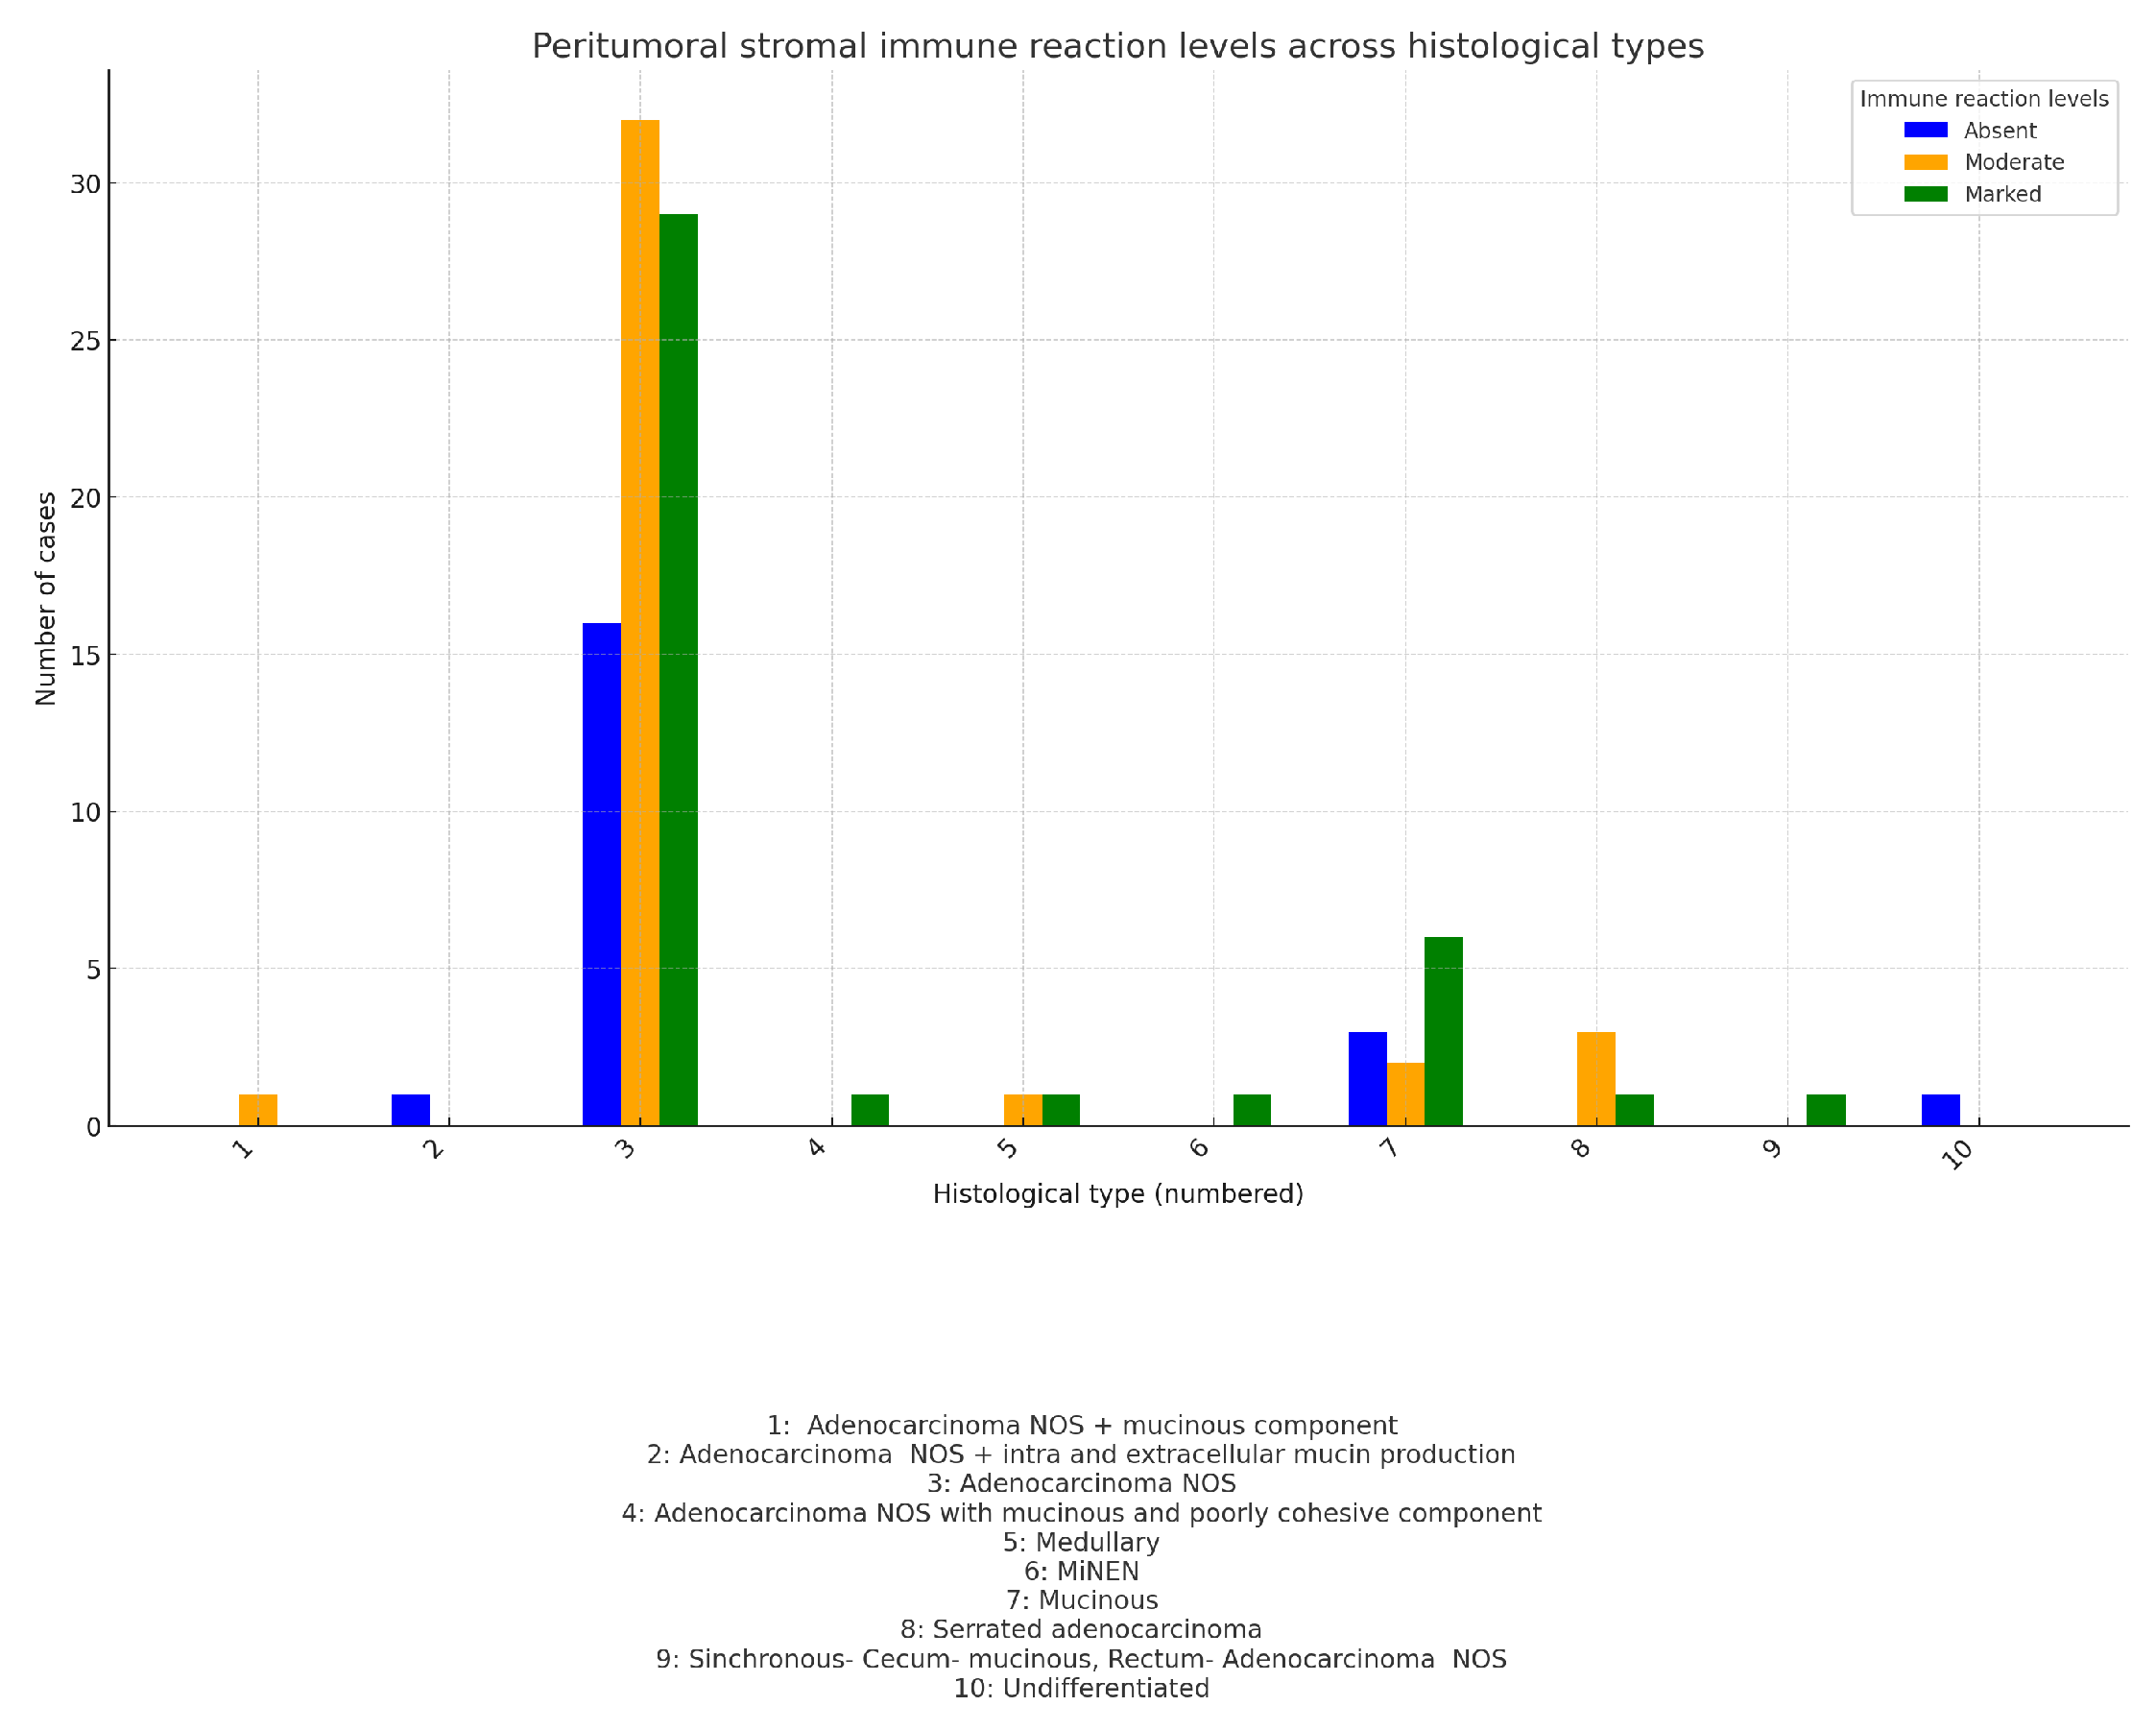
The chart compares the average peritumoral stromal reaction for each histological subtype. Each point represents the average immune response (from absent to marked) within each histological type-
Figure 18:
As shown in the chart, adenocarcinomas NOS with an additional tumor component (such as Synchronous- Cecum- mucinous + Rectum- Adenocarcinoma NOS, Adenocarcinoma NOS + intra- and extracellular mucin production, or MiNEN with an exception) exhibit a marked immune response. Speculatively, this could be due to the tumor heterogeneity and the higher immunogenicity of these tumors.
The results from the Chi-square test are: value: 18.76; p-value: 0.4067; Degrees of freedom (dof): 18 These results show no statistically significant association between histological type and the peritumoral stromal reaction. This suggests that while some histological subtypes may show a pronounced immune response, there isn’t a consistent or significant pattern across the different histological subtypes studied.
-Immune response and tumor grade and stage
In the following
Table 7—the relationships between tumor grade and peritumoral stromal immune reaction, as well as tumor stage and peritumoral stromal immune reaction, are presented. The Chi-square tests conducted for these two characteristics show no statistically significant results for either variable, indicating no strong association between tumor grade or tumor stage and the intensity of the peritumoral stromal immune reaction:
1. Tumor Grade (G1, G2, G3) vs. Peritumoral strormal immune reaction (Normalized): Chi-square value (): 0.185; p-value: 0.996; Degrees of freedom (dof): 4.
2. Tumor Stage (T1, T2, T3, T4) vs. Peritumoral stromal immune reaction (Normalized): Chi-square value (): 0.685; p-value: 0.995; Degrees of freedom (dof): 6.
This suggests that the immune response in the tumor’s surrounding stroma does not significantly correlate with the differentiation (grade) or progression (stage) of the tumor in this particular cohort.
-Immune response and lymph node status
The chi-square test results for the relationship between peritumoral stromal immune reaction and lymph node status are as follows:
Chi-square value: 14.47; p-value: 0.416; Degrees of Freedom: 14.
These results indicate that there is no significant association between peritumoral stromal immune reaction and lymph node status, as the p-value is greater than 0.05. This suggests that variations in the immune reaction in the tumor stroma do not correlate significantly with whether lymph node involvement is present or not.
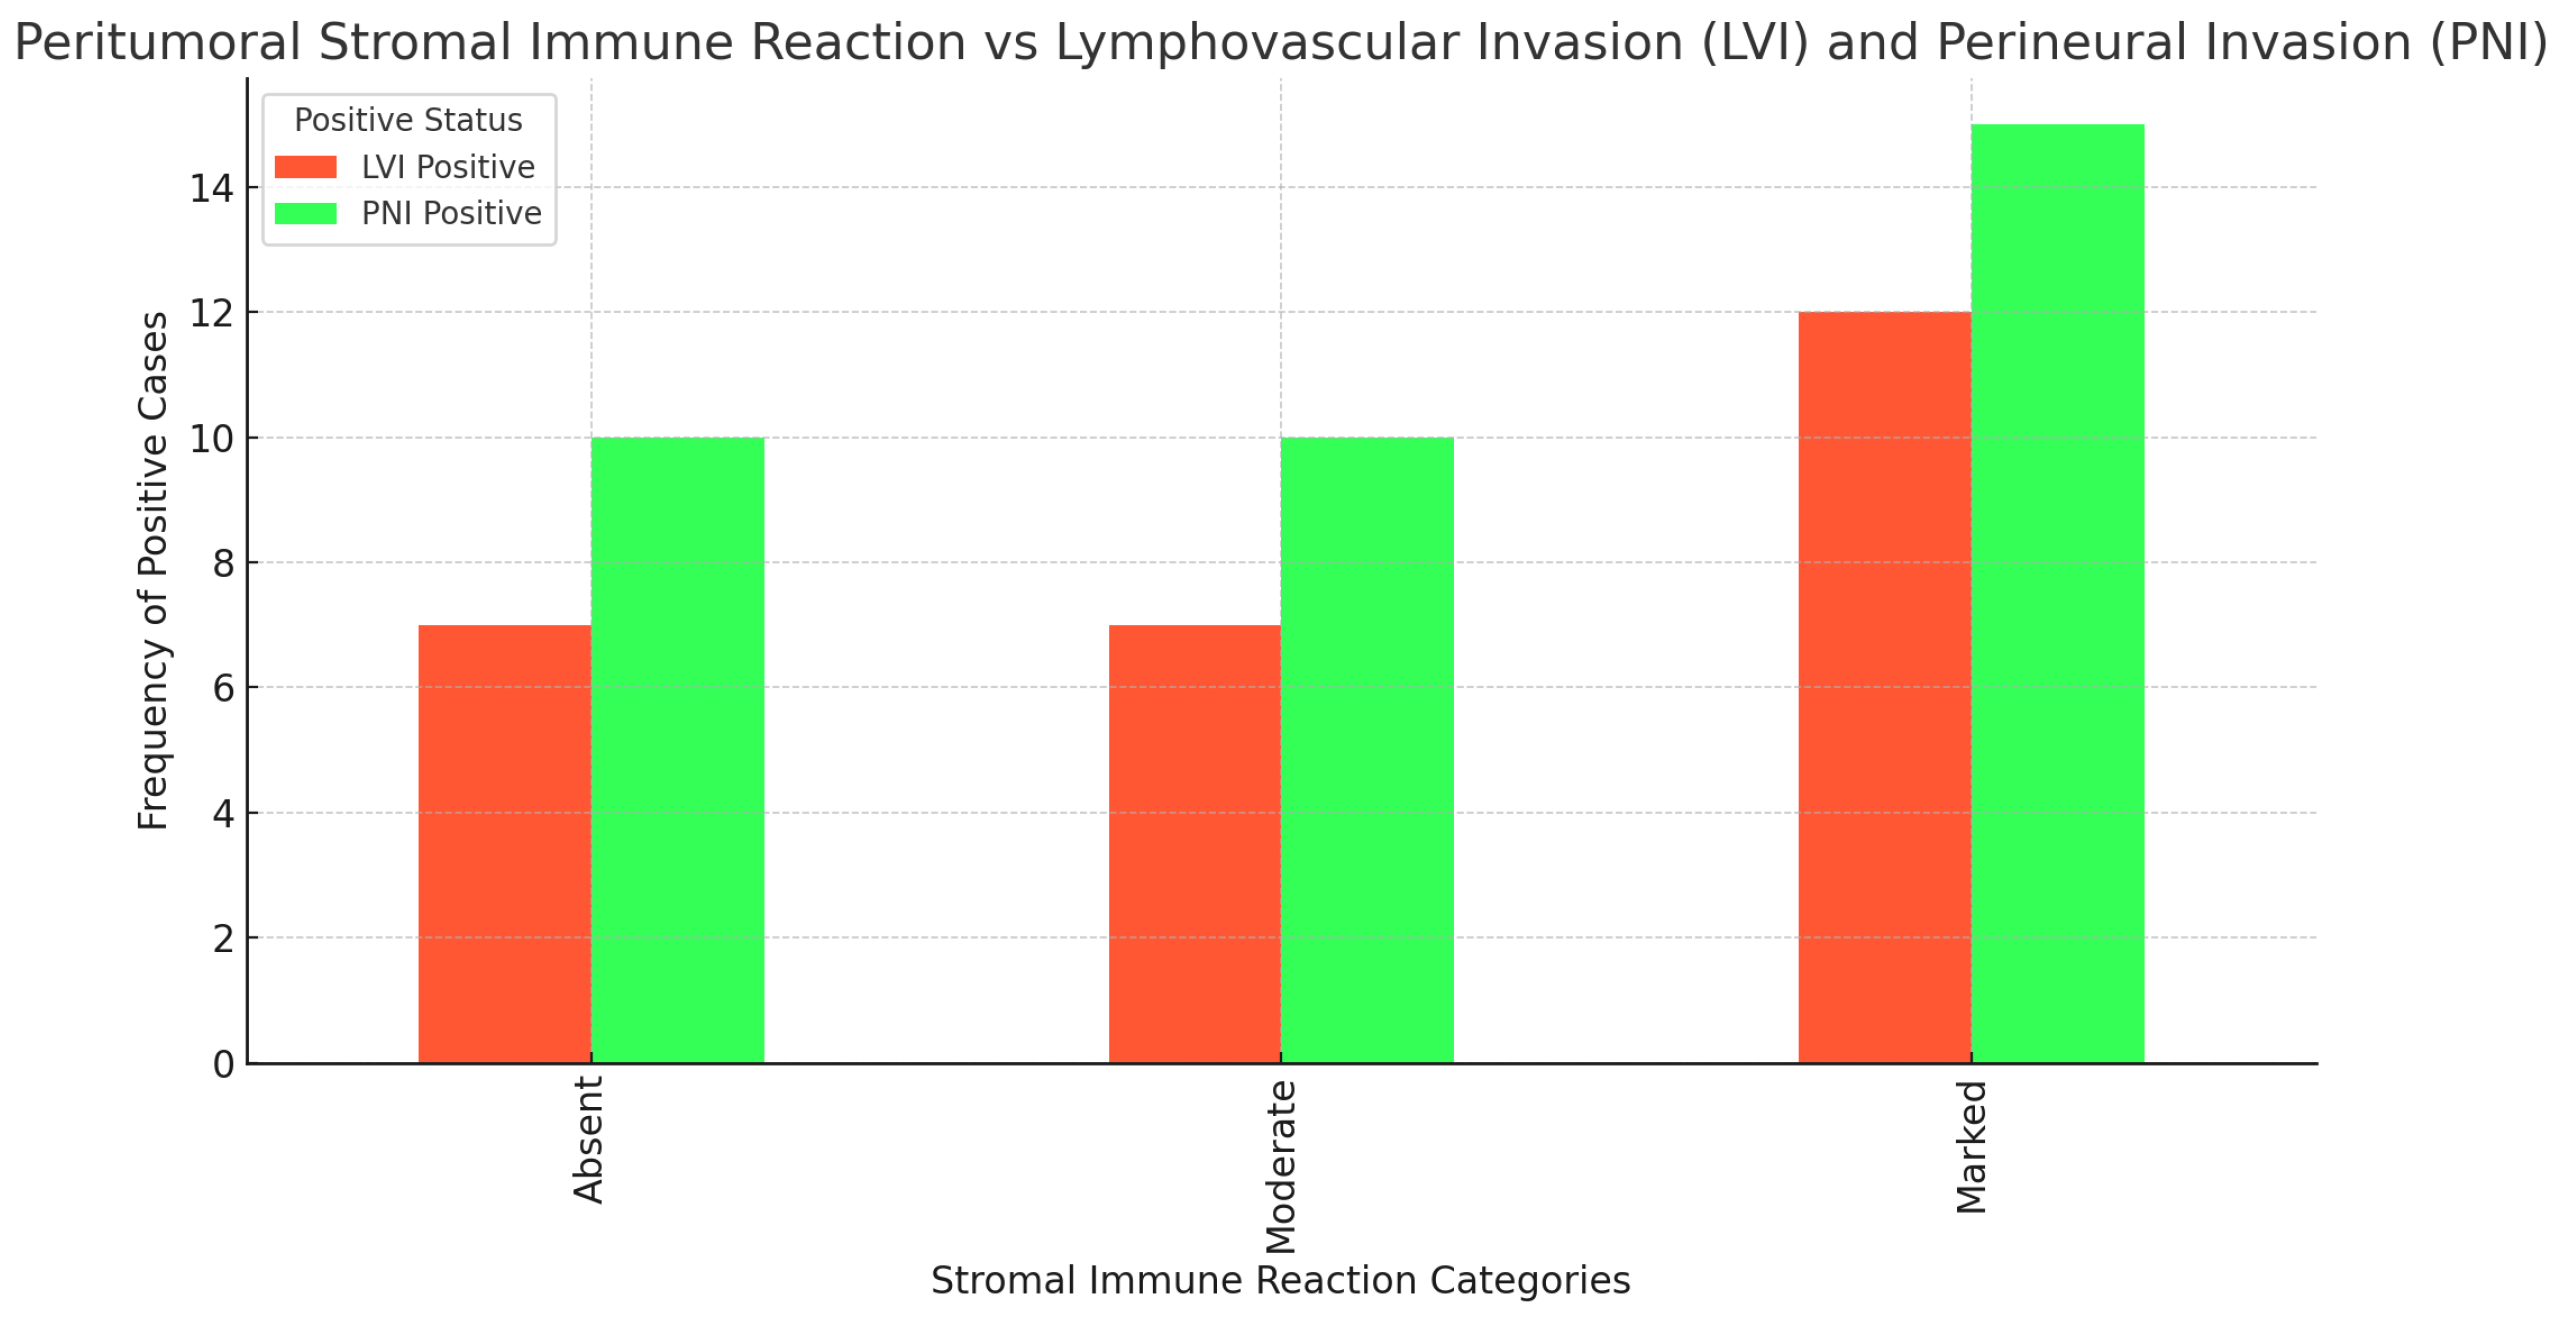
-Immune response and lymphovascular (LVI) and perineural invasion (PNI)
The following
Figure 20 shows the correlation between peritumoral stromal immune reaction and lymphovascular and perineural invasion. As seen from the results of the chi-square tests, there is no statistically significant association between these three examined parameters.
1. Peritumoral stromal immune reaction vs. lymphovascular invasion (LVI):
Chi-square value: 2.23; p-value: 0.327; Degrees of freedom: 2.
2. Peritumoral stromal immune reaction vs. perineural invasion (PNI):
Chi-square value: 3.08; p-value: 0.214; Degrees of freedom: 2.
The lack of a significant correlation suggests that the peritumoral stromal immune reaction does not directly influence lymphovascular or perineural invasion in the context of the cases studied. These results can be interpreted to mean that the immune reaction in the tumor stroma is not a primary predictor of tumor invasiveness in these aspects.
In our study, when assessing tumor budding, we followed the classical scheme described by the International Tumor Budding Consensus Conference (ITBCC) . During the evaluation, we also encountered cases with zero budding, which were included in Bd1 group.
After evaluating the tumor budding, we obtained the following results:
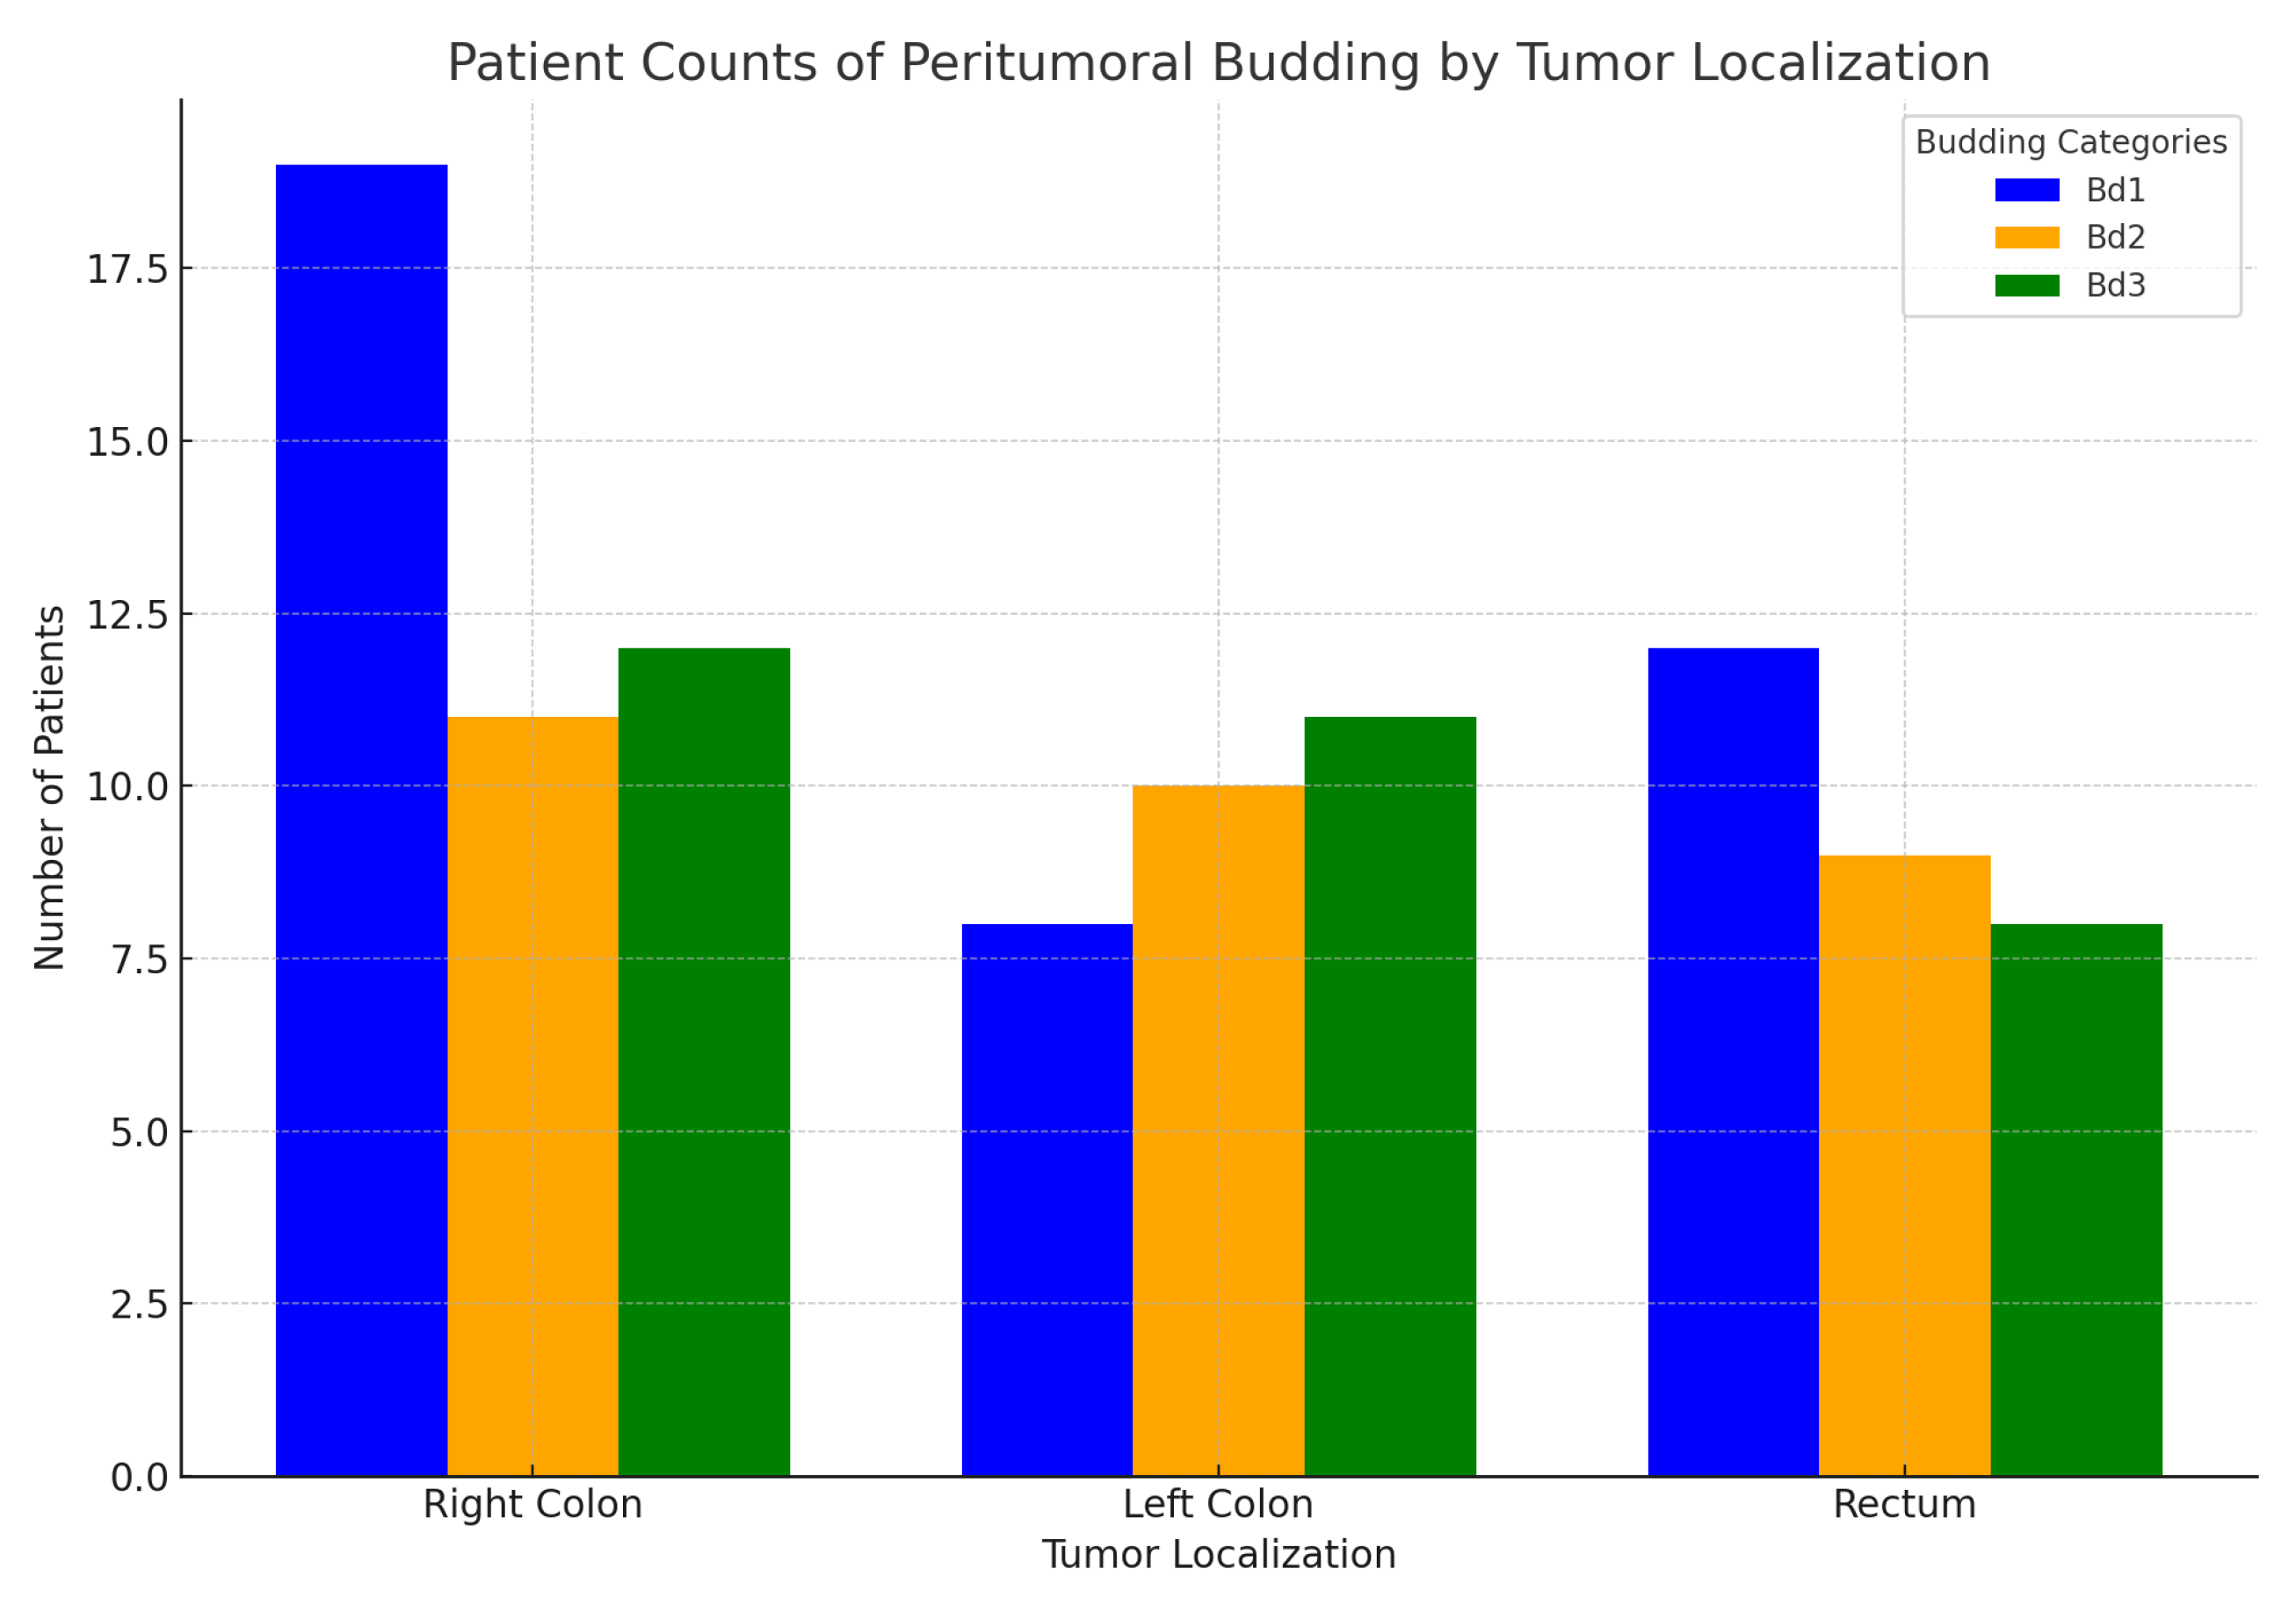
- Peritumoral budding and primary tumor localization- Right colon, Left colon, Rectum:
In the following
Figure 20, the relationship between peritumoral budding Bd1 = (Bd0 + Bd1), Bd2, and Bd3 and the primary tumor localization (Right colon, Left colon, Rectum) is illustrated. As seen in the graph, all grades of peritumoral budding are more prevalent in the right colon, followed by the left colon and rectum. Notably, the Bd1 group in the rectum shows a higher value compared to the left colon.
The subsequent statistical analysis did not reveal statistically significant differences among these groups. The results of the Kruskal-Wallis test indicate: Test statistic: 3.37; p-value: 0.185.
- Peritumoral budding and histological subtype:
In
Figure 21, we can observe the distribution of peritumoral budding across different histological tumor subtypes. The results of the Kruskal-Wallis test for the peritumoral budding groups (Bd1, Bd2, Bd3) across these histological types are as follows: Test statistic: 7.39, p-value: 0.597. These results indicate that there is no statistically significant difference in peritumoral budding across the different histological subtypes, suggesting that the subtype does not have a meaningful impact on the distribution of tumor budding grades for the studied cohort of patients.
The undifferentiated tumors, along with adenocarcinoma NOS that include other tumor components such as mucinous and poorly cohesive types, exhibit the highest average peritumoral budding grade (Bd3). This suggests the correlation between these tumor types and more aggressive behavior.
- Peritumoral budding and tumor grade and stage:
The results for peritumoral budding grades and tumor Grade and Stage are shown in the next
Table 8
The results of the chi-square tests for the association between peritumoral budding and both tumor grade and tumor stage are as follows: and both tumor grade and tumor stage:
1. Tumor grade vs. Peritumoral budding: Chi-square value: 14.39; p-value: 0.0255; Degrees of freedom: 6. This result indicates that there is a statistically significant association between peritumoral budding and tumor grade, as the p-value is below 0.05.
2. Tumor stage vs. Peritumoral budding: Chi-square value: 7.36; p-value: 0.691; Degrees of freedom: 10.
This result suggests that there is no statistically significant association between peritumoral budding and tumor stage, as the p-value is much higher than 0.05.
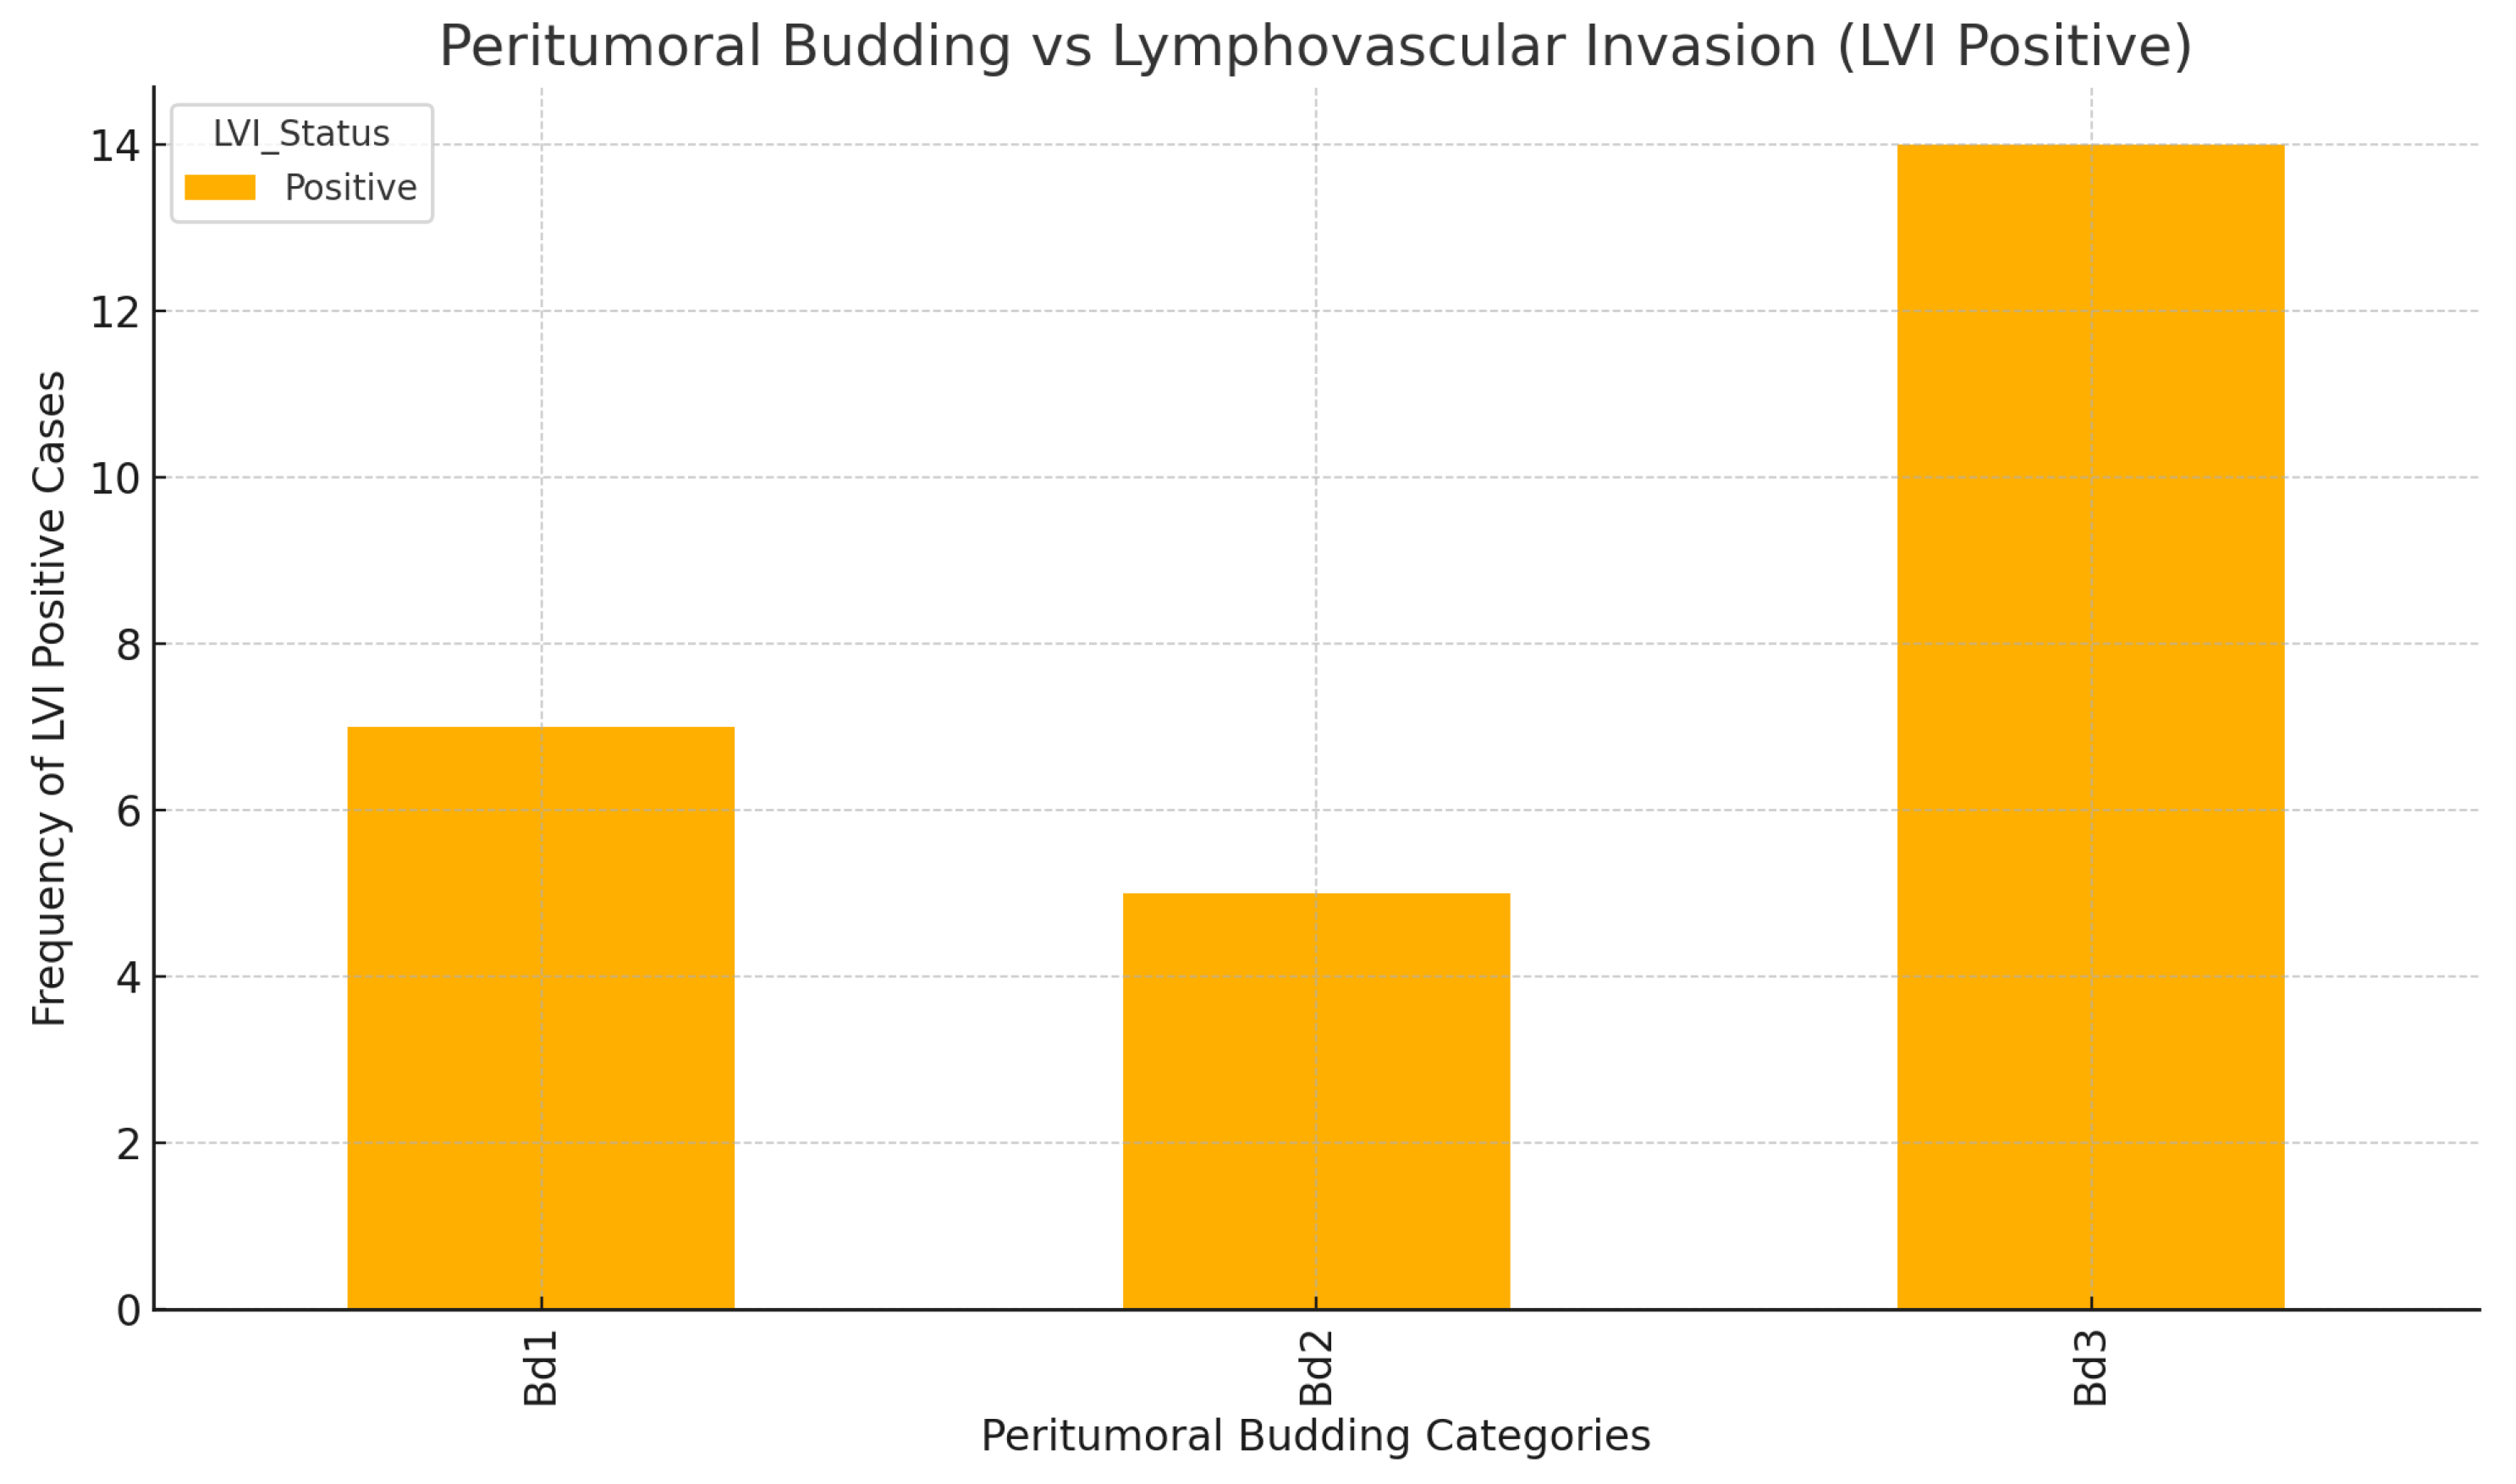
-Peritumoral budding and lymphovascular invasion(LVI) and lymph node status:
The analysis of the association between peritumoral budding and lymphovascular invasion indicates a statistically significant correlation between the two, as illustrated in
Figure 22. The results from the chi-square test are as follows:
Chi-square value: 8.59; p-value: 0.0137; Degrees of freedom: 2
These results suggest that there is a meaningful relationship between peritumoral budding and lymphovascular invasion, implying that higher levels of budding may be associated with an increased likelihood of lymphovascular spread in colorectal cancer. This finding highlights the importance of assessing both peritumoral budding and lymphovascular invasion in the prognostic evaluation of tumors.
On the other hand, the analysis of the association between peritumoral budding and lymph node status shows a lack of statistical significance in this group:
Chi-square value: 19.93; p-value: 0.132; Degrees of freedom: 14.
These results indicate that there is no significant relationship between peritumoral budding and lymph node status in this cohort.
-Peritumoral budding and perineural invasion(PNI)
The chi-square test results for the association between peritumoral budding and perineural invasion (PNI) are as follows:
Chi-square value: 5.59; p-value: 0.061; Degrees of freedom: 2
These results suggest a marginally non-significant association, as the p-value is slightly above the common threshold of 0.05. This indicates that while there may be some correlation between peritumoral budding and PNI, it does not achieve statistical significance.
3. Important prognostic and predictive biomarkers of Colorectal carcinoma (CRC)
-MMR status and primary tumor localization:
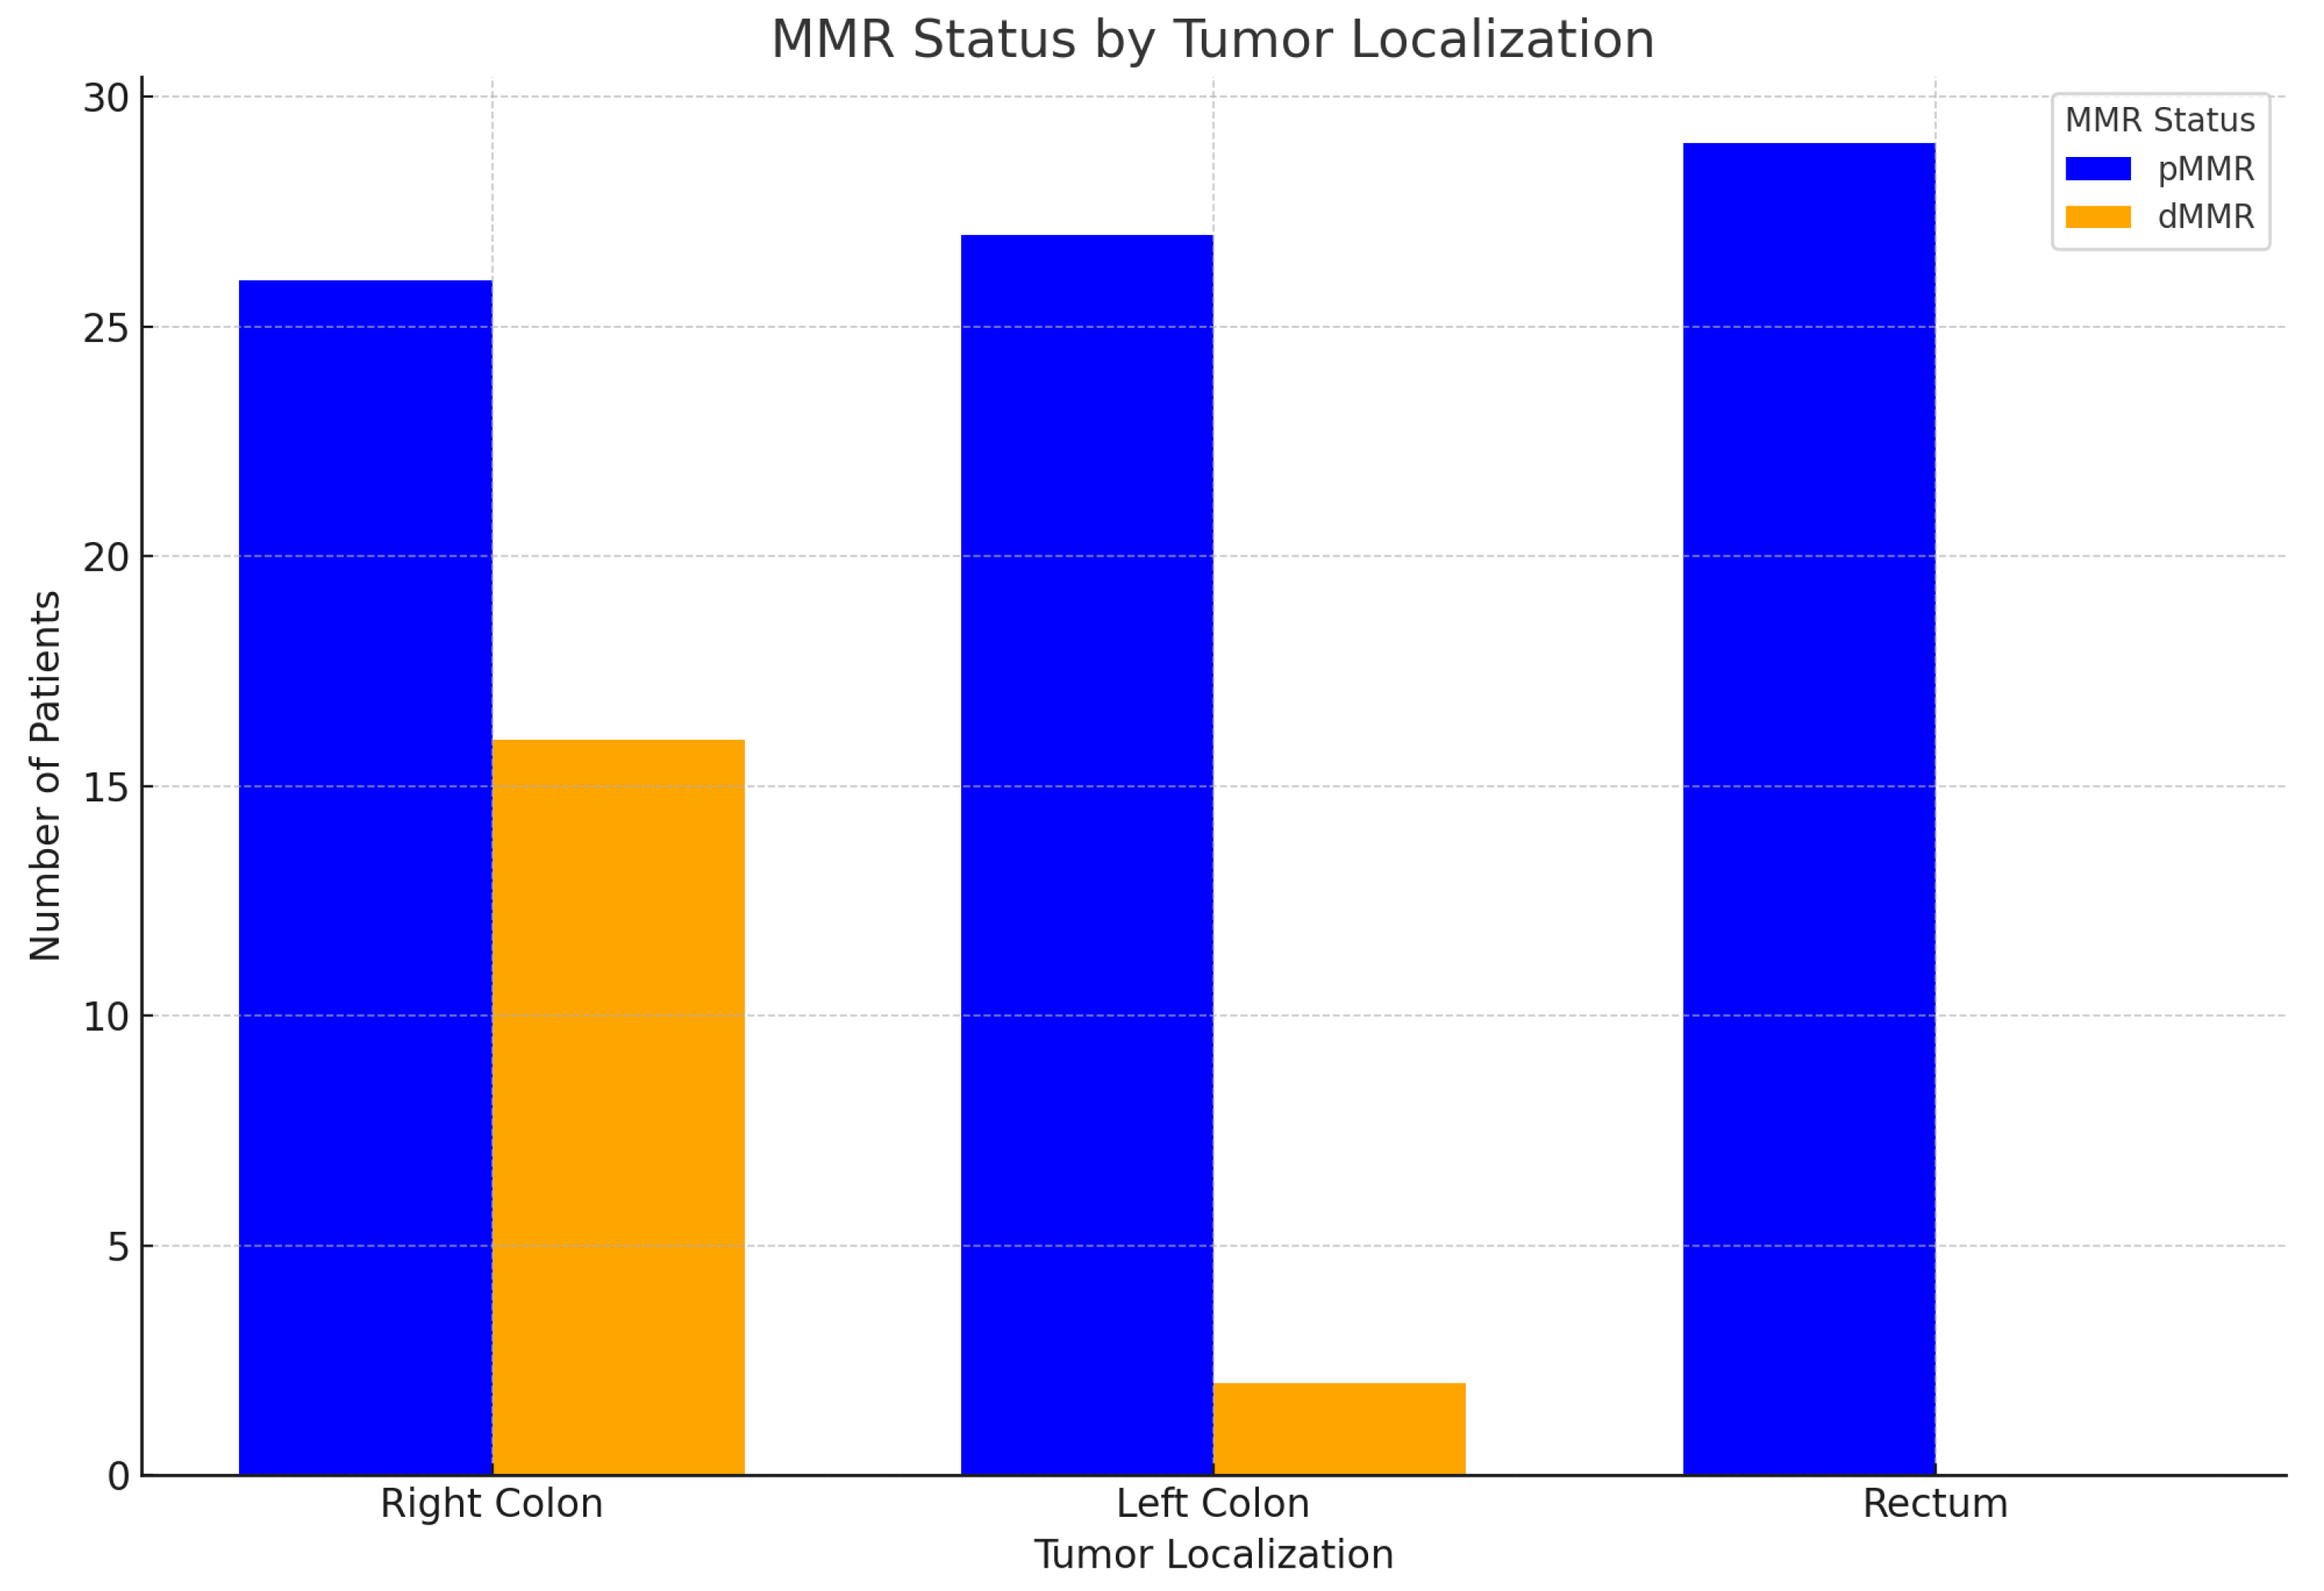
The following
Table 9 presents the results of MMR status in colorectal carcinomas within the studied cohort. As illustrated in the corresponding
Figure 23, the findings can be summarized as follows:
1. dMMR (Deficient mismatch repair): Right-sided tumors dominate: A significant majority of tumors in the dMMR group are localized in the right colon, approximately 89%. This strong association suggests that dMMR status is more prevalent in right-sided colon cancer. Left-sided and rectal tumors are rare: There are very few left-sided tumors and no rectal tumors associated with dMMR, indicating a distinct localization pattern.
2. pMMR (Proficient mismatch repair): Even distribution: Tumors in the pMMR group are more evenly distributed across all localization groups (right, left, rectum), suggesting that pMMR tumors do not have a strong preference for a specific side. Common rectal tumors: Rectal tumors are notably common in the pMMR group, accounting for nearly 35% of cases. This highlights a significant presence of rectal cancer in patients with proficient MMR. Relatively frequent left-sided tumors: Left-sided tumors are also observed more frequently in the pMMR group compared to dMMR, reinforcing the variability in tumor location based on MMR status.
-Statistical analysis:
The chi-square test results confirm a statistically significant association between MMR status and tumor localization (right, left, rectum):
Chi-square value: 20.28; p-value: 0.000039; Degrees of freedom: 2. These results indicate a strong correlation between MMR status and the localization of colorectal tumors.
-MMR status and sex:
For both sexes, the pattern for dMMR is as follows:
-Right Colon: dMMR is most prevalent in the right colon for both males and females. There are 8 cases for males and 8 cases for females localized in the right colon.
-Left Colon: There is only 1 case of dMMR for both males and females in the left colon, showing a much lower prevalence compared to the right colon.
-Rectum: dMMR is absent in the rectum for both males and females. In summary, dMMR is predominantly found in the right colon in both males and females, with very few cases in the left colon and none in the rectum.
-Chi-square value: 0.16; p-value: 0.689; Degrees of Freedom: 1
These results indicate that there is no statistically significant association between MMR status and sex.
-MMR status and histological subtype:
The results for MMR status, histological subtype, and tumor localization are presented in the next crosstab-
Table 10. The key findings for dMMR are as follows:
Adenocarcinoma NOS: All 8 cases of dMMR-associated Adenocarcinoma NOS are located in the right colon.
Medullary: Both cases of Medullary tumors are located in the right colon.
MiNEN: The single case of MiNEN is also found in the right colon.
Mucinous: Most dMMR-associated Mucinous cases (4 out of 6) are found in the right colon, with 2 in the left colon.
Serrated adenocarcinoma: The single case is located in the right colon.
No dMMR-associated tumors were found in the rectum.
The results of the chi-square test for statistical significance for MMR status vs histological subtype and tumor localization are as follows:
Chi-square value: 36.72; p-value: 0.0467; Degrees of freedom: 24.
There is a statistically significant association between MMR status, histological subtype, and tumor localization, as the p-value is slightly below 0.05.
When we examined the relationship between MMR status and histological subtype separately, the following results from the chi-square test were obtained:
Chi-square value: 27.87; p-value: 0.001;Degrees of Freedom: 9.
This indicates that there is a statistically significant association between MMR status and histological subtype, as the p-value is well below the 0.05 threshold.
-MMR status and peritumoral stromal immune reaction
Our results indicated a lack of statistically significant association between MMR status and peritumoral stromal immune reaction. This suggests that the immune response in the peritumoral stroma does not appear to be influenced by the MMR status of the tumors in the studied cohort.
Chi-square value: 4.18; p-value: 0.1239; Degrees of freedom: 2.
-MMR status and lymph node status:
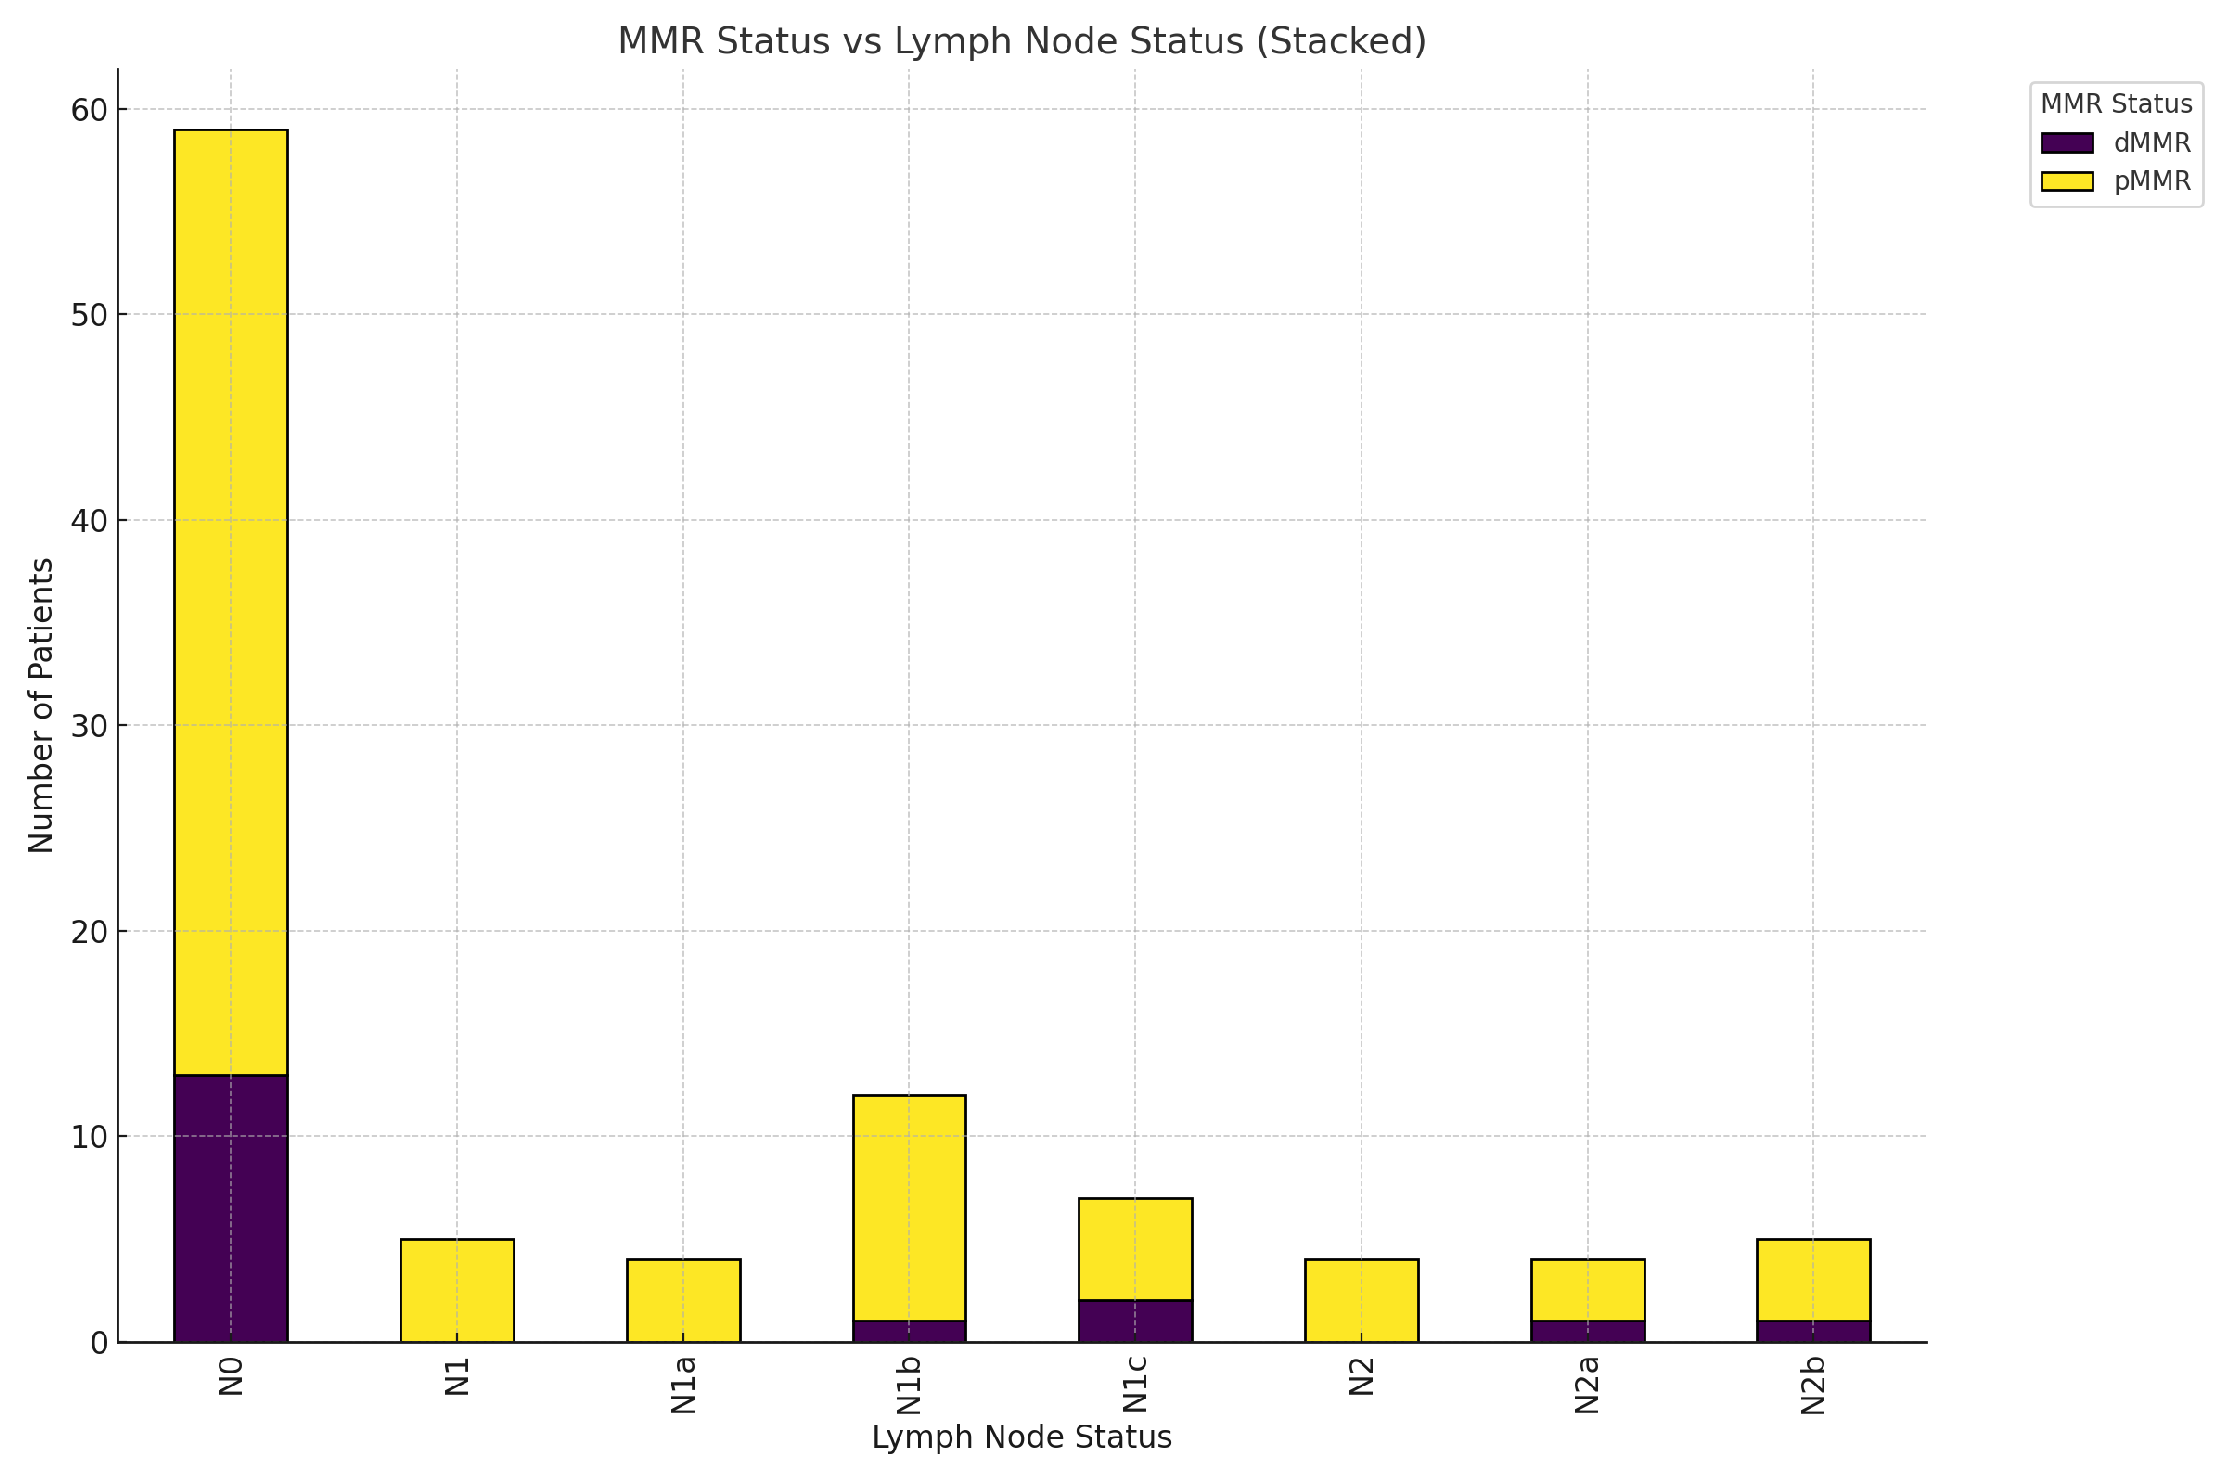
The next chart visualizing the relationship between MMR status (dMMR and pMMR) and lymph node status-
Figure 24.
-MMR status and lymphovascular invasion (LVI) and perineural invasion (PNI) The statistical analysis indicates a lack of statistical significance for the association between MMR status and both lymphovascular invasion (LVI) and perineural invasion (PNI). This suggests that MMR status may not play a significant role in predicting these specific invasive behaviors in the tumors analyzed.
1. MMR Status vs LVI: Chi-square value: 0.24 p-value: 0.63; Degrees of freedom: 1.
2. MMR Status vs PNI: Chi-square value: 0.19; p-value: 0.66; Degrees of Freedom: 1.
In a
Table 11, patients with dMMR and the corresponding MLH1, PMS2, MSH6, and MSH2 abnormalities identified through immunohistochemistry (IHC) are shown, along with the NGS-analyzed mutations in key genes and their combinations. In the last col- umn, we have indicated cases where further investigation for Lynch syndrome is war- ranted. In cases with a suspicion of Lynch syndrome, no additional tests were conducted in our research to confirm the diagnosis. The research team declared a refusal to influence specific diagnostic or therapeutic decisions.
In our study, we utilized the "TruSight Tumor 15" panel from Illumina for Next-Generation Sequencing (NGS). This panel is designed to detect mutations across 15 key genes associated with various cancers, which include: AKT1, BRAF, EGFR, ERBB2(HER2), FOXL2, GNA11, GNAQ, KIT, KRAS, MET, NRAS, PDGFRA, PIK3CA, RET, TP53.
The results obtained from NGS are as follows:
-Observed mutations by sex:
-Proportions of gene mutations by sex:
Females: TP53 is the most frequent mutation, appearing in about 67.4% of cases. KRAS follows with a proportion of 34.9%. Other gene mutations include BRAF (18.6%), PIK3CA (9.3%), and NRAS (4.7%).
Males: TP53 is also the most common, but slightly less frequent than in females, at 57.9%. KRAS appears in 38.6% of cases. Other gene mutations include PIK3CA (12.3%), BRAF (15.8%), and NRAS (3.5%).
Both sexes show a higher prevalence of TP53 mutations, but females have a slightly higher proportion. PIK3CA mutations appear more often in males compared to females.
The two-proportion Z-test for each gene mutation between males and females are as follows:
AKT1: Z-Statistic: 0.202; p-value: 0.840;
TP53: Z-Statistic: 0.974; p-value: 0.330;
KRAS: Z-Statistic: -0.381; p-value: 0.703;
BRAF: Z-Statistic: 0.371; p-value: 0.711;
PIK3CA: Z-Statistic: -0.471; p-value: 0.637;
NRAS: Z-Statistic: 0.289; p-value: 0.773;
All p-values are greater than the common significance level of 0.05, indicating no statistically significant differences in the proportions of any gene mutation between males and females.
-Observed mutations vs primary tumor localization:
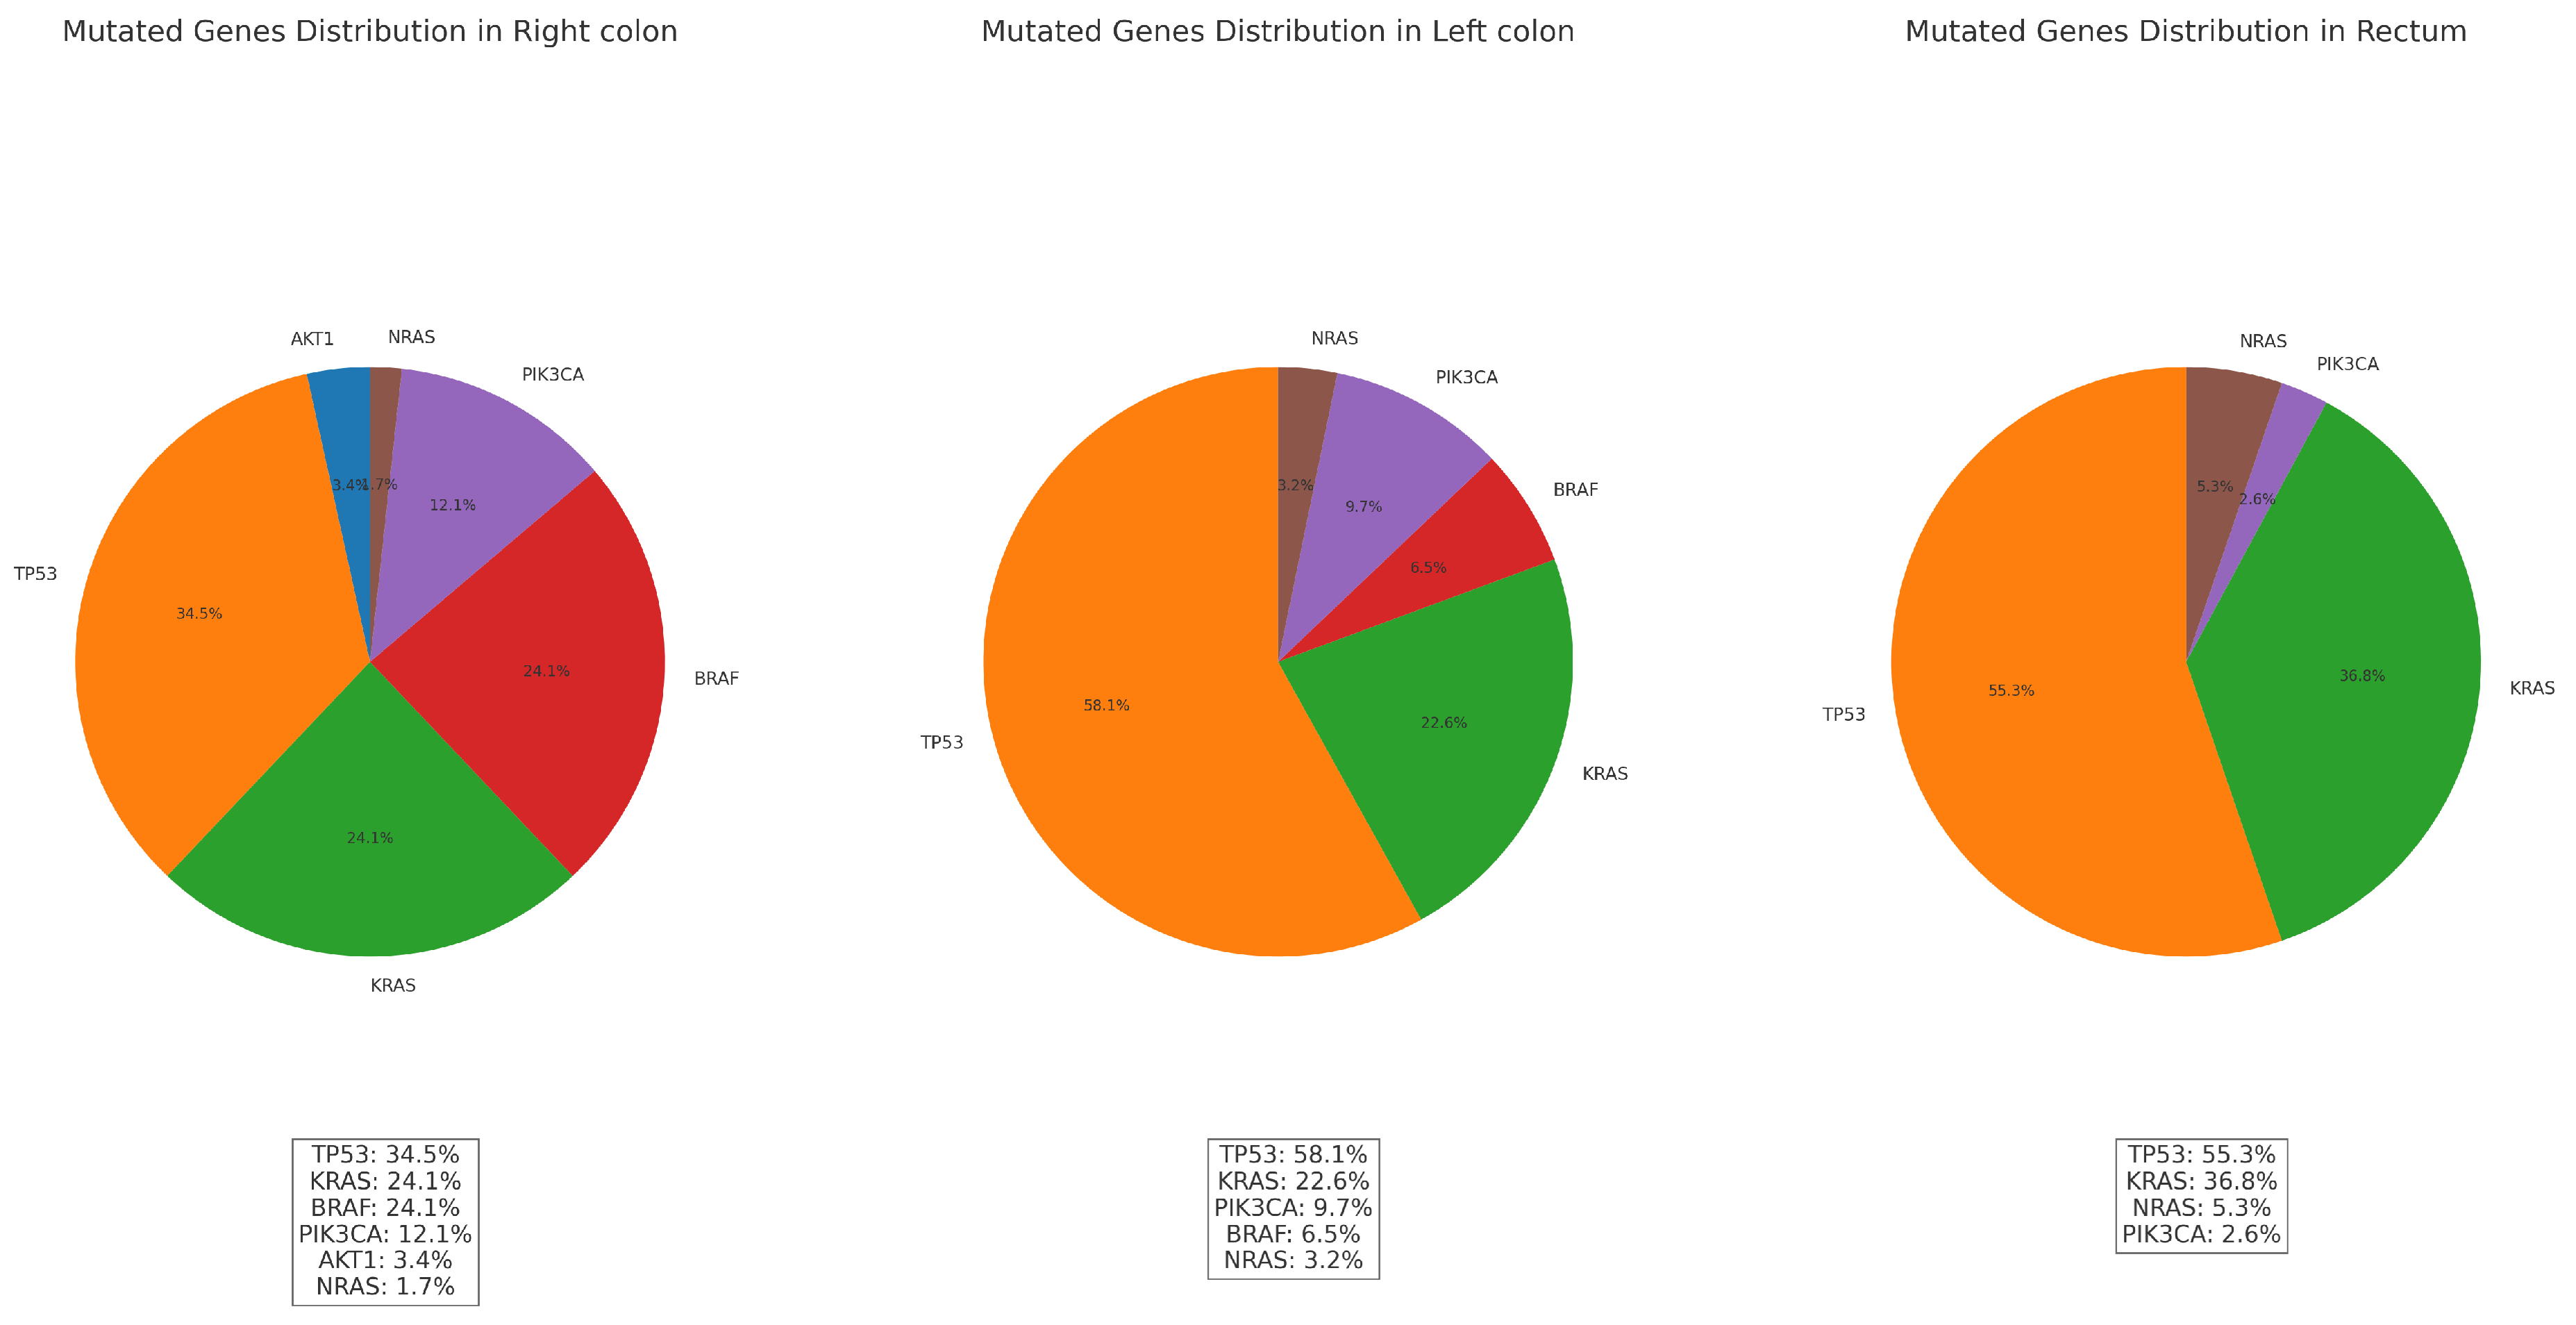
The distributions of gene mutations by count and frequency in relation to tumor localization are presented in the
Table 12 and
Figure 25 below. These visualizations illustrate the variations in mutation prevalence across different tumor sites.
The chi-square test results for the association between gene mutations and localizations are as follows: Chi-square value: 22.59; p-value: 0.012; Degrees of freedom: 10. The p-value (0.012) is less than 0.05, indicating that there is a statistically significant association between gene mutations and localization. This suggests that the distribution of gene mutations differs significantly across the Right colon, Left colon, and Rectum.
Based on the statistical analysis, there is a significant association between gene mutations and localization:
1. Right colon:
Tumors located in the Right colon tend to exhibit the highest number of mutations overall (42), with a variety of gene mutations such as TP53, KRAS, BRAF, PIK3CA, and AKT1. BRAF and KRAS mutations are more frequent here compared to other locations. The high presence of mutations like BRAF in the right colon aligns with known patterns in colorectal cancer, and they indicates a sporadic pathway rather than Lynch syndrome.
2. Left colon:
The left colon tumors have fewer total mutations (25) compared to the right colon. The dominant mutations here include TP53 and KRAS, with PIK3CA also present but at a lower frequency. The mutations in the left colon tend to align more with classic genetic alterations seen in colorectal cancer. The lower count of BRAF mutations in this area differentiates it from the right colon.
3. Rectum:
The rectal carcinomas has 29 total mutations, with a higher frequency of TP53 mutations. Unlike the right colon, the rectum does not show any BRAF mutations, which is a key distinction. This suggests that the genetic profile of rectal cancers in this dataset differs significantly from right-sided colorectal cancers, which often exhibit BRAF mutations. The presence of KRAS and NRAS mutations indicates a different mutation spectrum in the rectum, which might be more associated with sporadic colorectal cancers rather than hereditary syndromes like Lynch.
-Mutations across tumor histological subtype:
The only gene mutation showing a significant association with histological type is BRAF. This suggests that the presence of BRAF mutations may vary depending on the histological subtype. The
Table 13 displays the results of the Chi-square test comparing mutated genes with histological subtypes.
-Mutations across tumor grade and stage:
The performed chi-square test for gene mutations in relation to tumor grade and stage yielded the following results:
Tumor grade vs gene mutations:
AKT1 Chi-Square: 0.360; DOF: 2; p-value: 0.835.
TP53 Chi-Square: 5.194; DOF: 2; p-value: 0.074.
KRAS Chi-Square: 0.102; DOF: 2; p-value: 0.950.
BRAF Chi-Square: 12.070; DOF: 2; p-value: 0.002.
PIK3CA Chi-Square: 0.509; DOF: 2; p-value: 0.775.
NRAS Chi-Square: 0.761; DOF: 2; p-value: 0.684.
BRAF shows a statistically significant association with tumor grade.
G2 is the grade with the highest frequency of mutations, particularly TP53 and KRAS. G3 shows TP53 as the most frequent mutation, with a slight increase in BRAF mutations. G4 has the fewest mutations overall.
Tumor stage vs gene mutations:
AKT1 Chi-Square: 1.591; DOF: 5; p-value: 0.902.
TP53 Chi-Square: 4.116; DOF: 5; p-value: 0.533.
KRAS Chi-Square: 1.814; DOF: 5; p-value: 0.874.
BRAF Chi-Square: 6.304; DOF: 5; p-value: 0.278.
PIK3CA Chi-Square: 3.742; DOF: 5; p-value: 0.587.
NRAS Chi-Square: 11.929; DOF: 5; p-value: 0.036.
NRAS shows a statistically significant association with tumor stage.
Stages pT1 and pT2: These early stages demonstrate limited mutations, with TP53 and KRAS mutations appearing occasionally.
Stages pT3 and pT4: In these advanced stages, TP53 and KRAS mutations become more frequent. Additionally, mutations in BRAF and PIK3CA are observed in some cases, indicating a shift toward a more aggressive tumor profile.
Lymph node status and lymphovascular invasion vs gene mutations:
Lymph node status vs gene mutations:
Negative lymph node status: TP53 (27 cases) and KRAS (18 cases) are the most frequent mutations. BRAF appears in 10 cases.
Positive lymph node status: TP53 is the most common (34 cases), followed by KRAS (19 cases) and PIK3CA (8 cases).
Lymphovascular invasion vs gene mutations:
Negative Lymphovascular Invasion: TP53 (38 cases) and KRAS (28 cases) are prominent. BRAF and PIK3CA mutations are also present but less frequent.
Positive Lymphovascular Invasion: TP53 remains frequent (24 cases), but KRAS drops to 9 cases. BRAF is seen in 9 cases, and PIK3CA appears in 5 cases.
The results of the performed chi-square test indicate significant associations between specific gene mutations and both lymph node status and lymphovascular invasion in colorectal cancer:
TP53 Mutations: There is a notable association with both lymph node status and lymphovascular invasion.
Chi-square: 7.423; Dof: 2; p-value: 0.024 (significant association).
BRAF Mutations: A significant association with lymphovascular invasion was also observed for BRAF mutations.
Chi-square: 4.853; Dof: 1; p-value: 0.028 (significant association).
Analyses for gene mutations versus peritumoral budding, stromal immune reaction, and perineural invasion:
1. Peritumoral budding vs gene mutations:
Bd1(Bd0 + Bd1): TP53 and KRAS mutations are most frequent, with moderate occurrences of BRAF and PIK3CA.
Bd2: Similar frequency for TP53, with KRAS and BRAF appearing less frequently.
Bd3: Highest occurrence of TP53, followed by KRAS, BRAF, and some PIK3CA mutations.
2. Stromal immune reaction vs gene mutations:
Absent: TP53 and KRAS mutations are common, with minimal BRAF and PIK3CA.
Moderate: TP53 and KRAS are frequent, with a presence of BRAF but fewer PIK3CA mutations.
Marked: TP53 remains frequent, with higher occurrences of BRAF and PIK3CA.
3. Perineural invasion vs gene mutations:
Negative: TP53 and KRAS mutations are most frequent; BRAF and PIK3CA appear less frequently.
Positive: TP53 remains common, and there is an increase in PIK3CA mutations compared to negative cases.
The summary of the performed chi-square test for the associations reveals significant findings:
TP53 and peritumoral budding: Chi-Square = 6.071; p-value = 0.048; DOF = 2. This indicates a statistically significant association between TP53 mutations and peritumoral budding, suggesting that the presence of TP53 mutations may influence the tumor’s invasive characteristics, potentially impacting prognosis and treatment options.
NRAS and stromal immune reaction: Chi-square = 7.645; p-value = 0.022; DOF = 2. The significant association between NRAS mutations and the stromal immune reaction indicates that NRAS may play a role in the immune landscape surrounding tumors, which could have implications for therapeutic strategies.
These results highlight the importance of genetic profiling in colorectal cancer, as understanding the relationships between specific mutations and clinical features can help inform prognosis and treatment decisions.
MMR status (pMMR and dMMR) versus gene mutations:
Lastly, in this section, we will examine the association between gene mutations and MMR status. In
Table 14, the results of the MMR status in relation to the mutations of individual genes are presented. This table highlights the correlation between the MMR (mismatch repair) status and specific gene mutations, which can provide insights into the genetic landscape of colorectal cancer.
Only KRAS and BRAF mutations show significant associations with MMR status:
KRAS: Chi-square: 7.739; p-value: 0.005; Dof: 1.
BRAF: Chi-square: 34.204; p-value: <0.001; Dof: 1.
These results indicate a strong relationship between these specific mutations and the MMR status of colorectal tumors. The significant p-values suggest that the presence of KRAS and BRAF mutations is associated with specific MMR status groups, which may have implications for treatment decisions and prognostic outcomes.
