1. Introduction
Sediment abrasion has long been a significant concern in hydraulic machinery because it causes wear and deformation of the flow-passing components and leads to performance degradation, which affects the stability and safe operation of the units. In recent years, high-head and large-capacity hydraulic turbines have been successfully implemented in the mountainous regions of Southwest China. Wear failures of these units have resulted in significant economic losses and safety risks. Therefore, it is crucial to address and prevent wear in hydraulic machinery [
1].
Hydraulic machinery operating in sediment-laden rivers experiences severe wear, particularly in turbine guide vanes (TGVs). Extensive research on wear mechanisms and their influencing factors has revealed that particle characteristics (such as hardness, size, concentration, and density) and two-phase flow field characteristics are the key contributors to wear [
2,
3,
4]. Many researchers have explored the impact of particle characteristics on wear. For instance, Chen [
5] investigated the effect of particle density on turbine runner wear rates by introducing the Stokes number and found that with constant sediment concentration and particle size, increasing the particle density reduces the sediment content, thereby lowering the erosion rates and affected areas. Shrestha [
6], considering the synergistic effects of sediment morphology, particle size, concentration, hardness, and flow velocity, used computational fluid dynamics (CFD) simulations to analyze sediment erosion in mixed-flow turbines and predict the areas most vulnerable to wear. Although research on the effect of particle characteristics on wear has advanced, further investigation is warranted to fully understand the interaction between the solid-phase flow characteristics and wear.
The direct cause of wear is the impact of sediment particles carrying kinetic energy on material surfaces. Therefore, examining two-phase flow field characteristics is critical for understanding the wear mechanism [
7]. Particle image velocimetry (PIV) is extensively used to observe solid–liquid two-phase flows, particularly to visualize flow behavior in the near-wall region. Thapa [
8] and Koirala [
9] designed a three-guide vane test rig using PIV to measure the velocity and pressure within guide vane gaps. Their tests visualized the flow behavior in the gaps and demonstrated that the pressures on both sides of the blade and at the exit were positively correlated with the wear levels. Zhu [
10,
11] employed laser particle imaging velocimetry to analyze the flow characteristics and velocity slip between the solid and liquid phases, as well as the influence of particle size and Reynolds number on velocity slip. PIV visualization offers new research avenues for exploring wear mechanisms based on theoretical models, impact angles, and two-phase flow characteristics. However, owing to limitations in the PIV test accuracy, precise flow field data cannot be obtained within 1 mm of the near-wall region at higher sediment concentrations.
In recent years, advances in high-performance computing and CFD have made numerical simulations indispensable tools for examining multiphase flows, offering diverse models, low costs, and short cycles [
12,
13,
14,
15]. Brekke [
16] categorized guide vane wear into four types based on guide vane flow characteristics: turbulent, secondary flow, leakage, and accelerated scours. Song [
17] investigated the influence of a guide vane opening on particle motion and sediment erosion in a runner chamber and concluded that guide vane openings increase the flow rates in gapless channels.
Lu [
18], Yao [
19], and Zhao [
20] used CFD simulations of two-phase flow fields to extract wall profiles and designed a novel test rig to examine the wear zones on fixed guide vanes under rated conditions. They conducted sediment wear tests on the turbine guide vanes and developed a predictive model for sediment wear. Khan [
21] simulated a water-sediment two-phase flow in impulse turbines and qualitatively analyzed sediment erosion inside buckets. They found that sediment particle impact angles and particle size significantly influenced the extent of wear. The advancement of numerical simulation techniques addresses the insufficient accuracy of PIV measurements in near-wall regions, providing an effective means of accurately capturing solid–liquid two-phase flow field characteristics.
Based on previous research on solid–liquid two-phase flow field characteristics, sediment wear, and numerical and testing methods, this study analyzed the wear development process through sediment wear tests on the vane cascade of a NACA0012 aluminum alloy airfoil. The results were cross-validated using the Finnie model to address the challenge of capturing near-wall flow fields during tests. This study examined the effects of solid-phase impact and near-wall flow field characteristics on wear generation, providing practical insights for addressing wear issues in engineering applications.
2. Materials and Methods
2.1. Introduction to the Tests
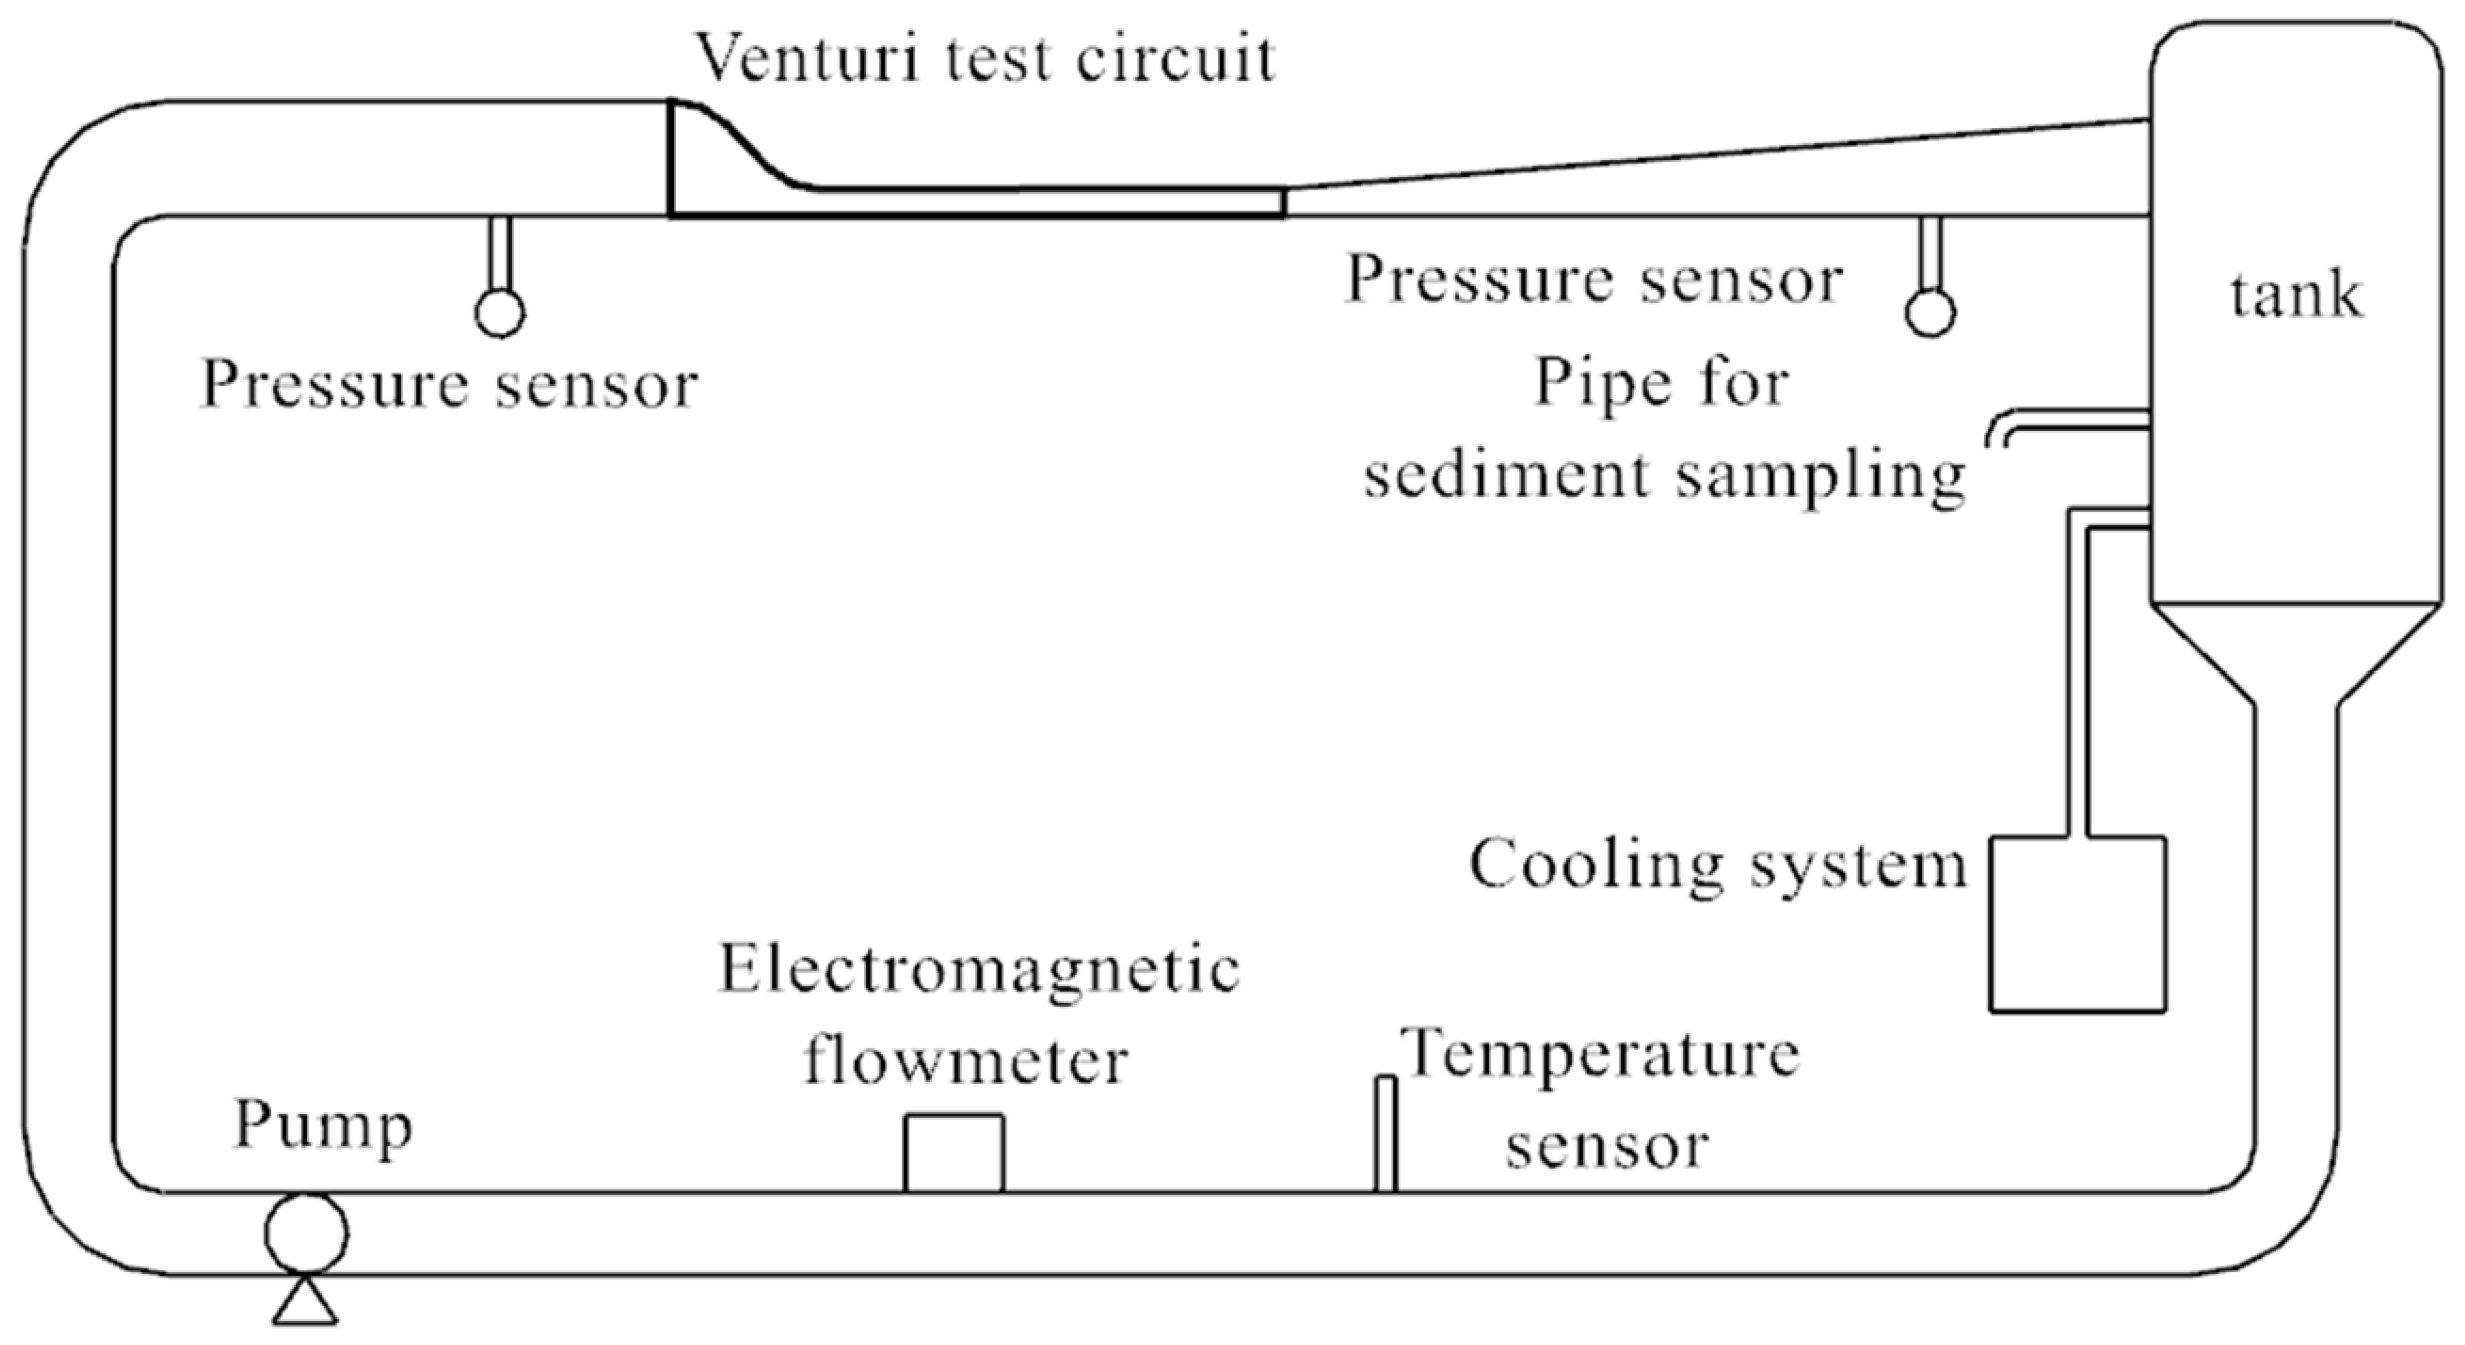
Tests were conducted using a Venturi abrasion test system primarily designed for sediment abrasion testing. An aluminum (Al) airfoil was selected to examine the evolution of wear damage on the vane cascade under an incoming flow with a 10° impact angle. The layout of the Venturi wear test cycle system for a vane cascade is shown in
Figure 1.
2.1.1. Test Conditions
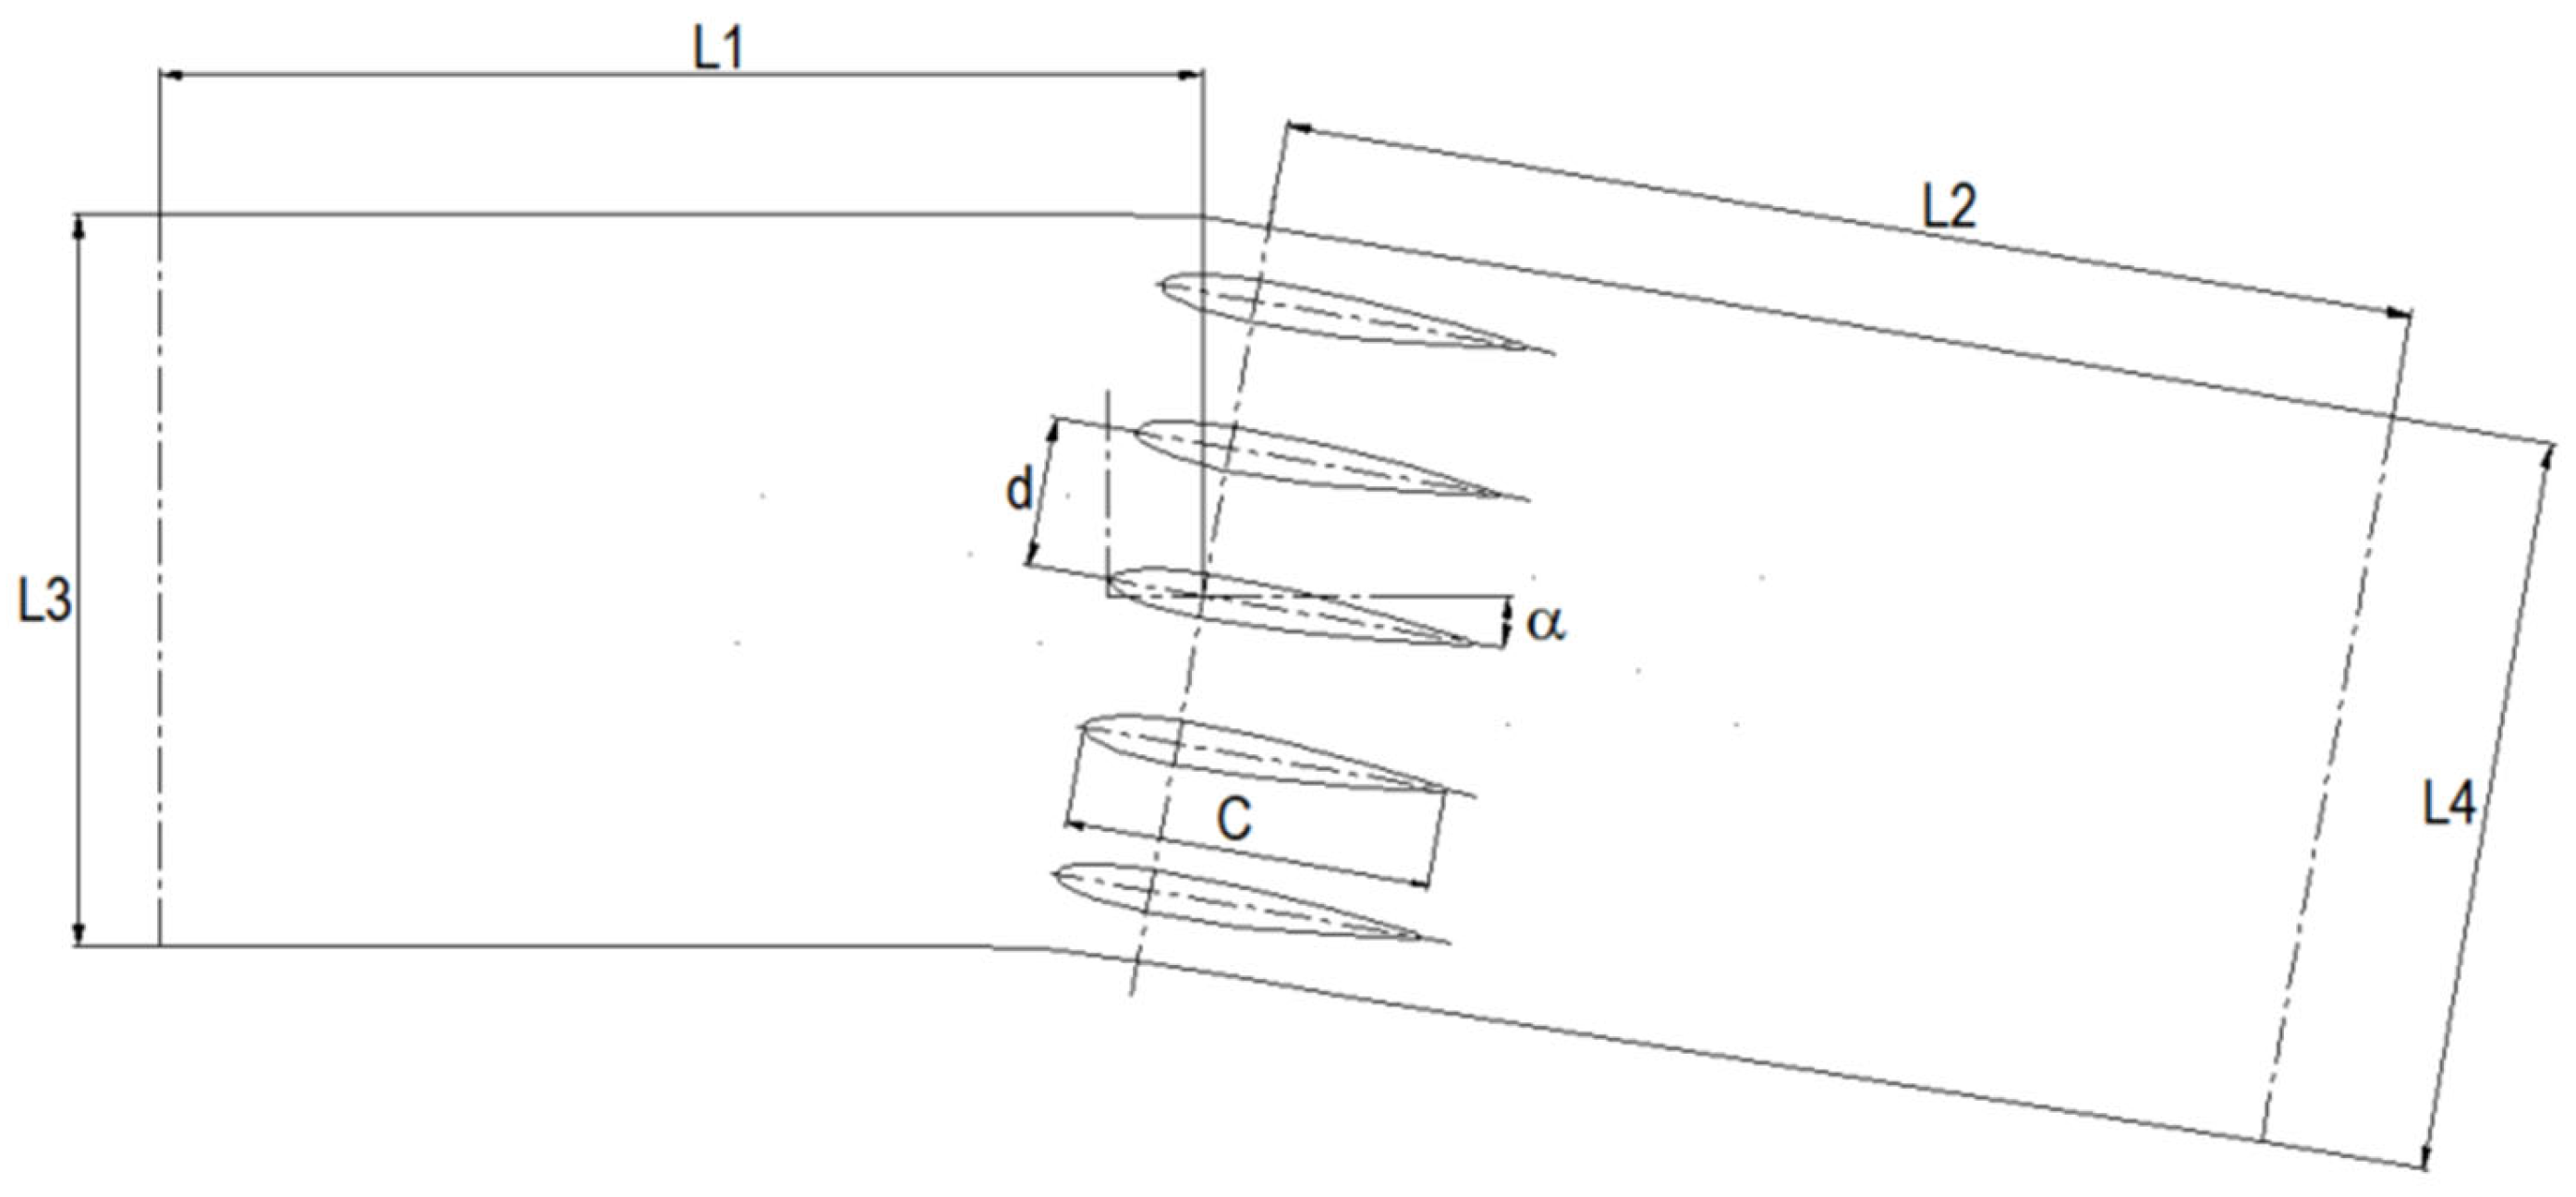
To replicate the actual flow conditions of the guide vanes and ensure a smooth, fully developed turbulence upstream of the airfoil, a long test section design was used. The distances between the test section inlet and outlet and the center of rotation of the intermediate airfoil (25 mm from the leading edge) were L1 = 575 mm and L2 = 700 mm, respectively. In addition, to accurately simulate the periodic boundary conditions of the guide vane, numerical simulations of the flow characteristics of the vane cascade in a clean water field were conducted under the same test conditions. Smooth streamlines near the airfoil wall were extracted and used as profiles for the inner walls of the test flow channel to reduce the effect of the flow channel walls on the flow characteristics of the vane cascade. Five NACA0012 airfoils, each with a chord length
c of 100 mm, were fixed at equal intervals with a blade spacing
d of 40 mm in the test section flow channel, as shown in
Figure 2. The airfoil material was aluminum, and its mechanical properties are listed in
Table 1. The incoming flow angle α was 10°, and the incoming flow velocity was 8 m/s, corresponding to a Reynolds number of 8.0 × 10
5. The mass concentration
Cm of sediment in the test water was approximately 6.0 kg/m³, with a volume fraction
CV of approximately 0.28%, as detailed in
Table 2.
2.1.2. Test Methods
Wear tests were conducted under non-cavitation conditions. Before each test, approximately 8.0 kg of sediment was added to each test group, calculated based on the water volume of the system. During the test, two samples of sediment-laden water were collected and the actual sediment content was determined by averaging these samples. The average sediment concentration is approximately 5.61 kg/m³.
To minimize errors owing to sediment wear and system temperature rise, each test cycle lasted for 6 h. At the end of each cycle, the test system was stopped, the water and sediment were drained, and fresh water and sediment were added to the next cycle. Four tests were conducted in each group to observe the evolution of sediment wear, totaling a net wear time of 24 h. After each group, the airfoil was removed and its surface profile was measured using a surface profiler with an accuracy of 0.1 μm. The weight loss of the airfoil was also measured using an analytical balance with an accuracy of 0.1 mg to assess changes in both the surface profile and mass. The first set of tests lasted for 12 h to determine the initial wear position, followed by five additional cycles of 24 h each, resulting in a total test duration of 132 h.
2.1.3. Measurement of the Airfoil’s Outer Profile
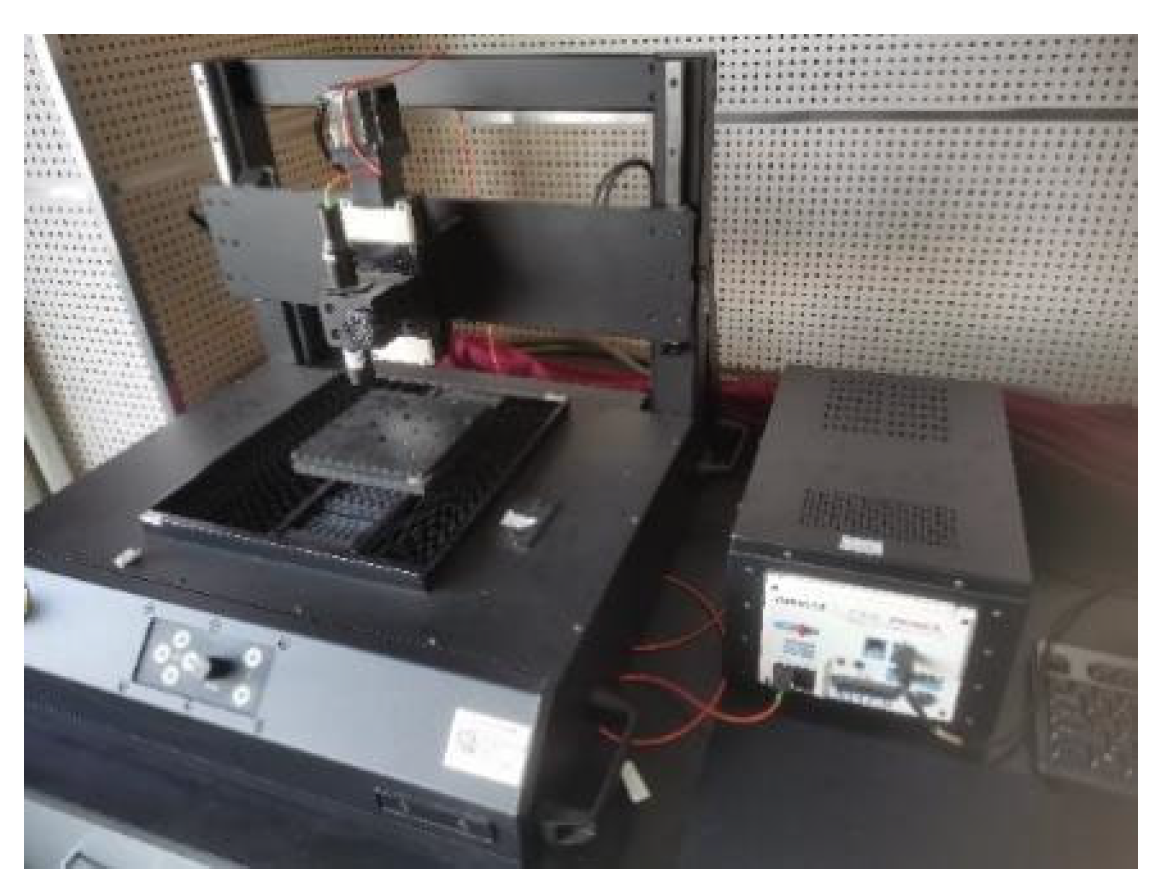
The surface profiler uses white-light confocal technology to measure the distances. Following the scanning measurement protocol, a linear scanning method was employed in the
x-direction. After each line scan, the stage was moved in the
y-direction using a predetermined step size to scan the next line. The scanning step sizes in the
x and
y directions achieved an accuracy of 0.1 μm, as shown in
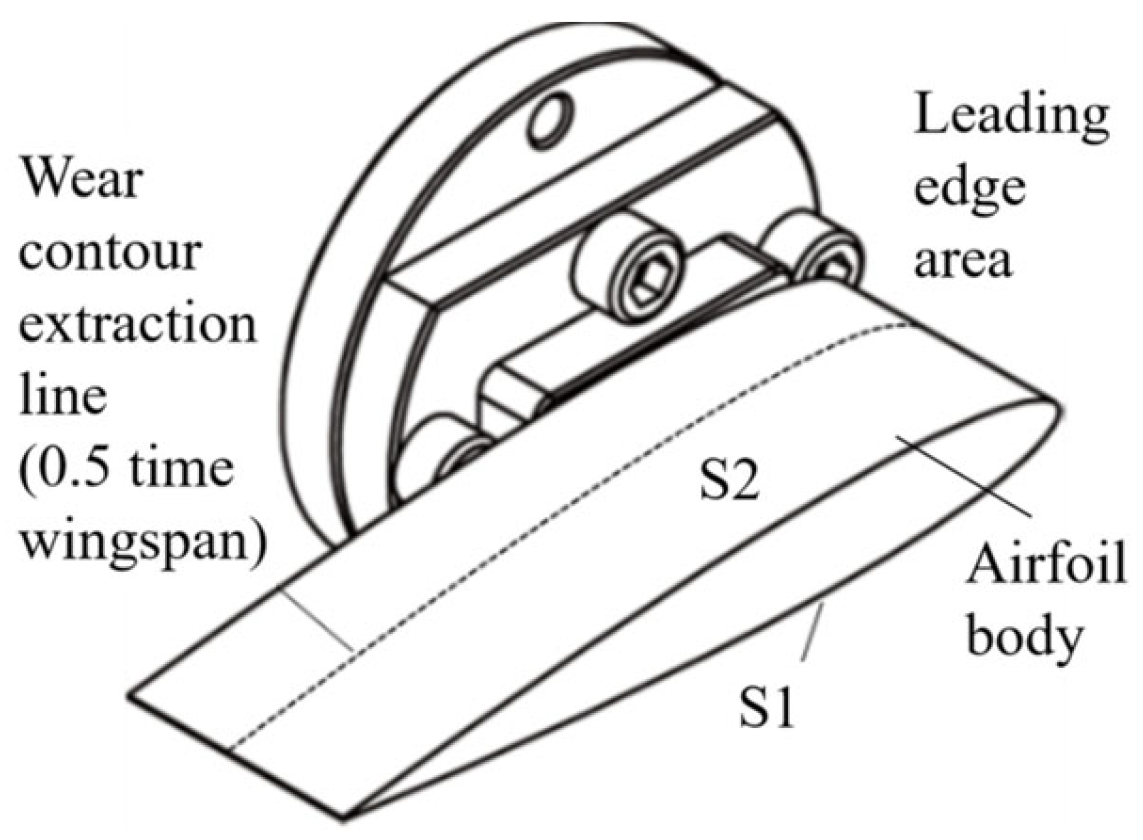
Figure 3. The z-axis measurement range was set as 10 mm. To address the profiler’s depth measurement limitations, particularly the high-curvature surface profile of the airfoil's leading edge, which exceeded the instrument's measurement range, a motorized rotary table was installed on the stage to provide an additional rotational degree of freedom. The upstream surface of the airfoil was designated as the S1 surface, whereas the downstream surface was designated as the S2 surface, with the leading edge as the boundary. Surface profile measurements and wear volume analyses were performed for both surfaces in the leading edge and airfoil body regions, as shown in
Figure 4.
The contour line data at 50% of the airfoil span were compared to analyze the wear regions and their progression. Translation and rotation calculations were performed for each set of the extracted contour line data to map the curve coordinates onto the airfoil surface. The evolution of the wear boundary on the airfoil was analyzed over time within a consistent coordinate system, and the wear amount was calculated based on changes in the boundary coordinates on the airfoil surface.
2.1.4. Wear Depth Measurement
The average wear depth of the airfoil was calculated by measuring the airfoil mass loss, as follows:
The airfoil’s mass loss due to wear can be defined as
where
is the cumulative mass loss of the airfoil (mg),
is the airfoil mass at time t (mg), and
is the initial airfoil mass (mg).
The average wear depth of the airfoil can be defined as
where
is the cumulative wear depth (µm),
denotes the material density of the sample (g/cm³),
represents the surface area of the airfoil (mm²);
denotes the arc length of the airfoil, 203.9 mm; and
is the airfoil span, 30 mm.
The wear rate can be defined as
where
is the average wear depth.
2.2. Numerical Calculations
2.2.1. 3D Model and Meshing of Test Section
Numerical wear calculations were performed to investigate the effects of particle impact and internal flow characteristics in the near-wall region of the airfoil’s leading edge on wear and to explore the underlying wear mechanism. The flow channel geometry was modeled based on the sediment abrasion tests conducted in the vane cascade, as illustrated in
Figure 5. Owing to its robust adaptability, a tetrahedral unstructured mesh was used to discretize the computational domain, with mesh refinement applied in the near-wall region of the airfoil. The total number of grids (N1) was 1,264,584 and the number of nodes (N2) was 1,146,992.
Figure 6 illustrates the mesh configuration.
2.2.2. Numerical Model
The Euler–Lagrange method was employed to simulate the solid–liquid two-phase flow in the flow channel, using the test conditions outlined in
Section 2.1. The Eulerian method solves the time-averaged Navier–Stokes equations, whereas the Lagrangian method applies Newton’s second law to compute the particle motion. The SST k-omega (k-ω) turbulence model was selected for turbulence modeling, as it can accurately capture variations in the flow field near the wall surface. The Finnie model described in [
22]
, was employed for the wear calculations. Wear is considered to be a function of the particle impact angle and velocity. The Finnie model distinguishes wear mechanisms through particle displacement and cutting action and is particularly suitable for wear caused by oblique impact angles. The relevant formulas are presented in Equations (5)–(7):
where
is the dimensionless wear parameter and
denotes the particle impact velocity.
denotes the dimensionless function of the impact angle, defined as the angle between the particle trajectory and the wall (in radians). For common metals,
typically ranges from 2.3 to 2.5; for cast iron and similar materials,
[
23].
In the numerical calculations, (5) is rewritten to yield a dimensionless erosion factor:
where
; for aluminum alloy,
.
Herein,
is the critical value that distinguishes between sliding wear and impact wear;
is predominantly sliding wear;
is dominated by impact wear [
23].
2.3. Calculation Methods and Boundary Conditions
The boundary parameters used in the calculations were as follows: The inlet boundary was defined as a velocity boundary (v = 8 m/s) with 5% turbulent kinetic energy. The outlet boundary is set as the outlet pressure. The flow channel walls and airfoil were modeled as no-slip walls with a surface roughness of 0.2 mm. The SIMPLEC algorithm was employed to solve the continuous phase by utilizing second-order schemes for the pressure, momentum, and turbulence equations. A two-way coupling approach was used to track the particle trajectories.
3. Results and Discussion
3.1. Wear Test Results and Analysis
Wear tests were performed on the airfoil using sediment-laden water with a sediment concentration of 5.61 kg/m³ to examine the wear phenomena and investigate the wear process. The test results indicated that the leading edge of the aerofoil experienced the most significant wear, as shown in
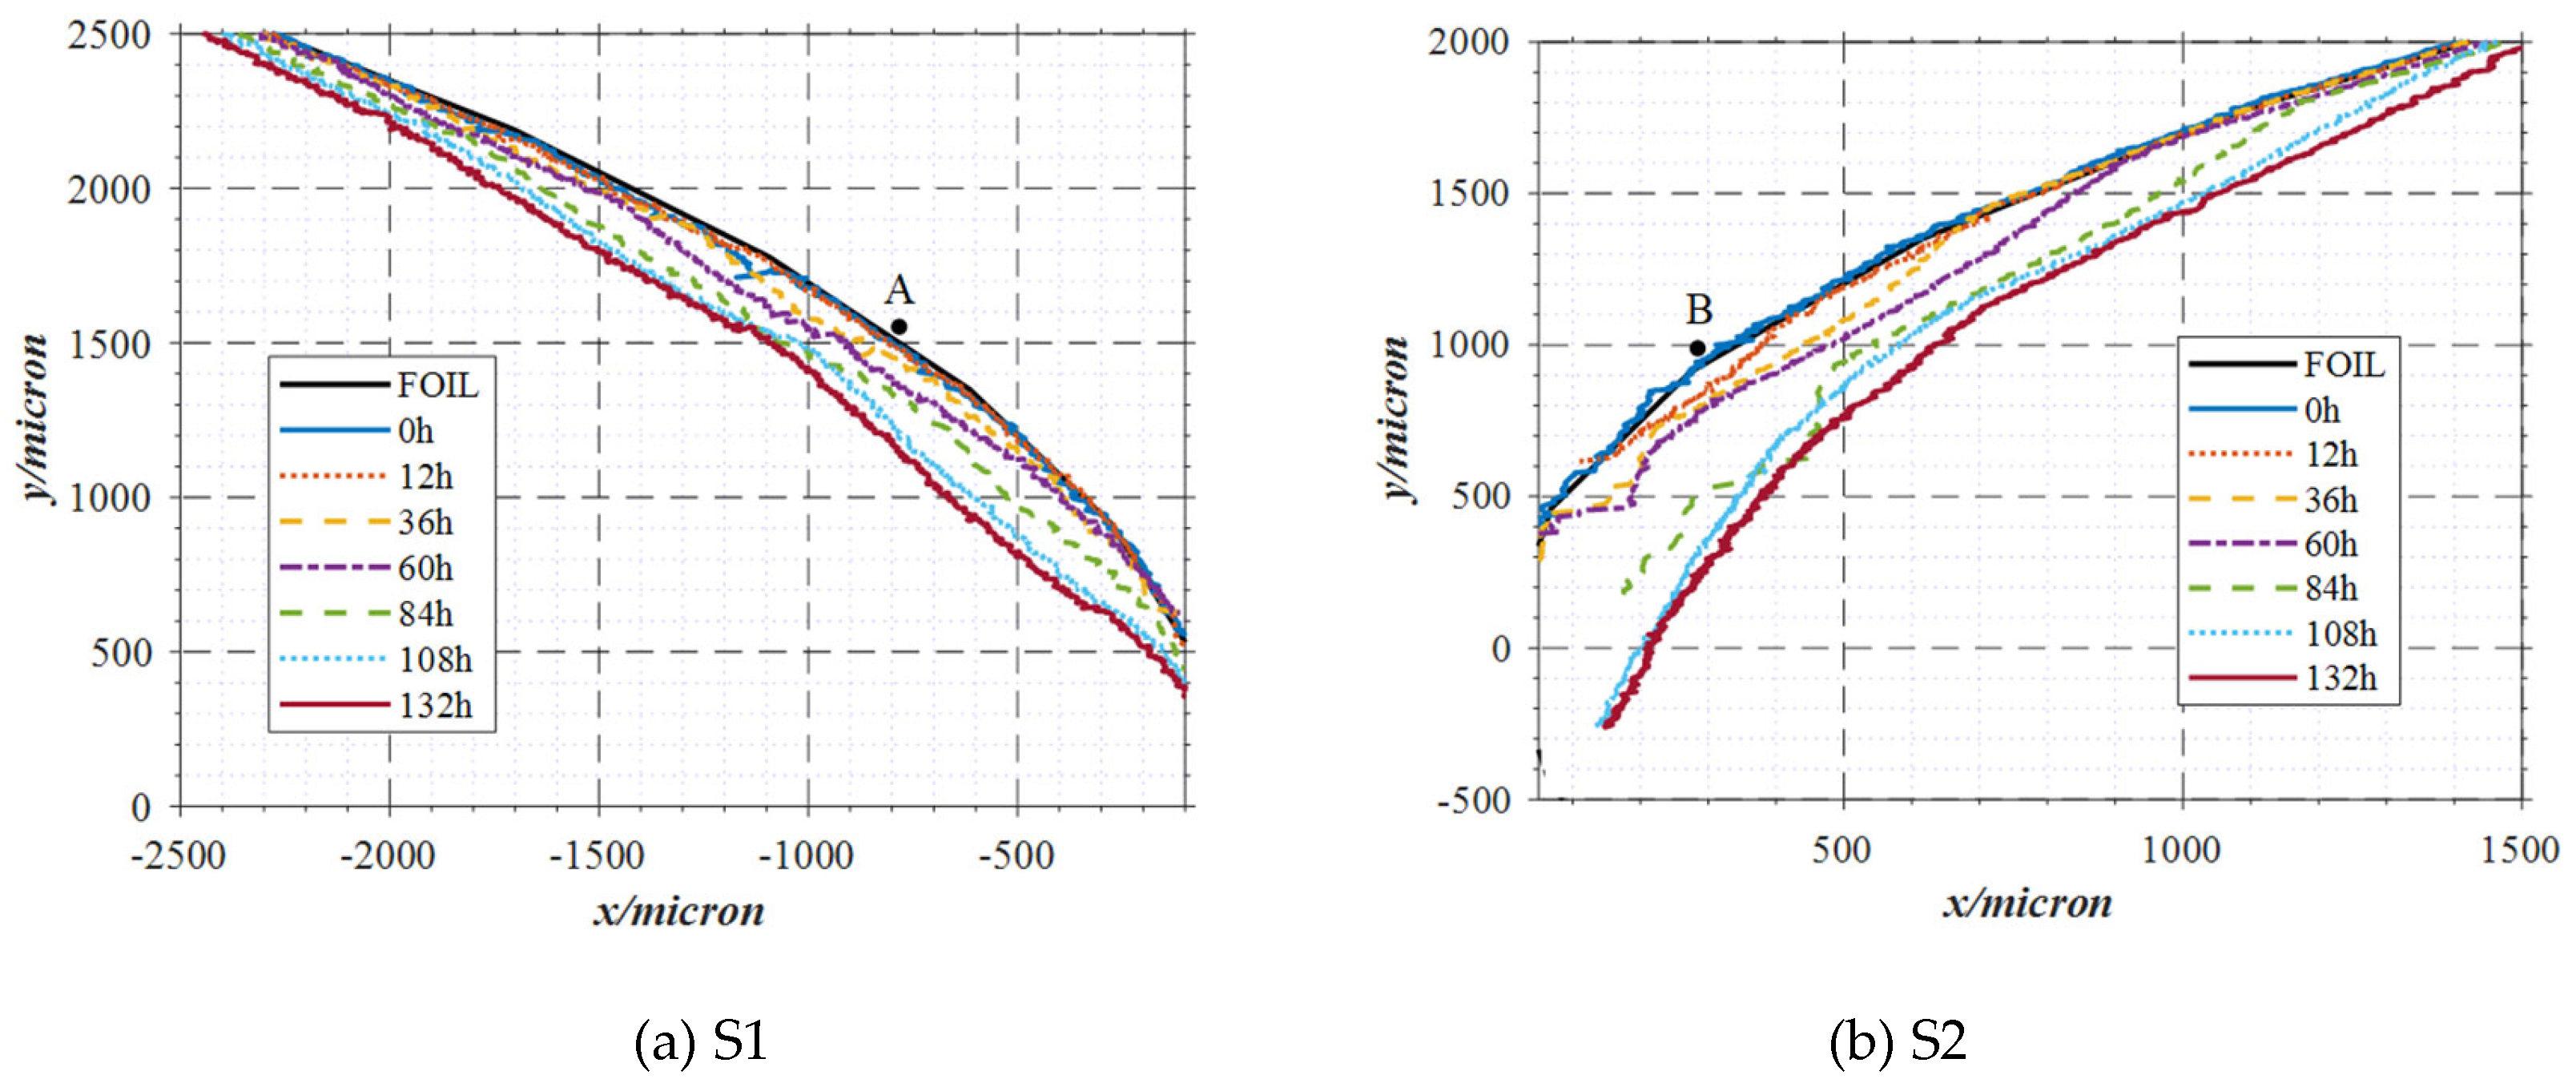
Figure 7. The leading edge was designated as the reference point, the upstream surface as the S1 surface, and the downstream surfaces were designated as the S2 surfaces, respectively. The wear process of the airfoil was analyzed by comparing the outer contour lines of the leading edge at different time intervals, as illustrated in
Figure 8.
From the wear trend of the leading edge over time, the wear initiation points of the S1 and S2 surfaces were A (-0.951, 1.626) and B (0.274, 0.920), respectively. The wear zone expanded from the initiation points and eventually formed a wavy wear pattern. The wear process can be categorized into three stages: initial (0–36 h), development (36–84 h), and stabilization (84–132 h).
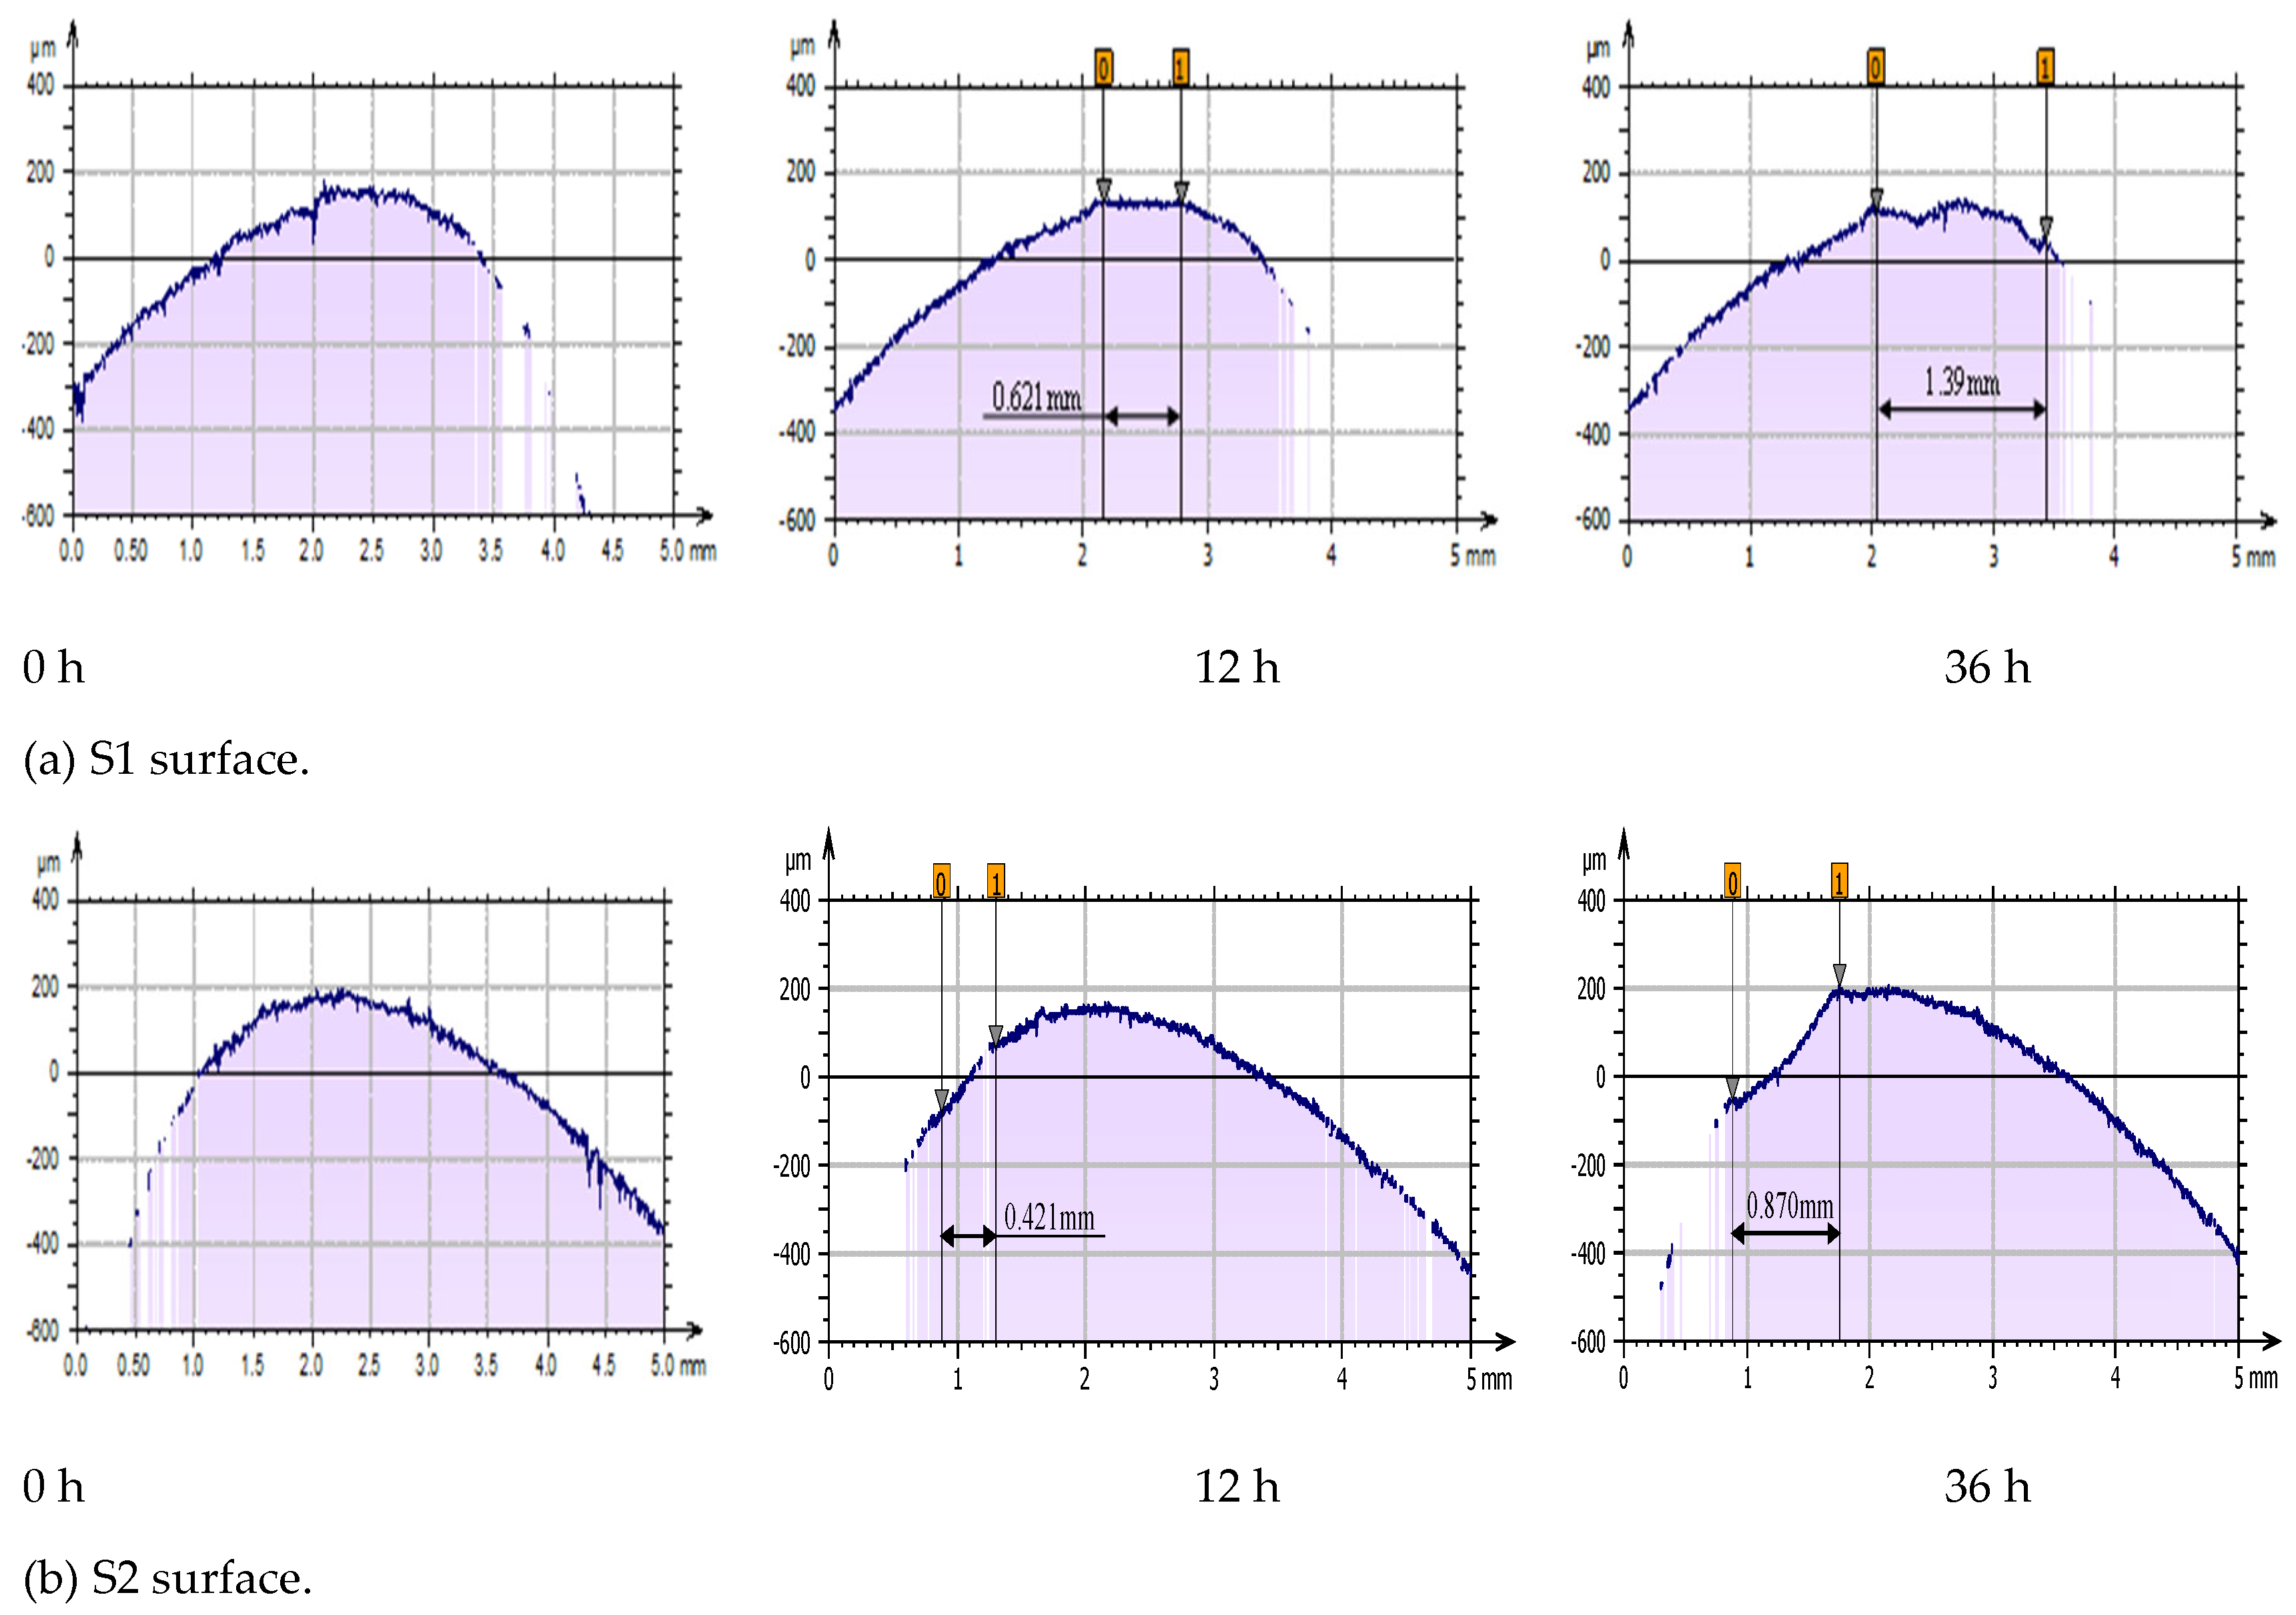
During the initial stage (0–36 h), the sediment-laden water impacted the airfoil surface, breaking through the wear initiation points and deepening the material. At this stage, both the wear area and depth were relatively small; however, the wear area began to expand, whereas the increase in depth remained insignificant. Overall, the wear development was slow. The maximum width of the wear area on the S1 surface was 1.39 mm, with a maximum wear depth of 56.6 μm. The S2 surface had a maximum wear area width of 0.870 mm and a maximum wear depth of 74 μm. The wear area on the S1 surface was broader than that on the S2 surface; however, the wear depth was smaller than that on the S2 surface.
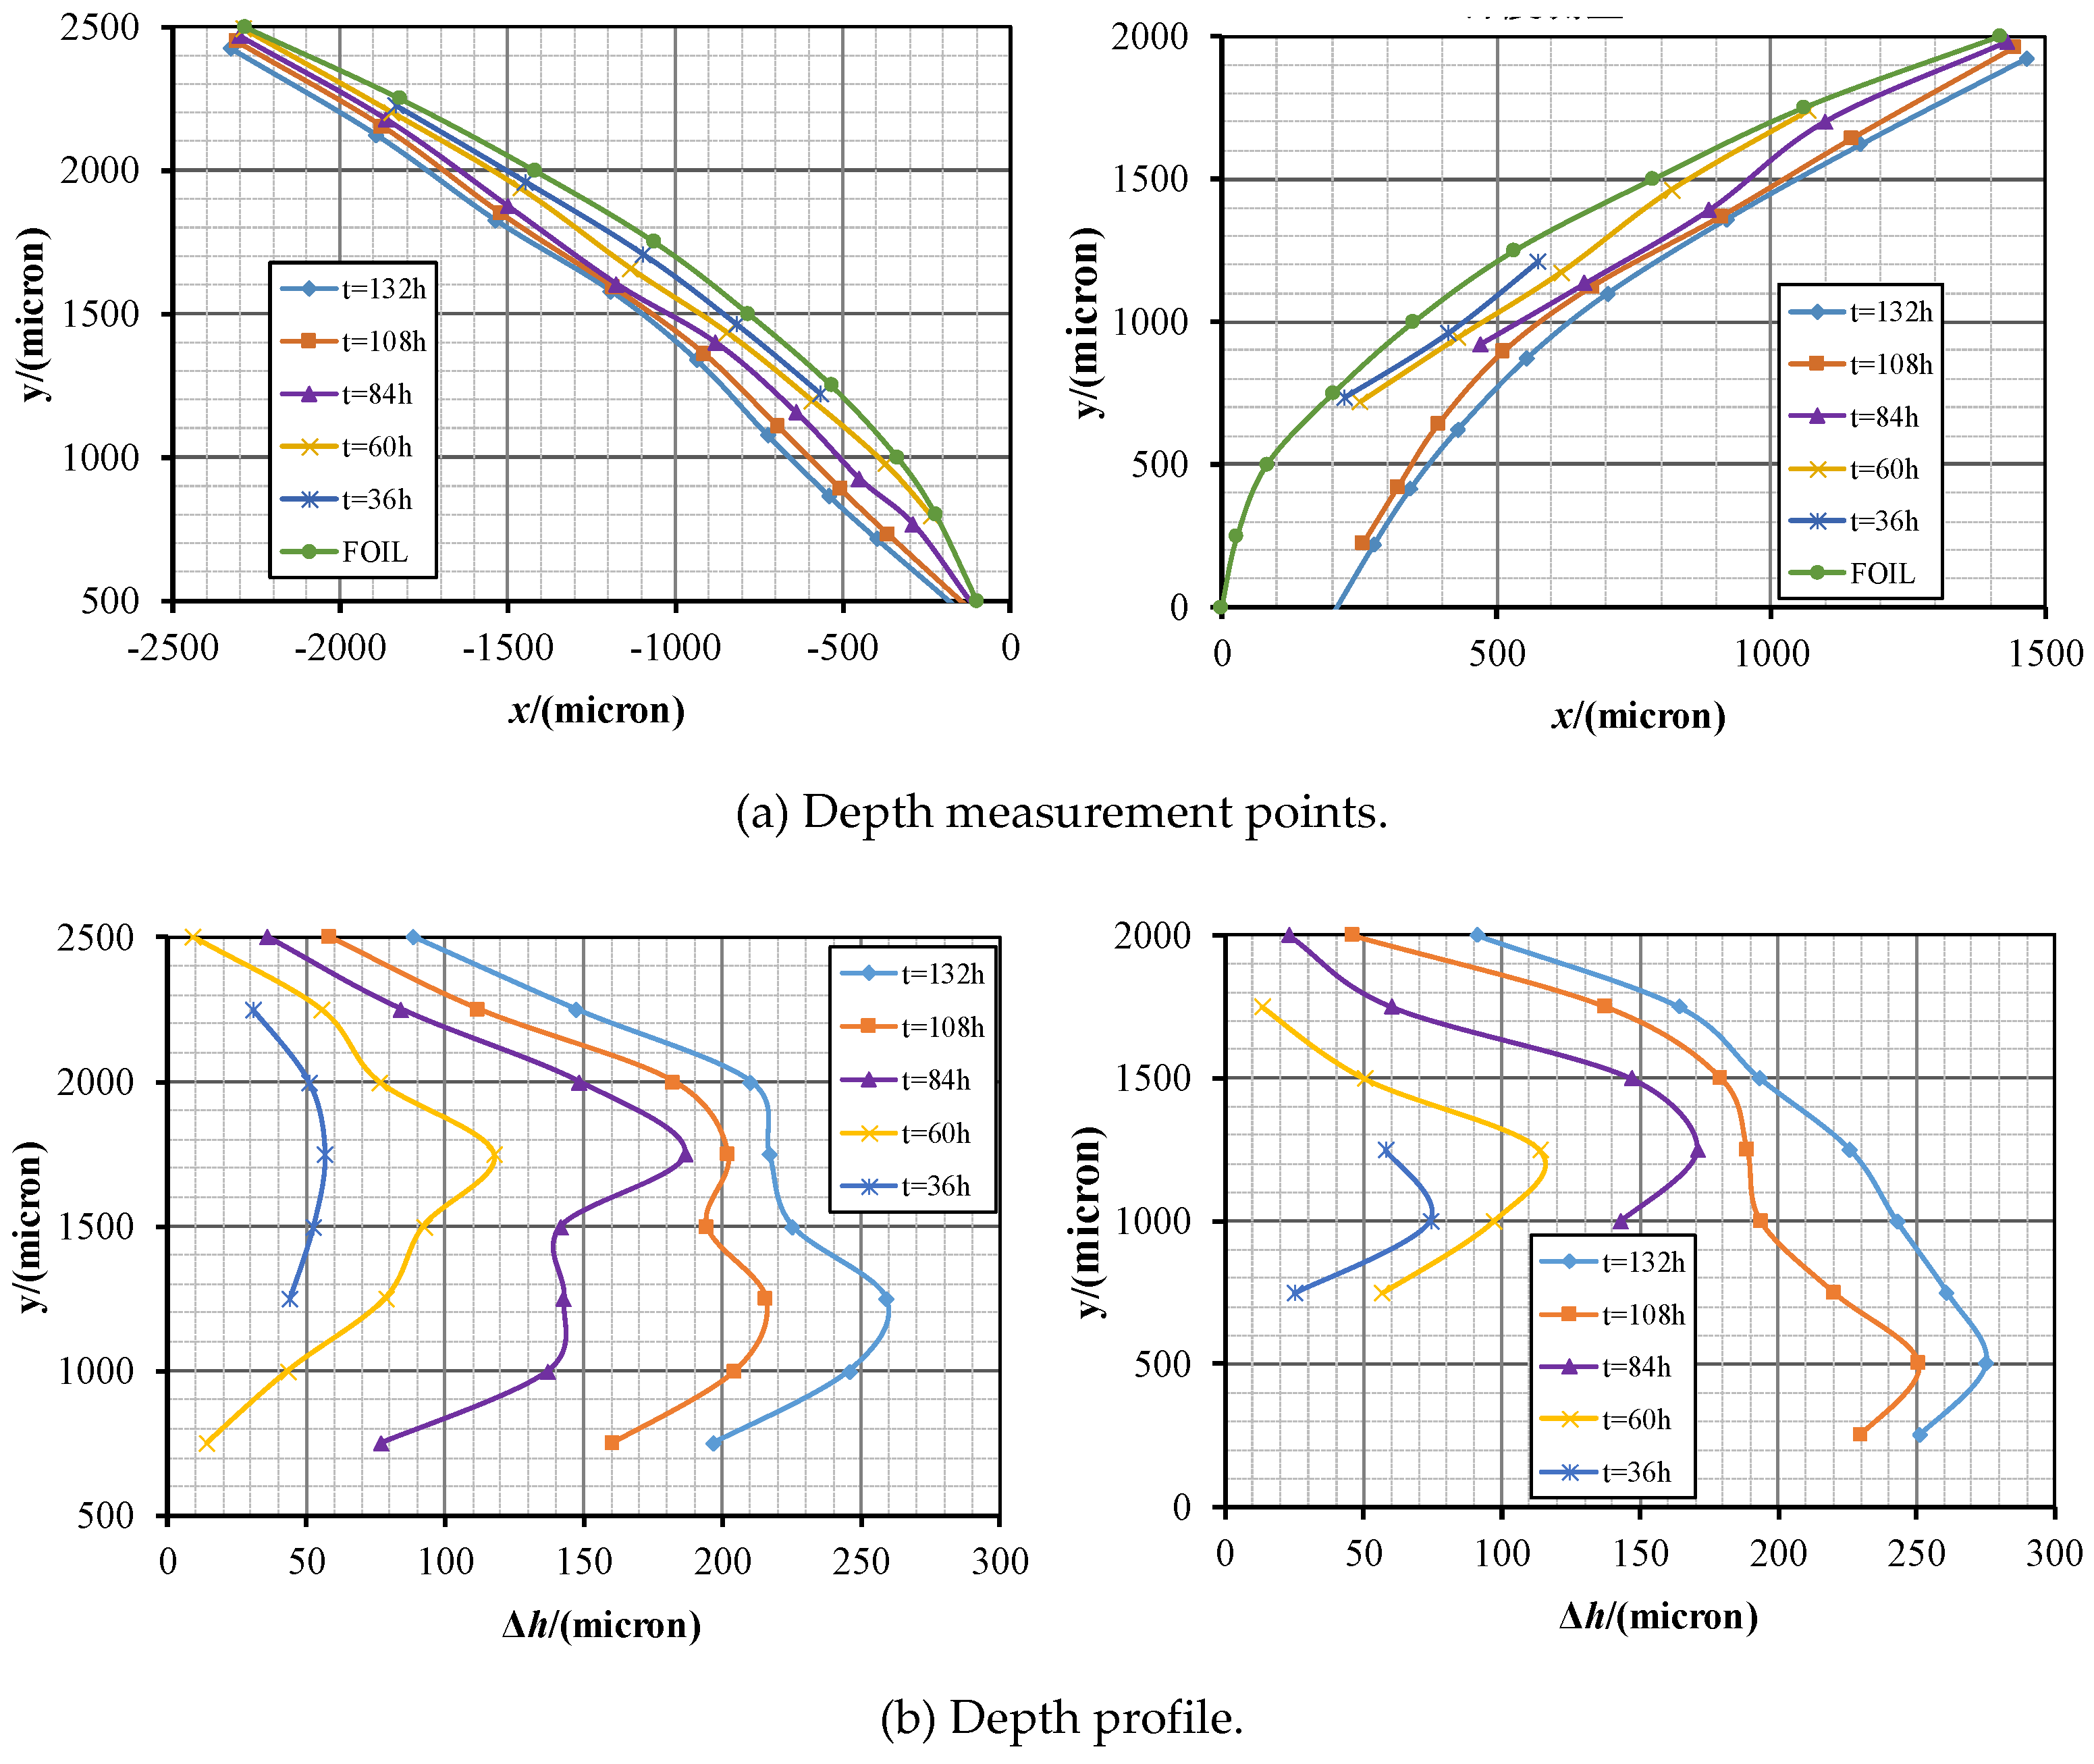
Figure 9 shows the measurement points of the wear depth, and
Figure 10 shows the initial wear process of S1 and S2 surface of airfoil leading edge.
Table 3 lists the maximum wear depths of the S1 and S2 surfaces at different stages.
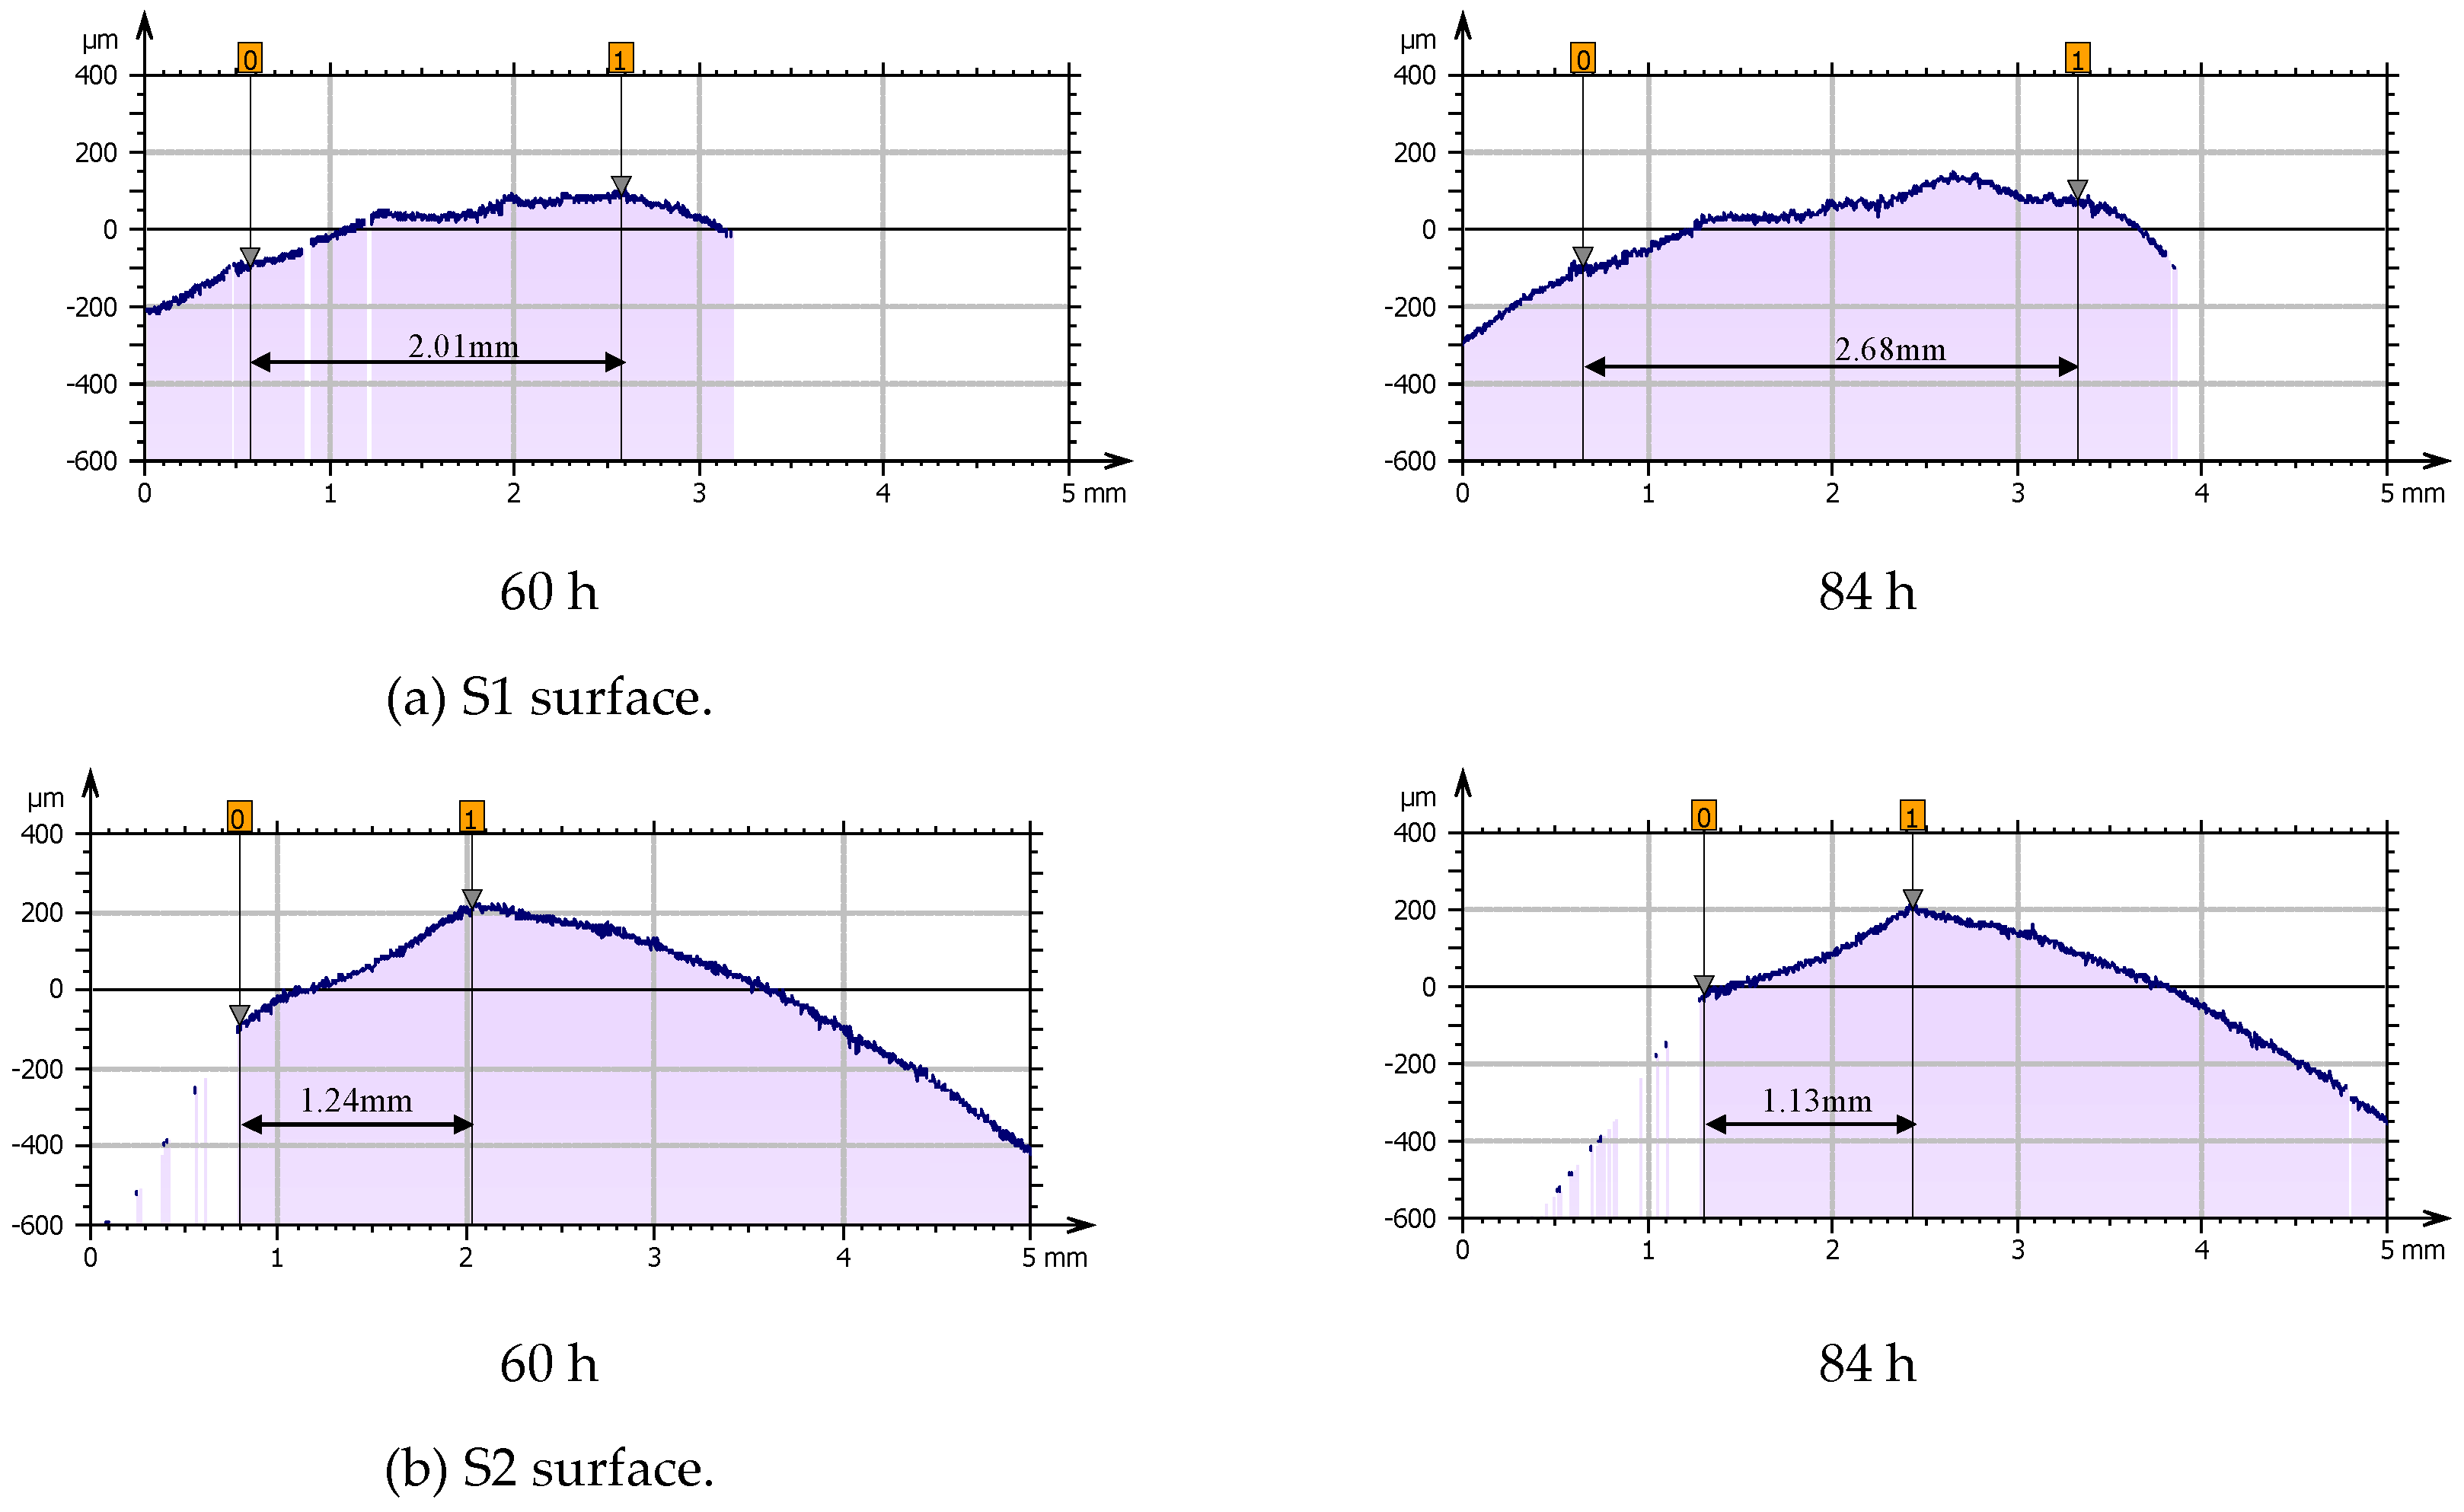
During the development stage (36–84 h), the wear area on the S1 surface continued to expand, with the maximum width increasing from 1.39–2.68 mm, as shown in
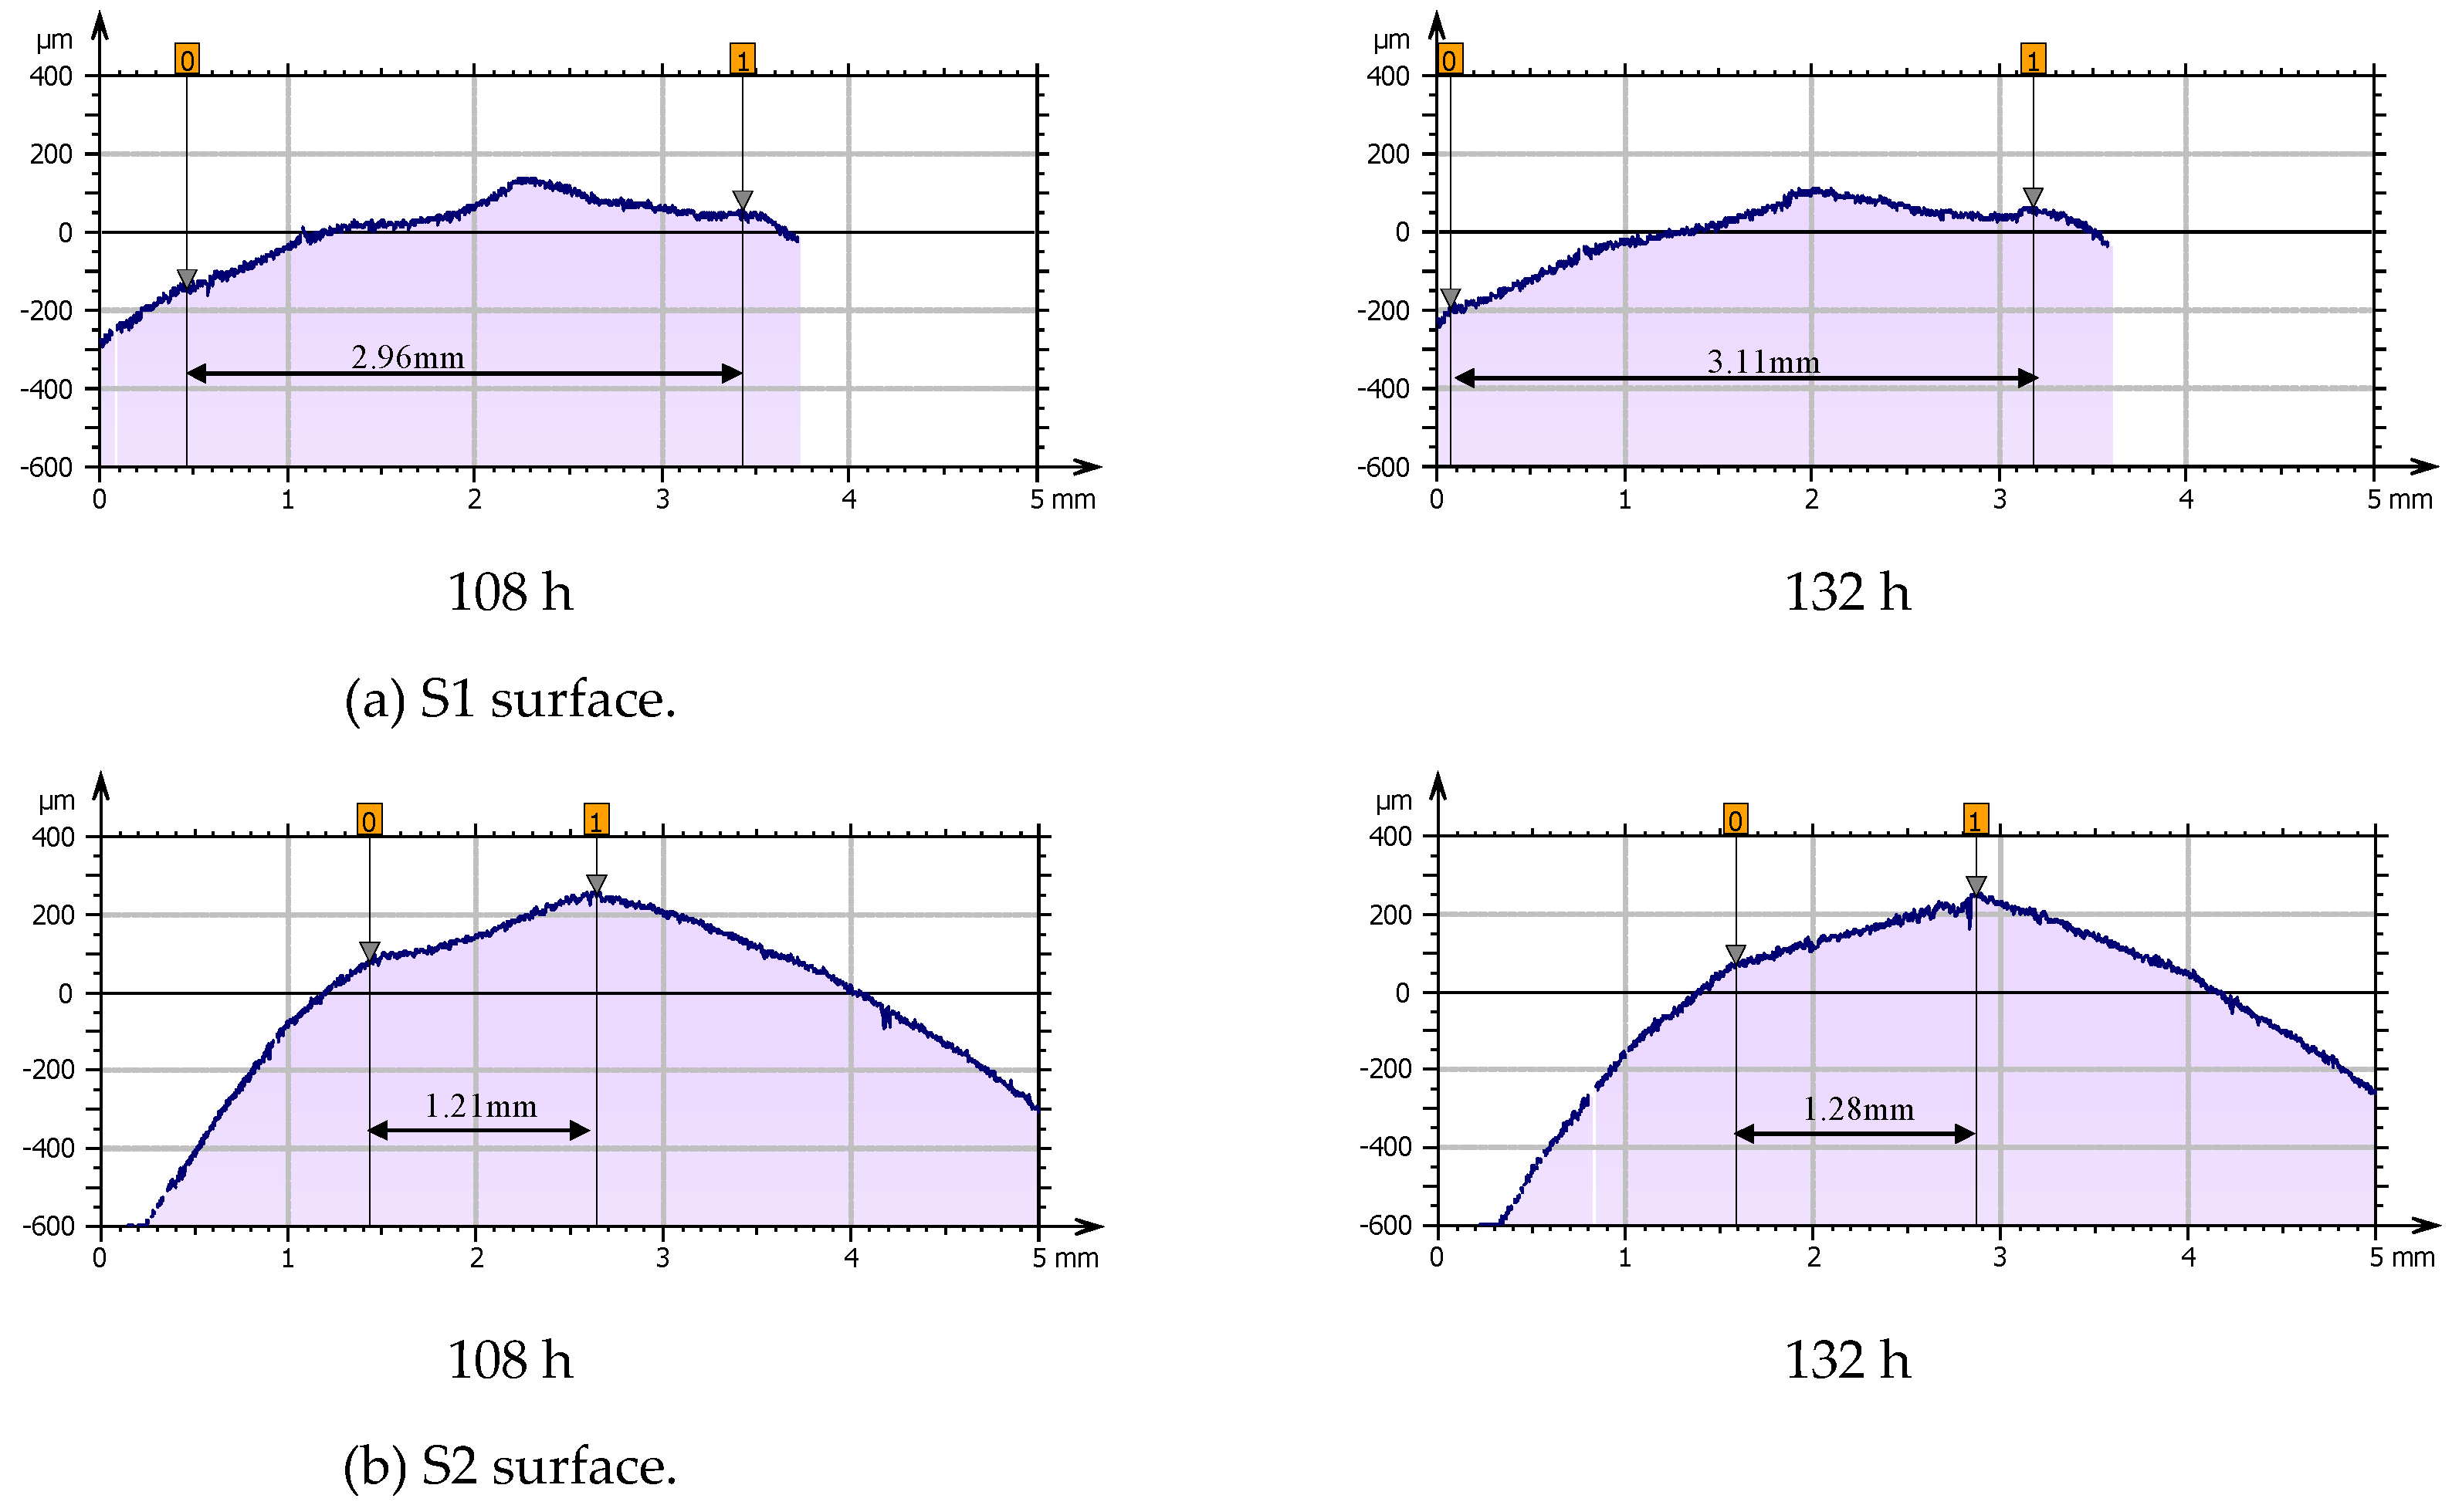
Figure 11. The wear depth also increased, forming two core wear zones at 500 μm and 1,150 μm from the leading edge, with two wear depth maxima. The second core wear zone situated downstream reached a maximum wear depth of 186.3 μm. On the S2 surface, the wear area expanded from 0.87 to 1.13 mm, and the wear depth gradually deepened and shifted downstream. The maximum wear depth is 170.9 μm during this stage.
During the stabilization stage (84–132 h), the wear area width on the S1 surface expanded to 3.11 mm, forming a wave-like pattern with “one peak and two valleys.” A distinct inflection point emerges between the two core wear zones. The wear rate decreased in the second core wear zone downstream of the aerofoil and accelerated in the first core wear zone upstream. The wear depth gradually exceeded the second extremum, reaching a new maximum depth of 215.5 μm at 1,250 μm from the leading edge. On the S2 surface, the wear zone continued to extend downstream, with the width of the wear area increasing to 1.28 mm, this expansion was less significant than that in the previous stage. The maximum wear depth increased significantly to 250.7 μm, surpassing that of the S1 surface.
Figure 12 shows the wear surface contour lines for the S1 and S2 surfaces during the stabilization stage.
3.2. Numerical Simulation Results and Analysis
3.2.1. Comparison of Predicted Airfoil Wear Results with Test Data
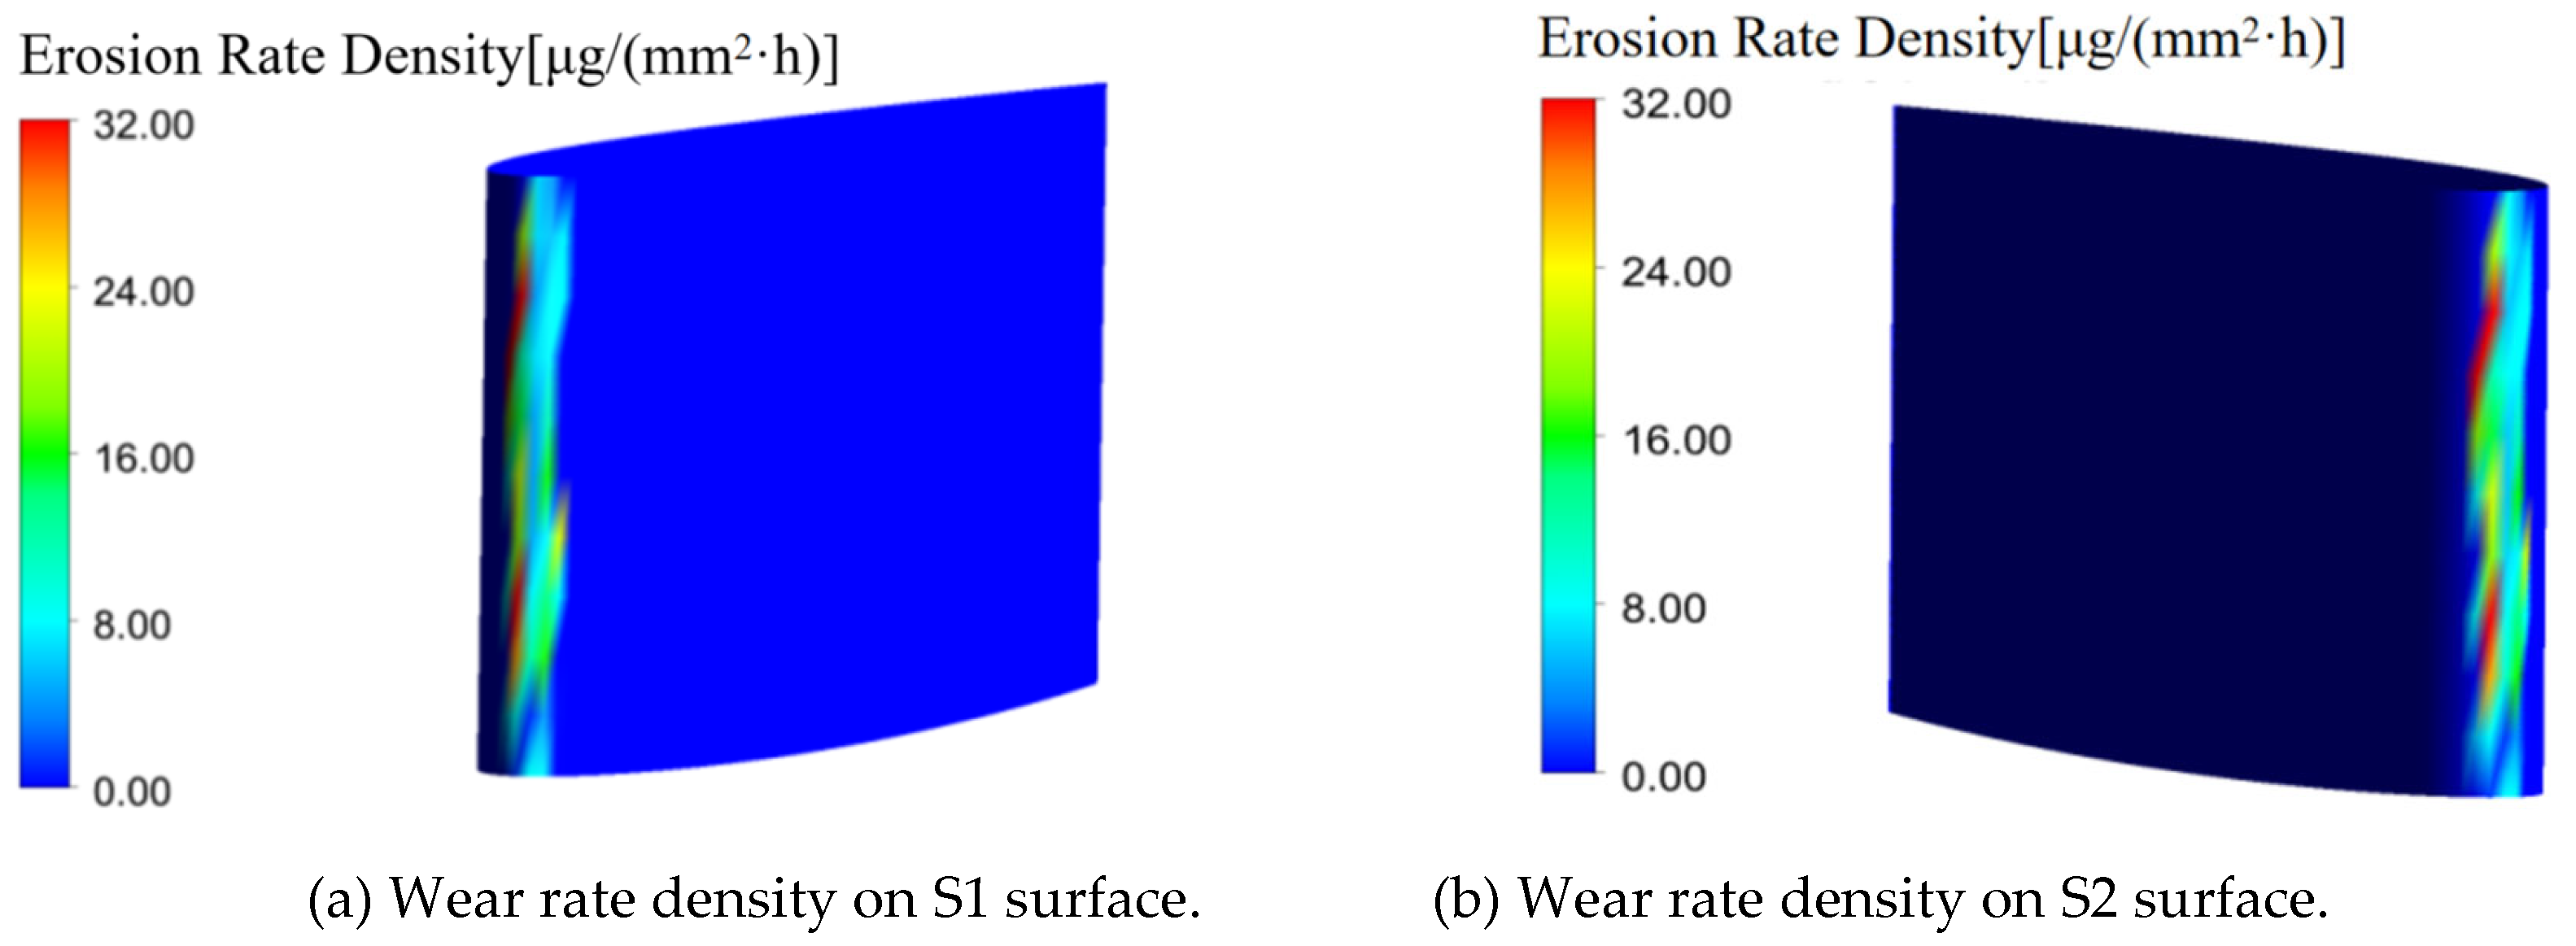
The wear tests indicated that primary wear of the airfoil occurred at the leading edge. We focused on the effect of 65.9 μm particles on the leading edge wear of the airfoil under specific material, flow rate, and sediment concentration conditions. Therefore, the particle flow distribution in the near-wall region of the leading edge of the airfoil is a critical factor affecting wear. In this section, numerical simulations are performed to analyze the motion characteristics of particles near the leading edge before wear occurs. The numerical wear results are compared with the wear test results, as shown in
Figure 13. Additionally, the wear mechanism at the leading edge of the airfoil during the initial stages of the wear tests was examined.
The wear rate density represents the mass loss of material per unit area per unit time. This is a key parameter for evaluating wear severity. From
Figure 9, it can be observed that wear mainly occurred at the leading edge of the airfoil. The numerical simulation results were consistent with the wear distribution observed in the wear tests (
Figure 7).
Figure 14 presents the numerical simulation and wear test results for surfaces S1 and S2 at the leading edge along the horizontal plane at 50% of the airfoil span. The black lines depict the wear depths (∆h) at various locations from the wear test, while the red lines represent the wear rate density (
Er) at different locations from the numerical simulation. As shown in the figure, the distribution patterns of the wear rate density and wear depth are generally consistent. Along the y-axis of the leading edge of the airfoil, both the wear rate density and wear depth initially increased and then decreased, whereas on the S1 surface, it occurred at y = -1.75 mm, and on the S2 surface, it occurred at y = 1.0 mm, both corresponding to the locations of the maximum wear rate density. This confirmed the accuracy of the numerical simulations.
3.2.2. Airfoil Wear Mechanism Analysis
The wear distribution at the leading edge of the airfoil was directly related to the particle motion characteristics and particle concentration before impact. By extracting parameters such as the solid-phase velocity, impact angle, particle volume fraction, and particle motion trajectory in the near-wall region, the solid-phase motion characteristics were analyzed to study the wear generation mechanism at the leading edge of the airfoil.
Figure 15 shows the distribution curves of the solid–liquid two-phase velocity along the y-axis in the near-wall region at the leading edge of the airfoil. Curves with the same color indicate that they are located on the same x-coordinate. The solid line with symbols represents the solid-phase velocity, whereas the dashed line represents the liquid-phase velocity. It is clear from the figure that the closer to the wall (i.e., the smaller the absolute values of x and y), the more pronounced the velocity slip between the solid and liquid phases. A velocity minimum was observed within the range of y = -4 mm to 4 mm. Combining this with
Figure 14, it can be seen that in the region between y = -2.5 mm and -1.5 mm, the impact velocity in the wear zone was relatively low. The solid phase in the near-wall region at the leading edge of the airfoil impacts the wall at a low velocity.
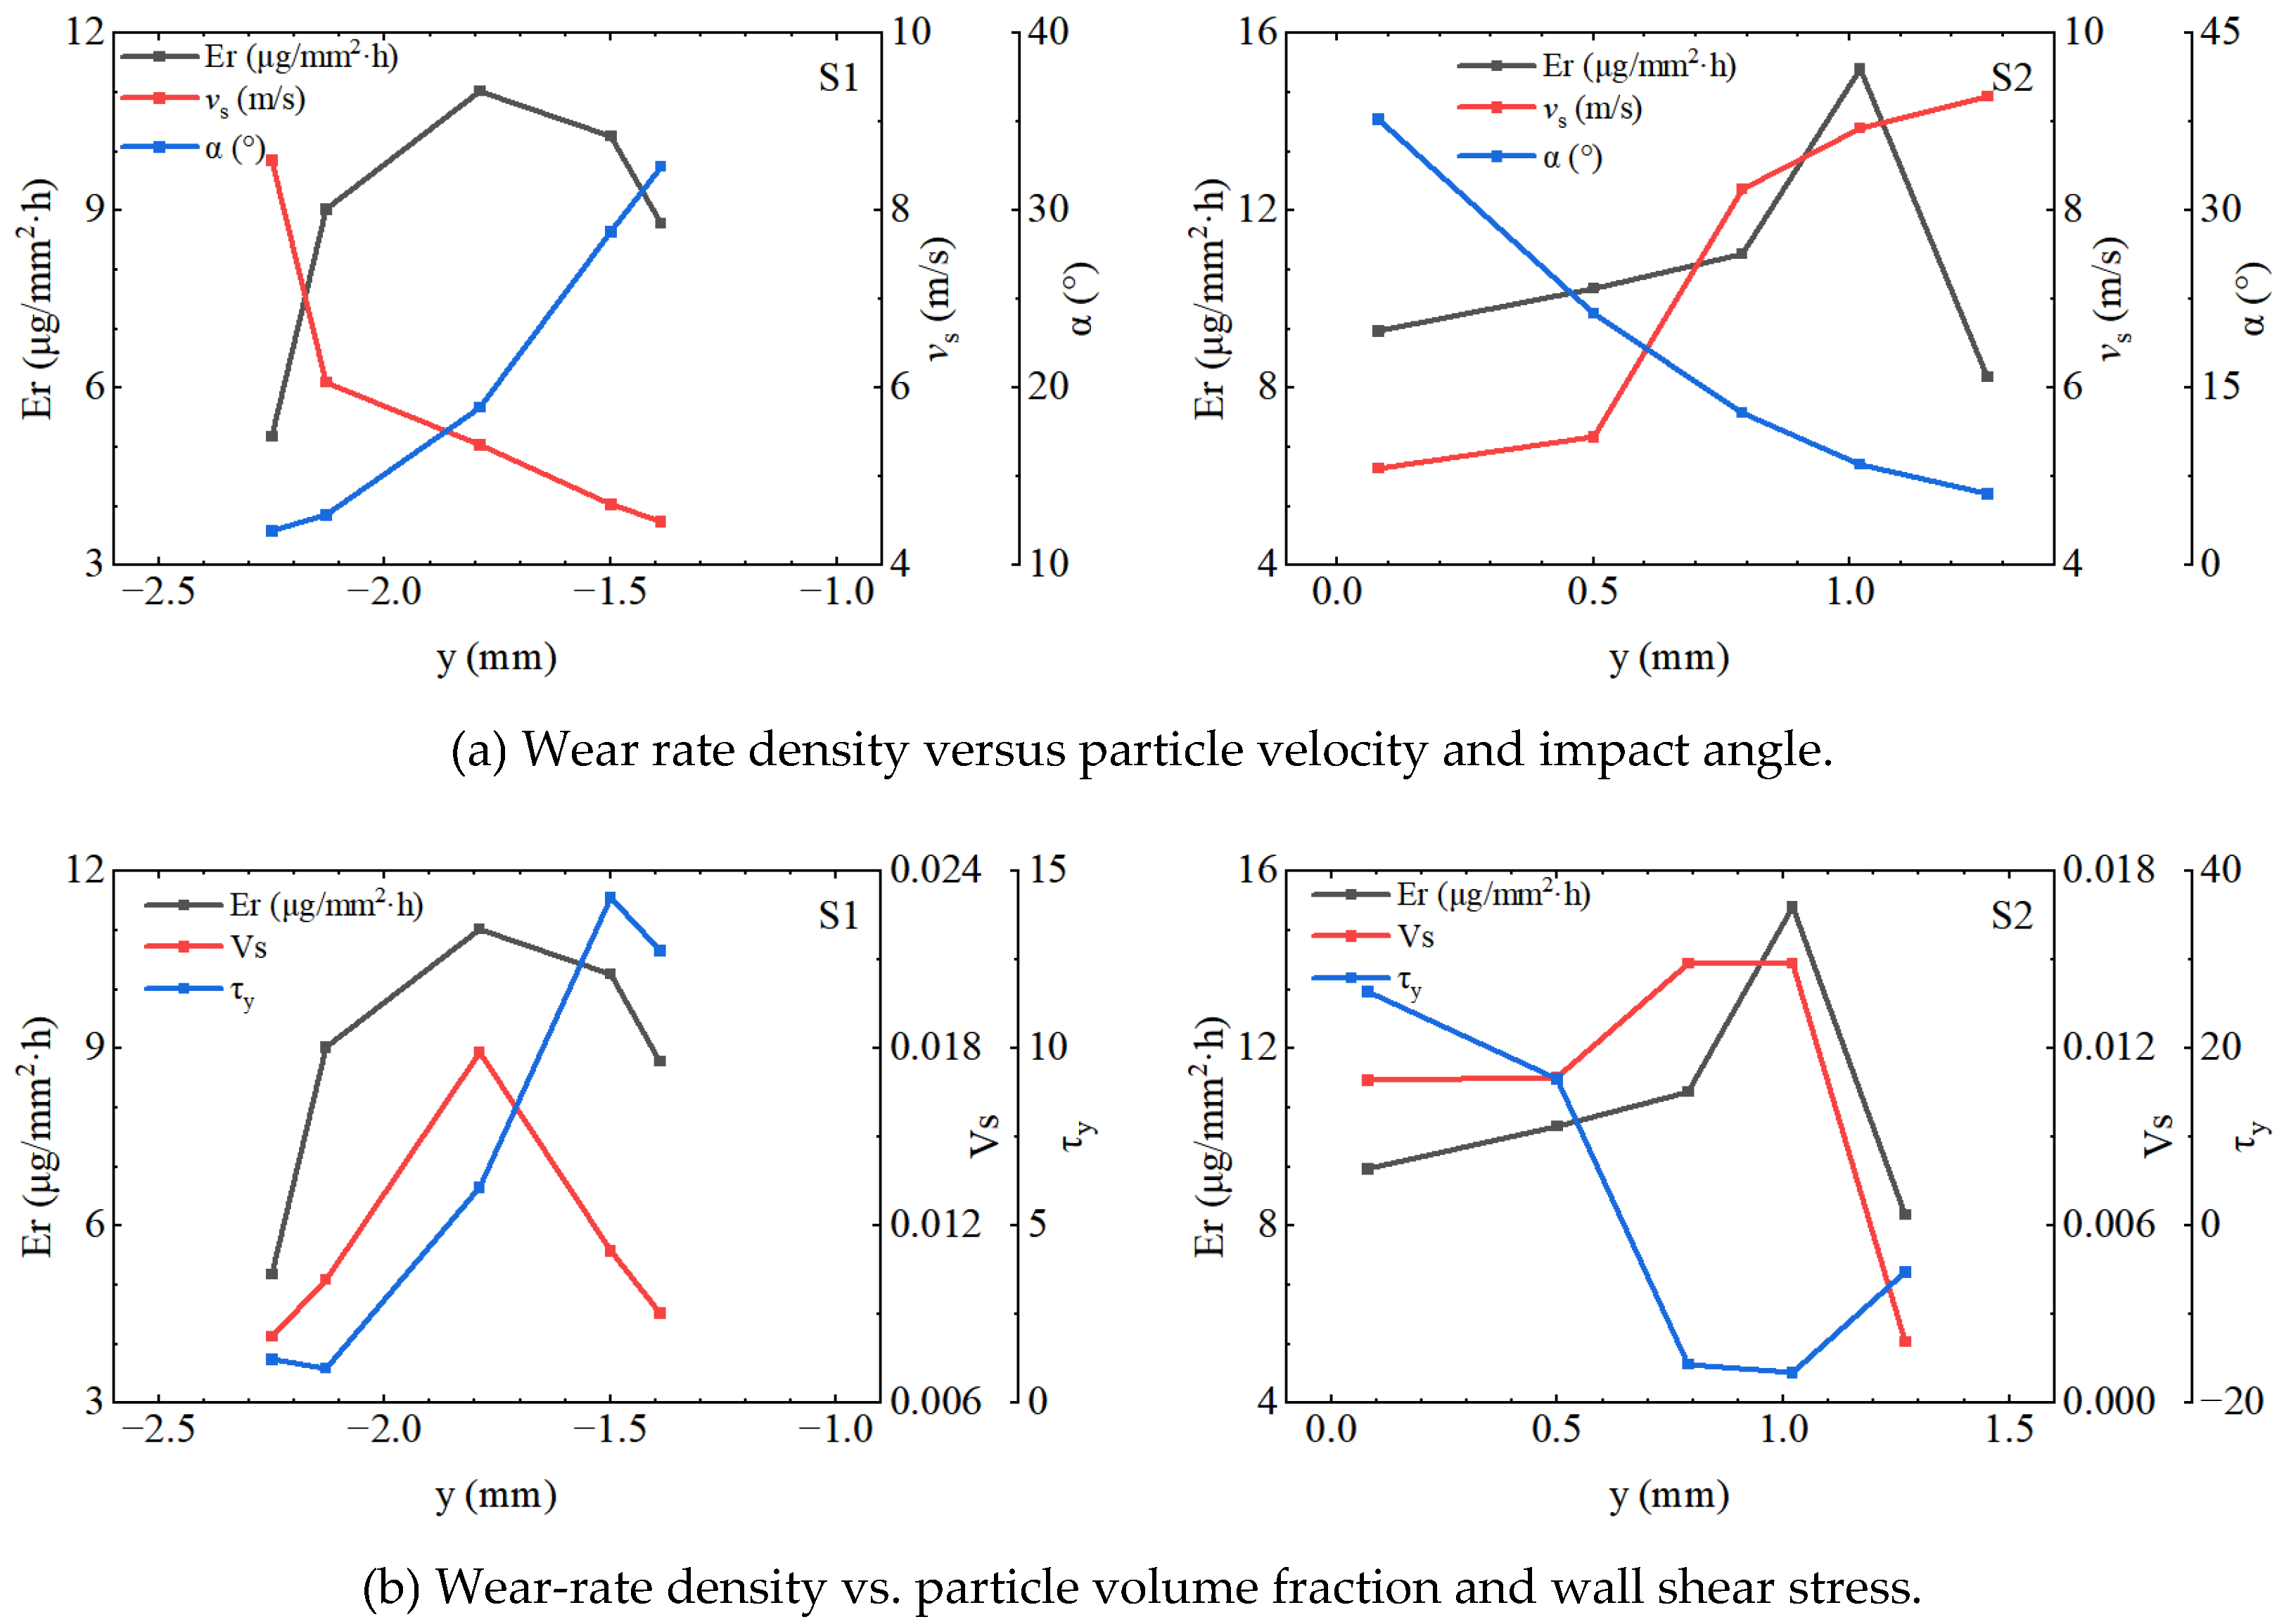
To investigate the patterns of the wear characteristics at the leading edge of airfoil surfaces S1 and S2, as well as those of the particle impact characteristics during the initial stage of wear, data were collected from the 50% spanwise section of the airfoil using the y-axis as the horizontal coordinate. The collected data included the wear rate density of surfaces S1 and S2, along with the corresponding particle impact velocity, impact angle, volume fraction, and wall shear stress, as shown in
Figure 16. As shown in
Figure 16, the wear patterns on surfaces S1 and S2 are largely consistent. Along the y-axis, moving towards the leading edge, the wear rate density initially increased and then decreased, reaching peak values at y = -1.79 mm and y = 1.02 mm. The maximum wear rate density of S2 was higher than that of S1. As shown in
Figure 16(a), the wear rate density did not have a direct positive correlation with the particle impact velocity or impact angle. Moving closer to the leading edge along the y-axis, the impact velocity tended to decrease, whereas the impact angle increased. From
Figure 16(b), it is clear that the particle volume fraction is not positively correlated with the wear rate density.
The highest wear rate density occurred at the point of the maximum particle volume fraction. For the wall shear stress,
Figure 16(b) shows that the shear stress in the y-direction influenced the wear rate density. Positive stress acts on surface S1, whereas negative stress affects surface S2. The maximum shear stress on surface S2 coincides with the maximum wear rate density and particle volume fraction, whereas the maximum stress point on surface S1 does not coincide with the maximum wear rate density. This indicates that the particle volume fraction has a greater impact on the wear rate than the shear stress in the y-direction. The higher wear rate density on surface S2 was due to the higher particle volume fraction compared with that on surface S1.
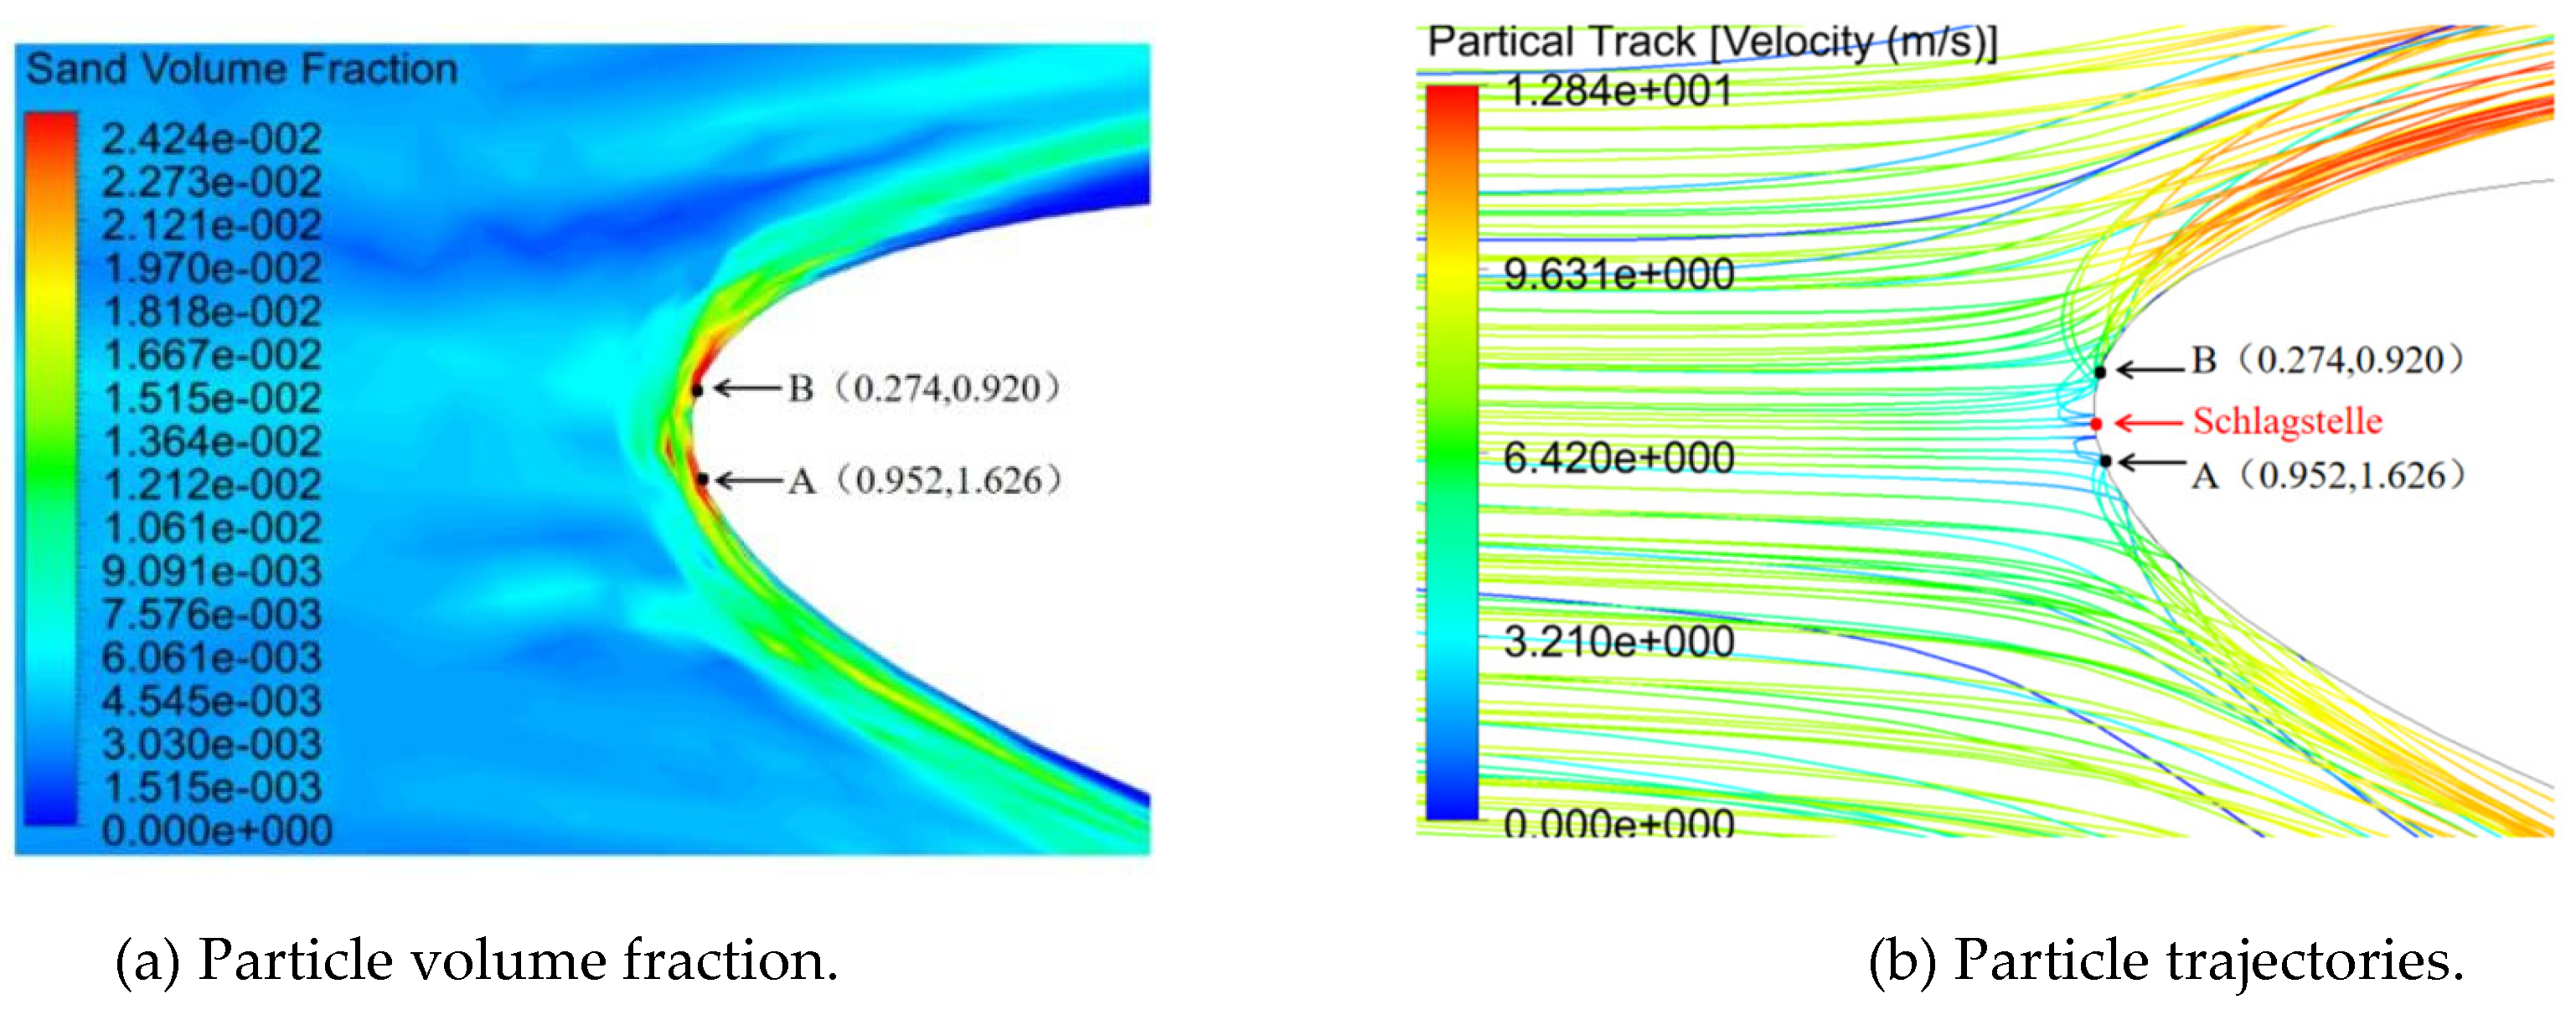
Figure 17 shows the distributions of the particle volume fraction and particle motion trajectory at the leading edge of the airfoil in a 50% spanwise section. As shown in
Figure 17(a), there were particle accumulation zones near the wall on both the S1 and S2 surfaces at the leading edge of the airfoil. This was mainly caused by the particles impacting the wall at large impact angles, rebounding, and secondary impacts on the downstream wall. Therefore, two points of initial wear, A (0.952 and 1.626) and B (0.274 and 0.920) appeared during the initial wear stage. The different coordinates of points A and B were owing to the asymmetric nature of the incoming flow. From the particle trajectory in
Figure 17(b), it can be observed that flow separation occurred downstream of the leading edge of the airfoil, which was the main reason why the wear was concentrated at the leading edge.
Overall, the wear at the leading edge of the airfoil was influenced by several factors, including the particle impact velocity, impact angle, particle volume fraction, and shear stress in the y-direction. A low-velocity zone was identified near the impact point at the airfoil’s leading edge, where the particles impacted the wall at relatively low velocities and large impact angles. After the initial impact, the particles rebounded and caused a secondary impact downstream of the initial impact point, leading to particle accumulation near points A and B. Consequently, in the initial stage of wear, the initiation points for wear were slightly downstream from the impact points A and B. Considering that the y-direction wall shear stress was the dominant factor in wear formation, the y-direction wall shear stress near point B on the S2 surface was greater than that near point A on the S1 surface. Consequently, the maximum wear rate density of the S2 surface was higher than that of the S1 surface, primarily because of the asymmetric incoming flow. The wear mostly occurred at the leading edge of the airfoil, largely because of the flow separation in the downstream region of the leading edge.
5. Conclusions
This study investigated leading-edge wear on an airfoil in sediment-laden water using tests and numerical simulations. The wear development process was analyzed experimentally, and numerical simulations were employed to investigate variations in the wear rate density, particle flow field characteristics, and particle impact characteristics during the initial wear stage. This approach enhances our understanding of the mechanisms that affect the leading edge of an airfoil.
The following conclusions were drawn through the wear tests:
Based on the physical testing, the wear process was categorized into three stages: initial (0–36 h), development (36–84 h), and stabilization stages(84–132 h). During the initial stage, both surfaces S1 and S2 exhibited extreme points of wear depth, with the wear depth profile approximating a parabolic curve. The maximum wear depth on the S1 surface was smaller than that on the S2 surface.
During the development stage, two wear-depth maxima appeared on the S1 surface. The wear depth in the previous stage continued to increase. A second extreme point emerged, and the maximum wear depth on the S2 surface progressively increased, shifting downstream along the airfoil surface. The maximum wear depth of the S1 surface exceeded that of the S2 surface.
During the stabilization stage, compared to the previous stage, the wear rate at the first extreme point on the S1 surface decreased, whereas the wear rate at the second extreme point increased, with the wear depth surpassing that at the first extreme point. The deepest wear point shifted further downstream, and, ultimately, the maximum wear depth on the S1 surface was less than that on the S2 surface.
The following conclusions can be drawn from the numerical simulations:
(4) During the initial stage, the wear rate density is primarily influenced by the particle impact velocity, impact angle, particle volume fraction, and shear stress in the y-direction. A low-velocity zone exists near the impact point, where particles, after impacting the wall at a relatively low velocity and high impact angle, rebound and cause secondary impacts on the downstream wall. This results in particle accumulation downstream of the impact point, creating two wear initiation points at A and B. The y-direction wall shear stress significantly affected the wear rate density, which explains why the maximum wear rate density on the S2 surface was higher than that on the S1 surface during the initial wear stage.
(5) The flow separation downstream of the leading edge of the airfoil was the primary reason for the predominant wear observed at this location.
Author Contributions
Conceptualization, L.L and L.Z; methodology, Z.L and L.Z.; writing— original draft preparation, Z.L.; writing—review and editing, T.L. and W.W.; supervision, L.L.; project administration, L.M. All authors have read and agreed to the published version of the manuscript.
Funding
This work was supported by the IWHR Research & Development Support Program(HM0145B012021).
Institutional Review Board Statement
Not applicable.
Informed Consent Statement
Not applicable.
Data Availability Statement
Not applicable.
Conflicts of Interest
Not applicable.
References
- Lu, L.; Liu, J.; Yi, Y.L. Evaluation of sand abration of hydraulic in Baihetan hydropower Station. Journal of hydropower 2016, 35, 67–74. (In Chinese) [Google Scholar]
- Padhy, M.K.; Saini, R.P. Effect of Size and Concentration of Silt Particles on Erosion of Pelton Turbine Buckets. Energy 2009, 34, 1477–1483. [Google Scholar] [CrossRef]
- Han, L.; Wang, Y.; Zhang, G.F.; Wei, X.Z. The Particle Induced Energy Loss Mechanism of Pelton Turbine. Renewable Energy 2021, 173, 237–248. [Google Scholar] [CrossRef]
- Ge, X.; Sun, J.; Zhou, Y.; Cai, J.; Zhang, H.; Zhang, L.; Ding, M.; Deng, C.; Binama, M.; Zheng, Y. Experimental and Numerical Studies on Opening and Velocity Influence on Sediment Erosion of Pelton Turbine Buckets. Renewable Energy 2021, 173, 1040–1056. [Google Scholar] [CrossRef]
- Chen, M.; Tan, L.; Fan, H.; Wang, C.; Liu, D. Solid-Liquid Multiphase Flow and Erosion Characteristics of a Centrifugal Pump in the Energy Storage Pump Station. J. Energy Storage 2022, 56, 105916. [Google Scholar] [CrossRef]
- Shrestha, U.; Chen, Z.; Choi, D.Y. Correlation of the Sediment Properties and Erosion in Francis Hydro Turbine Runner. Int. J. Fluid Mach. Syst. 2019, 12, 109–118. [Google Scholar] [CrossRef]
- Rohit, S.K.; Bhupendra, G.K. Erosive Flow Field Investigation on Guide Vanes of Francis Turbine – A Systematic Review. Sustainable Energy Technol. Assess. 2022, 53, 102491. [Google Scholar]
- Thapa, S.B.; Trivedi, C.; Dahlhaug, G.O. Design and Development of Guide Vane Cascade for a Low Speed Number Francis Turbine. J. Hydrodyn. 2016, 28, 676–689. [Google Scholar] [CrossRef]
- Koirala R, Neopane P H,Zhu B, et al. Effect of sediment erosion on flow around guide vanes of Francis turbine. Renewable Energy 2019, 136. [Google Scholar]
- Zhu, L.; Zhang, H.; Chen, Y.; Meng, X.; Lu, L. Asymmetric Solid–Liquid Two-Phase Flow Around a NACA0012 Cascade in Sediment-Laden Flow. Symmetry 2022, 14, 540. [Google Scholar] [CrossRef]
- Zhu, L.; Liu, Z.; Zhang, J.; Zhang, H.; Rao, L.; Lu, L. PIV Experimental Study on Water-Sediment Two-Phase Flow in NACA0012 Cascade. In Proceedings of the 4th IAHR Asian Working Group Symposium on Hydraulic Machinery and Systems, Kashgar, China, 12–16 August 2023; IOP Publishing, 2024; Volume 2752, p. 012208. [Google Scholar]
- Gautam, S.; Acharya, N.; Lama, R.; Chitrakar, S.; Neopane, H.P.; Zhu, B.; Dahlhaug, O.G. Numerical and experimental investigation of erosive wear in Francis runner blade optimized for sediment laden hydropower projects in Nepal. Sustainable Energy Technol. Assess. 2022, 51, 101954. [Google Scholar] [CrossRef]
- Khan, R.; Ullah, S.; Qahtani, F.; Pao, W.; Talha, T. Experimental and numerical investigation of hydro-abrasive erosion in the Pelton turbine buckets for multiphase flow. Renewable Energy 2024, 222, 119829. [Google Scholar] [CrossRef]
- Mansouri, A.; Arabnejad, H.; Shirazi, S.A.; McLaury, B.S. A combined CFD/experimental methodology for erosion prediction. Wear 2015, 332, 1090–1097. [Google Scholar] [CrossRef]
- Zhang, Y.; Jia, Y.F.; Sun, X.W.; Fang, Z.H.; Yan, J.J.; Zhang, C.C.; Zhang, X.C. A model of erosion rate prediction for component with complex geometry based on numerical simulation. Wear 2024, 546, 205328. [Google Scholar] [CrossRef]
- Brekke, H.; Wu, Y.L.; Cai, B.Y. Design of hydraulic machinery working in sand laden water, 2nd ed.; Imperial College Press: London, 2002; Volume 2, pp. 155–181. [Google Scholar]
- Song, X.; Zhou, X.; Song, H.; Deng, J.; Wang, Z. Study on the Effect of the Guide Vane Opening on the Band Clearance Sediment Erosion in a Francis Turbine. J. Mar. Sci. Eng. 2022, 10, 1396. [Google Scholar] [CrossRef]
- Jia, L.; Zeng, Y.; Liu, X.; Huang, W. Numerical Simulation and Experimental Study on Sediment Wear of Fixed Guide Vanes of Hydraulic Turbines in Muddy River Based on Discrete Phase Model. Processes 2023, 11, 2117. [Google Scholar] [CrossRef]
- Yao, B.; Li, J.; Zhao, T.; Liu, X. Sediment wear prediction model of ZG06Cr13Ni4Mo turbine guide vane in sediment-laden hydropower station. Mater. Express 2021, 11, 1866–1873. [Google Scholar] [CrossRef]
- Zhao, X.; Peng, Y.; Yang, J.; Chen, J.; Xu, L.; Tang, W.; Liu, X. Sediment wear of turbine guide vane before and after tungsten carbide treatment. Adv. Mech. Eng. 2022, 14, 16878132221089435. [Google Scholar] [CrossRef]
- Khan, R.; Ullah, S.; Qahtani, F.; Pao, W.; Talha, T. Experimental and numerical investigation of hydro-abrasive erosion in the Pelton turbine buckets for multiphase flow. Renewable Energy 2024, 222, 119829. [Google Scholar] [CrossRef]
- Dosanjh, S.; Humphrey, J.A. The influence of turbulence on erosion by a particle-laden fluid jet. Wear 1985, 102, 309–330. [Google Scholar] [CrossRef]
- Noon, A.A.; Kim, M.H. Erosion wear on centrifugal pump casing due to slurry flow. Wear 2016, 364, 103–111. [Google Scholar] [CrossRef]
Figure 1.
Structure of the Venturi abrasion test system.
Figure 1.
Structure of the Venturi abrasion test system.
Figure 2.
Channel dimensions of the test section.
Figure 2.
Channel dimensions of the test section.
Figure 3.
Surface profiler.
Figure 3.
Surface profiler.
Figure 4.
Morphological data acquisition and processing.
Figure 4.
Morphological data acquisition and processing.
Figure 5.
3D model of the test section.
Figure 5.
3D model of the test section.
Figure 6.
Mesh division schematic.
Figure 6.
Mesh division schematic.
Figure 7.
Wear test results.
Figure 7.
Wear test results.
Figure 8.
Outer contour lines of the leading edge at different time points for the S1 and S2 surfaces.
Figure 8.
Outer contour lines of the leading edge at different time points for the S1 and S2 surfaces.
Figure 9.
Wear depth at the leading edge of the airfoil.
Figure 9.
Wear depth at the leading edge of the airfoil.
Figure 10.
Wear process of S1 and S2 surface of airfoil leading edge during initial stage.
Figure 10.
Wear process of S1 and S2 surface of airfoil leading edge during initial stage.
Figure 11.
Wear process of S1 and S2 surface of airfoil leading edge during development stage.
Figure 11.
Wear process of S1 and S2 surface of airfoil leading edge during development stage.
Figure 12.
Wear process of S1 and S2 surface of airfoil leading edge during stabilization stage.
Figure 12.
Wear process of S1 and S2 surface of airfoil leading edge during stabilization stage.
Figure 13.
Wear rate density distribution.
Figure 13.
Wear rate density distribution.
Figure 14.
Comparison of numerical simulation and wear test results.
Figure 14.
Comparison of numerical simulation and wear test results.
Figure 15.
Solid–liquid two-phase velocity distribution curves in the near-wall region at the leading edge of the airfoil (Re = 8.0 × 10⁵).
Figure 15.
Solid–liquid two-phase velocity distribution curves in the near-wall region at the leading edge of the airfoil (Re = 8.0 × 10⁵).
Figure 16.
Wear at the leading edge of the airfoil.
Figure 16.
Wear at the leading edge of the airfoil.
Figure 17.
Particle volume fraction and motion trajectory in the near-wall region at the leading edge of the airfoil.
Figure 17.
Particle volume fraction and motion trajectory in the near-wall region at the leading edge of the airfoil.
Table 1.
Mechanical properties of specimen material.
Table 1.
Mechanical properties of specimen material.
| Material |
Hardness |
Tensile strength σb
MPa |
Conditional yield strength σ0.2
MPa |
Elongation δ5 (%) |
| 6061 |
90–95 HBW |
180 |
110 |
14 |
Table 2.
Test conditions.
Table 2.
Test conditions.
| Re |
Impact angle α |
Sediment mass concentration Cm (kg/m3) |
Sediment volume fraction CV (%) |
Average sediment concentration (kg/m3) |
Median particle size
(μm) |
| 8.0×10⁵
|
10° |
6.0 |
0.28 |
5.61 |
65.9 |
Table 3.
Maximum wear depth of the S1 and S2 surfaces.
Table 3.
Maximum wear depth of the S1 and S2 surfaces.
| Test time t/h |
Maximum wear depth |
| S1 surface |
S2 surface |
| 36 |
56.6 |
74.0 |
| 60 |
117.8 |
113.8 |
| 84 |
186.3 |
170.9 |
| 108 |
215.5 |
250.7 |
| 132 |
258.9 |
275.0 |
|
Disclaimer/Publisher’s Note: The statements, opinions and data contained in all publications are solely those of the individual author(s) and contributor(s) and not of MDPI and/or the editor(s). MDPI and/or the editor(s) disclaim responsibility for any injury to people or property resulting from any ideas, methods, instructions or products referred to in the content. |
© 2024 by the authors. Licensee MDPI, Basel, Switzerland. This article is an open access article distributed under the terms and conditions of the Creative Commons Attribution (CC BY) license (http://creativecommons.org/licenses/by/4.0/).
