1. Introduction
Computational Thinking (CT) has emerged as a foundational skill in the 21st century, equipping individuals with problem-solving techniques that are integral in a wide range of disciplines, including computer science, engineering, and even the arts [
1]. As technology becomes increasingly integrated into educational environments, it is essential to explore and develop teaching methodologies that not only engage young learners but also provide educators with the tools to foster these skills in their students [
2].
Teaching CT effectively in Early Childhood Education (ECE) presents unique challenges due to the developmental stages of young learners [
3]. Research has shown that while young children can engage with CT concepts, effective instructional approaches are necessary to make these concepts accessible and relevant to their cognitive abilities [
4]. One promising approach involves the use of educational robotics, which provides a tangible, interactive way for young students to engage with CT concepts [
5]. However, there remains a gap in understanding how best to prepare preservice teachers to incorporate robotics and CT into their future classrooms.
The preparation of future educators, particularly preservice teachers, is critical to ensuring the successful integration of CT into early childhood curricula [
6]. Educational robotics has been recognized as a powerful tool to enhance CT, but the complexity of designing and implementing such methodologies requires innovative approaches [
7]. The use of Artificial Intelligence (AI) in generating specific contexts for robotics education presents a novel strategy to address these challenges, allowing for tailored learning experiences that can better support both teachers and students.
Integrating computational thinking (CT) into early childhood education is crucial for preparing young learners for the digital age. There are effective methods for incorporating CT into early childhood education, drawing on insights from multiple research studies. Such as, unplugged activities, which do not require digital devices, are effective in enhancing children’s CT skills by providing concrete experiences and tangible learning materials [
8,
9,
10] and unplugged methods, such as using tangible materials and educational robots, help in developing CT skills like sequencing, pattern recognition, and algorithm design [
9,
10,
11]. Or combining unplugged activities with plugged (digital) activities can be beneficial. Unplugged activities can lay the groundwork for understanding CT concepts, which can then be reinforced through digital activities [
9,
10], this combined approach has shown positive effects on children’s coding skills and cognitive abilities, including visuo-spatial skills [
10].
The teacher’s role and professional development play a critical role in fostering CT in young children. Effective strategies include scaffolding, modeling, and providing differentiated instruction based on children’s developmental stages [
11,
12,
13]. Professional development for teachers is essential to equip them with both content knowledge and pedagogical knowledge specific to CT [
11,
13]. Developmentally appropriate assessment tools, such as TechCheck, are necessary to evaluate CT skills in young children without requiring prior programming knowledge. These tools help in identifying different skill levels and guiding instruction [
14].
Integrating CT with other subjects, particularly mathematics, can enhance learning outcomes. Activities that combine CT with math concepts, such as problem-solving and debugging, are effective in promoting CT skills [
11,
15]. In this paper, we investigate the combination of integrating CT with an established context children are already working with [
11,
15].
Effective methods for integrating computational thinking into early childhood education include the use of unplugged activities, combined unplugged and plugged approaches, and interdisciplinary integration with subjects like mathematics. Teachers play a pivotal role, and their professional development is crucial for successful implementation. Developmentally appropriate assessment tools are also essential for measuring and guiding CT skill development in young learners.
This study explores a methodology that leverages AI to generate specific contexts for teaching robotics, aiming to improve CT among future educators and their students. Through an experiment conducted with 120 undergraduate preservice teachers enrolled in a Computer Science and Digital Competence course, the research investigates the effectiveness of AI-generated contexts in practical assignments. By comparing the outcomes between an experimental group using this AI-aided methodology and a control group employing traditional methods, this study examines the impact of AI-generated contexts on the acquisition of CT skills and attitudes toward learning.
In this paper, we will outline the AI-aided methodology employed, the results of the study, and the implications for training preservice teachers to effectively incorporate CT and robotics in early childhood education.
The hypotheses of this research are as follows:
H1. It is possible to improve early childhood student teachers’ computational thinking by using AI-generated contexts for teaching robotics.
H2.
Some Computational Thinking Domains are more easily improved than others; therefore, those may need more time to practice.
H3.
It is possible to improve the perception of by using AI-generated context for teaching robotics.
H4.
It is possible to improve the perceived knowledge students’ teachers have on the use of educational robots by using AI-generated context methodology.
It is anticipated that AI-generated context for practical assignments plays a crucial part in today’s world and that this study will greatly contribute to the body of literature given the dearth of research and advancement on the subject. Consequently, building on the aforementioned theories, we concentrate on resolving the following research issues in this work:
- RQ1: Does the AI-generated context for teaching robotics improve student teachers computational thinking skills/domains?
- RQ2: which computational thinking skills/domains (hardware & software, debugging, algorithm, modularity, representation and control structures) have improved more or less?
- RQ3: In the technology acceptance model, are there distinct measures for perceived usefulness, social norms, behavioral intention, attitude towards use, and actual use?
- RQ4: Is the perception of student teachers regarding their ability to teach educational robots higher in the AI-generated context methodology group?
- RQ5: Is there a relationship between student teachers’ ability to teach educational robots and their technology acceptance?
In the following subsections, a review of the state of the art on how to address Computational thinking in early childhood is being studied. Following that, a review on the Technology Acceptance Model for addressing how educators accept using specific technology in their classroom. Finally, how to measure their knowledge of specific educational robotics in their classroom.
1.1. Early Childhood Computational Thinking Test
Studies suggest that integrating computational thinking assessment in early childhood education improves children’s computational thinking skills, cognitive abilities, achievements in various disciplines, and teachers’ professional knowledge and teaching effectiveness. Integrating computational thinking (CT) assessment in early childhood education is gaining traction as educators and researchers recognize its potential to enhance cognitive abilities and prepare children for a technology-driven world. This synthesis explores the benefits of incorporating CT assessments in early childhood education based on recent research findings. Developmentally Appropriate Assessment Tools like TechCheck are designed to assess CT skills in young children without requiring prior programming knowledge, making them suitable for early childhood education [
16,
17]. These tools are validated for reliability and can effectively discriminate between different skill levels among young children [
16,
17]. Furthermore, integrating CT activities, both unplugged and through educational robotics, significantly enhances cognitive abilities such as planning, response inhibition, and visuo-spatial skills in preschoolers [
18]. CT activities also improve executive functions in young children, which are crucial for their overall cognitive development [
18]. Moreover, both boys and girls perform similarly in CT and programming tasks, indicating that CT assessments are equally beneficial across genders [
19,
20] On the contrary, age is a significant factor, with older children generally performing better in CT tasks, suggesting the need for age-appropriate CT assessments [
19,
20,
21]. Integrating CT with other subjects, particularly STEM, improves achievements in these areas and prepares children for future technological challenges [
22,
23]. Also, CT skills such as sequencing, modularity, and debugging can be effectively taught in non-coding environments, enhancing learning in various disciplines [
22]. Unplugged activities, which do not require digital devices, are particularly effective in teaching CT skills to young children, providing concrete experiences that enhance understanding [
19,
24]. Thus, combining unplugged activities with plugged activities (using digital devices) offers a comprehensive approach to teaching CT, catering to different learning styles and needs [
24]. In this sense, collaborative game-based environments for learning CT are particularly effective, fostering teamwork and improving learning outcomes, especially for students with special needs or those in lower percentiles [
17]. Overall, integrating computational thinking assessment in early childhood education offers numerous benefits, including the development of cognitive abilities, improved performance in STEM and other disciplines, and effective learning across genders and age groups. Developmentally appropriate tools and a combination of unplugged and plugged activities are key to successfully implementing CT assessments. Collaborative learning environments further enhance the effectiveness of CT education, making it a valuable addition to early childhood curricula.
1.2. Technology Acceptance Model Test
The Technology Acceptance Model (TAM) is a widely used framework to understand how users come to accept and use technology. In the context of early childhood education, TAM has been applied to assess the acceptance of various educational technologies, including robotics, by preservice teachers and student teachers. For example, preservice teachers showed a willingness to accept floor-robots as useful instructional tools to support K-12 student learning [
25]. Preschool and elementary teachers also demonstrated positive reactions and acceptance of Socially Assistive Robots (SAR), although there was a need for model adaptation due to varied responses [
26]. Innovative partnerships between preservice early childhood and engineering students were effective in teaching math, science, and technology through robotics, enhancing curriculum development and implementation [
27], also factors such as subjective norm, perceived usefulness, and computer self-efficacy significantly influenced the acceptance of computer technology among kindergarten teachers [
28]. Regarding Technology Acceptance in Early Childhood Education and Care (ECEC), the intention to use technology and a positive attitude towards it were significant determinants of actual technology usage among preschool teachers, with a high explained variance in technology adoption [
29]. Moreover, robotics programming was identified as a promising tool for teaching STEM subjects, with potential benefits for both pre- and in-service early childhood educators [
30]; and engagement with robotics in a science methods course increased preservice teachers’ self-efficacy, interest, and understanding of science concepts, as well as their computational thinking skills [
31]. Therefore, the application of the Technology Acceptance Model in early childhood education reveals a generally positive reception of robotics among preservice and student teachers. Factors such as perceived usefulness, self-efficacy, and positive attitudes towards technology play crucial roles in technology acceptance. Innovative teaching partnerships and hands-on experiences with robotics further enhance preservice teachers’ readiness to integrate these technologies into their future classrooms. Overall, the findings suggest that robotics can be an effective tool for teaching STEM subjects and developing essential skills in early childhood education.
1.3. Knowledge of Educational Robotics
The integration of robotics in early childhood education is gaining traction, with various tools being introduced to enhance learning experiences. Understanding the knowledge and attitudes of preservice early childhood teachers towards these technologies is crucial for an effective implementation. Preservice teachers generally have a positive attitude towards the use of educational robotics in early childhood education, although they often lack sufficient knowledge and experience with these technologies [
34,
35]. A significant barrier to the effective use of educational robotics is the lack of teacher training and technical support. Teachers express the need for more opportunities to learn about and experience these technologies [
32,
33]. Teachers recognize the potential benefits of educational robotics, such as improving children’s engagement, learning, and development in various domains including cognitive, social-emotional, and physical skills [
32,
36,
37]. While some preservice teachers are enthusiastic about integrating robotics, others have mixed feelings or concerns, particularly regarding the cost, technical challenges, and the appropriateness of robots as social entities in the classroom [
32,
33]. Studies have shown successful implementation of robotics curricula, such as the KIBO and KIWI robotics kits, which have helped children master foundational programming and robotics concepts. These examples highlight the potential for effective integration when proper resources and support are provided [
38,
39]. As a conclusion, preservice early childhood teachers generally view educational robotics positively but face challenges due to limited knowledge and training. There is a clear need for more comprehensive training programs and technical support to help teachers effectively integrate these technologies into their classrooms. Despite these challenges, the potential benefits of educational robotics in enhancing children’s learning and development are widely recognized.
Figure 1 shows the three main domains tested on each test specific part across the paper: The Computational thinking in Early childhood Test being studied (left), the Technology Acceptance Model used by the students’ teachers (center), and finally how the measure on specific educational robotics in their classroom was taken out.
2. Materials and Methods
2.1. Research Design
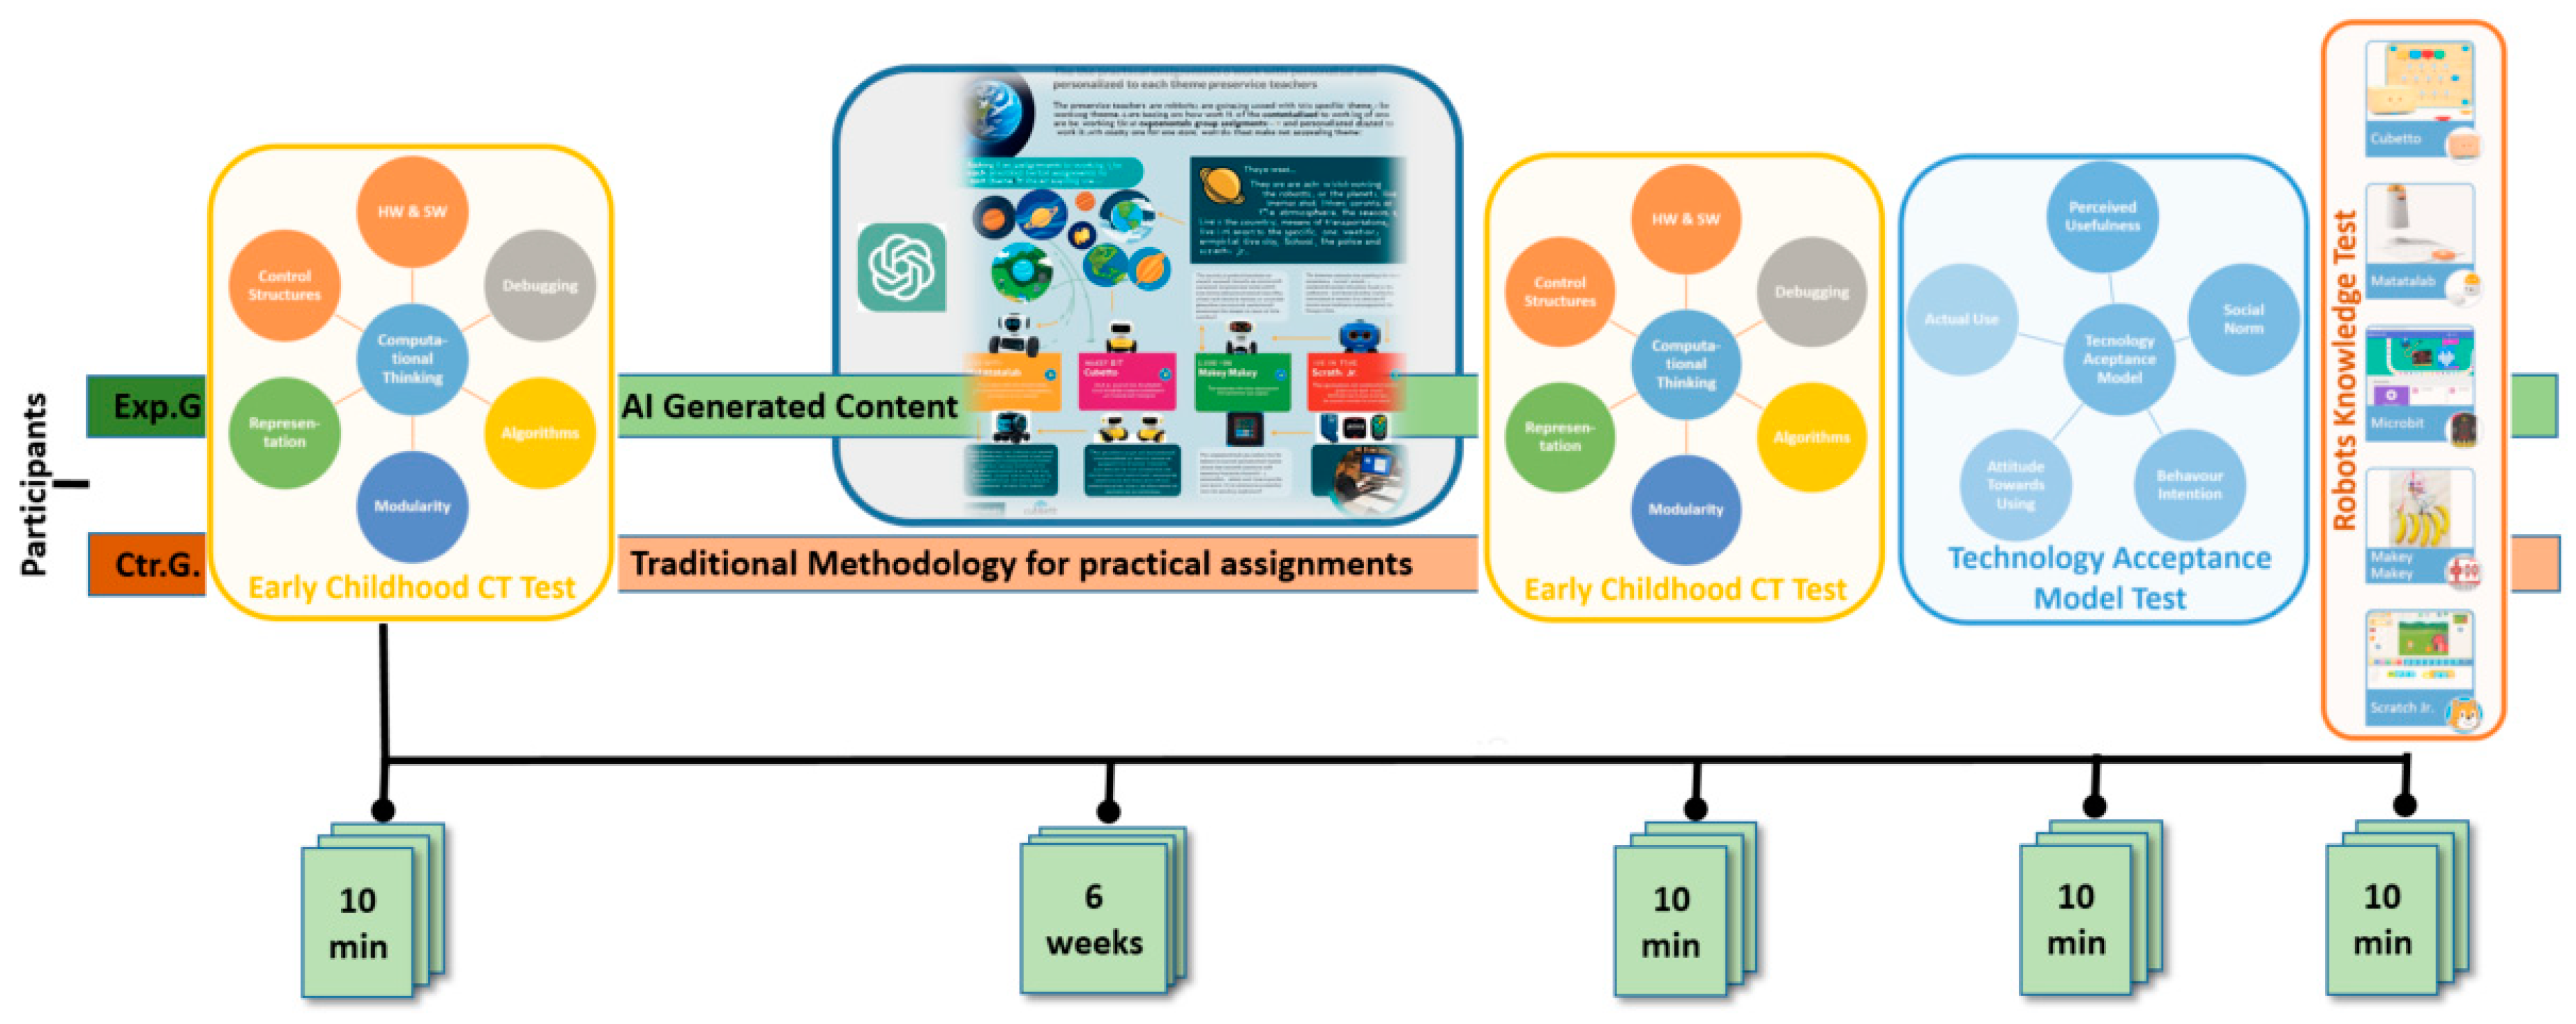
A quantitative study was conducted to measure the computational thinking ability of students studying the subjects “Computer Science and Digital Competence” of the Early Childhood Education Degree of the URJC. The students, divided geographically into two groups, used the same educational robots or environments, sessions, coordinated teachers, structural practical assignments and materials (laboratories) to work in the classroom. Both groups firstly took an early childhood CT Test, then worked for 6 weeks on the educational robotics, and finally both groups took the same Early Childhood Test, TAM test and robots knowledge test. The only difference in the experimental design is on using AI-generated context for the practical assignment in the experimental group, for two main reasons: firstly, to improve their specific learning about the use of that specific robot, and secondly to acquire an effective guide to teach those Computational Thinking concepts [
40] through the specific robot to their future students.
Figure 2 shows the outline of the experimental design.
2.2. Sampling
The sample for this study was drawn from students enrolled at Universidad Rey Juan Carlos (URJC) in Madrid, Spain. These students were part of two Early Childhood Education degree programs taught by the researchers, located in two cities: Madrid and Fuenlabrada. The control group was based in Madrid, while the experimental group was in Fuenlabrada (
Figure 2). Of the 77 students enrolled in the 1st year subject “Computer Science and Digital Competence” of Fuenlabrada, 60 completed the 3 tests. Of the 62 students enrolled in the 1st year subject “Computer Science and Digital Competence” of Madrid, 13 students completed the 3 tests. Both subjects are part of the Early Childhood Education Degree Program at URJC.
2.3. Ethics Committee
The Research Ethics Committee of Rey Juan Carlos University has favorably evaluated this research project, with internal registration number 060220240872024 to pursue the research at both cities within the URJC under the same research project.
2.4. Materials
This study used a comprehensive set of materials designed to provide a rich, contextual learning experience for preservice teachers, preparing them to effectively teach CT to young children. The materials comprised four key components: educational robots, AI-generated contextual assignments, an activity planning sheet, and evaluation rubrics
2.4.1. Educational Robots
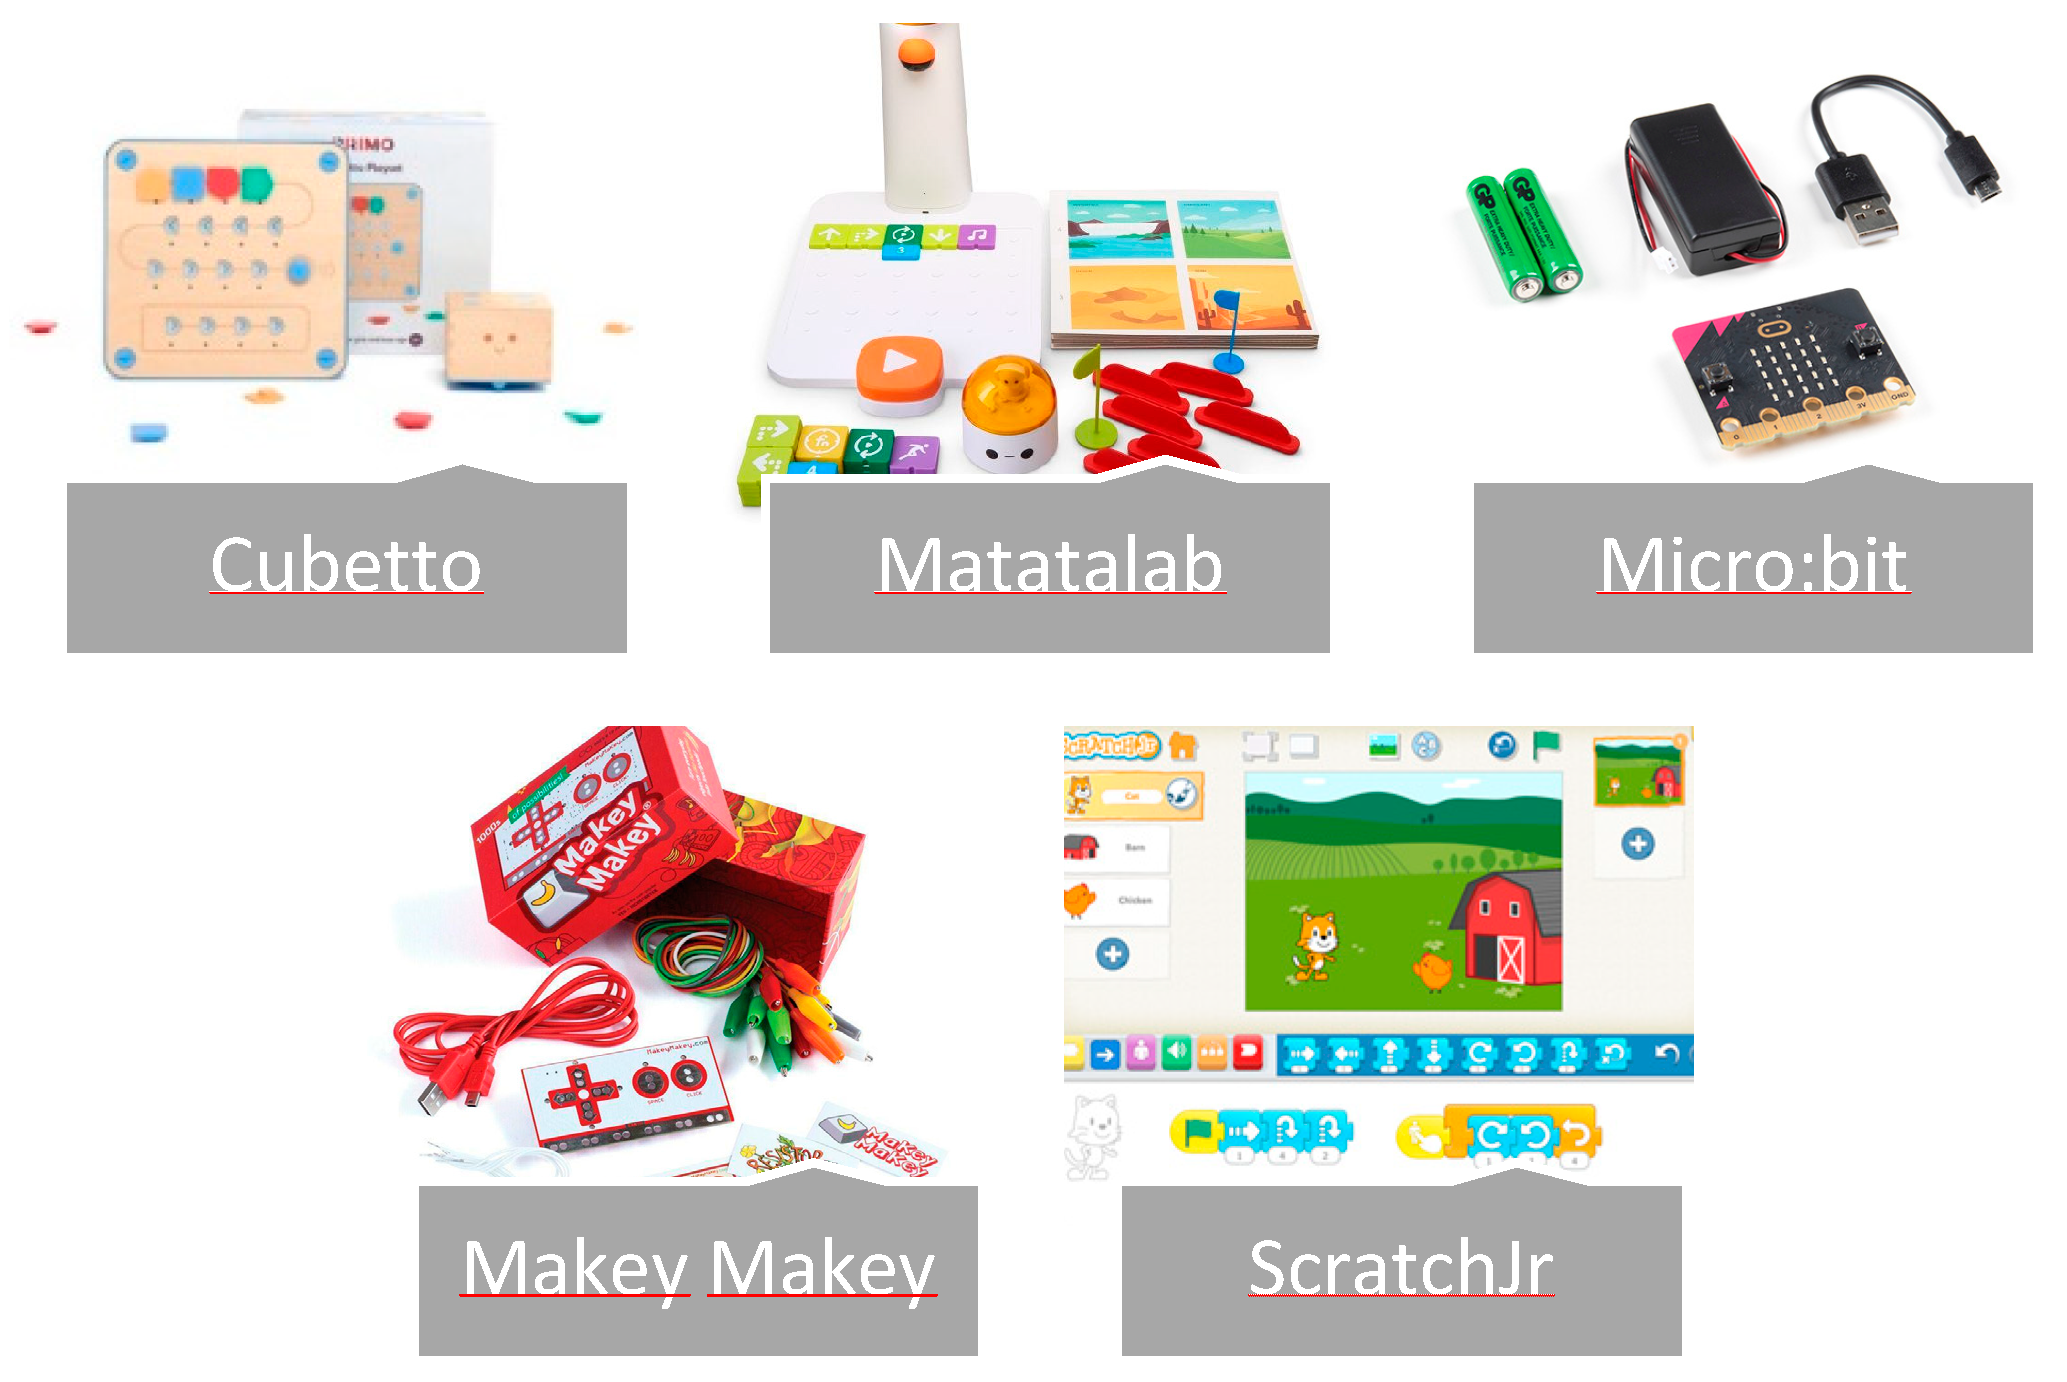
The core of the methodology centered on educational robots designed for early childhood education. These robots were selected for their simplicity and ability to engage young learners in basic programming concepts through physical movement and environmental interaction. The study utilized four distinct robots: Cubetto: A wooden robot teaching programming basics through physical coding blocks [
41], Matatalab: A screen-free coding set using tangible blocks to control a small robot [
42], Micro:bit: A pocket-sized computer introducing children to digital making and coding [
43], Makey Makey: An invention kit allowing users to turn everyday objects into touchpads [
44].
Finally, after working with the robots, the students use ScratchJr. ScratchJr is a visual programming language designed specifically for young children (ages 5-7) to program their own interactive stories and games [
45].
Figure 3 illustrates the four educational robots used in the study: Cubetto, Matatalab, Micro:bit, and Makey Makey, as well as a screenshot of the ScratchJr program.
2.4.2. AI-Generated Contextual Assignments
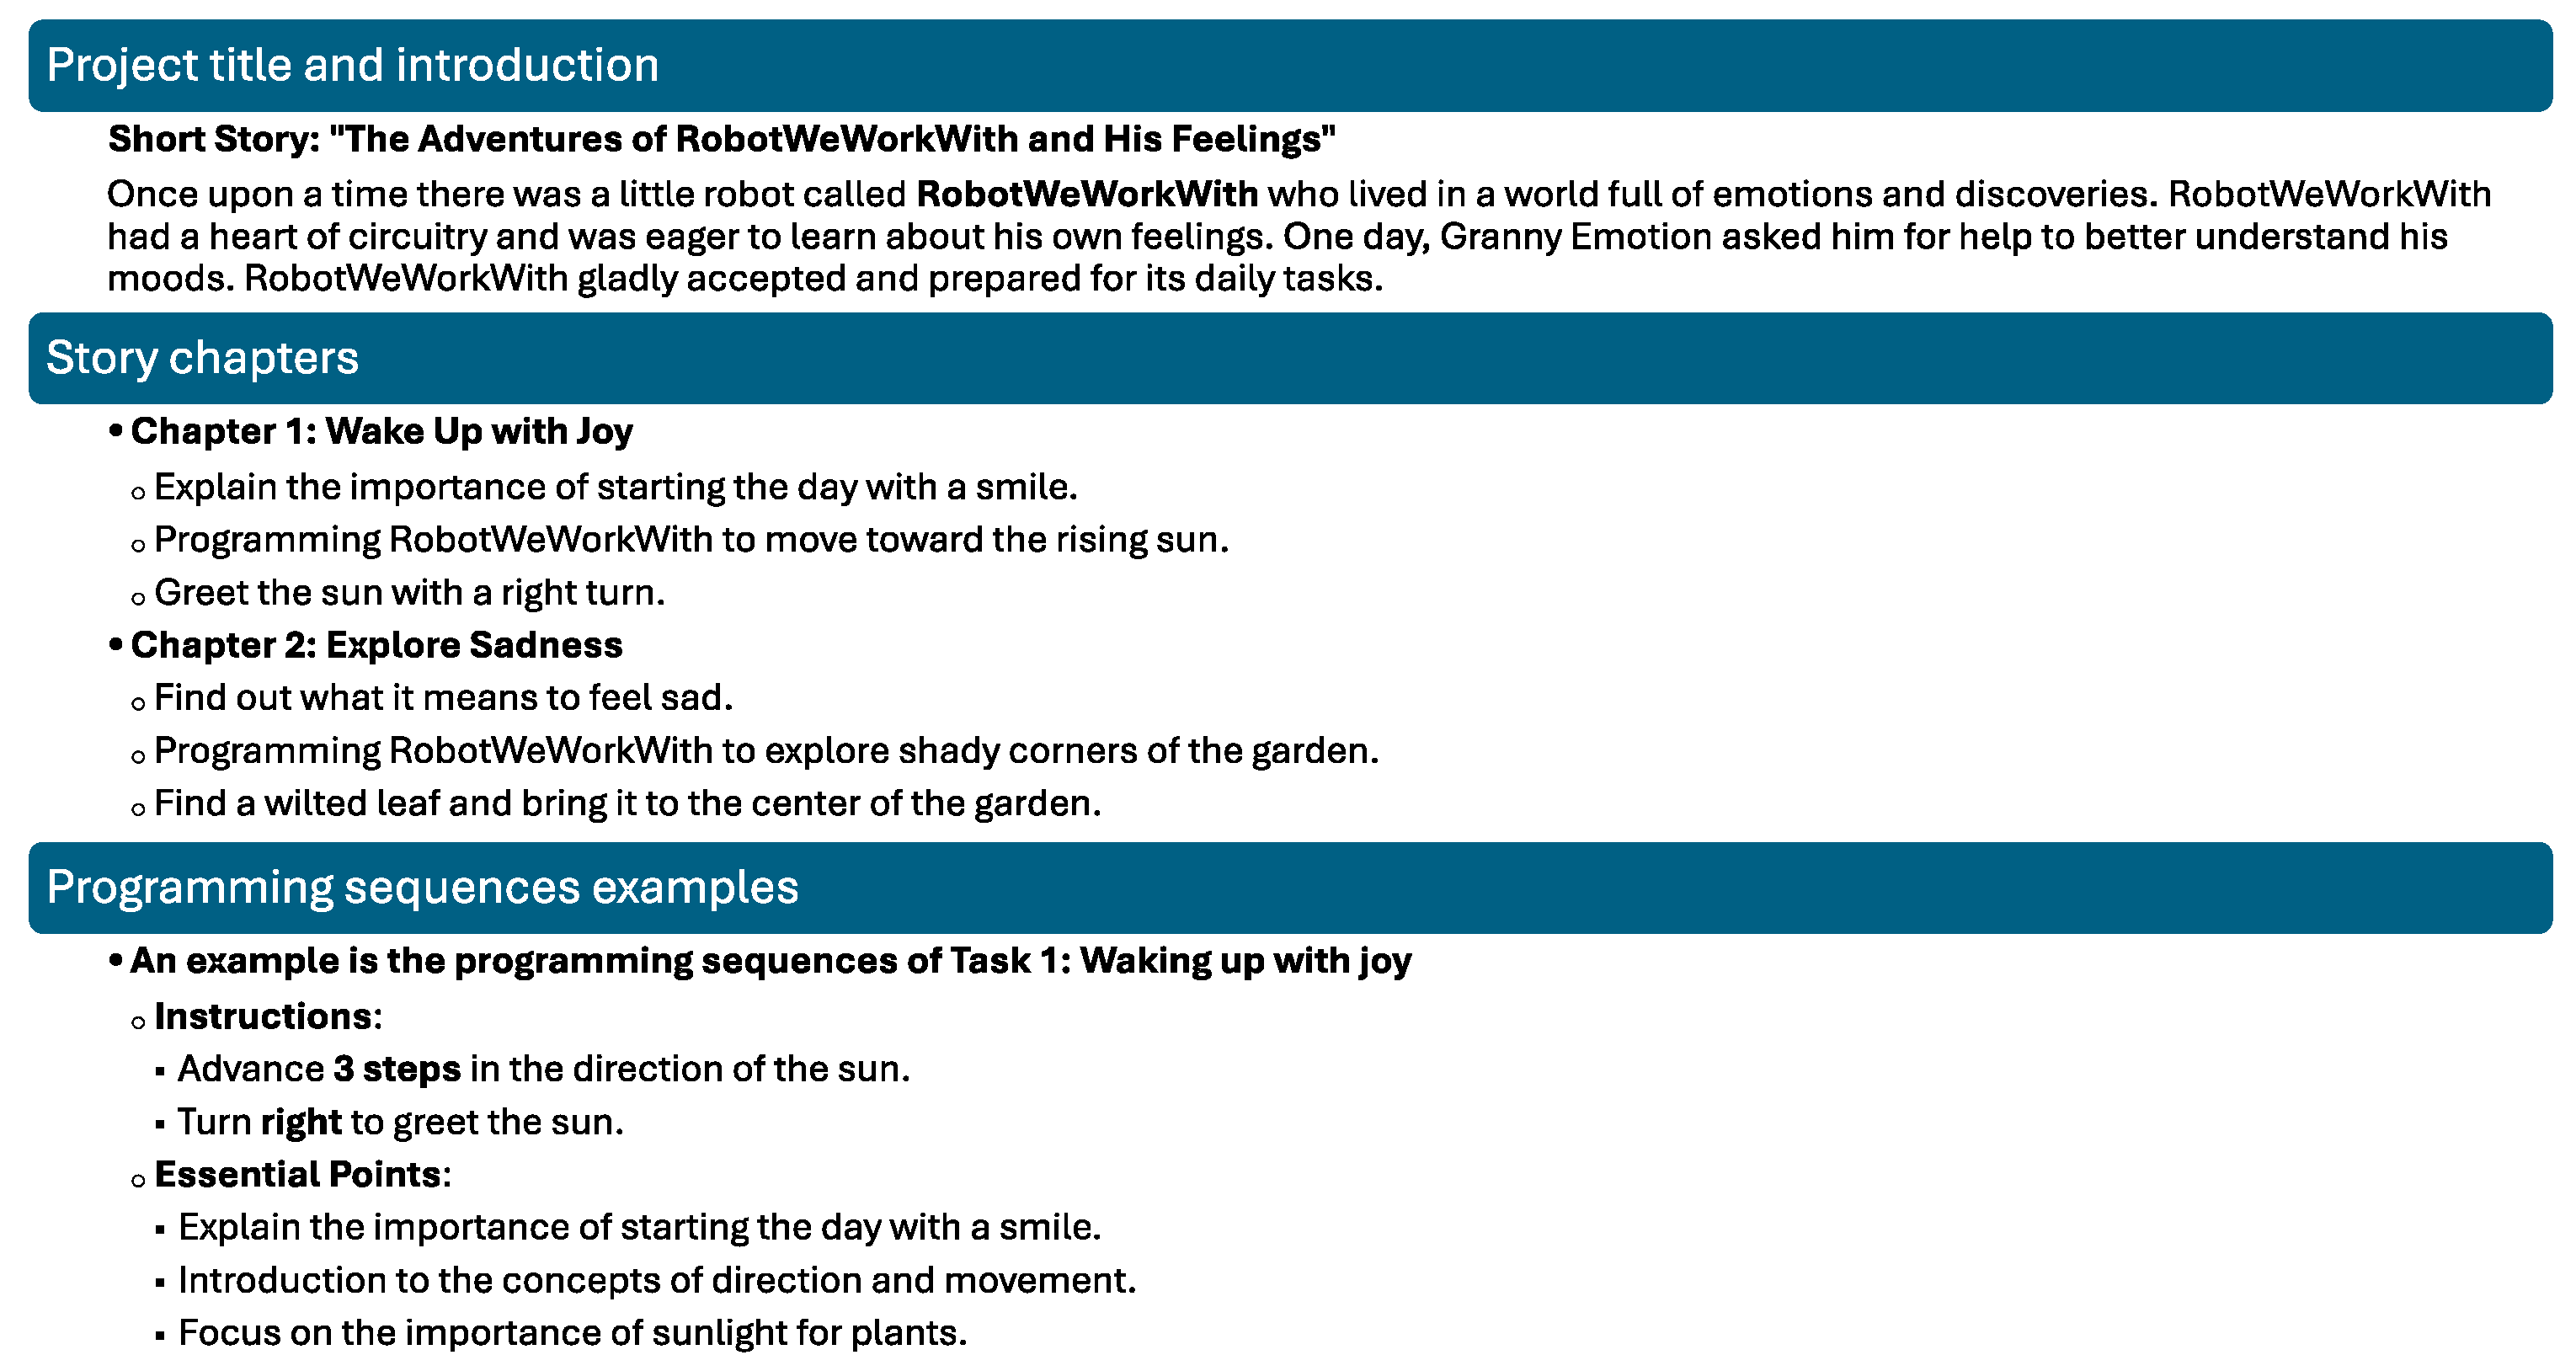
These assignments were based on an initial framework developed by the lecturers, which was then expanded and customized by AI to create diverse, engaging scenarios. Each group received a unique project, consisting of: firstly, a project title and introduction: A thematic framework setting the stage for robotics activities (e.g., “A Day of Sensations”, “The Daily Tasks of My Robot”, “Discovering the World of Food”). Following that, the story chapters: Multiple related stories designed to introduce specific programming concepts (e.g., sequential programming, loops, functions) within the context of daily activities familiar to 4–5-year-old children. Finally, programming sequences examples: Detailed examples of how to program the educational robots to perform specific tasks related to the story chapters.
Figure 4 illustrates an example of an assignment, consisting of the aforementioned three parts with an example provided for each.
2.4.3. Activity Planning Sheet
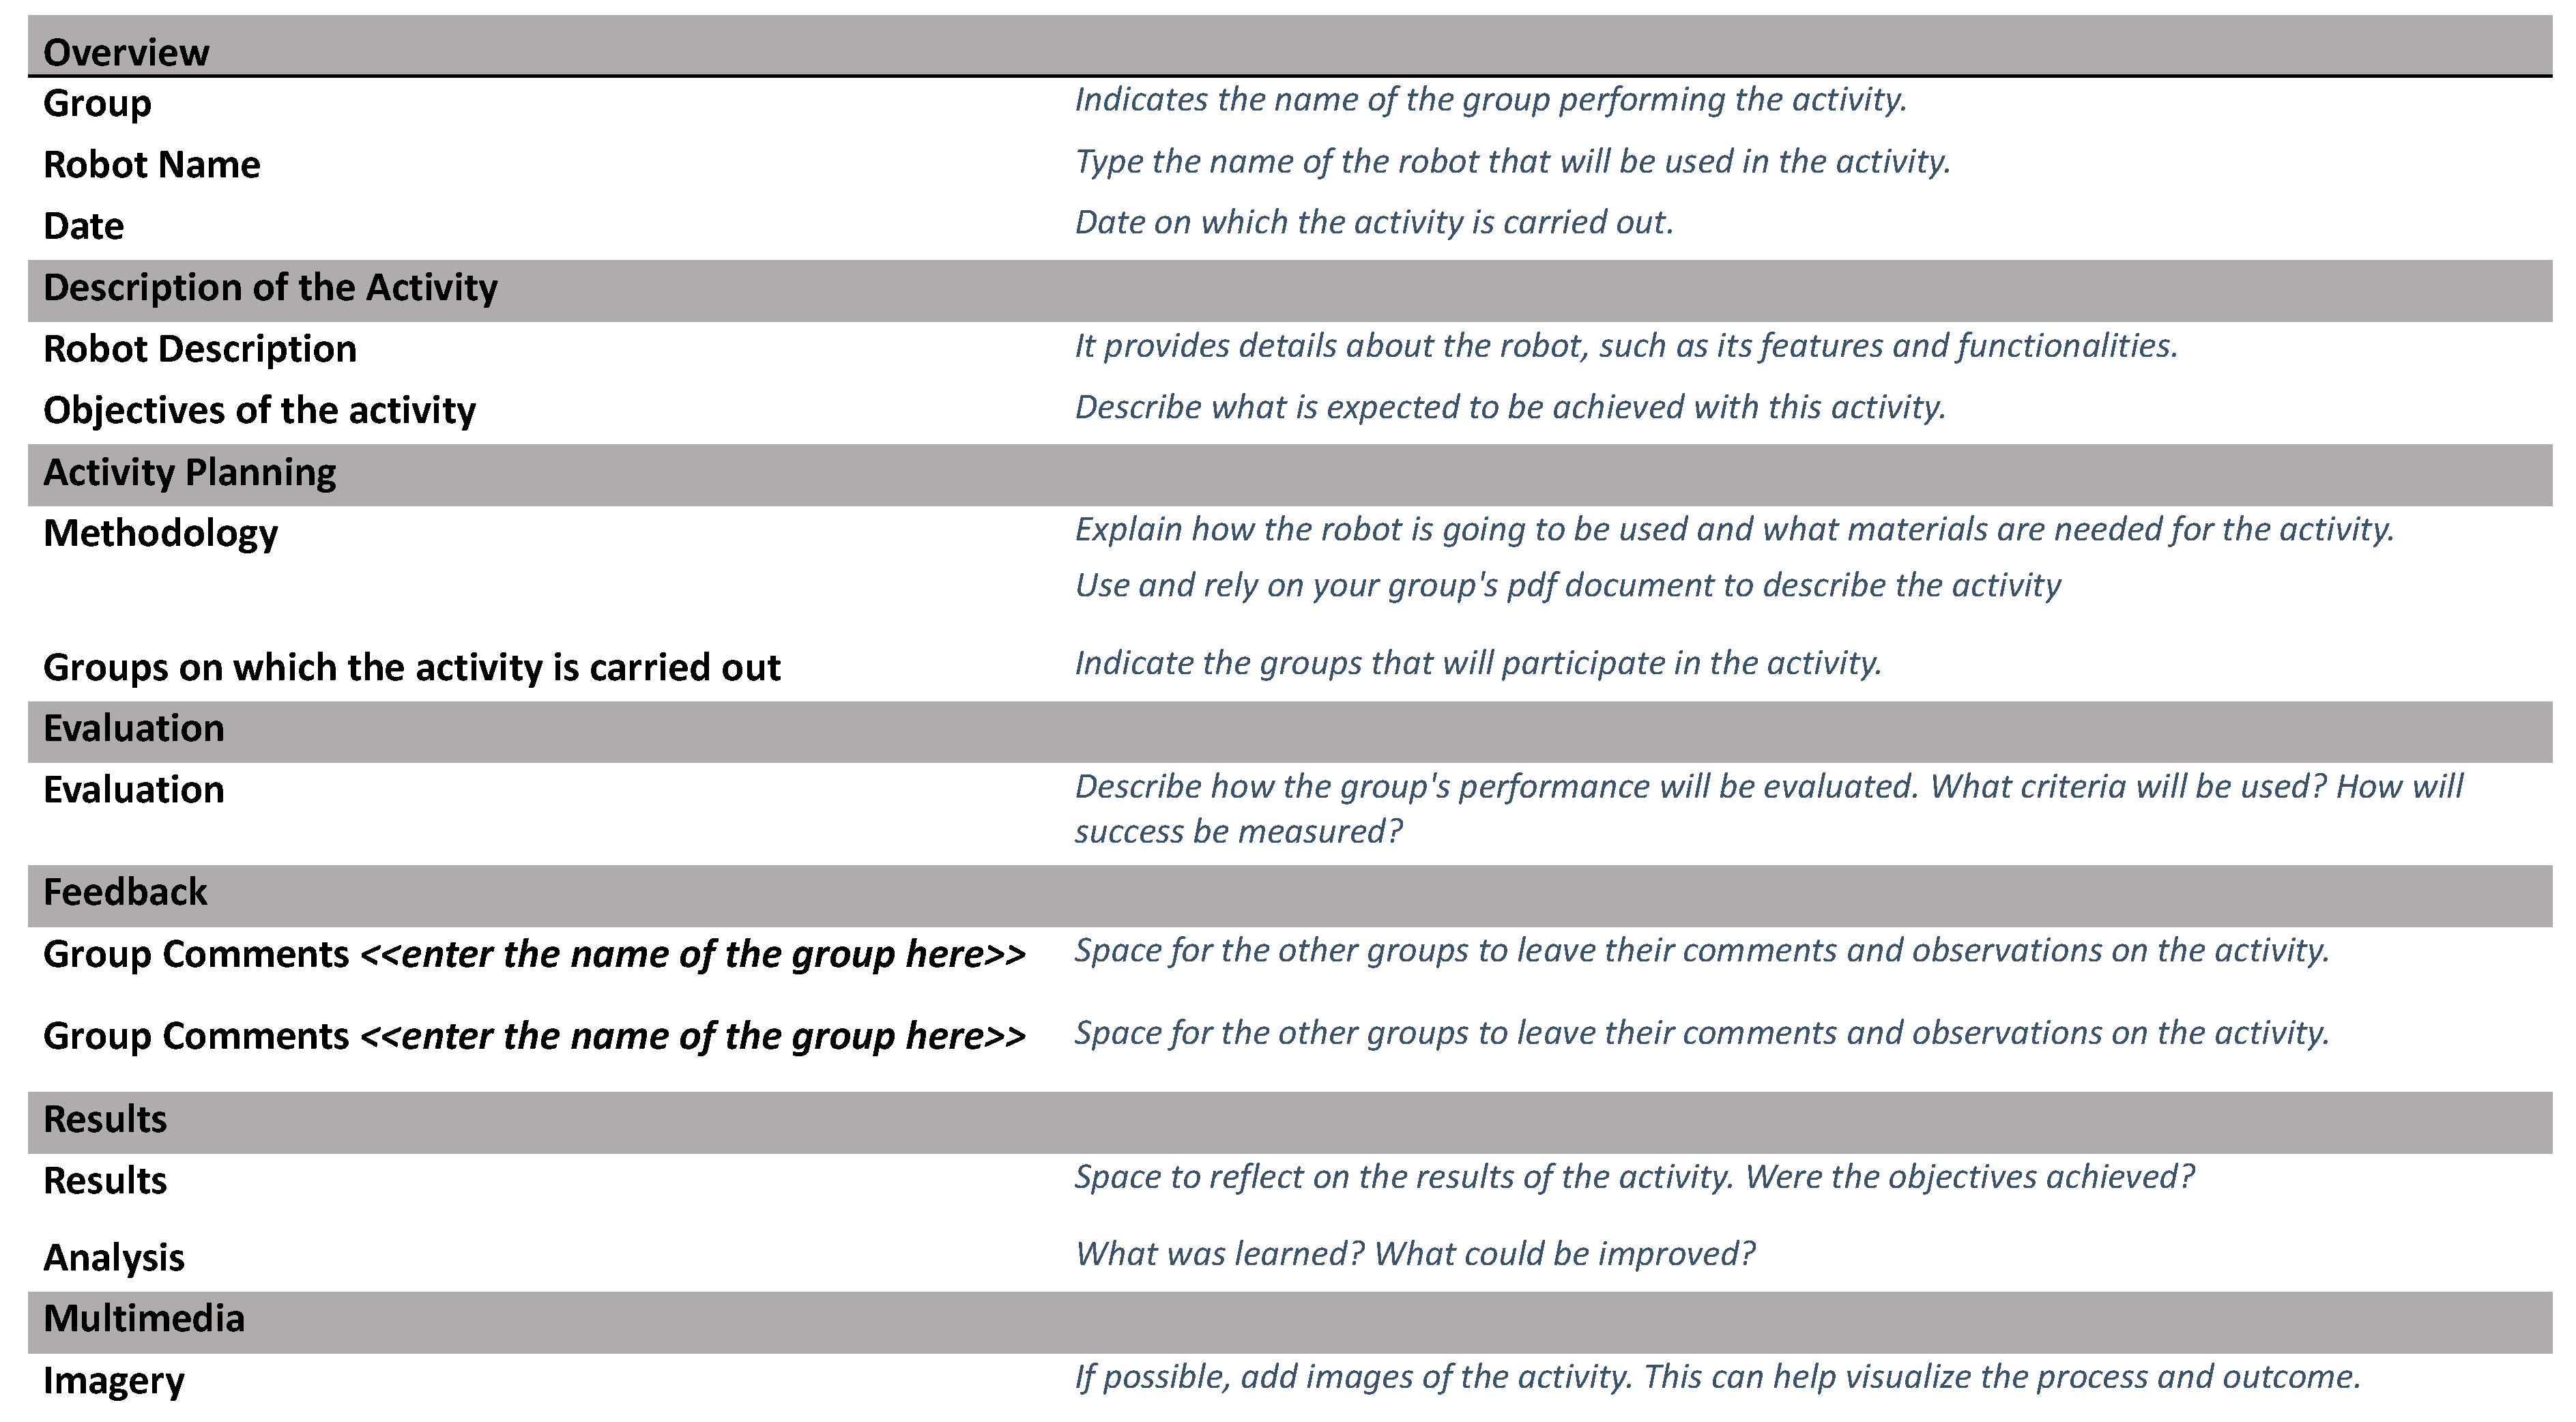
Preservice teachers were provided with a structured activity planning sheet that included: general information (group name, robot name and date), activity description (robot details and learning objectives), activity planning (methodology and target groups), evaluation criteria, feedback sections for peer review, results and analysis section and multimedia (a space to include pictures taken during the activity).
This sheet, which is presented in
Figure 5, served as a guide for preservice teachers to design, implement, and reflect on their robotics activities, ensuring a thorough and consistent approach across all groups.
2.4.4. Evaluation Rubrics
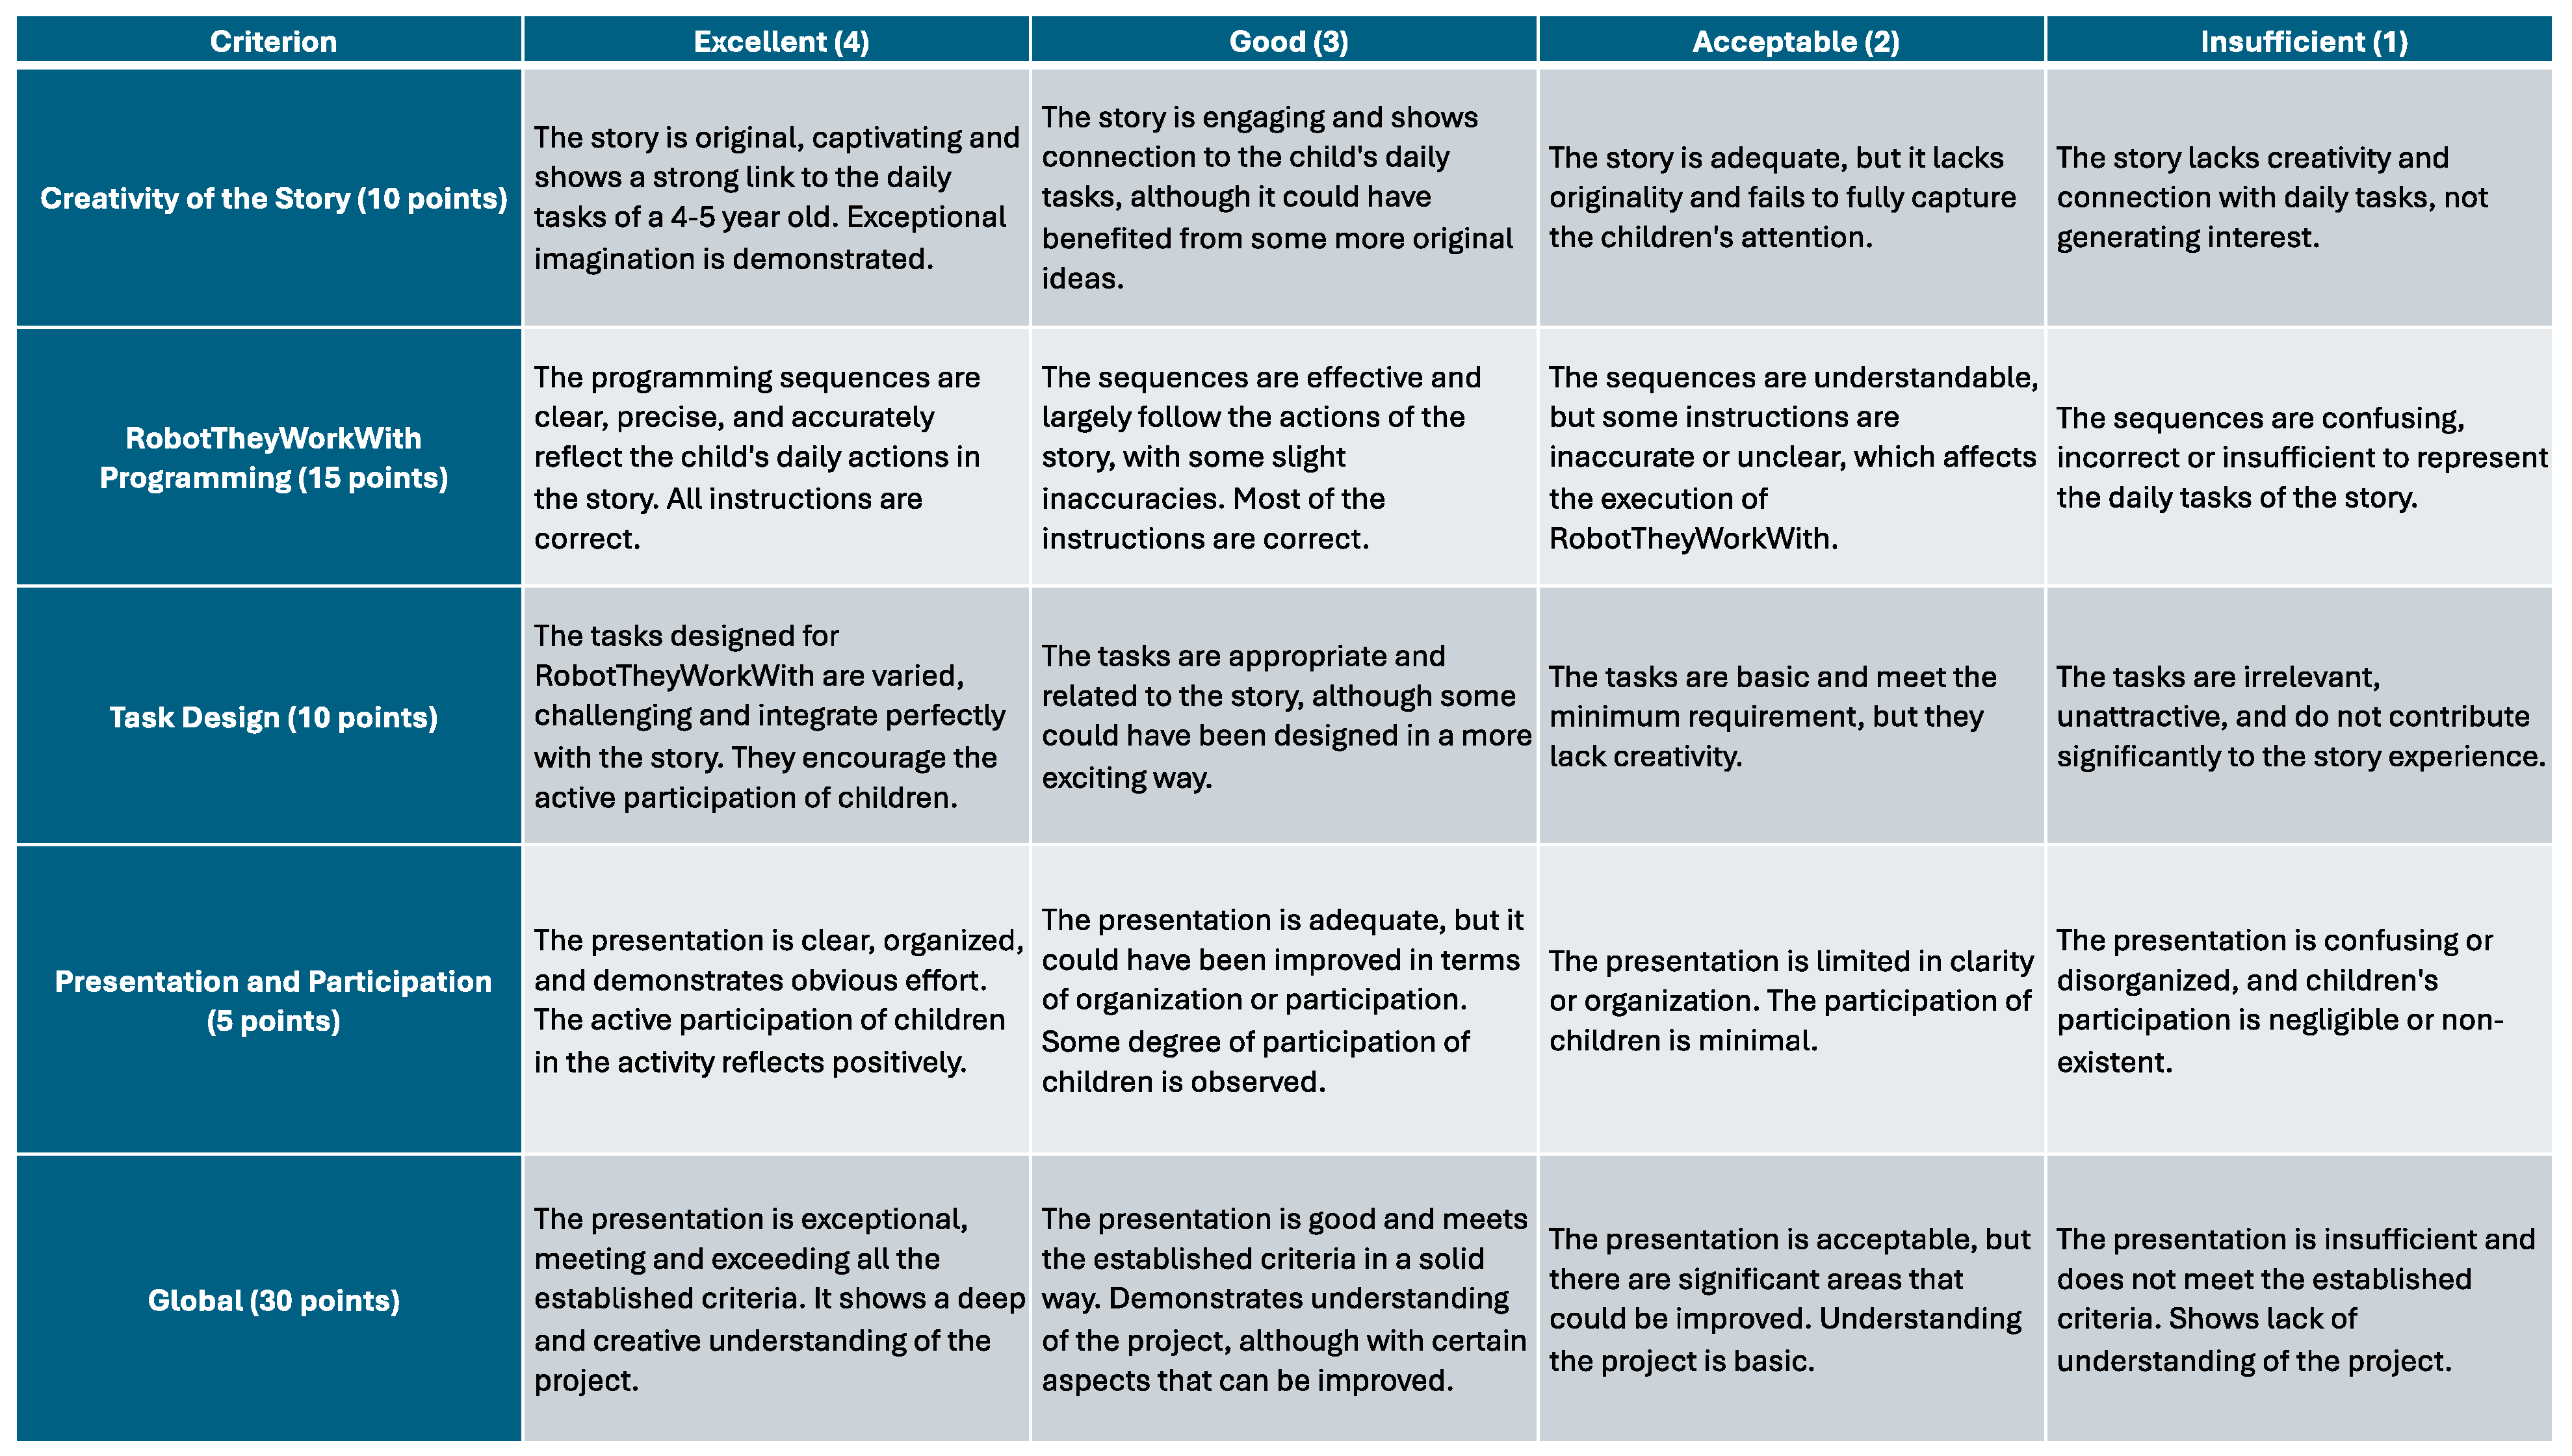
Comprehensive evaluation rubrics were developed to assess the quality of the activities designed by preservice teachers. These rubrics covered four main criteria: creativity of the story, robot programming, task design, and presentation and participation. These rubrics were designed for use by both instructors and peers, fostering critical thinking and self-reflection among preservice teachers. This dual-use approach not only facilitated thorough evaluation but also enhanced the learning experience by encouraging preservice teachers to critically analyze their peers’ work. In
Figure 6 we present the rubric developed.
All materials generated and used in this study, including the AI-generated assignments, activity planning sheets, and evaluation rubrics, are publicly accessible for reference and further research. These resources are available in both Spanish and English to facilitate broader use and replication of the study. The materials can be accessed at
https://hdl.handle.net/10115/39969.
2.5. Data Collection Tools
2.5.1. Early Childhood CT Test
In recent years, the importance of computational thinking (CT) as a foundational skill for young learners has gained significant attention. Recognizing the need to assess these skills in early childhood, Relkin, de Ruiter, and Bers (2020) [
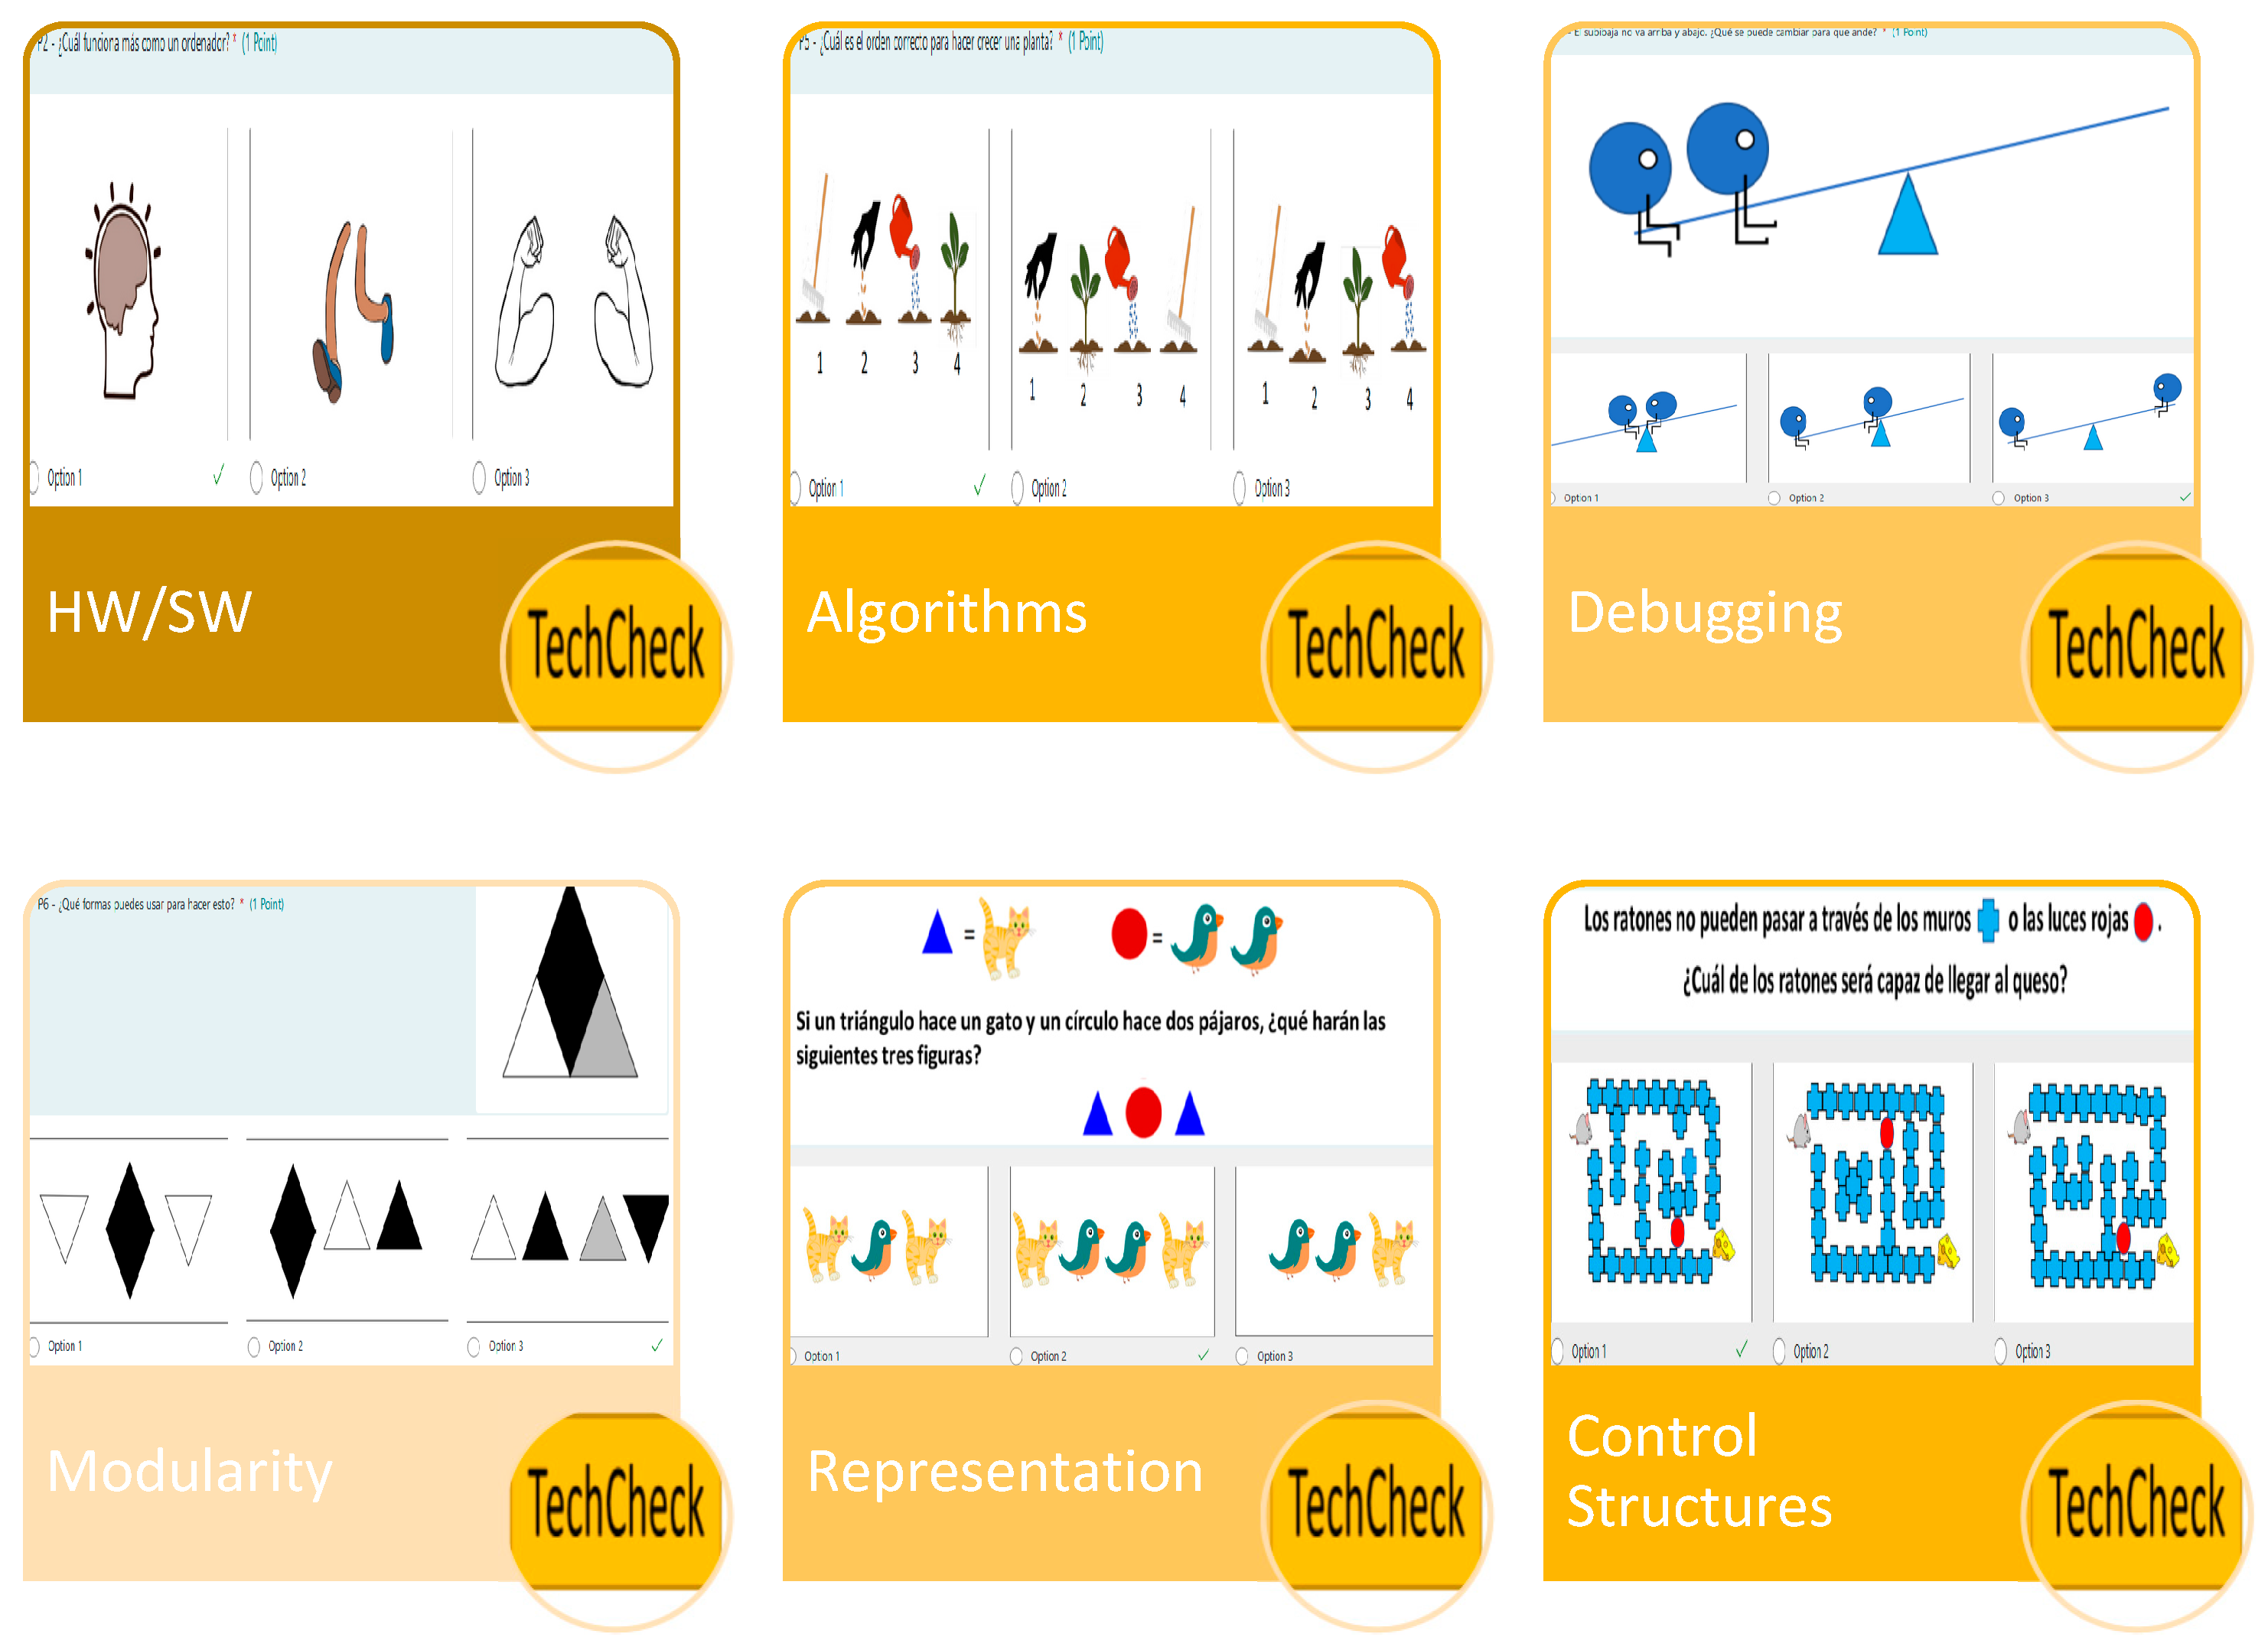
40] developed TechCheck, an unplugged assessment tool specifically designed to evaluate computational thinking in early childhood education. Their study, published in the Journal of Science Education and Technology, presents both the development process and validation of TechCheck, contributing to the growing body of research on how young children can develop CT skills without the use of digital technology. This research provides educators with an innovative method to gauge the computational thinking abilities of young learners, making it a valuable addition to early childhood education. In this paper the test has been offered to their preservice teachers for two main reasons, firstly to assess their CT skills, and secondly and more important, to show them a procedure to effectively evaluate their future students CT improvement based on specific tasks they may develop in their classroom. The TechCheck measures six computational thinking components (HW/SW, debugging, algorithms, modularity, representation and control structures). The test can be accessed here:
https://hdl.handle.net/10115/39969.
Figure 7 shows an example of the questions for each CT component evaluated.
2.5.2. Technology Acceptance Model Test
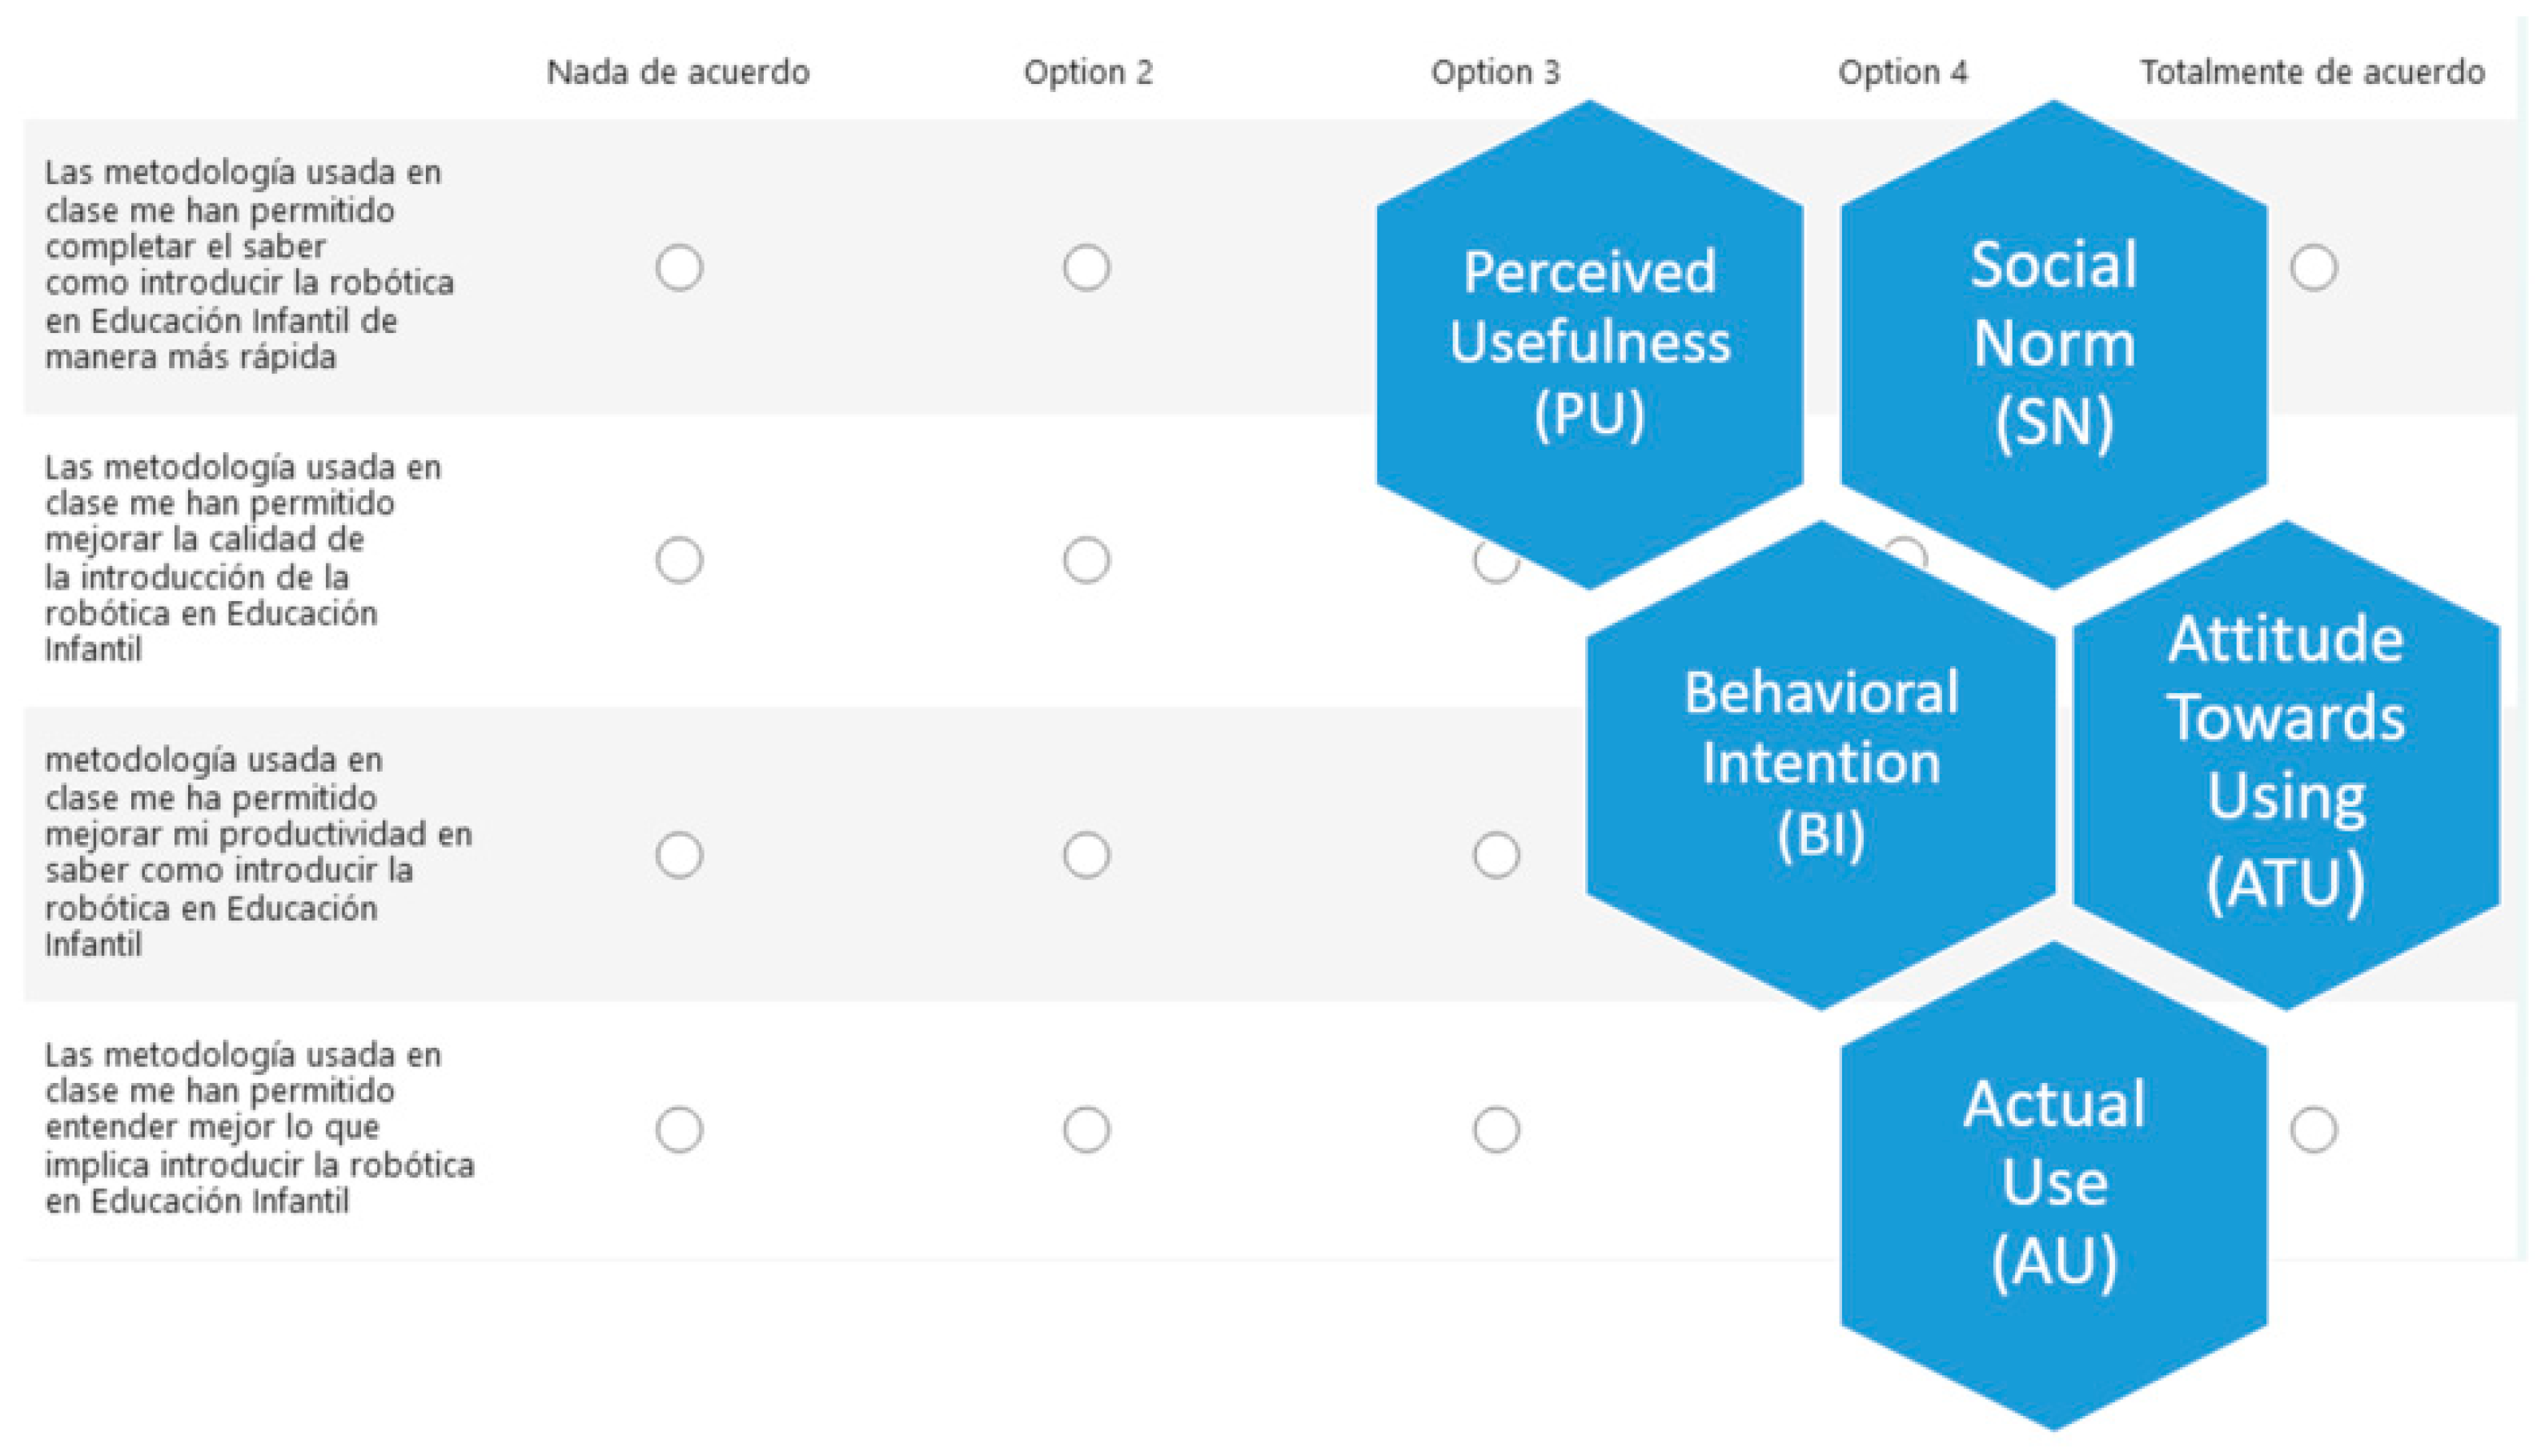
The Technology Acceptance Model (TAM) is a well-recognized framework for analyzing how individuals adopt and use technology, particularly in educational contexts. Originally developed to explain user acceptance of technology based on two main variables—Perceived Usefulness (PU) and Perceived Ease of Use (PEOU)—the model has since evolved to assess broader dimensions of user behavior. In this study, we focus specifically on five key dimensions of TAM: Perceived Usefulness (PU), Social Norm (SN), Behavioral Intention (BI), Attitude Towards Using (ATT), and Actual Use (AU). These dimensions allow for a comprehensive understanding of the factors driving technology adoption and usage among educators.
Perceived Usefulness (PU) refers to the extent to which users believe that a technology will enhance their teaching performance, which is essential in determining their acceptance of educational tools. Social Norm (SN) captures the influence of societal and peer expectations on teachers’ willingness to adopt new technologies, highlighting how external pressures can shape attitudes toward technology use. Behavioral Intention (BI) measures an individual’s intent to use a specific technology, often shaped by positive attitudes and external influences. Attitude Towards Using (ATT) reflects the overall affective response to adopting a technology, including both emotional and cognitive evaluations. Finally, Actual Use (AU) refers to the real-world integration and usage of the technology in educational settings.
In the context of early childhood and elementary education, TAM is particularly useful for assessing how preservice teachers view the integration of robotics into their teaching practices. Robotics offers interactive and hands-on methods for teaching subjects like science, math, and computational thinking. By applying TAM, researchers can gauge whether educators perceive these technologies as beneficial for improving learning outcomes and whether they feel external expectations or social norms drive their adoption of such tools. Previous studies have demonstrated the utility of TAM in exploring educators’ acceptance of robotics. For instance, research has shown that preservice teachers are willing to adopt floor-robots as educational tools when they perceive them as effective in enhancing student learning [
25]. Similarly, attitudes towards socially assistive robots among preschool and elementary teachers have been influenced by perceived usefulness and social expectations, further highlighting the role of these TAM dimensions [
26].
This refined version of TAM, focusing on PU, SN, BI, ATU, and AU, provides a robust framework for understanding the key factors that promote or hinder the adoption of robotics and other technologies in educational environments. Through the use of multi-item Likert-scale questionnaires, researchers can systematically measure these dimensions and assess the impact of technology on educational practices. By focusing on these variables, this study aims to offer insights into the conditions that foster the successful integration of robotics and other technologies into early childhood and elementary education. Each dimension is typically measured using a multi-item Likert-scale questionnaire, like in
Figure 8 here the sample questions and dimensions measured are represented. The test can be accessed here:
https://hdl.handle.net/10115/39969.
2.5.3. Robots’ Knowledge Test
Assessing preservice teachers’ learning and mastery of educational robotics is critical for understanding how effectively these technologies can be integrated into early childhood classrooms. Robotics has been shown to offer numerous benefits, such as fostering children’s problem-solving skills, creativity, and foundational STEM knowledge [
27]. However, the successful implementation of robotics depends largely on the preparedness and competence of teachers, who often lack sufficient experience with these tools [
26,
29]. Evaluating preservice teachers’ experiences with various educational robots—such as the five key robots they have used in this experience (Cubetto, Matatalab, Micro:bit, Makey Makey and Scratch Jr.)—helps identify gaps in knowledge, instructional challenges, and areas where further training is required [
25,
28]. This assessment ensures that future educators are equipped to integrate robotics confidently, enhancing the potential for meaningful, technology-enhanced learning experiences for young students.
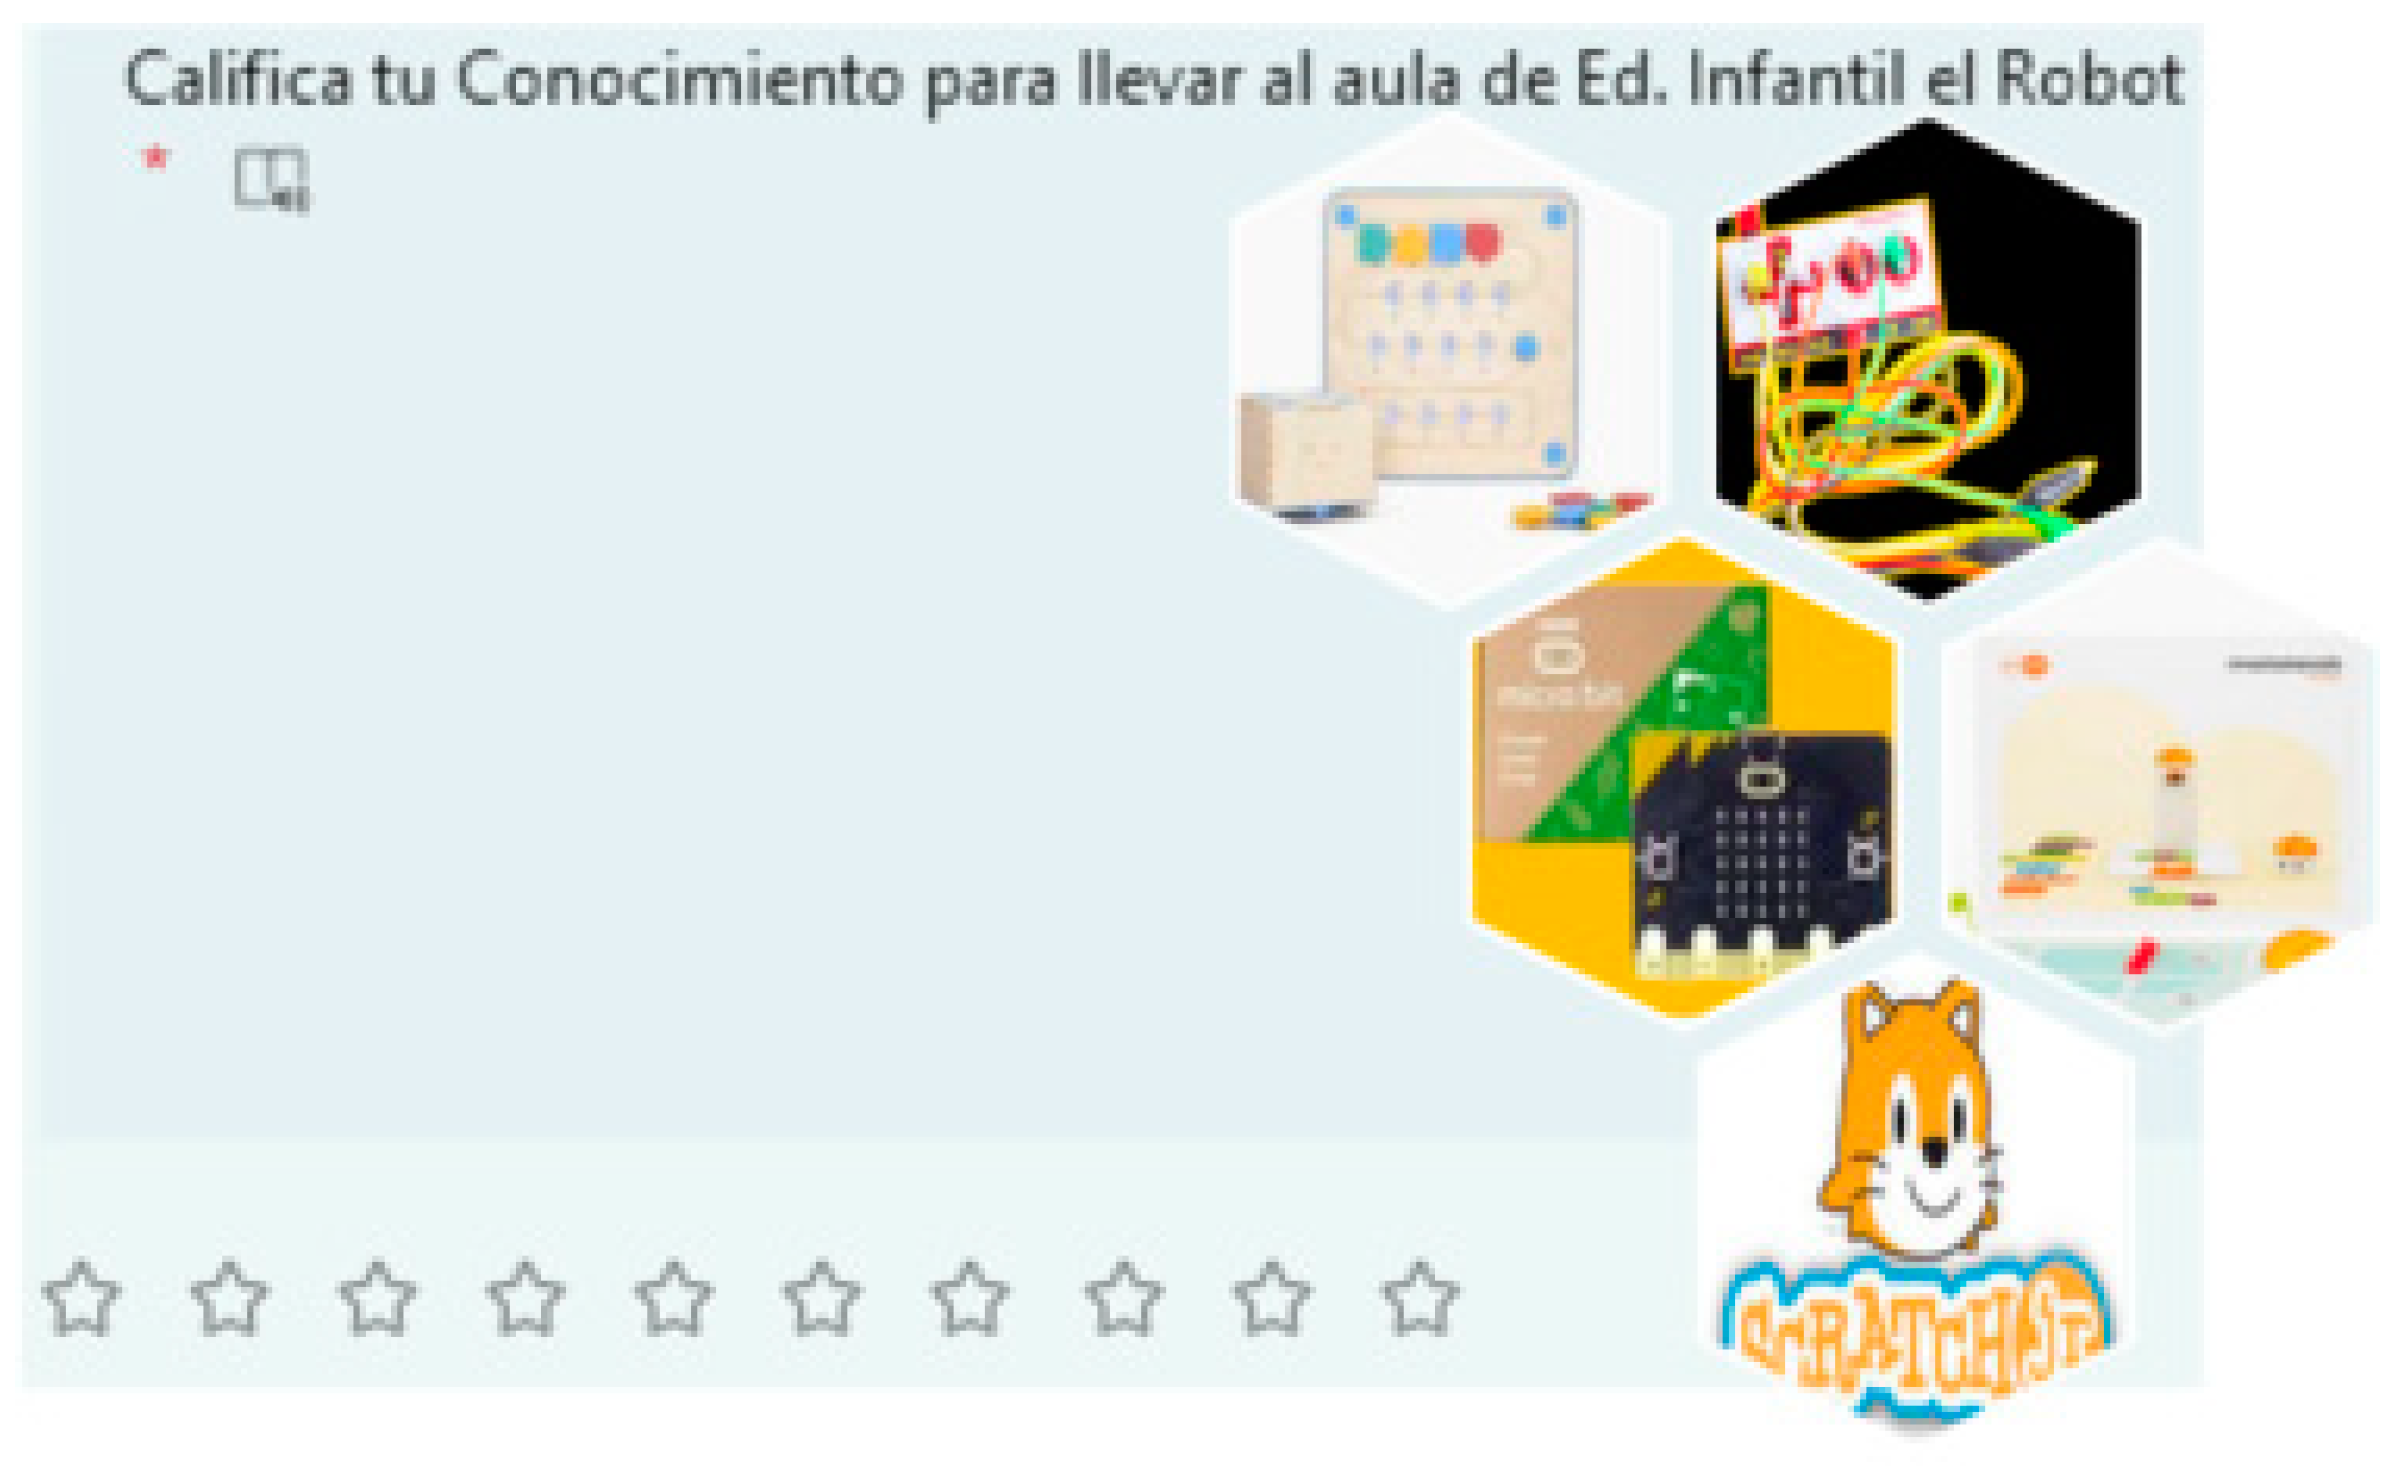
Figure 9 shows a representation of the ‘Robots knowledge Test’ the preservice teachers took after the assessment. It was a 10-point Likert scale with stars (also to offer them the tools to take this test to their future students) to rate their self-knowledge to teach their future students with that specific robot (
Figure 9).
2.6. Variables
Early Childhood CT Test : learning outcomes as determined by a validated CT questionnaire are related to the dependent variables of the pre- and post-test in control and experimental group. The pre- and post-test variables are rescaled from 0 to 10 for purposes of simplicity. First with a variable with the total score and later, the experiment’s several computational concepts—HW/SW, debugging, algorithms, modularity, representation, and control structures—are associated with six dependent variables.
Technology Acceptance Model Test: Technology acceptance is measured using 5 Likert-type variables scaled from 1 (do not agree at all) to 5 (completely agree), named PU, SN, BI, ATU and AU. There is only a post-test measure.
Robots’ knowledge Test: Knowledge about 5 different robots (Cubetto, Matatalab, Micro:bit, Makey Makey and Scratch Jr) is measured in both the pre-test and post-test for the control group and the experimental group. Likert-type variables scaled from 1 to 10 are used.
Two factors, Group and Test, are considered as independent variables. The first is related to whether or not the participant belongs to the control or experimental group and the second is related to the moment of the test, before or after the intervention.
These variables are listed in the same order in
Table 1.
2.7. Validity and Reliabililty
IBM SPSS Statistics Version 29 was used for the entire statistical analysis. Cronbach’s alpha, which measures the internal consistency of the first questionnaire in both the pre- and post-test, yielded a value of 0.313, which is considered unacceptable. This result was expected since the questionnaire was used on this experimental design to provide educators with an innovative method for assessing young learners’ computational thinking abilities. It offers them a procedure to effectively evaluate students’ improvement in CT based on specific classroom tasks. However, as demonstrated, it is not suitable for administration to students teachers (adults). This value did not improve when any items were removed. In contrast, the second and third questionnaires produced Cronbach’s alpha values of 0.910 and 0.901, respectively, which indicate excellent internal consistency.
3. Results
In this section the most relevant results of the tests carried out by the subjects are presented.
3.1. Early Childhood Computational Thinking Test
Table 2 shows the most relevant centralization, dispersion and positional descriptive statistics for the overall score on the computational thinking test.
As can be seen in
Table 2, pre-test and post-test scores are very similar in the control and experimental groups, with the mean in the post-test being slightly higher than in the pre-test. In addition, as can be seen in
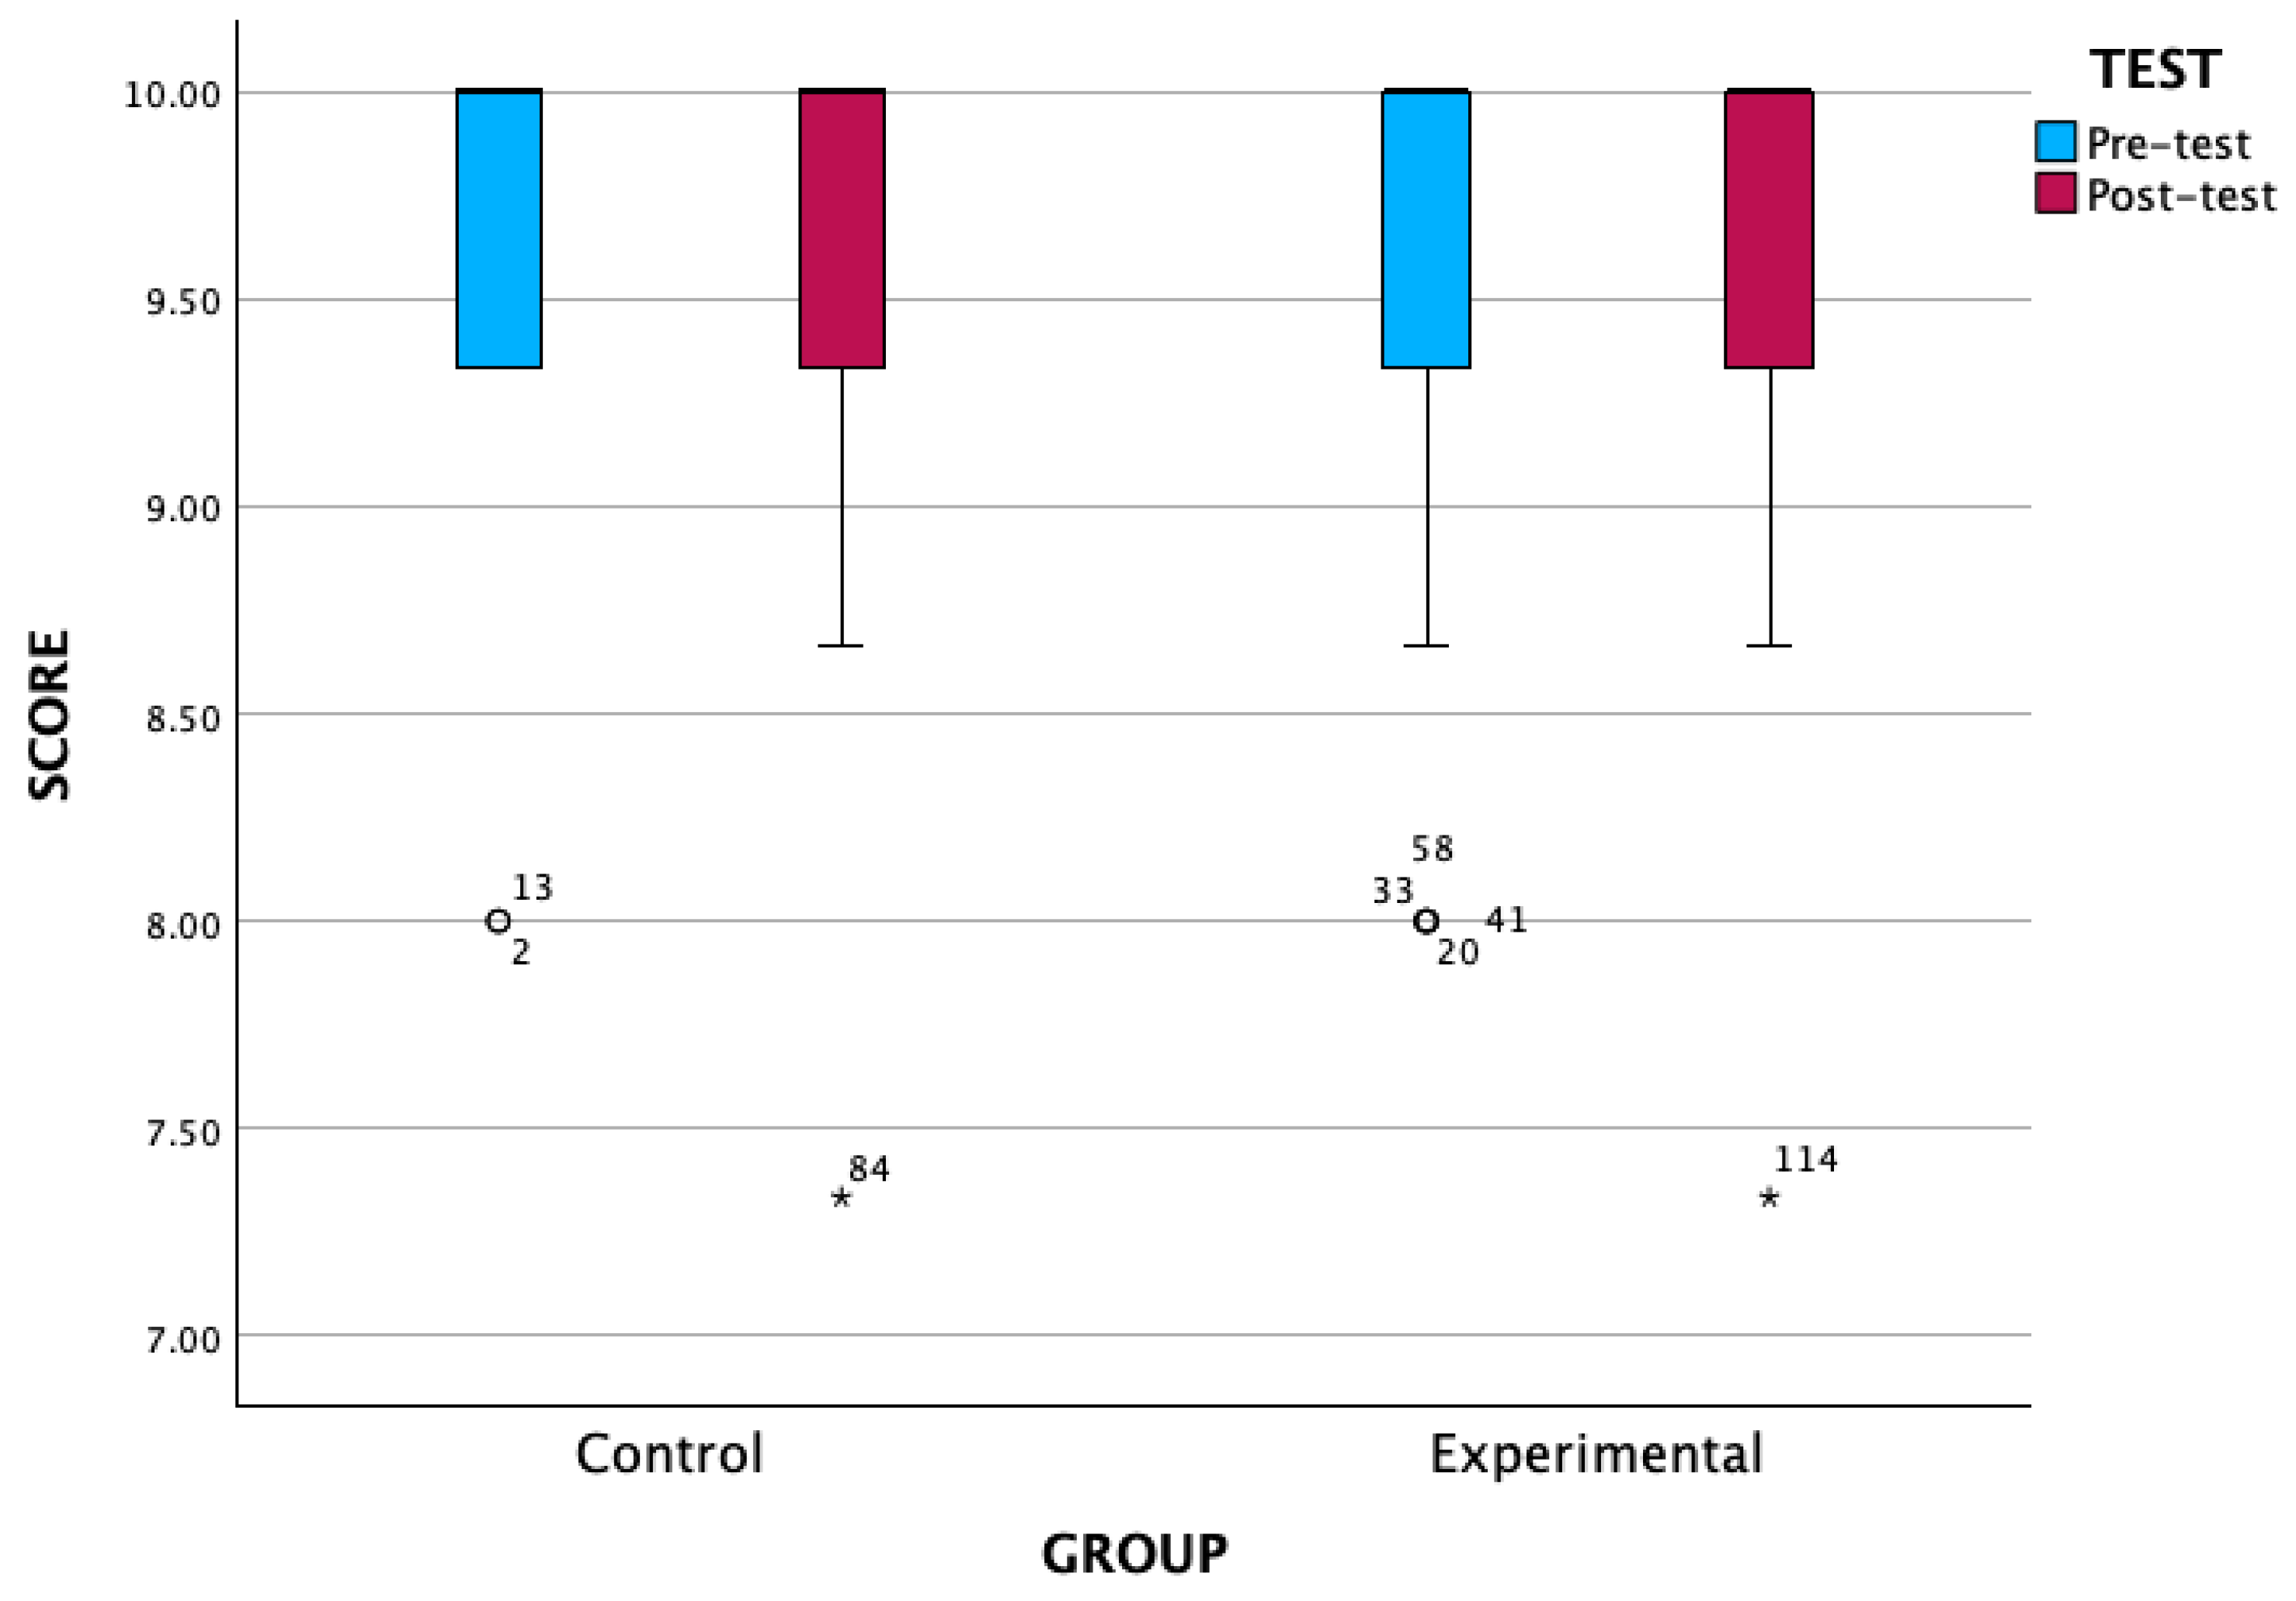
Figure 10, 50% of the central data lie between values close to 9.3 and 10. There are outliers in both groups, with participants scoring low, but in no case below 7.
Table 3 shows, using the Wilcoxon signed ranks test for related samples, that indeed the differences between pre- and post-tests are not significant (p>0.05) for both the control and experimental groups.
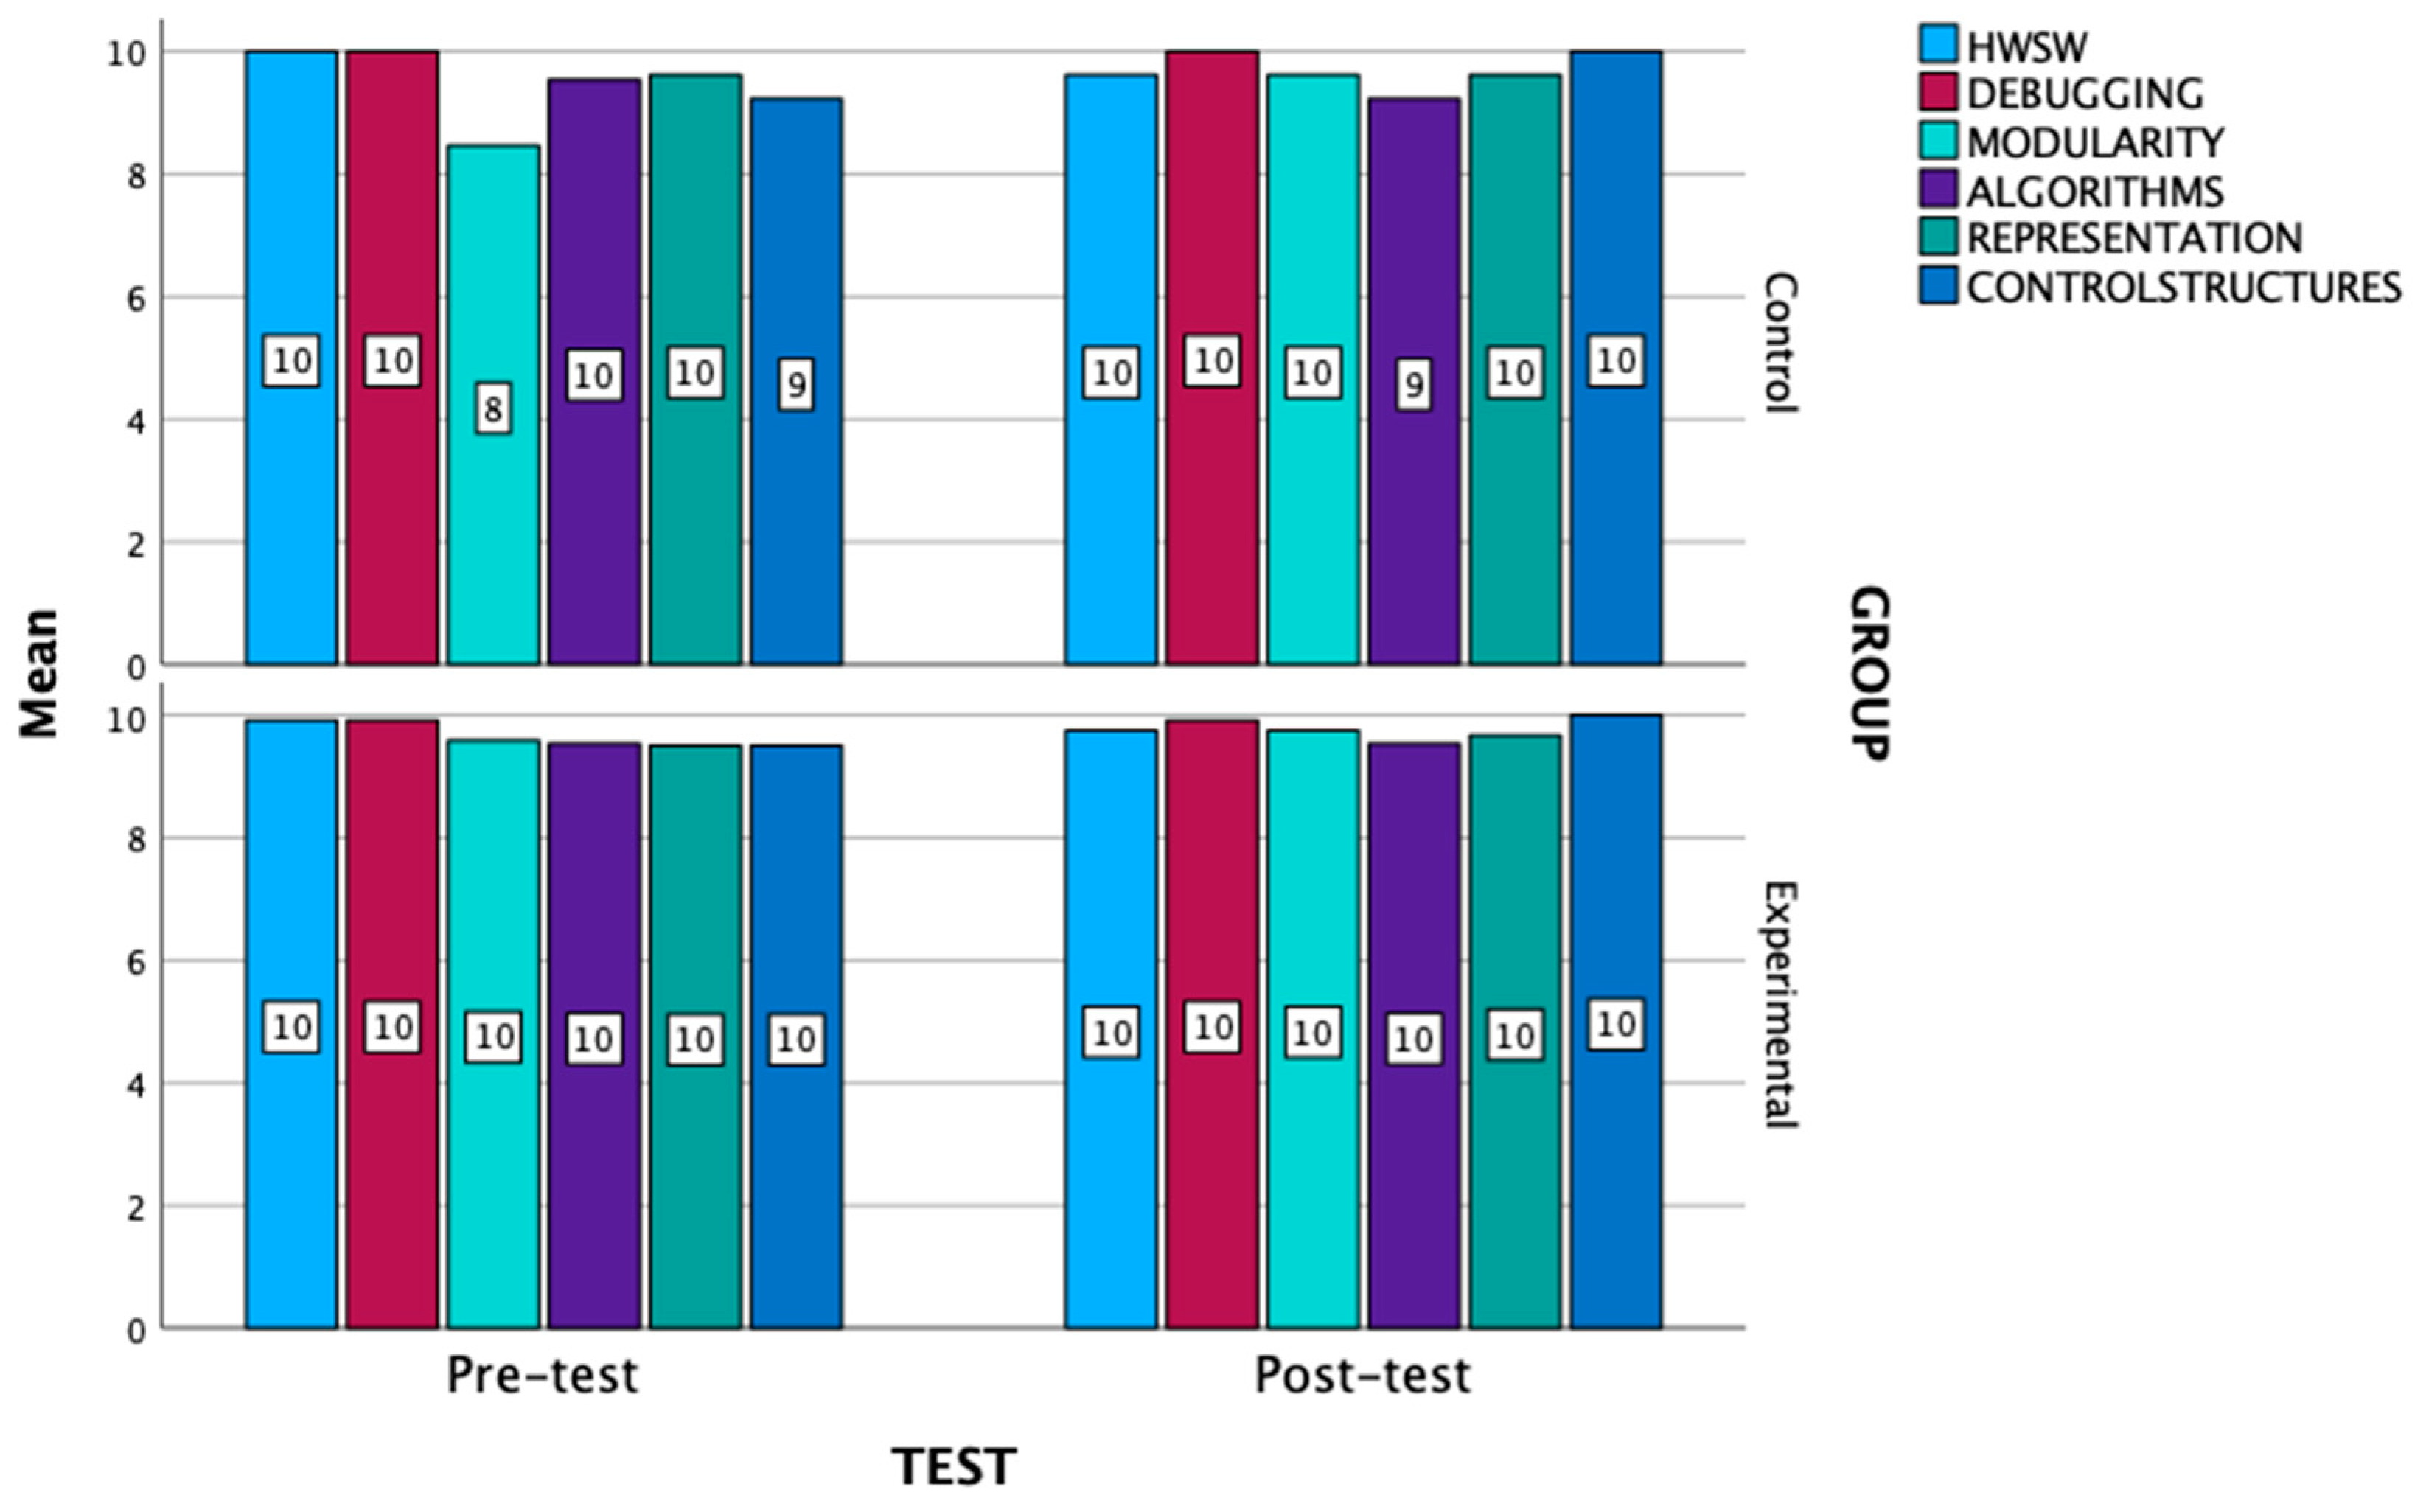
The focus now is on the differences between each of the dimensions under investigation in this test. The following graph shows the mean of each of these, as a representative of the central tendency of the data. As can be seen in
Figure 11, in the experimental group and in the control group the scores start from very high values, the maximum values being in the experimental group. Thus, in this experimental group there are no changes in the post-test. The scores increase slightly in the post-test of the control group in Modularity and Control structures and decrease in Algorithms. Likewise, these changes on average are not statistically significant, being extremely high in practically all cases.
3.2. Technology Acceptance Model Test
A study of this likert scale test from 1 to 5 is presented. This test was carried out at the end of the intervention, so it has been called directly post-test. The most relevant results of this test for both the experimental and control groups are presented below.
First,
Table 4 shows the most relevant descriptive. As this is an ordinal categorical variable, the median is shown instead of the mean, as this is considered more relevant. As can be seen in both
Table 4 and
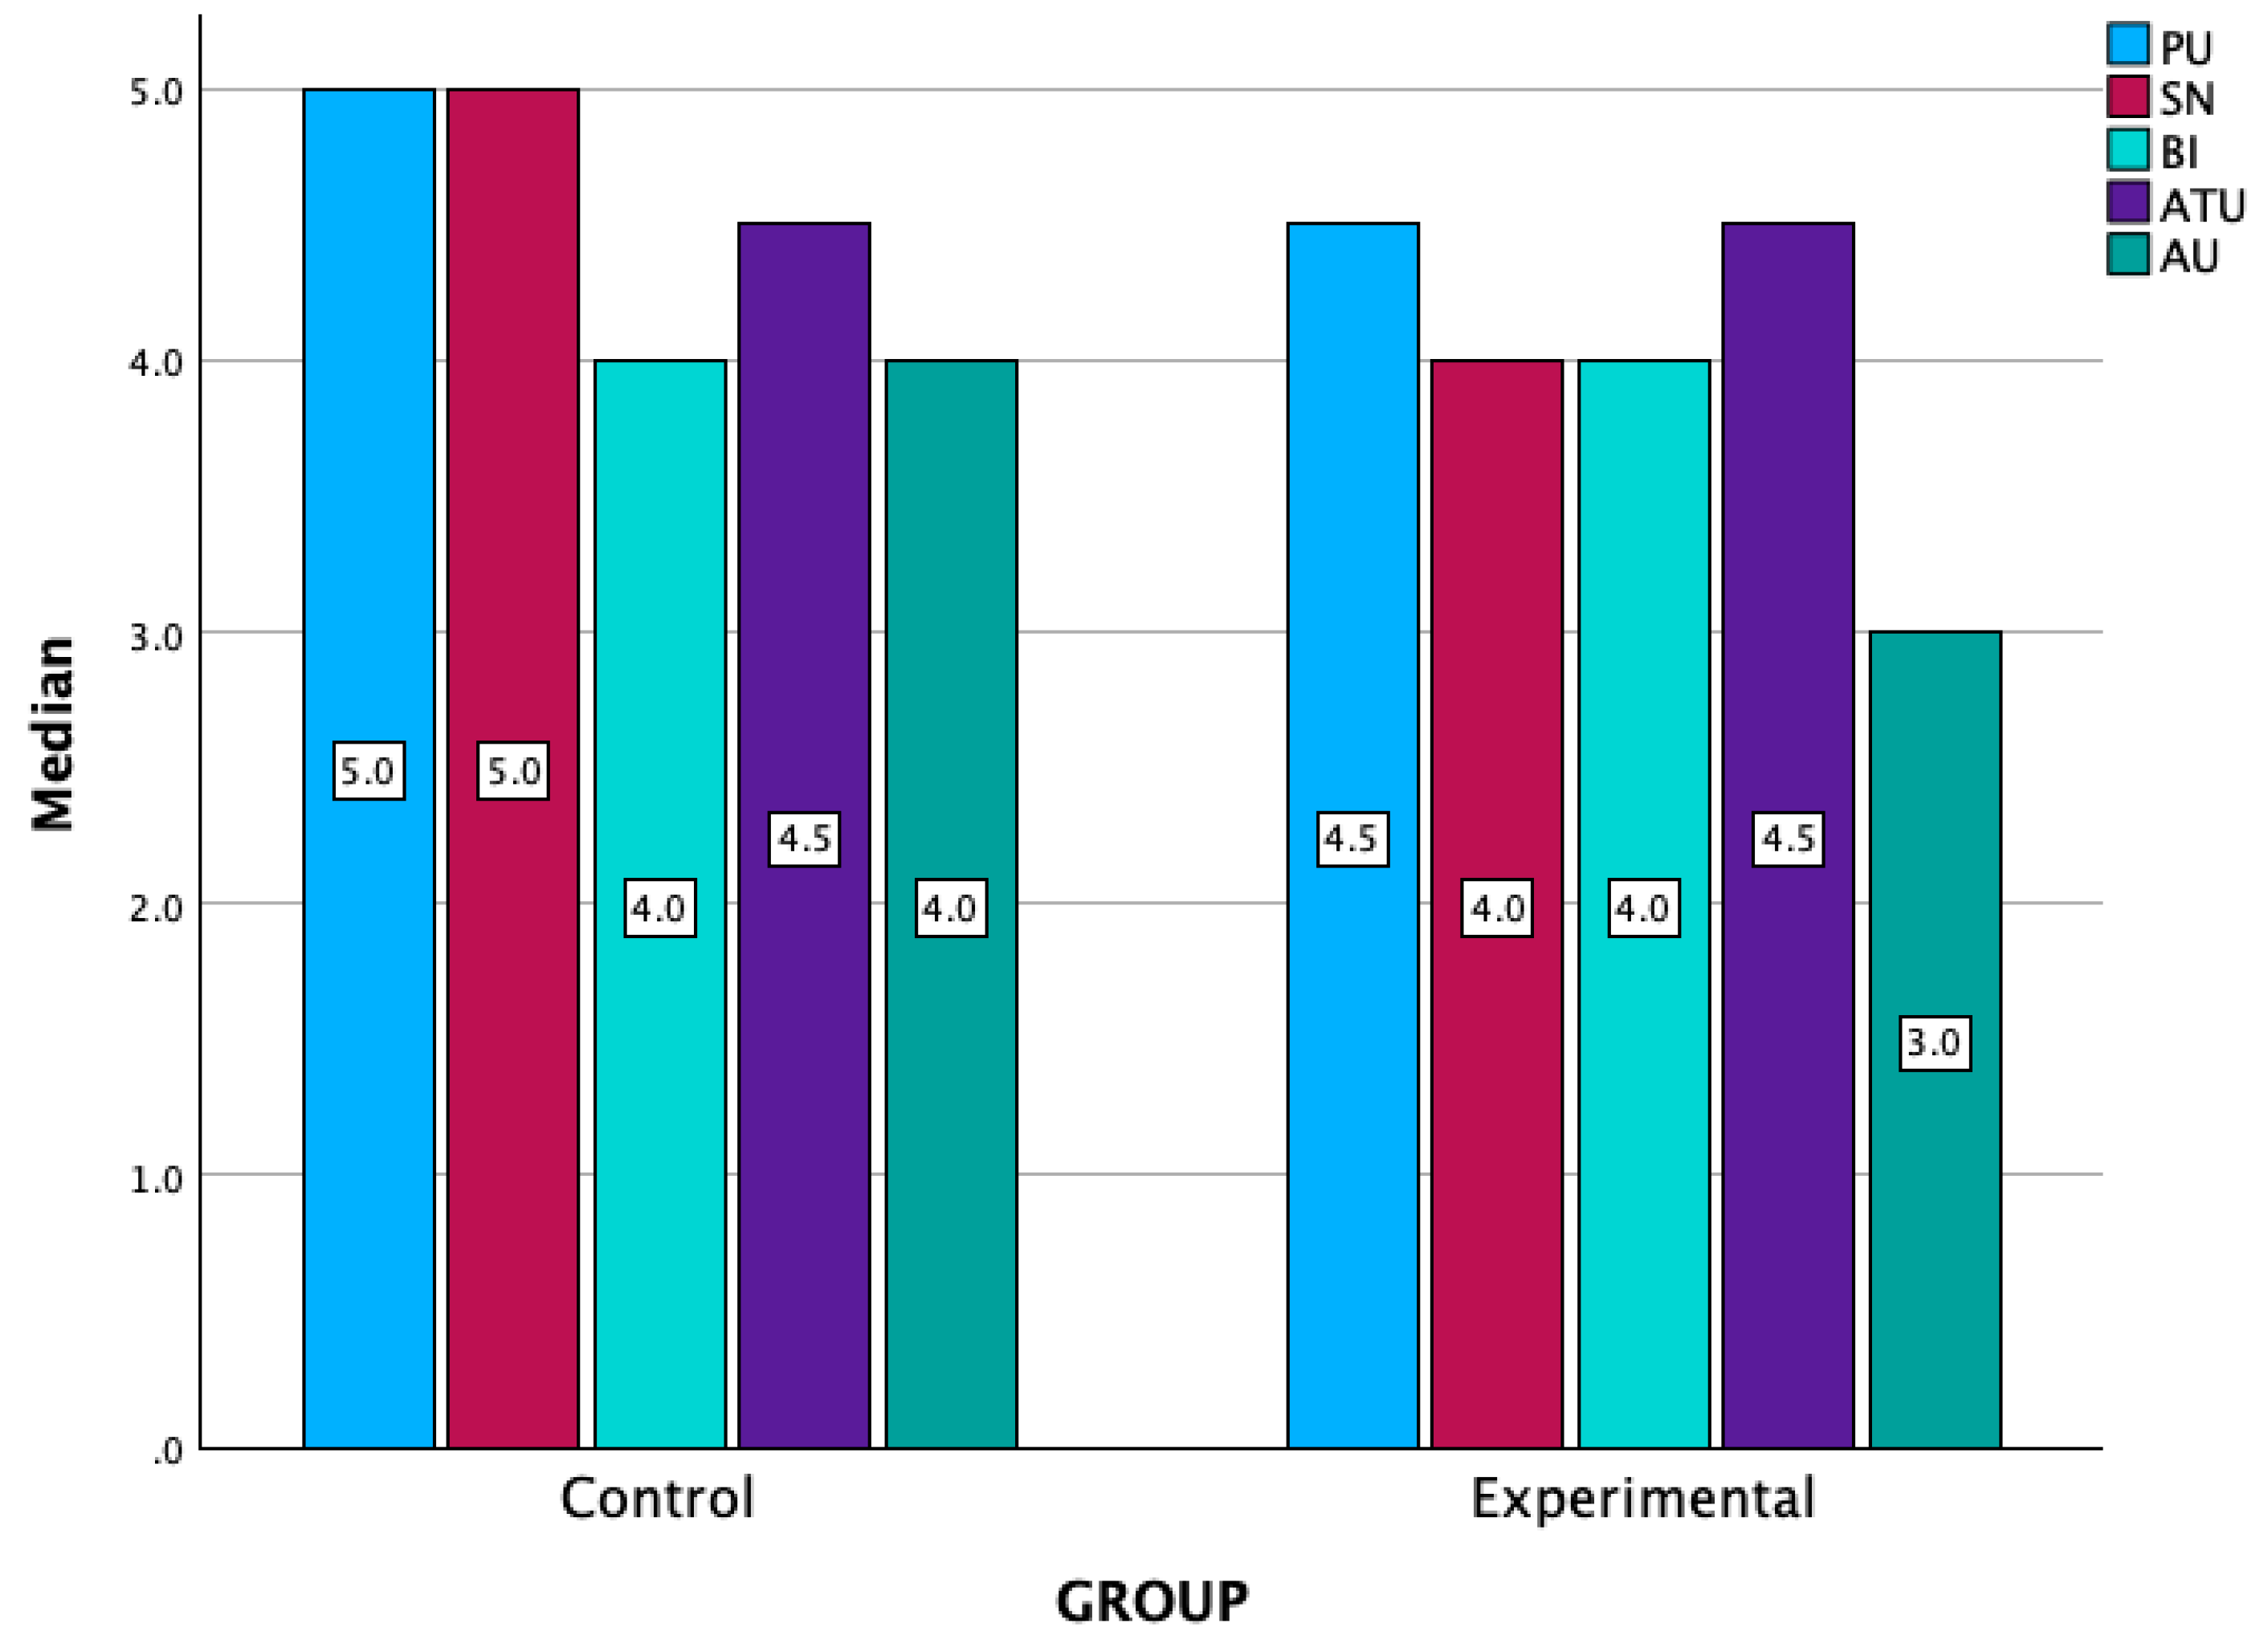
Figure 12, the median values, as well as the minimum values, are slightly lower in the experimental group than in the control group, where the number of subjects is much smaller. However, the dispersion is similar in both groups. The same applies to the maximum values, which are 5 in both groups.
This difference between the two groups, as can be seen in
Table 5, is not statistically significant in any case, except for the AU variable, with a p-value of 0.045, which could be considered a minor but statistically significant difference.
3.3. Robots’ Knowledge Test
A study of this likert scale test from 1 to 10 is presented. For this purpose, the most representative statistics for the control group and the experimental group for both the pre-test and the post-test are presented. Subsequently, for both control and experimental groups, the possible improvement between pre-test and post-test of each of the variables is studied separately.
As can be seen in
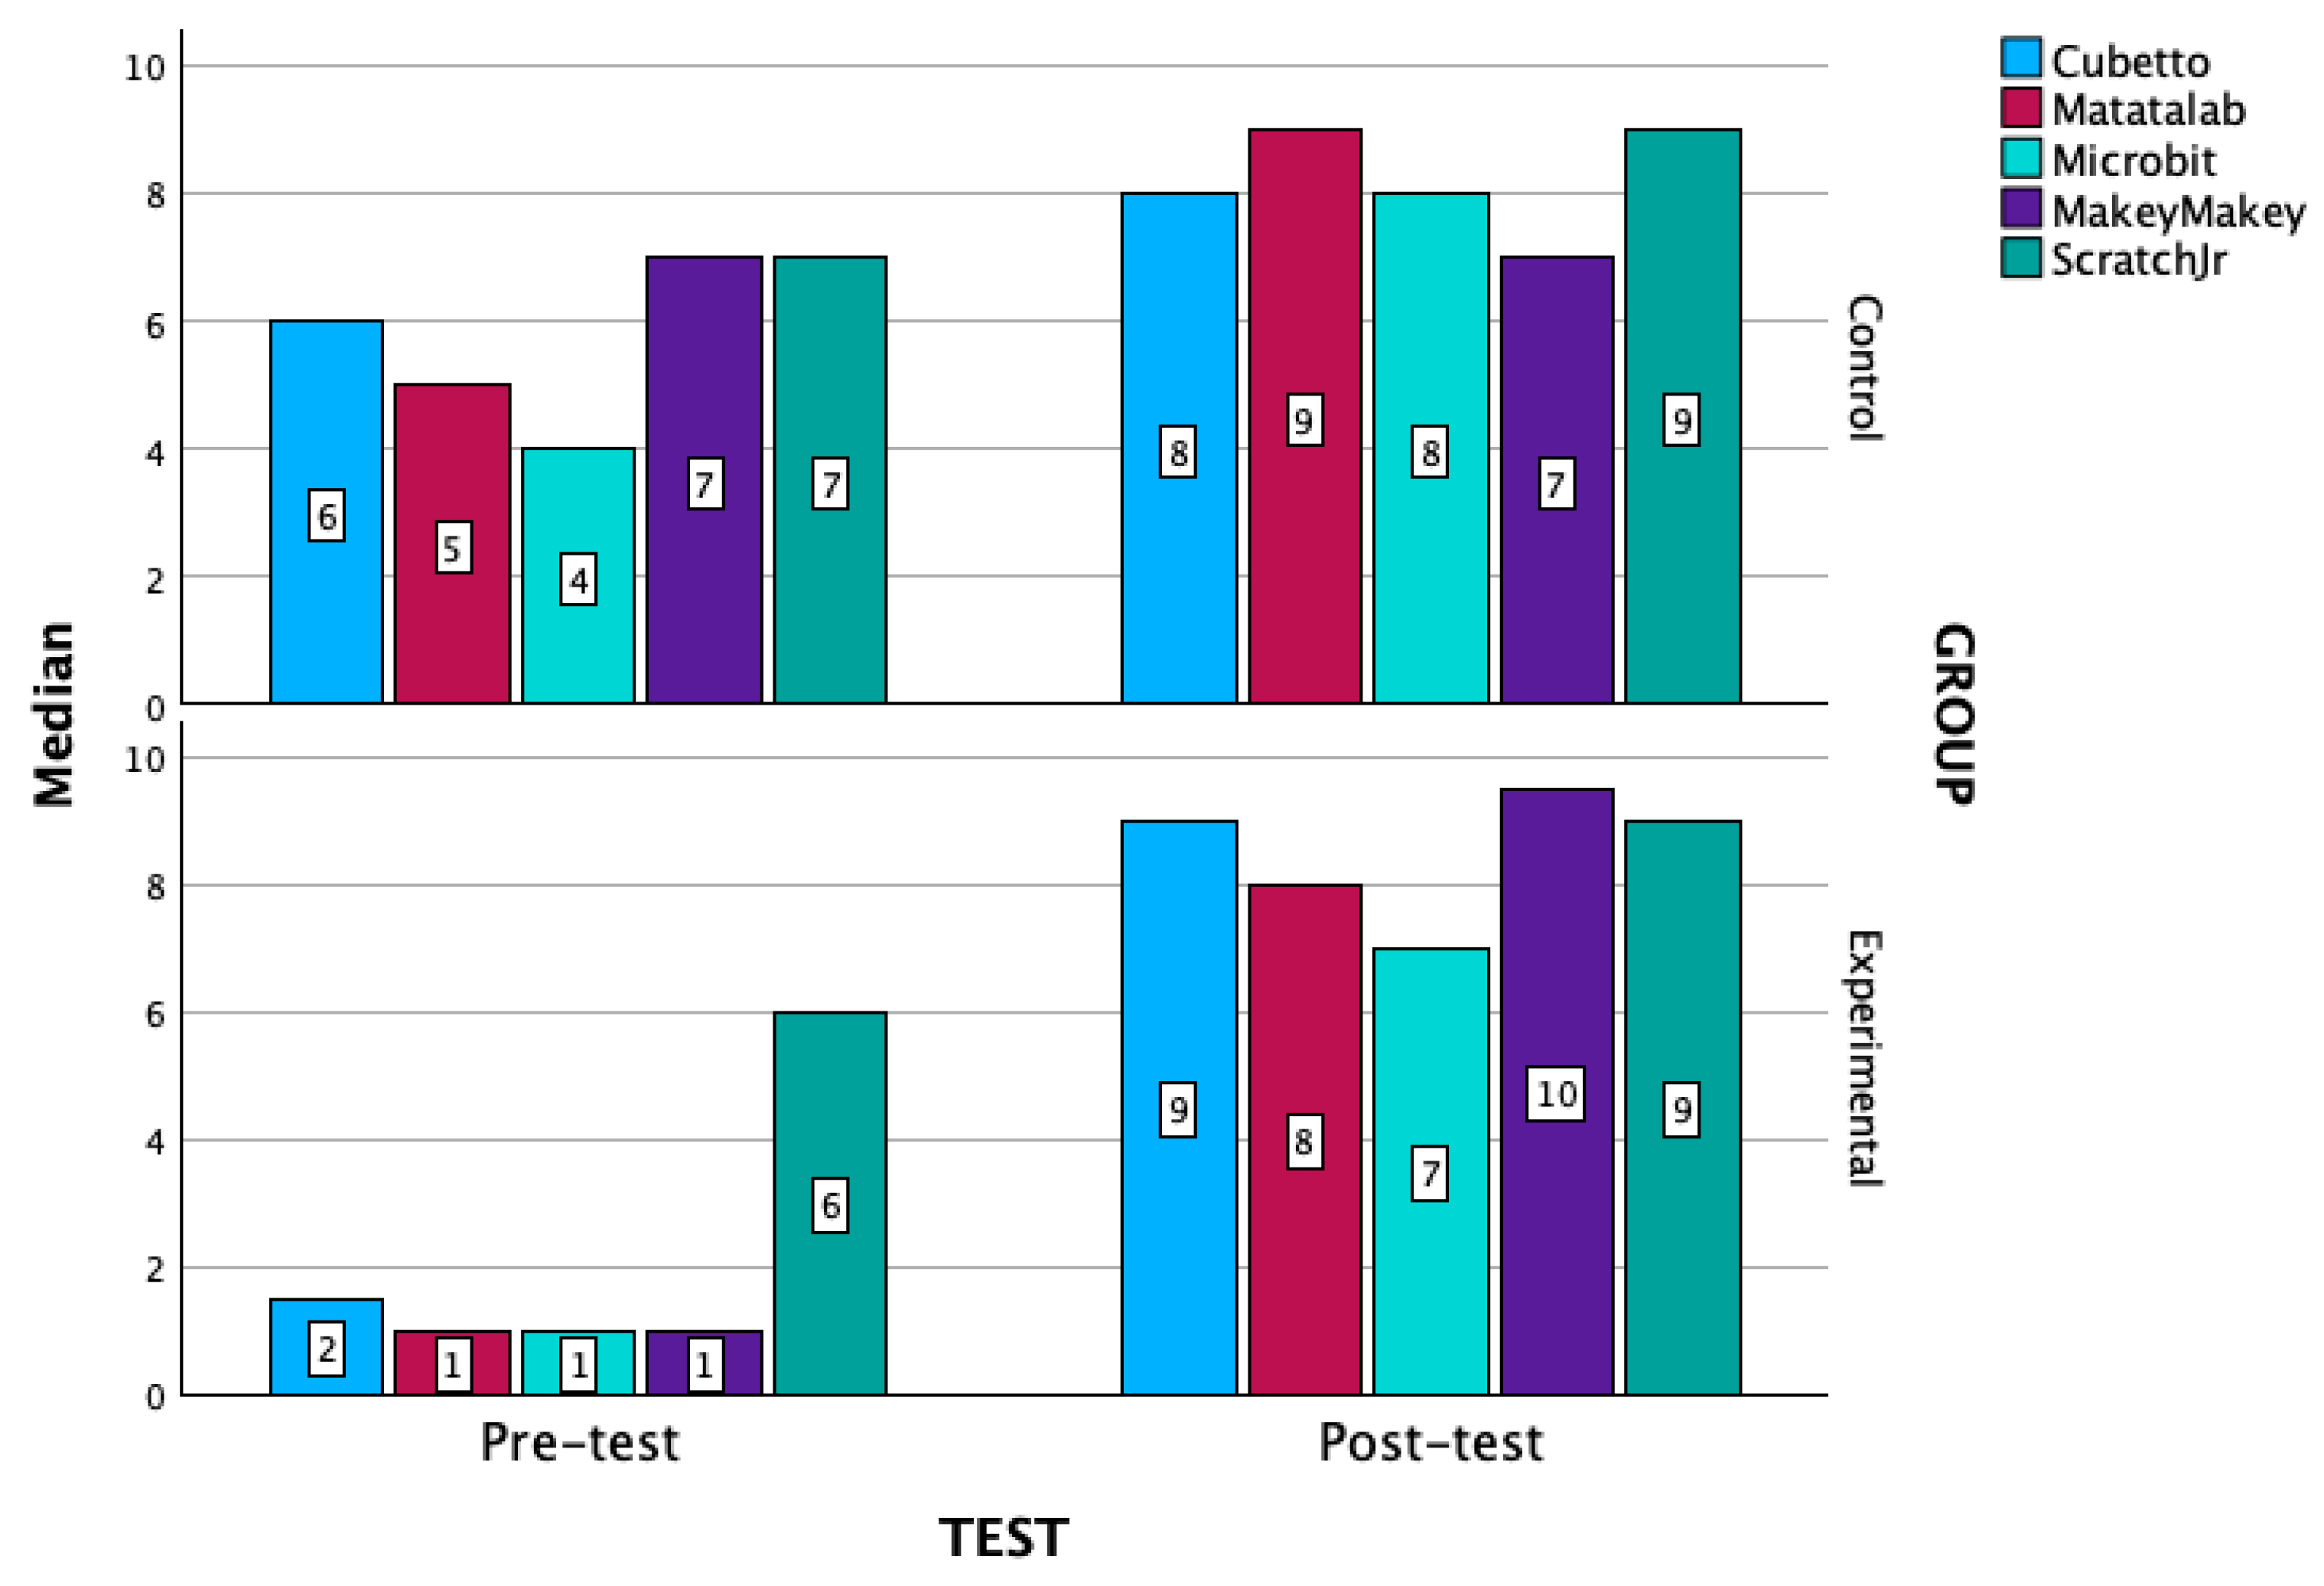
Table 6, the median scores in the pre-test are much higher in the control group than in the experimental group. The same applies to the dispersion of the data. In the post-test, however, the medians are quite similar in both groups (in some cases slightly higher and in others slightly lower), with the gain in the experimental group being much higher. The experimental group feel very confident on knowing how to teach specially on those hands on robots such as Cubetto and Makey Makey, remaining the same on both groups for Scratch Jr. This difference can be seen in
Figure 13, which visually complements the information given in
Table 6.
Table 7 shows, by means of the non-parametric Wilcoxon signed rank test for related samples, how these improvements between pre- and post-test of the experimental group are the only significant ones with p-value, in all cases, less than 0.001.
3.4. Correlations
In the following subsection, it is studied the possible correlation between the post-tests of the second and third tests (TAM and Robot’s konwledge test), both measured by ordinal variables, the first on a scale of 1 to 5 and the second on a scale of 1 to 10. This difference in scales does not influence the statistical results presented, so the original scale of each of the tests has been preserved.
This correlation, in ordinal variables, is measured using the Rho-Spearman coefficients.
Table 8 below shows these coefficients, which are positive in all cases, where those that are statistically significant are marked in bold, in which case we can speak of a positive correlation.
Thus, it can be seen, firstly, that all the variables studied in the second test are highly correlated with each other, with a medium or high positive correlation, depending on the case, and statistically significant, this is to say that when they found Perceived Usefulness (PU), they also find Social Norm (SN), Behavioral Intention (BI, Attitude Towards Using (ATU) and Actual Use (AU) high, and viceversa with all possible combination of the TAM dimensions. In the case of the third test something similar occurs, all the variables are positively related and statistically significant, this is to say that when they feel confident about their knowledge to teach one of the robots (Cubetto, Matatalab, Microbit, Makey Makey or Scratch Jr.) they also feel confident to teach any other of them. When considering the relationship between variables of the second (TAM) and third (Robots) tests, Cubetto is related to four of the five variables of the second test (PU, SN, BI, ATU), and so does Scratch Jr (SN, BI, ATU, AU), for Matatalab only with two (PU, ATU) being statistically significant correlations with those variables of the second test, but with higher relationship values in the case of Cubetto. For the rest, no relationship of any kind can be observed. This is to say that when they feel confident about teaching a robot such as Cubetto, Matatalab or Scratch Jr, they also accept and adopt using educational robotics.
For the experimental group,
Table 9 shows, firstly, a positive and statistically significant correlation, this is to say that when they found Perceived Usefulness (PU), they also found Social Norm (SN), Behavioral Intention (BI), Attitude Towards Using (ATU) and Actual Use (AU) high, and vice versa with all possible combination of the TAM dimensions. In the experimental group, the relationship between variables of the second (TAM) and third (Robots) tests, is very strong for Cubetto, Scratch Jr and Matatalab; in the case of Cubetto and Scratch Jr is strongly related to all of the five variables of the second test (PU, SN, BI, ATU, AU), being stronger for the first one; and in the case of the Matatalab it is only related to the second test by ATU. No relationship with the second test have been found for Microbit or Makey Makey. Thus the students teachers of the experimental group that used AI generated content to learn about Cubetto felt strongly confident on knowing how to teach with Cubetto and perceive this technology for accepting and using educational robotics with very high perceived usefulness (PU), which refers to the extent to which users believe that a technology will enhance their teaching performance, which is essential in determining their acceptance of educational tools. Also very high Social Norm (SN) that captures the influence of societal and peer expectations on teachers’ willingness to adopt new technologies, highlighting how external pressures can shape attitudes toward technology use. Very strong Behavioral Intention (BI) too, which measures an individual’s intent to use a specific technology, often shaped by positive attitudes and external influences. As very high Attitude Towards Using (ATU) that reflects the overall affective response to adopting a technology, including both emotional and cognitive evaluations. Finally, very high Actual Use (AU), which refers to the real-world integration and usage of the technology in educational settings. The same effect occurs when the students teachers use Scratch Jr, which is strongly correlated to the same five variables (PU, SN, BI, ATU, AU), but a little bit weaker than with Cubetto. And in the case of Matatalab, the students’ teachers that use it felt as very high Attitude Towards Using (ATU) that reflects the overall affective response to adopting a technology, including both emotional and cognitive evaluations.
Table 10 shows the correlation coefficients for the control group. It can be seen that, for each pair, all variables in the second test have a positive and statistically significant correlation, similar to the experimental group in the variables of the second test this is to say that when they found Perceived Usefulness (PU), they also find Social Norm (SN), Behavioral Intention (BI) , Attitude Towards Using (ATU) and Actual Use (AU) high, and viceversa with all possible combination of the TAM dimensions. The same is true for the third test, this is to say that when a they feel confident about their knowledge to teach one of the robots (Cubetto, Matatalab, Microbit, Makey Makey or Scratch Jr.) they also feel confident to teach any other of them. But in this case, the relationship between variables of the second (TAM) and third (Robots) tests, is weaker, Cubetto is only related to two of the five variables of the second test (BI, ATU), and Matatalab only with one (ATU) being statistically significant correlations with those variables of the second test, but with higher relationship values in the case of Cubetto. This is to say that only when they feel confident about teaching the robot Cubetto, they found BI and ATU high for adopting and use educational robotics, and when they feel confident about teaching Matatalab, they found a positive correlation with ATU, but much weaker than the previous. For the rest, no relationship of any kind can be observed.
4. Discussion
This study aimed to explore the impact of AI-generated contexts for teaching robotics on student teachers’ computational thinking (CT) skills. The findings highlight the effectiveness of this innovative approach, particularly in the context of early childhood education.
RQ1: Does the AI-generated context for teaching robotics improve student teachers computational thinking skills/domains?
The investigation into the impact of AI-generated contexts on student teachers’ computational thinking (CT) skills is particularly relevant in the context of early childhood education. In this study, the computational thinking skills of future educators, assessed through a validated test designed for children aged 3 to 6 years, revealed that both the experimental and control groups began with high baseline scores. Notably, the experimental group, which engaged with AI-generated contexts for teaching robotics, achieved the highest scores overall. However, the statistical analysis indicated that the differences in pre- and post-test scores were not significant (p > 0.05) for either group.
RQ2: Which computational thinking skills/domains (hardware & software, debugging, algorithm, modularity, representation and control structures) have improved more or less?
In examining the specific computational thinking (CT) skills that may have been influenced by the AI-generated context for teaching robotics, the results indicate that there were no significant changes in the post-test scores for the experimental group. Interestingly, the control group exhibited slight increases in their post-test scores for Modularity and Control Structures, while a decrease was observed in their scores for Algorithms. However, these changes were not statistically significant, as the scores remained high across both groups. The differences may be found in the prospective early childhood students when being taught such educational robotics.
RQ3: In the technology acceptance model, are there distinct measures for perceived usefulness, social norms, behavioral intention, attitude towards use, and actual use?
The median values, as well as the minimum values, are slightly lower in the experimental group than in the control group. This difference between the two groups, is not statistically significant in any case, except for the Actual Use (AU) variable, which refers to the real-world integration and usage of the technology in educational settings, with statistically significant difference for the experimental group.
This echoes findings from [
6], who noted that a lack of confidence in using technology can hinder the effective integration of robotics in educational settings. Addressing these challenges through AI-generated context for teaching robotics is crucial for successful implementation.
This finding is consistent with the work of [
46], who highlighted that meaningful contexts in education can lead to increased motivation and deeper learning. The integration of AI not only made the content more relatable but also allowed for personalized learning experiences, catering to diverse learning styles.
RQ4: Is the perception of student teachers regarding their ability to teach educational robots higher in the AI-generated context methodology group?
The findings reveal an interesting trend. Initially, the control group exhibited significantly higher median scores in the pre-test compared to the experimental group, indicating a greater confidence or familiarity with teaching educational robots prior to the intervention. This pattern was also reflected in the dispersion of the data, suggesting a more consistent level of confidence among control group participants.
However, post-test results showed that the median scores for both groups became more comparable, with the experimental group demonstrating a notable increase in confidence. This gain was particularly pronounced for hands-on robots like Cubetto and Makey Makey, where the experimental group reported feeling very confident in their teaching abilities. In contrast, the control group maintained similar scores for Scratch Jr, despite starting from a higher baseline.
These findings align with previous research that emphasizes the role of context in shaping educators’ self-efficacy. For instance, the work [
47] highlighted that perceived self-efficacy is influenced by the learning environment, suggesting that innovative teaching methods can enhance confidence levels. Additionally, studies by [
48] and [
46] have shown that engaging, context-rich learning experiences can significantly improve educators’ perceptions of their teaching capabilities, particularly in technology-rich environments. Thus, the results of this study support the notion that AI-generated contexts can effectively bolster student teachers’ confidence in teaching educational robots, ultimately enhancing their pedagogical skills.
RQ5: Is there a relationship between student teachers’ ability to teach educational robots and their technology acceptance?
The findings indicate a strong correlation within the experimental group that utilized AI-generated content to learn about Cubetto. Participants in this group expressed high confidence in their ability to teach with Cubetto, coupled with a strong perception of its perceived usefulness (PU). This aligns with the Technology Acceptance Model (TAM), which posits that perceived usefulness is a critical factor influencing the acceptance and integration of educational technologies [
49].
Moreover, the experimental group demonstrated very high levels of Social Norm (SN), reflecting the impact of societal and peer expectations on their willingness to adopt new technologies. This finding is consistent with research by [
50], which emphasizes the role of social influences in technology acceptance. Additionally, the participants exhibited strong Behavioral Intention (BI) to use the technology, shaped by positive attitudes and external influences, as well as a very high Attitude Towards Using (ATU), which encompasses both emotional and cognitive evaluations of the technology.
The results also indicated high levels of Actual Use (AU), signifying the real-world integration of the technology in educational settings. Similar patterns were observed with Scratch Jr, where the correlations with the five TAM variables (PU, SN, BI, ATU, AU) were slightly weaker than those for Cubetto. In the case of Matatalab, participants reported a very high ATU, reflecting a positive affective response to adopting the technology.
Conversely, in the control group, confidence in teaching Cubetto was associated with high BI and ATU for adopting educational robots. However, the correlation with Matatalab was much weaker, indicating that confidence alone did not translate into a strong acceptance of technology. This suggests that without the supportive context provided by AI-generated content, the relationship between teaching ability and technology acceptance may not be as robust.
These findings resonate with previous studies, such as those by [
51] and [
52], which highlight the importance of perceived usefulness and self-efficacy in shaping educators’ acceptance of technology. Overall, the results underscore the significance of context and support in fostering both confidence and acceptance of educational robots among student teachers.
Future research:
The implications of this study are significant for both research and practice. Future research should explore longitudinal effects of AI-generated contexts on CT skills and teaching practices. Additionally, studies could investigate the scalability of such approaches across different educational settings and demographics. Practically, teacher education programs should consider integrating AI and educational robots into their curricula to better prepare future educators for the demands of modern classrooms.
In conclusion, this study contributes to the growing body of literature on the intersection of AI, robotics, and education. By demonstrating the effectiveness of AI-generated contexts in enhancing students’ computational thinking skills and future teachers’ acceptance of technology, it paves the way for innovative teaching practices that can transform early childhood education.
5. Conclusions
This study has effectively explored the integration of AI-generated contexts in teaching robotics to preservice teachers, addressing key research questions that guided our investigation:
RQ1: The study found that AI-generated contexts significantly enhance student teachers’ computational thinking (CT) skills.
RQ2: Certain CT domains, particularly problem-solving and algorithmic thinking, showed more substantial improvement, indicating areas that may require focused practice.
RQ3: Participants in the AI-generated context group reported a more positive perception of their ability to teach with educational robots.
RQ4: The methodology improved the perceived knowledge of educational robots among student teachers, boosting their confidence in using these tools.
RQ5: Overall, the integration of AI-generated contexts positively impacted teaching practices, suggesting a need for these methodologies in teacher education programs.
In conclusion, this research contributes valuable insights into the intersection of AI, robotics, and education, emphasizing the importance of innovative teaching methodologies. It advocates for the incorporation of AI and robotics into teacher training curricula to better prepare future educators for the challenges of contemporary education. Future research should further investigate the long-term effects of these methodologies on CT skills and teaching practices across diverse educational contexts.
Author Contributions
Conceptualization. R.H..; methodology. R.H. and S.C..; software. R.H, S.C and O.B..; validation. R.H and C. P.; formal analysis. C.P..; investigation, R.H., S.C. and O.B..; resources, R.H., S.C., O.B. and C.P..; data curation, R.H:.; writing—original draft preparation, R.H., S.C., C.P..; writing—review and editing, R.H., S.C., C.P. and O.B.; visualization, R.H, C.P. S.C., O.B..; supervision, R.H..; All authors have read and agreed to the published version of the manuscript.
Funding
Please add: This research was funded by research grants PID2022-137849OB-I00 and PID2021-125709OA-C22 funded by MICIU/AEI/10.13039/501100011033 and by the ERDF, EU.
Data Availability Statement
Conflicts of Interest
Declare conflicts of interest or state “The authors declare no conflicts of interest.”.
References
- Wing, J.M. Computational thinking. Commun. ACM 2006, 49, 33–35. [Google Scholar] [CrossRef]
- Bers, M. U. (2020). Coding as a playground: Programming and computational thinking in the early childhood classroom. Routledge.
- Papert, S. (1980). Mindstorms: Children, computers, and powerful ideas. Basic Books.
- Brennan, K. , & Resnick, M. (2012). New frameworks for studying and assessing the development of computational thinking. Proceedings of the 2012 annual meeting of the American Educational Research Association.
- Alimisis, D. (2013). Educational robotics: Open questions and new challenges. Themes in Science & Technology Education, 6(1), 63-71.
- Yadav, A.; Hong, H.; Stephenson, C. Computational Thinking for All: Pedagogical Approaches to Embedding 21st Century Problem Solving in K-12 Classrooms. TechTrends 2016, 60, 565–568. [Google Scholar] [CrossRef]
- Bers, M.U.; Flannery, L.; Kazakoff, E.R.; Sullivan, A. Computational thinking and tinkering: Exploration of an early childhood robotics curriculum. Comput. Educ. 2014, 72, 145–157. [Google Scholar] [CrossRef]
- Bati, K. A systematic literature review regarding computational thinking and programming in early childhood education. Educ. Inf. Technol. 2021, 27, 2059–2082. [Google Scholar] [CrossRef]
- Saxena, A.; Lo, C.K.; Hew, K.F.; Wong, G.K.W. Designing Unplugged and Plugged Activities to Cultivate Computational Thinking: An Exploratory Study in Early Childhood Education. Asia-Pacific Educ. Res. 2020, 29, 55–66. [Google Scholar] [CrossRef]
- Montuori, C.; Pozzan, G.; Padova, C.; Ronconi, L.; Vardanega, T.; Arfé, B. Combined Unplugged and Educational Robotics Training to Promote Computational Thinking and Cognitive Abilities in Preschoolers. Educ. Sci. 2023, 13, 858. [Google Scholar] [CrossRef]
- Pérez-Suay, A.; García-Bayona, I.; Van Vaerenbergh, S.; Pascual-Venteo, A.B. Assessing a Didactic Sequence for Computational Thinking Development in Early Education Using Educational Robots. Educ. Sci. 2023, 13, 669. [Google Scholar] [CrossRef]
- Rehmat, A.P.; Ehsan, H.; Cardella, M.E. Instructional strategies to promote computational thinking for young learners. J. Digit. Learn. Teach. Educ. 2020, 36, 46–62. [Google Scholar] [CrossRef]
- Wang, X.C.; Choi, Y.; Benson, K.; Eggleston, C.; Weber, D. Teacher’s Role in Fostering Preschoolers’ Computational Thinking: An Exploratory Case Study. Early Educ. Dev. 2020, 32, 26–48. [Google Scholar] [CrossRef]
- Relkin, E.; de Ruiter, L.; Bers, M.U. TechCheck: Development and Validation of an Unplugged Assessment of Computational Thinking in Early Childhood Education. J. Sci. Educ. Technol. 2020, 29, 482–498. [Google Scholar] [CrossRef]
- Lavigne, H.J.; Lewis-Presser, A.; Rosenfeld, D. An exploratory approach for investigating the integration of computational thinking and mathematics for preschool children. J. Digit. Learn. Teach. Educ. 2020, 36, 63–77. [Google Scholar] [CrossRef]
- Relkin, E.; de Ruiter, L.; Bers, M.U. TechCheck: Development and Validation of an Unplugged Assessment of Computational Thinking in Early Childhood Education. J. Sci. Educ. Technol. 2020, 29, 482–498. [Google Scholar] [CrossRef]
- Zapata-Caceres, M.; Martin-Barroso, E.; Roman-Gonzalez, M. Collaborative Game-Based Environment and Assessment Tool for Learning Computational Thinking in Primary School: A Case Study. IEEE Trans. Learn. Technol. 2021, 14, 576–589. [Google Scholar] [CrossRef]
- Montuori, C.; Pozzan, G.; Padova, C.; Ronconi, L.; Vardanega, T.; Arfé, B. Combined Unplugged and Educational Robotics Training to Promote Computational Thinking and Cognitive Abilities in Preschoolers. Educ. Sci. 2023, 13, 858. [Google Scholar] [CrossRef]
- Bati, K. A systematic literature review regarding computational thinking and programming in early childhood education. Educ. Inf. Technol. 2021, 27, 2059–2082. [Google Scholar] [CrossRef]
- Kanaki, K., & Kalogiannakis, M. (2022). Algorithmic thinking in early childhood. Proceedings of the 6th International Conference on Digital Technology in Education. [CrossRef]
- Kanaki, K.; Kalogiannakis, M. Assessing Algorithmic Thinking Skills in Relation to Age in Early Childhood STEM Education. Educ. Sci. 2022, 12, 380. [Google Scholar] [CrossRef]
- Lavigne, H.J.; Lewis-Presser, A.; Rosenfeld, D. An exploratory approach for investigating the integration of computational thinking and mathematics for preschool children. J. Digit. Learn. Teach. Educ. 2020, 36, 63–77. [Google Scholar] [CrossRef]
- Yeni, S.; Grgurina, N.; Saeli, M.; Hermans, F.; Tolboom, J.; Barendsen, E. Interdisciplinary Integration of Computational Thinking in K-12 Education: A Systematic Review. Informatics Educ. 2023, 23, 223–278. [Google Scholar] [CrossRef]
- Saxena, A.; Lo, C.K.; Hew, K.F.; Wong, G.K.W. Designing Unplugged and Plugged Activities to Cultivate Computational Thinking: An Exploratory Study in Early Childhood Education. Asia-Pacific Educ. Res. 2020, 29, 55–66. [Google Scholar] [CrossRef]
- Casey, J.E.; Pennington, L.K.; Mireles, S.V. Technology Acceptance Model: Assessing Preservice Teachers’ Acceptance of Floor-Robots as a Useful Pedagogical Tool. Technol. Knowl. Learn. 2020, 26, 499–514. [Google Scholar] [CrossRef]
- Fridin, M.; Belokopytov, M. Acceptance of socially assistive humanoid robot by preschool and elementary school teachers. Comput. Hum. Behav. 2014, 33, 23–31. [Google Scholar] [CrossRef]
- Bers, M.U.; Portsmore, M. Teaching Partnerships: Early Childhood and Engineering Students Teaching Math and Science Through Robotics. J. Sci. Educ. Technol. 2005, 14, 59–73. [Google Scholar] [CrossRef]
- Jeong, H.I.; Kim, Y. The acceptance of computer technology by teachers in early childhood education. Interact. Learn. Environ. 2017, 25, 496–512. [Google Scholar] [CrossRef]
- Rad, D.; Egerau, A.; Roman, A.; Dughi, T.; Balas, E.; Maier, R.; Ignat, S.; Rad, G. A Preliminary Investigation of the Technology Acceptance Model (TAM) in Early Childhood Education and Care. BRAIN. BROAD Res. Artif. Intell. Neurosci. 2022, 13, 518–533. [Google Scholar] [CrossRef]
- Alam, A. (2022). Educational Robotics and Computer Programming in Early Childhood Education: A Conceptual Framework for Assessing Elementary School Students’ Computational Thinking for Designing Powerful Educational Scenarios. 2022 International Conference on Smart Technologies and Systems for Next Generation Computing (ICSTSN), 1-7. [CrossRef]
- Jaipal-Jamani, K.; Angeli, C. Effect of Robotics on Elementary Preservice Teachers’ Self-Efficacy, Science Learning, and Computational Thinking. J. Sci. Educ. Technol. 2017, 26, 175–192. [Google Scholar] [CrossRef]
- Neumann, M.M.; Calteaux, I.; Reilly, D.; Neumann, D.L. Exploring teachers’ perspectives on the benefits and barriers of using social robots in early childhood education. Early Child Dev. Care 2023, 193, 1503–1516. [Google Scholar] [CrossRef]
- Istenic, A.; Bratko, I.; Rosanda, V. Pre-service teachers’ concerns about social robots in the classroom: A model for development. Educ. Self Dev. 2021, 16, 60–87. [Google Scholar] [CrossRef]
- Papadakis, S.; Vaiopoulou, J.; Sifaki, E.; Stamovlasis, D.; Kalogiannakis, M. Attitudes towards the Use of Educational Robotics: Exploring Pre-Service and In-Service Early Childhood Teacher Profiles. Educ. Sci. 2021, 11, 204. [Google Scholar] [CrossRef]
- Papadakis, S., & Kalogiannakis, M. (2020). Exploring Preservice Teachers’ Attitudes About the Usage of Educational Robotics in Preschool Education. , 339-355. [CrossRef]
- Crompton, H.; Gregory, K.; Burke, D. Humanoid robots supporting children’s learning in an early childhood setting. Br. J. Educ. Technol. 2018, 49, 911–927. [Google Scholar] [CrossRef]
- Alam, A. (2022). Educational Robotics and Computer Programming in Early Childhood Education: A Conceptual Framework for Assessing Elementary School Students’ Computational Thinking for Designing Powerful Educational Scenarios. 2022 International Conference on Smart Technologies and Systems for Next Generation Computing (ICSTSN), 1-7. [CrossRef]
- Sullivan, A.; Bers, M.U. Dancing robots: integrating art, music, and robotics in Singapore’s early childhood centers. Int. J. Technol. Des. Educ. 2017, 28, 325–346. [Google Scholar] [CrossRef]
- Sullivan, A.; Bers, M.U. Robotics in the early childhood classroom: learning outcomes from an 8-week robotics curriculum in pre-kindergarten through second grade. Int. J. Technol. Des. Educ. 2016, 26, 3–20. [Google Scholar] [CrossRef]
- Relkin, E.; de Ruiter, L.; Bers, M.U. TechCheck: Development and Validation of an Unplugged Assessment of Computational Thinking in Early Childhood Education. J. Sci. Educ. Technol. 2020, 29, 482–498. [Google Scholar] [CrossRef]
- Cubetto. (2016, October). Cubetto: Hands on coding for ages 3 and up. Kickstarter. https://www.kickstarter.com/projects/primotoys/cubetto-hands-on-coding-for-girls-and-boys-aged-3. Accessed September 26, 2024.
- MatataLab. (n.d.). Mata Studio - MatataStudio STEAM Learning Solution for Age 3-18. https://en.matatalab.com/.Accessed September 26, 2024.
- Austin, J.; Baker, H.; Ball, T.; Devine, J.; Finney, J.; De Halleux, P.; Hodges, S.; Moskal, M.; Stockdale, G. The BBC micro:bit: from the UK to the world. Commun. ACM 2020, 63, 62–69. [Google Scholar] [CrossRef]
- Rogers, Y., Paay, J., Brereton, M., Vaisutis, K. L., Marsden, G., & Vetere, F. (2014, April). Never too old: engaging retired people inventing the future with MaKey MaKey. In Proceedings of the SIGCHI Conference on Human Factors in Computing Systems (pp. 3913-3922). [CrossRef]
- Bers, M. U., & Resnick, M. (2015). The official ScratchJr book: Help your kids learn to code. No Starch Press.
- Kafai, Y.B.; Burke, Q. Constructionist Gaming: Understanding the Benefits of Making Games for Learning. Educ. Psychol. 2014, 50, 313–334. [Google Scholar] [CrossRef]
- Bandura, A. (1997). Self-efficacy: The exercise of control. W.H. Freeman and Company.
- Hsu, Y. S., Ching, Y. H., & Grabowski, B. (2019). The impact of a technology-enhanced learning environment on students' self-efficacy and learning outcomes. Computers & Education, 128, 1-12. [CrossRef]
- Davis, F.D. Perceived Usefulness, Perceived Ease of Use, and User Acceptance of Information Technology. MIS Q. 1989, 13, 319–340. [Google Scholar] [CrossRef]
- Venkatesh, V.; Morris, M.G.; Davis, G.B.; Davis, F.D. User Acceptance of Information Technology: Toward a Unified View. MIS Q. 2003, 27, 425–478. [Google Scholar] [CrossRef]
- Teo, T. (2009). Technology acceptance in education: A review. Educational Technology & Society, 12(4), 1-10.
- Ertmer, P. A. (1999). Addressing the technology integration challenge: The role of teacher efficacy. Journal of Technology and Teacher Education, 7(1), 1-24.
Figure 1.
Diagram of the Computational thinking in Early childhood Test (left), the Technology Acceptance Model used (center), and the measure on specific educational robotics in the classroom (right) by the students’ teachers.
Figure 1.
Diagram of the Computational thinking in Early childhood Test (left), the Technology Acceptance Model used (center), and the measure on specific educational robotics in the classroom (right) by the students’ teachers.
Figure 2.
Diagram of the experimental Design.
Figure 2.
Diagram of the experimental Design.
Figure 3.
The four educational robots used in the study: Cubetto, Matatalab, Micro:bit, and Makey Makey; and the ScratchJr program.
Figure 3.
The four educational robots used in the study: Cubetto, Matatalab, Micro:bit, and Makey Makey; and the ScratchJr program.
Figure 4.
Example of an AI-generated contextual assignment.
Figure 4.
Example of an AI-generated contextual assignment.
Figure 5.
Activity planning sheet.
Figure 5.
Activity planning sheet.
Figure 6.
Evaluation Rubrics.
Figure 6.
Evaluation Rubrics.
Figure 7.
Early Childhood TechCheck Test components with sample questions.
Figure 7.
Early Childhood TechCheck Test components with sample questions.
Figure 8.
Technology Acceptance Model Test sample questions and dimensions measured.
Figure 8.
Technology Acceptance Model Test sample questions and dimensions measured.
Figure 9.
Robots’ knowledge Test for the robots used.
Figure 9.
Robots’ knowledge Test for the robots used.
Figure 10.
Box-plots for the total scores in pre and post-tests for Experimental and Control group.
Figure 10.
Box-plots for the total scores in pre and post-tests for Experimental and Control group.
Figure 11.
Bar chart for the means of the different dimensions in pre and post-tests for the Experimental and Control groups. The values shown on the bars represent the nearest integer.
Figure 11.
Bar chart for the means of the different dimensions in pre and post-tests for the Experimental and Control groups. The values shown on the bars represent the nearest integer.
Figure 12.
Bar chart for the medians of the different dimensions in pre and post-tests for Experimental and Control group.
Figure 12.
Bar chart for the medians of the different dimensions in pre and post-tests for Experimental and Control group.
Figure 13.
Bar chart for the medians for Robot’s knowdlege test variables in control and experimental group.
Figure 13.
Bar chart for the medians for Robot’s knowdlege test variables in control and experimental group.
Table 1.
Summary of variables, type (DV, dependent variable; IV, independent variable), name, and description.
Table 1.
Summary of variables, type (DV, dependent variable; IV, independent variable), name, and description.
| Test |
Aspect |
Type |
Variable |
Name |
| Early Childhood CT Test |
Learning programming and CT |
DV |
Total Score |
Score |
| DV |
HW/SW |
HWSW |
| DV |
Debugging |
DEBUGGING |
| DV |
Algorithms |
ALGORITHMS |
| DV |
Modularity |
MODULARITY |
| DV |
Representation |
REPRESENTATION |
| DV |
Control Structures |
CONTROLSTRUCTURES |
| Technology Acceptance Model Test |
Adoption and use of technology in educational context |
DV |
Perceived Usefulness |
PU |
| DV |
Social norms |
SN |
| DV |
Behavioral Intention |
BI |
| DV |
Attitude Towards Using |
ATU |
| DV |
Actual Use |
AU |
| Robots’ knowledge Test |
Self-knowledge to teach with robots |
DV |
Cubetto |
Cubetto |
| DV |
Matatalab |
Matatalab |
| DV |
Micro:bit |
Microbit |
| DV |
Makey Makey |
MakeyMakey |
| DV |
Scratch Jr |
ScratchJr |
| |
Methodological factors |
IV |
Intervention group |
GROUP |
| |
IV |
Pre and post-tests |
TEST |
Table 2.
Descriptive statistics for total scores.
Table 2.
Descriptive statistics for total scores.
| |
Control (n=13) |
Experimental (n=60) |
| |
Pre-test |
Post-test |
Pre-test |
Post-test |
| Mean |
9.48 |
9.58 |
9.63 |
9.72 |
| Median |
10 |
10 |
10 |
10 |
| SD |
0.72 |
0.79 |
0.58 |
0.51 |
| Min |
8 |
7.33 |
8 |
7.33 |
| Max |
10 |
10 |
10 |
10 |
Table 3.
A non-parametric test (signed rank Wilcoxon test for related samples) between pre and post-test.
Table 3.
A non-parametric test (signed rank Wilcoxon test for related samples) between pre and post-test.
| |
Control |
Experimental |
| W |
20.50 |
290 |
| p-value |
0.722 |
0.383 |
Table 4.
Descriptive statistics for Technology Acceptance Model test variables in control and experimental group.
Table 4.
Descriptive statistics for Technology Acceptance Model test variables in control and experimental group.
| |
Control |
|
Experimental |
|
| |
Median |
SD |
Min |
Max |
Median |
SD |
Min |
Max |
| PU |
5 |
0.86 |
2.5 |
5 |
4.5 |
0.79 |
2 |
5 |
| SN |
5 |
0.96 |
2 |
5 |
4 |
0.84 |
2 |
5 |
| BI |
4 |
1.04 |
2 |
5 |
4 |
1.13 |
1 |
5 |
| ATI |
4.5 |
0.77 |
3 |
5 |
4.5 |
0.86 |
2 |
5 |
| AU |
4 |
1.26 |
1 |
5 |
3 |
1.16 |
1 |
5 |
Table 5.
A non-parametric test (signed rank Wilcoxon test for related samples) between control and test group.
Table 5.
A non-parametric test (signed rank Wilcoxon test for related samples) between control and test group.
| |
PU |
SN |
BI |
ATU |
AU |
| Z |
0.796 |
1.227 |
0.667 |
0.264 |
2.007 |
| p-value |
0.426 |
0.220 |
0.505 |
0.792 |
0.045 |
Table 6.
Descriptive statistics for control and experimental group in pre- and post-test.
Table 6.
Descriptive statistics for control and experimental group in pre- and post-test.
| |
|
Pre-test |
Post-test |
| |
|
Median |
SD |
Min |
Max |
Median |
SD |
Min |
Max |
| |
Cubetto |
6 |
3.23 |
1 |
10 |
8 |
2.72 |
1 |
10 |
| |
Matatalab |
5 |
3.50 |
1 |
10 |
9 |
2.63 |
3 |
10 |
| Control |
Microbit |
4 |
3.22 |
1 |
10 |
8 |
3.01 |
1 |
10 |
| |
MakeyMakey |
7 |
3.75 |
1 |
10 |
7 |
3.01 |
1 |
10 |
| |
ScratchJr |
7 |
2.77 |
1 |
10 |
9 |
2.04 |
4 |
10 |
| |
Cubetto |
1.5 |
2.03 |
1 |
10 |
9 |
1.78 |
4 |
10 |
| Experimental |
Matatalab |
1 |
1.71 |
1 |
9 |
8 |
2.58 |
1 |
10 |
| |
Microbit |
1 |
1.34 |
1 |
6 |
7 |
3.01 |
1 |
10 |
| |
MakeyMakey |
1 |
1.72 |
1 |
7 |
9.5 |
1.85 |
2 |
10 |
| |
ScratchJr |
6 |
3.04 |
1 |
10 |
9 |
1.76 |
2 |
10 |
Table 7.
A non-parametric test (signed rank Wilcoxon test for related samples) between pre and post-test.
Table 7.
A non-parametric test (signed rank Wilcoxon test for related samples) between pre and post-test.
| |
|
Cubetto |
Matatalab |
Microbit |
MakeyMakey |
ScratchJr |
| Control |
Z |
1.691 |
1.694 |
2.130 |
0.947 |
1.842 |
| p-value |
0.091 |
0.090 |
0.033 |
0.344 |
0.065 |
| Experimental |
Z |
6.368 |
6.149 |
6.168 |
6.359 |
5.179 |
| p-value |
<.001 |
<.001 |
<.001 |
<.001 |
<.001 |
Table 8.
Rho-Spearman coefficients for each pair of variables. Those which are significant are marked in bold (*: p <0.05; **: p <0.01).
Table 8.
Rho-Spearman coefficients for each pair of variables. Those which are significant are marked in bold (*: p <0.05; **: p <0.01).
| |
PU |
SN |
BI |
ATU |
AU |
Cubetto |
Matatalab |
Microbit |
MakeyMakey |
ScratchJr |
| |
PU |
-- |
|
|
|
|
|
|
|
|
|
| SN |
.662** |
-- |
|
|
|
|
|
|
|
|
| BI |
.761** |
.668** |
-- |
|
|
|
|
|
|
|
| ATU |
.737** |
.619** |
.813** |
-- |
|
|
|
|
|
|
| AU |
.647** |
.464** |
.711** |
.583** |
-- |
|
|
|
|
|
| Cubetto |
.521** |
.454** |
.528** |
.501** |
.312* |
-- |
|
|
|
|
| Matatalab |
.271* |
.146 |
.232 |
.269* |
.203 |
.736** |
-- |
|
|
|
| Microbit |
.175 |
.195 |
.219 |
.154 |
.059 |
.741** |
.693** |
-- |
|
|
| MakeyMakey |
.165 |
.130 |
.165 |
.075 |
.095 |
.743** |
.751** |
.831** |
-- |
|
| ScratchJr |
.251* |
.290* |
.258* |
.255* |
.276* |
.450** |
.388** |
.416** |
.459** |
-- |
Table 9.
Rho-Spearman coefficients for each pair of variables in experimental group. Those which are significant are marked in bold (*: p <0.05; **: p <0.01).
Table 9.
Rho-Spearman coefficients for each pair of variables in experimental group. Those which are significant are marked in bold (*: p <0.05; **: p <0.01).
| |
PU |
SN |
BI |
ATU |
AU |
Cubetto |
Matatalab |
Microbit |
MakeyMakey |
ScratchJr |
| |
PU |
-- |
|
|
|
|
|
|
|
|
|
| SN |
.662** |
-- |
|
|
|
|
|
|
|
|
| BI |
.761** |
.668** |
-- |
|
|
|
|
|
|
|
| ATU |
.737** |
.619** |
.813** |
-- |
|
|
|
|
|
|
| AU |
.647** |
.464** |
.711** |
.583** |
-- |
|
|
|
|
|
| Cubetto |
.521** |
.454** |
.528** |
.501** |
.312* |
-- |
|
|
|
|
| Matatalab |
.271* |
.146 |
.232 |
.269* |
.203 |
.213 |
-- |
|
|
|
| Microbit |
.175 |
.195 |
.219 |
.154 |
.059 |
.285* |
.068 |
-- |
|
|
| MakeyMakey |
.165 |
-.130 |
.165 |
.075 |
.095 |
.125 |
.194 |
.456** |
-- |
|
| ScratchJr |
.251* |
.290* |
.258* |
.255* |
.276* |
.274* |
.231 |
.242 |
.226 |
-- |
Table 10.
Rho-Spearman coefficients for each pair of variables in control group. Those which are significant are marked in bold (*: p <0.05; **: p <0.01).
Table 10.
Rho-Spearman coefficients for each pair of variables in control group. Those which are significant are marked in bold (*: p <0.05; **: p <0.01).
| |
PU |
SN |
BI |
ATU |
AU |
Cubetto |
Matatalab |
Microbit |
MakeyMakey |
ScratchJr |
| |
PU |
-- |
|
|
|
|
|
|
|
|
|
| SN |
.949** |
-- |
|
|
|
|
|
|
|
|
| BI |
.811** |
.764** |
-- |
|
|
|
|
|
|
|
| ATU |
.883** |
.863** |
.683* |
-- |
|
|
|
|
|
|
| AU |
.795** |
.753** |
.857** |
.749** |
-- |
|
|
|
|
|
| Cubetto |
.445 |
.367 |
.565* |
.415 |
.444 |
-- |
|
|
|
|
| Matatalab |
.147 |
.021 |
.300 |
.119 |
.028 |
.707** |
-- |
|
|
|
| Microbit |
.191 |
.093 |
.354 |
.229 |
.287 |
.704** |
.716** |
-- |
|
|
| MakeyMakey |
.049 |
-.046 |
.283 |
.112 |
.083 |
.619** |
.909** |
.785** |
-- |
|
| ScratchJr |
-.064 |
-.175 |
.236 |
-.180 |
.146 |
.340 |
.639** |
.578** |
.776** |
-- |
|
Disclaimer/Publisher’s Note: The statements, opinions and data contained in all publications are solely those of the individual author(s) and contributor(s) and not of MDPI and/or the editor(s). MDPI and/or the editor(s) disclaim responsibility for any injury to people or property resulting from any ideas, methods, instructions or products referred to in the content. |
© 2024 by the authors. Licensee MDPI, Basel, Switzerland. This article is an open access article distributed under the terms and conditions of the Creative Commons Attribution (CC BY) license (http://creativecommons.org/licenses/by/4.0/).

