Preprint
Article

Determining the Physical Value of Human Transport Services: A Proposal for a Sensor-Based Approach

This version is not peer-reviewed.

Submitted:

27 October 2024

Posted:

28 October 2024

You are already at the latest version

Abstract
The paper is concerned with the problem of assigning value to a transport service that moves a mass M with velocity vAB in a time τAB from a first point A to a more distant point B. It is argued that the value of such a transport service can be measured in an objective and physically accessible way by calculating the physical action WAB(M,vAB,τAB) upon moving a mass M along a specific path joining points A and B. In the specific case of a linear straight-line motion in a force-free field this action attains a minimum value of WAB_ideal= 12MvAB2τAB=12MvABLAB which shows that the function WAB_ideal(M,LAB,τAB) contains all those quantities which in practice determine the money-value of the related transport service. It is argued that with the sensor hardware routinely available in modern cars, the accumulation of transport value with driving can be continuously monitored inside a car. Such accumulation allows the transport value gained at the final destination B to be compared to the intrinsic value of a transport service that connects points A and B. In this way, the potential for optimizing transport services with regard to economic and ecological constraints can be quantitatively assessed and possible improvements be identified.
Keywords: 
Subject: 
Physical Sciences  -   Applied Physics

1. Introduction

Mobility, i.e. the ability to move from one place to another has always been a major concern in human history [1,2,3]. In the current age of globalization and world-wide trade, mobility has become an even greater concern than in former times. In view of the increasingly dense and inter-linked supply chains, it is of paramount importance to coordinate the traffic of raw materials, goods and human workforces in a way that is consistent with ever-tightening economic and environmental constraints [4,5].
Turning to the individual transport processes themselves, the task of providing the transport of a mass M from point A to B over a transport path of length L A B in a pre-determined time τ A B can be accomplished by the expenditure of energy E A B leading to the creation of a value V A B ( M , L A B , τ A B ) . In the current state of the art this value is expressed in money units, i.e. in the form of a price P A B ( M , L A B , τ A B ) . In real life the formation of prices is subject to market mechanisms which involve many poorly understood and hardly quantifiable parameters such as competitive constraints and business policies. In this context we only mention that the money cost for the air transport of a single person over several hundred miles is often comparable to the money cost of a taxi ride over a short distance of several miles only. We therefore conjecture that money prices often do not reflect the true value V A B ( M , L A B , τ A B ) of a transport service, i.e. the benefit that has been generated by a transport service in relation to its physically assessable energetic and environmental costs.
In the following we introduce the idea that a realistic value function V A B ( M , L A B , τ A B ) can be determined by invoking the physical quantity of action (in German: “Wirkung”= effect of work done). This action-related value W A B ( M , L A B , τ A B ) can be determined from physically accessible parameters that characterize the form of the trajectory that connects points A and B and of parameters that describe how a mass M is actually moving along its trajectory. We show below that - consistent with reasonable economic pricing - the action-based transport value W A B ( M , L A B , τ A B ) is proportional to the mass M that had been transported, the length L A B of the transport path covered, and the time τ A B in which this task has been carried out. As this physically accessible transport value can be compared to the energy that had to be invested to enable this very piece of transport, transport processes can be planned, controlled, and optimized with regard to rationally accessible benefit-cost relationships. In the following we explain the key concepts of our approach and we demonstrate its usefulness by considering some simple and easily over-seeable traffic scenarios. In the final section of this paper, we point out how this innovative concept can be put to practice by using sensor technologies routinely incorporated in modern cars.

2. Physical Value of Mechanical Motion

Performing a transport service requires a mass M to be moved along a road connecting a starting point A with an endpoint B .   Driving a mass M along a distance L A B = A B in a time τ A B requires well-dosed amounts of forces F i to be applied on mass M to overcome its inertia, its friction with the environment and to compensate upside or downside dragging gravitational forces:
F ( r , t ) = F i n ( r , t )   +   F f r ( r , t )   +   F g ( r , t )
With well-dosed forces F i ( r   , t ) being applied to mass M at appropriate times and positions along its trajectory, mass M can be forced to follow a chosen road with Newton´s equations of motion
M d v ( r , t ) d t = i = 1 N F i ( r , t )
predicting the positions r ( t ) and velocities v ( r , t ) along the trajectory at each instant of time. In addition to this kinematic information, Newton´s equations neither yield any information that would allow quantifying the motional value of the trajectory r ( t ) , nor do these equations provide any clues towards the energetic and entropic costs that had to be paid to make mass M follow the chosen road from A to B .
Aiming at elucidating the motional value of the chosen trajectory and its energetic and entropic costs, we note that, in the present state of the art the forces F i that are required to move mass M along its predetermined trajectory, are produced by internal combustion engines. Within such engines, liquid fuel is being burnt and mechanical power is delivered at the engine output amounting to
P m e c h ( t ) = η e n d E c o m b d t .
where d E c o m b is the combustion energy that is liberated in an infinitely small interval of time d t and η e n is the efficiency of this engine at generating mechanical power out of internal combustion. Equating P m e c h ( t ) to the scalar product of the input forces F i ( r , t ) in Equation 1 and the velocity profile v ( r , t ) upon following the chosen road profile, the engine power input into mechanical motion is obtained:
P m e c h ( t ) = F i n ( r , t ) + F f r ( r , t ) + F g ( r , t ) v ( r , t ) .
Double integration of this latter equation first yields the mechanical energy
E m e c h ( t ) = 0 t F i n ( r , t ) + F f r ( r , t ) + F g ( r , t ) v ( r , t ) d t
that had been invested into the moving mass M up to time t to make it follow the chosen road. In a second integration step the physical action W ( t ) is obtained that is associated with the mass M while following the chosen trajectory r ( t ) up to point t :
W m e c h ( t ) = 0 t E m e c h ( t ) d t .
This latter result can also be expressed in differential forms as
d 2 W m e c h ( t ) d t 2 = F i n ( r , t ) + F f r ( r , t ) + F g ( r , t ) v ( r , t ) .
For the reasons outlined in the following sections we regard the function W m e c h ( τ A B ) as the physical value of the transport service that had moved a mass M from its initial position A to its final destination B in the required time τ A B while following the chosen road profile r ( t ) . Further with the money value of the fuel that had been burnt to generate the trajectory r ( t ) and the solution of Equation 6 a direct correspondence between the money value of the fuel and the physical value of the generated trajectory can be established. Establishing such correlations, trajectories and prices can be optimized to reflect in a much better way the energetic and environmental costs that are associated with practically realized transport services.
Figure 1. (a) turning money value into trajectories; (b) deriving physical transport value from inputs in engine power.
Preprints 137633 g001

3. Some Simple One-Dimensional Transport Scenarii

3.1. Idealized Fly-Through Scenario

In order to validate the idea of using the entity of physical action as a means of enumerating the physical value of mechanical motion, we consider a scenario in which a mass M is moving with constant speed v A B along a straight-line path of length L A B connecting points A and B (see Figure 2). We further assume that this motion is perpendicular to the direction of the earth´s gravitational field. The potential energy V of this mass can therefore be taken as a constant. In particular, we can set V = 0 by choosing a Cartesian coordinate system in which the motion of the mass M occurs along the x-axis and in which the direction of the gravitational field vector points along the negative z-axis. In the following we will call such a scenario a “fly-through” scenario.
In this highly idealized case, the kinetic energy of the moving mass is
T = 1 2 M v A B 2
and
τ A B = L A B v A B
is the time required for traversing the distance L A B with speed v A B . After traversing the length L A B with velocity v A B , the change in the physical action W A B is:
W A B M , L A B , τ A B = 0 τ A B T d t = 1 2 M v A B 2 τ A B = 1 2 M v A B L A B =   1 2 M L A B 2 τ A B
This is an important result as it shows that W A B depends on a number of parameters that are important for assigning a money value to a transport service:
- the magnitude of the transported mass M ,
- the length L A B of the transport path,
- the time τ A B in which the transport has been carried out.
With this result in mind, the function W A B M , L A B , τ A B = 1 2 M L A B 2 τ A B can be regarded as the intrinsic value of a transport service in which a mass M is moved over a distance L A B in a time τ A B within a force-free field. This assignment of a reference value is motivated by the principle of least action [6,7], which states that a mass M moving in a force-free field will follow a straight-line path, which is a minimal-action path.

3.2. Start-Stop Scenarii

The “fly-through” scenario discussed above is a fairly artificial one, only invented for motivating the entity of physical action to be a useful figure of merit for the hitherto undefined property of transport value. Realistic transport scenarii distinguish from this highly idealized case in that realistic scenarii start out at point A from rest, speed up to a finite speed v a b > v A B = L A B / τ A B and slow down upon approach to endpoint B . In the following we will call such transport processes “start-stop” scenarii.
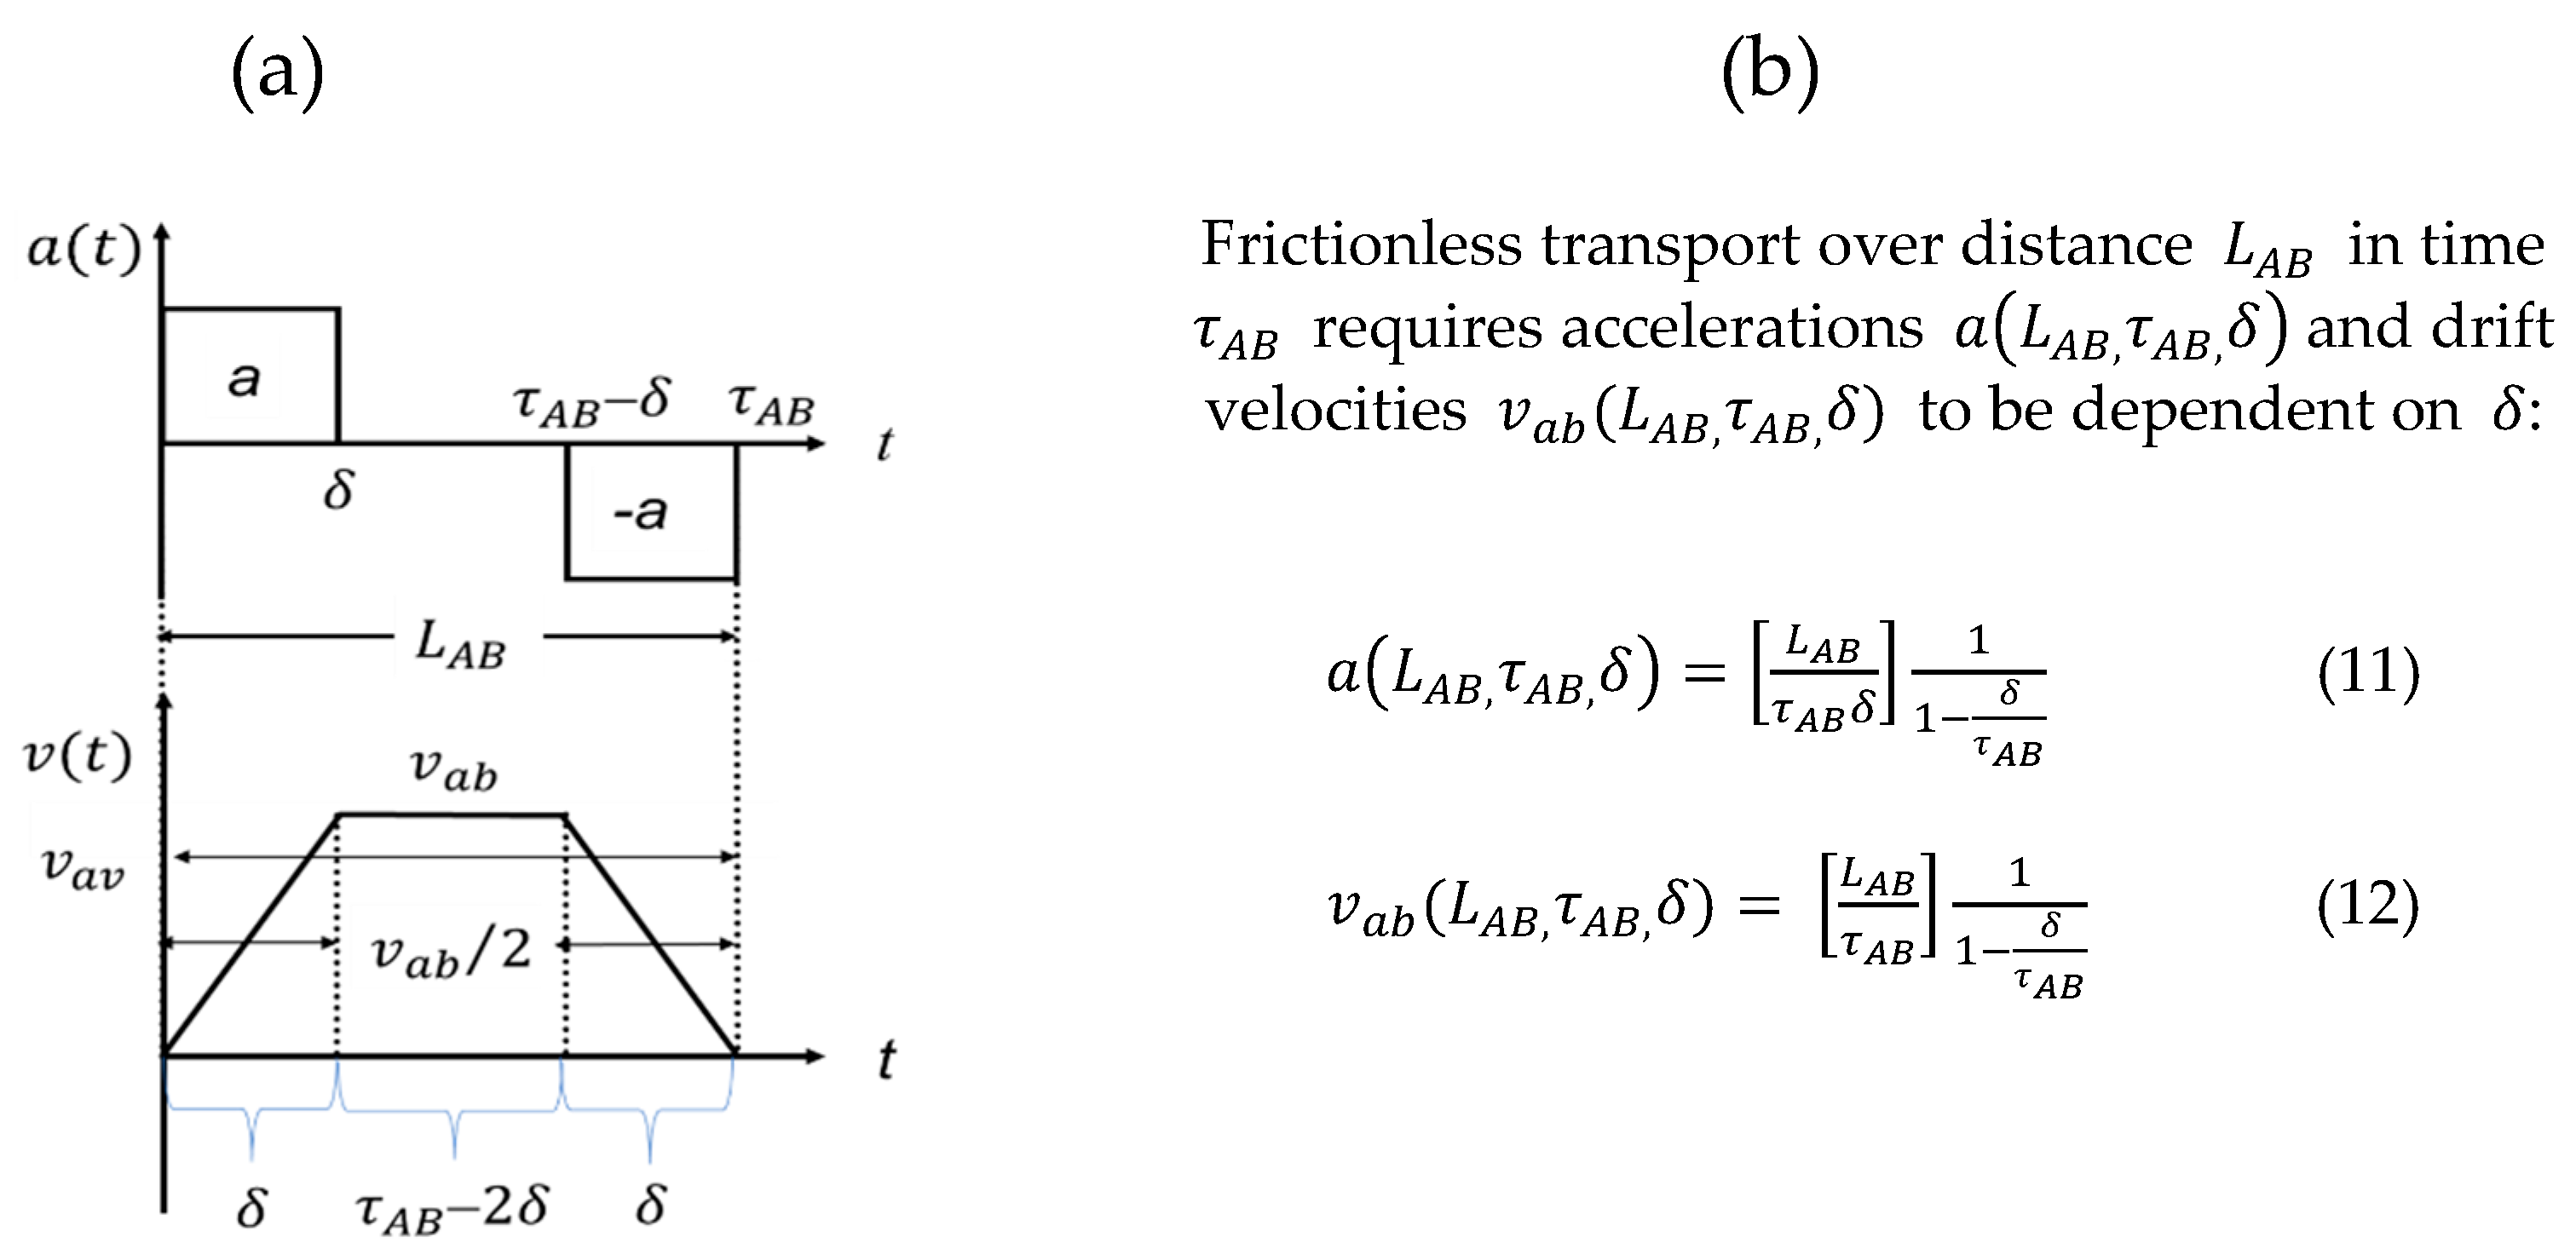
Within a “start-stop” scenario, mass M starts out from rest at point A and is accelerated by engine forces F e n = M a in time δ to attain a speed v a b after which it travels without any further acceleration until it approaches its endpoint B at time t =   τ A B   δ . Thereafter it becomes decelerated by brake forces a to come to rest at point B again. Assuming that this “start-stop” transport occurs over the same length L A B and the same time τ A B as in the “fly-through” scenario above, the accelerations and decelerations a ( L A B , τ A B , δ ) acting during these three phases need to be adjusted to the lengths δ of the acceleration and deceleration phases. Similarly, the velocity v a b ( L A B , τ A B , δ ) in the intermediate drift phase needs to be adjusted as well. These adjustments are shown in Figure 3.
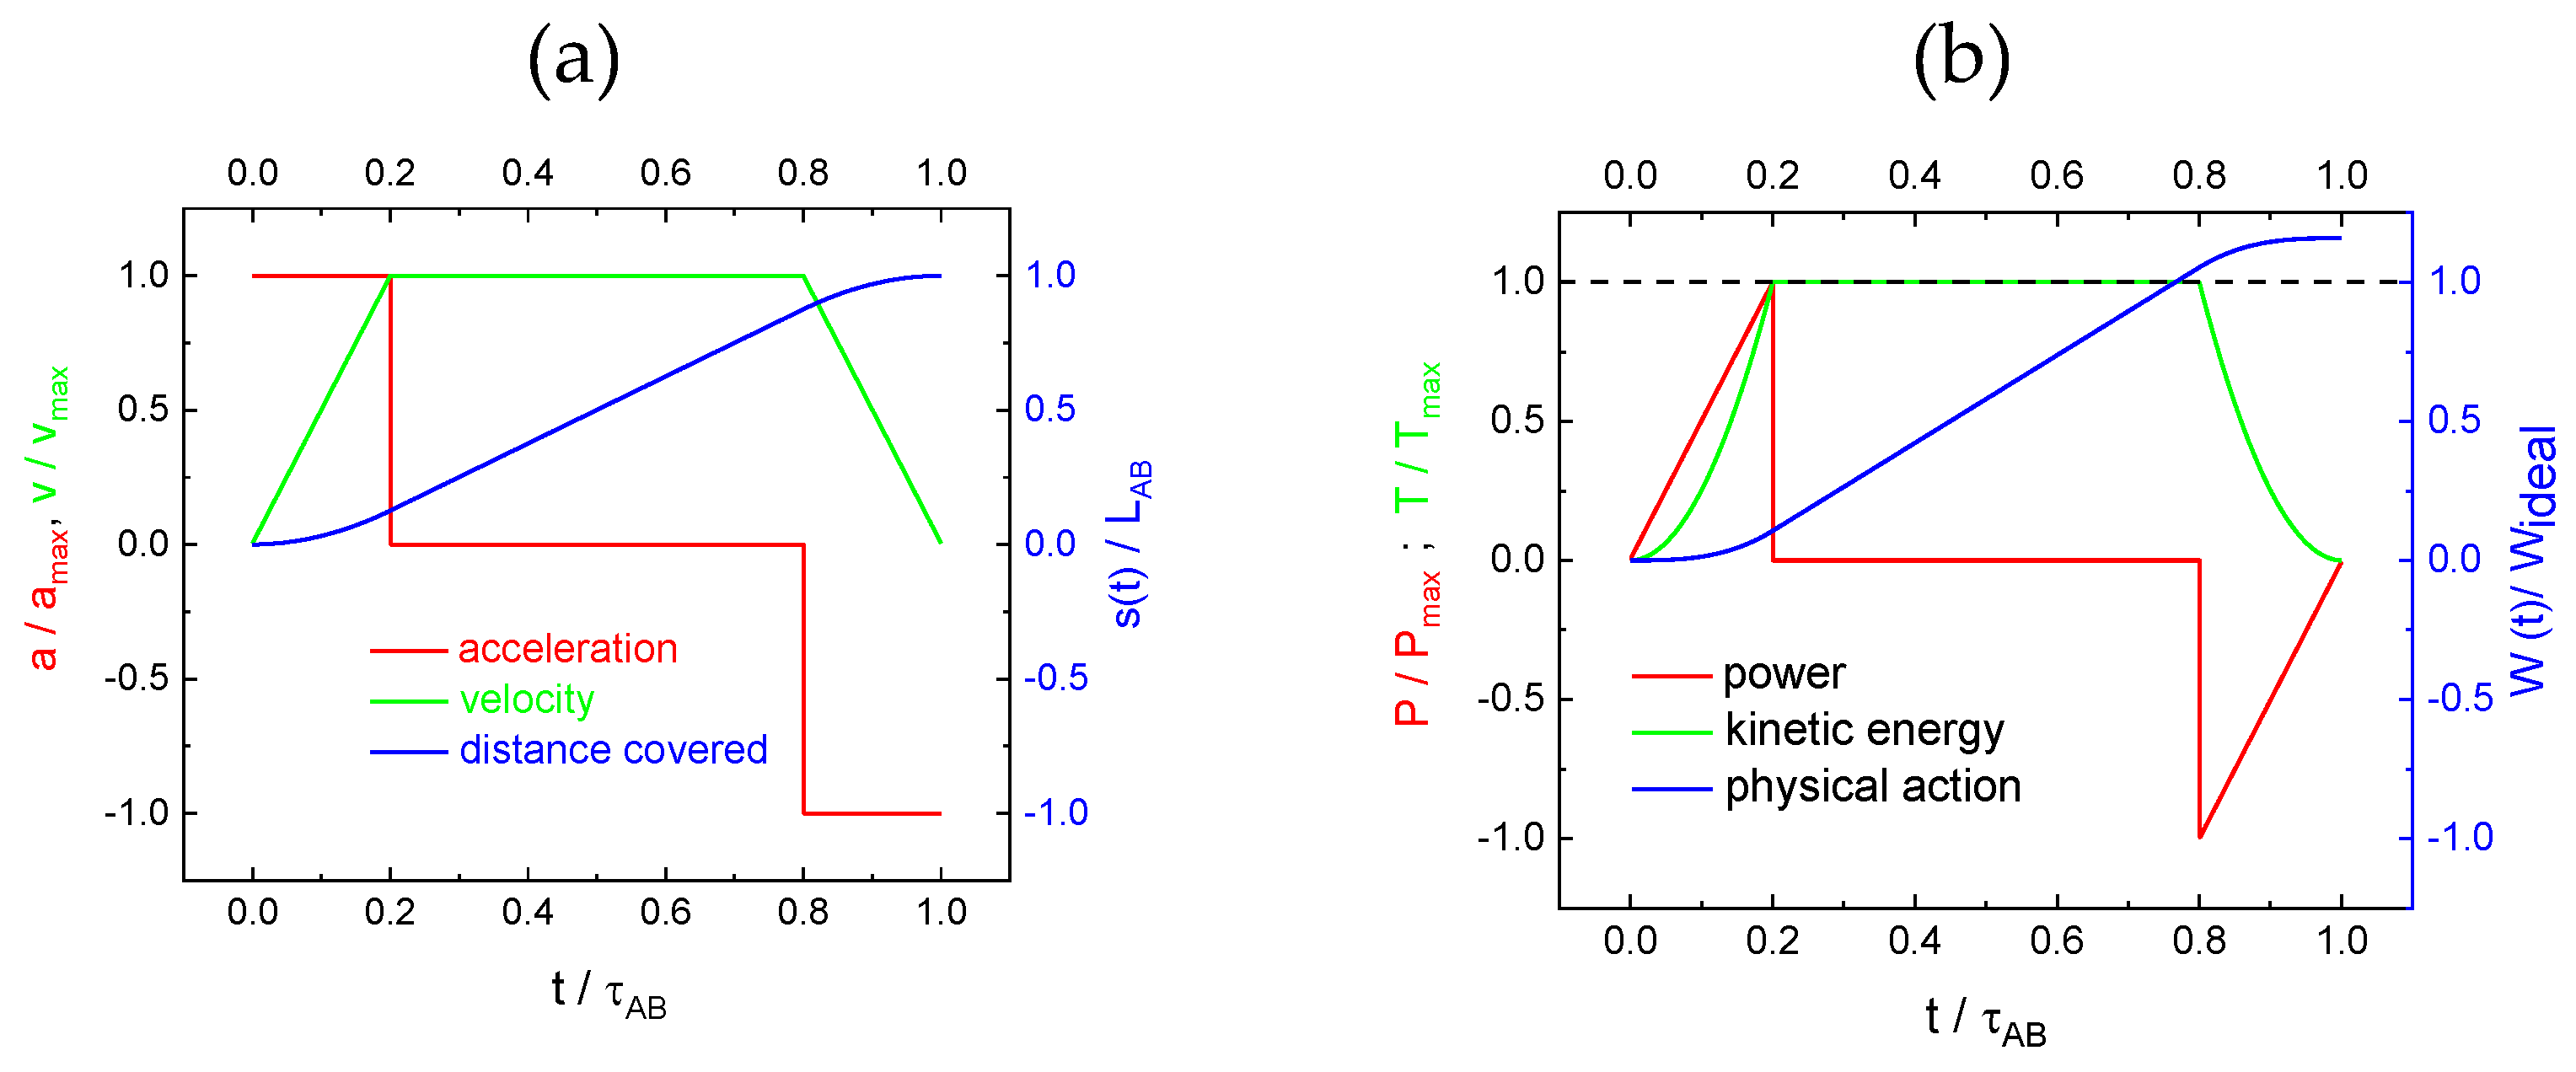
In Figure 4a we show acceleration (red) and speed profiles (green) as well as the fractional distance s ( t ) / L A B covered up to time t (blue), all as functions of the fractional transport time t / τ A B . In this first example we have assumed δ = 0.2 τ A B . Figure 4b, on the other hand, shows the engine and brake power profiles (red) delivered to the mass M close to points A and B , as well as the resulting kinetic energy profiles T t (green), both plotted once again against the fractional transport time t / τ A B . Also shown for comparison is the physical action W ( t , δ ) (blue) attained after time τ A B and as normalized to the physical action W A B ( M , L A B , τ A B ) that had been attained at the end of the “fly-through” scenario in Section 3.1 above.
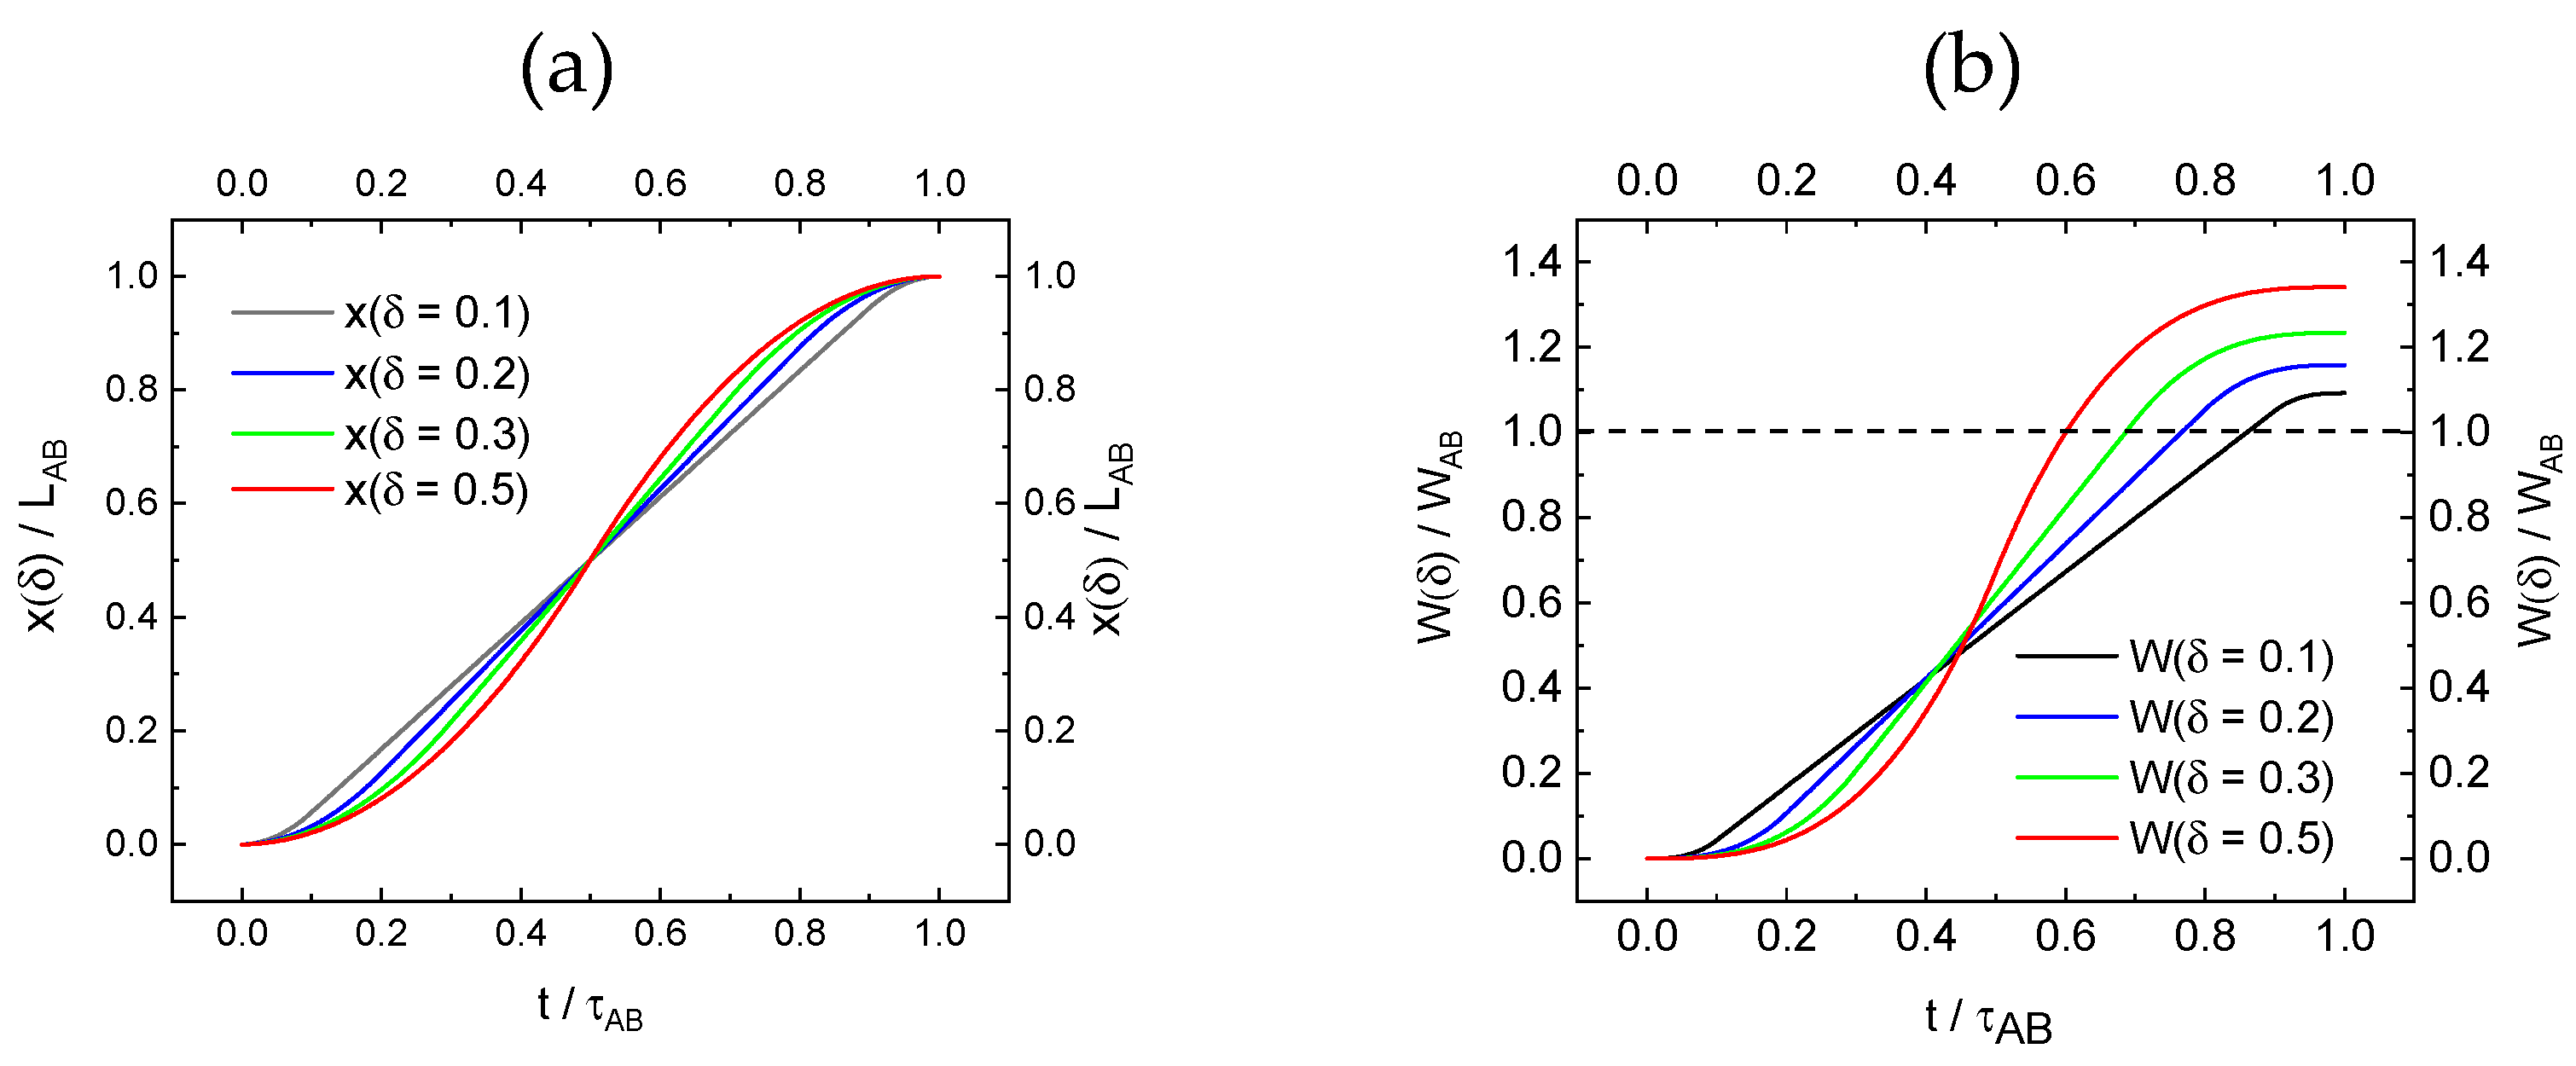
Figure 5a,b, on the other hand, compare start-stop scenarii with increasingly longer acceleration and deceleration lengths δ . While Figure 5a shows that, independent of δ , all trajectories converge at endpoint B after the time τ A B , Figure 5b shows that trajectories with larger δ ´ s converge to increasingly larger values of transport value W A B as these approach endpoint B . With the principle of least action in mind [6,7], such an increase is expected as in a “start-stop”-scenario, mass M had no longer been moving in a force-free field, but rather needed to be accelerated by engine forces close to point A and decelerated by brake forces close to point B . Such acceleration and braking procedures are obviously associated with pieces of extra physical action and extra energy expense.
In order to arrive at more quantitative results concerning transport value generation and energy consumption, we note that the increase in physical action with increasing δ as displayed in Figure 5b is given by:
W s t a r t _ s t o p M , L A B , τ A B , δ = W A B M , L A B , τ A B 1     4 3 δ τ A B 1 δ τ A B 2 .
Here, W A B M , L A B , τ A B once again is the intrinsic value of a transport service that is obtained upon moving a mass M within a force-free field along a distance L A B in a time τ A B . The other item of interest is the kinetic energy T that needs to be generated to initiate the “start-stop” scenario close to point A, and the energy which needs to be withdrawn from mass M to bring it to rest at point B :
T M , L A B , τ A B , δ =   1 2 M v ( δ ) 2 =   1 2 M L A B τ A B 2 1 δ τ A B 2 .
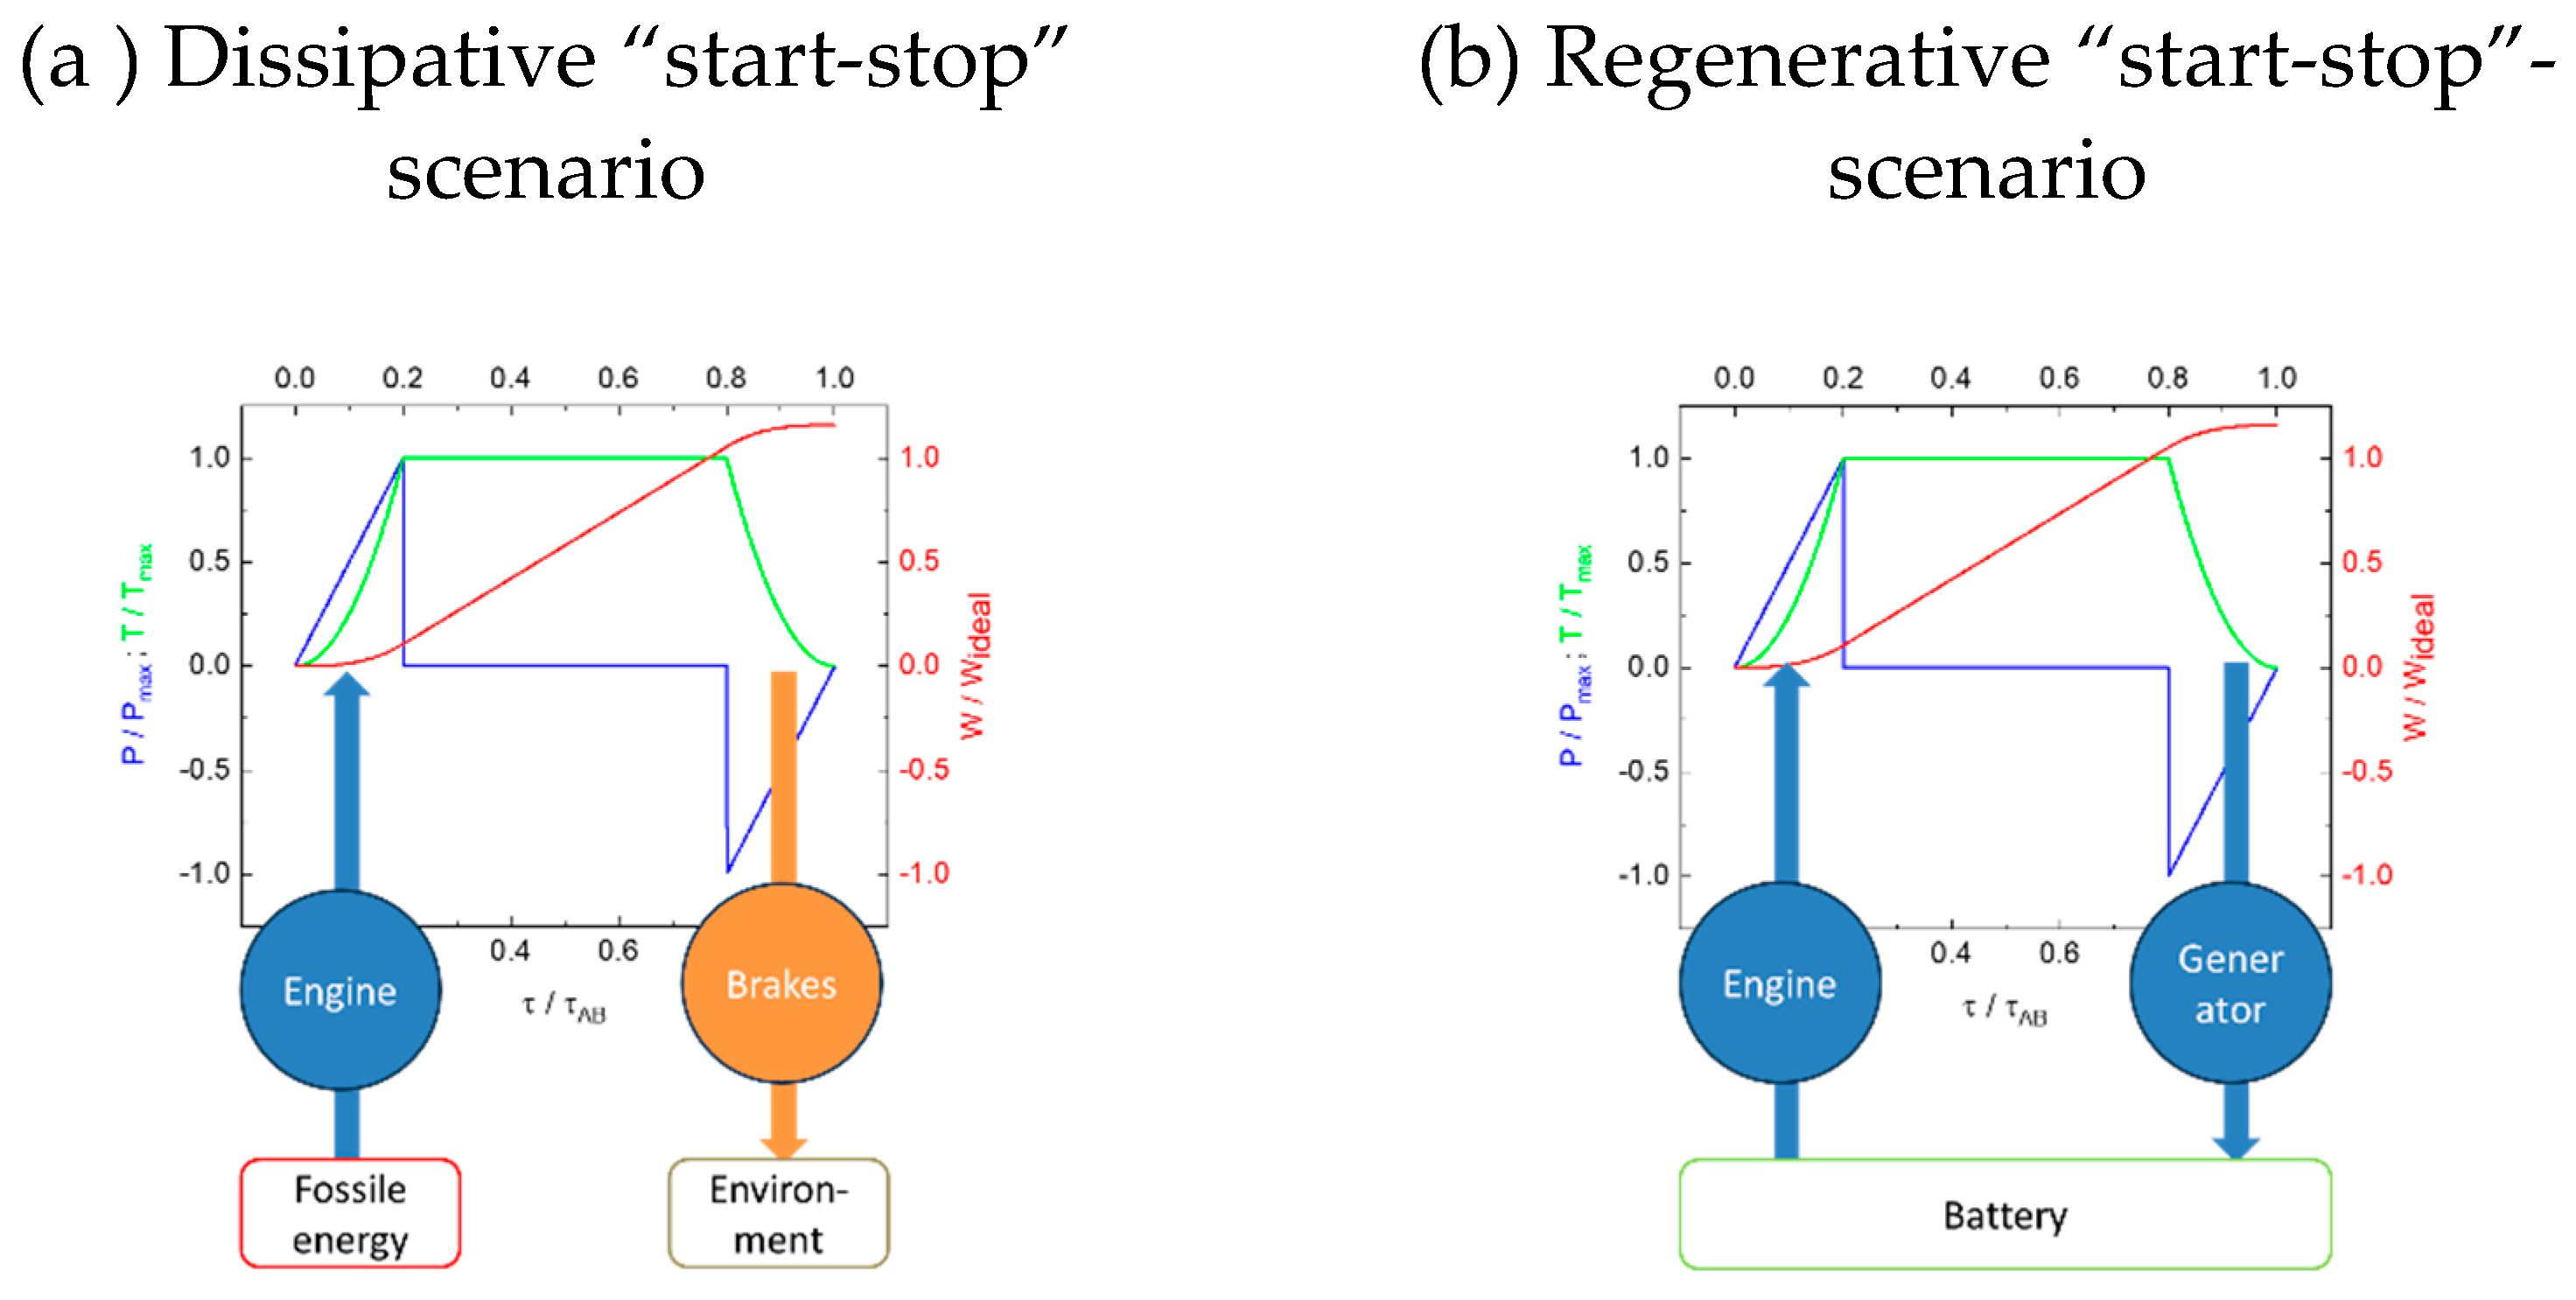
In order to address the issue of energy consumption, we compare in Figure 6 the traditional approach of generating transports by the use of internal combustion engines and dissipative brakes (Figure 6a), and in Figure 6b an all-electric scenario in which electrical energy is converted into mechanical energy close to point A and in which the generated mechanical energy T M , L A B , τ A B , δ is recuperated into electrical energy by reverse-operating the electrical engine as a generator upon approach to point B .
Turning to the internal combustion scenario first, we note that in order to initiate the transport, the kinetic energy T M , L A B , τ A B , δ first needs to be generated by an internal combustion engine in which the chemical energy E c h e m in the fuel is converted into mechanical energy E m e c h with an efficiency of η e n = E m e c h / E c h e m 0.3 0.4 [8]. Due to the limited engine efficiency, a relatively large amount of chemical energy needs to be used to generate the kinetic energy that is needed to initiate transport:
E a c c M , L A B , τ A B , δ = 1 η e n   T M , L A B , τ A B , δ .
In the deceleration phase the kinetic energy T M , L A B , τ A B , δ is irreversibly dissipated into heat by means of frictional braking [9] with an efficiency η b r a k e = 1 [9]:
E d e c M , L A B , τ A B , δ = T M , L A B , τ A B , δ .
Summing up both contributions, the total amount of chemical energy is obtained that has ultimately been converted into low-temperature heat:
E d i s s M , L A B , τ A B , δ = E a c c M , L A B , τ A B , δ + E d e c M , L A B , τ A B , δ .
Dividing the transport value that had been generated through the energy E d i s s , the benefit-to-cost ratio B C R of mechanical motion is obtained:
B C R s t a r t _ s t o p M , L A B , τ A B , δ = W s t a r t _ s t o p M , L A B , τ A B , δ E d i s s M , L A B , τ A B , δ
Rearranging Equations 13-18, one obtains
B C R s t a r t _ s t o p M , L A B , τ A B , δ = η e n 1 + η e n τ A B 1 4 3 δ τ A B
In the limit of transport paths L A B long compared to the acceleration and deceleration phases close to points A and B and in the limit of ideal engine efficiency of η e n = 1 , the benefit-cost ratio reduces to :
B C R s t a r t _ s t o p M , L A B , τ A B , δ = 0 = 1 2 τ A B = 1 2 L A B v A B .
In this latter form, the function B C R s t a r t _ s t o p highlights the effect of decreasing benefit-to-cost relationships when the speed of transport is increased and its time-demand being limited.
Figure 6. Converting money value contained in stored energy into money value associated with mechanical motion; (a) energy flow during mechanical transport with the help of an internal combustion engine and dissipative brakes [9]; (b) initiation of transport with the help of an electrical motor and recuperation of energy by generating electrical energy during braking.
Preprints 137633 g006

3.3. Frictional Transport Scenarios

The transport scenarii discussed above still represent highly idealized versions in that these completely neglect the effects of friction. In a friction-dominated transport scenario, acceleration and deceleration processes are the result of an interplay of forward-driving engine ( F e n ) and retarding frictional forces ( F f r ), giving rise to a stationary velocity v A B  (Figure 7a):
M d v ( t ) d t =   F e n F f r   = 0
In road-traffic situations, cars usually experience frictional forces which scale quadratically with the momentary speed v t [10]:
F f r t =   1 2 ϱ a i r   A   C d v ( t ) 2 .
In this equation, v ( t ) its momentary velocity, ϱ a i r   the air mass density, C d the dimensionless air drag resistance, and A   the cross-sectional area of the vehicle.
Considering long transport distances L A B in which acceleration and deceleration phases close to start-points A and endpoints B do not play significant roles, engine power P e n = F e n v A B needs to be constantly applied to overcome the effect of air friction and to maintain a constant speed v A B :
P e n v A B = 1 2 ϱ a i r   A   C d v A B 3 .
Double integration over the transport time τ A B first yields the input in energy that is required for maintaining the speed v A B over the entire transport length L A B and then the physical action that is associated with the frictional transport over this same distance. With τ A B =   L A B / v A B the total energy input along the transport length L A B emerges as
E f r L A B , v A B = 1 2 ϱ a i r   A   C d v A B 2 L A B ,
and the generated transport value as:
W f r L A B , v A B =   1 4 ϱ a i r   A   C d v A B L A B 2 .
The benefit-to-cost ratio, resulting from Equations 24 and 25 once again leads back to Equation 19 with δ = 0 . Depending on the engine power involved to overcome the effect of air friction, very different values of B C R f r are obtained. In the internal combustion scenario (ic), with η e n 0.3 0.4 ,
B C R i c M , L A B , τ A B , δ = 0 1 6 L A B v A B = 1 6 τ A B
is obtained. In the all-electric scenario (el.), in which η e n 1 , this same quantity transforms into
B C R e l M , L A B , τ A B , δ = 0 1 2 v A B L A B = 1 2 τ A B
With the values of B C R having the physical dimension of time, B C R values can be interpreted in terms of energy relaxation times τ E , i.e. as those fractions of the total transport time τ A B in which the transport-enabling energy had stayed with the transported mass M .
Preprints 137633 i001
Figure 7a: Start-stop scenario with δ = 0 and frictional forces acting along the transport path L = A B . Arrows denote the direction of the transport (red), the inputs in engine energy (blue) and the withdrawal of energy through air friction and braking (brown). Energy relaxation times τ f in friction-limited transport scenarios are normally in the order of several minutes [10,11]. Figure 7b: Left-hand ordinate: Physical action versus distance attained for frictional transport ( W f r ) , and frictionless “fly-through” transport ( W A B ), all plotted versus transport length. Right-hand ordinate: transport value of frictional transport relative to frictionless “fly-through” transport versus transport length. In the evaluation a constant speed of v A B = 100 k m / h had been assumed. The crossover point at L A B 4 k m is only weakly dependent on v A B .
The most interesting aspect in the context with frictional motion arises when the frictional transport scenario is compared to a frictionless start-stop scenario with δ = 0 , in which the same mass M is transported over the same length L A B and with the same average speed v A B . While in this frictionless case the transport value increases linearly with the transport length L A B (see Equations 10 and 13),
W A B s t a r t s t o p M , L A B , τ A B = 1 2 M v A B L A B ,
The transport value in the frictional case in creases proportionately to L A B 2 (Equation 25).
These different length dependencies are compared in Figure 7b, showing that there is a cross-over point between the frictionless and the friction-dominated “start-stop” transport scenarii at a transport lengths of around 4 k m . This cross-over indicates that at shorter distances inertial forces play a dominant role in requiring engine power inputs to initiate motion, while at larger distances engine power requirements and associated fuel consumption are increasingly dominated by frictional forces. With regard to traffic optimization this means that in the inertia-dominated domain the generation of transport value is in the hands of drivers and their decisions of applying acceleration and deceleration forces, while in the friction-limited transport domain the avoidance of excessively long transport distances and compliance with speed limitations are the parameters of choice which help to optimize transport values towards economic and environmental constraints.

4. Going Across Hills and Valleys

So far, we have been considering one-dimensional transport scenarii which take place on an equipotential plane, i.e. in a direction perpendicular to the earth´s gravitational field. In this section we turn to scenarii in which the transported mass M takes excursions in vertical direction, i.e. in directions along the earth´s gravitational field. In such scenarii different kinds of motion become relevant which arise from the interference of gravitational forces, which are road-specific, and engine forces, which are driver-specific. In the following we will call these different kinds of forces “profile forces” and “control forces”.

4.1. Profile and Control Forces

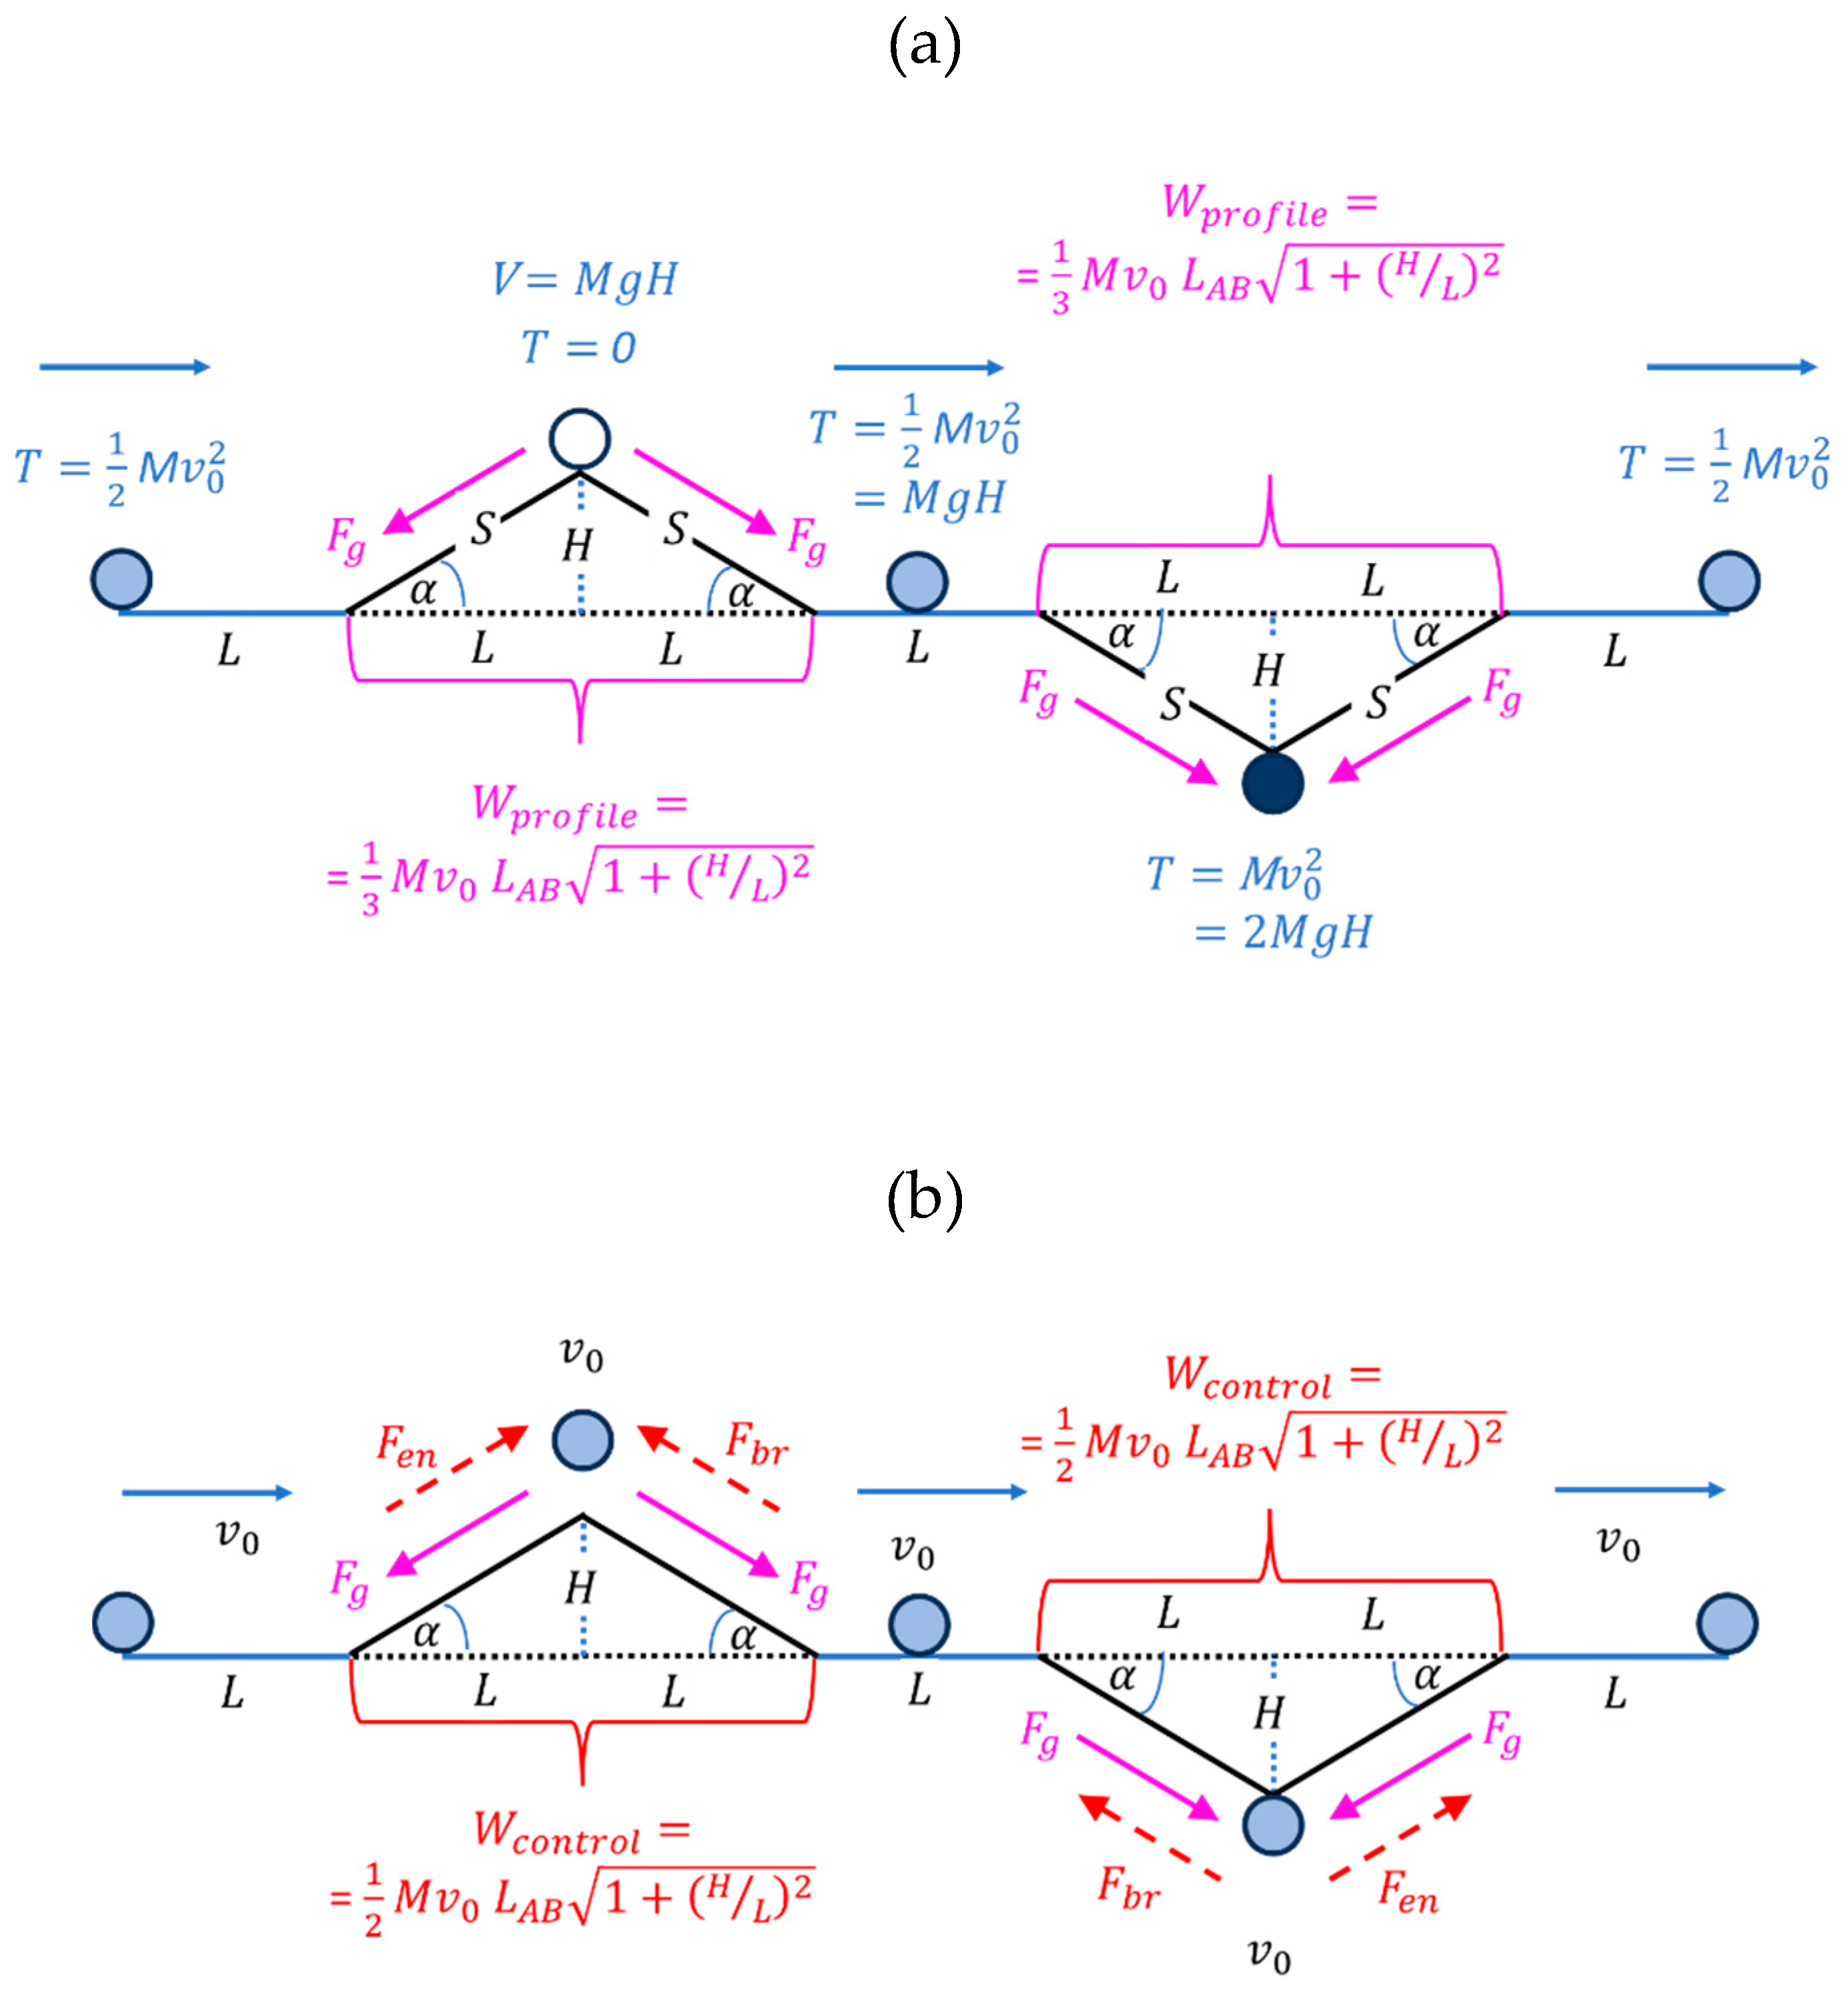
In Figure 8a we consider a frictionless road scenario in which a mass M moves in a straight line across an equipotential plane, interrupted by an intermediate hill- and a valley section. Inside these hill and valley sections, mass M experiences gravitational forces whose magnitudes are solely determined by the specific road profile, and which therefore constitute “profile forces”. In order to allow mass M to climb up to the summit point of the hill section on the left and to proceed further towards the right through the valley section, mass M needs to start its journey on the left with a kinetic energy that overwhelms the potential energy of mass M on the summit point of the hill section:
1 2 M v m i n 2 M g H   ;   v m i n ( H ) 2 g H .
In this latter equation H is the summit height, g the gravitational constant, and v m i n the minimum velocity upon start-up at point A . Choosing the minimum possible velocity v 0 = 2 g H upon start-off, Figure 8a shows that the summit point of the hill section will be passed with zero velocity, while at the bottom of the valley section the speed of mass M will have risen to v v a l l e y = 2 v 0 . Upon climbing up to the flat-land sections on the right, the initial speed of v 0 is recovered.
Assuming for the sake of definiteness that the entire road scenario consists of seven segments with individual lengths of L = 500 m , it is ensured that these segments are short enough to make inertial forces the dominating forces that determine the motion of mass M throughout the entire scenario. With the vertical extensions of the hill and valley sections not exceeding H = 50 m , slope angles α do not exceed slopes of about 6 ° . With this elevation in mind, the initial speed of mass M needs to be higher than v 0 110 k p h to ensure that the summit point of the hill section will be crossed with zero speed. While on its downward journey from the hill, mass M regains its initial speed of v 0 , it speeds up to v v a l l e y   160 k p h at the deepest point in the valley section. With the kinetic energy gained, mass M finally climbs up to the right-hand side until it reaches its initial speed of v 0 110 k p h again. Considering this example, it is clear that any responsible driver would not go through such extremes. Most drivers, rather, will employ engine and brake forces to arrive at more moderate and roughly constant speeds all throughout the road scenario. Such a more realistic scenario is sketched in Figure 8b. There, engine and brake forces are employed to compensate the road-specific gravitational forces. As such engine and brake forces are subject to driver control, the scenario in Figure 8b is a demonstrator of “control forces”. Considering the energetic and entropic transport costs, the important difference between profile and control forces is that profile forces come for free, while control forces need to be generated by engines which require fuel that needs to be paid for in terms of money.
Turning to the scenario in Figure 8a first, the transport value gained upon traversing the hill and valley sections of length L A B = 2 L is
W p r o f i l e ( M , v 0 . L , H ) = 1 3 M v 0   L A B 1 + ( H L ) 2 .
Comparing this result to Equation 10, the square root factor in Equation 30 arises from the path elongation that had been enforced on mass M while following the upward- and downward slopes of the hill and valley sections. The lower prefactor of 1 / 3 derives from the time-varying speed of v ( t ) v 0 with which the mass M had been travelling throughout the hill- and valley sections.
In the frictionless control scenario shown in Figure 8b, a constant speed of magnitude v 0 is enforced all throughout the hill- and valley sections by compensating upward- and downward-dragging gravitational forces by additional engine- or brake-forces, respectively. With the enforced constant speed of v 0 , the transport value in Equation 31 returns to the same value as in Equation 10, except for the square-root-factor which once again accounts for the path elongation that is suffered in both vertical excursions:
W c o n t r o l M , v 0 L , H = 1 2 M v 0   L A B 1 + ( H L ) 2 > W p r o f i l e ( M , v 0 L , H ) .
The most interesting difference between the profile-force- and control-force dominated scenarii is revealed by considering the respective benefit-to-cost relationships. For reasons of symmetry and brevity, we confine ourselves to the case of hill-sections in both scenarii.
Returning to the profile-force-dominated scenario of Figure 8a, the related benefit-to-cost ratio becomes:
B C R p r o f i l e M , v 0 , L , H =   W p r o f i l e ( M , v 0 L , H ) 1 2 M v 0 2 + ( 1 2 M v 0 2 )
The first factor in the denominator derives from the fact that in the course of the upward travel, the input kinetic energy of T =   1 2 M v 0 2 of mass M is converted into potential energy until the condition V = M g H and T = 0   is attained on the summit. During the downward travel the gained potential energy is re-converted into the original kinetic energy of T = 1 2 M v 0 2 and made available for the onward travel through the equipotential section on the right. As overall, no energy had been transferred to mass M during the hill excursion, the physical action W p r o f i l e ( M , v 0 L , H ) that had been gained by mass M during the hill excursion, has been gained at zero energy cost, thus yielding an infinite benefit-to-cost ratio at the end of the hill excursion.
Turning to the control-force-dominated scenario in Figure 8b, the corresponding equation for B C R c o n t r o l becomes:
B C R c o n t r o l M , v 0 L , H =   W c o n t r o l ( M , v 0 L , H ) 1 2 M v 0 2 + 1 η e n E f u e l + ( 1 2 M v 0 2 E b r a k e )
In this latter equation the first term in the denominator accounts for the fact that the loss in the incoming kinetic energy of mass M and its conversion into potential energy is now compensated by the upwards driving engine forces that maintain the initial speed of v 0 . Under these circumstances, mass M has acquired total energy of
E s u m m i t = 1 2 M v 0 2 + M g H .
upon reaching the summit point. During the downward travel, the potential energy V = M g H is re-converted into kinetic energy T =   1 2 M v 0 2 , thereby increasing the kinetic energy of mass M at the end of the hill section to T d o w n = 2 T . In order to maintain a constant speed of v 0 the increase of the kinetic energy beyond T =   1 2 M v 0 2 needs to be dissipated by brake forces, thus reducing the kinetic energy to T =   1 2 M v 0 2 during the entire onward travel through the equipotential section on the right. With
1 η e n E f u e l = 1 2 M v 0 2 ,   E b r a k e = 1 2 M v 0 2 ,   and   1 2 M v 0 2 = M g H ,
Equation 34 reduces to
B C R c o n t r o l M , v 0 , L , H = η e n 1 η e n 1 2 v 0 g H L A B 1 + ( H L ) 2   .
Within an all-electric scenario with η e n = 1 , the recuperation of the control energy upon braking again yields
B C R e l e c t r i c M , v 0 L , H ,
which corresponds to another kind of frictionless “fly-through” scenario. In a fossil-fuel scenario, in contrast, with η e n 0.3 -0.4, the related benefit-to-cost ratio attains a finite value, which reveals the energetic and money cost of speed control.

4.2. Moving Long Distances Towards Higher and Lower Locations

So far, we have been considering relatively short-range upward and downward excursions which require driver action, and which often result in additional fuel consumption. Considering journeys between two towns, A and B, separated by lateral distances of say L A B = 100 k m and a constant upward or downward slope in between, the dominating effect in generating transport value and in determining fuel consumption is air friction.
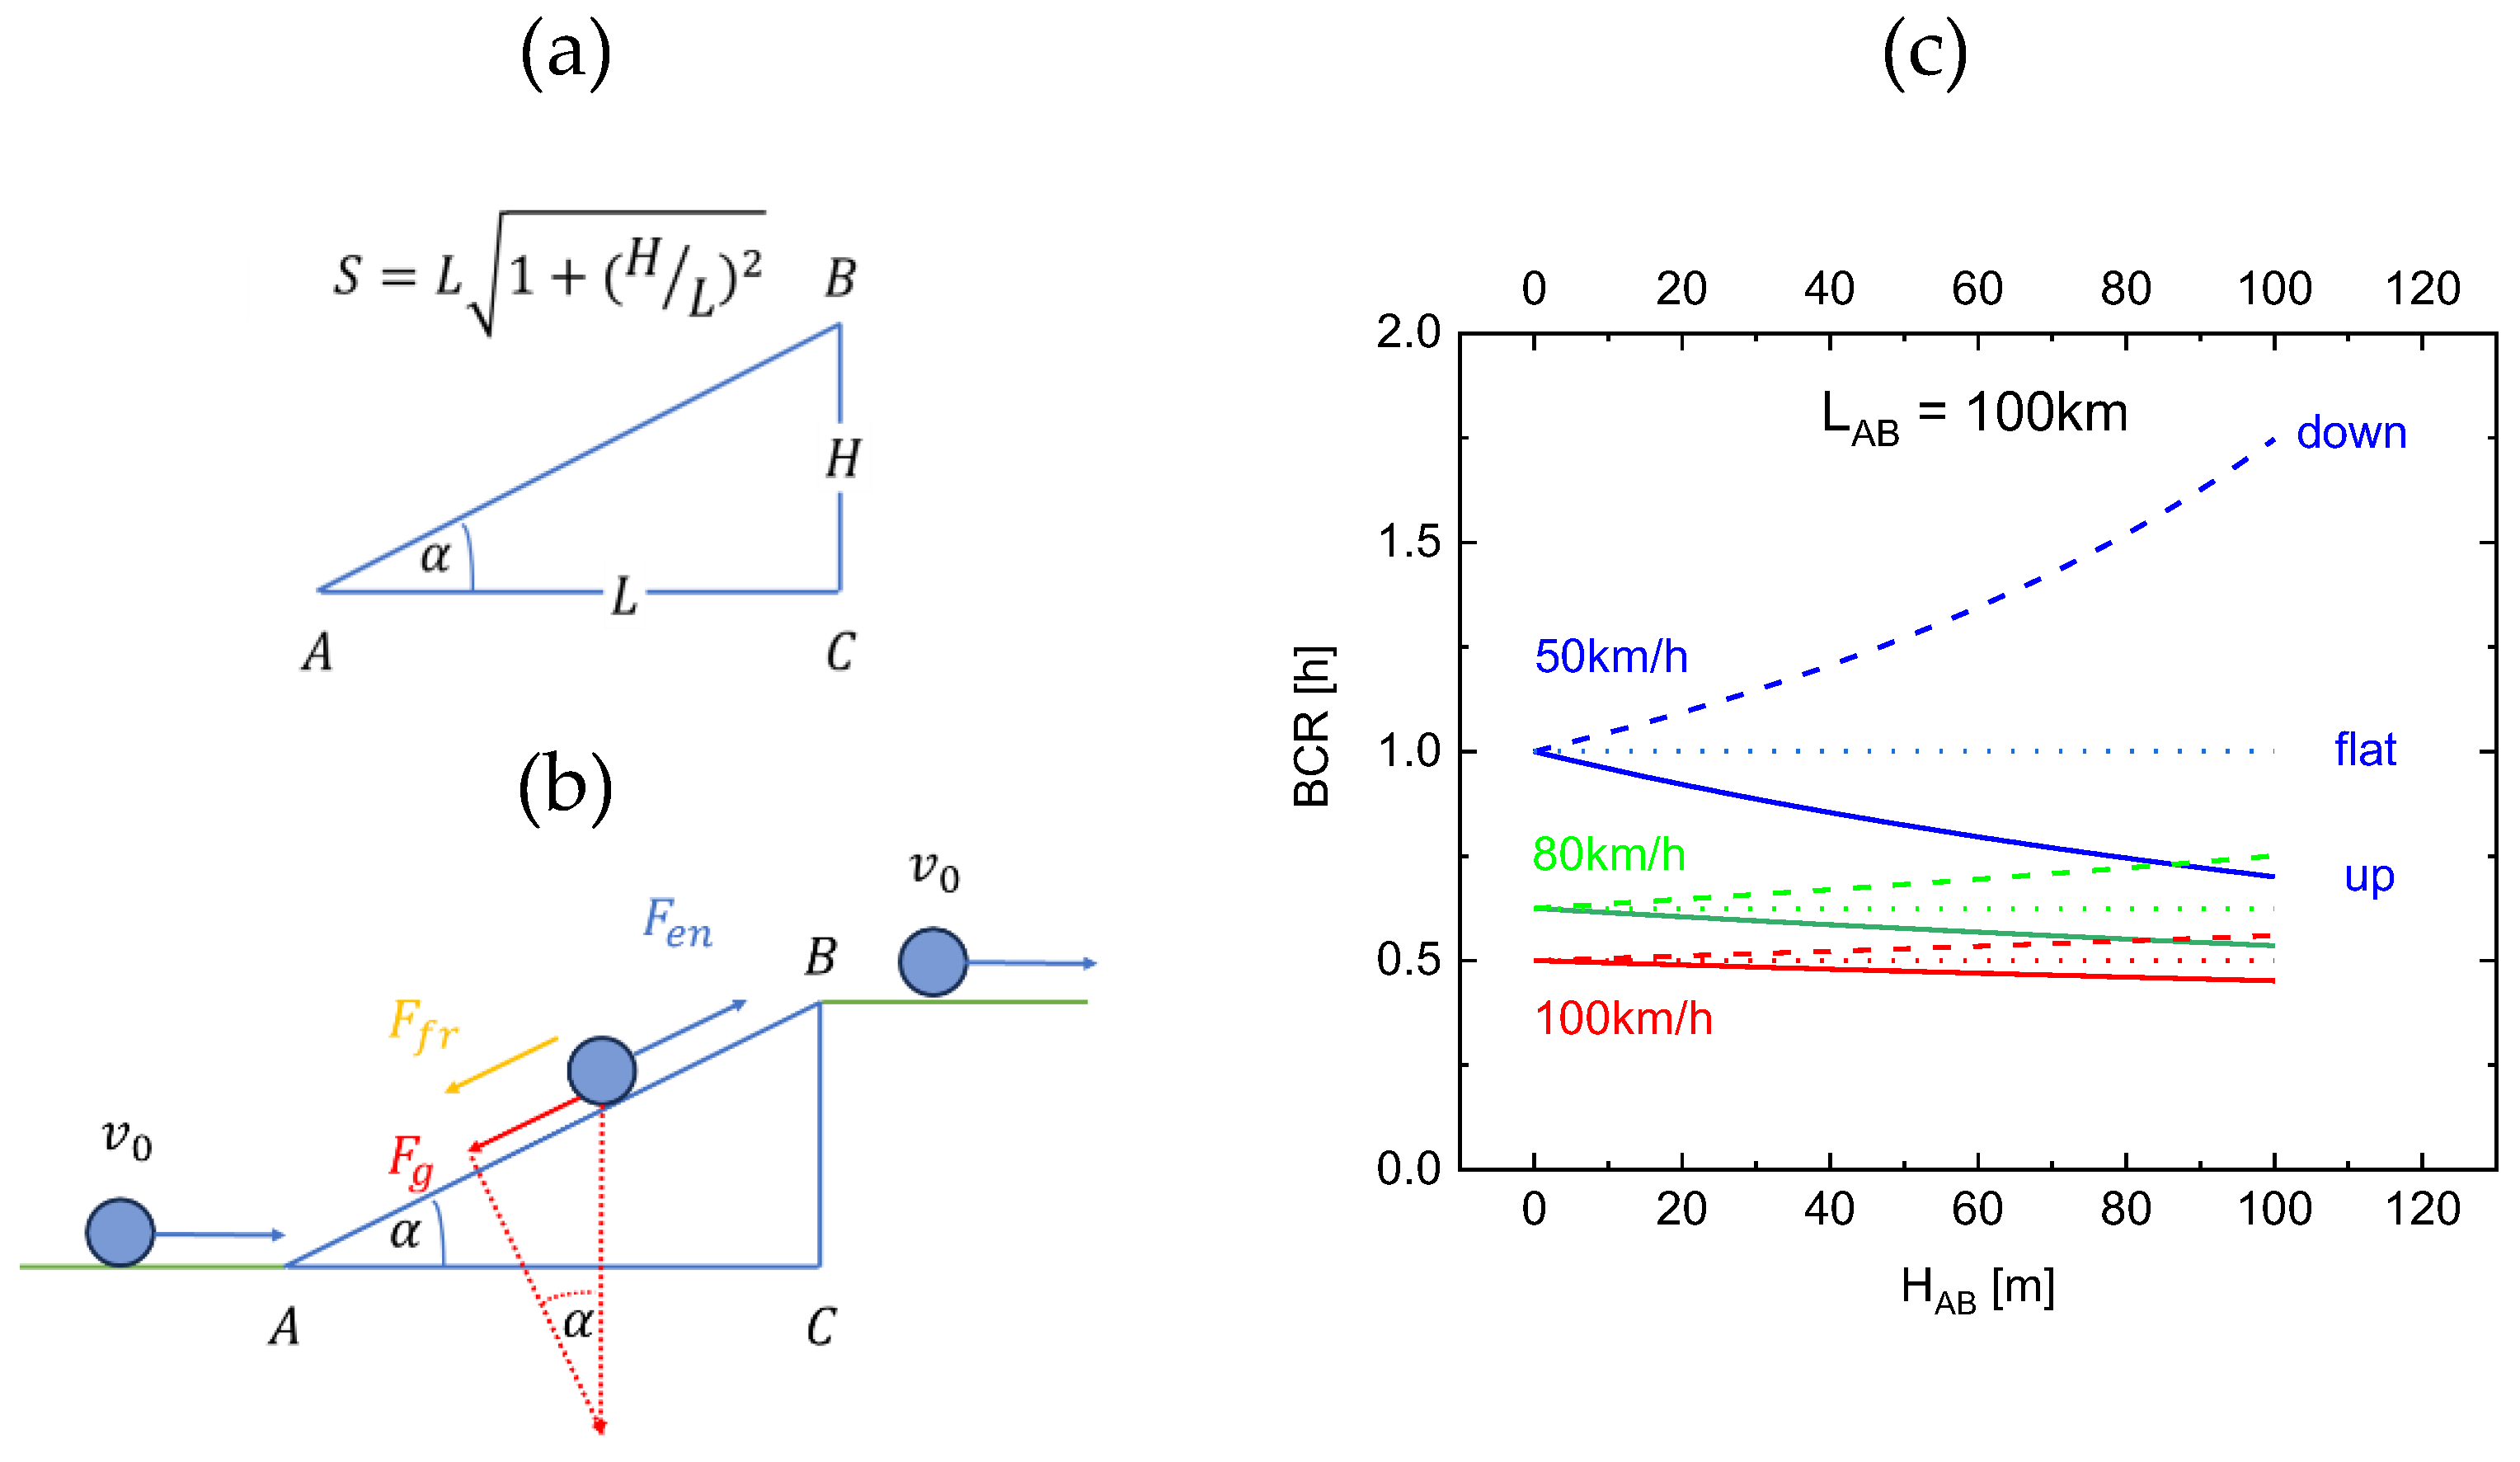
Moving uphill from A -town to B -town, distances S A B = L A B 1 + ( H A B L A B ) 2 larger than their lateral distance L A B again need to be covered. This first effect is illustrated in Figure 9a. With the downward-driving gravitational forces being compensated by engine forces, the vehicle is effectively moving on a flat surface, leaving the engine with the task of compensating for the air friction γ f r = 1 2 ϱ a i r C d A and working against the gravitational downward drag (Figure 9b). Once arrived at B -town, the generated transport value will be
W A B ( M , L A B , H A B ,   v A B ) = 1 4 γ f r v 0 S A B 2 ,
and the energy expense
E A B M , L A B , H A B ,   v A B = 1 2 γ f r v A B 2 S A B + M g H A B .
In the limit of small height differences H A B , the benefit-to-cost ratio becomes
B C R u p M , L A B , H A B , v A B = W A B ( M , L A B , H A B ,   v A B ) E A B M , L A B , H A B ,   v A B 1 2 S A B v A B + M g H A B γ f r v A B 3 ,
and
B C R d o w n M , L A B , H A B , v A B 1 2 S A B v A B M g H A B γ f r v A B 3
in the case of downhill travelling from B -town back to A -town. The resulting increases and decreases in transport value with height difference are shown in Figure 9c without resorting to low- H A B approximations above. This latter figure shows that differences in the elevation above sea level make a relatively large impact on B C R as long as transport speeds remain relatively low. At high speeds, the impact of geographic height on B C R diminishes, however, at the cost of significantly decreased overall levels of B C R . This latter effect again illustrates that high speeds are the dominant factor in causing unproportionately large levels of energy consumption.

5. Onboard Measurement of Transport Value

Summarizing the lessons learnt in Section 3 and Section 4, it can be seen that in all the scenarii covered so far, the benefit-to-cost ratio of mechanical transport basically depends on the distance L A B covered and the average speed v A B with which the respective transport had taken place:
B C R ( L A B ,   v A B ) ~   L A B v A B .
While such rough estimates of B C R are easy to obtain in cases in which the transport takes place on straight-line paths and with constant speed, the problem of obtaining meaningful values of B C R becomes challenging in case the transport takes place on a system of winding roads with large vertical excursions and thus, widely varying speeds. In such cases large deviations from the average B C R can take place, particularly, when speeds transiently may become very low:
d ( B C R ) d t   L A B v A B d v ( t ) d t v A B .
Problems of this kind frequently arise in stop-and-go traffic situations in big cities, or in traffic jams on motorways. Similar problems also arise on roads with large and frequently occurring vertical excursions. The problem of attaining reliable values of B C R in such more demanding situations can, however, be solved by making use of the advanced sensor technology that is nowadays routinely incorporated in modern cars.
Looking back on the development of the car industry in the past few decades, it is seen that much of this progress has been driven by the rapidly expanding use of sensor-, electronic and software technologies [12]. In this advance, two key developments stand out: this is firstly the global positioning system (GPS) [13] which allows the geo-location of vehicles to be continuously monitored with high precision. The second key innovation has been the widespread introduction of electronic stability control systems (ESP) in modern cars. Whereas work on anti-lock braking systems (ABS) [14] started out quite early, such systems have more recently evolved into full-scale electronic stability control (ESP) systems [15,16]. Such systems sense the momentary motion of cars and their orientation in 3d-space. By comparing the car´s motion to the driver´s intentions as signaled by the momentarily applied steering angle, ESP-systems apply brake forces to individual wheels to generate yaw momenta that align the car´s motion with the driver´s intentions. The key enabling technologies that enabled the introductions of such ESP systems where the advances in the field of micro-electro-mechanical (MEMS) technologies [17,18,19]. Such technologies allow silicon wafers to be shaped into small-scale mechanical structures which can be reversibly deformed by the action of linear and rotational accelerations and whose ensuing changes in electrical capacitance can then be used to generate electrical output signals in response to the eternally applied input mechanical forces.
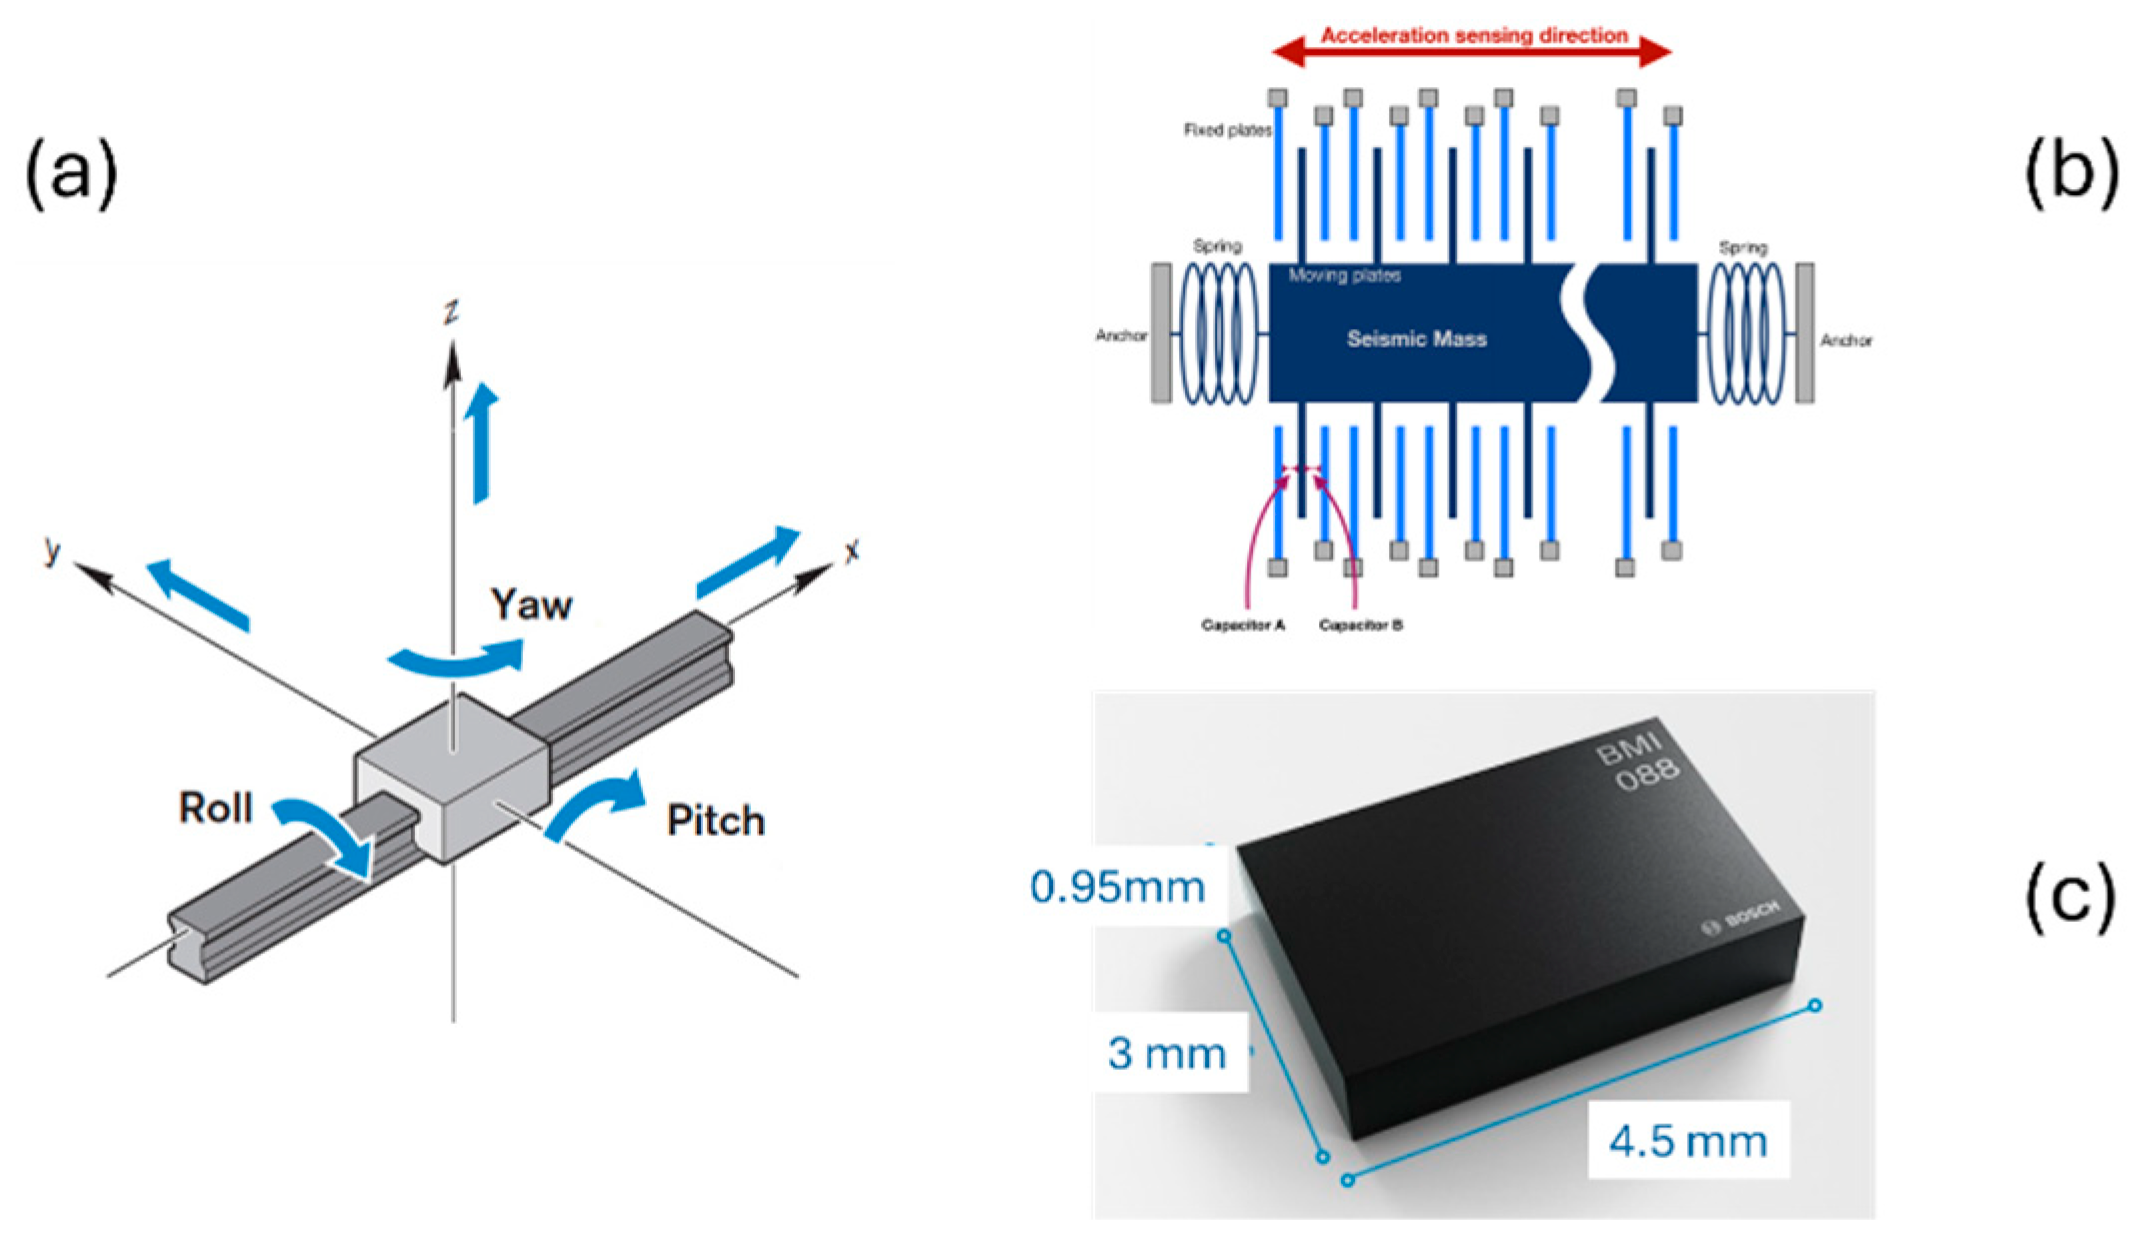
An example of such a MEMS micro-inertial sensor system is illustrated in Figure 10. As shown in Figure 10a, such systems are able to monitor linear accelerations in all three space directions and also rotational motions around all three space axes. As illustrated in Figure 10b, such sensors are implemented as silicon-micromachined spring-mass systems which take the form of interdigital capacitors for enabling electrical readout of the mechanical input measurands [20,21,22]. Due to the rapid development of MEMS (micro-electro-mechanic systems) technologies [17,18,19], such sensors have evolved into the form of low-cost microelectronic chips (Figure 10c), a development that has led to the rapid adoption of this technology not only in the car industry but also in a huge range of consumer products such as smart phones and all kinds of gaming equipment. In the car industry the driving force in the adoption of ESP systems was the observation that the gradual introduction of ESP systems has led to significantly lower fatal car accidents. This positive effect had resulted in legislation that made the introduction of ESP systems in newly sold cars mandatory [15,16].
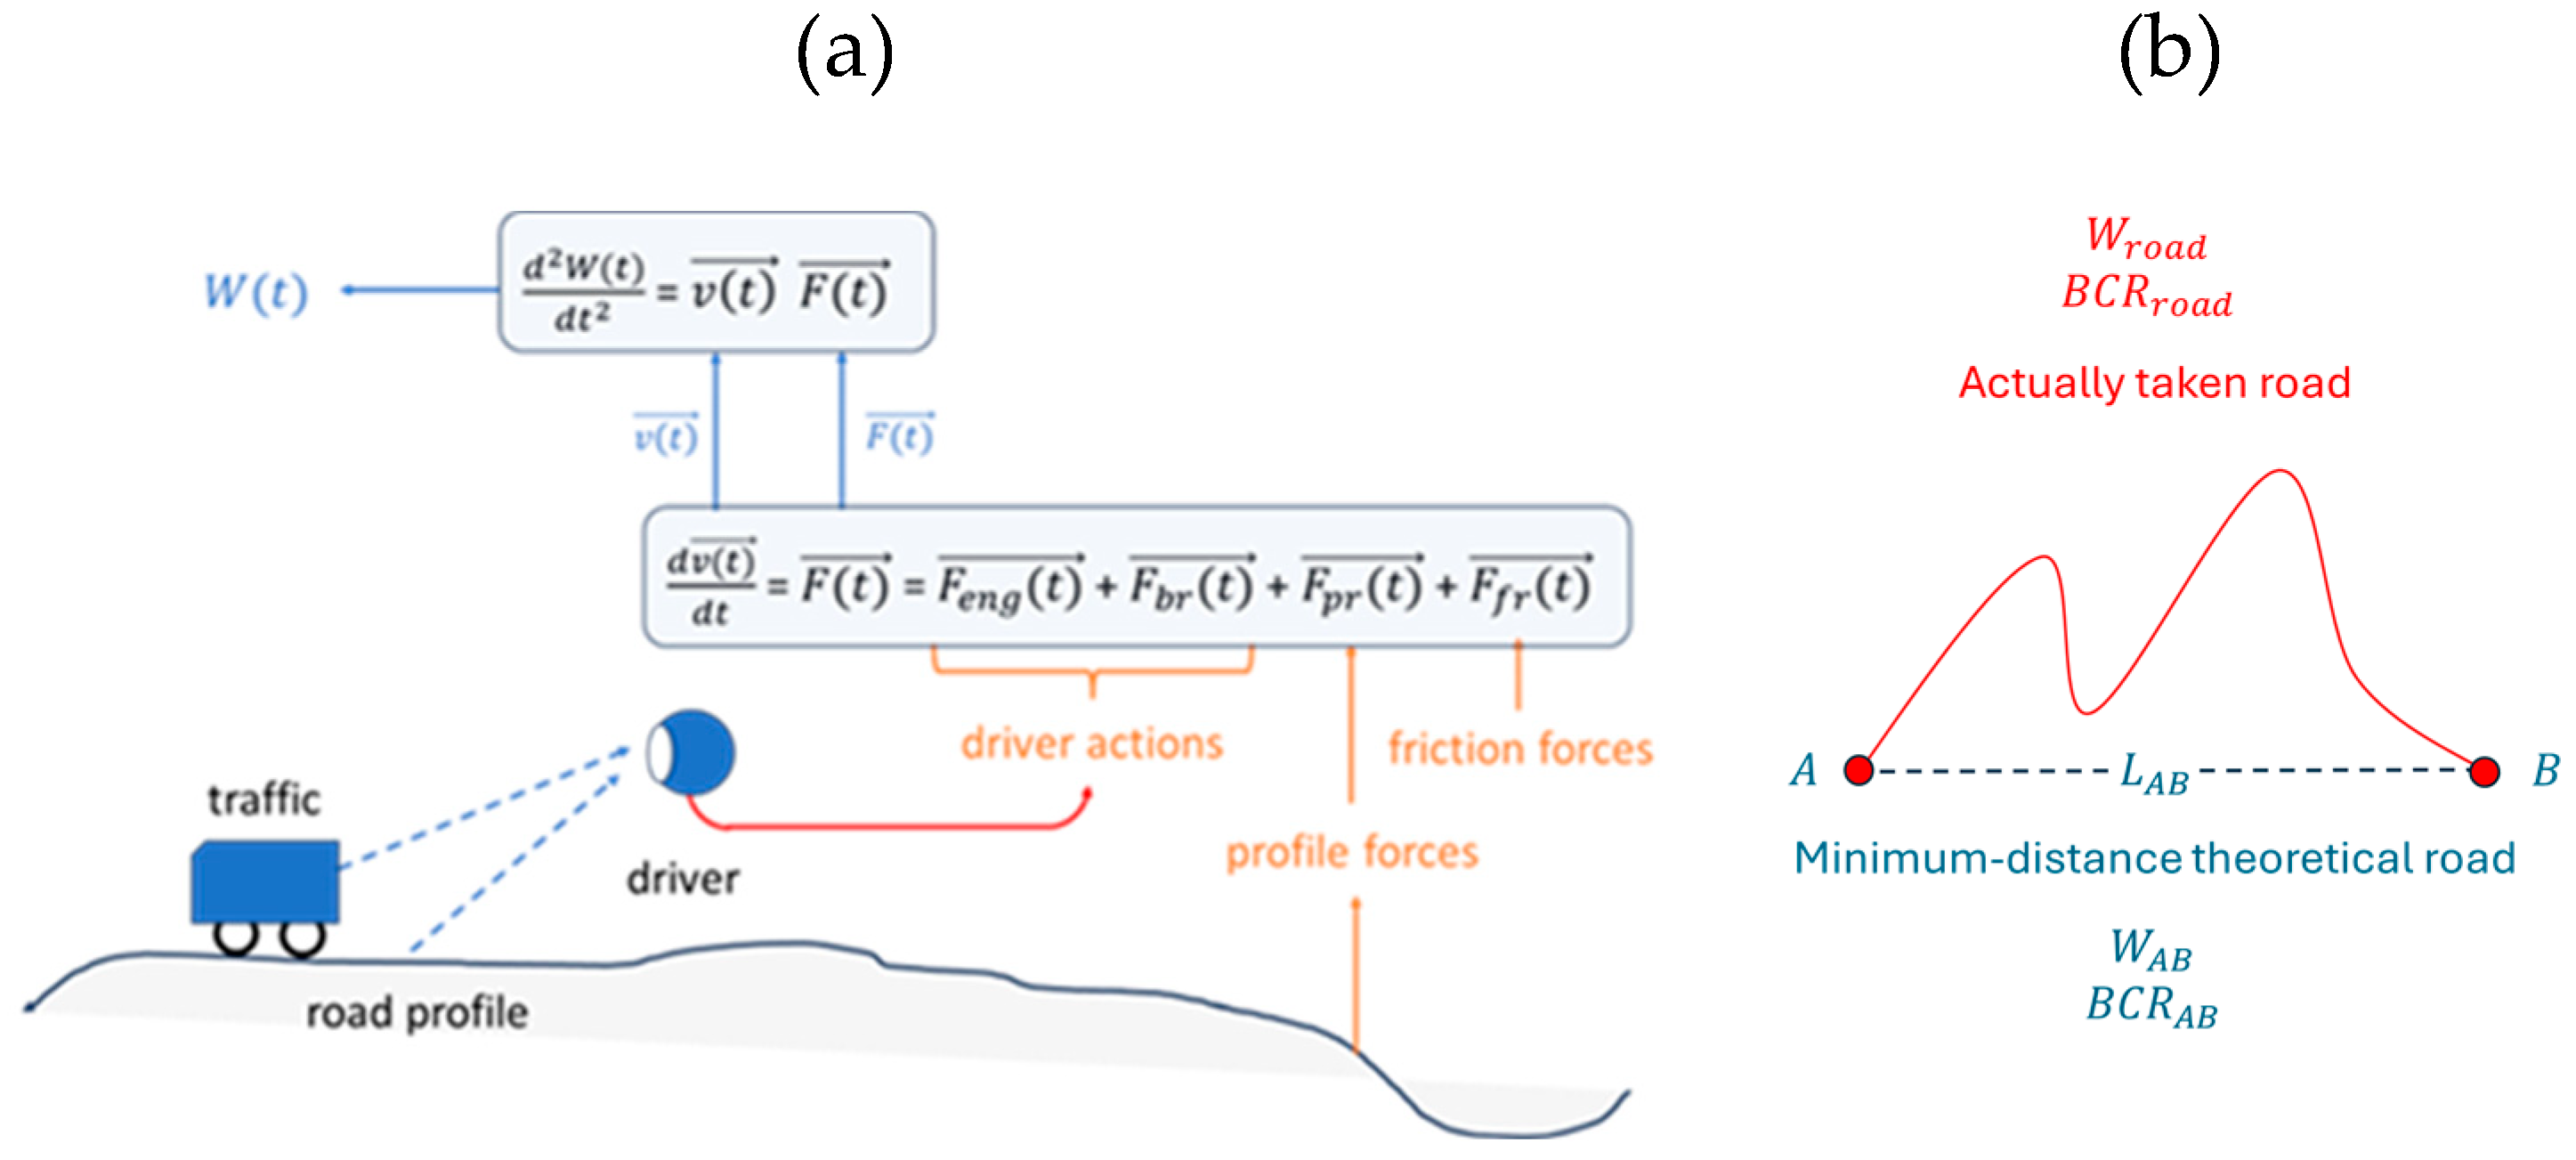
With newly produced cars routinely containing ESP systems, such systems can also serve the purpose of measuring the transport value of mechanical motion and assessing the efficiency of transport services with the help of the mathematics developed in previous sections. Building on the general principles laid out in Section 2 and the application examples discussed in Section 3 and Section 4, the technical implementation of a motion monitoring system is drawn up in Figure 11. In the system sketched there, car-internal sensors are being used to measure the input of engine and brake forces on wheels and a micro inertial sensor system is used to measure the impact of acceleration and brake forces on the car´s motion into the intended direction of motion. With the added capability of measuring roll, pitch and yaw angles, there is also the possibility of measuring the road orientation and determining upwards- and downward-sloping road orientations and assessing the resulting profile forces. With the help of additional implemented sensors it is also possible to measure control forces in reaction to the profile forces that are impressed by the road orientation. With all force and velocity components being known, the engine and gravitational input powers can be combined into dot products and inserted into the differential equation yielding the motional value W ( t ) . In this way, the actually generated transport value can be determined directly from the driver´s actions while following the chosen road connecting start- and endpoints A and B . Following the arguments presented in sections 2, 3 and 4, the actually generated transport value can then be compared to the minimum possible transport value that would arise if the transport had taken place along a fictional road connecting A and B while following the inclined straight line with constant velocity v A B (Figure 11b). In this way, the level of non-ideality of transport can be determined and possibilities for attaining better transport efficiency can be identified.

6. Summary and Conclusions

In the current state of the art, the value of transport services is measured in money units, i.e. in a way that involves many hardly quantifiable parameters which are often hard to line up with the energetic and environmental footprint of the related transport services.
In the present paper we have proposed a new way of measuring the value of practically employed transport services that is based on physically accessible parameters which can be retrieved from electronic and sensory equipment routinely implemented in modern cars.
While these underlying hardware innovations had in the past been driven by the core interests of navigation and traffic safety, the current paper opens up a new perspective by showing in which way this existing electronic and sensory hardware can be used to assess the physical value of practically occurring transport services and their related energetic and environmental footprints. With such data at hand, more appropriate pricing policies may become possible in the future.
In the present state of the art the paper is in the state of an openly distributed invention that still requires a whole lot of practical testing and software development downstream to this paper.

Funding

This research received no external funding.

Institutional Review Board Statement

Not applicable.

Data Availability Statement

All relevant data are contained in the above paper.

Conflicts of Interest

No conflicts of interest.

References

  1. Pooley, C.G. Mobility and History: Framing the Argument. In: Mobility, Migration and Transport. Palgrave Studies in Migration History. Palgrave Macmillan, Basingstoke, Hampshire, England, 2017; [CrossRef]
  2. Dominguez-Mujica, J. Global Change and Human Mobility. Springer, Singapore, 2016, . [CrossRef]
  3. Domínguez-Mujica, J. Global Change and Human Mobility in the Anthropocene. In: Bański, J., Meadows, M. (eds). Research Directions, Challenges and Achievements of Modern Geography. Advances in Geographical and Environmental Sciences. Springer, Singapore. 2023; [CrossRef]
  4. Meekan, M.G.; Duarte, C.M.; Fernández-Gracia, J.; Thums, M.; Sequeira, A. M.M.; Harcourt, R. ; Eguíluz, V.M. The Ecology of Human Mobility. Trends in Ecology & Evolution 2017. Volume 32, pp. 198-21, . [CrossRef]
  5. R. H. Ballou, R.H.; Business Logistics/Supply Chain Management. Planning, Organizing, and Controlling the Supply Chain. 5th edition. Upper Saddle River, 2004, ISBN 0-13-149286-1.
  6. Goldstein, H, Poole, Ch., Safko, J. Classical mechanics,3rd ed. Addison-Wesley, San Francisco, USA, ISBN 0-201-65702-3.
  7. Nolting, W. Grundkurs Theoretische Physik 2 – Analytische Mechanik, 8th ed. Springer: Berlin, Heidelberg, New York, Germany, 2006, pp. 198–116.
  8. Internal combustion engine. Available online: Wikipedia (accessed on 17/09/2024).
  9. Brake. Available online: Wikipedia (accessed on 17/09/2024).
  10. Drag coefficient. Available online: Wikipedia (accessed on 17/09/2024).
  11. Vehicle Coefficient of Drag List. Available online. Vehicle Coefficient of Drag List - EcoModder Forum Wiki (accessed on 17/09/2024).
  12. Automotive electronics - Wikipedia. Available online: Wikipedia (accessed on 17/09/2024).
  13. Global Positioning System – Wikipedia. Available online: Wikipedia (accessed on 17/09/2024).
  14. Anti-lock braking system - Wikipedia. Available online: Wikipedia (accessed on 17/09/2024).
  15. Electronic stability control - Wikipedia. Available online: Wikipedia (accessed on 17/09/2024).
  16. Electronic Stability Control – Safety. Available online: Electronic stability control - European Commission (europa.eu).
  17. MEMS - Wikipedia. Available online: Wikipedia (accessed on 17/09/2024). (accessed on 17/09/2024).
  18. Layton, R.A. Introductory MEMS. Springer, New York, 2009, . [CrossRef]
  19. Tilli, M.; Petzhold, M.; Motooka, T.; Paulasto-Krockel, M.; Theus, H.; Lindroos, V. (eds.). Handbook of Silicon Based MEMS Materials and Technologies. Elsevier, 3rd edition, 2020. [CrossRef]
  20. Algamili, A.S., Khir, M.H.M., Dennis, J.O. et al. A Review of Actuation and Sensing Mechanisms in MEMS-Based Sensor Devices. Nanoscale Res Lett 16, 16 (2021). [CrossRef]
  21. Collin, J., Davidson, P., Kirkko-Jaakkola, M., Leppäkoski, H. (2019). Inertial Sensors and Their Applications. In: Bhattacharyya, S., Deprettere, E., Leupers, R., Takala, J. (eds). Handbook of Signal Processing Systems. Springer, Cham. [CrossRef]
  22. llegato, G., Corso, L., Valzasina, C. (2022). Inertial Sensors. In: Vigna, B., Ferrari, P., Villa, F.F., Lasalandra, E., Zerbini, S. (eds). Silicon Sensors and Actuators. Springer, Cham. [CrossRef]
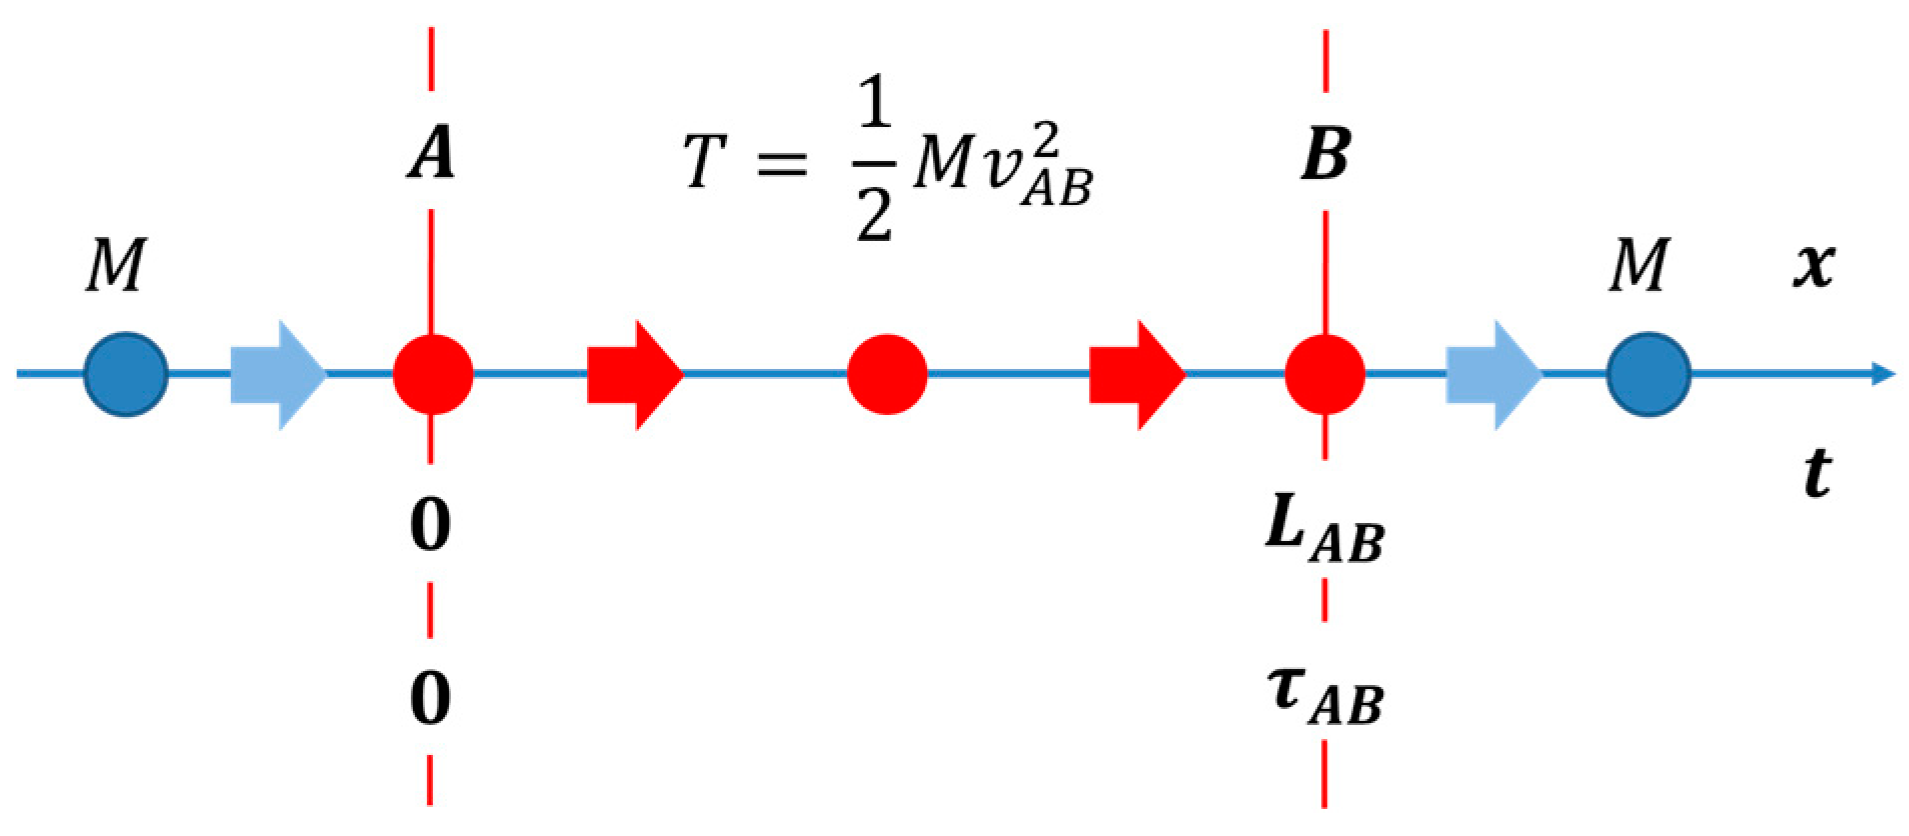
Figure 2. “Fly-through” scenario transporting a mass M across a distance L = A B with speed v A B = L A B / τ A B .
Preprints 137633 g002
Figure 3. (a) acceleration and deceleration phases in start-stop scenarii reaching out to a constant transport length L A B in a time τ A B ; (b) accelerations and intermediate drift speeds adapted to different values of δ / τ A B .
Preprints 137633 g003
Figure 4. (a) (red) acceleration/deceleration profile giving rise to a start-stop transport scenario; (green) velocity and (blue) distance profiles resulting from the impressed acceleration profile; (b) (red) acceleration and braking powers delivered to the transported mass M ; (green) kinetic energy and (blue) transport value of mass M , again as normalized to the transport value of an ideal “fly-through scenario.
Preprints 137633 g004
Figure 5. (a) fractional progress in transported length x ( δ ) / L A B as a function of fractional transport time t / τ A B as evaluated for different durations δ of acceleration and deceleration phases; (b) δ -dependent gains in physical action W A B L A B , τ , δ relative to the gain W A B attained in a “fly-through “ scenario.
Preprints 137633 g005
Figure 8. (a) profile forces of gravitational origin acting in the hill- and valley sections; (b) engine and brake forces employed to compensate the effect of uncontrollable profile forces and to arrive at a constant overall speed throughout the entire road scenario.
Preprints 137633 g008
Figure 9. (a) elongation of transport paths on upward-sloping roads; (b) equilibrium of engine, gravitational-, and friction forces on the moving vehicle; (c) impact of geographical height difference on upward (full lines) and downward (broken lines) B C R values.
Preprints 137633 g009
Figure 10. MEMS micro-inertial sensors for measuring linear and rotational motions of cars; (a) linear and rotational motions acting on a silicon proof mass; (b) MEMS-micromachined interdigital capacitors for turning mechanical motions into electrical readout signals; (c) example of a MEMS micro inertial system housed in a microelectronic chip package.
Preprints 137633 g010
Figure 11. (a) determination of transport value from driver actions using car-internal sensors: (b) comparison of intrinsic value of an A B transport (blue) and an actually carried out transport joining start- and endpoints A and B through a winding road (red).
Preprints 137633 g011
Disclaimer/Publisher’s Note: The statements, opinions and data contained in all publications are solely those of the individual author(s) and contributor(s) and not of MDPI and/or the editor(s). MDPI and/or the editor(s) disclaim responsibility for any injury to people or property resulting from any ideas, methods, instructions or products referred to in the content.
Copyright: This open access article is published under a Creative Commons CC BY 4.0 license, which permit the free download, distribution, and reuse, provided that the author and preprint are cited in any reuse.
Alerts
Prerpints.org logo

Preprints.org is a free preprint server supported by MDPI in Basel, Switzerland.

Subscribe

© 2025 MDPI (Basel, Switzerland) unless otherwise stated