Submitted:
25 October 2024
Posted:
29 October 2024
You are already at the latest version
Abstract
Keywords:
1. Introduction
2. Materials and Methods
2.1. Soil Characteristics and Experimental Design
2.2. Experimental Methods and Sample Analysis
2.2.1. Cd uptake, Accumulation and Translocation in S. nigrum
2.2.2. Impact of Cd on the Physiological Parameters of S. nigrum
2.3. Data Processing and Statistical Analysis
3. Results and Discussion
3.1. Effect of Adaptation to Cd Stress on Biomass of Middle -European ecotype of S. nigrum
3.2. Cd Accumulation, Enrichment and Translocation in Natural (N0) and Adapted (A50) Plants Exposed to the Growing Cd Stress
3.3. Effect of Adaptation to High Cd Contents in Soil on Physiological Properties of Middle-European ecotype of Solanum nigrum
3.3.1. Photosynthetic Pigments
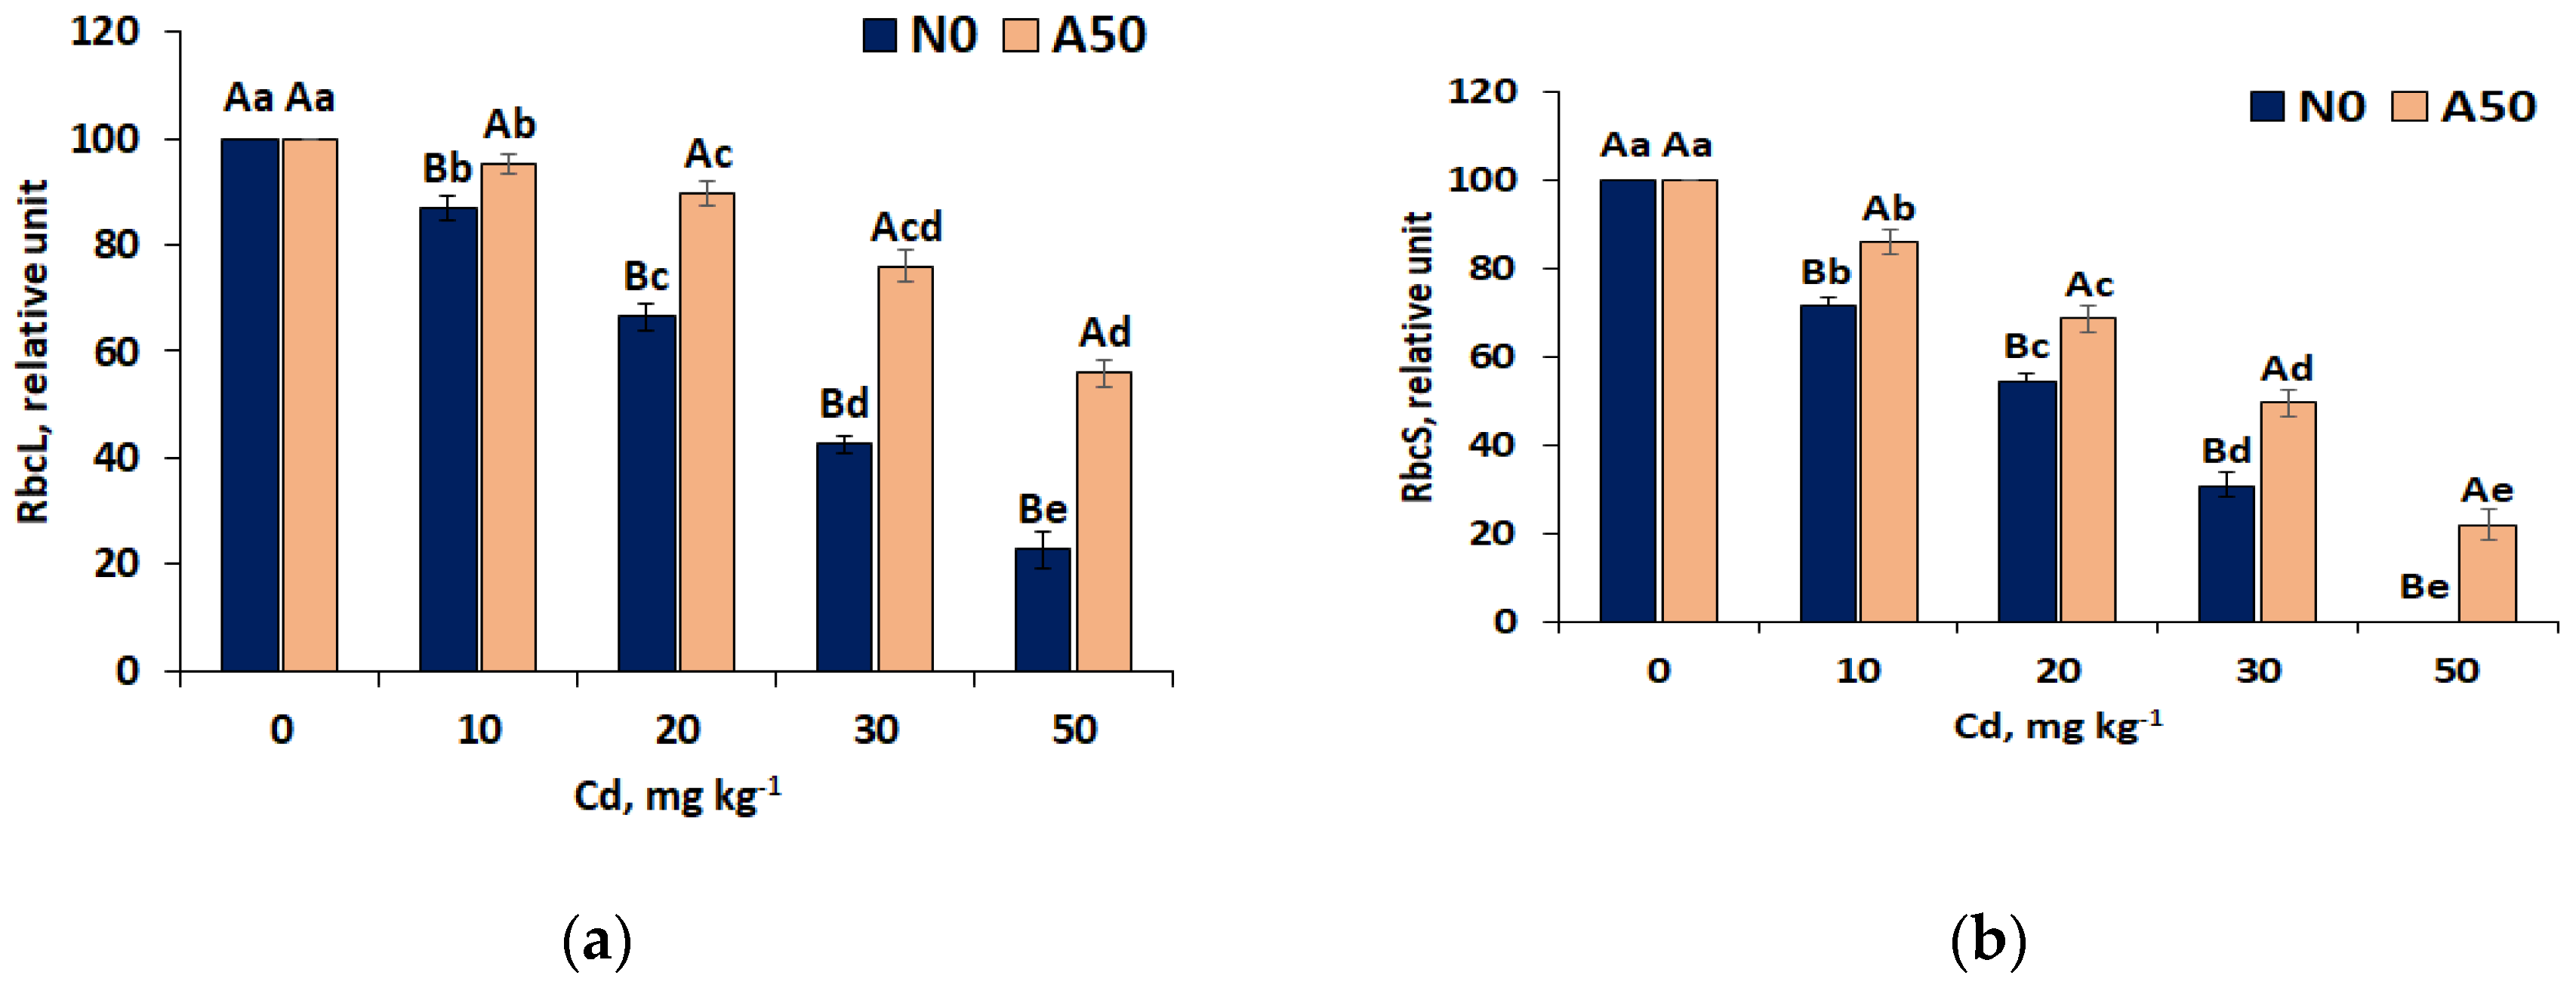
3.3.2. RuBisCO Activities
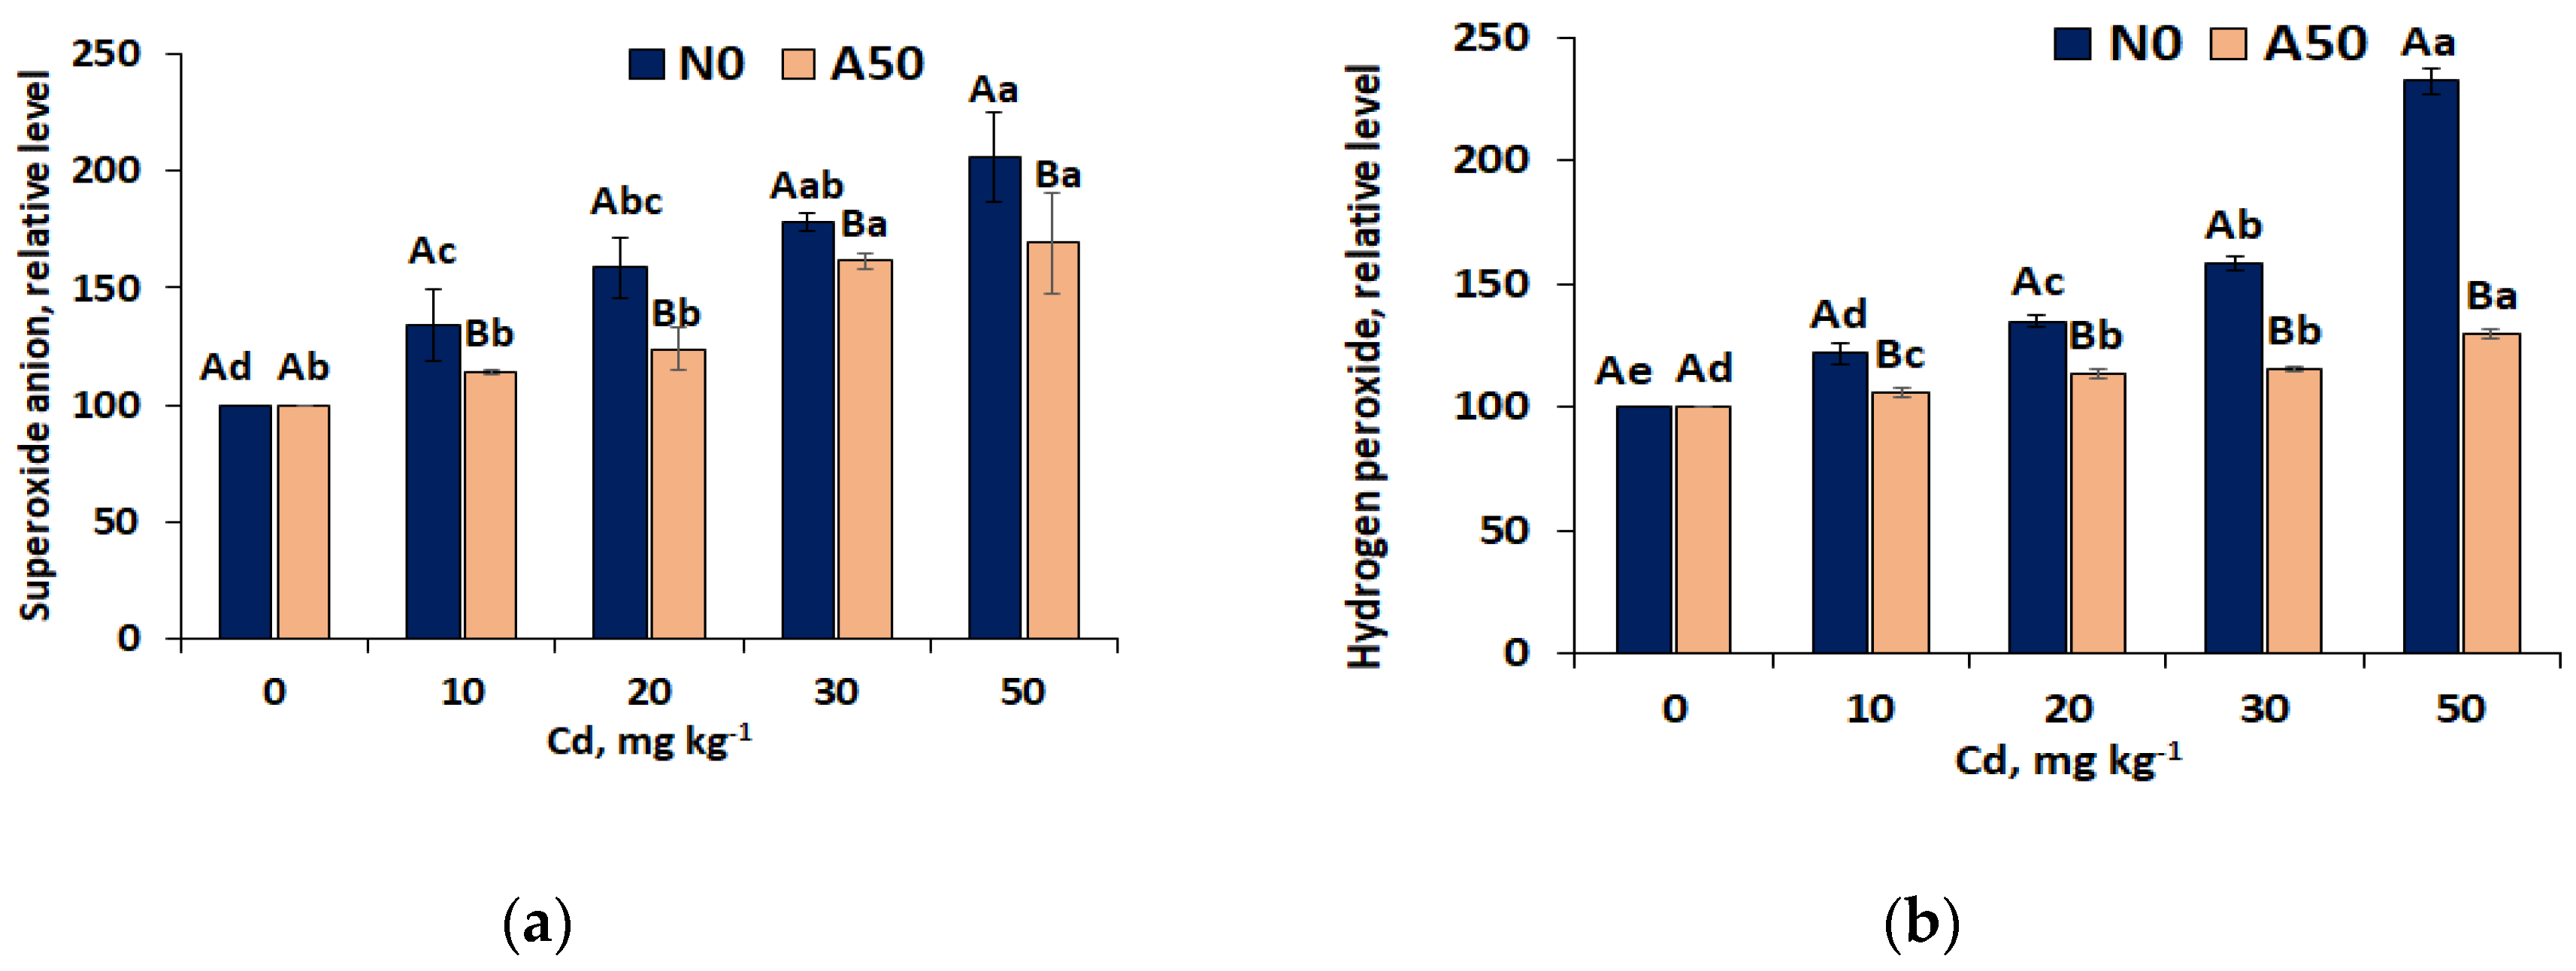
3.3.3. Reacrtive Oxygen Species (ROS)
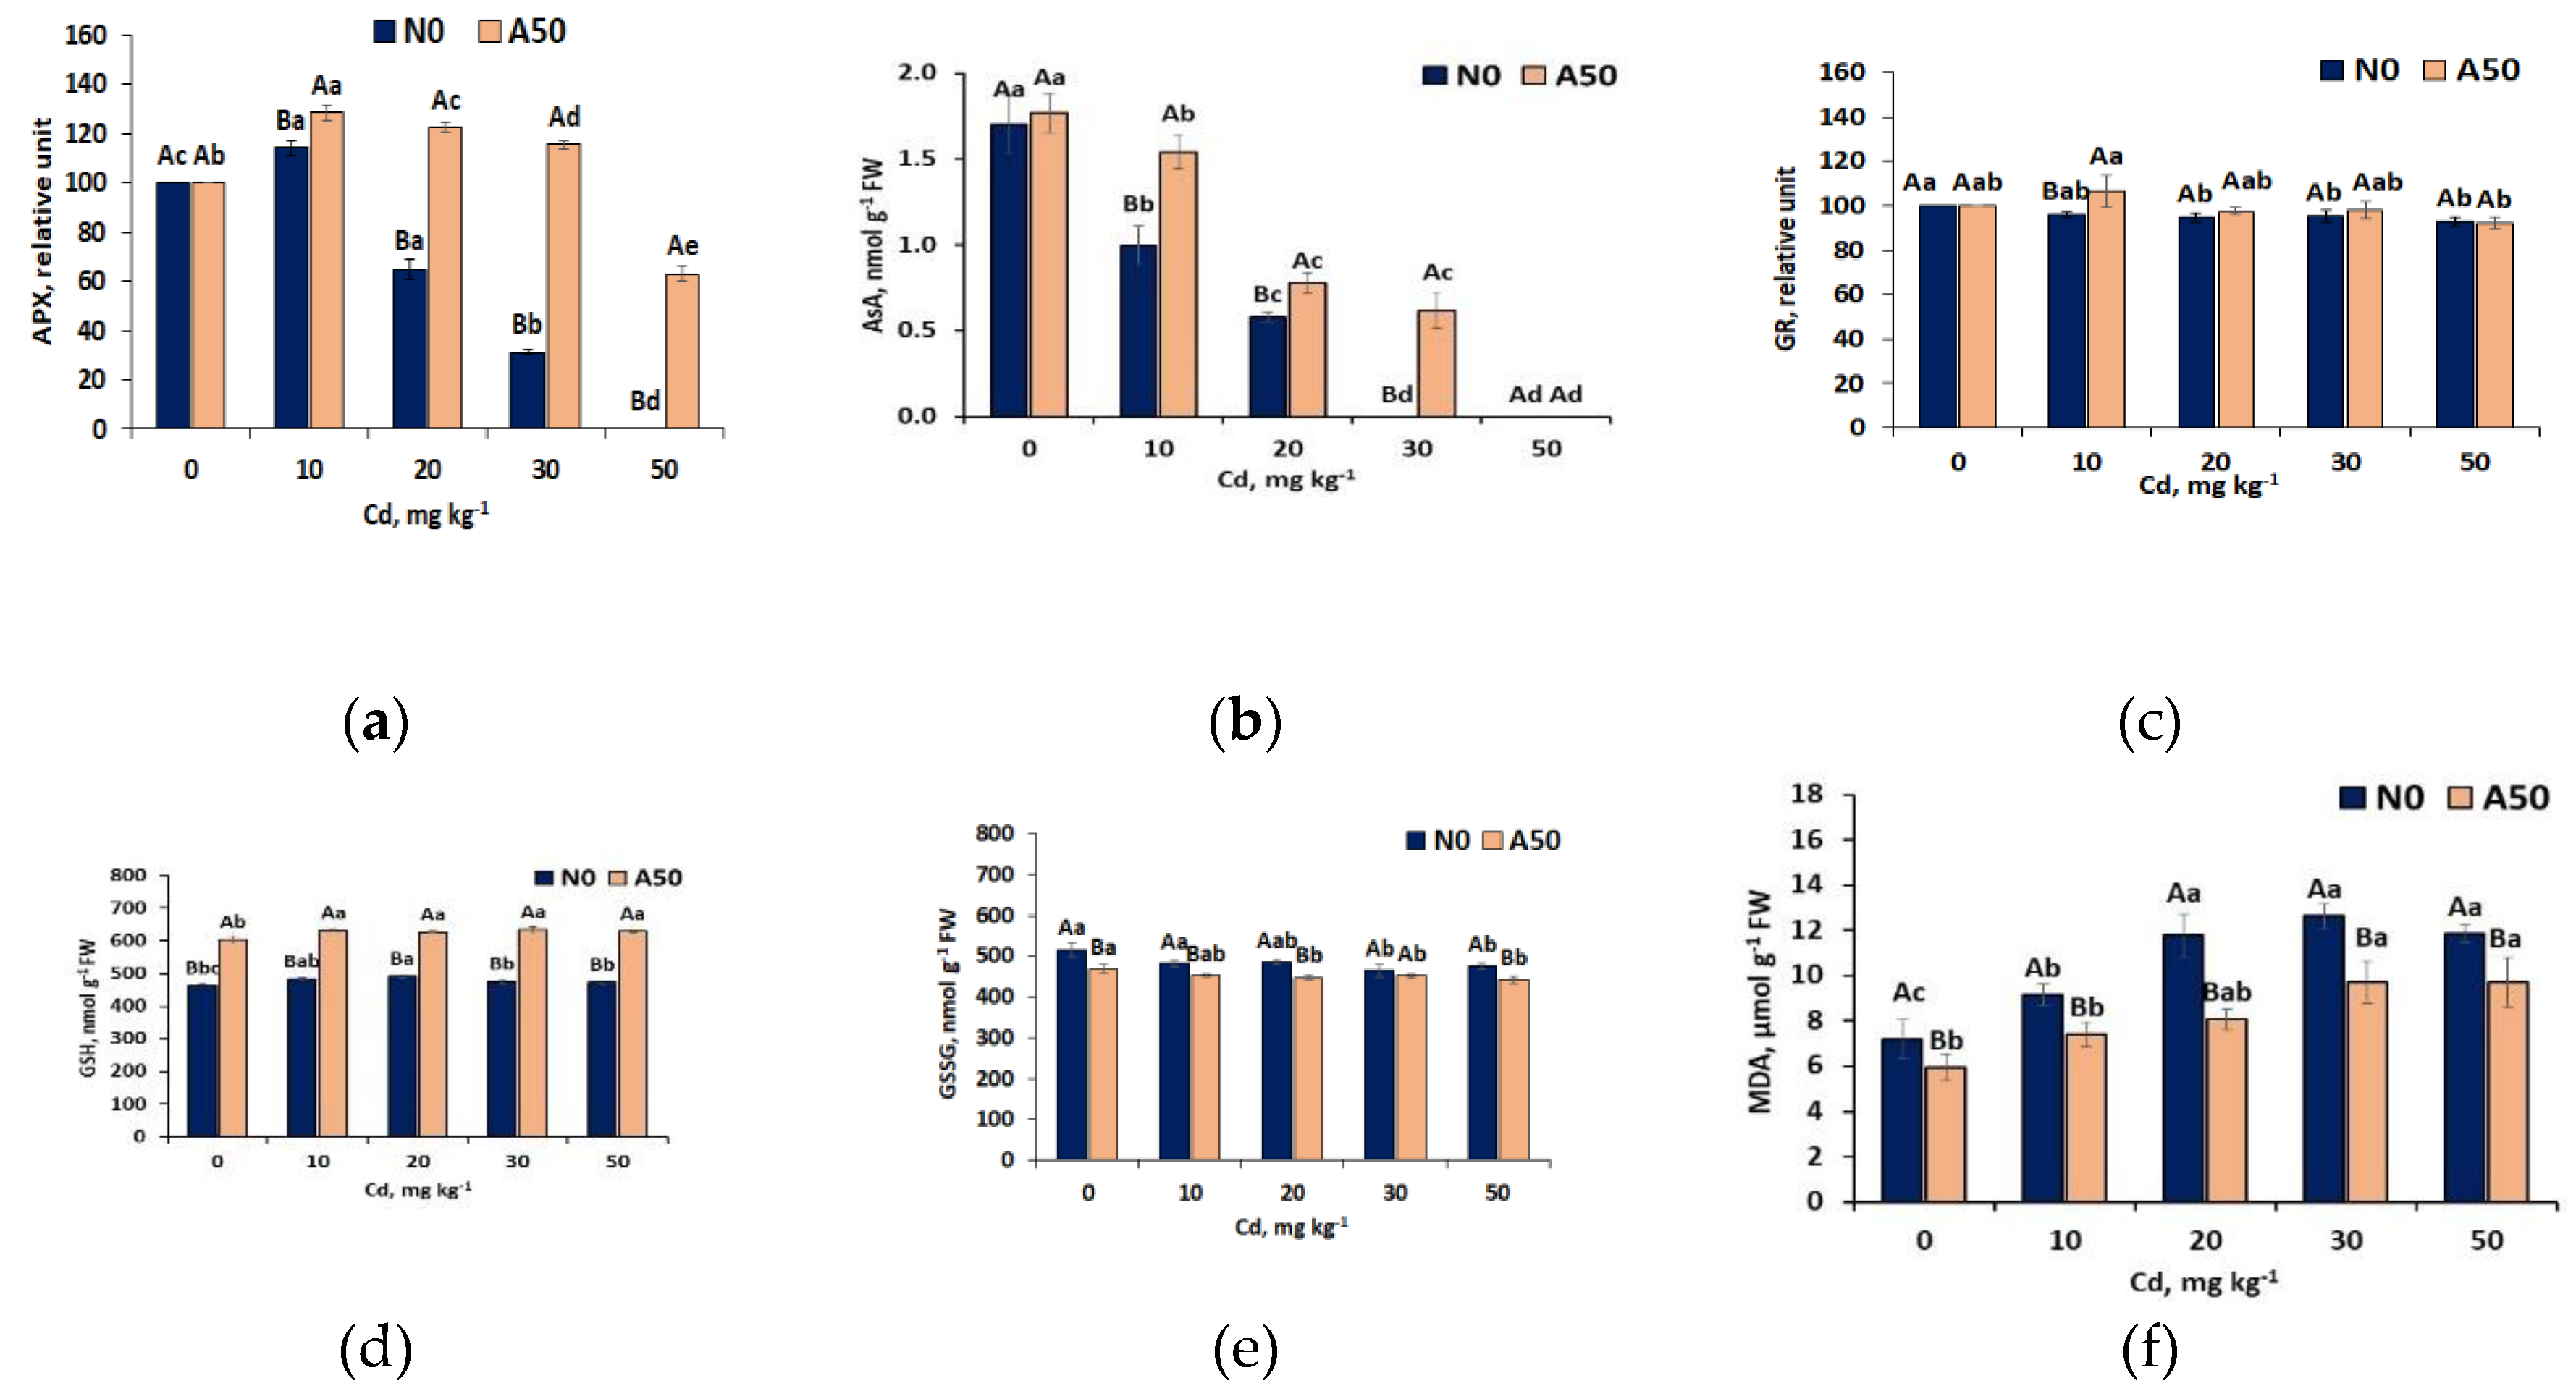
3.3.4. First Line Defence Antioxidant Activities
3.3.5. Second Line Defence Antioxidant Activities
4. Conclusions
Funding
Author Contributions
Institutional Review Board Statement
Informed Consent Statement
Data Availability Statement
Acknowledgments
Conflicts of Interest
References
- Kabata-Pendias, A. Trace Elements in Soils and Plants, 4th ed.; CRC Press Boca Raton, FL, 2011; pp. 266.
- Miszczak, E.; Stefaniak, S.; Michczyński, A.; Steinnes, E.; Twardowska, I. A novel approach to peatlands as archives of total cumulative spatial pollution loads from atmospheric deposition of airborne elements complementary to EMEP data: priority pollutants (Pb, Cd, Hg). Sci. Total. Environ. 2020, 705, 135776. [Google Scholar] [CrossRef] [PubMed]
- Reeves, R.D.; Baker, A.J.M.; Jaffr´e, T.; Erskine, P.D.; Echevarria, G.; van der Ent, A. A global database for plants that hyperaccumulate metal and metalloid trace elements. New Phytol. 2018, 218, 407–411. [Google Scholar] [CrossRef] [PubMed]
- Wei, S.H.; Zhou, Q.X.; Wang, X.; Zhang, K.S.; Guo, G.L.; Ma, L.Q. A newly-discovered Cd-hyperaccumulator Solanum nigrum L. Chin. Sci. Bull. 2005, 50, 33–38. [Google Scholar] [CrossRef]
- Dai, H.; Wei, S.; Twardowska, I.; Hou, N.; Zhang, Q. Cosmopolitan cadmium hyperaccumulator Solanum nigrum: Exploring cadmium uptake, transport and physiological mechanisms of accumulation in different ecotypes as a way of enhancing its hyperaccumulative capacity. Journal of Environmental Management, 2022, 320, 115878. [Google Scholar] [CrossRef]
- Marques, A.P.G.C.; Rangel, A.O.S.S.; Castro, P.M.L. Effect of arsenic, lead and zinc on seed germination and plant growth in black nightshade (Solanum nigrum L. ) vs. clover (Trifolium incarnatum L.). Fresenius Environmental Bulletin, 2007, 16, 896–903. [Google Scholar]
- Teixeira, J.; de Sousa, A.; Azenha, M.; Moreira, J.T.; Fidalgo, F.; Silva, A.F.; Faria, J.L. Solanum nigrum L. weed plants as a remediation tool for metalaxyl-polluted effluents and soils. Chemosphere 2011, 85, 744–750. [Google Scholar] [CrossRef]
- Teixeira, J.; Ferraz, P.; Gouveia, C.; Azevedo, F.; Neves, S.; Fidalgo, F.; Silva, A.M. Targeting key metabolic points for an enhanced phytoremediation of wastewaters pre-treated by the photo-Fenton process using Solanum nigrum L. Ecotoxicol. Environ. Saf. 2015, 120, 124–129. [Google Scholar] [CrossRef] [PubMed]
- Ferraz, P.; Fidalgo, F.; Almeida, A.; Teixeira, J. Phytostabilization of nickel by the zinc and cadmium hyperaccumulator Solanum nigrum L. Are metallothioneins involved? Plant Physiol. Biochem. 2012, 57, 254–260. [Google Scholar] [CrossRef] [PubMed]
- Rehman, M.Z.U.; Rizwan, M.; Ali, S.; Ok, Y.S.; Ishaque, W.; Nawaz, M.F.; Akmal, F.; Waqar, M. Remediation of heavy metal contaminated soils by using Solanum nigrum: A review. Ecotoxicol. Environ. Saf. 2017, 143, 236–248. [Google Scholar] [CrossRef]
- Sousa, B.; Soares, C.; Oliveira, F.; Martins, M.; Branco-Neves, S.; Barbosa, B.; Ataíde, I.; Teixeira, J.; Azenha, M.; Azevedo, R.A.; et al. Foliar application of 24-epibrassinolide improves Solanum nigrum L. tolerance to high levels of Zn without affecting its remediation potential. Chemosphere 2019, 244, 125579. [Google Scholar] [CrossRef]
- Pons, M.-L.; Collin, B.; Doelsch, E.; Chaurand, P.; Fehlauer, T.; Levard, C.; Keller, C.; Rose, J. X-ray absorption spectroscopy evidence of sulfur-bound cadmium in the Cd-hyperaccumulator Solanum nigrum and the non-accumulator Solanum melongena. Environ. Pollut. 2021, 279, 116897. [Google Scholar] [CrossRef] [PubMed]
- Al-Huqail, A.A. Stimulating the efficiency of Cd-phytoremediation from contaminated soils by Solanum nigrum L.: Effect of foliar and soil application of yeast extract. South Afr. J. Bot. 2023, 161, 512–518. [Google Scholar] [CrossRef]
- Sahito, Z.A.; Zehra, A. , Song Yu S. ; Chen S., Arif M.A.R.; Raza S.T., Lahori A.H., Mai Ali Mwaheb M.A.M.A.; He Z.; Yang X. Folic acid supplementation improves seed germination, seedling growth and cadmium uptake in a mining ecotype of Solanum nigrum L. Environmental Technology and Innovationvol 2024, 34, 103600. [Google Scholar]
- EMEP, 2022. EMEP Status Report 2/2022. Assessment of heavy metal and POP pollution on global, regional and national scales. Joint MSC-E, CCC, CEIP, IMR, CEIMAT, INERIS, ENEA and FMI Report. http://www.msceast.org/reports/2_2022.pdf (assessed 27.09. 2024.
- Wei, S.; Clark, G.; Dornila, A.I.; Monsant, A.C. Cd hyperacumulative characteristics of Australia ecotype Solanum nigrum L. and its implication in screening hyperaccumulator. Int. J. Phytoremediation 2013, 15, 199–205. [Google Scholar]
- Dou, X.; Dai, H.; Skuza, L.; Wei, S. Strong accumulation capacity of hyperaccumulator Solanum nigrum L. for low or insoluble Cd compounds in soil and its implication for phytoremediation. Chemosphere 2020, 260, 127564. [Google Scholar]
- Yang, X.; Qin, J.; Li, J.; Lai, Z.; Li, H. Upland rice intercropping with Solanum nigrum inoculated with arbuscular mycorrhizal fungi reduces grain Cd while promoting phytoremediation of Cd-contaminated soil. Journal of Hazardous Materials, 2021, 406, 124325. [Google Scholar] [CrossRef] [PubMed]
- Ditzler, C. , Scheffe, K., and Monger, H.C. (eds.). Soil survey manual. Soil Science Division Staff USDA Handbook 18. Government Printing Office, Washington, D.C; 2017.
- IUSS Working Group WRB. World Reference Base for Soil Resources. In International Soil Classification System for Naming Soils and Creating Legends for Soil Maps, 4th ed.; International Union of Soil Sciences: Vienna, Austria, 2022. [Google Scholar]
- Dai, H.; Wei, S.; Twardowska, I.; Zhang, Q. In search of the exclusion/lowaccumulation mechanisms: cadmium uptake and accumulation from soil by cultivated (Solanum melongena L. ) and wild eggplants (Solanum torvum L.). J. Clean. Prod. 2021, 323, 12941. [Google Scholar]
- Dai, H.; Wei, S.; Noori, A. The mechanism of chelator improved the tolerance and accumulation of poplar to Cd explored through differential expression protein based on iTRAQ. J. Hazard. Mater. 2020, 393, 122370. [Google Scholar] [CrossRef] [PubMed]
- Dai, H.; Wei, S.; Pogrzeba, M.; Krzyżak, J.; Rusinowski, S.; Zhang, Q. The cadmium accumulation differences of two Bidens pilosa L. ecotypes from clean farmlands and the changes of some physiology and biochemistry indices. Ecotoxicol. Environ. Saf. 2020, 209, 111847. [Google Scholar] [CrossRef]
- Lichtenthaler, H.K.; Buschmann, C. Extraction of Phtosynthetic Tissues:Chlorophylls and Carotenoids. Curr. Protoc. Food Anal. Chem. 2001, 1, F4–2. [Google Scholar] [CrossRef]
- Cembrowska-Lech, D. Tissue Printing and Dual Excitation Flow Cytometry for Oxidative Stress—New Tools for Reactive Oxygen Species Research in Seed Biology. Int. J. Mol. Sci. 2020, 21, 8656. [Google Scholar] [CrossRef] [PubMed]
- Laemmli, U.K. Cleavage of structural proteins during the assembly of the head phase of bacteriophage T4. Nature 1970, 227, 680–5. [Google Scholar] [CrossRef]
- Schindelin, J.; Arganda-Carreras, I.; Frise, E.; Kaynig, V.; Longair, M.; Pietzsch, T.; Preibisch, S.; Rueden, C.; Saalfeld, S.; Schmid, B.; et al. Fiji: an open-source platform for biological-image analysis. Nat. Methods 2012, 9, 676–682. [Google Scholar] [CrossRef] [PubMed]
- Giannopolitis, C.N.; Ries, S.K. Superoxide dismutases: I. Occurrence in higher plants. Plant Physiol. 1977, 59, 309–314. [Google Scholar] [PubMed]
- Rao, M.V.; Paliyath, G.; Ormrod, D.P. Ultraviolet-B- and Ozone-Induced Biochemical Changes in Antioxidant Enzymes of Arabidopsis thaliana. Plant Physiol. 1996, 110, 125–136. [Google Scholar] [CrossRef]
- Esterbauer, H.; Grill, D. Seasonal Variation of Glutathione and Glutathione Reductase in Needles of Picea abies. Plant Physiol. 1978, 61, 119–121. [Google Scholar] [CrossRef]
- Nagalakshmi, N.; Prasad, M. Responses of glutathione cycle enzymes and glutathione metabolism to copper stress in Scenedesmus bijugatus. Plant Sci. 2001, 160, 291–299. [Google Scholar] [CrossRef]
- Bradford, M.M. A rapid and sensitive method for the quantitation of microgram quantities utilizing the principle of protein dye binding. Anal Biochem 1976, 72, 248–54. [Google Scholar] [CrossRef]
- Smith, I.K. Stimulation of Glutathione Synthesis in Photorespiring Plants by Catalase Inhibitors. Plant Physiol. 1985, 79, 1044–1047. [Google Scholar] [CrossRef]
- Kampfenkel, K.; Van Montagu, M. ; Inze,` D. Extraction and determination of ascorbate and dehydroascorbate from plant tissue. Anal Biochem 1995, 225, 165–167. [Google Scholar]
- Bailly, C. , Benamar A., Corbineau F., Côme D. 1996. Changes in malondialdehyde content and in superoxide dismutase, catalase and glutathione reductase activities in sunflower seeds as related to deterioration during accelerated aging. Physiol. Plant. 97:104-110.
- Khan, A.R.; Ullah, I.; Khan, A.L.; Hong, S.-J.; Waqas, M.; Park, G.-S.; Kwak, Y.; Choi, J.; Jung, B.-K.; Park, M.; et al. Phytostabilization and Physicochemical Responses of Korean Ecotype Solanum nigrum L. to Cadmium Contamination. Water, Air, Soil Pollut. 2014, 225, 2147. [Google Scholar] [CrossRef]
- Yamaguchi, H.; Fukuoka, H.; Arao, T.; Ohyama, A.; Nunome, T.; Miyatake, K.; Negoro, S. Gene expression analysis in cadmium-stressed roots of a low cadmium-accumulating solanaceous plant, Solanum torvum. J. Exp. Bot. 2009, 61, 423–437. [Google Scholar] [CrossRef] [PubMed]
- Xu, J.; Sun, J.; Du, L.; Liu, X. Comparative transcriptome analysis of cadmium responses in Solanum nigrum and Solanum torvum. New Phytol. 2012, 196, 110–124. [Google Scholar] [CrossRef]
- Baek, K.-H.; Skinner, D.Z. Production of reactive oxygen species by freezing stress and the protective roles of antioxidant enzymes in plants. J. Agric. Chem. Environ. 2012, 01, 34–40. [Google Scholar] [CrossRef]
- Racchi, M.L. Antioxidant Defenses in Plants with Attention to Prunus and Citrus spp. Antioxidants 2013, 2, 340–369. [Google Scholar] [CrossRef]
- Ighodaro, O.M.; Akinloye, O.A. First line defense antioxidants – superoxide dismutase (SOD), catalase (CAT) and glutathione peroxidase (GPX): their fundamental role in the entire antioxidant defense grid. Alexandria J. Med. 2018, 54, 287–293. [Google Scholar] [CrossRef]
- Hasanuzzaman, M.; Bhuyan, M.H.M.B.; Anee, T.I.; Parvin, K.; Nahar, K.; Mahmud, J.A.; Fujita, M. Regulation of Ascorbate-Glutathione Pathway in Mitigating Oxidative Damage in Plants under Abiotic Stress. Antioxidants 2019, 8, 384. [Google Scholar] [CrossRef]
- Song, L.-Y.; Liu, X.; Zhang, L.-D.; Hu, W.-J.; Xu, C.-Q.; Li, J.; Song, S.-W.; Guo, Z.-J.; Sun, C.-Y.; Tang, H.-C.; et al. Proteomic analysis reveals differential responsive mechanisms in Solanum nigrum exposed to low and high dose of cadmium. J. Hazard. Mater. 2023, 448, 130880. [Google Scholar] [CrossRef]


| T-Treatments mg Cd kg-1 | 0 | 10 | 20 | 30 | 50 |
|---|---|---|---|---|---|
| Cdsoil mg Cd kg-1 |
0.22±0.08 | 10.52±0.87 | 20.44±1.96 | 30.09±1.52 | 50.49±2.29 |
| BmR - Biomass of root (g pot -1 DW) | |||||
| N0 | 2.06±0.41Aa | 2.02±0.62Aa | 1.59±0.48Aa | 1.34±0.85Aa | 1.31±0.15Aa |
| A50 | 2.00±0.28Aa | 1.89±0.08Aa | 1.43±0.37Aa | 1.38±0.70Aa | 1.41±0.33Aa |
| BmS -Biomass of shoot (g pot -1 DW) | |||||
| N0 | 13.00±3.51Aa | 11.90±2.11Aa | 11.00±1.29Aa | 8.26±3.96Aa | 9.65±0.68Aa |
| A50 | 12.01±1.80Aa | 10.86±3.69Aa | 9.98±1.51Aa | 9.08±4.40Aa | 11.38±1.01Aa |
| T | Csoil mg kg-1Symbol | Cn mg kg-1 | EFn | TF | Ln µg pot -1 | LTF | |||||
|---|---|---|---|---|---|---|---|---|---|---|---|
| N0 | A50 | N0 | A50 | N0 | A50 | N0 | A50 | N0 | A50 | ||
| Root | |||||||||||
| 0 | 0.22±0.08 | 0.57±0.14dA | 0.24±0.02cB | 2.59±0.63bA | 1.09±0.08bB | 1.20±0.49cA | 0.48±0.06bA | ||||
| 10 | 10.52±0.87 | 55.49±7.96cA | 50.83±11.66bcA | 5.27±0.76aA | 4.83±1.11aA | 108.6±21.9bcA | 95.90±21.58bA | ||||
| 20 | 20.44±1.96 | 127.20±11.95bA | 104.21±21.42bA | 6.22±0.56aA | 5.10±1.04aA | 201.8±68.6bA | 150.1±58.2bA | ||||
| 30 | 30.09±1.52 | 166.74±28.40bA | 110.16±25.99bB | 5.54±0.94aA | 3.66±0.86aB | 210.4±124.5bA | 157.6±92.6bA | ||||
| 50 | 50.49±2.29 | 324.07±31.20aA | 279.91±49.01aA | 6.42±0.62aA | 5.54±0.97aA | 420.8±17.5aA | 401.7±142.1aA | ||||
| Shoot | |||||||||||
| 0 | 0.22±0.08 | 0.82±0.34dA | 0.49±0.08cA | 3.72±1.53bA | 2.23±0.34cA | 1.40±0.23bB | 2.06±0.27aA | 10.9±5.92cA | 5.85±0.81cA | 8.77±1.63aB | 12.26±0.86aA |
| 10 | 10.52±0.87 | 81.05±7.81cA | 90.67±7.61bA | 7.70±0.74aA | 8.62±0.72aA | 1.48±0.27aA | 1.83±0.28aA | 957.9±127.2bA | 988.8±377.7bA | 8.91±0.71aA | 10.51±3.71abA |
| 20 | 20.44±1.96 | 111.05±2.15bA | 129.27±34.06aA | 5.43±0.10bA | 6.32±1.67bA | 0.88±0.10cB | 1.23±0.11bA | 1222.0±157.7abA | 1269.1±289.9abA | 6.44±1.82abA | 8.79±1.46abA |
| 30 | 30.09±1.52 | 103.03±7.81bA | 117.01±16.04abA | 3.42±0.26bcA | 3.89±0.53cA | 0.62±0.06cB | 1.11±0.33bcA | 835.69±377.0bA | 1015.2±403.3bA | 4.41±1.11bA | 7.43±2.55abA |
| 50 | 50.49±2.29 | 174.65±9.92aA | 164.55±13.52aA | 3.46±0.20bcA | 3.26±0.27cA | 0.54±0.04cA | 0.60±0.15cA | 1685.51±154.6aA | 1867.6±151.6aA | 4.00±0.20bA | 5.11±1.96bA |
| Total | |||||||||||
| 0 | 0.22±0.08 | 12.15±6.40cA | 6.33±0.86cA | ||||||||
| 10 | 10.52±0.87 | 1066.6±148.9bA | 1084.7±386.1bA | ||||||||
| 20 | 20.44±1.96 | 1423.8±183.9bA | 1419.2±344.7abA | ||||||||
| 30 | 30.09±1.52 | 1046.1±500.7bA | 1172.8±490.5bA | ||||||||
| 50 | 50.49±2.29 | 2106.3±85.9aA | 2269.3±240.6aA | ||||||||
Disclaimer/Publisher’s Note: The statements, opinions and data contained in all publications are solely those of the individual author(s) and contributor(s) and not of MDPI and/or the editor(s). MDPI and/or the editor(s) disclaim responsibility for any injury to people or property resulting from any ideas, methods, instructions or products referred to in the content. |
© 2024 by the authors. Licensee MDPI, Basel, Switzerland. This article is an open access article distributed under the terms and conditions of the Creative Commons Attribution (CC BY) license (http://creativecommons.org/licenses/by/4.0/).


