Introduction
Most of the world’s plantations are monocultures, with just a small number of tree genera (e.g. Eucalyptus, Pinus, and Tectona) is widely used [
1,
2]. Such plantations have been criticized for having negative impacts on local environments and its services [
3,
4] and not providing many traditional forest goods used by local people, especially for biodiversity conservation [
5].
Researches demonstrating that mixed-species plantations can increase stand level productivity relative to monocultures. However, such comparative advantages has not led to their commercial uptake; mixed species plantations are limited to less than0.1% of industrial plantations in the globe [
6]. Commercial and experimental mixed species plantations rarely offer data on financial analyses, and small landholders appear to be the main innovators in establishing and demonstrating mixed species plantations [
6]. Mixed-species plantations preferable as result of: increased yield, provide better environmental protection, biodiversity conservation and restoration [
7].
Among the different monoculture plantations, monoculture plantation with Eucalyptus criticized most [
1]. Eucalyptus species mainly suppresses ground vegetation, results less undergrowth, has an impact on biodiversity conservation [
8]. On the other hand mixed plantation had diversity of component and products. For example, [
9] recorded 39 woody plants regenerated in a 20-year-old
E. camaldulensis plantation in North Eastern Zimbabwe. [
10] recorded under
E. globulus plantations in dry afro-mountain areas of Ethiopia: 16 species in a 13 year old stand, 13 species in a 16-year-old stand and 17 species in a 22-year-old plantation. [
11] recorded 46 woody species in a 31-year
E. grandis plantation in Southwestern Ethiopia, 37 woody plants were identified in a 27-year-old monoculture
E. camaldulensis plantation in semi-arid areas of Ethiopia. However, these studies on mixed plantations of Eucalyptus were focused only on the growth and productivity of the plantation species. Therefore, this research is design to evaluate the effect of some selected tree species on the growth of
Eucalyptus globulus in early stage. Despite our limited understanding of how to design, select species for, and manage mixed-species plantations in Australia, they are commonly promoted as more environmentally preferable to monocultures [
4,
12,
13]. Therefore this research was design to identify most compatible tree species with Eucalyptus globulus for Gummer wereda.
Material and Methods
Site Description
The study was conducted in Gummer district, Gurage zone, southern Ethiopia. It is one of the woredas in the central Ethiopia region. Gummer is bordered on the southeast by the Silt’e Zone, on the southwest by Geta, on the northwest by Cheha, and on the north by Ezha. Water bodies in this woreda include Lake Arek’it, after which the town was named. Based on the 2007 Census conducted by the central statistical agency, the district had a total population of 80,178, of whom 37,495 are men and 42,683 women; 2,923 or 3.65% of its population are urban dwellers.
Like most farmers in Ethiopia, the farmers in Gummer wereda produce both crops and livestock. The major crops in the grown in the Woredas are Barley, Faba Bean, Wheat, Potato, Enset and Field Pea. Wheat, Potato and Barley are also the top three contributors to farmers’ income. Sheep, Cow, and Horses constituted the largest proportion of total livestock in the wereda. The largest contributor to the livestock population in the Kebele was sheep (38.99%) followed by cows (24.93%), horses (15.03%), calves (6.98%) and heifers (6.76%). These top five accounted for 92.69% of the livestock population ([
14]).
The major vegetation grown in the wereda are exotic tree species like Eucalyptus globulus, Cupresus lustanica Chamythesis palimnesis and Gravellia robusta and indigenous tree species such as Juniporus procera, Hygenia abysinica podocarpus falctus, Bundelija polystachyus. Eucalyptus globulus, Juniporus procera, Hygenia abysinica and Cupresus lustanica are dominantly grown tree species (personal observation). Eucalyptus globulus, Gravellia robusta, Chamythesis palminesis, apple and prim is preferred species by farmers in wereda. The bases of preference are their products and services such as wood products environmental services. Bamboo is the only and an important non-timber forest product in the wereda (SARI Quick survey).
Treatments, Experimental Design and Management
The treatments used for the study were
Eucalyptus globulus monoculture,
Eucalyptus globulus + Hygenia abysinica,
Eucalyptus globulus + Podocarpus falcatus,
Eucalyptus globulus + Cupressus lusitanica and
Eucalyptus globulus + Juniporus procera.
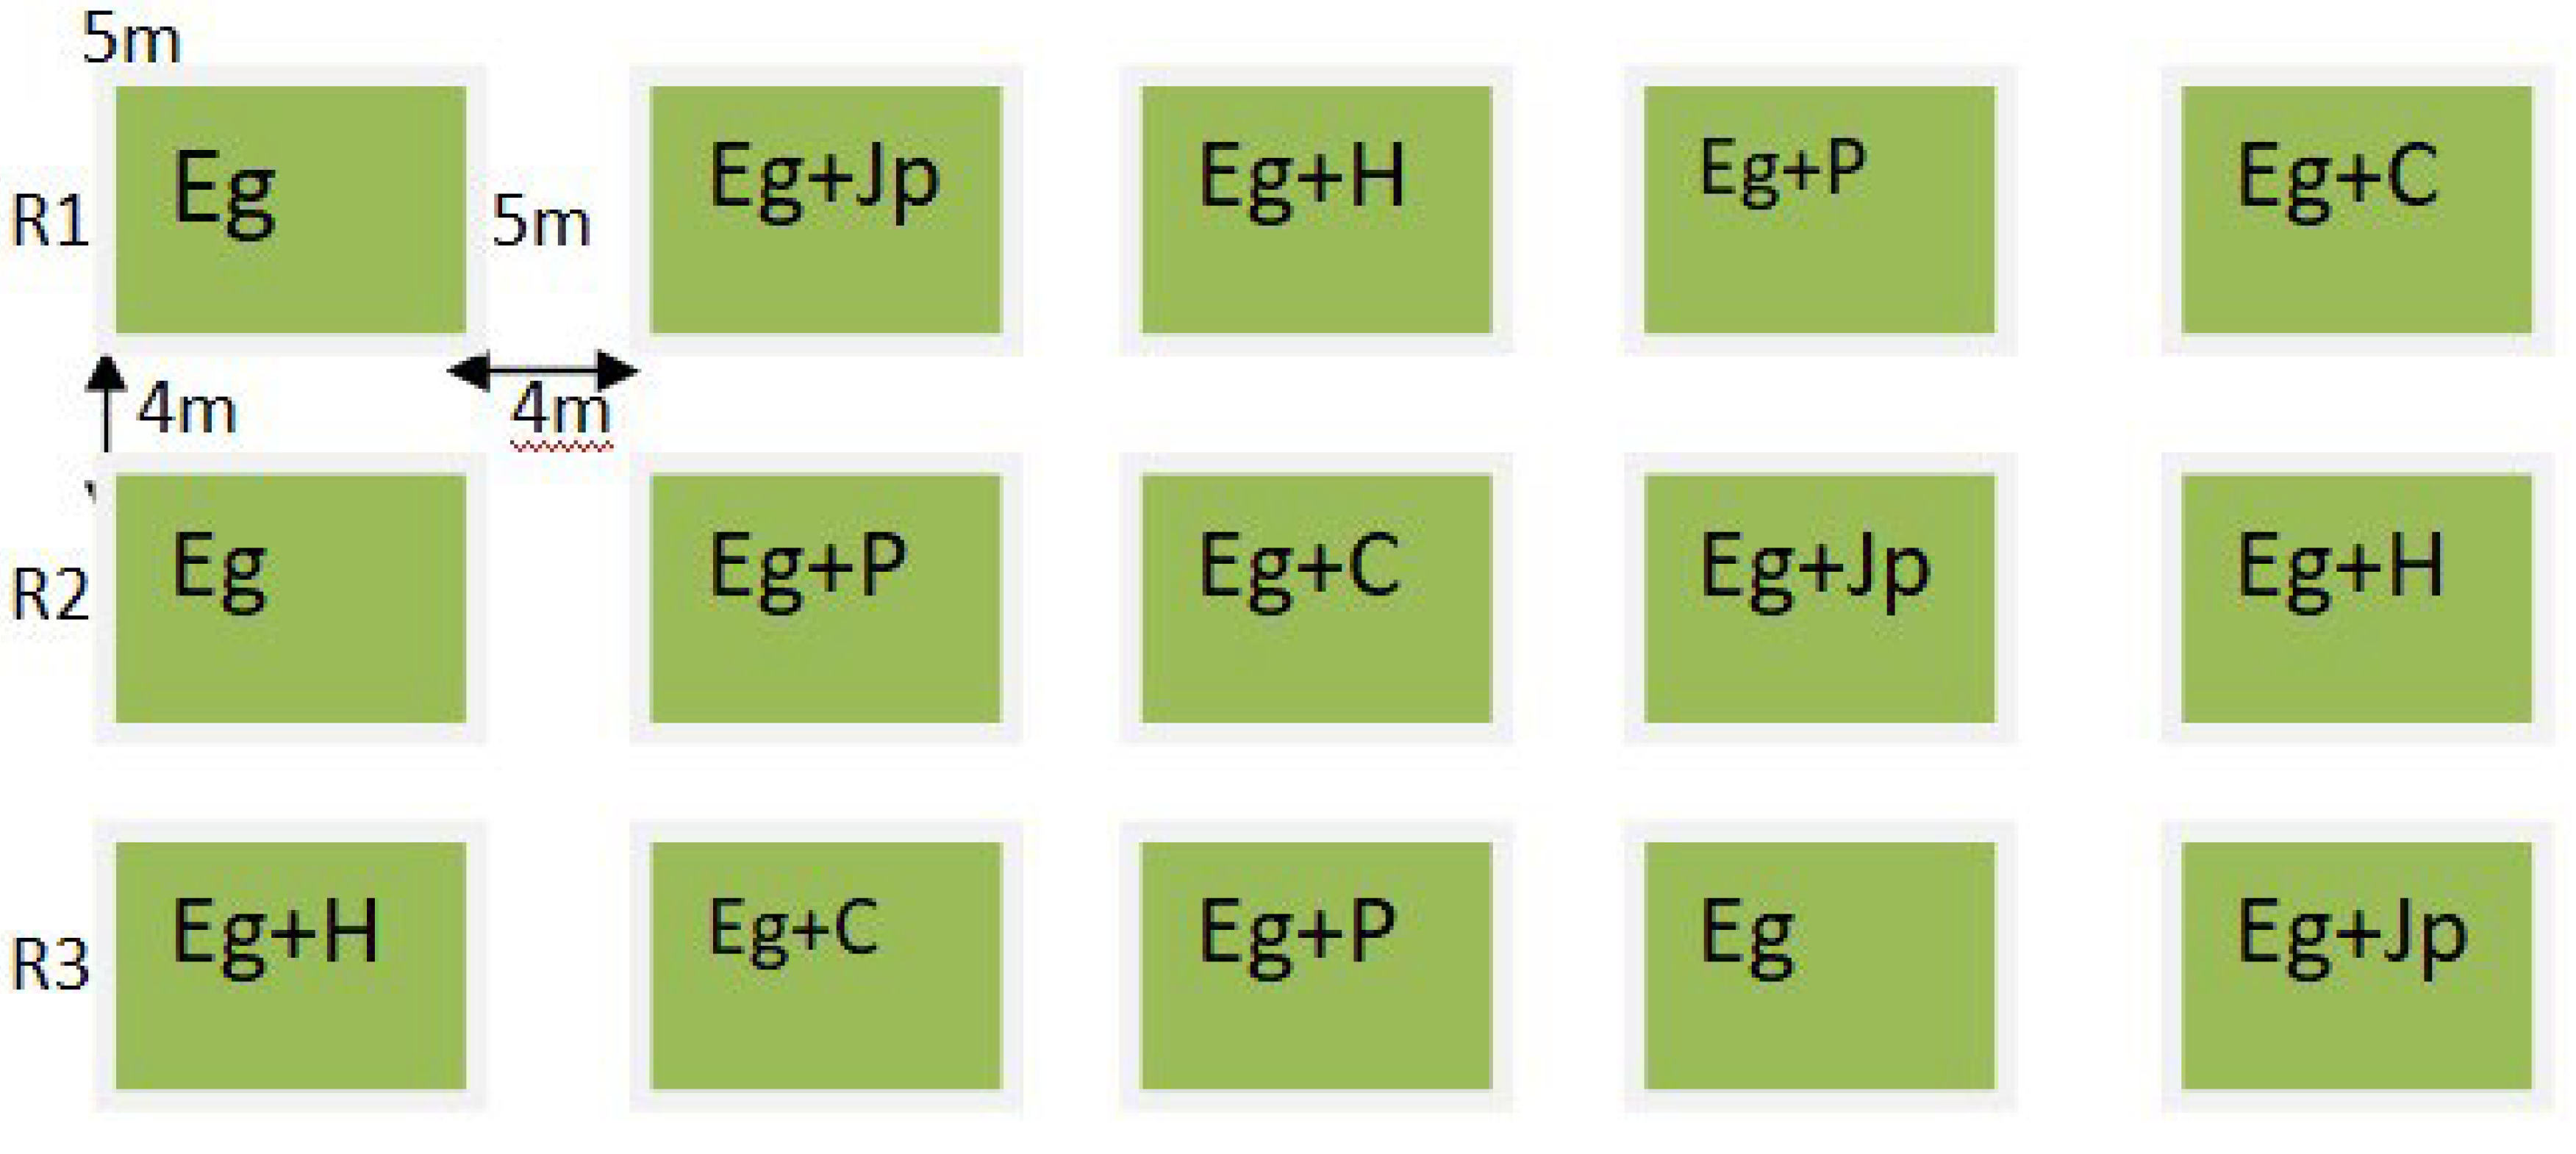
Seedlings of the tree were raised in Gummer wereda agriculture office nursery site, the nearby nursery to the study area. Then, field preparation began one month before planting. Planting holes were dug 50*40 cm deep and wid. The size of the plot was 5m X 5m. A plot consisted of six rows of trees that had six trees one line. One plots had a total of 36 seedlings. Distance between trees in the same row and between in row was 1m. The distance between plots and blocks was 4 m. In mixed plantation mixed species were planted alternative line, that means the line next to other line that plot contain other mixed species with in a plot.
Figure 1.
field design of the experiment containing all treatments with three replications; Where: Eg = Mono-crop Eucalyptus globulus; Eg + Jp = Eucalyptus globulus mixed with Juniporus procera; Eg + H = Eucalyptus globulus mixed with Haygenia abysinica; Eg + P = Eucalyptus globulus mixed with Podocarpus falcatus; Eg + C = Eucalyptus globulus mixed.
Treatments were laid out in a Randomized Complete Block Design (RCBD) with three replications. Weeding and hoeing were applied after planting uniformly two times in a year to the entire plot in the first and second year of the growing period.
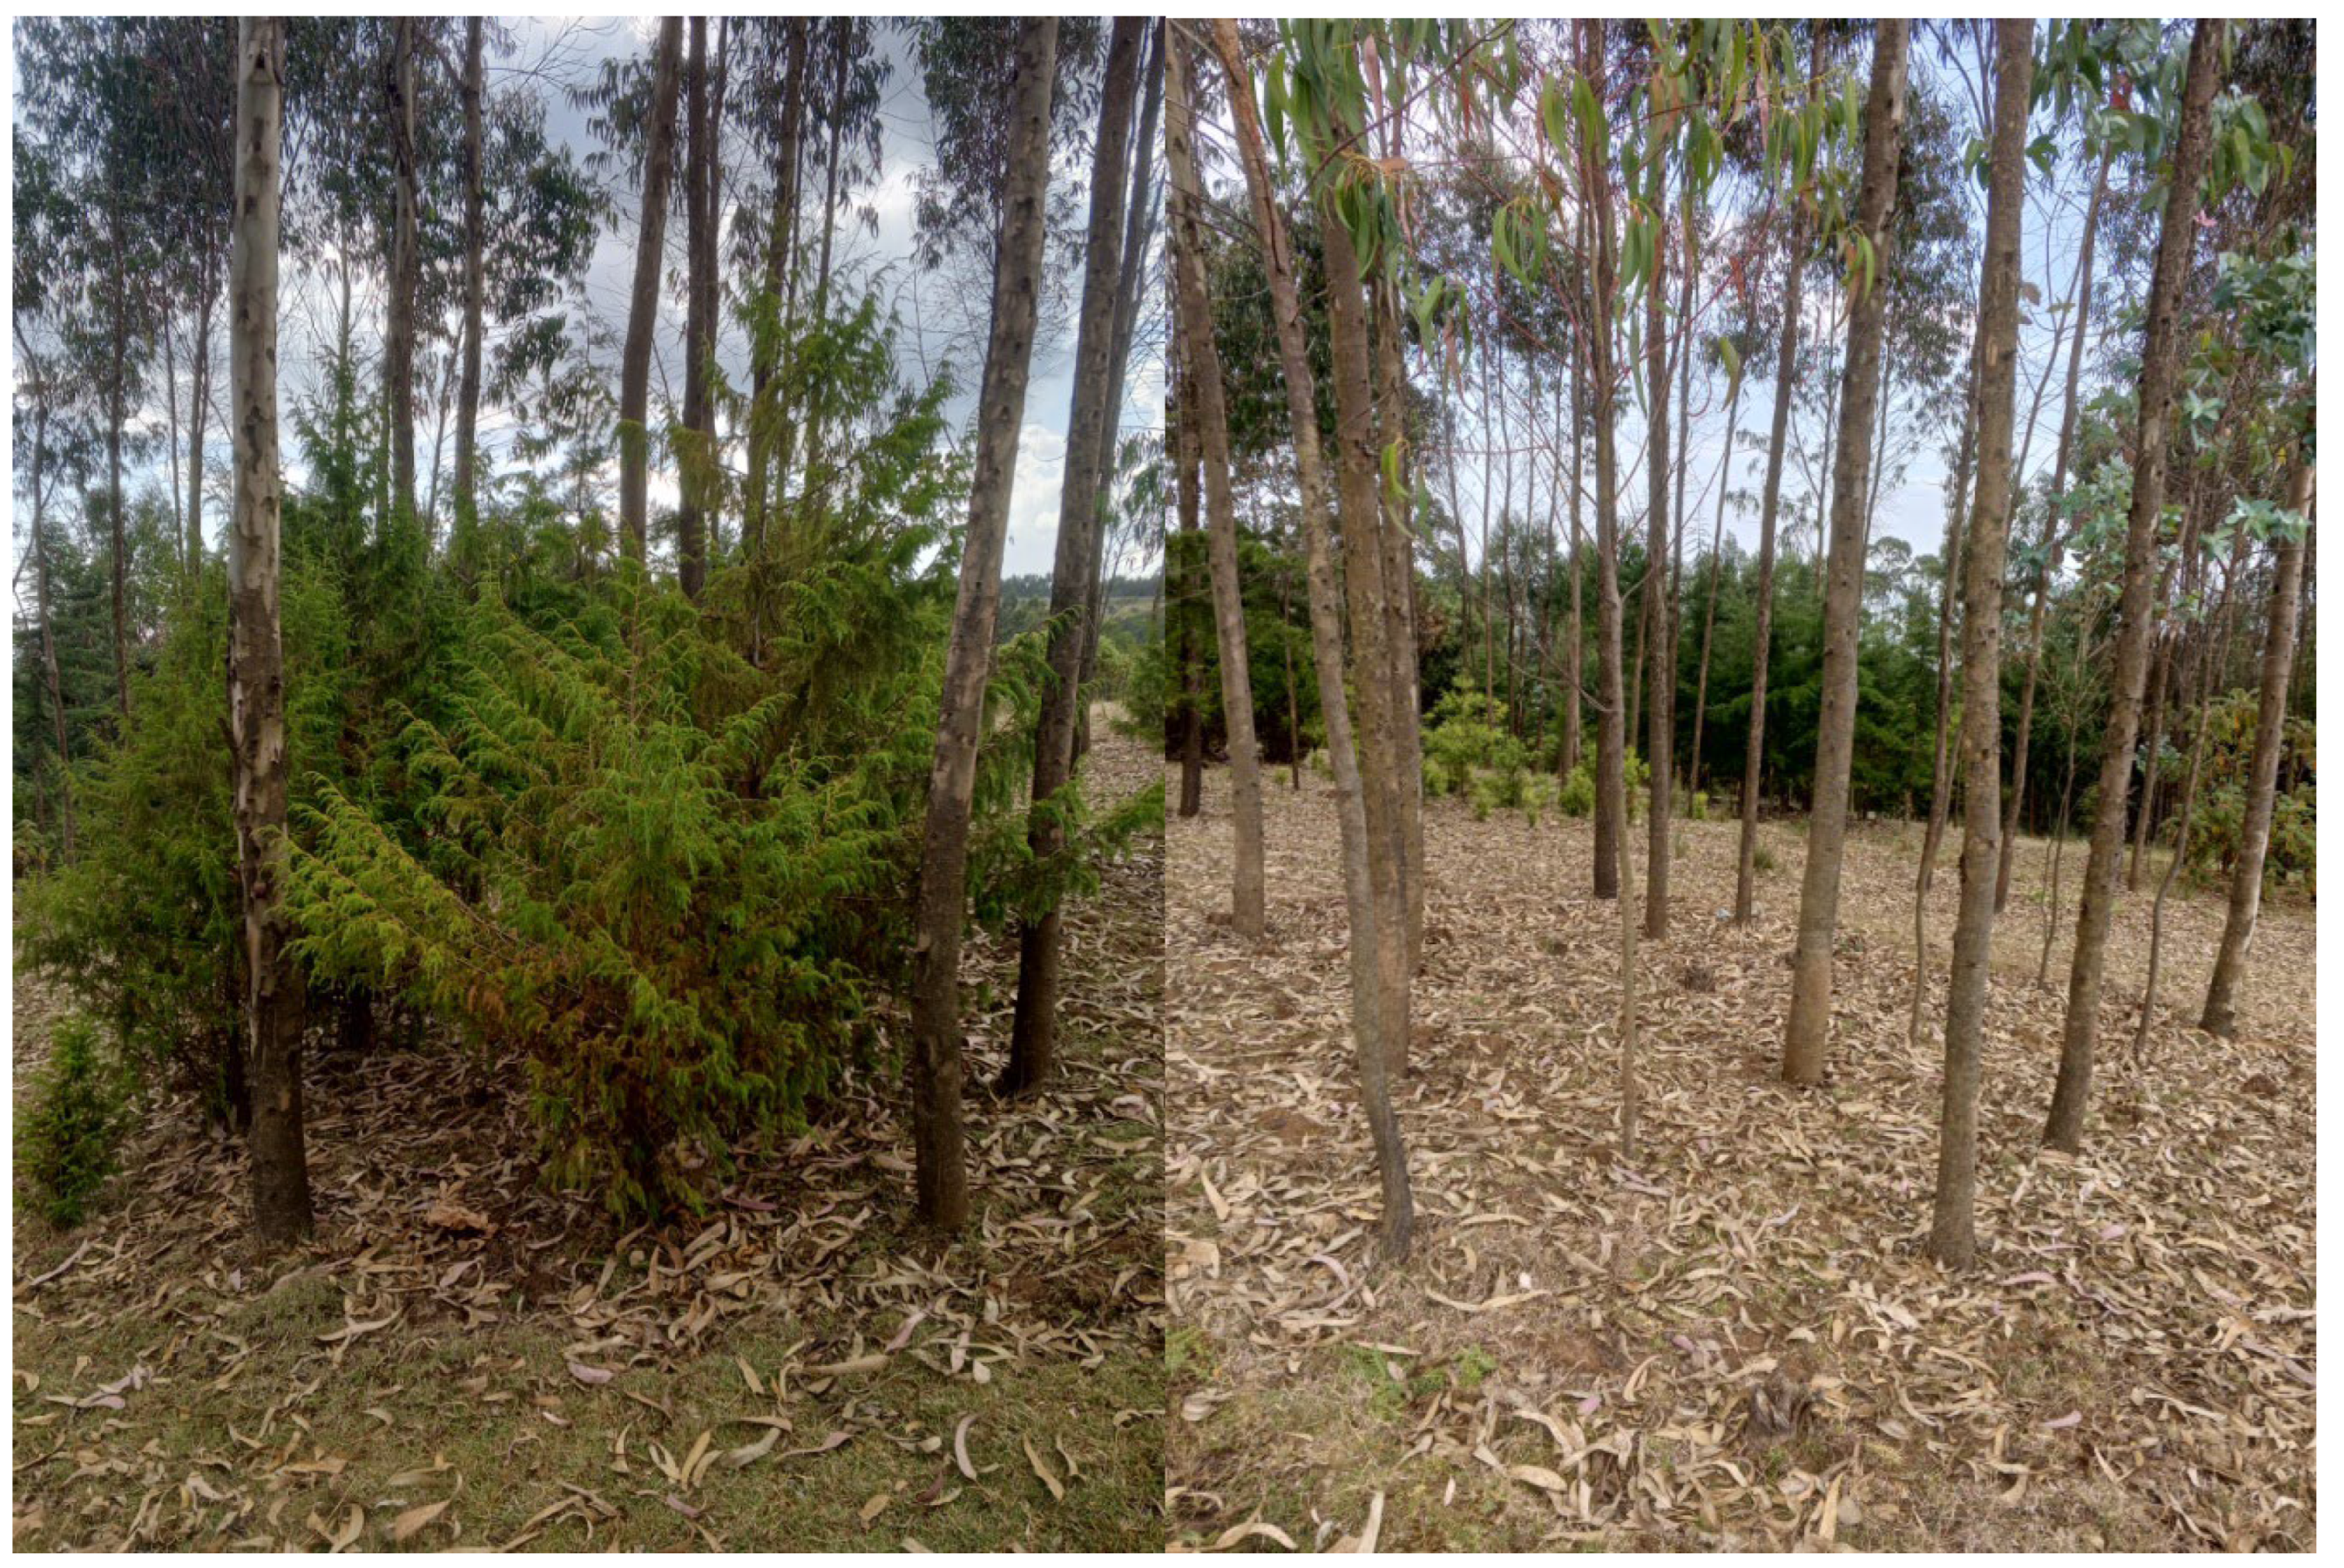
Figure 2.
field status of Eucalyptus globulus in mixed the left side and mono-crop in the right side.
Figure 2.
field status of Eucalyptus globulus in mixed the left side and mono-crop in the right side.
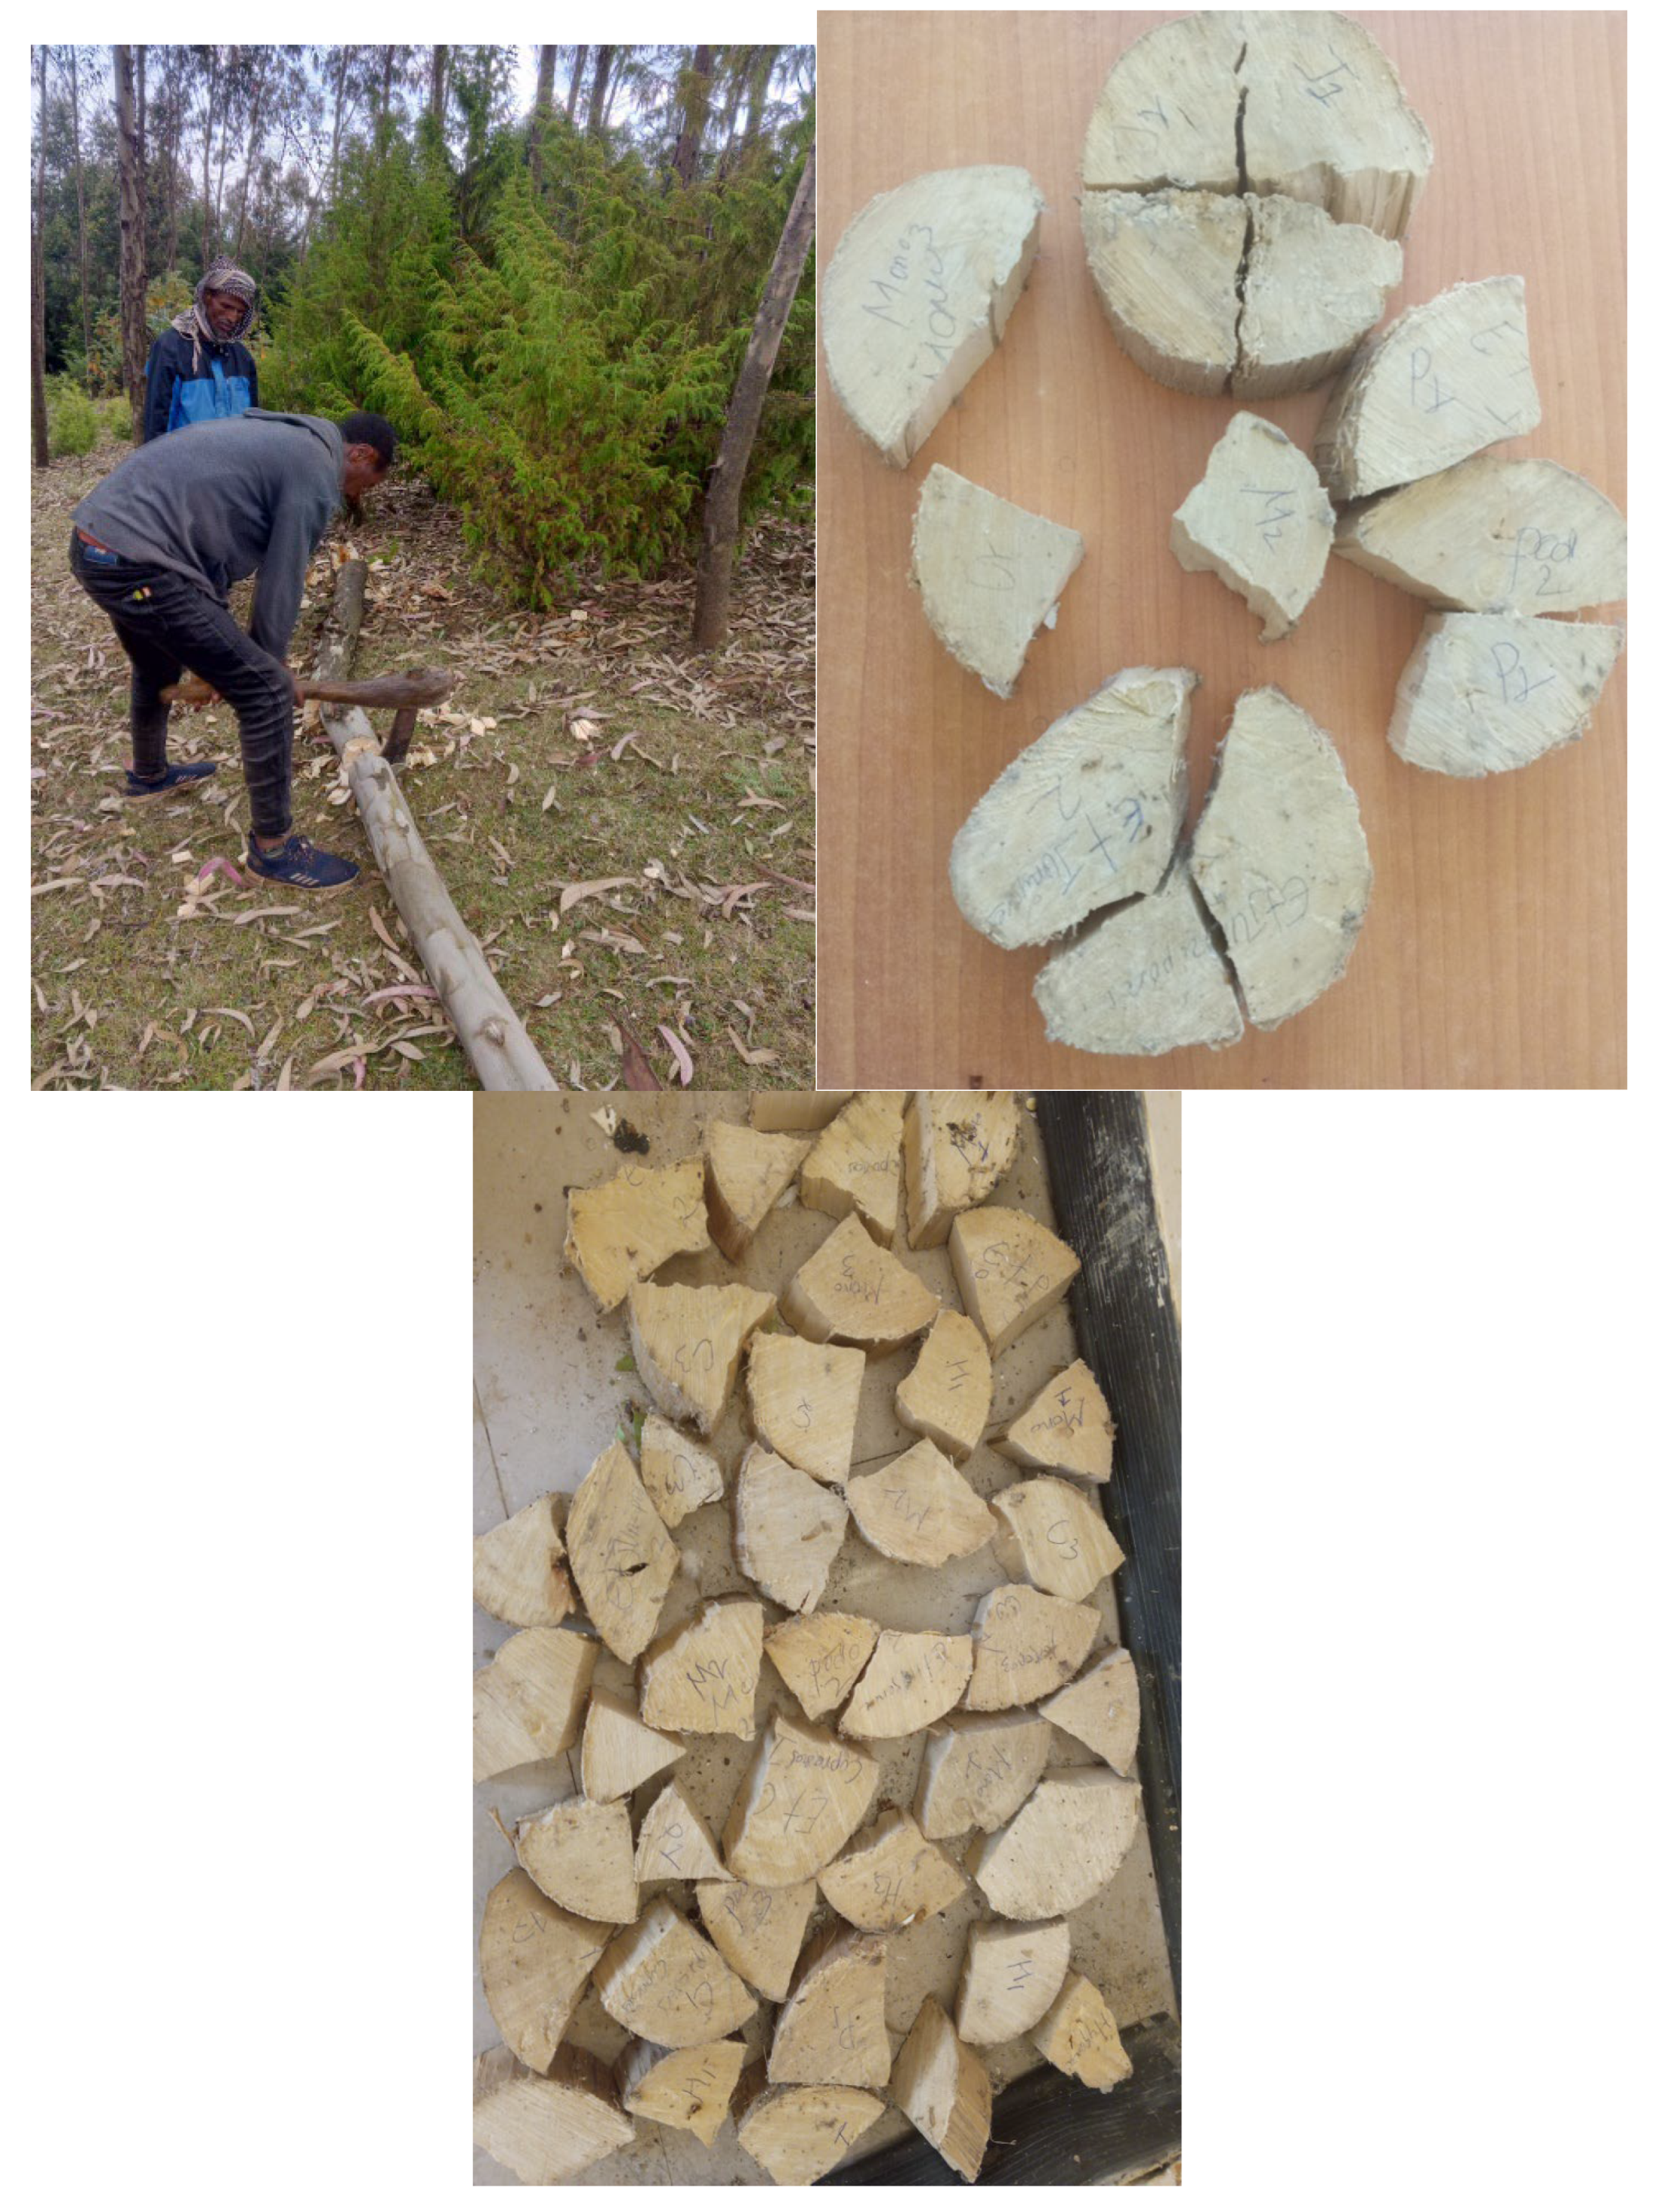
Figure 3.
harvesting tree for measurement of volume of log at the left; the middle and right side are wood samples collected to drive wood density for biomass estimation, these all piece of wood are collected from E. globulus by destructive method and labeled.
Figure 3.
harvesting tree for measurement of volume of log at the left; the middle and right side are wood samples collected to drive wood density for biomass estimation, these all piece of wood are collected from E. globulus by destructive method and labeled.
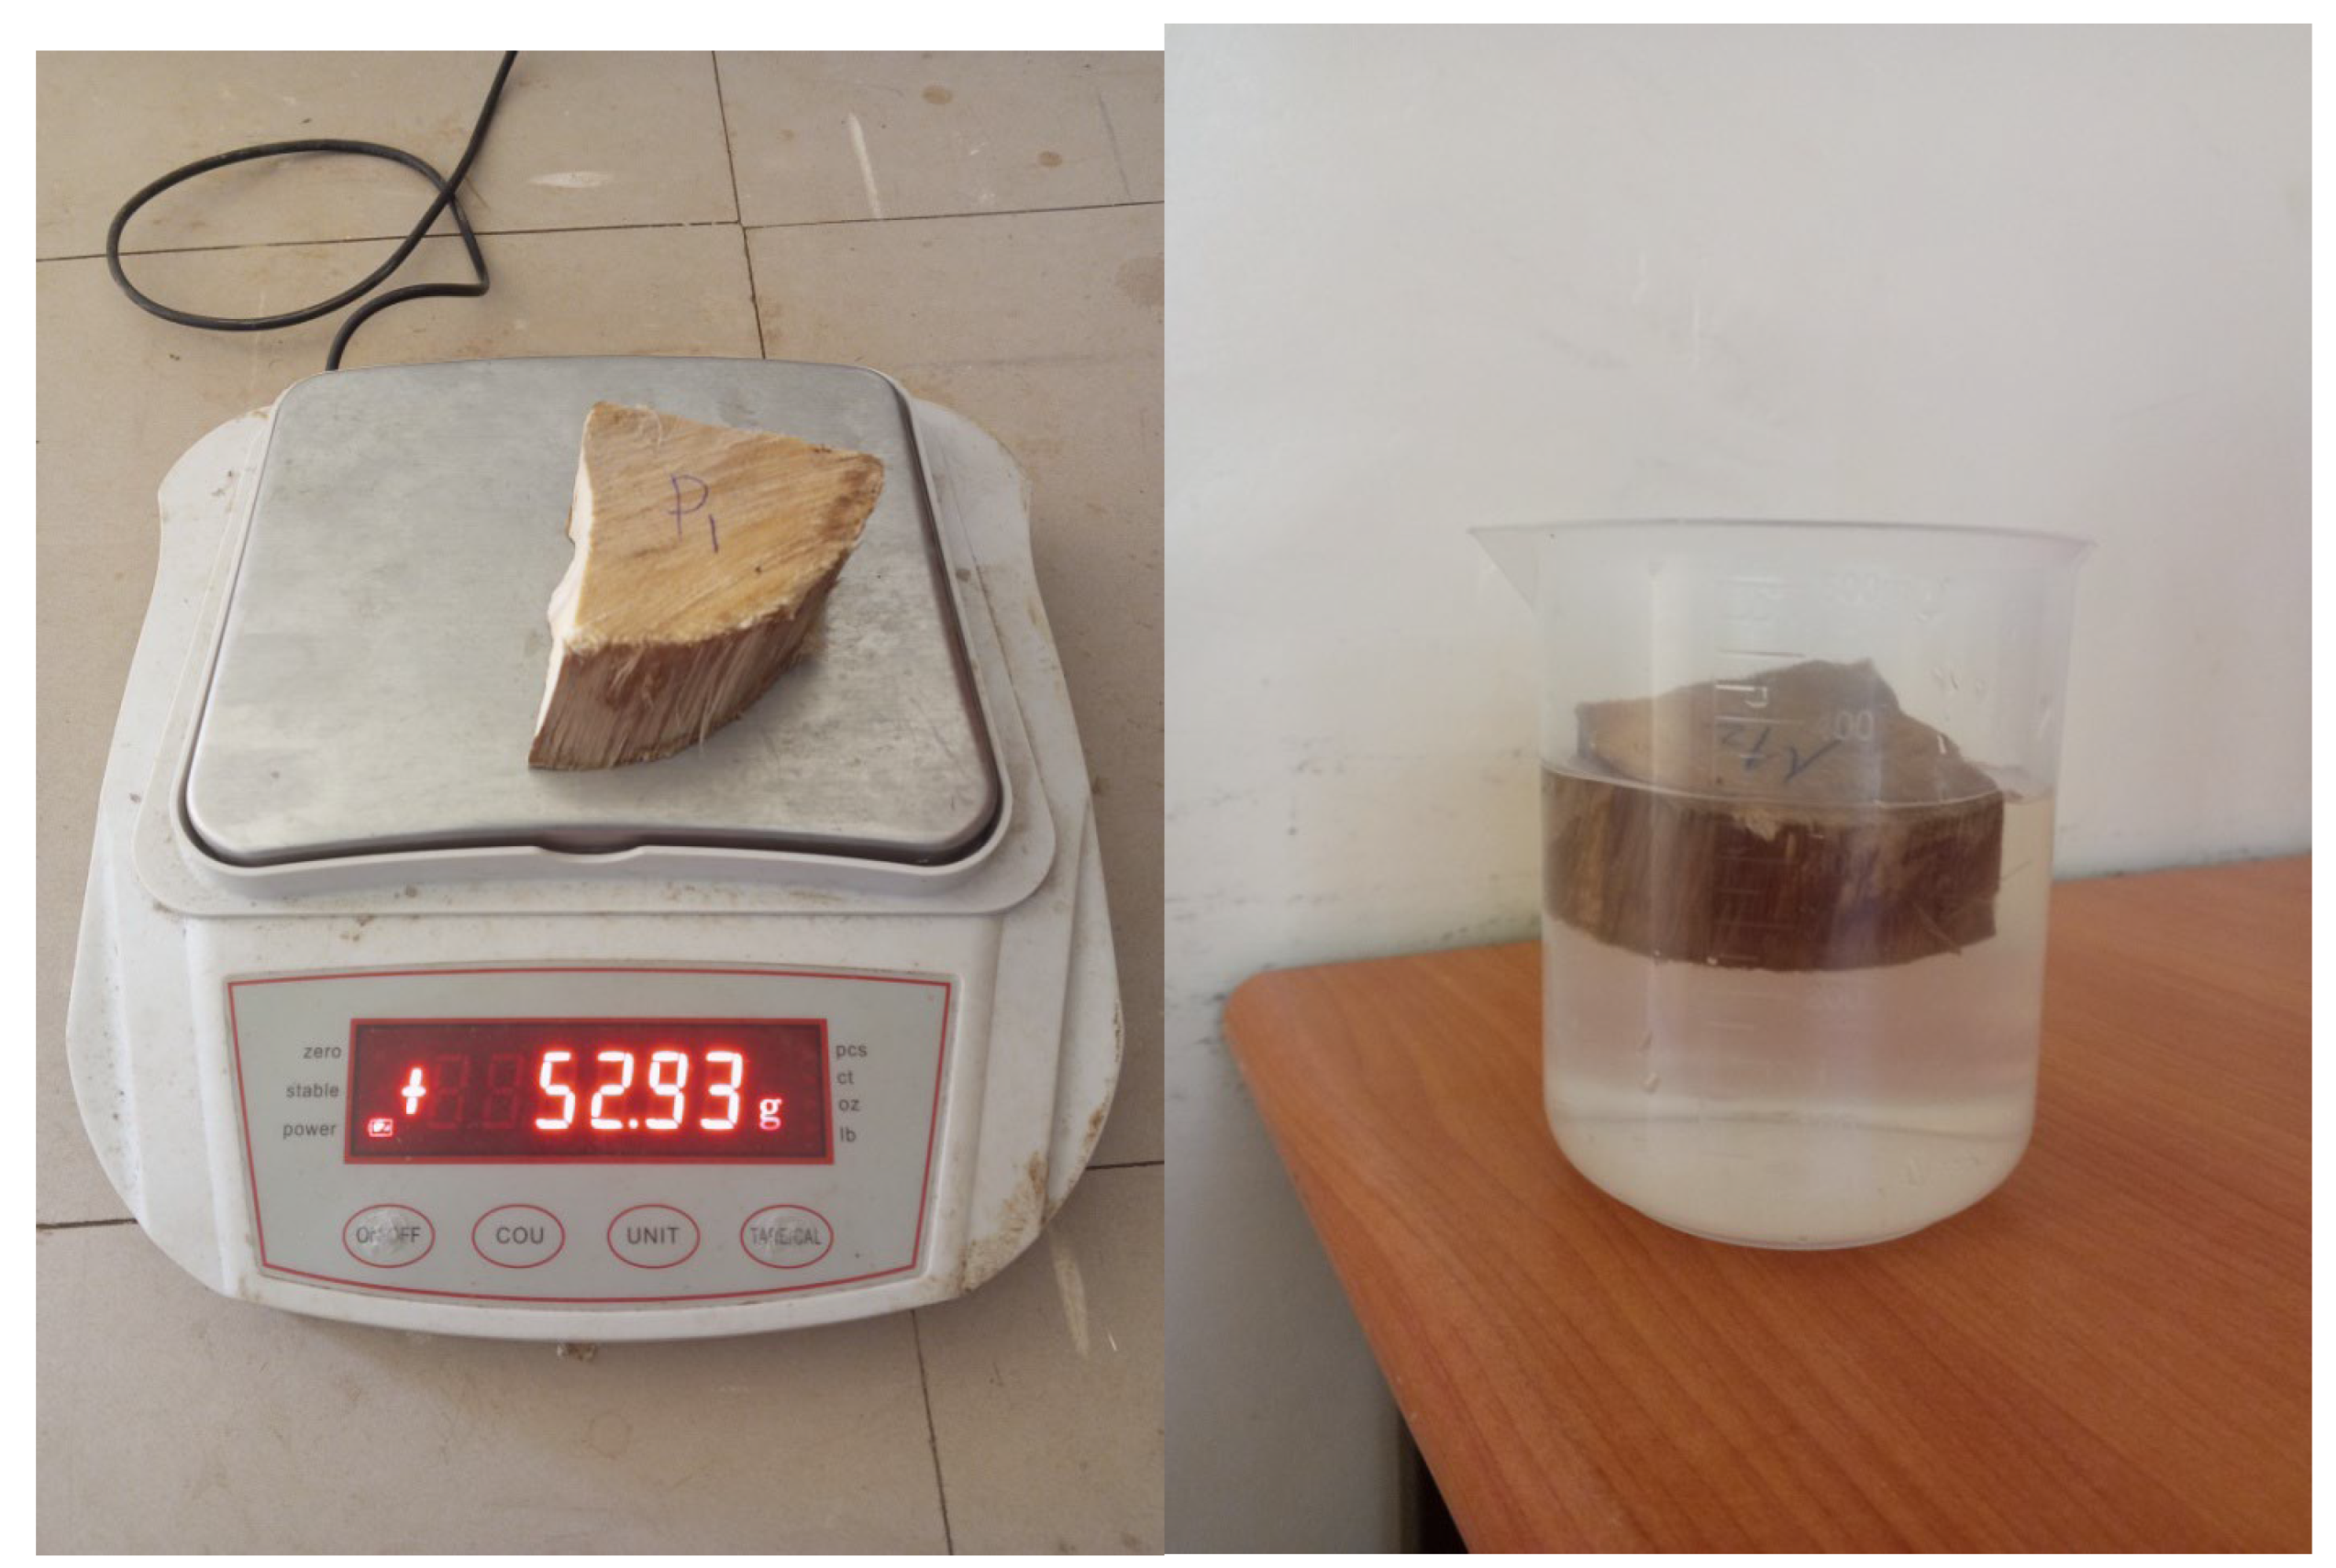
Figure 4.
measuring of the dry weight and volume of sampled wood using sensitive balance and graduated bicker in water displacement method respectively in laboratory.
Figure 4.
measuring of the dry weight and volume of sampled wood using sensitive balance and graduated bicker in water displacement method respectively in laboratory.
Data Collection
Measurements were taken on 6 trees in each of two lines (6 trees), each located in a different line alternatively in the interior of each plot. For most treatments, there were two rows of buffer trees between measurement trees and trees in other treatments. Early growth data were recorded like height, DBH, RCD, in each year for four year. Survival count was made in the second measurement season, 12 months after out-planting, and was constant when each tree was compared at>12 months of growing periods. Height was measured using Ruler during the first two year and Epyso-meter at year three and four when the trees are beyond to measurable height by ruler. RCD was measured by small caliper and DBH was measured caliper.
Distractive method was used to measure the log length of tree at different position. Wood density of the sample was measured using graduated cylinder by water displacement method.
Data Analysis
Dendrometric measurements were made for all trees for Eucalyptus globulus tree in the plot. Basal area (BA) (m2 ha−1) and volume (Vt) (m3 ha−1) for the planted tree were calculated using inventory data. Total volume was calculated using the conventional volume equation because local volume equations were not available for these species [
15]:
Where ln= natural logarism; V4= tree Volume at year four (4
th year); V1= tree Volume at year one (1
st year); T4=year four ( the 4
th year) T1= year one (the 1
st year)
Where V= tree volume, DBH= tree diameter at breast height, h= tree height and f=form factor (0.42)
Basal area was calculated using the formula
Where, BA= basal area, DBH= tree diameter at breast height
To calculate Volume and basal Area increment
Where VI= tree volume increment, Vyr1= tree volume in year one, Vyr4= tree volume in year four, BAI= tree basal area increment, BAyr1= tree basal area in year one, BAyr4= tree basal area in year four.
Relative Yield
The relative height, DBH, basal area and volume of
E. globulus was calculated using
E globulus under mixed plantation Vs pure
E. globulus plantation. This parameter is used as land equivalent ratio of
E. globulus. Those were calculated using the following formulas
Where RH= Relative Height, Hem= Height of Eucalyptus globulus in mono crop plantation, Hemix= height of Eucalyptus globulus in mixed plantation
Above Ground Biomass
Aboveground biomass was calculated using [
17] (Eq. 4) because this equation is the most recent and important predictive variable for estimation using diameter at breast height (DBH), total height (H), basic wood density (ρ).
Where AGBest = aboveground biomass (kg),D= DBH (cm), H= height (m), and ρ= basic wood density (gcm
−3). Accumulated aboveground and belowground carbon density was calculated [
18].
Where ACD = aboveground carbon density, BCD = belowground carbon density
Generally R software was used to analyzed the collected and manipulated data to determine significance difference at level of α=0.05. Mean separations was done using liner model (LM) and GLM to show the effect of year and treatment on the growth and yield of the E. globulus. The ggplot2 package from R soft ware was used to demonstrate some parameter in graphic way.
Result and Discussion
The results demonstrated that the growth performance of E. globules was not affected by mixing with different indigenous and exotics species in early growth period at field level. Height, Root collar diameter and number of branches in first two consecutive years have no showed significant difference.
Survival
The survival percent E. globulus was generally good, being greater than 75% for most of the tree species on all experimental plots in the study area. The highest survival was registered for
Eucalyptus globulus mixed with
Juniporous procera (96.27%) followed by
Eucalyptus globulus mixed with
Cupressus lusitanica (92.57%) and
Eucalyptus globulus mixed with
Podocarpus falcatus (88.87%). The lower survival count was recorded for pure plantation and Eucalyptus globulus with
Hygenia abysinica (85% and 75.9%). Several studies have found that mixed-species plantations are more productive in comparison with monocultures [
21]. Similar studies reported that survival percent of Eucalyptus is greater in mixed plantation than pure stand [
22].
Table 1.
The growth performance of E. globulus mixed planting with selected tree species in year one.
Table 1.
The growth performance of E. globulus mixed planting with selected tree species in year one.
| Treatment |
Height (m) |
RCD (cm) |
Survival |
Branch |
| E. globulus + Cupressus lusitanica |
1.16 |
1.53 |
92.57 |
16.87 |
| E. globulus + Podocarpus falcatus |
1.02 |
1.73 |
88.87 |
14.57 |
| E. globulus + Juniporous procera |
1.28 |
1.93 |
96.27 |
20.33 |
| E. globulus + Hygenia abysinica |
0.94 |
1.7 |
75.9 |
15.87 |
|
E. globulus only |
1.04 |
1.53 |
85 |
16.6 |
| CV |
22.73 |
26.29 |
13.8 |
19.37 |
| LSD |
NS |
NS |
NS |
NS |
Height
The height of
E. globulus ranged from 5.52 to 6.12 m in three years. The highest height of (6.12m)
E. globulus was recorded on plots
E. globulus mixed with
Juniporous procera, while the lowest height was recorded in plots E.
globulus mixed with
Hygenia abysinica. This was may be the growth performance of
Hygenia abysinica was higher than other tree species mixed with
E. globulus, which may be have higher resource competition than other. Another field observation in this study was height growth of
E. globulus is better when it mixed with the tree species those have lower growth performance like
Juniporus procera and
Podocarpus falcatus (Table 2).
Root Collar Diameter (RCD)
RCD measurements made consecutively for three years to all the planted trees. Significant differences between treatment in RCD and DBH were not detected. However, in this study Plots treated with Eucalyptus globulus mixed with Cupressus lusitanica recorded the highest RCD, while plots treated with E. globulus mixed with Juniporous procera had higher m the highest DBH. Generally RCD growth for all the trees showed an increasing trend and no-significant differences along the growing periods are provided.
Table 2.
The growth performance of E. globulus mixed planting with selected tree species in year two.
Table 2.
The growth performance of E. globulus mixed planting with selected tree species in year two.
| Treatment |
Height |
DBH |
Basal Area |
Log Volume |
| E.globulus +C. lustanica |
5.24a |
4.93 |
26.84 |
289.48a |
| E. globulus + P. falcatus |
4.83ab |
4.77 |
24.08 |
213.39ab |
| E. globulus +J. procera |
4.82ab |
4.82 |
23.89 |
146.8b |
| E. Globulus + H. abysinica |
4.57b |
4.77 |
25.11 |
185.79b |
| E. globulus Mono |
4.56b |
4.6 |
22.76 |
136.85 |
| CV |
14.67 |
11.75 |
26.73 |
49.95 |
| LSD |
0.58 |
NS |
NS |
80.28 |
According to the present study all parameter measured from
E. globulus have no shows significant difference (
Table 3). This may be the tree those mixed with
E. globulus were not be effect at their early growth stage rather than E. globulus is fast growing tree and have more resource consumption. In line with my study, the study at Hamakua coast reported that early height growth of Eucalyptus was very rapid than other mixed tree during the first 4 yr after out planting averaging nearly 4 m/yr and there is no significant difference among treatment [
23]. Similar results were reported that competition from
E. robusta planted with
C. equisetifolia did not have any significant effect on the quantity of N fixed or by
C. equisetifolia at early growing stage (between 6-24 months of age) [
24]. However, this may be due to less intense competition in the plantation when compared to the pots. In addition, the competition for resource during at early growth stage at plantation site E. globulus is higher than other species. While
E. globulus may have competed for N, the net effect of competition for all resources from
E. globulus on
C. cunninghamiana must have been less than the competition from other
C. cunninghamiana [
24].
Year Effect on Growth and Yield of E. globulus
According to the table below the height of
E. globulus was affected by the interaction between years and mixed (
Table 4).
E. globulus mixed with
Juniporus procera had attained higher height than other in the three year; on the other hand the height of E
. globulus was higher in the third than the first year. It shows a very fast growth rate of the species. In addition monoculture
E. globulus had recorded lower height growth rate than in mixed. In line with this research result the research done in Bangladish show that the initial growth performance of
A. auriculiformis and
G. arborea performed better in combinations than in pure plantations [
25].
Table 3.
Effect of year and planting system the growth performance and yield E. globulus.
Table 3.
Effect of year and planting system the growth performance and yield E. globulus.
| Treatment |
Height |
DBH |
Basal Area m2/ha |
Log Volume ton/ha |
| Year |
Planting System |
| Yea one |
E. globulus +C. lustanica |
1.15fg |
1.55e |
1.99f |
2.59d |
| |
E. globulus + P. falcatus |
1.02g |
1.71e |
2.41f |
2.76d |
| |
E. globulus +J. procera |
1.28efg |
1.92e |
3.11f |
3.38d |
| |
E. Globulus + H. abysinica |
0.94g |
1.68e |
2.25f |
2.04d |
| |
E. globulus Mono |
1.04g |
1.55e |
1.95f |
1d |
| year two |
E. globulus + C. lustanica |
2.38de |
3.23d |
8.26ef |
22.27d |
| |
E. globulus + P. falcatus |
2.45d |
3.17d |
7.98ef |
20.74d |
| |
E. globulus + J. procera |
2.53d |
3.16d |
8.04ef |
16.68d |
| |
E. Globulus + H. abysinica |
2.25def |
2.94d |
6.81f |
14.02d |
| |
E. globulus Mono |
2.35de |
3.01d |
7.22f |
13.34d |
| year three |
E. globulus + C. lustanica |
5.84c |
5.06c |
20.13d |
131.9d |
| |
E. globulus + P. falcatus |
5.58c |
5.22c |
21.47d |
125.25d |
| |
E. globulus + J. procera |
6.12c |
5.34c |
22.46d |
109.84d |
| |
E. Globulus + H. abysinica |
5.52c |
4.82c |
18.37de |
93.78d |
| |
E. globulus Mono |
5.65c |
3.01c |
19.83d |
86.91d |
| year Four |
E. globulus + C. lustanica |
11.57a |
9.89a |
76.98a |
100.17a |
| |
E. globulus + P. falcatus |
10.27b |
8.97ab |
64.48bc |
704.45b |
| |
E. globulus + J. procera |
9.35b |
8.88b |
61.95c |
457.31c |
| |
E. Globulus + H. abysinica |
9.53b |
9.64ab |
73ab |
633.35b |
| |
E. globulus Mono |
9.23b |
8.85b |
62.05c |
445.56c |
| |
CV |
14.67 |
11.75 |
26.73 |
49.95 |
| |
LSD |
1.17 |
0.92 |
10.84 |
160.56 |
Growth Rate of Height and RCD
The growth rate of
E. globulus was analyzed by using year one and year three measurements in height and root collar diameter. Even though
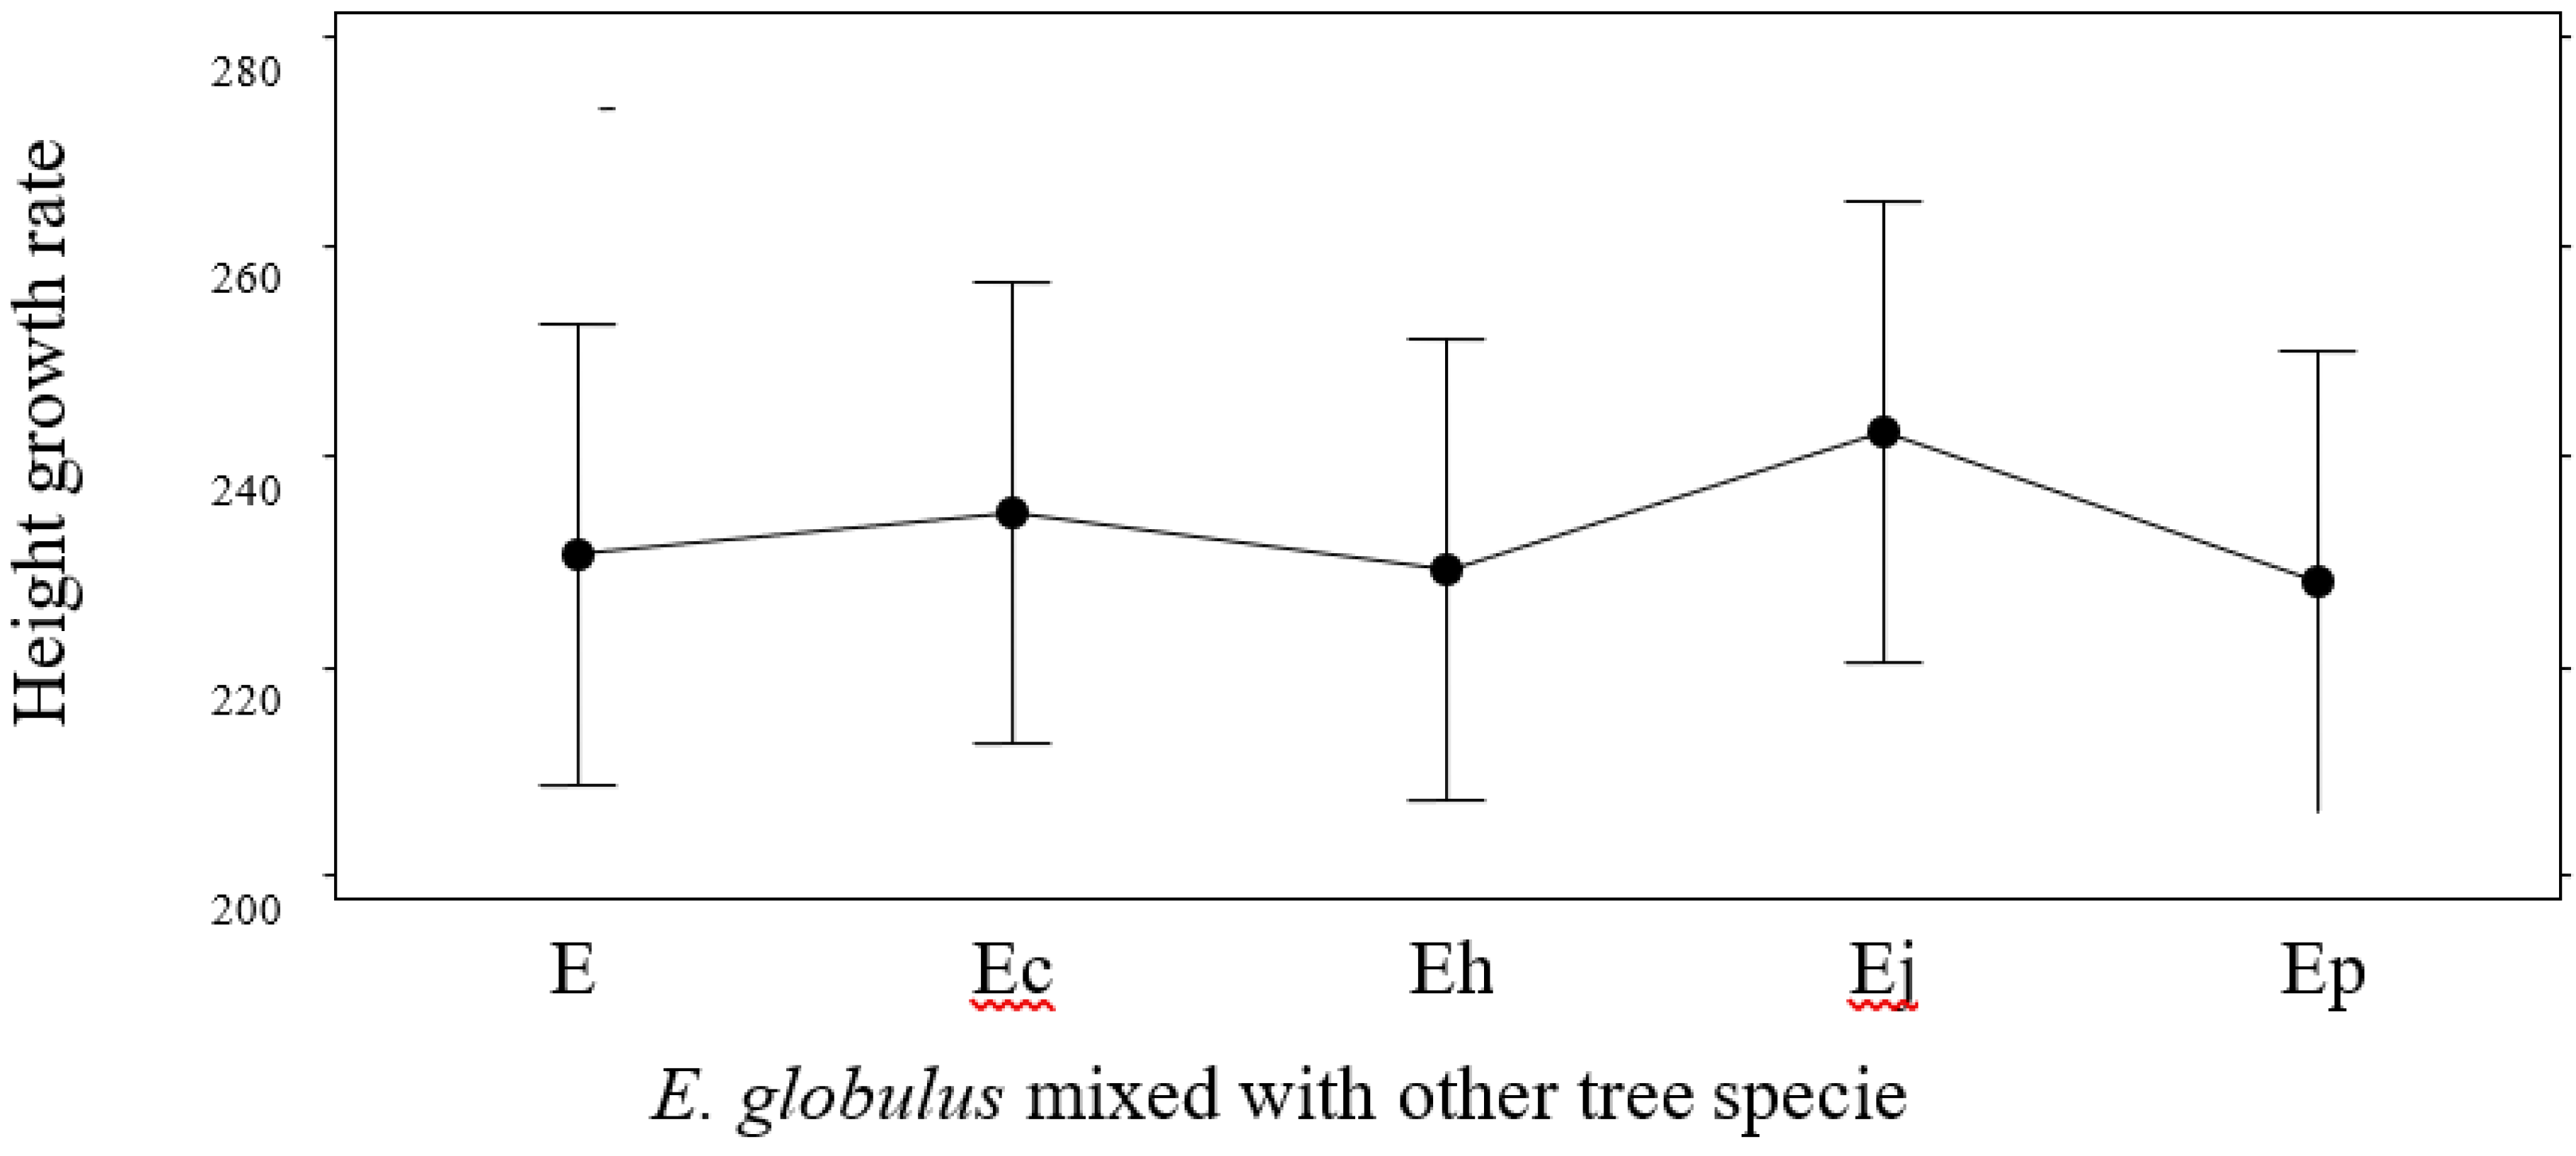
E. globulus statically significance difference was on declare, the highest mean growth rate of height was measured on
E. globulus mixed with
Juniporus procera (242.4%) and lower was recorded on
E. globulus mixed with
Hygenia abysinica (229.1%) (
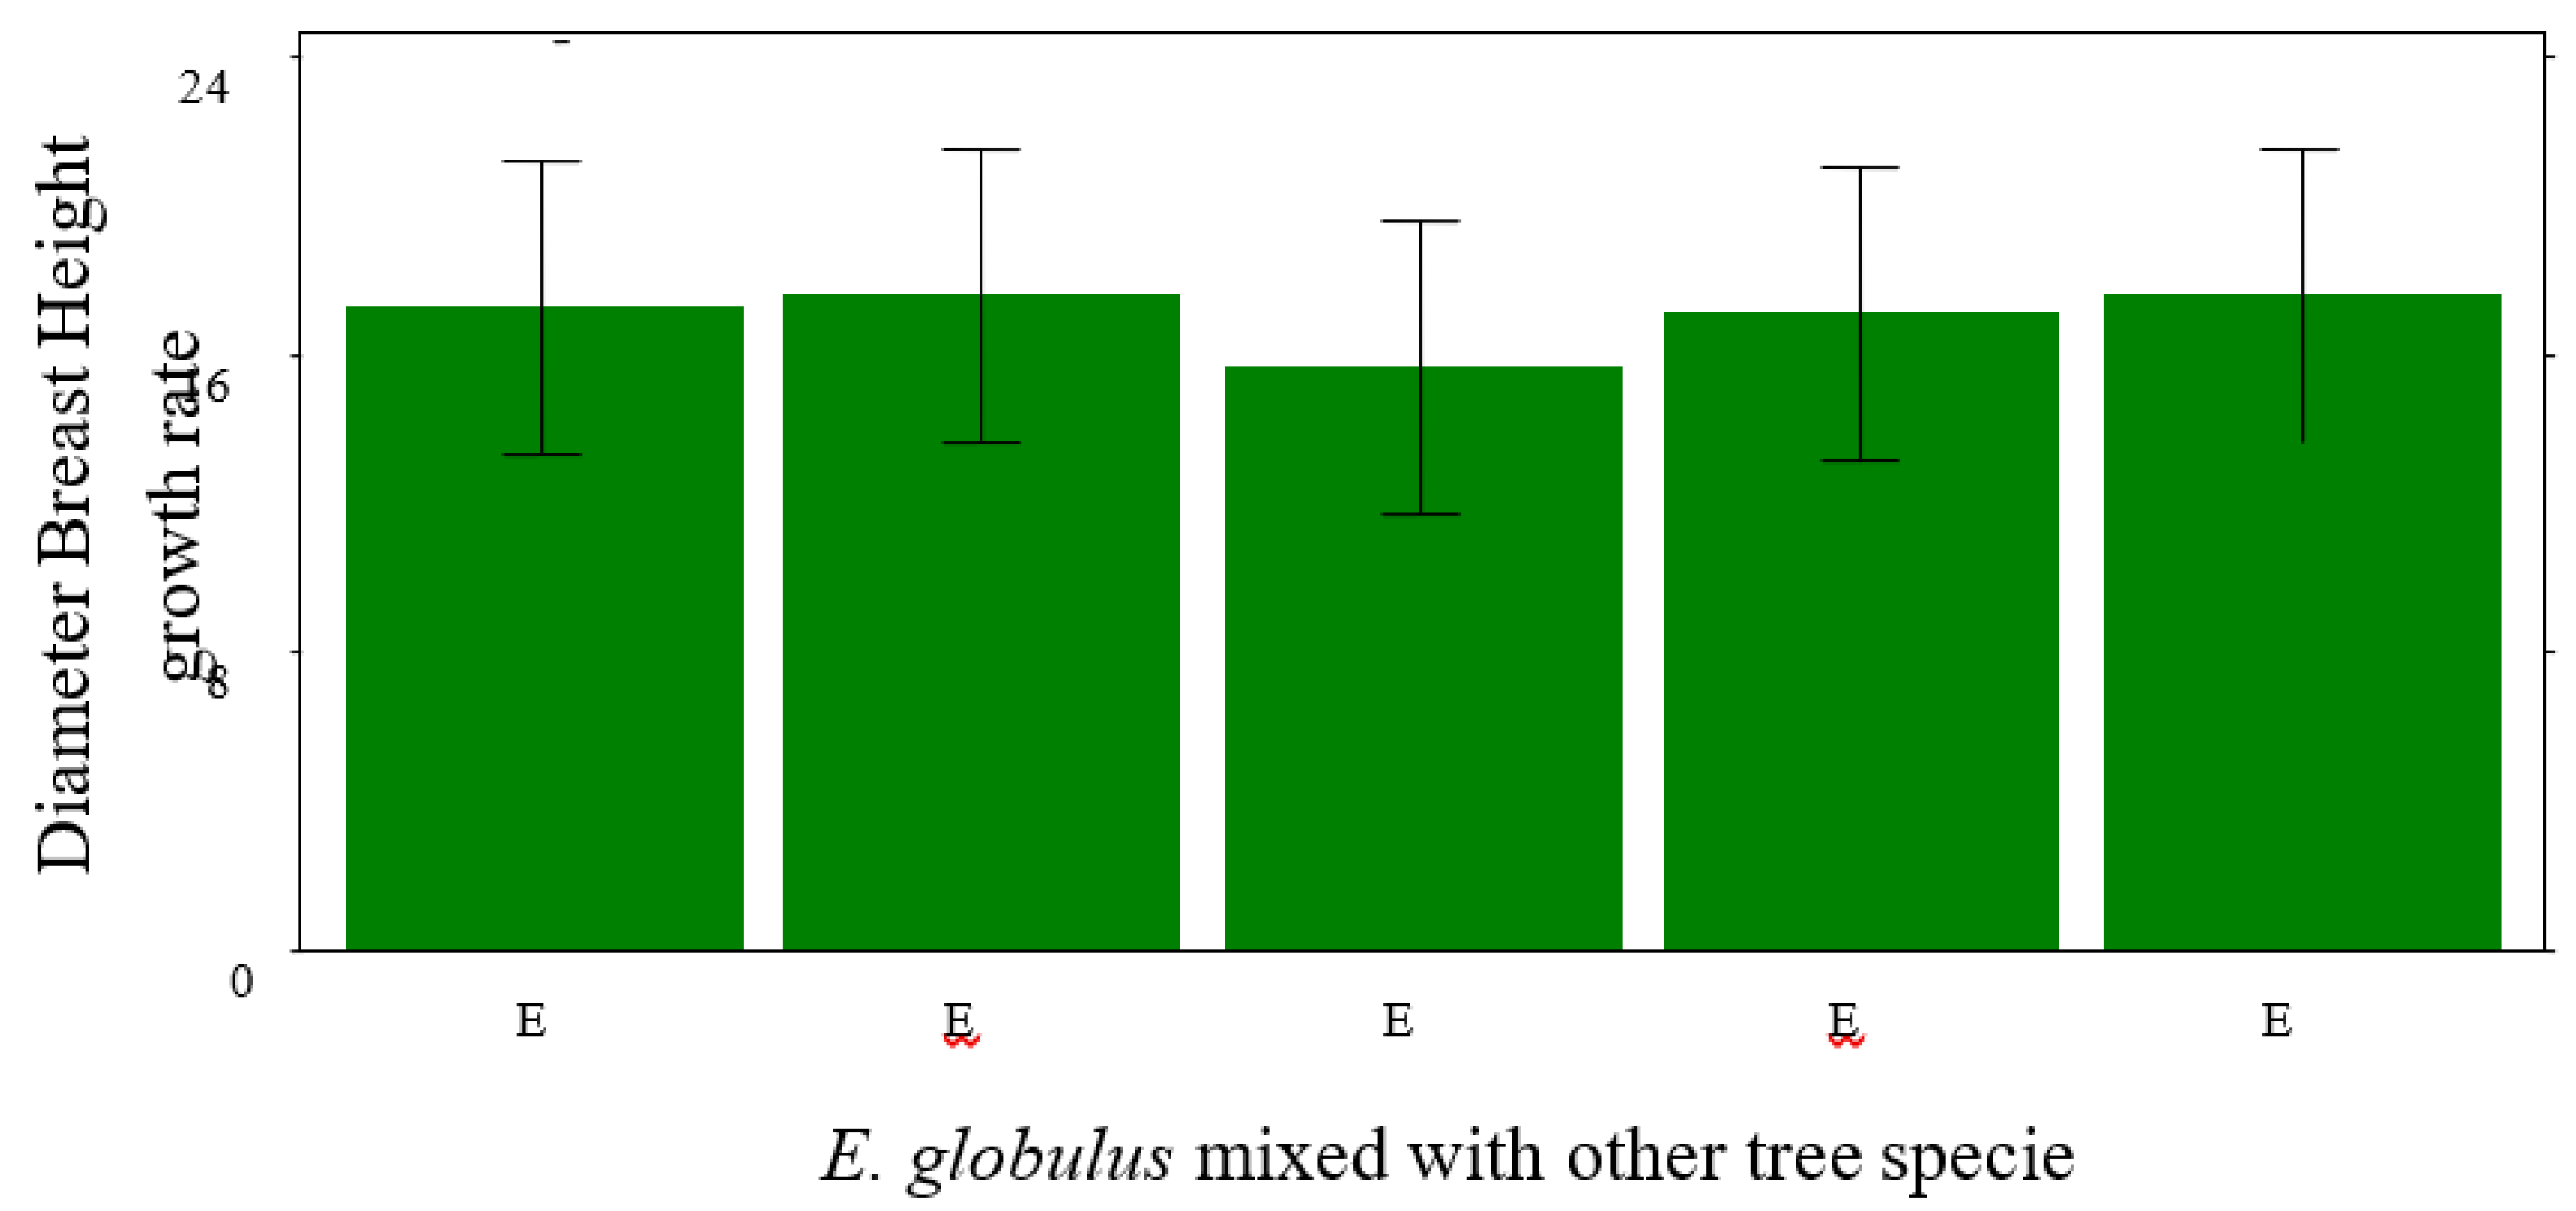
Figure 3). Similarly, in DBH highest means is recorded on treatment
Cupressus lustanica with
E. globulus (175.83%) and lower is recorded on
E. globulus mixed with
Juniporus procera(170.83) (
Figure 4). Mixtures with stratification can also enhance individual-tree growth rates and stem quality of species in upper canopies, whilst minimizing the proportion of taller species that can reach the highest production [
29,
30].
Figure 5.
Means and 95% C.I. of height growth rate for E. globulus mixed with one type of exotics and three indigenous tree species in early growth.
Figure 5.
Means and 95% C.I. of height growth rate for E. globulus mixed with one type of exotics and three indigenous tree species in early growth.
Figure 6.
Means and 95% C.I. of Root Collar Diameter for E. globulus mixed with one type of exotics and three indigenous tree species in early growth. Where E = E. globulus only; Ec = E. globulus + Cupressus lustanica; Eh = E. globulus + Hygenia abysinica; Ej = E. globulus + Juniporus procera; Ep = E. globulus + Podocarpus falcatus.
Similarly, the study done at Hawaii showed that, eucalyptus diameters grown in stands with 50% Albania averaged nearly 20 cm at 10 yr and were significantly greater than those in pure, fertilized stands and mixed stands with lower amounts of Albania. Diameters of Eucalyptus in the 66% Albania treatment were larger yet (23.5 cm) and differed significantly from those of all other treatments [
22].
Growth Rate of Tree Volume
Figure 7.
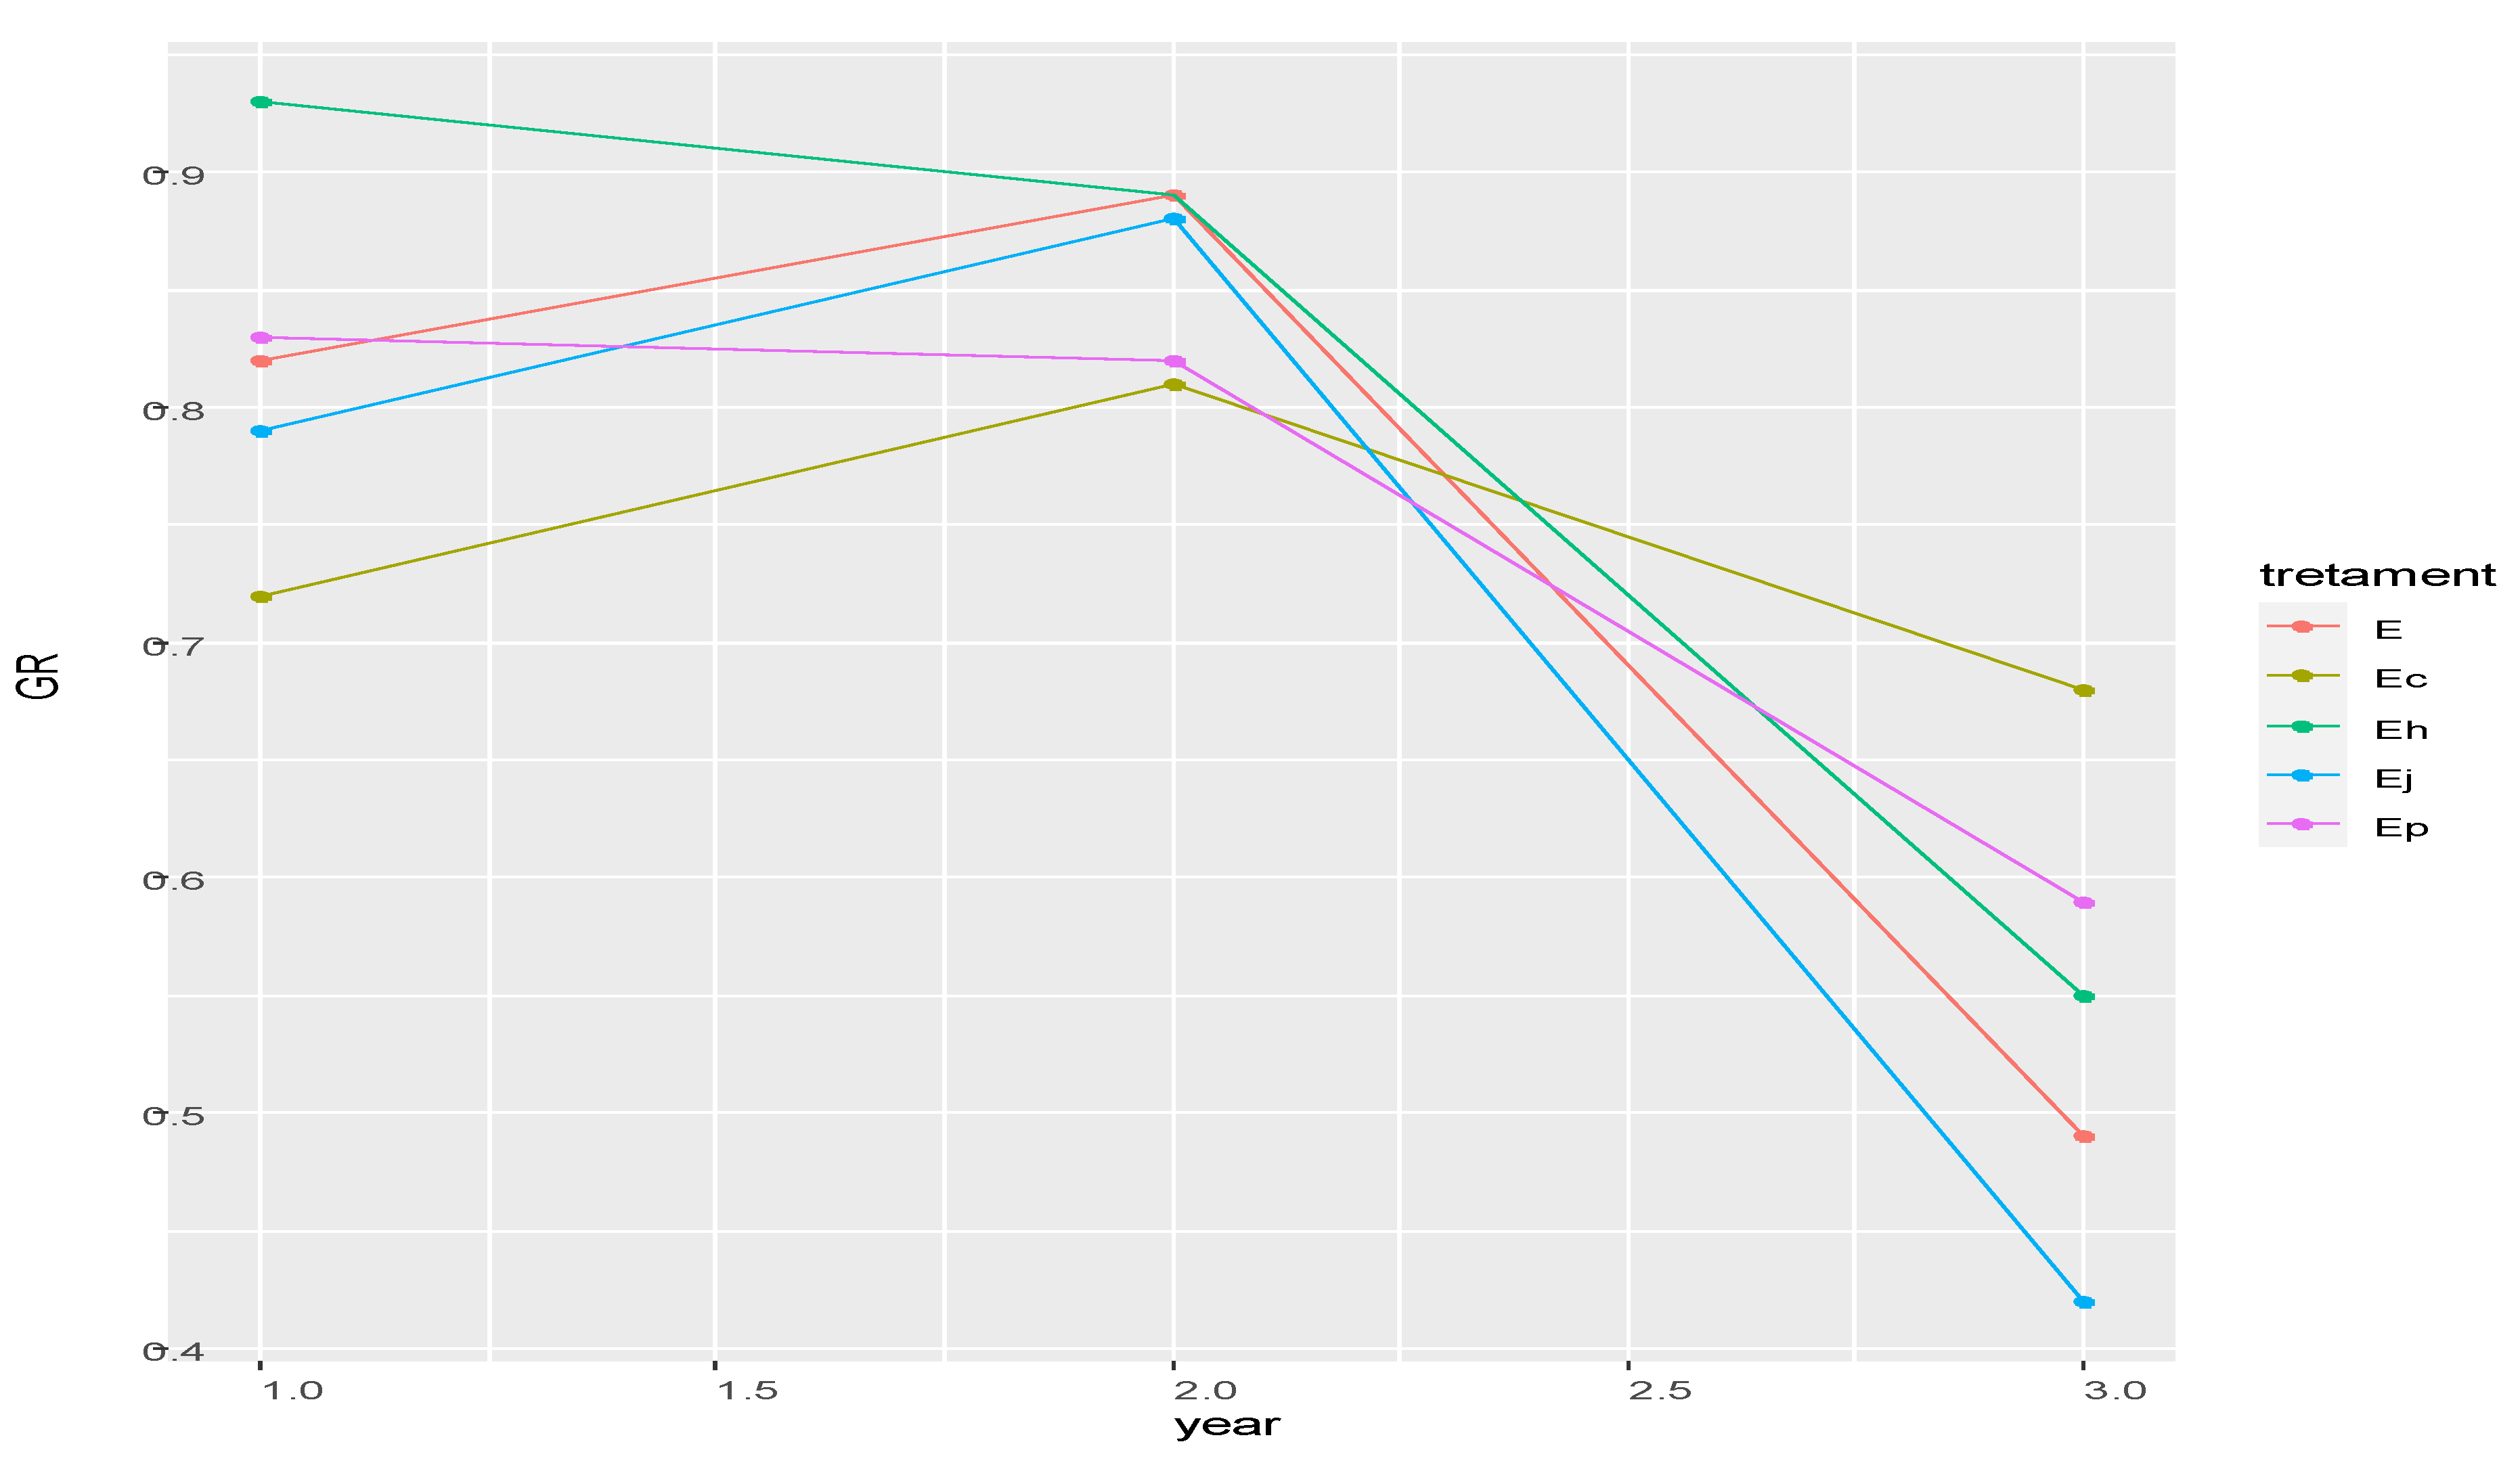
Trend of the rate of yield increment in volume through four year growth of E. globulus; E = pure E. globulus; Ec = E. globulus mixed with C. lustanica; Eh = E. globulus mixed with Hygenia abysinica; Ej = E. globulus mixed with Juniporus procera; Ep = E. globulus mixed with Podocarpus falcatus.
Relative Yield
The annual yield increment of
E. globulus in mixed plantation was analyzed relative to the mono-crop E. globulus in terms of tree height, DBH, basal area and volume of logs. Generally, there is the fluctuation of parameters from year to year. As shown below the table relative height increment and relative DBH increment of E, globulus declare significance difference between mixed plantation and mono-crop. The highest relative height increment and DBH increment E. globulus was recorded at the mixed with
Juniporus procera where as the lowest was recorded at mono-crop (
Table 5). On the other hand basal area increment was not shows significant difference among the treatments.
Table 5.
the relative Height, DBH and Basal area increment of E. globulus under mixed plantation and mono-crop.
Table 5.
the relative Height, DBH and Basal area increment of E. globulus under mixed plantation and mono-crop.
| |
Yield |
| Treatment |
Relative Height |
Relative DBH |
Basal Area |
|
E. globulus with Juniporus procera
|
1.3a |
1.11a |
10.9 |
|
E. globulus with Cupressus lustanica
|
1.06ab |
1.05ab |
10.23 |
|
E. globulus with Hygenia abysinica
|
1.03ab |
1.03ab |
9.89 |
|
E. globulus with Podocarpus falcatus
|
1.01b |
1.07ab |
10.61 |
|
E. globulus only |
1b |
1b |
10.1 |
| LSD |
0.28 |
0.09 |
ns |
| CV |
10.96 |
8.9 |
46.44 |
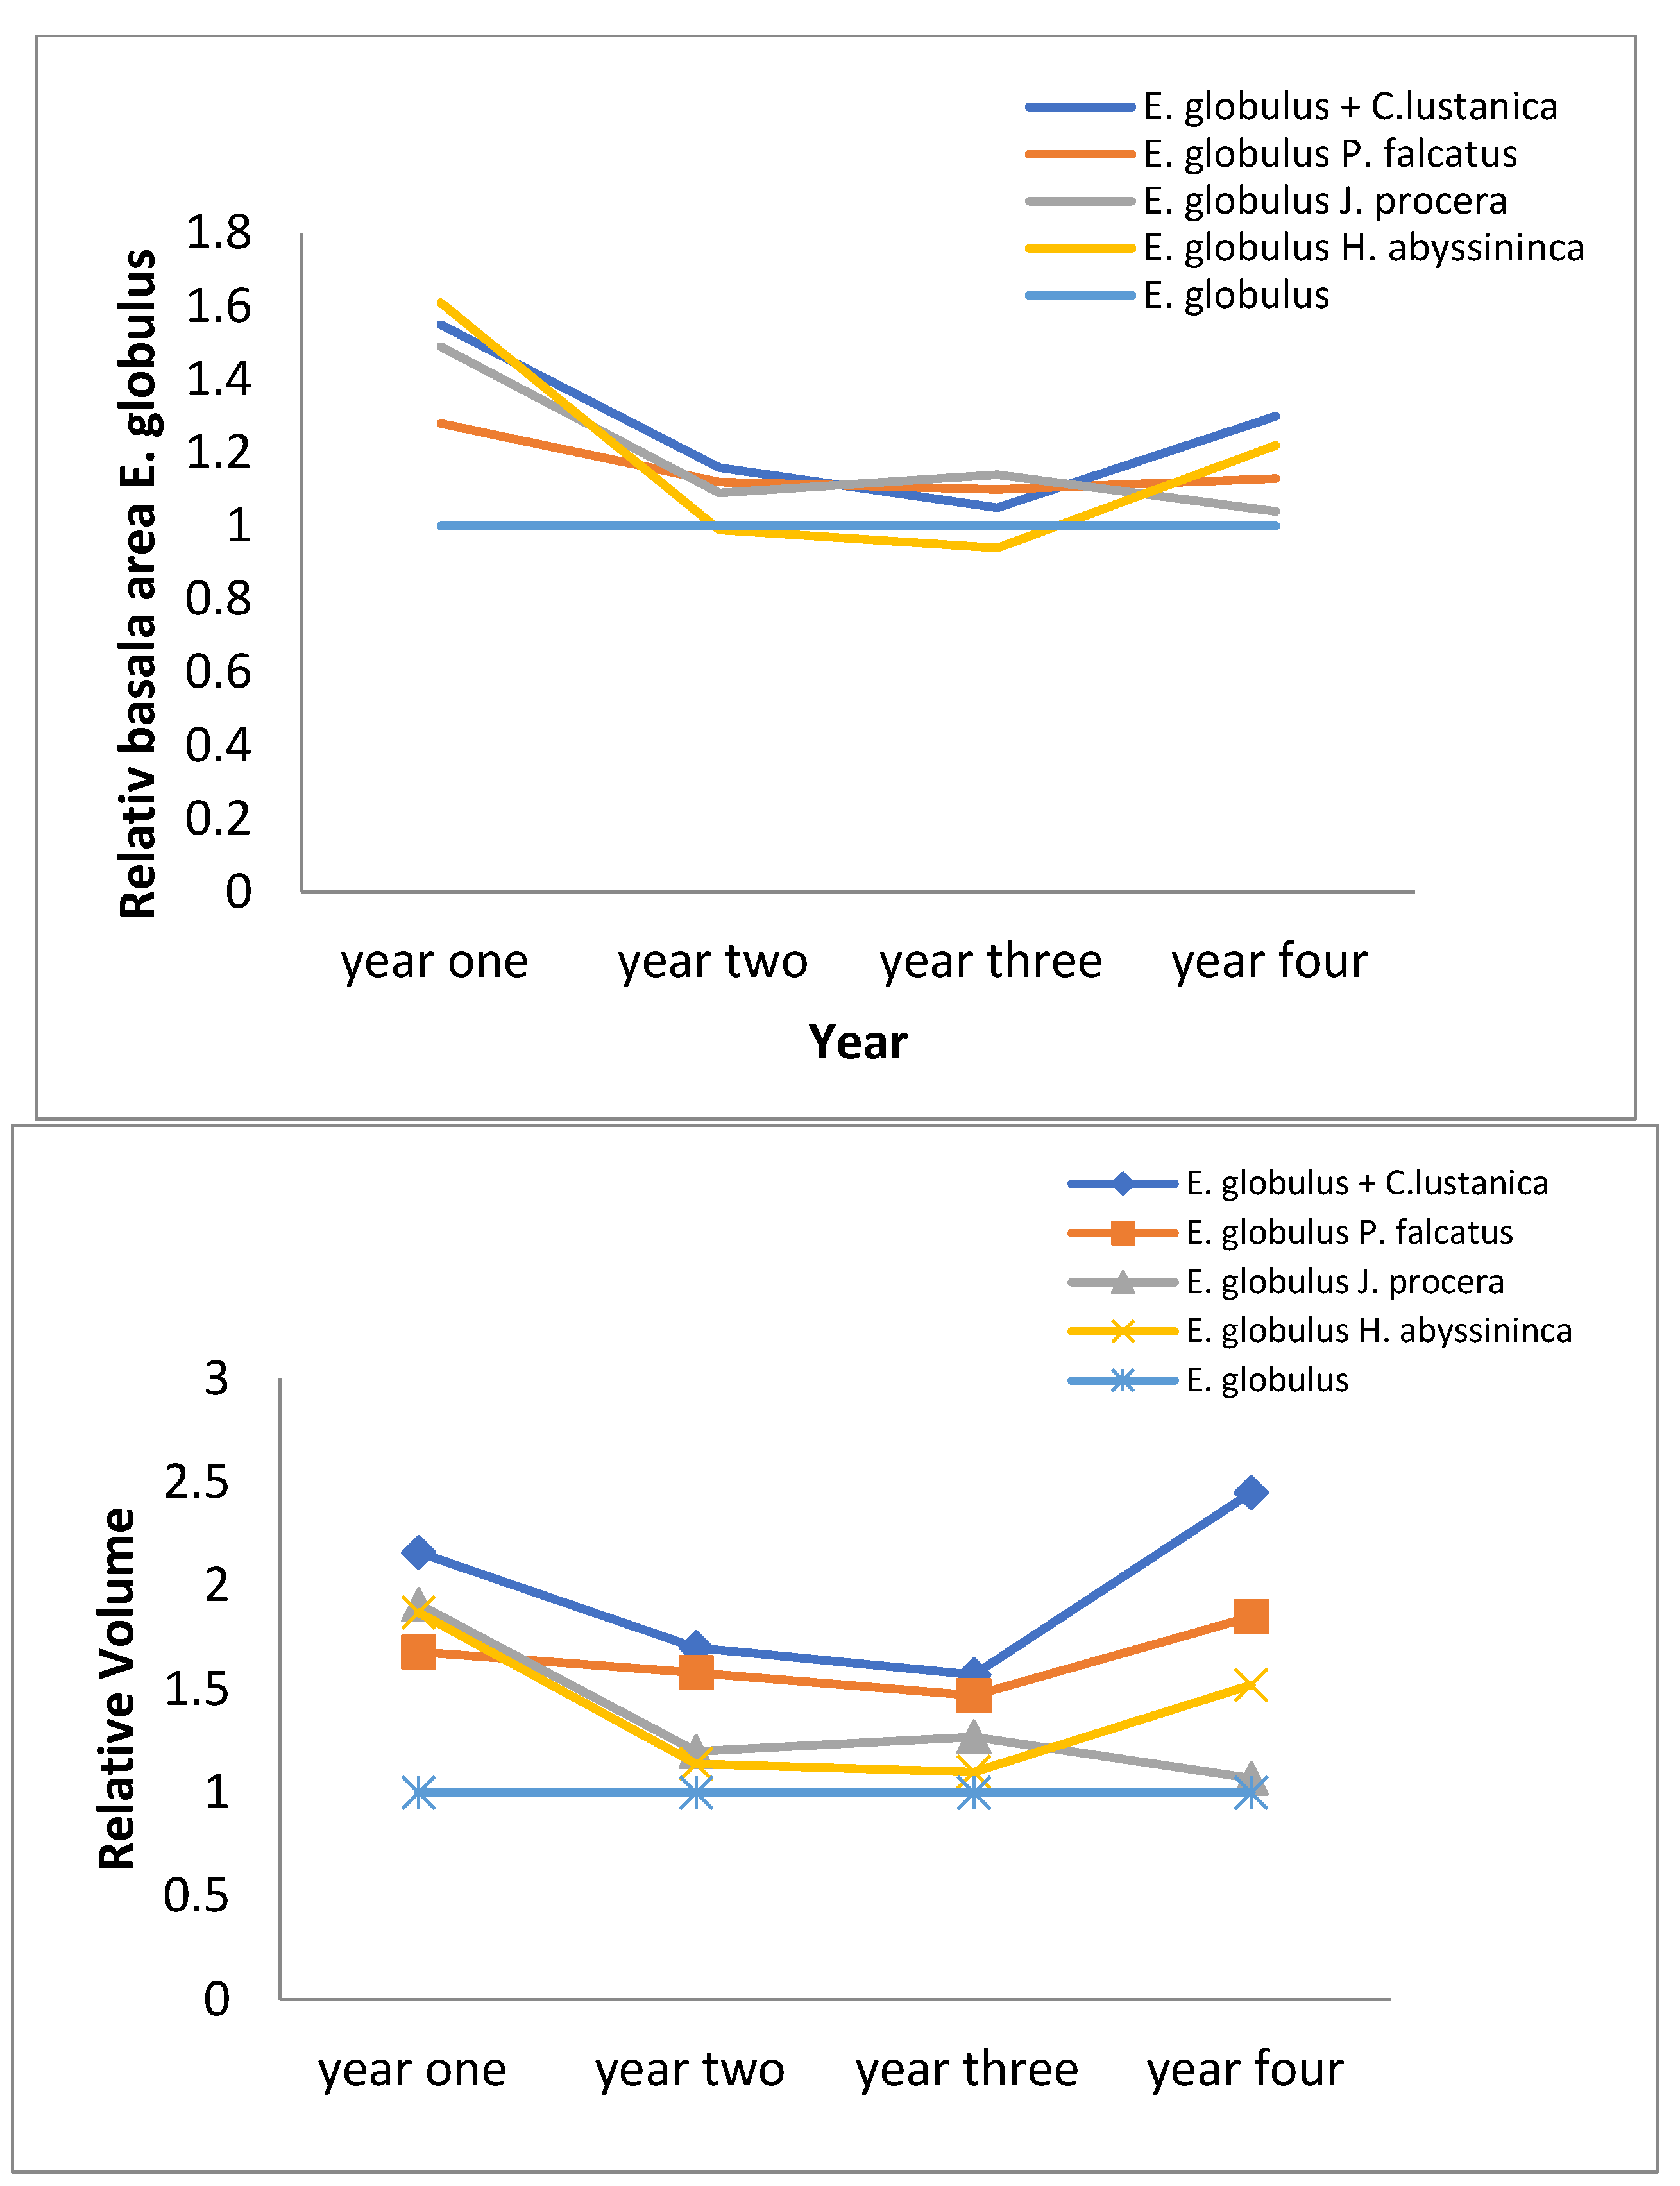
Figure 8.
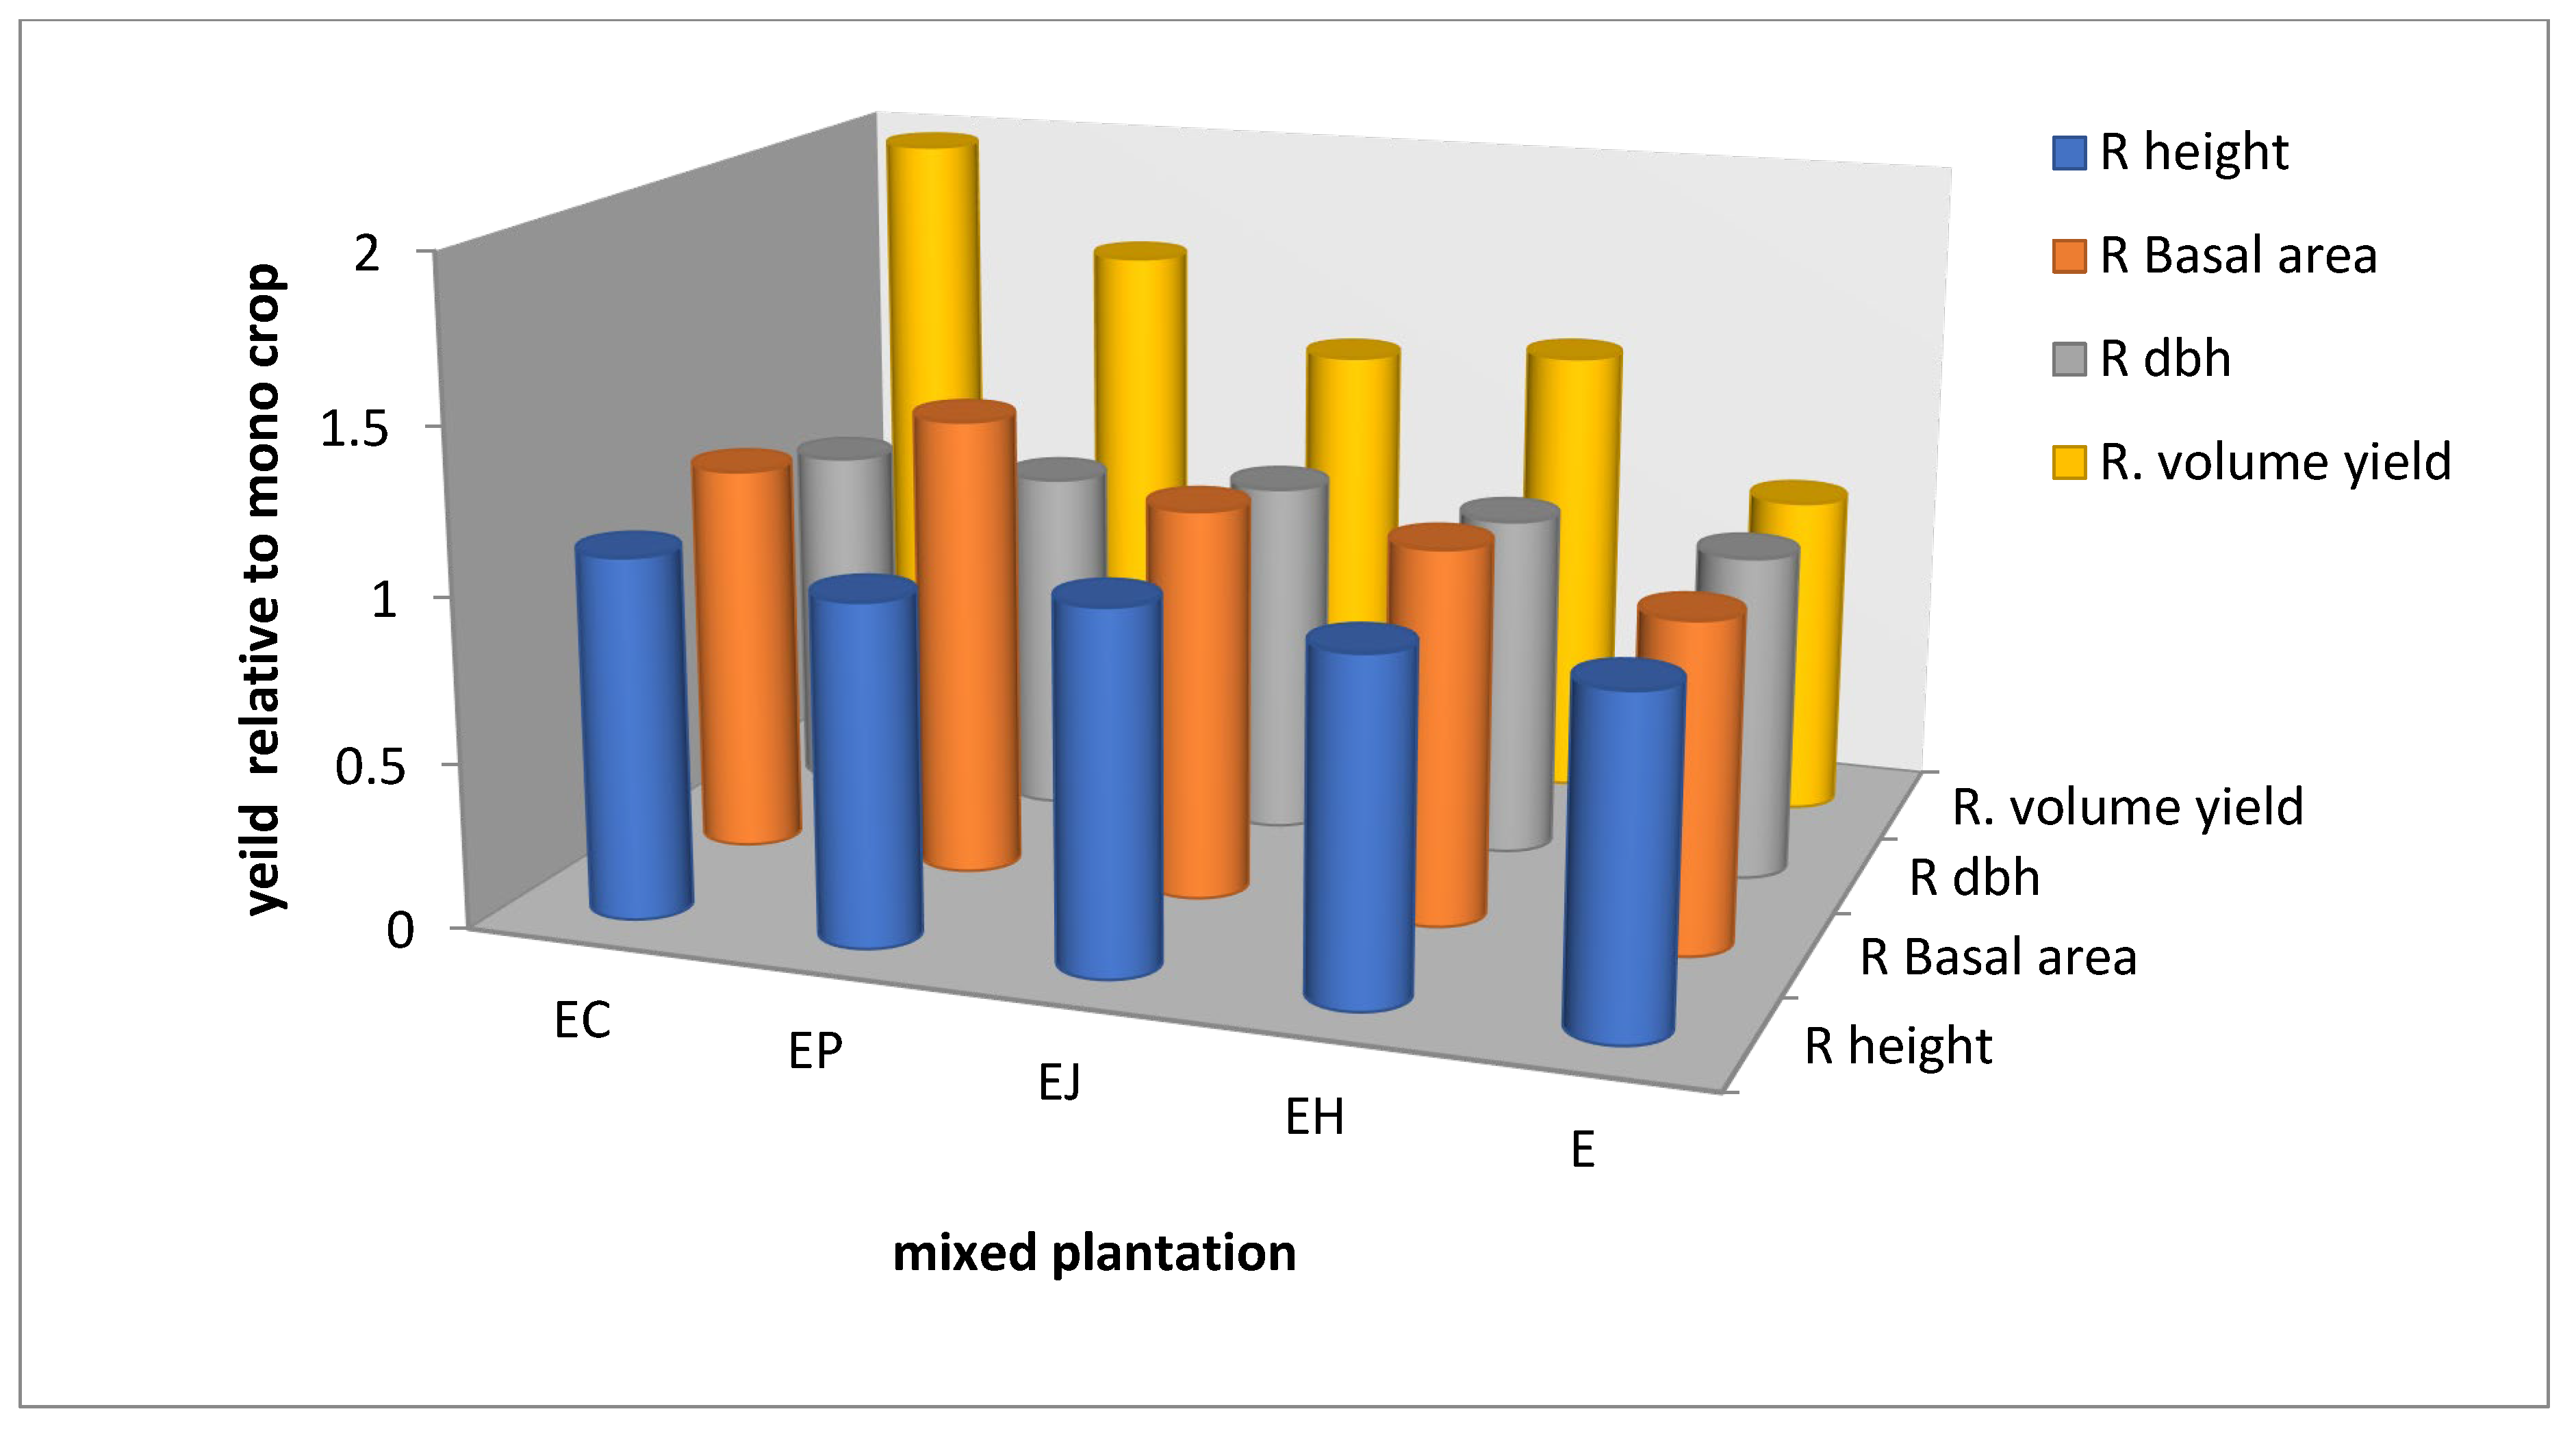
Relative growth performance and yield of Eucalyptus globulus when mixed with other species compared to mono crops.
Figure 8.
Relative growth performance and yield of Eucalyptus globulus when mixed with other species compared to mono crops.
Relative Yield Increment of E. globulus under Mixed Plantation Compared to Mono-Crop at Different Year
Yield increment of E. globulus was evaluated under mixed plantation and mono-crop. Even though there was no significance yield increment difference on E. globulus under mixed and mono-crop but there was relative yield increment of E. globulus under mixed plantation than mono crop. According to the trend of yield increment there may be significant different in yield increment of E. globulus between in the two plantation system.
Relative Height and Diameter at Brest Height (DBH) Increment
The height of
E. globulus tree mixed with
Cupressus lustanica and
Juniporus procera had showed that better growth increment under mixed plantation relative to the mono-crop in the first year. While,
E. globulus tree mixed
Podocarpus falcatus and
Hygenia abysinica were had lower height growth in the same year relative to the mono-crop. On the other hand, in the second year even though they were not lower growth rate relative to the mono crop but there were the decline of height growth rate relative to the first year except
E. globulus mixed with
Hygenia abysinica and
Podocarpus falcatus. Generally the height growth increment of Eucalyptus globulus was better in mixed than mono crop plantation (
Figure 4).
This study implies that when E. globulus planted mixed with some selected tree species like Cupressus lustanica, Podocarpus falcatus, Juniporus procera and Hygenia abysinica had relatively better DBH than mono-crop. While in the second year the DBH increment of E. globulus mixed with Hygenia abysinica was lower than the mono-crop.
Pattern of Relative Growth and Yield
Mixing E. globulus with different tree species have effect on relative increment on growth parameters (height, DBH and basal area) and yield (volume) of the tree. Trend of relative increment on height and DBH shows that corresponding trend between E. globulus in mono and E. globulus mixed with other species from year one to year three. Whereas at year for relative height of E. globulus mixed with Cupressus lustanica and Hygenia abysinica had shows increasing trend. Similarly relative DBH of E. globulus mixed with Cupressus lustanica had shows increasing trend than mono and other mixed plantations.
As shown the figure below, except E. globulus mixed with Hygenia abysinica in second and third year, all other mixed plantation had better increment of basal area. Therefore, based on this study to get better basal area increment mixed plantation with selected tree species is better than mono-crops. Log volume increment of the E. globulus under mixed plantation was recorded compared with mono-crop plantation. According to our study, E. globulus under mixed plantation had shows more log volume annual increment than under mono-crop plantation.
This study was agree with the study done at the diluvial north of Germany that reports the relative yield of tree on mixed stand had higher relative volume than pure stand [
31]. In addition the growth of
C. lusitanica and
E. camaldulensis in the mixed plantation is significantly higher than pure plantations by DBH (
p = 0.0001 and
p = 0.0076). Similarly C. lusitanica declare significance difference between pure and mixed stand on the DBH growth (
p = 0.001) [
32].
Figure 9.
Trend of relative yield increment of E. globulus mixed with other species relative to mono-crop plantation in four year.
Figure 9.
Trend of relative yield increment of E. globulus mixed with other species relative to mono-crop plantation in four year.
Carbon Density
According to the present study the biomass yield of
E. globulus under different cropping system was evaluated. Above ground biomass above and below ground carbon density of
E. globulus have no significance different in mono crop and mixed plantation. While
E. globulus mixed with
H. abysinica declare significant difference from
E. globulus mixed with
Podocarpus falcatus. Therefore, mixing of
E. globulus with those the above species will not have negative effect on the biomass yield of
E. globulus. An example from [
33] demonstrated that mixing hybrid poplar and white spruce increased wood production of poplar and sequestrated more carbon than monocultures of either poplar or white spruce.
Table 6.
the effect mixed plantation on above ground biomass and carbon density of E. globulus.
Table 6.
the effect mixed plantation on above ground biomass and carbon density of E. globulus.
| Treatment |
Above Ground Biomass (ton) |
Above Ground Carbon Density (ton) |
Below Ground Carbon Density (ton) |
| E. globulus +C. lustanica |
28.3ab |
13.3ab |
3.19ab |
| E. globulus + P. falcatus |
31.4a |
14.76a |
3.54a |
| E. globulus +J. procera |
21.3 ab |
10.03ab |
2.41ab |
| E. Globulus + H. abysinica |
19.2 b |
9.02b |
2.16b |
| E. globulus mono |
29.3 ab |
13.74ab |
3.29ab |
| CV |
21.99 |
22.01 |
22.04 |
| LSD |
10.3 |
4.87 |
1.17 |
Conclusions and Recommendations
The results support that mixing eucalyptus with indigenous and exotic species did not affect the growth performance of E. globulus. This, in turn, suggests that E. globulus can be planted mixed with the tested plant species. Such studies should be conducted for longer period to see effects at latter stage and provide conclusive suggestion for wider adoption of the technologies.
Acknowledgments
We have great acknowledge for Central Ethiopia agricultural Research institute for supporting in finance and material for field experiment. We have also gratitude for all researchers in the center that gives us valuable comment and suggestion in the whole work.
Conflicts of Interest
There is no any conflict of interest related to this paper.
References
- FAO, “Chapter: Illegal activities and Corruption in the Forest Sector,” State World’s For. 2001, pp. 88–101, 2001, [Online]. Available online: ftp://ftp.fao.org/docrep/fao/003/y0900e/y0900e02.pdf.
- J. Evans and J. W. Turnbull, Plantation forestry in the tropics: The role, silviculture, and use of planted forests for industrial, social, environmental, and agroforestry purposes., no. 3. ed. Oxford University Press, 2004.
- D. Lamb, P. D. Erskine, and J. A. Parrotta, “Restoration of degraded tropical forest landscapes,” Science (80-. )., vol. 310, no. 5754, pp. 1628–1632. [CrossRef]
- P. D. Erskine, D. Lamb, and M. Bristow, “Tree species diversity and ecosystem function: Can tropical multi-species plantations generate greater productivity?,” For. Ecol. Manage., vol. 233, no. 2–3, pp. 205–210, 2006. [CrossRef]
- T. Payn et al., “Changes in planted forests and future global implications,” For. Ecol. Manage., vol. 352, pp. 57–67, 2015. [CrossRef]
- J. D. Nichols, M. Bristow, and J. K. Vanclay, “Mixed-species plantations: Prospects and challenges,” For. Ecol. Manage., vol. 233, no. 2, pp. 383–390, 2006. [CrossRef]
- F. Montagnini, E. Gonzalez, and C. Porras, “Mixed and pure forest plantations in the humid neotropics: a comparison of early growth, pest damage and establishment costs,” Commonw. For. Rev., vol. 74, no. 4, pp. 306–314, 1995.
- P. J. and J. Pender, “the Role of Trees for Sustainable Management of Less-Favored Lands: the Case of Eucalyptus in Ethiopia,” Int. Food Policy Res. Inst. 2033 K Street, N.W. Washington, D.C. 20006 U.S.A., no. 65, 2000.
- T. M. Tyynelä, “Species diversity in Eucalyptus camaldulensis woodlots and miombo woodland in Northeastern Zimbabwe,” New For., vol. 22, no. 3, pp. 239–257. [CrossRef]
- F. Senbeta, D. Teketay, and B. Naslund, “Native woody species regeneration in exotic tree plantations at Munessa-Shashemene Forest, southern Ethiopia,” New For., vol. 24, pp. 131–145, 2002. [CrossRef]
- S. Alem and T. Woldemariam, “A comparative assessment on regeneration status of indigenous woody plants in Eucalyptus grandis plantation and adjacent natural forest,” J. For. Res., vol. 20, no. 1, pp. 31–36, 2009. [CrossRef]
- D. I. Forrester, A. L. Cowie, J. K. Vanclay, and E. Science, “Mixed-species plantations of Eucalyptus with nitrogen fixing trees: A review,” vol. 233, pp. 211–230, 2006. [CrossRef]
- M. Bristow, J. D. Nichols, and J. K. Vanclay, “Improving productivity in mixed-species plantations,” For. Ecol. Manage., vol. 233, no. 2–3, pp. 193–194, 2006,. [CrossRef]
- Temesgen and L. Estifanos, “Determinants of internal audit effectiveness: Evidence from Gurage Zone Ethiopia,” IISTE, vol. 9, 19, pp. 51–72, 2018. [CrossRef]
- J. Atta-Boateng and J. W. Moser Jr, “A method for classifying commercial tree species of an uneven-aged mixed species tropical forest for growth and yield model construction,” For. Ecol. Manage., vol. 104, no. 1–3, pp. 89–99, 1998.
- W. A. Hoffmann and H. Poorter, “Avoiding bias in calculations of relative growth rate,” Ann. Bot., vol. 90, no. 1, pp. 37–42, 2002. [CrossRef]
- J. Chave et al., “Improved allometric models to estimate the aboveground biomass of tropical trees,” Glob. Chang. Biol., vol. 20, no. 10, pp. 3177–3190, 2014. [CrossRef]
- IPCC, “INTERGOVERNMENTAL PANEL ON CLIMATE CHANGE 2006 IPCC Guidelines for National Greenhouse Gas inventories.,” Inst. Glob. Environ. Strateg., 2006.
- H. K. Gibbs, S. Brown, J. O. Niles, and J. A. Foley, “Monitoring and estimating tropical forest carbon stocks: Making REDD a reality,” Environ. Res. Lett., vol. 2, no. 4, 2007. [CrossRef]
- R. Ponce-Hernandez, P. Koohafkan, and J. Antoine, Assessing carbon stocks and modelling win-win scenarios of carbon sequestration through land-use changes, vol. 1. Food & Agriculture Org., 2004.
- C. Li, H. Barclay, B. Roitberg, and R. Lalonde, “Forest Productivity Enhancement and Compensatory Growth: A Review and Synthesis,” Front. Plant Sci., vol. 11, no. September, pp. 1–19, 2020. [CrossRef]
- D. S. Debell, T. G. Cole, and C. D. Whitesell, “Growth, development, and yield in pure and mixed stands of Eucalyptus and Albizia.,” vol. 43, no. 2, pp. 286–298, 1997.
- D. S. Debell, C. D. Whitesell, and T. H. Schubert, “Mixed Plantations of Eucalyptus and Leguminous Trees Enhance Biomass Production,” For. Serv. U.S. departmemt Agric., p. 6, 1997.
- J. A. Parrotta, D. D. Baker, and M. Fried, “Application of 15N-enrichment methodologies to estimate nitrogen fixation in Casuarinaequisetifolia,” Can. J. For. Res., vol. 24, no. 2, pp. 201–207, Feb. 1994. [CrossRef]
- S. Dutta and M. K. Hossain, “Effects of Mixed Plantation on Growth and Biomass Yield of Two Common Plantation Trees,” vol. 33, no. 1, pp. 22–32, 2017.
- V. C. Griess and T. Knoke, “Growth performance, windthrow, and insects: meta-analyses of parameters influencing performance of mixed-species stands in boreal and northern temperate biomes,” Can. J. For. Res., vol. 41, no. 6, pp. 1141–1159, 2011.
- L. Drössler, R. Övergaard, P. M. Ekö, H. Böhlenius, and P. Gemmel, “to the manuscript Early development of pure and mixed tree species plantations in Snogeholm , southern Sweden submitted to the Scandinavian Journal of Forest Research * Corresponding author : Lars.drossler@slu.se Table S1 . Total production of standing vo,” South. SwedenScand. J. For. Res., vol. 30 (4), no. 1005127, pp. 304–316, 2015.
- M. Hossain et al., “Stem and Total Above-Ground Biomass Models for the Tree Species of Freshwater Wetlands Forest, Coastal Areas and Dry Areas of Bangladesh: Using a Non-Destructive Approach,” Open J. For., vol. 11, no. 02, pp. 73–82, 2021. [CrossRef]
- M. J. Kelty, “The role of species mixtures in plantation forestry,” Forest Ecology and Management, vol. 233, no. 1. Elsevier, pp. 195–204, 2006. [CrossRef]
- D. Piotto, “A meta-analysis comparing tree growth in monocultures and mixed plantations,” For. Ecol. Manage., vol. 255, no. 3–4, pp. 781–786, 2008.
- H. Pretzsch, K. Bielak, J. Block, and A. Bruchwald, “Productivity of mixed versus pure stands of oak ( Quercus petraea ( MATT .) LIEBL . and Quercus robur L .) and European beech ( Fagus sylvatica L .) along an Productivity of mixed versus pure stands of oak ( Quercus petraea ( M ATT .) L IEBL . and Quercus,” no. March, 2013. [CrossRef]
- S. Alem, J. Pavlis, J. Urban, and J. Kucera, “Pure and Mixed Plantations of Eucalyptus camaldulensis and Cupressus lusitanica : Their Growth Interactions and Effect on Diversity and Density of Undergrowth Woody Plants in Relation to Light,” no. April, pp. 375–386, 2015.
- M. Chomel, A. DesRochers, V. Baldy, M. Larchevêque, and T. Gauquelin, “Non-additive effects of mixing hybrid poplar and white spruce on aboveground and soil carbon storage in boreal plantations,” For. Ecol. Manage., vol. 328, pp. 292–299, 2014. [CrossRef]
|
Disclaimer/Publisher’s Note: The statements, opinions and data contained in all publications are solely those of the individual author(s) and contributor(s) and not of MDPI and/or the editor(s). MDPI and/or the editor(s) disclaim responsibility for any injury to people or property resulting from any ideas, methods, instructions or products referred to in the content. |
© 2024 by the authors. Licensee MDPI, Basel, Switzerland. This article is an open access article distributed under the terms and conditions of the Creative Commons Attribution (CC BY) license (https://creativecommons.org/licenses/by/4.0/).

