3.1. Characterization of PtCo/Ti3C2Tx Catalyst
The morphology of Ti
3C
2T
x, Pt/Ti
3C
2T
x-6.64, Co/Ti
3C
2T
x-32 and PtCo/Ti
3C
2T
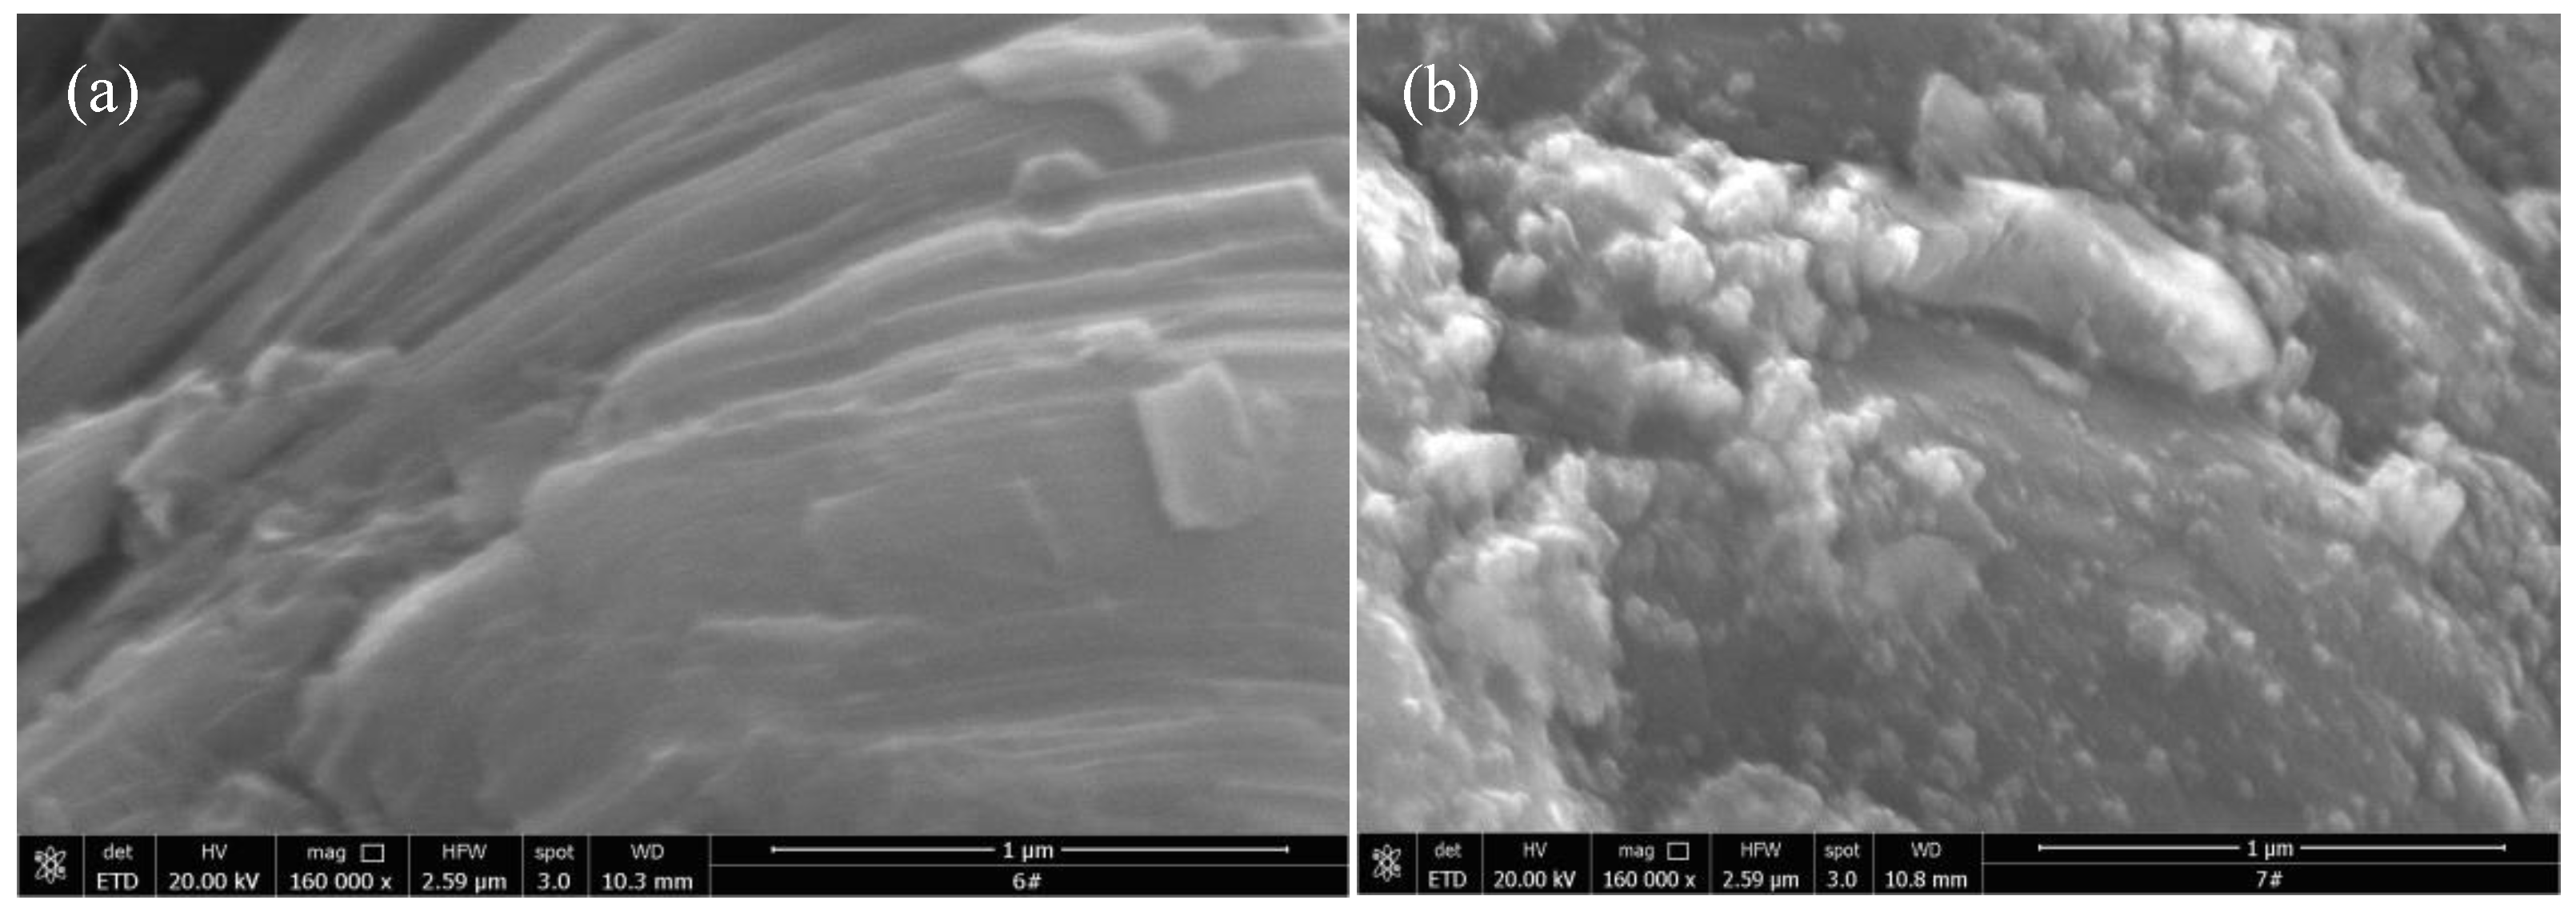
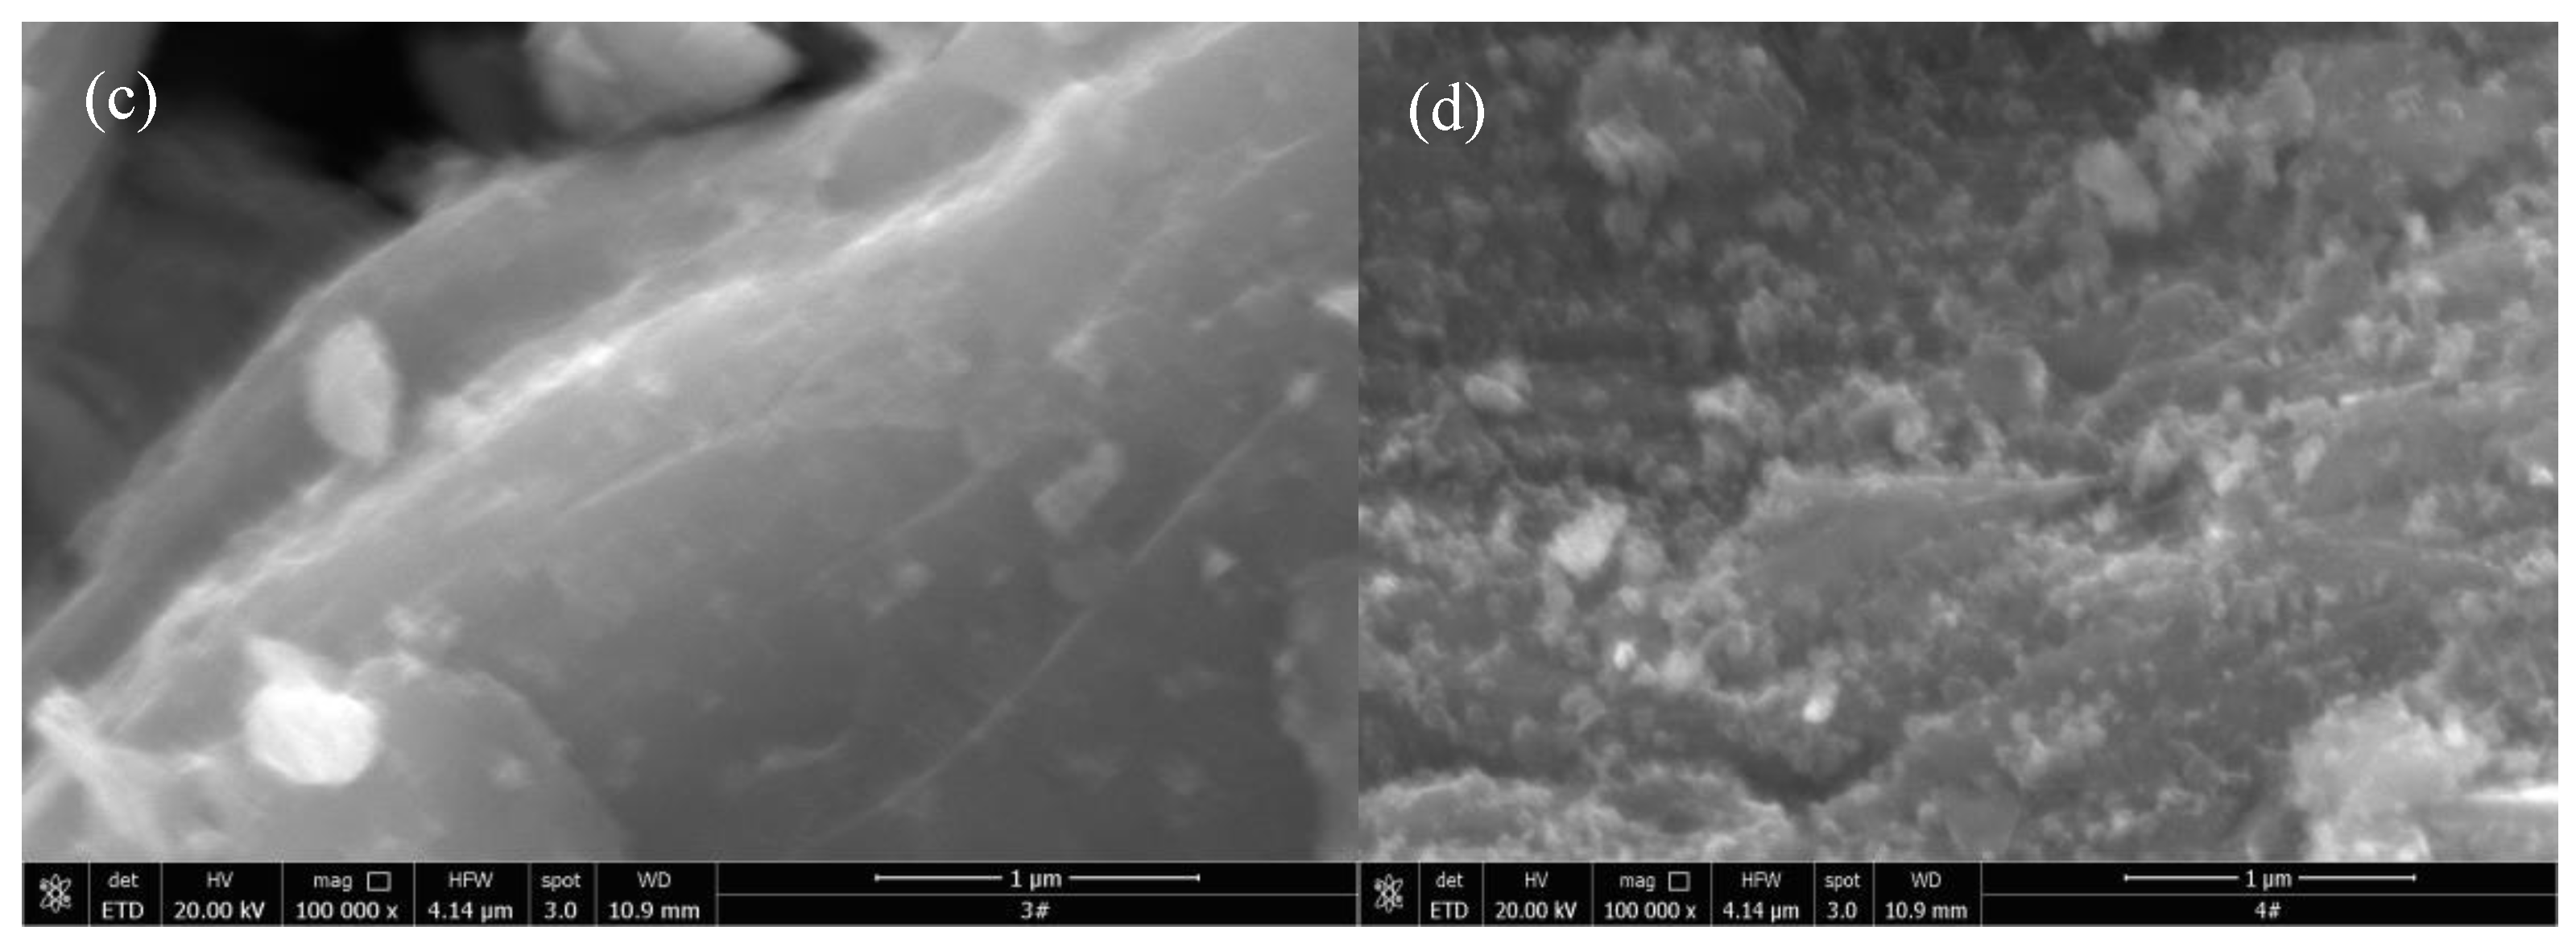
x-32 catalysts were analyzed by SEM, and the results were shown in
Figure 2. As can be seen from the SEM images of Ti
3C
2T
x shown in
Figure 2(a), Ti
3C
2T
x presents a multi-layer and compact stack lamellar structure, which is a typical two-dimensional layered structure. The unique two-dimensional structure of Ti
3C
2T
x can provide an effective conductive network for fast ion and electron transport during electrocatalysis HER process [
14]. From the SEM image of Pt/Ti
3C
2T
x-6.64 shown in
Figure 2(b), it can be clearly seen that granular Pt particles were deposited on the surface of Ti
3C
2T
x. As can be seen from SEM image of Co/Ti
3C
2T
x-32 shown in
Figure 2(c) that the morphology of Ti
3C
2T
x has not changed significantly. It still presents a two-dimensional layered structure, and no obvious granular particles were found on its surface. From the SEM image of PtCo/Ti
3C
2T
x-32 shown in
Figure 2(d), it can be seen that the particle size loaded on the surface of PtCo/Ti
3C
2T
x-32 was significantly smaller than that of Pt/Ti
3C
2T
x-6.64, indicating that Co can effectively inhibit the agglomeration of Pt.
In order to understand the type and distribution of elements in PtCo/Ti
3C
2T
x-32 catalyst as shown in
Figure S1.(a) (Supporting Information), EDS elemental mapping analysis was conducted, and analysis results were shown in
Figure S1.(b~f) (Supporting Information). It can be found that there are many bright regions with uniform distribution of particles, which indicates that Pt and Co did not form large particles on the surface of Ti
3C
2T
x. Combined with the SEM analysis results, it can found that Co not only inhibits the aggregation of Pt to form large-sized particles, but also promotes the uniform distribution of Pt on the surface of Ti
3C
2T
x, which is beneficial to the exposure of more active sites of the catalyst [
15]. Element point scanning analysis was carried out on PtCo/Ti
3C
2T
x-32, that is, 6 points were randomly selected on its surface to detect the element information of each point, and the results were shown in
Figure S1.(g) (Supporting Information). As can be seen from the results of
Figure S1.(g), the distribution of Pt and Co elements was relatively uniform. The average atomic percentages of C, Ti, Co and Pt were 37.67, 61.23, 1.03 and 0.07, respectively. It can be inferred that the mass percentage of C, Ti, Co and Pt were 13.04, 84.81, 1.75 and 0.39, respectively.
In order to further study the microstructure of the resulting catalysts, the structures of Ti
3C
2T
x, Pt/Ti
3C
2T
x-6.64, Co/Ti
3C
2T
x-32 and PtCo/Ti
3C
2T
x-32 were analyzed by TEM, and the results were shown in
Figure S2 (Supporting Information). It can be seen from
Figure S2.(a) that Ti
3C
2T
x has a unique two-dimensional layered structure. It can be found from
Figure S2.(b) that a large number of clusters with different sizes were attached to flaky Ti
3C
2T
x. This is because Pt particles are prone to agglomerate during the preparation process, which may seriously affect the activity and stability of the catalyst [
16].
Figure S2.(c) showed the TEM image of Co/Ti
3C
2T
x-32, and no obvious agglomeration phenomenon was found, which is consistent with the SEM analysis results.. From the TEM image of PtCo/Ti
3C
2T
x-32 shown in
Figure S2.(d), it can be seen that the number of clusters in PtCo/Ti
3C
2T
x-32 is significantly reduced and the size is smaller than that of Pt/Ti
3C
2T
x. It can be concluded that Co can inhibit the formation of large Pt particles, which will help to expose more Pt to the catalyst surface, thereby improving the utilization rate of Pt.
The phase structures of Ti
3AlC
2, Ti
3C
2T
x and Pt/Ti
3C
2T
x-6.64, Co/Ti
3C
2T
x-32 and PtCo/Ti
3C
2T
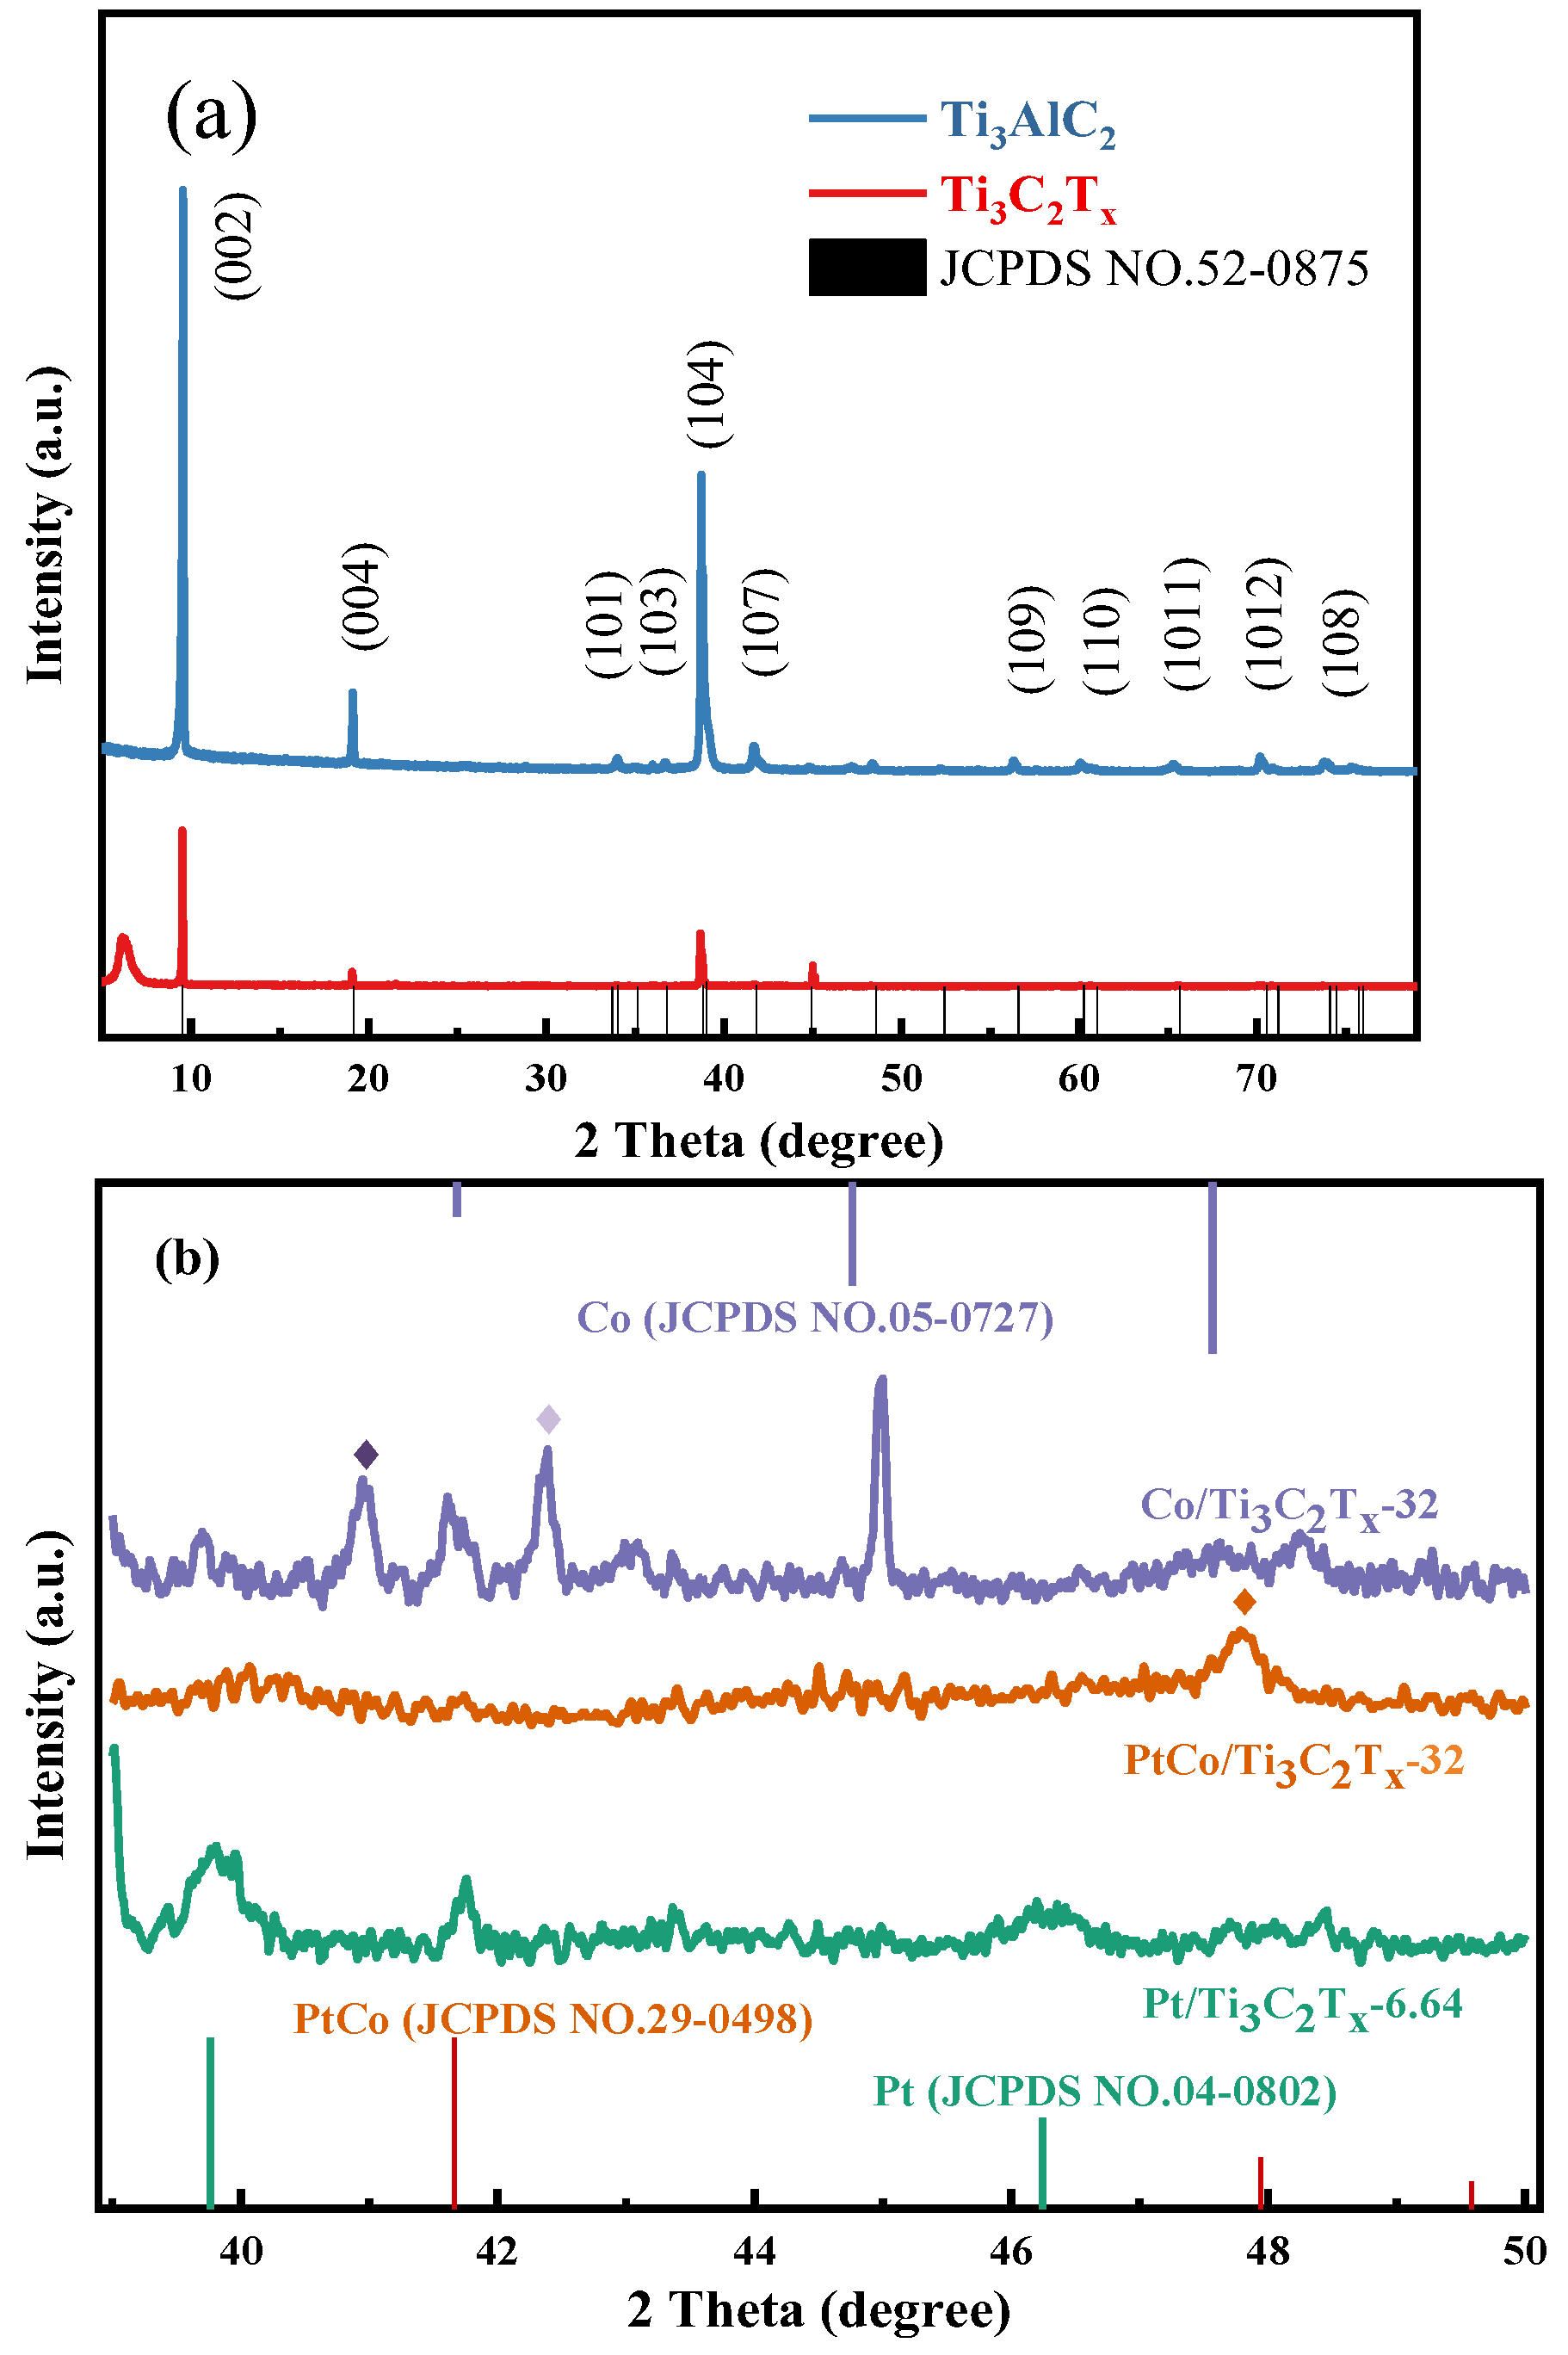
x-32 were analyzed by XRD, and the results were shown in
Figure 3.
Figure 3(a) shows the XRD analysis results of Ti
3AlC
2 and Ti
3C
2T
x. It can be seen from
Figure 5(a) that after HF etching of Ti
3AlC
2, three distinct characteristic diffraction peaks appeared at 2θ of 9.5°, 19.3° and 39.0°. It can be known that the above characteristic diffraction peaks respectively correspond to (002), (004) and (104) crystal faces after comparing the Ti
3AlC
2 standard card (JCPDS NO.52-0875). In addition, a new broad characteristic diffraction peak appeared at 2θ of 6.1°, indicating that the Al layer has been etched and that Ti
3AlC
2 has successfully transformed into Ti
3C
2T
x. It also indicated that the layer spacing of Ti
3C
2T
x has became larger after the etching of the Al layer, and which is facilitates the entry of active substances into Ti
3C
2T
x [
9]. It can be seen from
Figure 3(b) that Co/Ti
3C
2T
x-32 appeared three obvious characteristic diffraction peaks at 2θ of 41.6°, 44.9° and 47.5°, respectively. These characteristic peaks are indexed to the hcp Co phase (JCPDS 05-0727), corresponding to the crystal faces of Co (100), (002) and (101), respectively. In addition, Co/Ti
3C
2T
x-32 also exhibited two characteristic diffraction peaks at 2θ of 41.0° and 42.4°, and these two above characteristic diffraction peaks were indexed to the (321) crystal face of CoTi
2O
5 and the (200) crystal face of CoO after comparing the standard card of CoTi
2O
5 (JCPDS 35-0793) and CoO (JCPDS NO.43-1004), respectively. Pt/Ti
3C
2T
x appeared two characteristic diffraction peaks at 2θ of 39.7° and 46.2°, and these characteristic peaks were indexed to the (111) and (200) crystal faces of Pt after comparing the Pt standard card (JCPDS NO.04-0802). Moreover, Co/Ti
3C
2T
x-32 and Pt/Ti
3C
2T
x-6.64 show the same diffraction peak at 2θ of 41.7°, corresponding to the Ti
3C
2T
x substrate, which indicates that Co and Pt have successfully loaded on Ti
3C
2T
x. By observing the XRD pattern of PtCo/Ti
3C
2T
x, it can be seen that only one characteristic diffraction peak appeared at 2θ of 47.8°. It can be known that the above characteristic diffraction peaks corresponds to the (110) crystal face of PtCo alloy after comparing the standard card of PtCo alloy (JCPDS NO.29-0498). It is worth noting that the XRD pattern of PtCo/Ti
3C
2T
x does not show any diffraction peaks corresponding to the atomic and oxidation states of Co(Pt). The results show that Co and Pt exist in the form of PtCo alloy in PtCo/Ti
3C
2T
x.
The chemical states and valence electron structures of the surface atoms of Ti
3C
2T
x, Co/Ti
3C
2T
x-32, Pt/Ti
3C
2T
x-6.64 and PtCo/Ti
3C
2T
x-32 elecrocatalysts were studied by XPS. From
Figure S3.(a) to
Figure S6.(a) showed the spectrum of C1s of these above elecrocatalysts (Supporting Information). The peak at 284.8 eV corresponds to C-C bond, and the other three peaks correspond to C-Ti bond (281.8 eV), O-C bond (286.4 eV) and O-C=O bond (289.0 eV) respectively [
17,
18]. From
Figure S3.(b) to
Figure S6.(b) showed the spectrum of O1s of these above elecrocatalysts (Supporting Information), three peaks at 530.3 eV, 531.8 eV and 533.3 eV correspond to the C-Ti-O
x bond, Ti-OH bond, H
2O adsorbed on the surface and Ti(OF)
x, respectively [
19]. From
Figure S3.(c) to
Figure S6.(c) showed the Ti2p spectra of these above elecrocatalysts (Supporting Information), and six peaks can be found, the characteristic peaks at 455.4 eV, 456.8 eV and 461.2 eV, 465.4 eV correspond to Ti2p3/2 and Ti2p1/2 [
20], respectively. The peaks at 455.4 and 459.7 eV correspond to Ti-C, and the other two peaks at 457.8 and 462.5 eV correspond to Ti-O. The presence of TiO
2 component in the catalyst should be attributed to the inevitable surface oxidation of the Ti
3C
2T
x in the air. It has been proved to be unavoidable, and which does not affect the structure and physicochemical properties of Ti
3C
2T
x [
20].
Figure S5.(d) and
Figure S6.(d) shows the Pt4f spectra of Pt/Ti
3C
2T
x-6.64 and PtCo/Ti
3C
2T
x-32 (Supporting Information). Generally, the peaks at 71.4 eV (Pt4f
7/2) and 74.7 eV (Pt4f
5/2) correspond to Pt
0, and the peaks at 72.5 eV (Pt4f
7/2) and 75.9 eV (Pt4f
5/2) correspond to Pt
2+, respectively [
21]. It can been seen from the XPS spectra of PtCo/Ti
3C
2T
x-32, the peaks corresponding to Pt
0 and Pt
2+ all move in the direction of lower binding energies, and the shift amplitude of Pt
2+ was larger.
Figure S4.(d) and
Figure S6.(e) showed the Co2p spectra of Co/Ti
3C
2T
x-32 and PtCo/Ti
3C
2T
x-32 (Supporting Information). In the XPS spectra of Co/Ti
3C
2T
x-32, the characteristic peaks in the binding energy range of 778.5~782.0 eV can be divided into two peaks, 781.1 eV and 779.4 eV. They are classified as Co
2+ and Co
3+, and the satellite peak (sat) at 786.5 eV also indicates the presence of Co
2+ [
22]. In the XPS spectra of PtCo/Ti
3C
2T
x-32, peaks correspond to Co
2+ and Co
3+ move slightly in the direction of higher binding energies, and the peak corresponds to Pt4f moves in the direction of lower binding energy. The shift of peak position indicated that the electron distribution of Pt and Co elements has changed, that is, there is a strong electron interaction between them. This is because electrons were transferred from less electronegative Co to more electronegative Pt, resulting in a change in the electronic environment of Pt. It will affect the adsorption of the catalyst to the reactant molecules and the desorption ability of the product [
23].
The surface hydrophilicity of the catalyst was determined by measuring the contact angles of Ti
3C
2T
x, Pt/Ti
3C
2T
x-6.64, Co/Ti
3C
2T
x-32 and PtCo/Ti
3C
2T
x-32 (as shown in
Figure S7, Supporting Information)). The contact angles of Ti
3C
2T
x, Pt/Ti
3C
2T
x-6.64, Co/Ti
3C
2T
x-32 and PtCo/Ti
3C
2T
x-32 are 130.4°, 98.1°, 52.7° and 12.1°, respectively. The contact angle of PtCo/Ti
3C
2T
x is much smaller than that of Ti
3C
2T
x, Pt/Ti
3C
2T
x-6.64 and Co/Ti
3C
2T
x-32, which indicates that the PtCo/Ti
3C
2T
x-32 catalyst has strong hydrophilicity. Good hydrophilicity can make the contact between the active site and the electrolyte more adequate, which is also conducive to improve HER reaction activity [
24].
The specific surface area and pore size distribution of Ti
3C
2T
x, Pt/Ti
3C
2T
x-6.64, Co/Ti
3C
2T
x-32 and PtCo/Ti
3C
2T
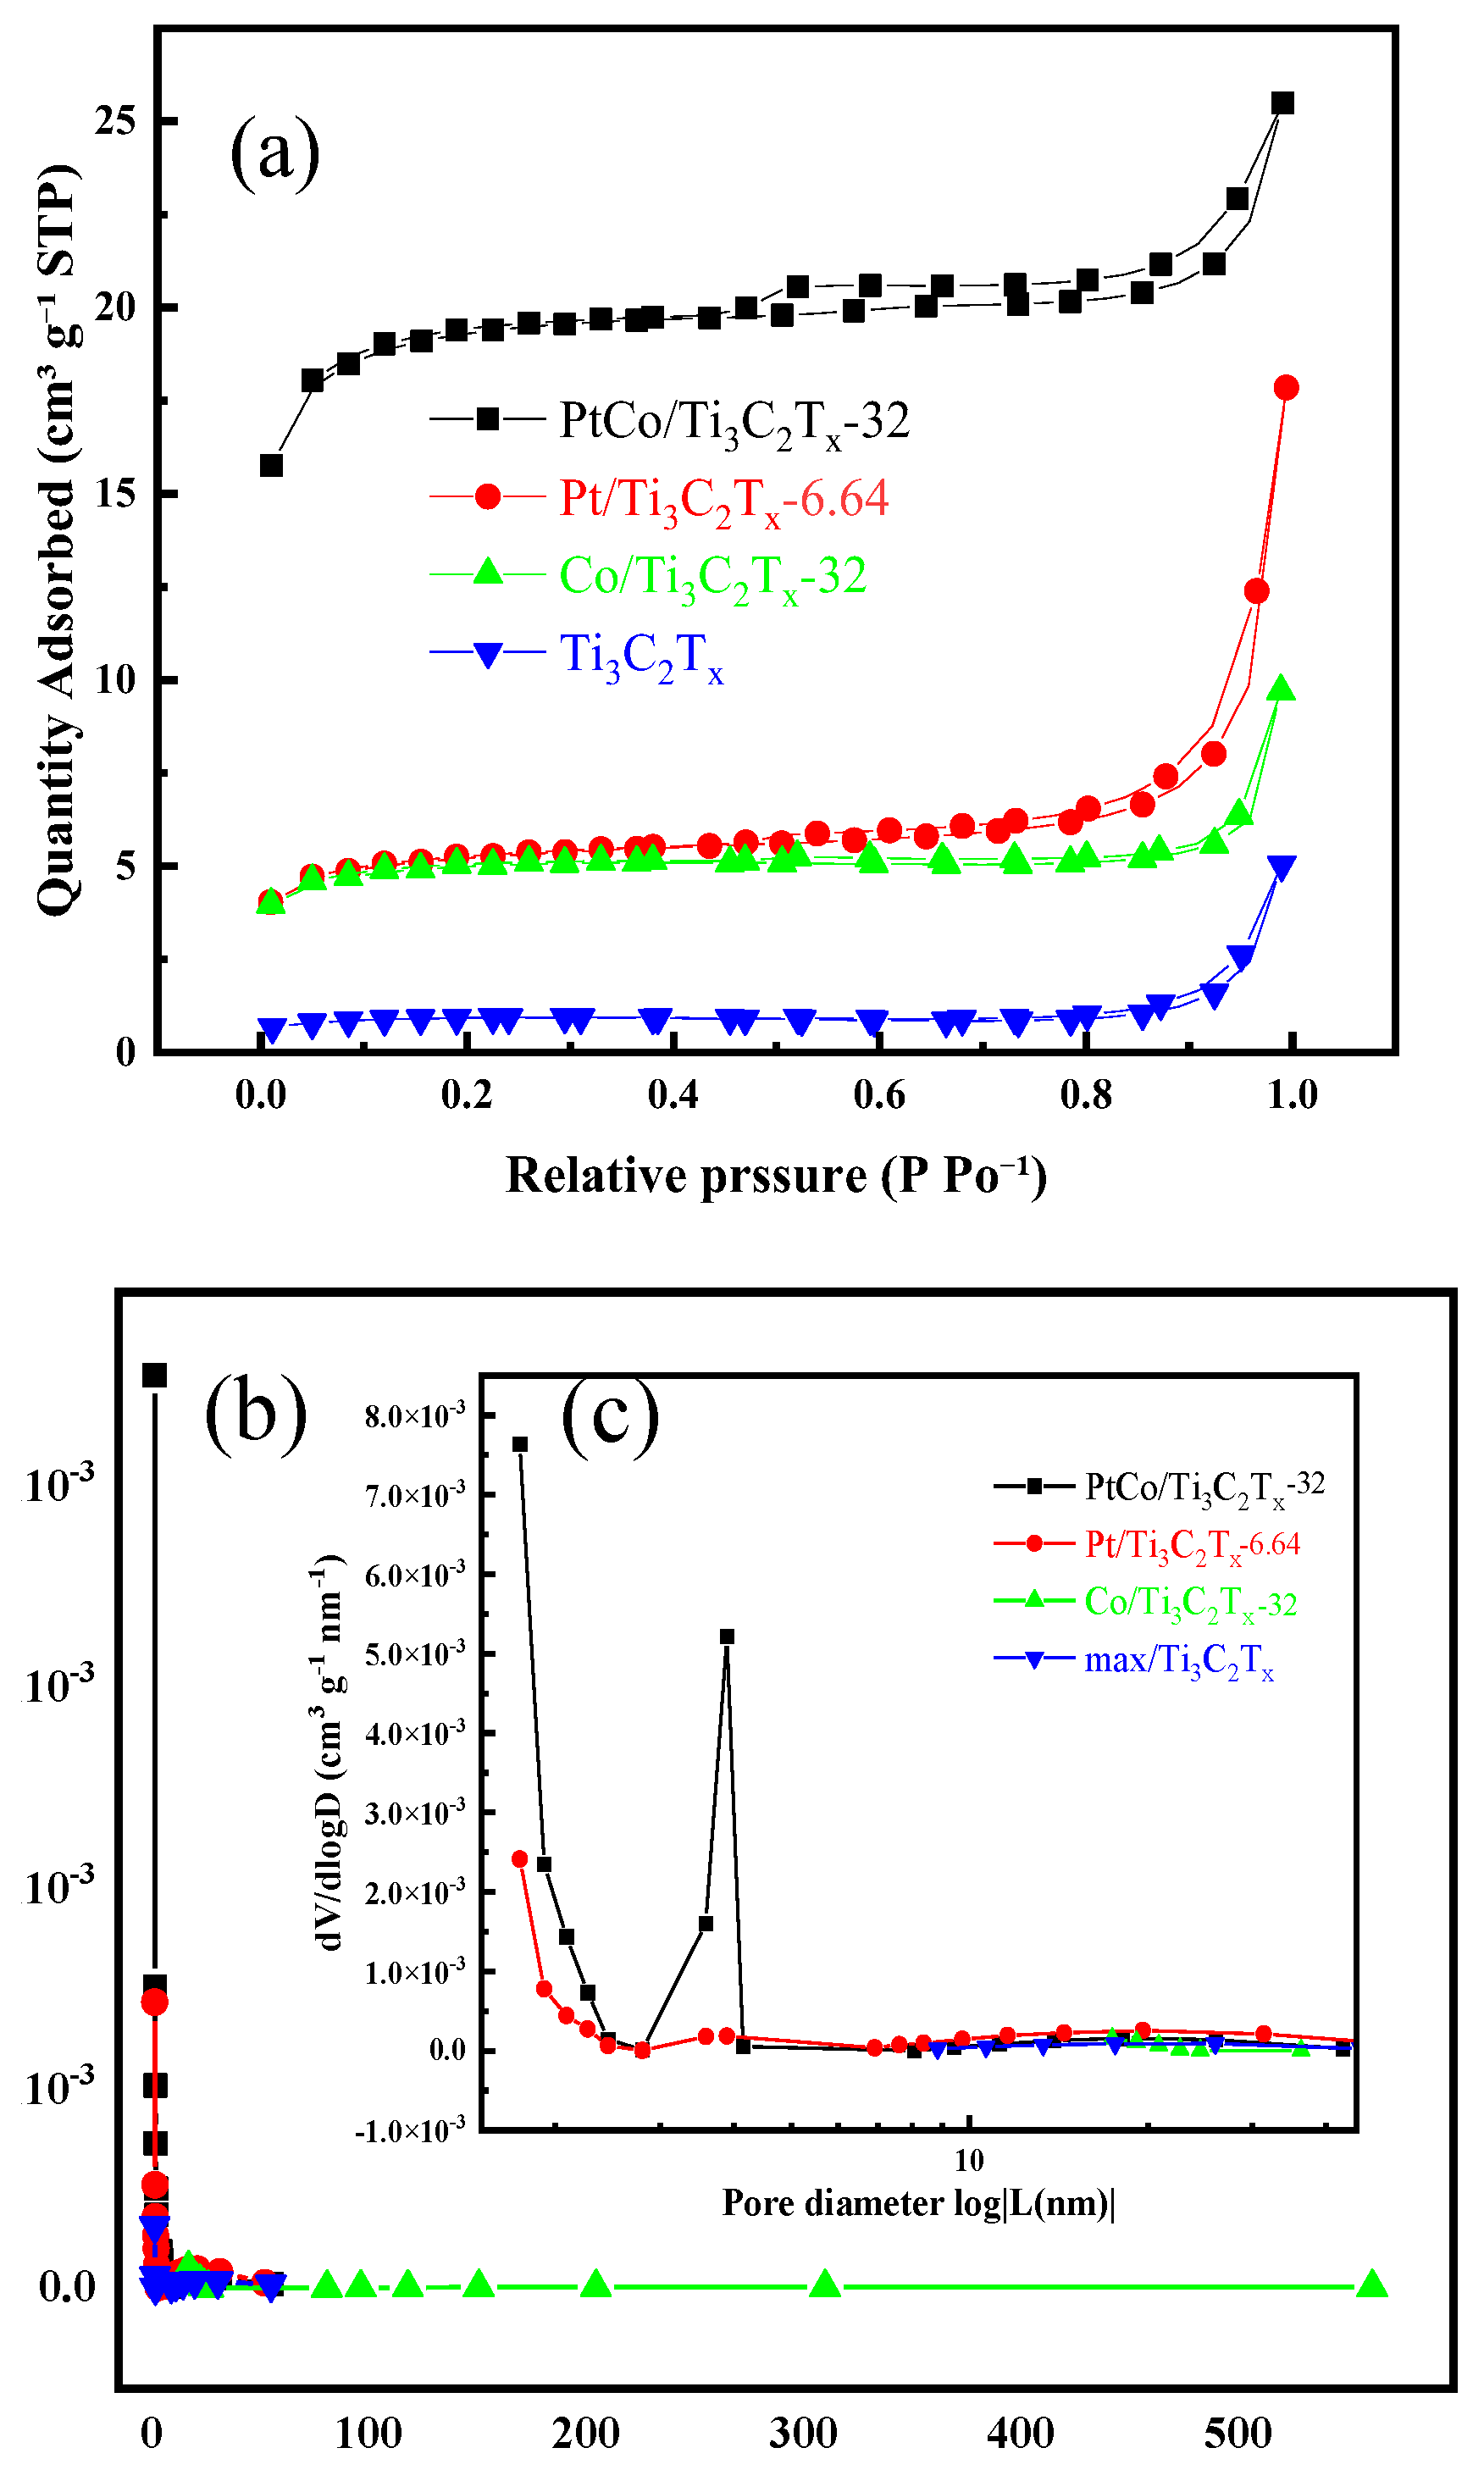
x-32 were determined by the specific surface area and pore size analyzer.
Figure 4(a) shows the N
2 adsorption-desorption curves of Ti
3C
2T
x, Pt/Ti
3C
2T
x-6.64, Co/Ti
3C
2T
x-32 and PtCo/Ti
3C
2T
x-32.
Figure 4(b) shows the pore size distribution of Ti
3C
2T
x, Pt/Ti
3C
2T
x-6.64, Co/Ti
3C
2T
x-32 and PtCo/Ti
3C
2T
x-32. It can be found that PtCo/Ti
3C
2T
x-32 has a wider aperture distribution when it was compared with Ti
3C
2T
x and Co/Ti
3C
2T
x-32. From the pore size distribution (0-50 nm) shown in
Figure 4(c), it can be found that the probability of mesoporous distribution of PtCo/Ti
3C
2T
x-32 was significantly higher than that of the other three catalysts, and the pore distribution was mainly between 2 and 3 nm. The N
2 adsorption-desorption curves of Ti
3C
2T
x, Pt/Ti
3C
2T
x-6.64, Co/Ti
3C
2T
x-32 and PtCo/Ti
3C
2T
x-32 were analyzed and calculated to obtain the specific surface area, pore size and pore volume of the above-mentioned catalysts. The results were shown in
Table 1.
As can been seen from
Table 1 that the Ti
3C
2T
x has a specific surface area of 2.96 m
2/g, a pore volume of 0.0075 cm
3/g and a pore size of 10.77 nm. After loading Pt with Ti
3C
2T
x, the specific surface area, pore volume and pore diameter of Pt/Ti
3C
2T
x-6.64 become 15.41 m
2/g, 0.015 cm
3/g and 38.84 nm, respectively. It can be found that all the specific surface area, pore diameter and pore volume were increased. After loading Co with Ti
3C
2T
x, the specific surface area of Co/Ti
3C
2T
x-32 was 16.37 m
2/g and the pore volume was 0.028 cm
3/g, both the specific surface area and pore volume were increased. However, the pore size was reduced to 6.75 nm. The specific surface area of PtCo/Ti
3C
2T
x-32 was 59.31 m
2/g, and which was greatly improved. The pore volume was 0.039 cm
3/g, so the pore volume was also increased. The pore size is 2.66 nm, and which is reduced. The results shown that the specific surface area and pore volume of Pt/Ti
3C
2T
x-6.64, Co/Ti
3C
2T
x-32 and PtCo/Ti
3C
2T
x-32 were increased when they were compared with Ti
3C
2T
x, which is due to the effect of inserting Pt, Co and PtCo particles between the Ti
3C
2T
x layers. The accumulation of Ti
3C
2T
x flakes was effectively inhibited and the layer spacing was expanded [
25]. It is worth noting that the number of active sites on the catalyst surface is positively correlated with the catalytic performance of HER [
26]. Therefore, PtCo/Ti
3C
2T
x-32 can be expected to have the highest HER electrocatalytic activity.
3.2. Electrocatalytic HER Performance Test in Acidic Electrolyte
The HER electrocatalytic performance of Pt/Ti
3C
2T
x-3.32, Pt/Ti
3C
2T
x-6.64 and Pt/Ti
3C
2T
x-13.28 catalysts was tested in 0.5 mol/L H
2SO
4 solution. LSV results were shown in
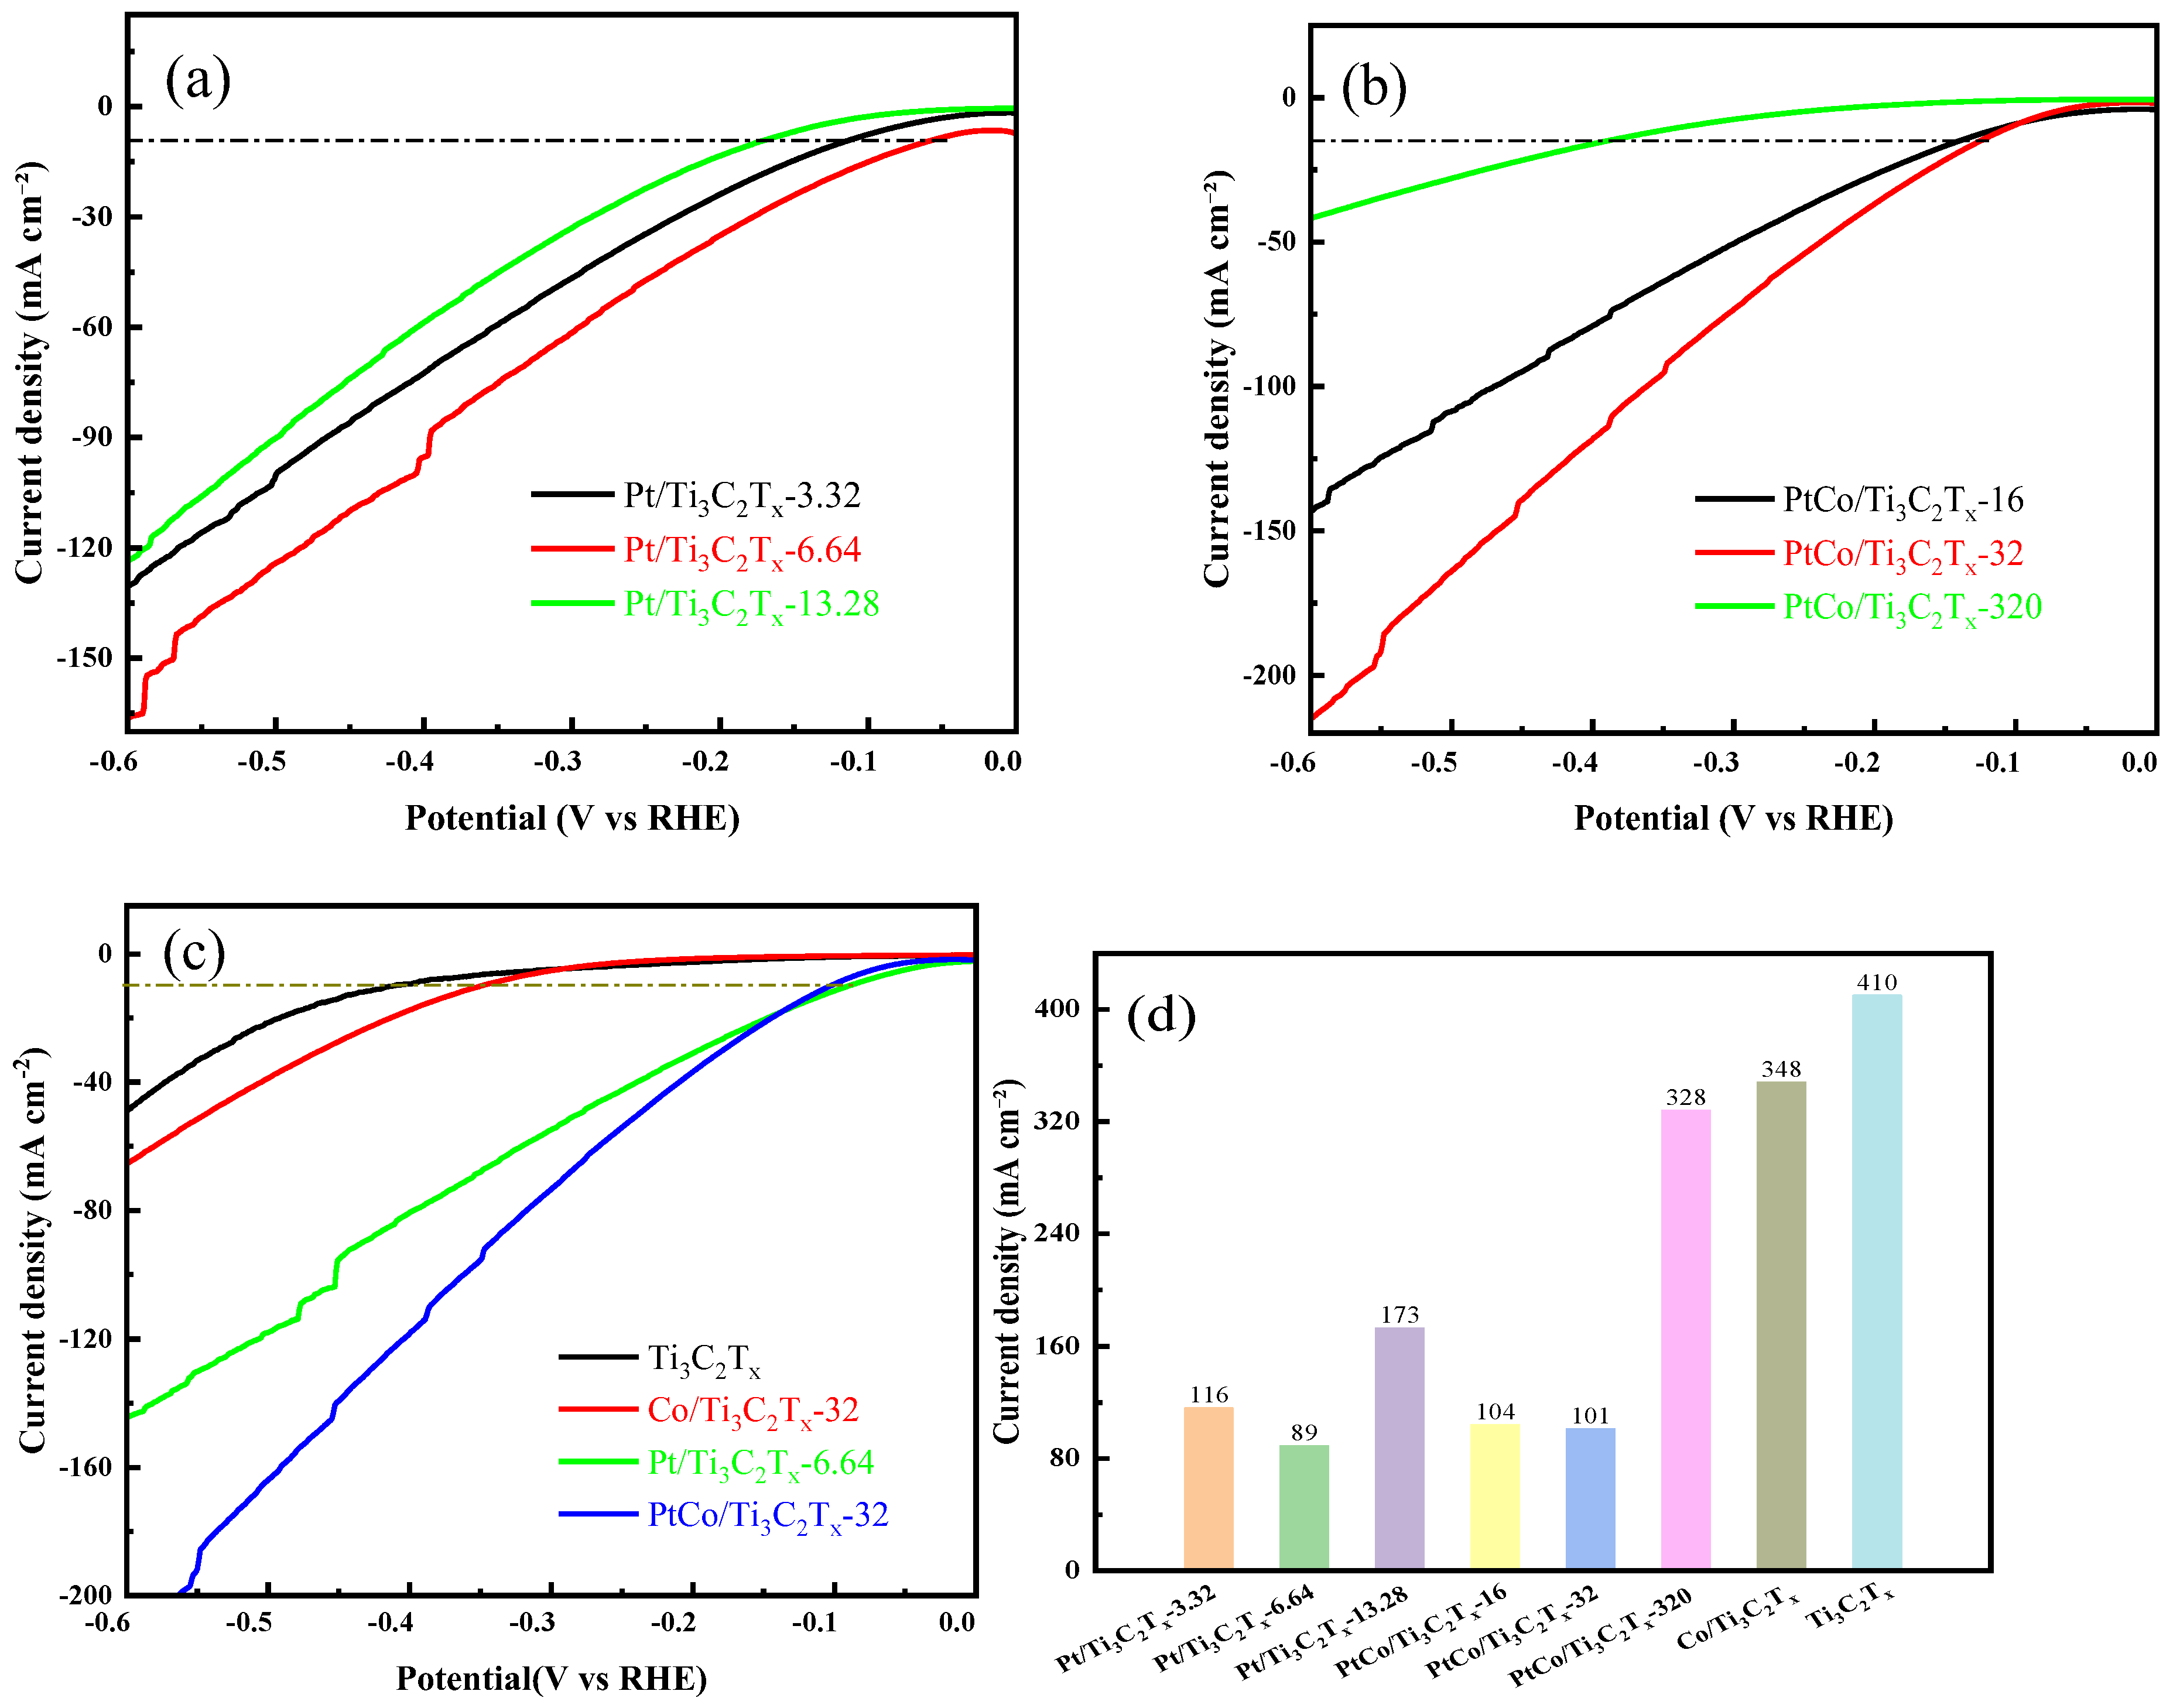
Figure 5(a). It can be seen that Pt/Ti
3C
2T
x-6.64 catalyst has the best HER electrocatalytic performance. The possible reasons for the low catalytic activity of Pt/Ti
3C
2T
x-3.32 and Pt/Ti
3C
2T
x-13.28 were as follows: when the content of Pt was insufficient, there are not enough active sites on the surface of Ti
3C
2T
x, resulting in poor HER performance; when the content of Pt was high, it is easier to agglomerate to form particles at high temperature reduction, making the Pt atoms wrapped in the particles unable to participate in the reaction, resulting in insufficient active sites. Therefore, the content of Pt was fixed at 6.64 mg, and the effects of different amounts of Co on the electrocatalytic HER performance were studied. The electrocatalytic HER performance of PtCo/Ti
3C
2T
x-16, PtCo/Ti
3C
2T
x-32 and PtCo/Ti
3C
2T
x-320 were tested in 0.5 mol/L H
2SO
4 solution and the LSV results were shown in
Figure 5(b). As can be seen from
Figure 9(b), the electrocatalytic HER performance of these above catalysts showed a trend of first increasing and then decreasing with the increase of Co content, and the PtCo/Ti
3C
2T
x-32 catalyst exhibited the best electrocatalytic HER performance. As a comparison, the electrocatalytic HER performance of Ti
3C
2T
x, Co/Ti
3C
2T
x-32, Pt/Ti
3C
2T
x-6.64 and PtCo/Ti
3C
2T
x-32 were tested and the LSV results of these above catalysts were shown in
Figure 5(c). It can be seen from
Figure 5(c) that PtCo/Ti
3C
2T
x-32 shown the best electrocatalytic HER performance. Finally, the η values of Ti
3C
2T
x, Co/Ti
3C
2T
x-32, Pt/Ti
3C
2T
x-6.64 and PtCo/Ti
3C
2T
x-32 required to reach a current density of 10 mA cm
-2 were obtained, as shown in
Figure 9(d). It can be seen from
Figure 9(d) that the η values of Ti
3C
2T
x and Co/Ti
3C
2T
x-32 were 435 mV and 420 mV, respectively. However, the η values of Pt/Ti
3C
2T
x-6.64 and PtCo/Ti
3C
2T
x-32 were 80 mV and 36 mV, respectively. It is worth noting that the η of commercial Pt/C catalyst was 45 mV to reach a current density of 10 mA cm
-2 in 0.5 M H
2SO
4 [
27], so the electrocatalytic HER performance of PtCo/Ti
3C
2T
x-32 is even better than the commercial Pt/C catalyst.
Figure 5.
HER performance diagram of catalyst in 0.5 mol/L H2SO4 solution. LSV diagram of (a) Pt/Ti3C2Tx with different amounts of Pt, (b) PtCo/Ti3C2Tx with different amounts of Co, (c) Ti3C2Tx, Co/Ti3C2Tx-32, Pt/Ti3C2Tx-6.64 and PtCo/Ti3C2Tx-32; (d) overpotential values of catalysts.
Figure 5.
HER performance diagram of catalyst in 0.5 mol/L H2SO4 solution. LSV diagram of (a) Pt/Ti3C2Tx with different amounts of Pt, (b) PtCo/Ti3C2Tx with different amounts of Co, (c) Ti3C2Tx, Co/Ti3C2Tx-32, Pt/Ti3C2Tx-6.64 and PtCo/Ti3C2Tx-32; (d) overpotential values of catalysts.
The ECSA of catalyst can reflect its hydrogen evolution performance. In order to comapare the electrocatalytic HER performance of Ti
3C
2T
x, Co/Ti
3C
2T
x-32, Pt/Ti
3C
2T
x-6.64 and PtCo/Ti
3C
2T
x-32 catalysts, so the CV curves of these above catalysts at different scanning speeds were obtained and shown as
Figure 6(a-d). Furthermore, the C
dl values of these above catalysts were calculated by equation (2) and shown as
Figure 6(e). It can be seen from
Figure 6(e) that the C
dl values of Ti
3C
2T
x, Co/Ti
3C
2T
x-32, Pt/Ti
3C
2T
x-6.64 and PtCo/Ti
3C
2T
x-32 catalysts were 0.94 mF cm
-2, 0.94 mF cm
-2, 3.54 mF cm
-2 and 5.46 mF cm
-2, respectively. The C
dl value was converted to ECSA value by equation (3), and the ECSA values of PtCo/Ti
3C
2T
x-32, Pt/Ti
3C
2T
x-6.64, Co/Ti
3C
2T
x-32 and Ti
3C
2T
x were 136.5 cm
-2, 88.5 cm
-2, 23.5 cm
-2 and 23.5 cm
-2, respectively. Therefore, the normalized ECSA followed the order: PtCo/Ti
3C
2T
x-32>Pt/Ti
3C
2T
x-6.64>Co/Ti
3C
2T
x-32=Ti
3C
2T
x. The HER activity followed the order: PtCo/Ti
3C
2T
x-32>Pt/Ti
3C
2T
x-6.64>Co/Ti
3C
2T
x-32>Ti
3C
2T
x. Co/Ti
3C
2T
x-32 and Ti
3C
2T
x had the same ECSA values, but Co/Ti
3C
2T
x had a higher HER activity than Ti
3C
2T
x, which may be due to Co entering the interior of Ti
3C
2T
x, which can effectively prevent Ti
3C
2T
x from stacking and expose more reaction active sites. Meanwhile, Pt/Ti
3C
2T
x-6.64 had higher ECSA and HER activity than Co/Ti
3C
2T
x-32, which indicates that Pt is more active than Co. PtCo/Ti
3C
2T
x-32 had higher ECSA and HER activity than Pt/Ti
3C
2T
x, which shows that PtCo forming an alloy can effectively inhibit the agglomeration of Pt. In order to further explore the HER kinetics of these catalysts, the corresponding Tafel slope values were obtained through the LSV curves of each catalyst, and the results were shown in
Figure 6(f). It can be seen from
Figure 6(f) that the Tafel slope of PtCo/Ti
3C
2T
x-32 catalyst was 66.31 mV dec
-1, which indicates the Volmer-Heyrovsky step is rate limiting. The Tafel slopes of Pt/Ti
3C
2T
x-6.64, Co/Ti
3C
2T
x-32 and Ti
3C
2T
x were 98.44 mV dec
-1, 196.52 mV dec
-1 and 262.72 mV dec
-1, respectively. Compared with Pt/Ti
3C
2T
x-6.64, Co/Ti
3C
2T
x-32 and Ti
3C
2T
x, the Tafel slope of PtCo/Ti
3C
2T
x-32 was significantly reduced, which means that its kinetic process is faster, indicating that the catalyst can reach the required current density at a lower η value, that is, it has the best electrocatalytic HER performance.
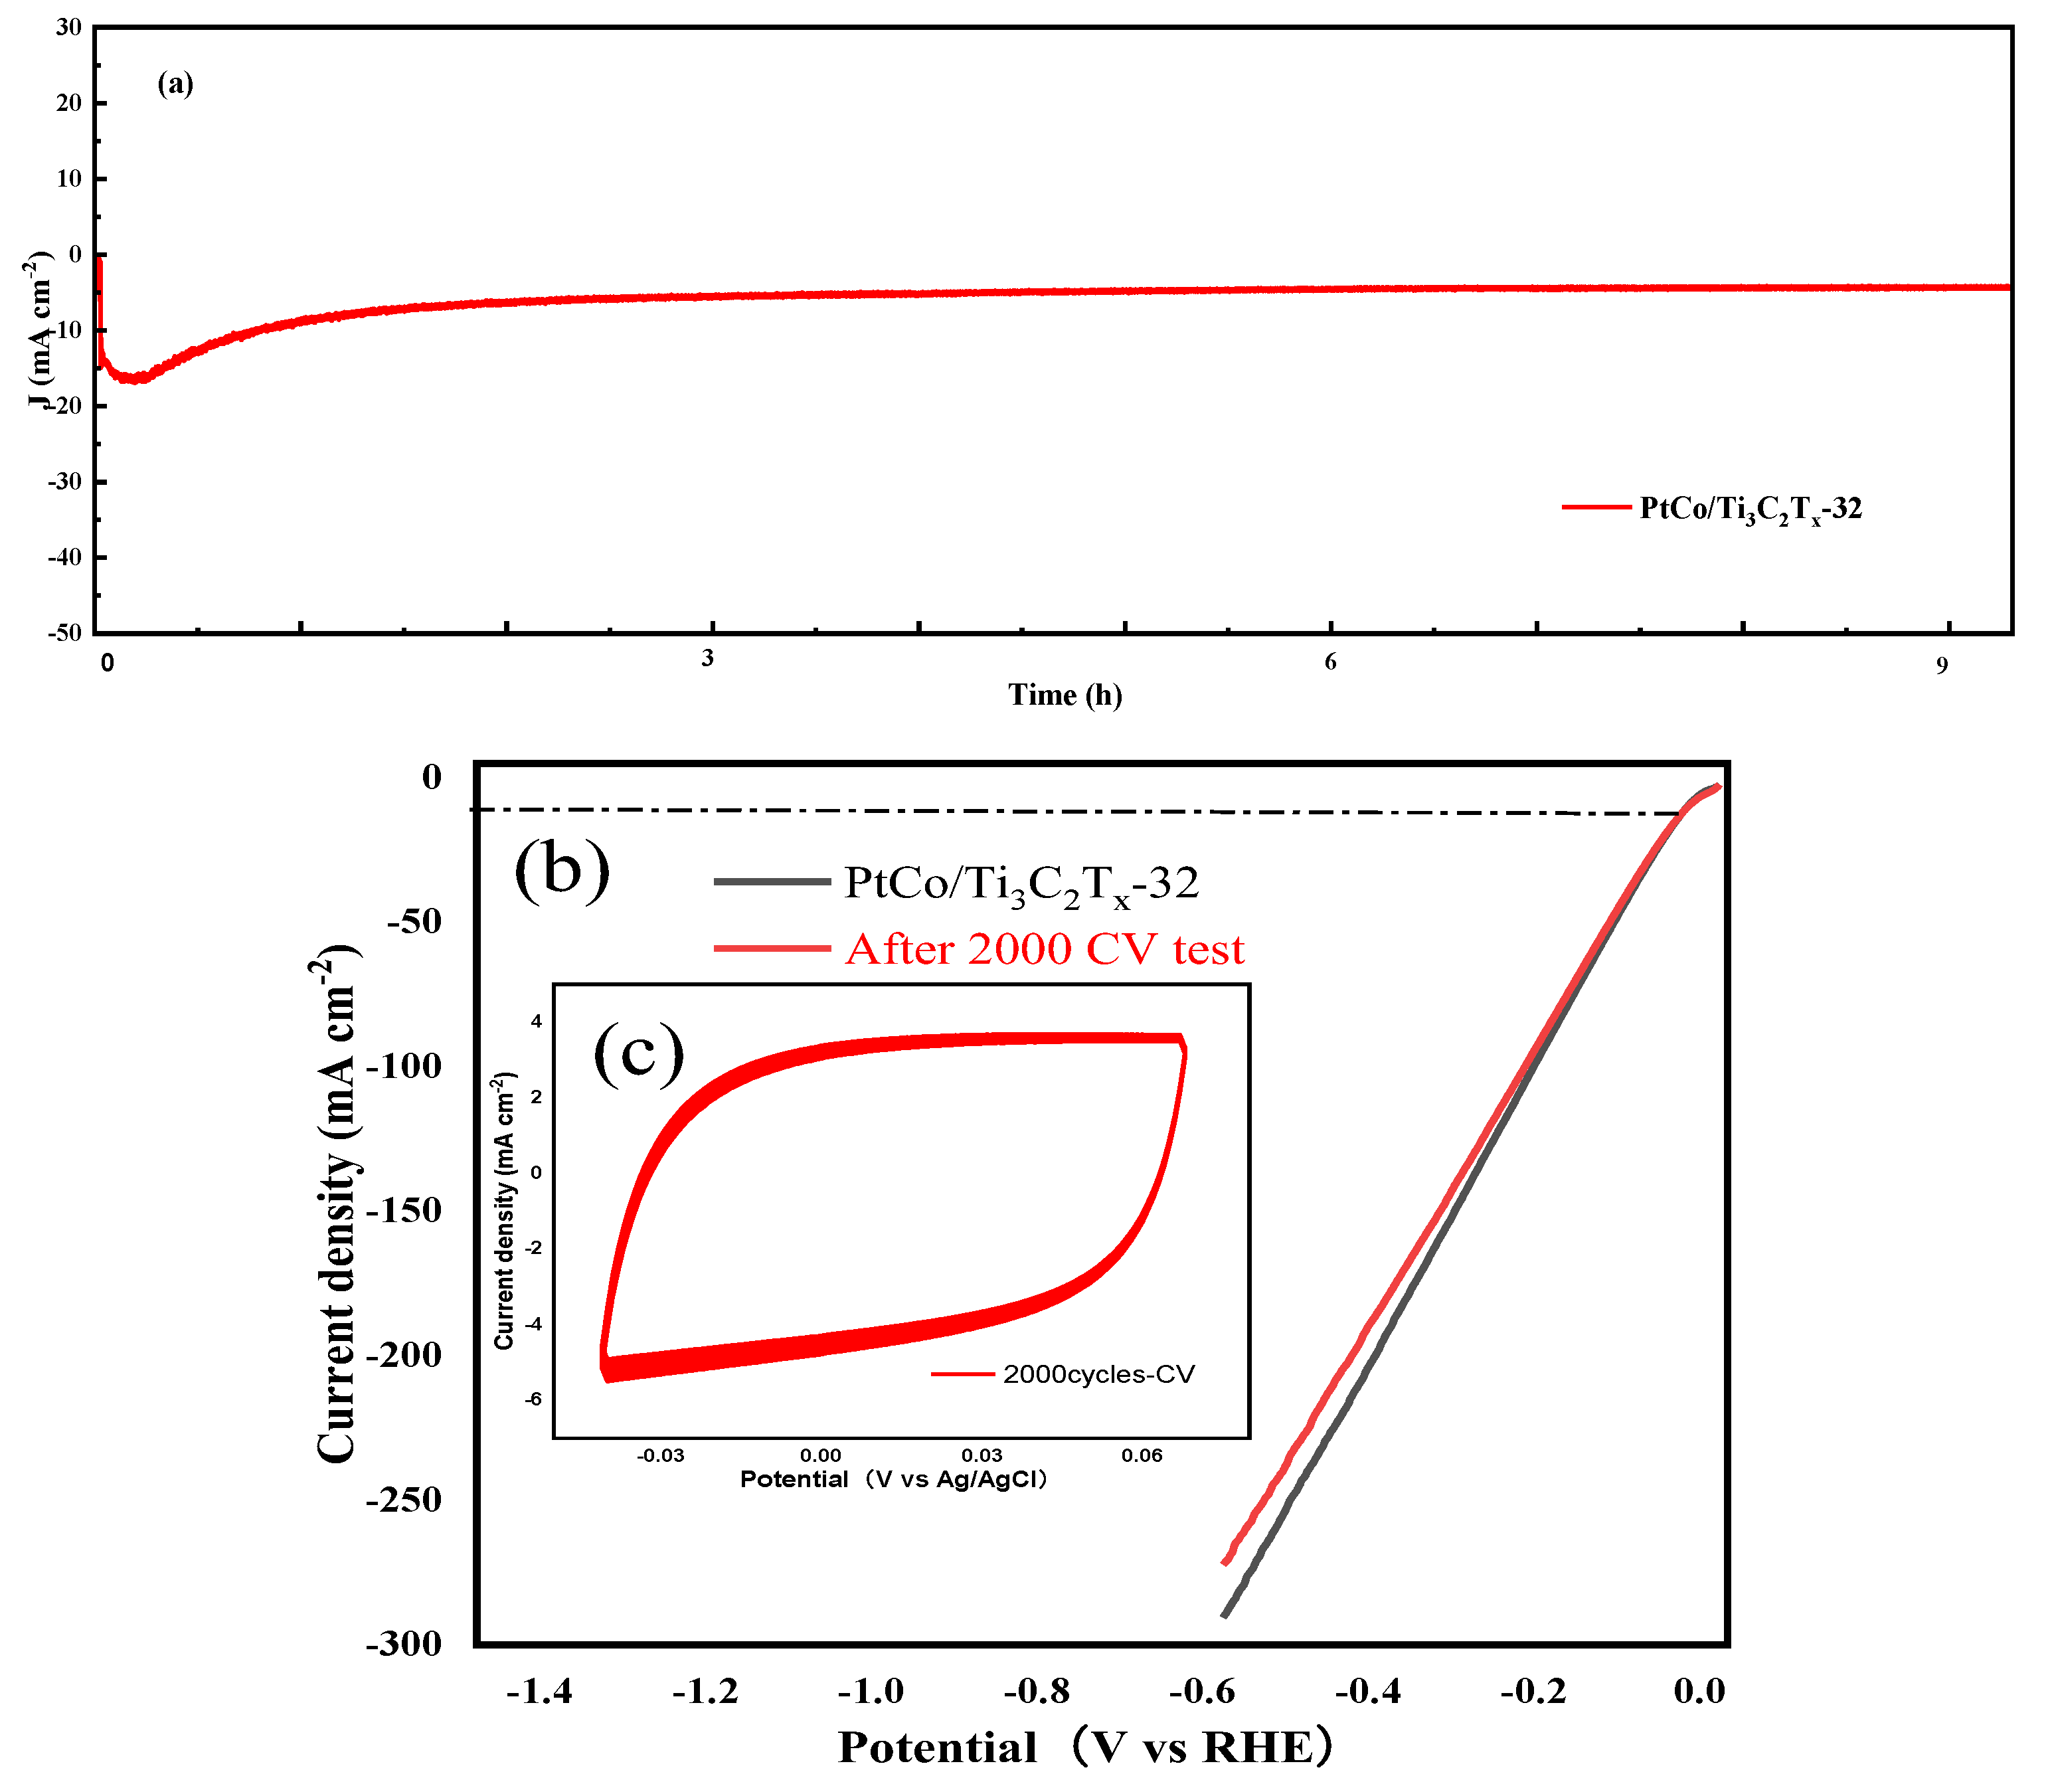
The electrocatalytic HER stability of PtCo/Ti
3C
2T
x-32 was tested in 0.5 mol L
-1 H
2SO
4 solution. The i-t, CV and LSV curves were shown in
Figure 7.
As can be seen from
Figure 7(a), PtCo/Ti
3C
2T
x-32 showed good stability after 10 h test. As can be seen from
Figure 7(b) and (c), the η value of PtCo/Ti
3C
2T
x-32 catalyst before and after 2000 cycles to reach the current density of 10 mA cm
-2 were 36 mV and 39 mV, only a 3 mV change in η value was observed, which further indicates that the PtCo/Ti
3C
2T
x-32 catalyst has good stability. According to CV test results, the MA value of PtCo/Ti
3C
2T
x-32 before and after electrocatalytic HER stability was obtained from equation (5). Before the electrocatalytic HER stability test, the MA value of PtCo/Ti
3C
2T
x-32 was 787.40 mA (mgPt)
-1; after the test, the MA value of PtCo/Ti
3C
2T
x-32 was changed to 748.03 mA (mgPt)
-1. All the above results shown that PtCo/Ti
3C
2T
x-32 had good stability in 0.5 mol L
-1 H
2SO
4 solution. Therefore, PtCo alloying can improve the corrosion resistance of Co in acidic media and protect the active site of catalyst.
3.3. Electrocatalytic HER Performance Test in Alkaline Electrolyte
The electrocatalytic HER performance of Pt/Ti
3C
2T
x-3.32, Pt/Ti
3C
2T
x-6.64 and Pt/Ti
3C
2T
x-13.28 were tested in 1 mol L
-1 KOH solution using standard three-electrode system. It can be seen from
Figure 8(a) that Pt/Ti
3C
2T
x-6.64 catalyst exhibited the best electrocatalytic HER performance. Subsequently, the Pt content was fixed at 6.64 mg, and the electrocatalytic HER performance of PtCo/Ti
3C
2T
x-16, PtCo/Ti
3C
2T
x-32 and PtCo/Ti
3C
2T
x-320 were tested to understand the influence of the amount of Co. It can be seen from
Figure 8(b) that the electrocatalytic HER performance increases first and then decreases with the increase of Co content, and PtCo/Ti
3C
2T
x-32 has the best electrocatalytic HER performance.
Figure 8(c) shows the LSV curves of Ti
3C
2T
x, Co/Ti
3C
2T
x-32, Pt/Ti
3C
2T
x-6.64 and PtCo/Ti
3C
2T
x-32.
Figure 8(d) showed that η values of Ti
3C
2T
x and Co/Ti
3C
2T
x-32 were respectively 410 mV and 348 mV to reach a current density of 10 mA cm
-2, which indicated that their electrocatalytic HER performance was poor. Although the η values of Ti
3C
2T
x and Co/Ti
3C
2T
x-32 in 1 mol L
-1 KOH solution are lower than their η values in 0.5 mol L
-1 H
2SO
4 solution, the overall η values were still too large. The addition of Pt improved the electrocatalytic HER performance of Pt/Ti
3C
2T
x-6.64 (89 mV) and PtCo/Ti
3C
2T
x-32 (101 mV). It is worth noting that the η ofommercial 20% Pt/C was 304 mV to reach a current density of 10 mA cm
-2 in 1 M KOH [
28], so the electrocatalytic HER performance of PtCo/Ti
3C
2T
x-32 was also better than the commercial Pt/C catalyst.
It is worth noting that the electrocatalytic HER performance of PtCo/Ti3C2Tx-32 was inferior to that of Pt/Ti3C2Tx-6.64 under low potential. However, the electrocatalytic HER performance of PtCo/Ti3C2Tx-32 rapidly exceeds that of Pt/Ti3C2Tx-6.64 with the increase of potential. In addition, the η value of the PtCo/Ti3C2Tx-32 in 0.5 mol L-1 H2SO4 solution is 36 mV, and the η value becomes 101 mV after the electrolyte is replaced with 1 mol L-1 KOH. The results showed that PtCo/Ti3C2Tx-32 can be used as electrocatalyst for HER in 0.5 mol L-1 H2SO4 solution and 1 mol L-1 KOH solution, and had better electrocatalytic performance in 0.5 mol/L H2SO4 solution.
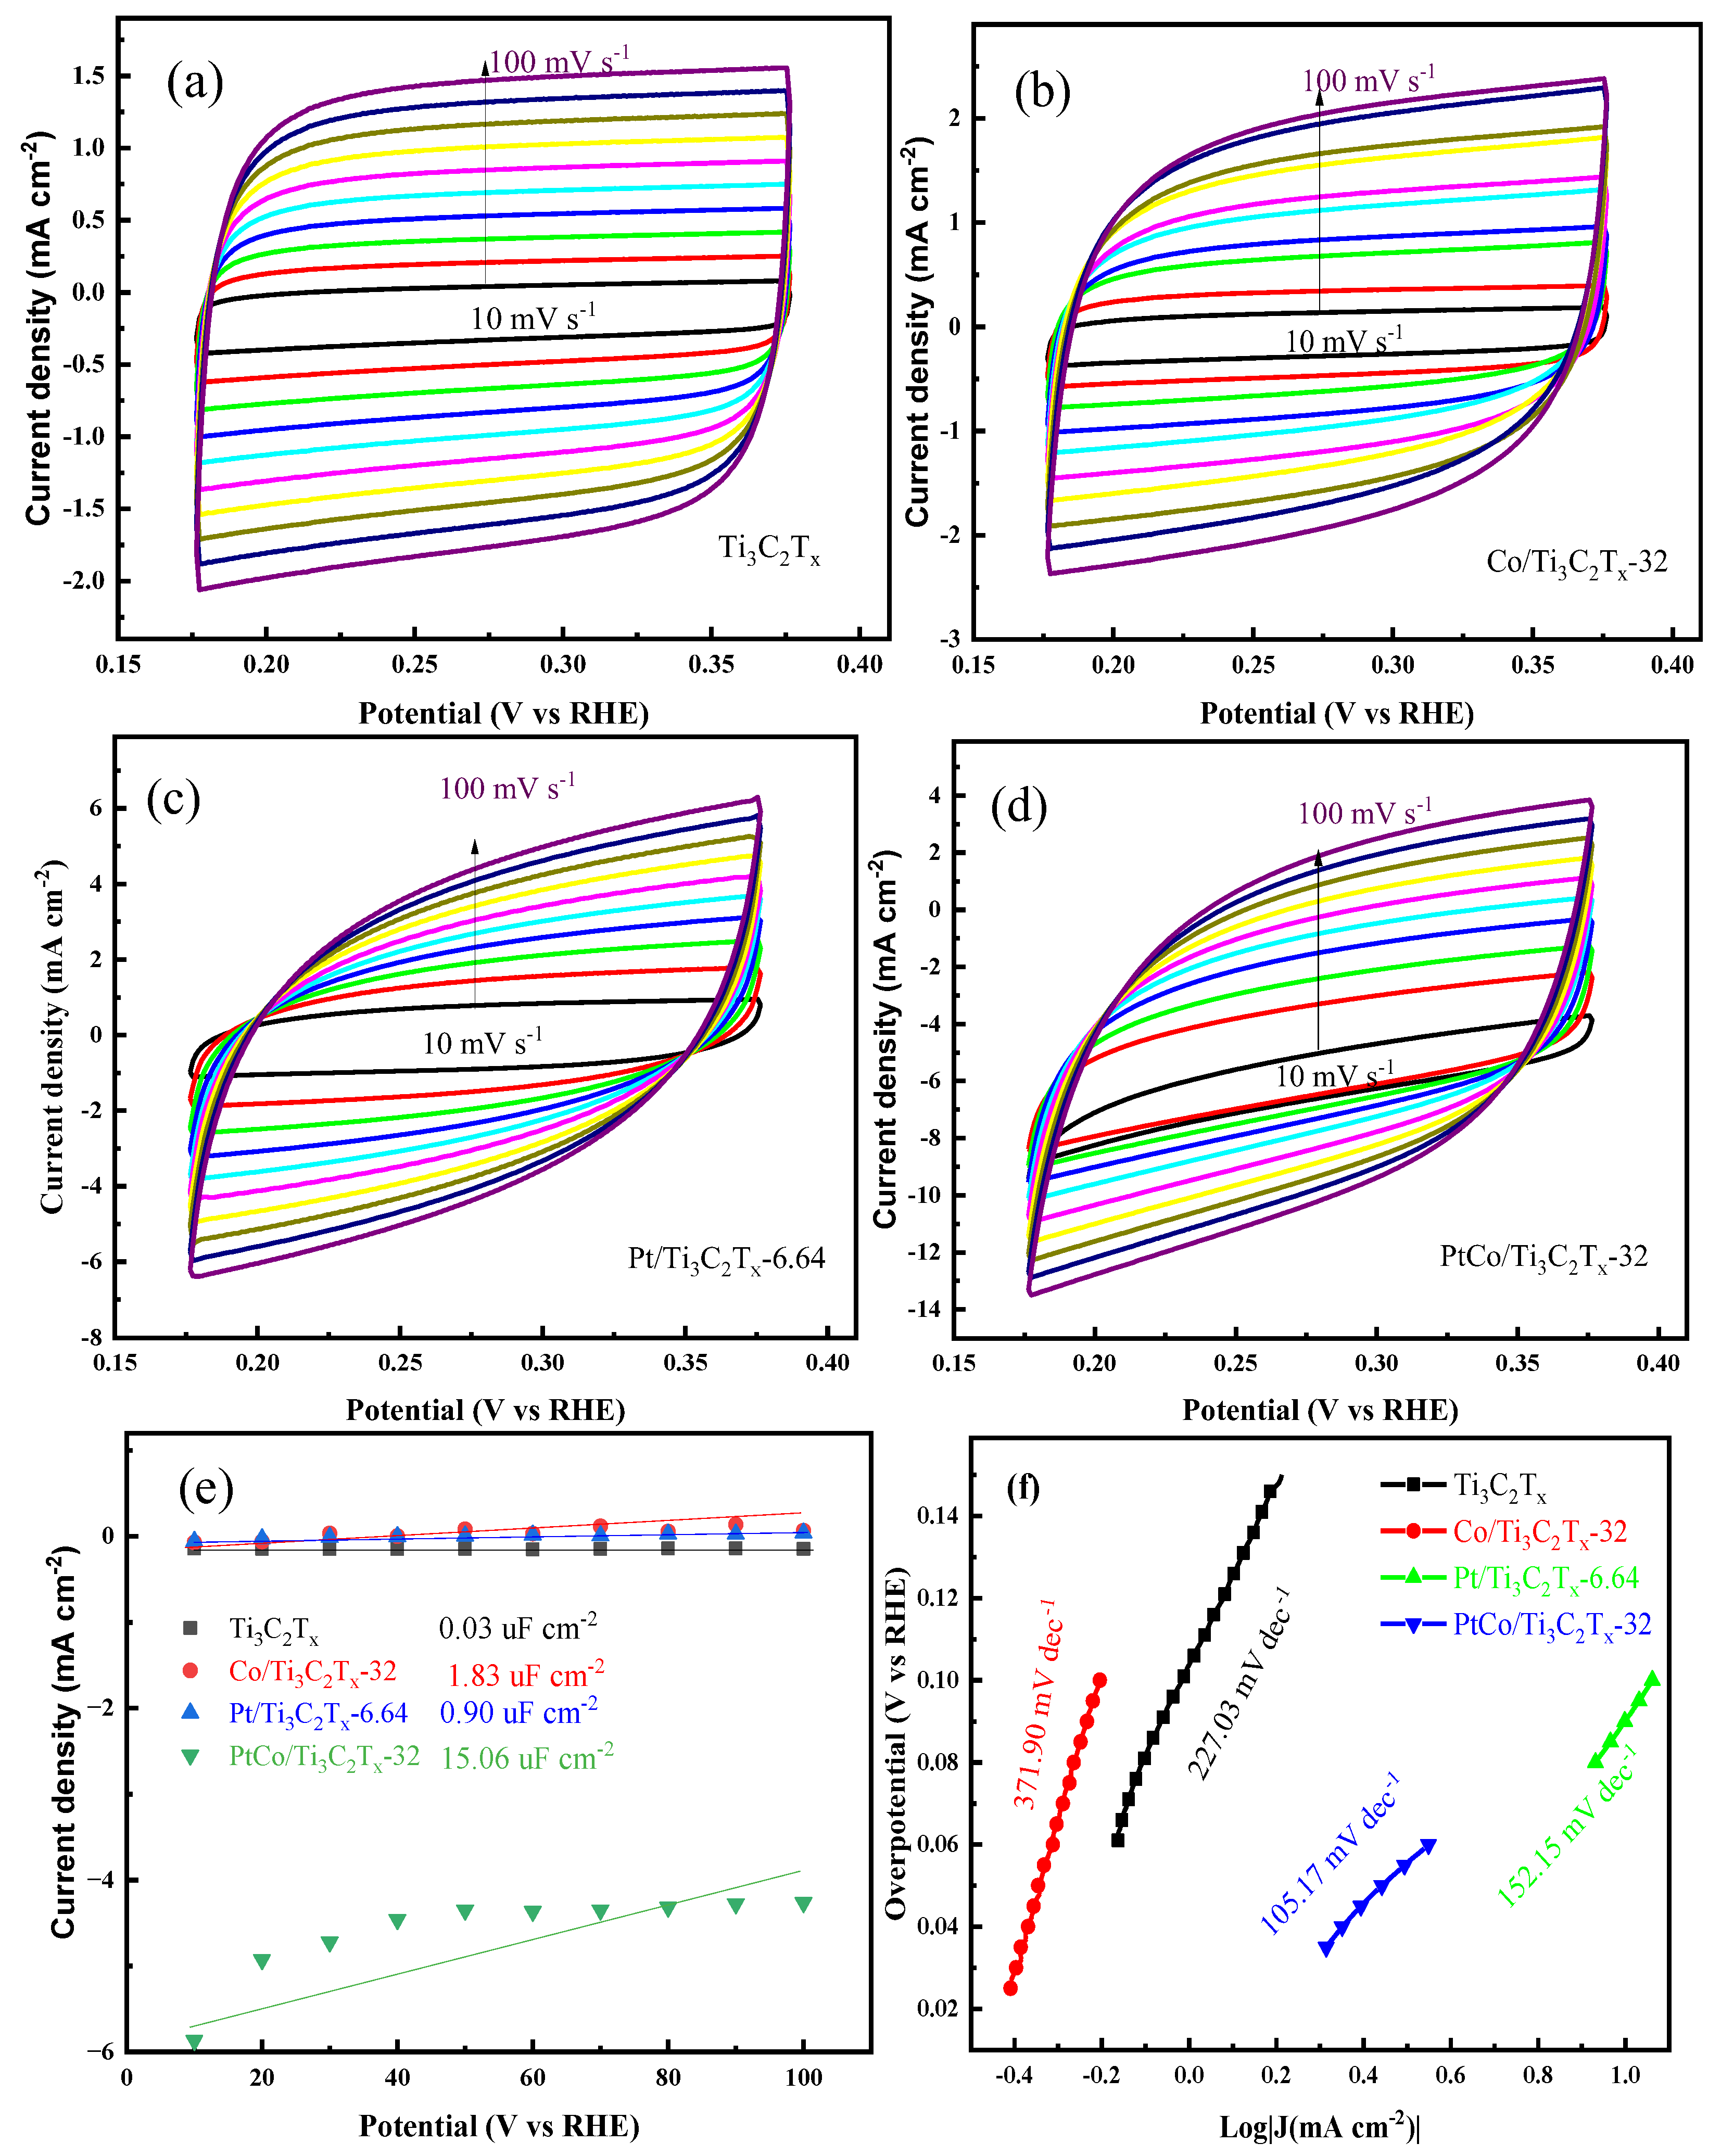
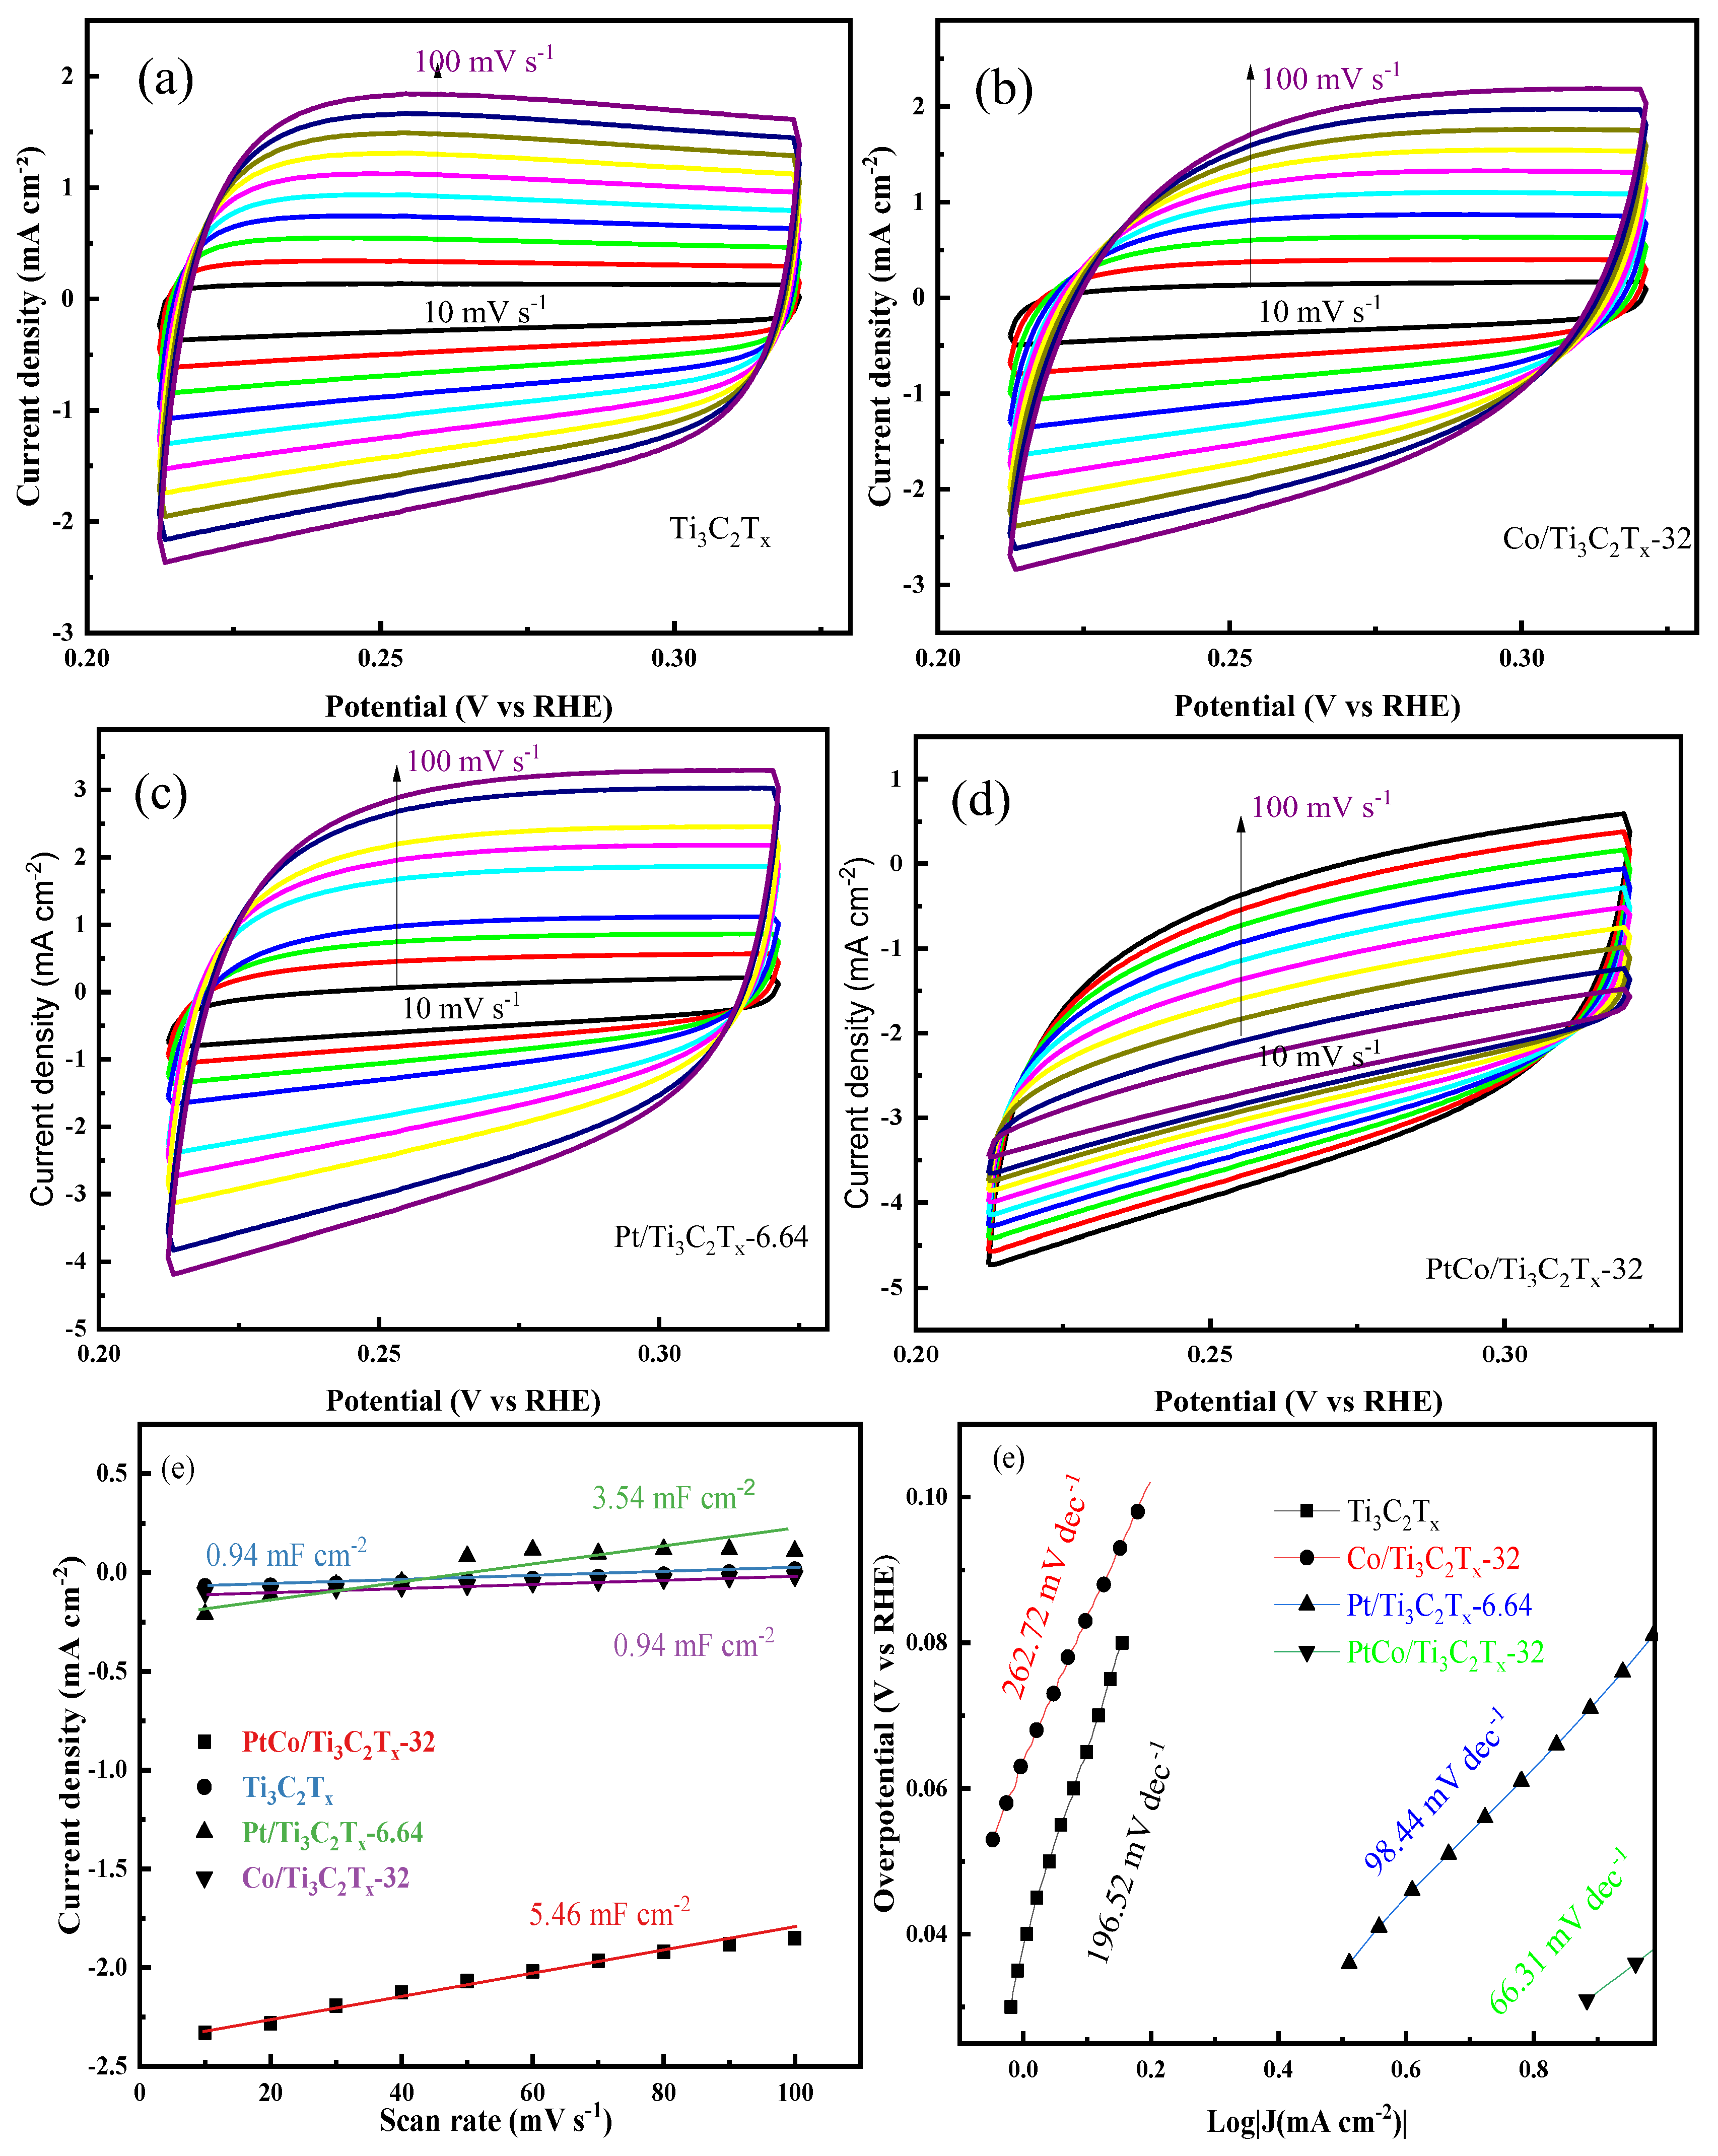
Figure 9(a-d) shows the CV diagrams of Ti
3C
2T
x, Co/Ti
3C
2T
x-32, Pt/Ti
3C
2T
x-6.64 and PtCo/Ti
3C
2T
x-32 at different scanning rates in 1 mol L
-1 KOH solution. The C
dl value of the above catalyst was calculated by equation (2), and the C
dl values of Ti
3C
2Tx, Co/Ti
3C
2T
x-32, Pt/Ti
3C
2T
x-6.64 and PtCo/Ti
3C
2T
x-32 catalysts were shown in
Figure 9(e). It can be seen from
Figure 9(e) that the C
dl values of Ti
3C
2T
x, Co/Ti
3C
2T
x-32, Pt/Ti
3C
2T
x-6.64 and PtCo/Ti
3C
2T
x-32 were 0.03 mF cm
-2, 0.94 mF cm
-2, 1.83 mF cm
-2 and 15.06 mF cm
-2, respectively. The C
dl value was then converted to ECSA value by equation (3), and the ECSA values of PtCo/Ti
3C
2T
x-32, Pt/Ti
3C
2T
x-6.64, Co/Ti
3C
2T
x-32 and Ti
3C
2T
x were 376.5 cm
-2, 22.5 cm
-2, 45.75 cm
-2 and 0.75 cm
-2, respectively. PtCo/Ti
3C
2T
x-32 catalyst has a large ECSA value, mainly because Co can effectively inhibit the agglomeration of Pt, reduce the particle size of Pt, and accelerate the charge transfer rate between Pt and Ti
3C
2T
x. In order to further explore the HER kinetics of these above catalysts, the corresponding Tafel slope values were obtained through the LSV curves of each catalyst, and the results were shown in
Figure 9(f). It can be seen from
Figure 9(f) that the Tafel slope of PtCo/Ti
3C
2T
x-32 catalyst was 105.17 mV dec
-1, which indicates the Volmer-Heyrovsky step is rate limiting. The Tafel slopes of Pt/Ti
3C
2T
x-6.64, Co/Ti
3C
2T
x-32 and Ti
3C
2T
x were 98.44 mV dec
-1, 196.52 mV dec
-1 and 262.72 mV dec
-1, respectively. The Tafel slope of PtCo/Ti
3C
2T
x-32 was significantly reduced when it was compared with Pt/Ti
3C
2T
x-6.64, Co/Ti
3C
2T
x-32 and Ti
3C
2T
x, indicating the kinetic process is faster and the HER activity is better.
Figure 9.
CV diagram of (a) Ti3C2Tx, (b) Co/Ti3C2Tx-32, (c) Pt/Ti3C2Tx-6.64, (d) PtCo/Ti3C2Tx-32; (e) Cdl values and (f) Tafel slopes of Ti3C2Tx, Co/Ti3C2Tx-32, Pt/Ti3C2Tx-6.64 and PtCo/Ti3C2Tx-32 in 1 mol L-1 KOH solution.
Figure 9.
CV diagram of (a) Ti3C2Tx, (b) Co/Ti3C2Tx-32, (c) Pt/Ti3C2Tx-6.64, (d) PtCo/Ti3C2Tx-32; (e) Cdl values and (f) Tafel slopes of Ti3C2Tx, Co/Ti3C2Tx-32, Pt/Ti3C2Tx-6.64 and PtCo/Ti3C2Tx-32 in 1 mol L-1 KOH solution.
The electrocatalytic HER stability of PtCo/Ti
3C
2T
x-32 was tested in 1 mol L
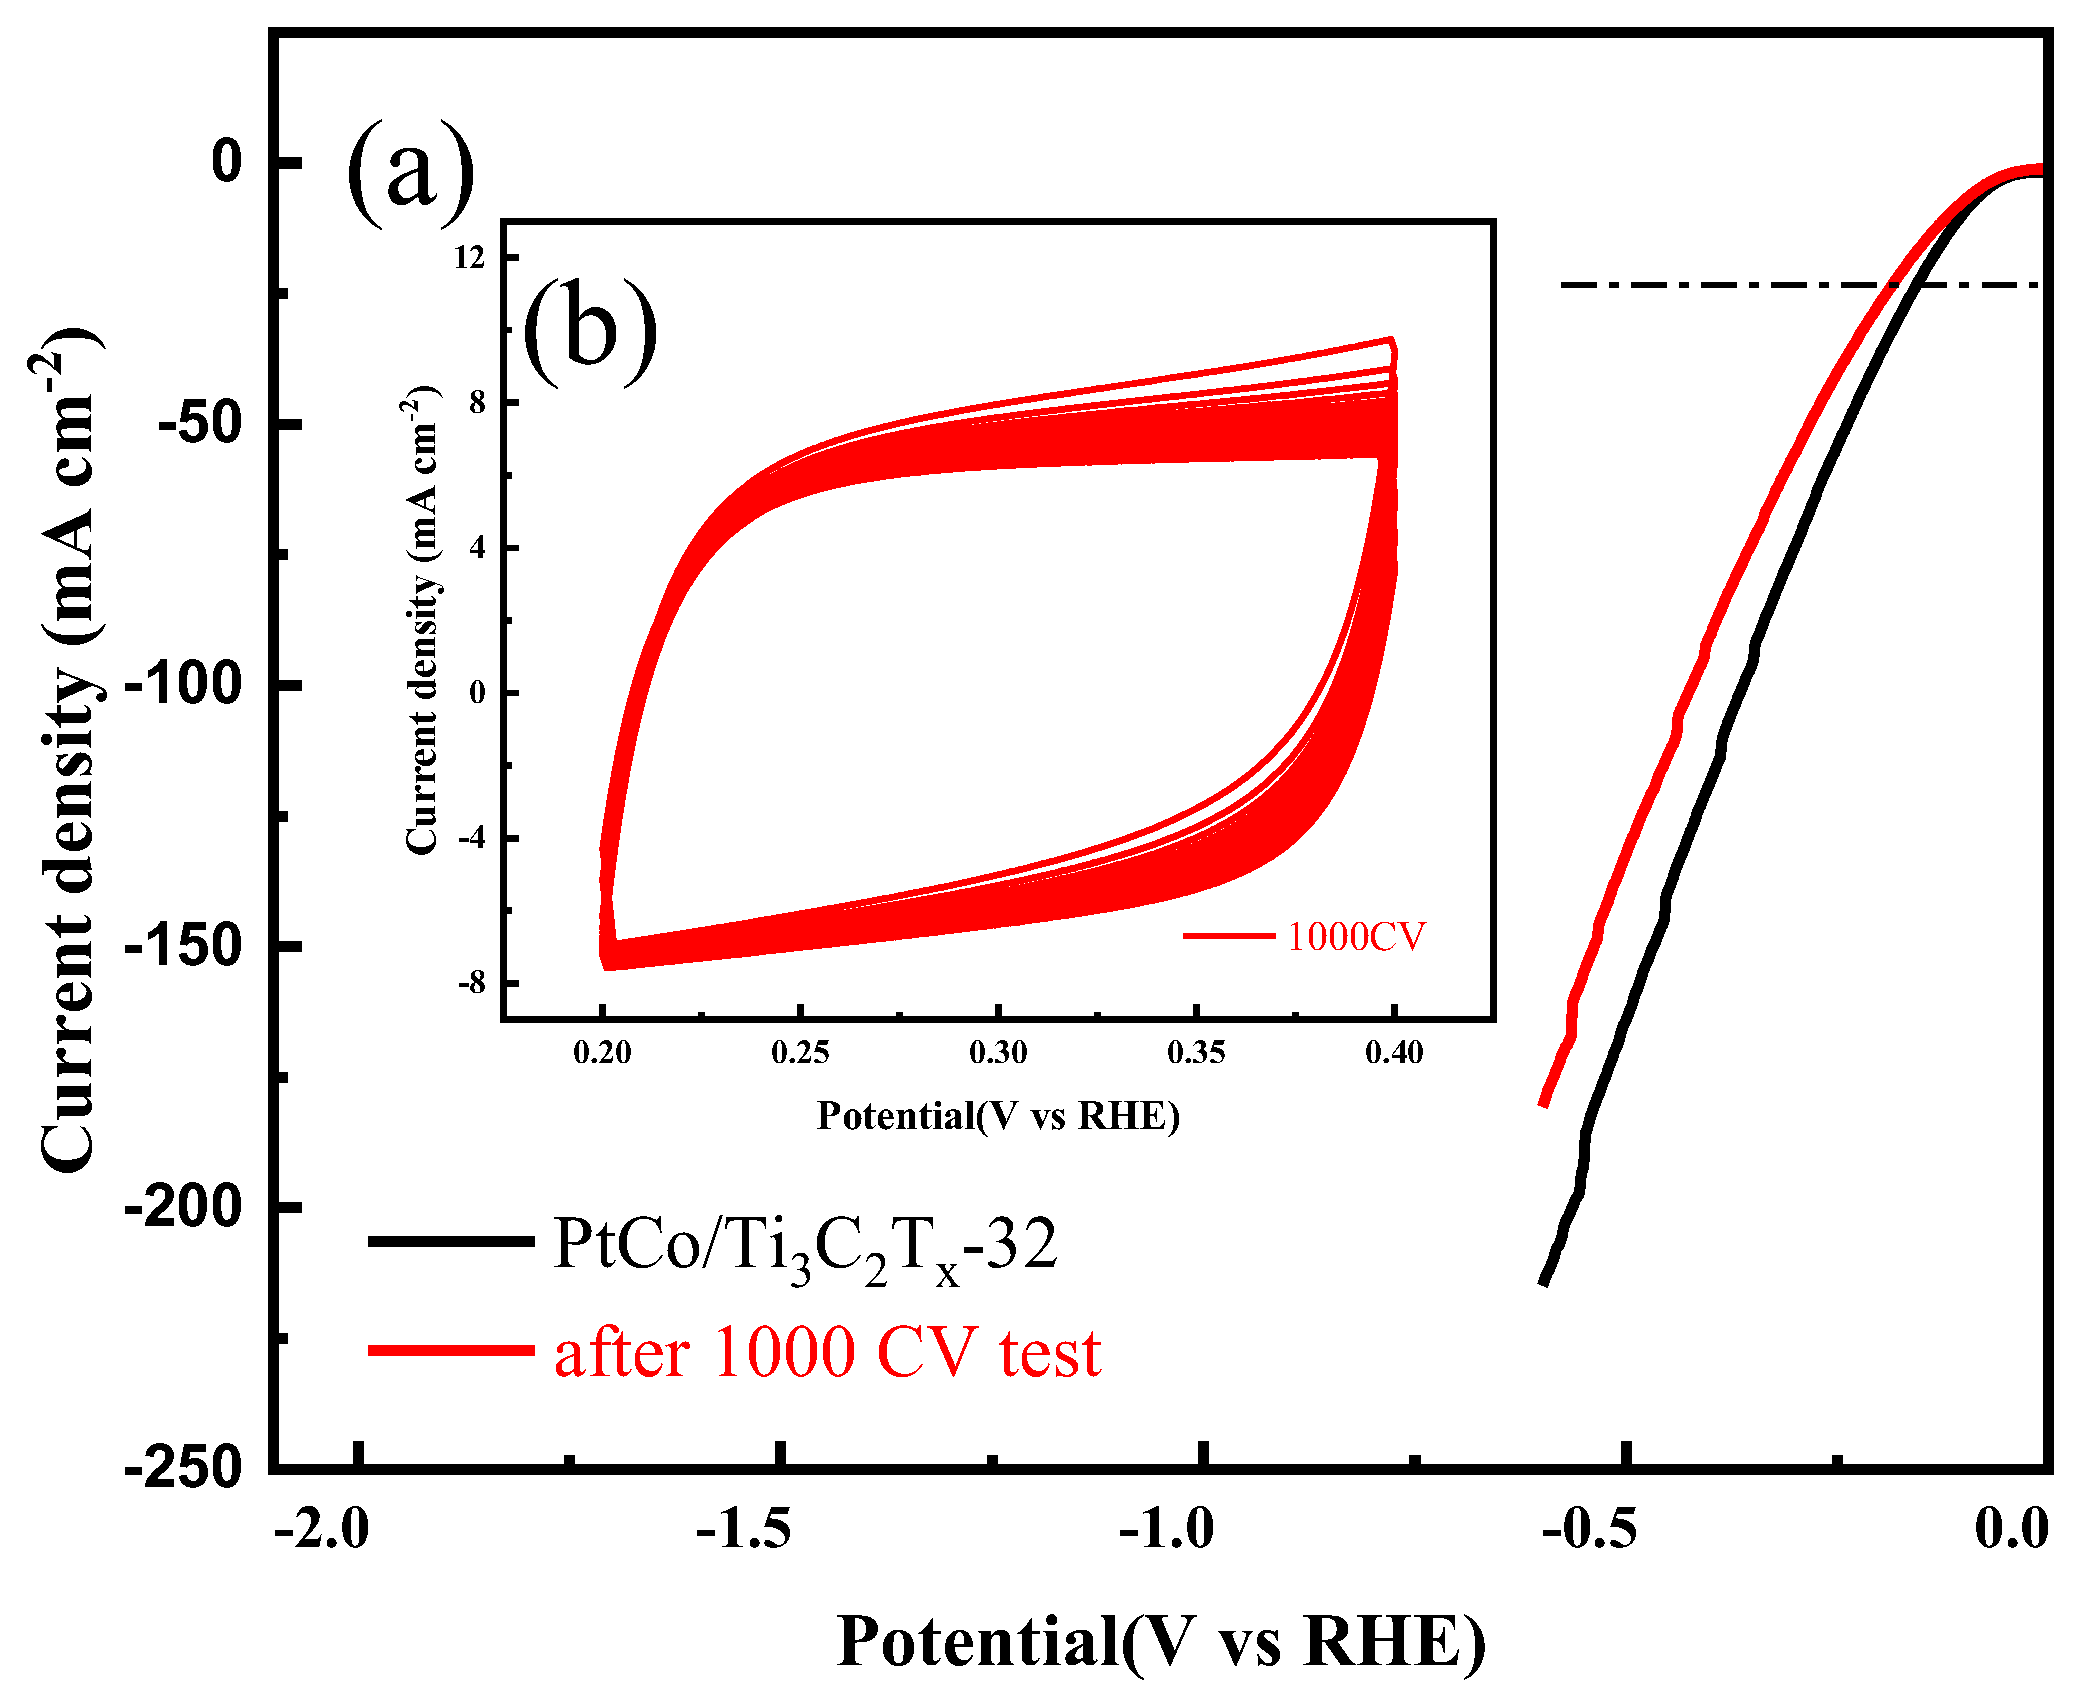
-1 KOH solution. The CV and LSV curves were shown in
Figure 10.
As can be seen from
Figure 10(a), the η value of PtCo/Ti
3C
2T
x-32 catalyst before and after 1000 cycles to reach the current density of 10 mA cm
-2 were 101 mV and 116 mV, and a 15 mV change in η value was observed, which indicates that the PtCo/Ti
3C
2T
x-32 catalyst has good stability. According to CV test results, the MA value of PtCo/Ti
3C
2T
x-32 before and after electrocatalytic HER stability was obtained from equation (5). Before the electrocatalytic HER stability test, the MA value of PtCo/Ti
3C
2T
x-32 was 787.4 mA (mgPt)
-1; after the test, the MA value of PtCo/Ti
3C
2T
x-32 was changed to 606.3 mA (mgPt)
-1. Therefore, the original 77% activity was still maintained after the test, indicating that the stability of PtCo/Ti
3C
2T
x-32 in 1 mol L
-1 KOH solution is worse than that in 0.5 mol L
-1 H
2SO
4 solution.
The electrocatalytic HER performance of PtCo/Ti3C2Tx-32 was compared with that of MXene-based catalyst reported in literature, and the results were shown in Error! Reference source not found.. It could be seen from the table that the PtCo/Ti3C2Tx-32 had better performance in terms of overpotential and Tafel slope, which can be expected as a promising electrocatalysts for HER.

