Submitted:
28 October 2024
Posted:
29 October 2024
You are already at the latest version
Abstract
Keywords:
1. Introduction
2. Material and Methods
2.1. Research Methodology
- -
- identification of the WKR’s economy sectors and factors that have the greatest impact on air quality;
- -
- data collection on the environmental state of the WKR and the impact of KPO on the region;
- -
- study and assessment of KPO’s strategies to implement measures for air pollution reduction;
- -
- using KPO as an example propose the model for the circular economy formation;
- -
- development of recommendations for the application of basic approaches to the concentration of resources, tools and methods for the circularization of economic relations based on KPO, contributing to the reduction of atmospheric pollution.
2.2. Information Database
2.3. Literature Review
3. Results and Discussion
3.1. Identification of WKR’s Economy Sectors and Factors That Impact on Air Quality
3.2. KPO's Contribution to the Socio-Economic Development and Environmental Condition of the WKR
3.3. Research on Opportunities for a Circular Economy in West Kazakhstan Region
3.3.1. Analysis of the Generally Accepted Strategy and Practice of Its Implementation at KPO to Reduce Harmful Air Pollution into the Environment Within the Framework of ESG.
3.5. Studying the Creation of a Circular Economy Meso-Model Based on KPO
3.5.1. Dependence of Atmospheric Pollutants Emissions from “Pro-Sustainable” Measures at KPO for 2012-2022.
| Independent Variables | Description | Independent Variables | Description |
| OIL GAS PROD |
Oil and gas condensate production, million barrels | PRO WASTE | Volume of processed industrial waste, th.t |
| FLARED GAS | Volume of flared gas, million m3 | ENV PROT COST |
Total costs for environmental protection, million USD |
| ENV TECH | Use of environmentally friendly technologies - gas injection into the reservoir, billion m3 | ENERGY_ CONS |
Energy consumption, PJ |
| 2012 | 2013 | 2014 | 2015 | 2016 | 2017 | 2018 | 2019 | 2020 | 2021 | 2022 | |||
|---|---|---|---|---|---|---|---|---|---|---|---|---|---|
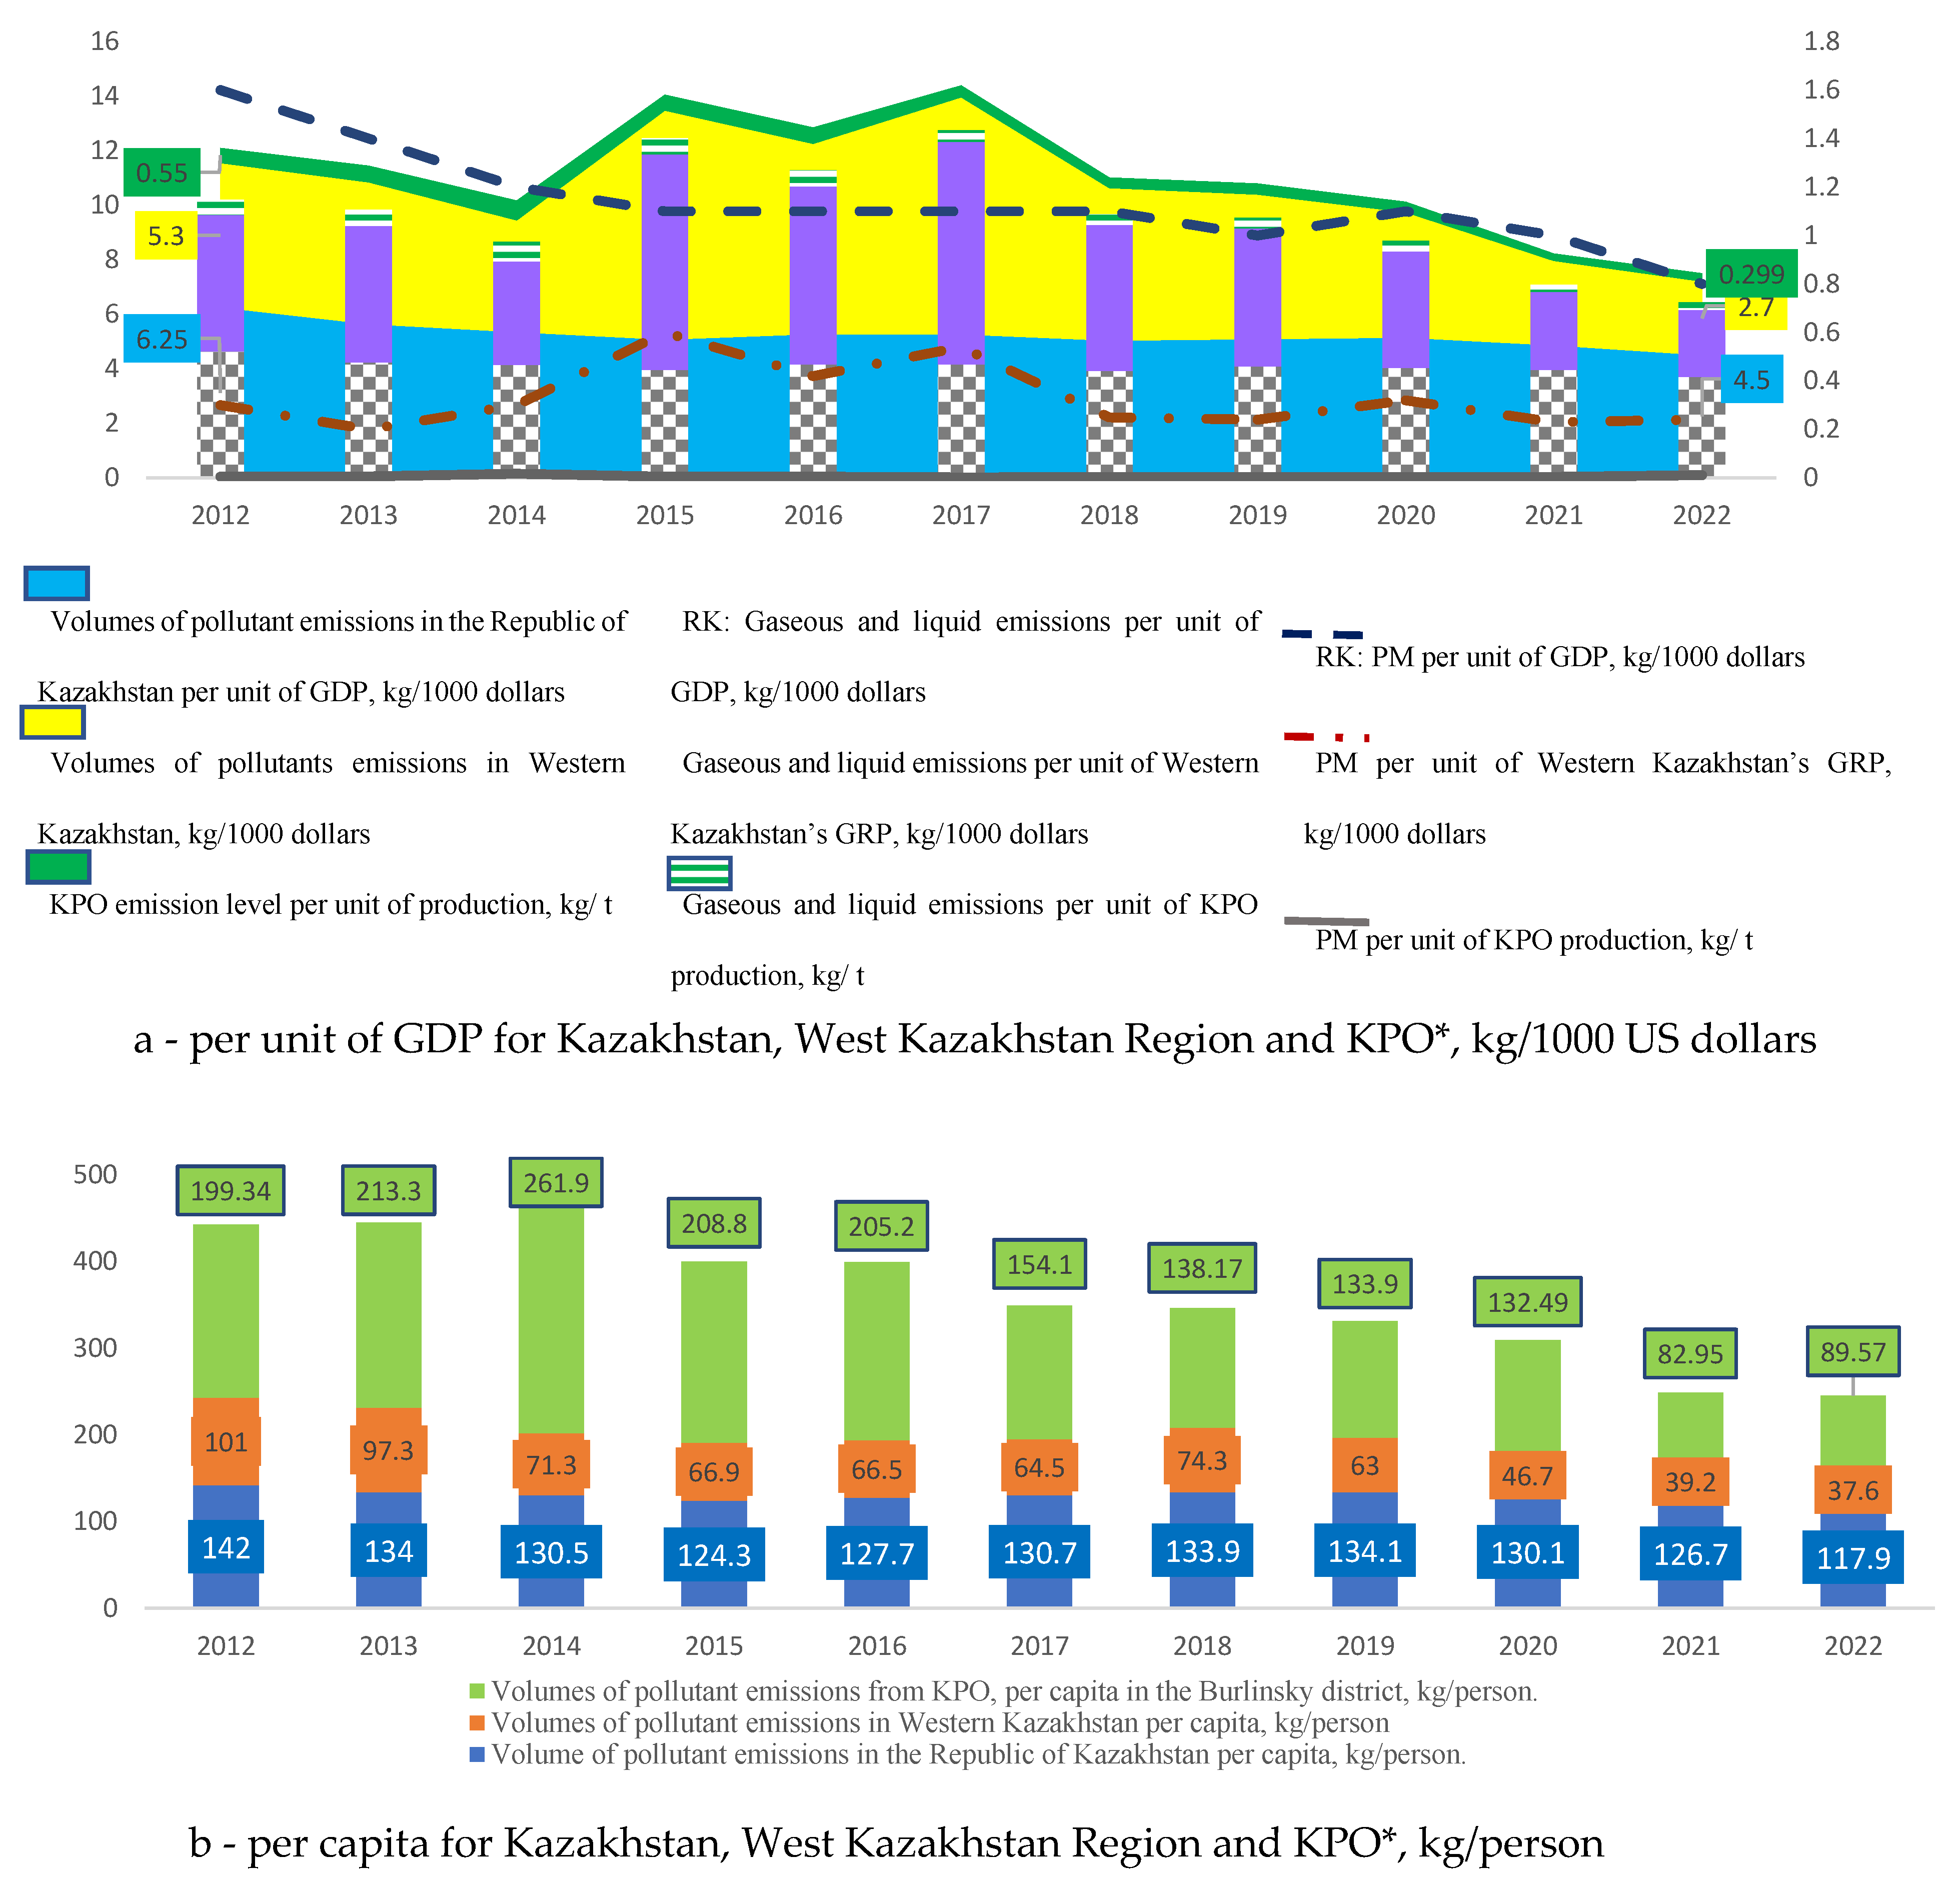
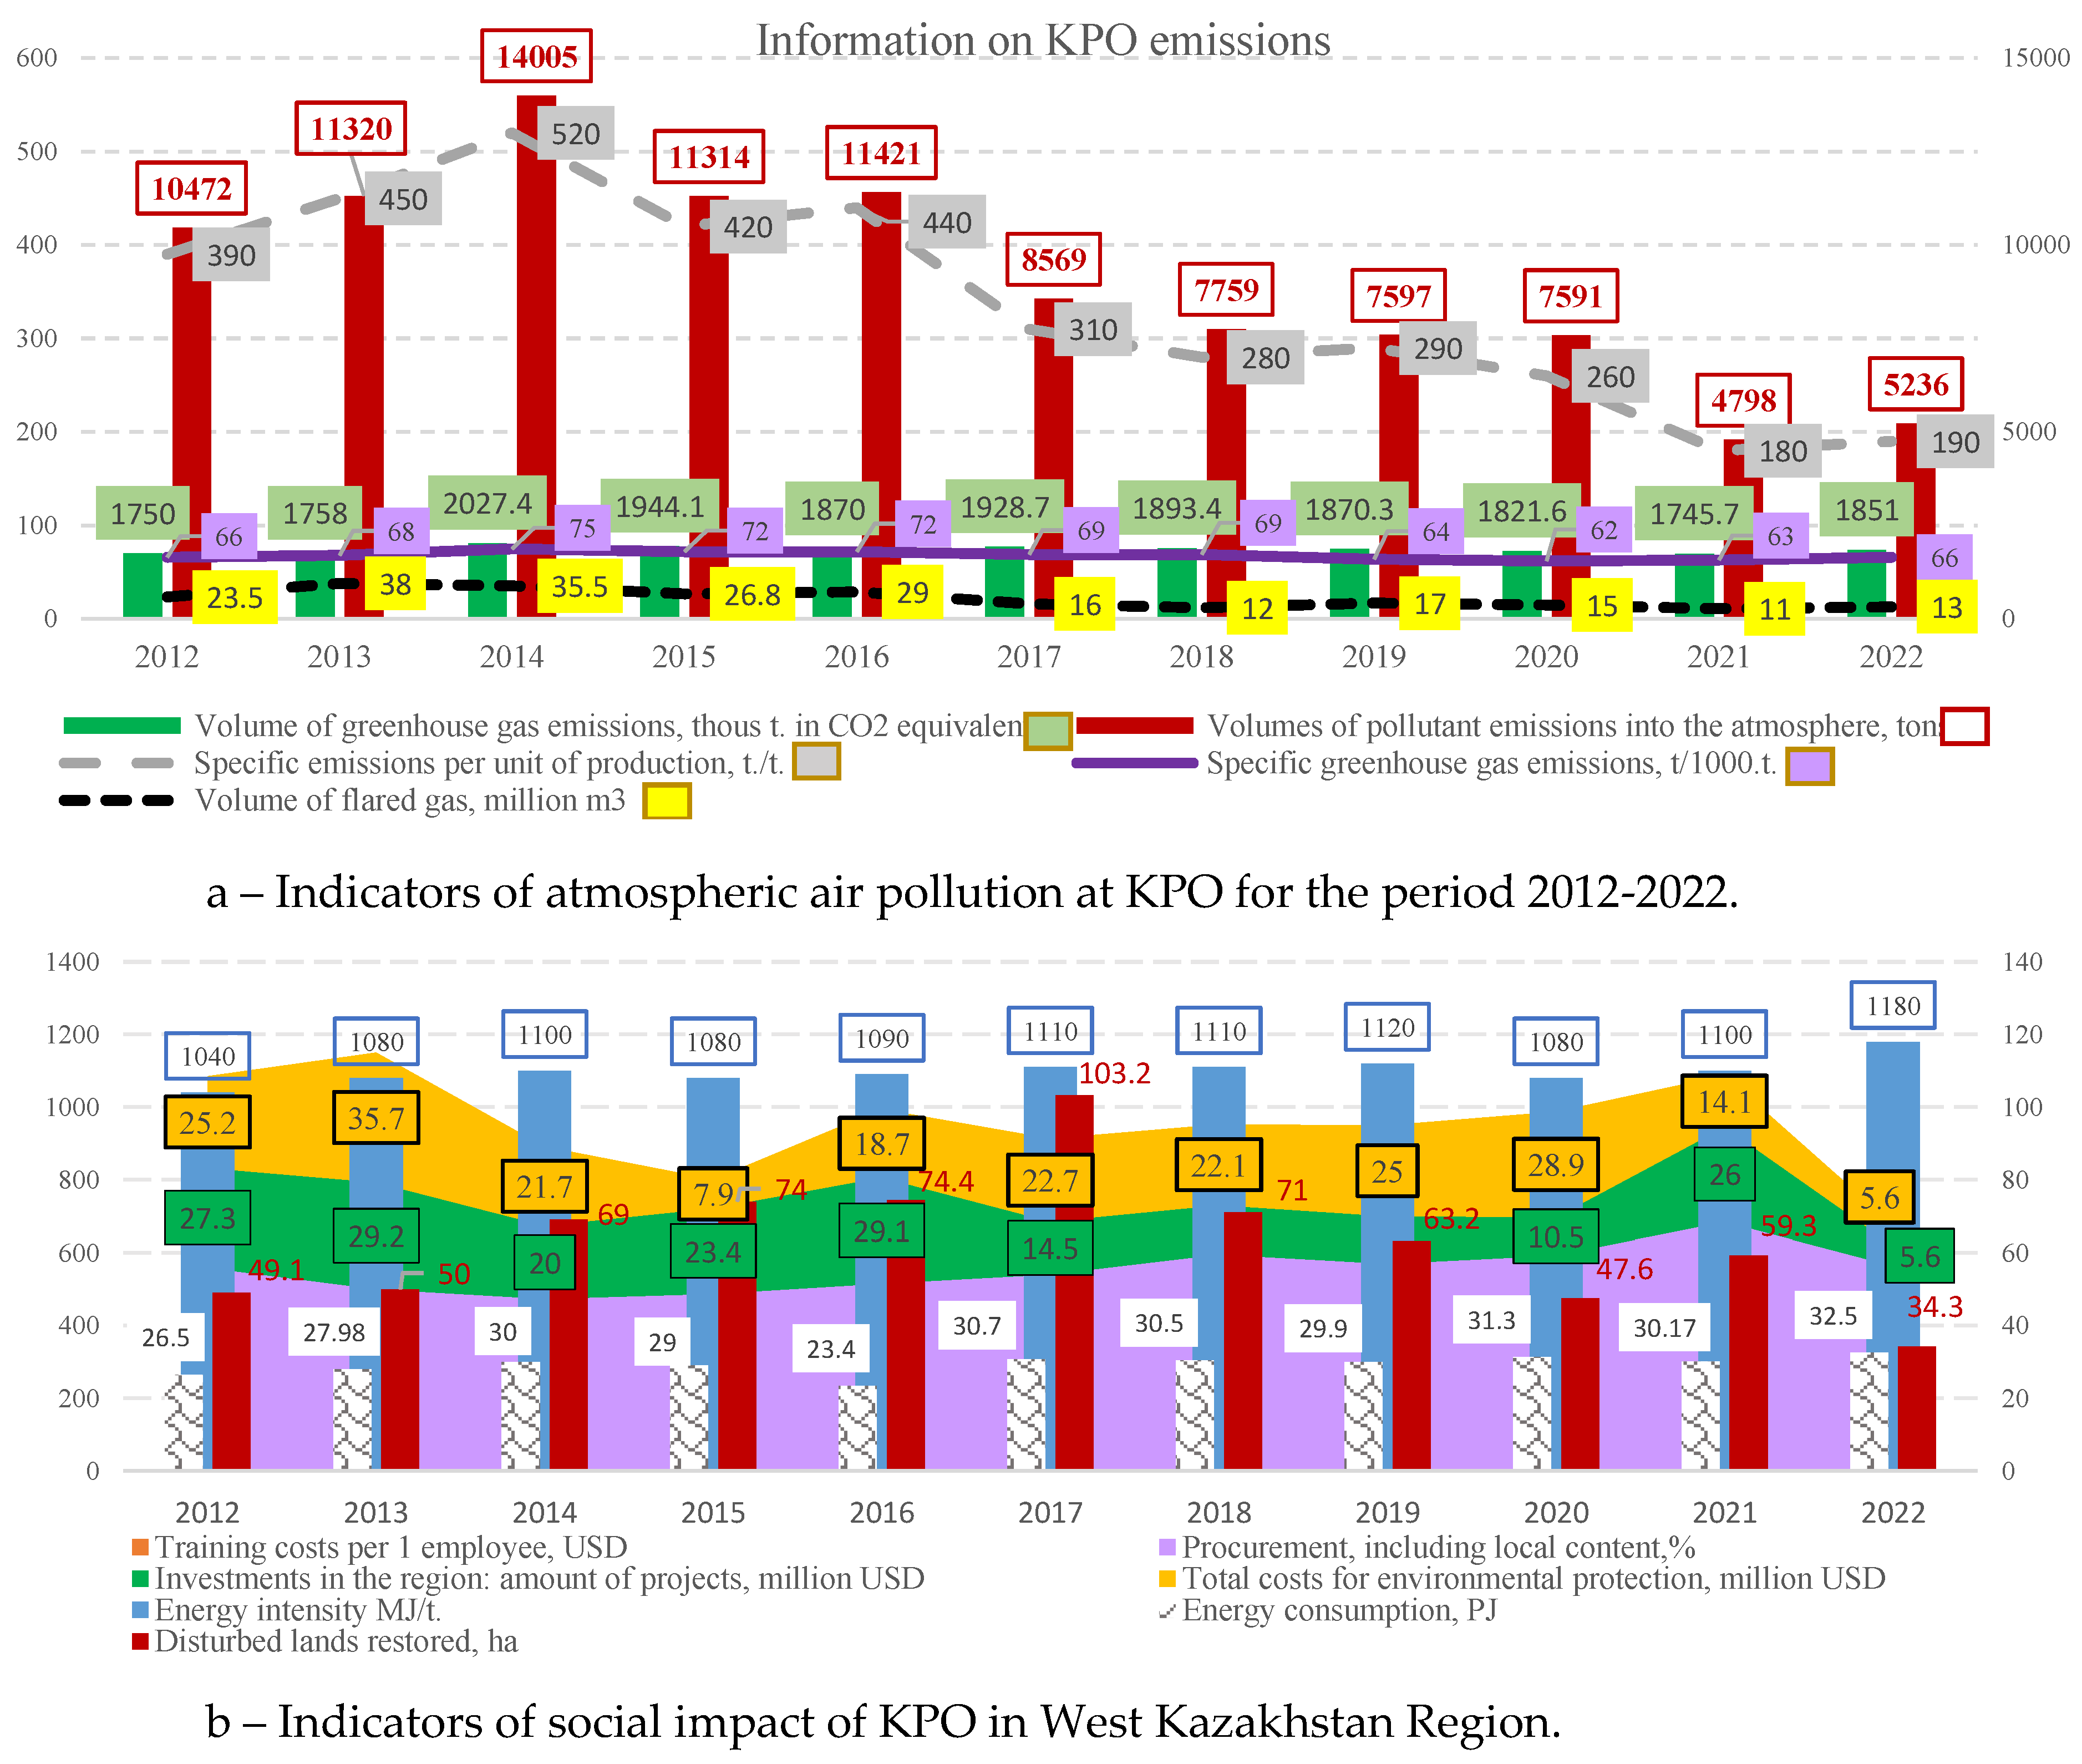
| DV | EMISSION1 | KPO emission level per unit of production, kg/t. | 0,55 | 0,61 | 0,721 | 0,585 | 0,599 | 0,431 | 0,386 | 0,404 | 0,387 | 0,262 | 0,299 |
| EMISSION2 | Volumes of pollutant emissions from KPO, per capita in the Burli district, kg/person. | 199,34 | 213,3 | 261,9 | 208,8 | 205,2 | 154,1 | 138,17 | 133,9 | 132,49 | 82,95 | 89,57 | |
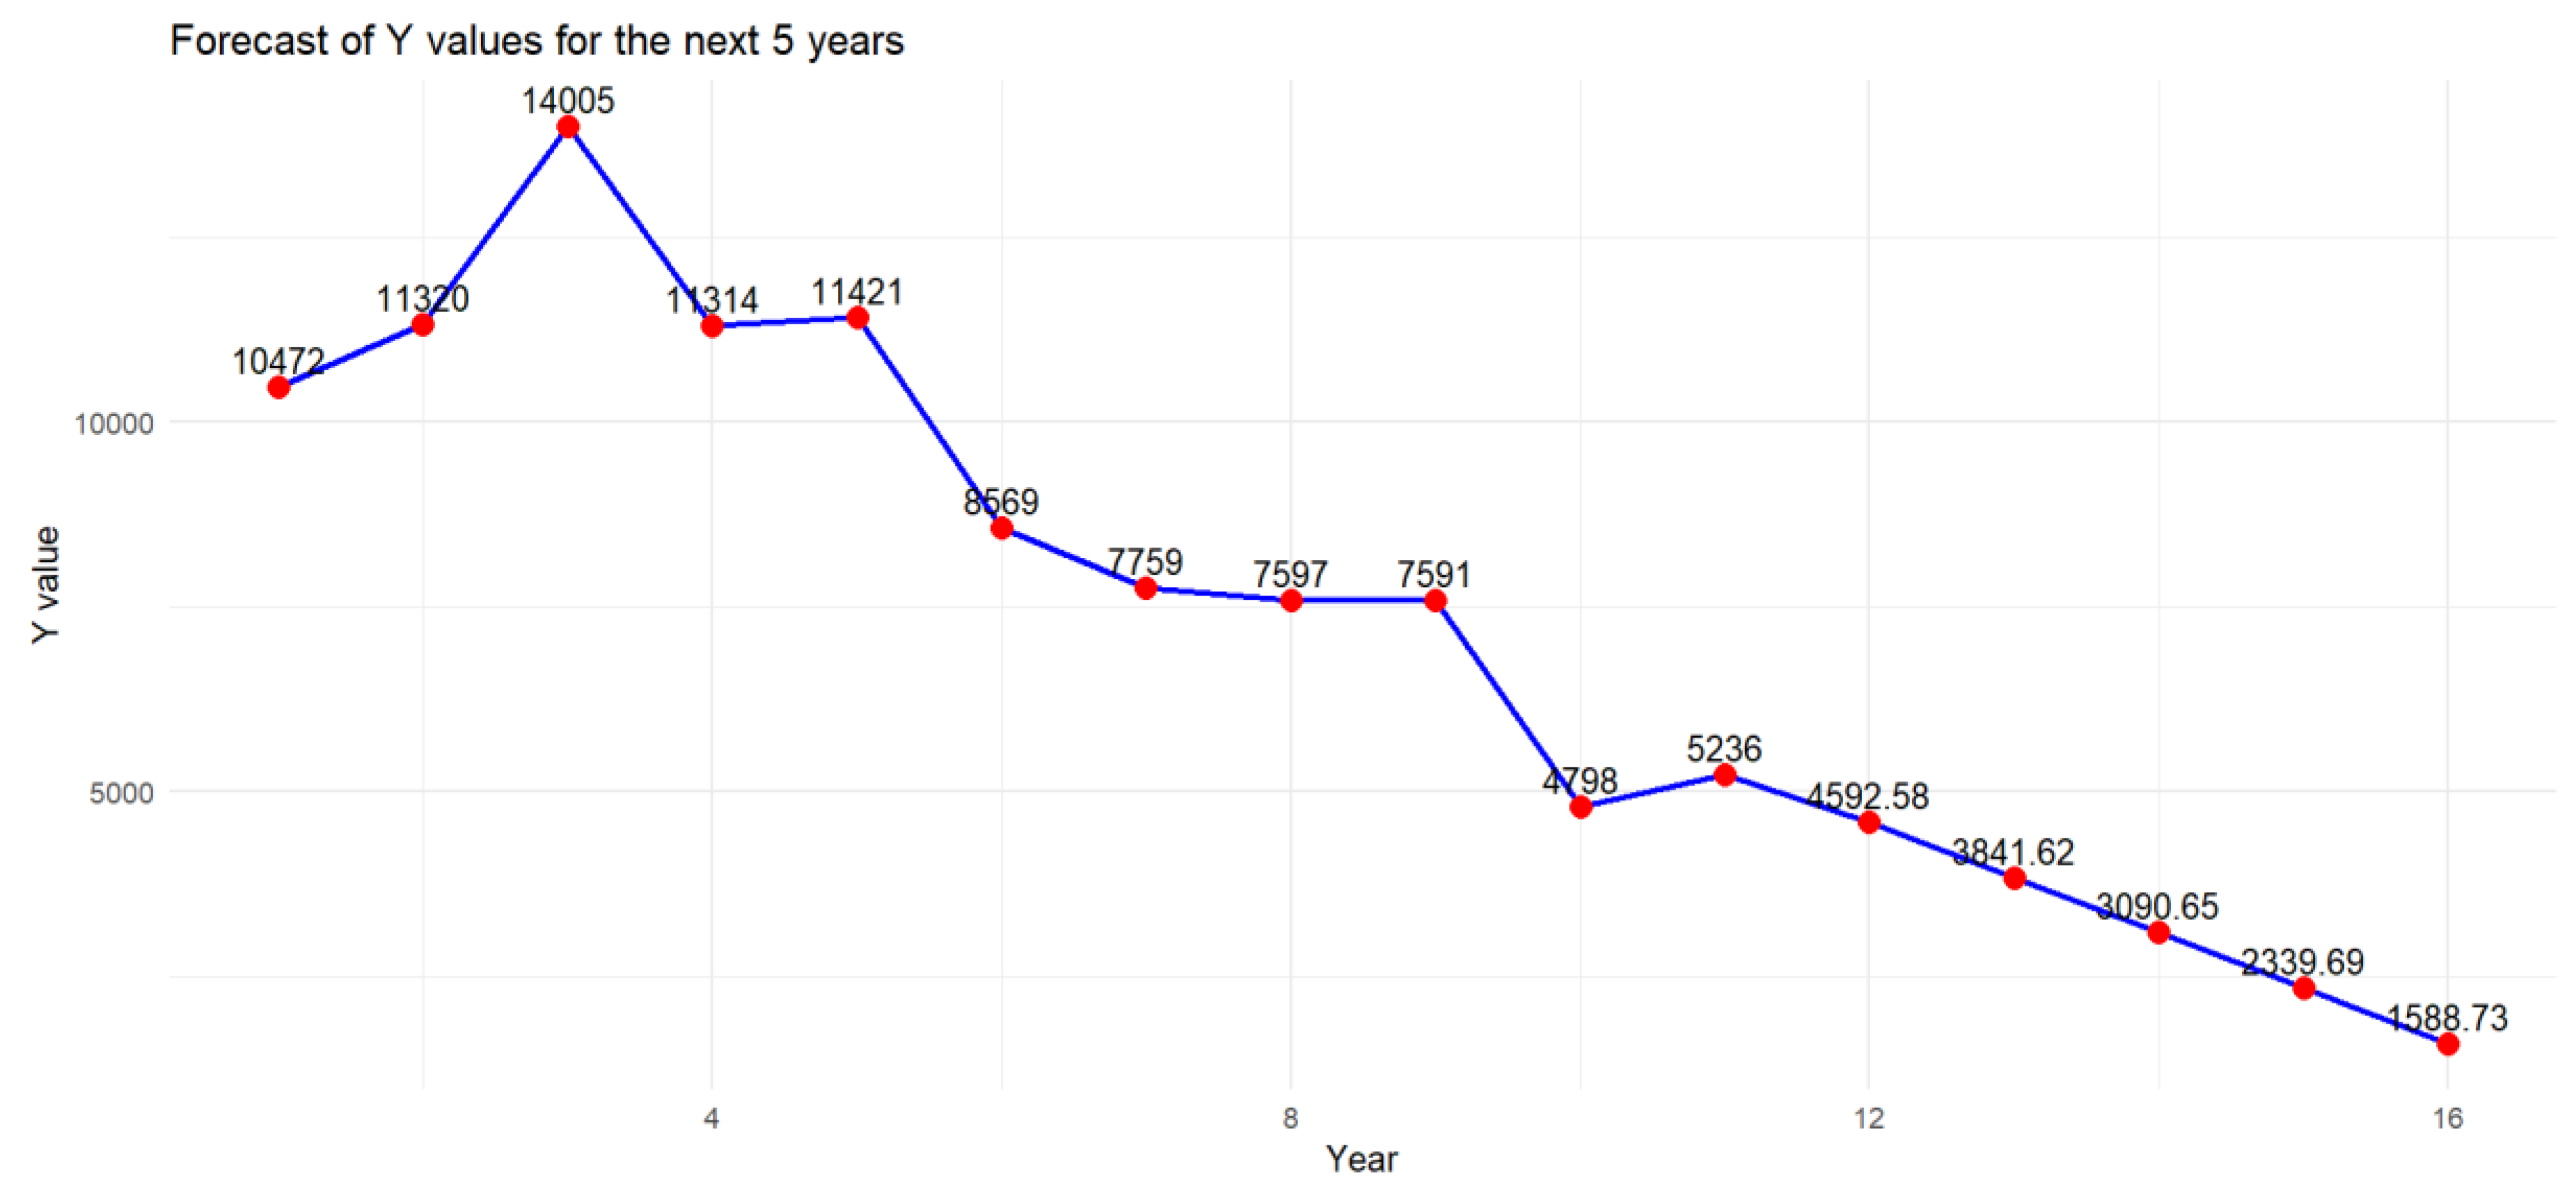
| EMISSION3 | Volumes of pollutant emissions from KPO into the atmosphere, tons | 10472 | 11320 | 14005 | 11314 | 11421 | 8569 | 7759 | 7597 | 7591 | 4798 | 5236 | |
| IDV1 | OIL GASPROD | Oil and gas condensate production, million barrels | 139,5 | 136 | 142,5 | 141,7 | 139,7 | 145,8 | 147,5 | 137,9 | 143,9 | 134,1 | 128,5 |
| IDV2 | FLARED GAS | Volume of flared gas, million m3 | 23,5 | 38 | 35,5 | 26,8 | 29 | 16 | 12 | 17 | 15 | 11 | 13 |
| Note: compiled based on sources (https://www.kpo.kz/en/sustainability, EEAR, 2022 Nyashina, G.,2018, TurbinaK and Yurgens Yu, red.,2022., Browder G. et al.,2018). | |||||||||||||
| EMISSION3 | OIL GAS PROD |
FLARED GAS | ENV TECH | ENV PROT COST |
ENERGY_ CONS |
|
|---|---|---|---|---|---|---|
| EMISSION3 | 1 | |||||
| OIL GAS PROD |
0,381727 | 1 | ||||
| FLARED GAS | 0,904194 | 0,029387 | 1 | |||
| ENV PROT COST |
-0,7176 | -0,45938 | -0,5966 | 1 | ||
| ENERGY_ CONS |
0,303915 | 0,365131 | 0,340601 | -0,34042 | 1 | |
| ENV PROT COST |
-0,55713 | -0,06261 | -0,55508 | 0,731779 | -0,20968 | 1 |
3.5.2. Matrix of Industrial-Agrarian Potential of West Kazakhstan Region
4. Conclusion
- This study is the first presentation of the possibility of reducing air pollution based on the circular economy formation in Kazakhstan’s industrial-agrarian region. Despite the fact that efforts are being made in Kazakhstan to build a circular economy, in comparison with world developed countries, the field of circular economy is still at the beginning of its journey.
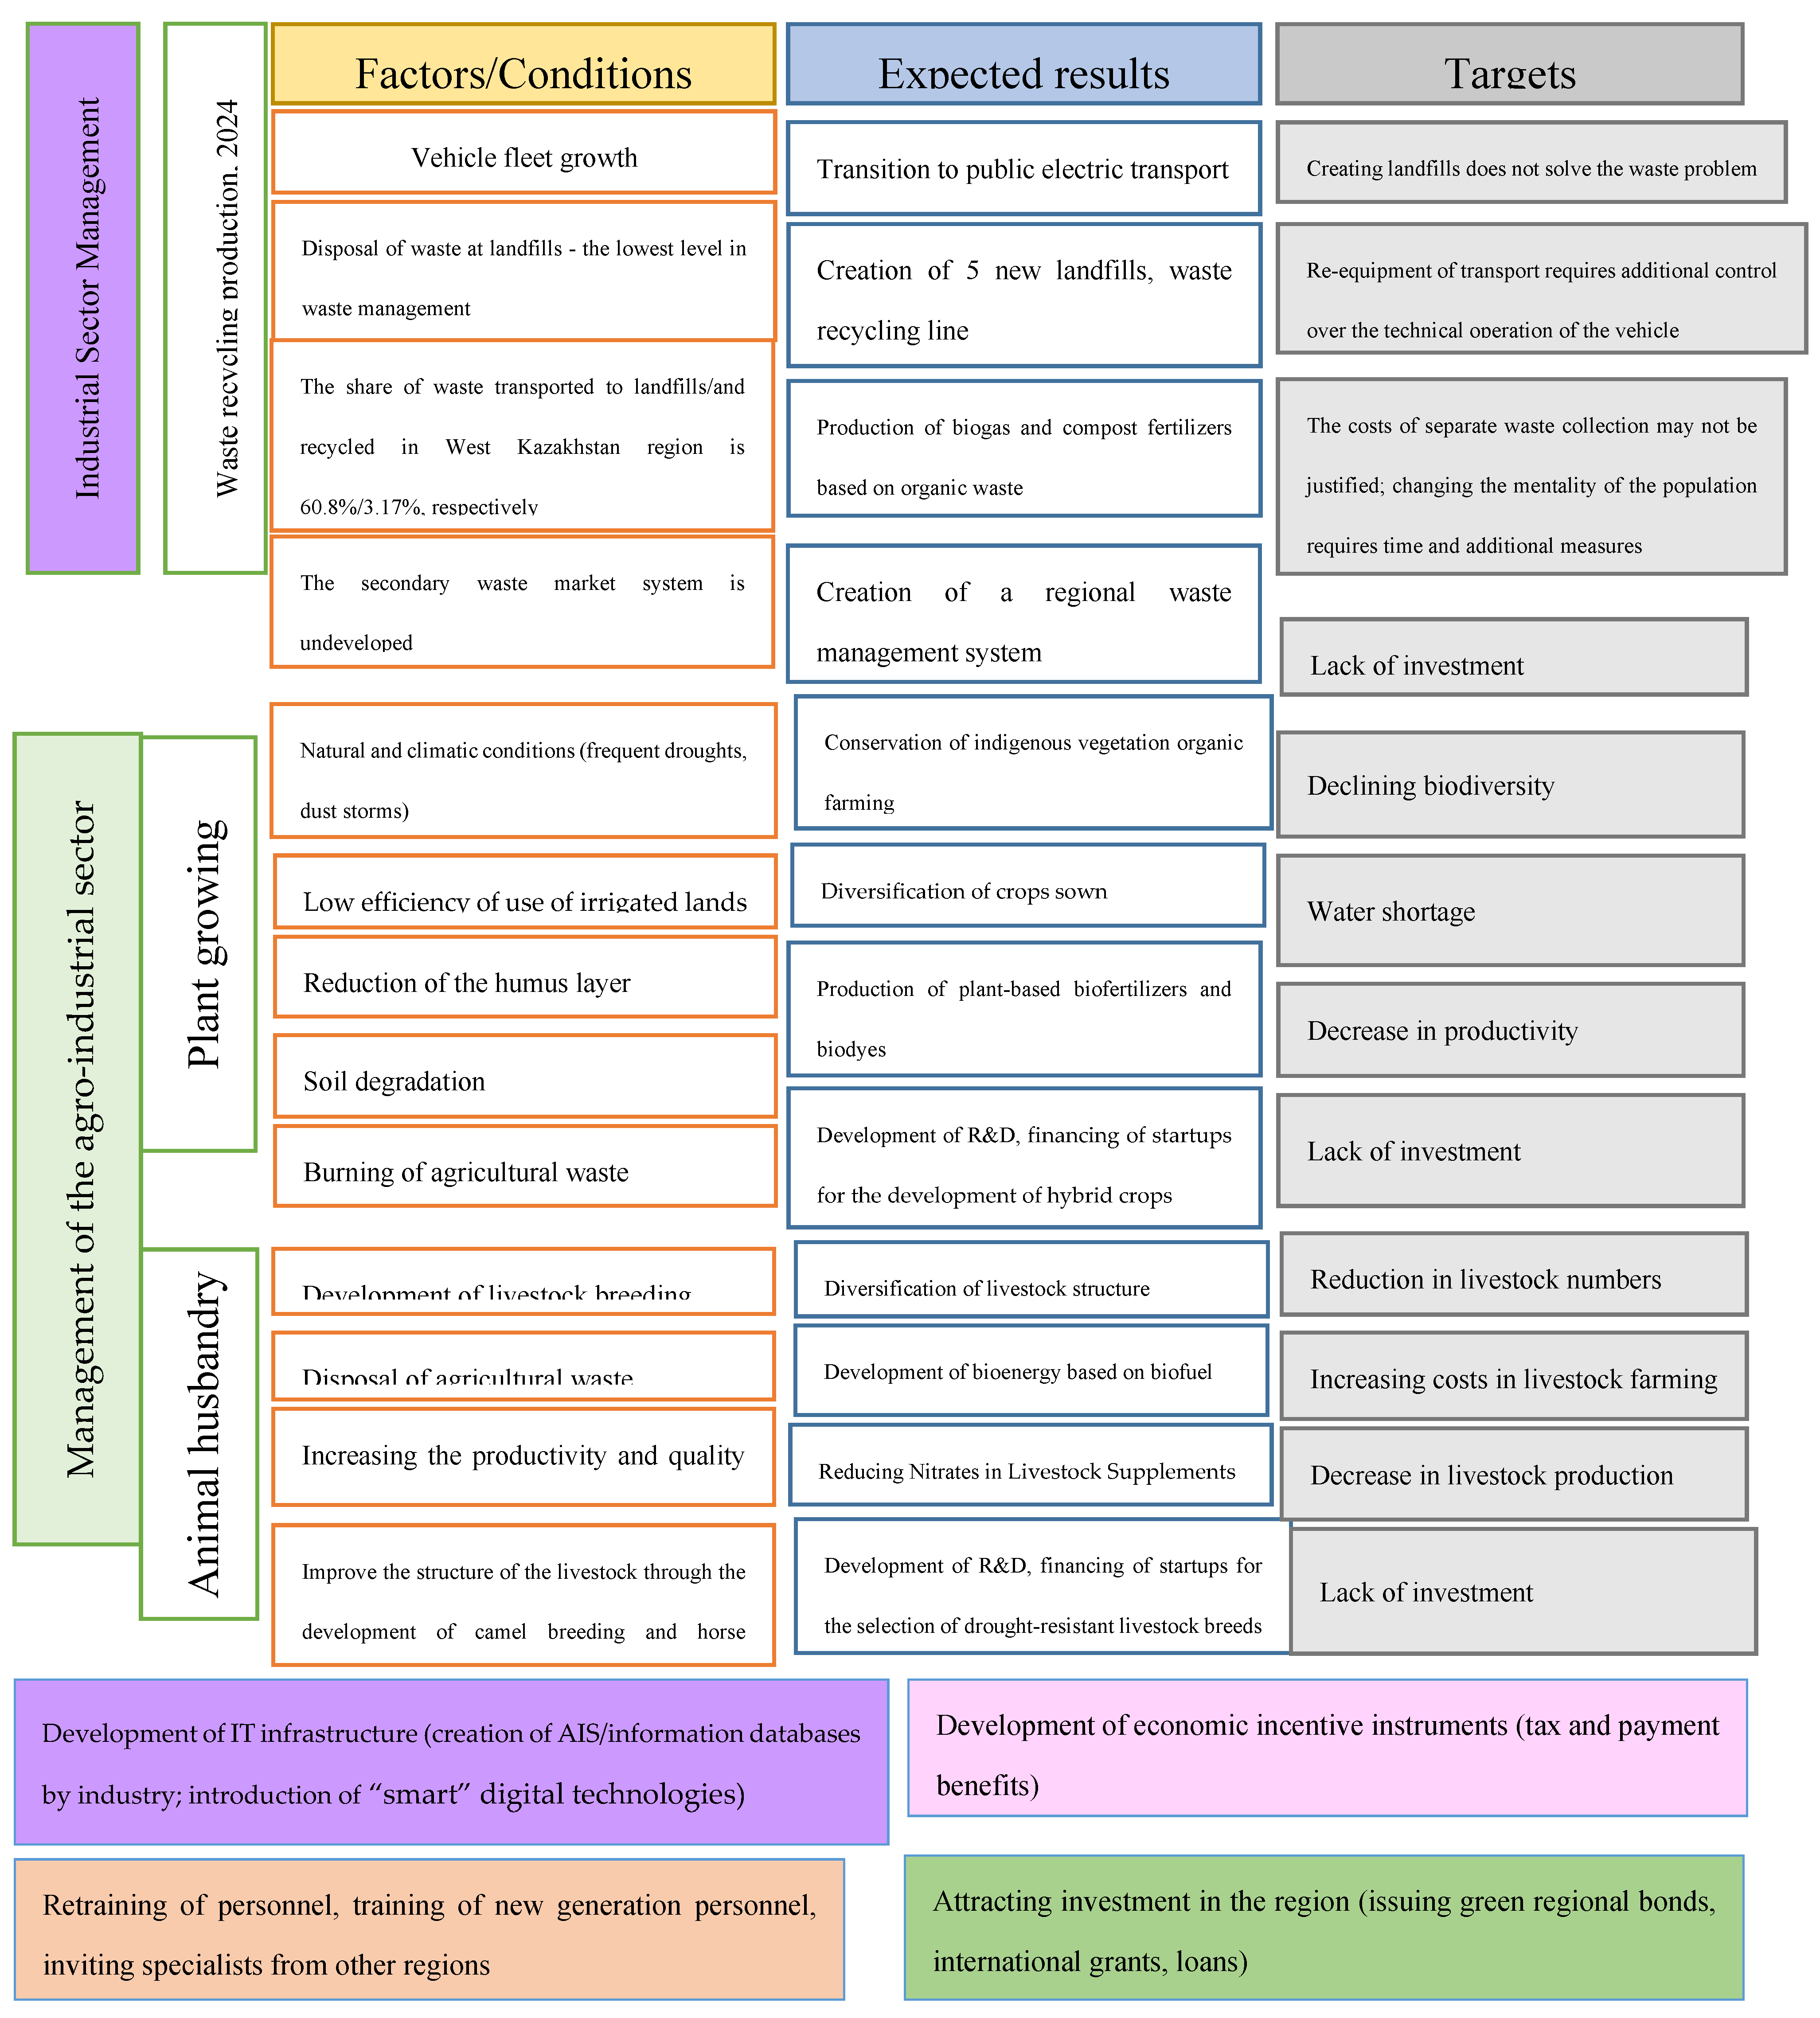
- In this work, based on an analysis of pollutant emissions from each sector of the West Kazakhstan region economy, based on international experience, the task was to consider possible approaches to a circular economy formation that would ensure an atmospheric emissions reduction. The construction of the industrial-agrarian potential matrix of the West Kazakhstan region made it possible to obtain results aimed at updating approaches in managing regional development in order to circularize all processes.
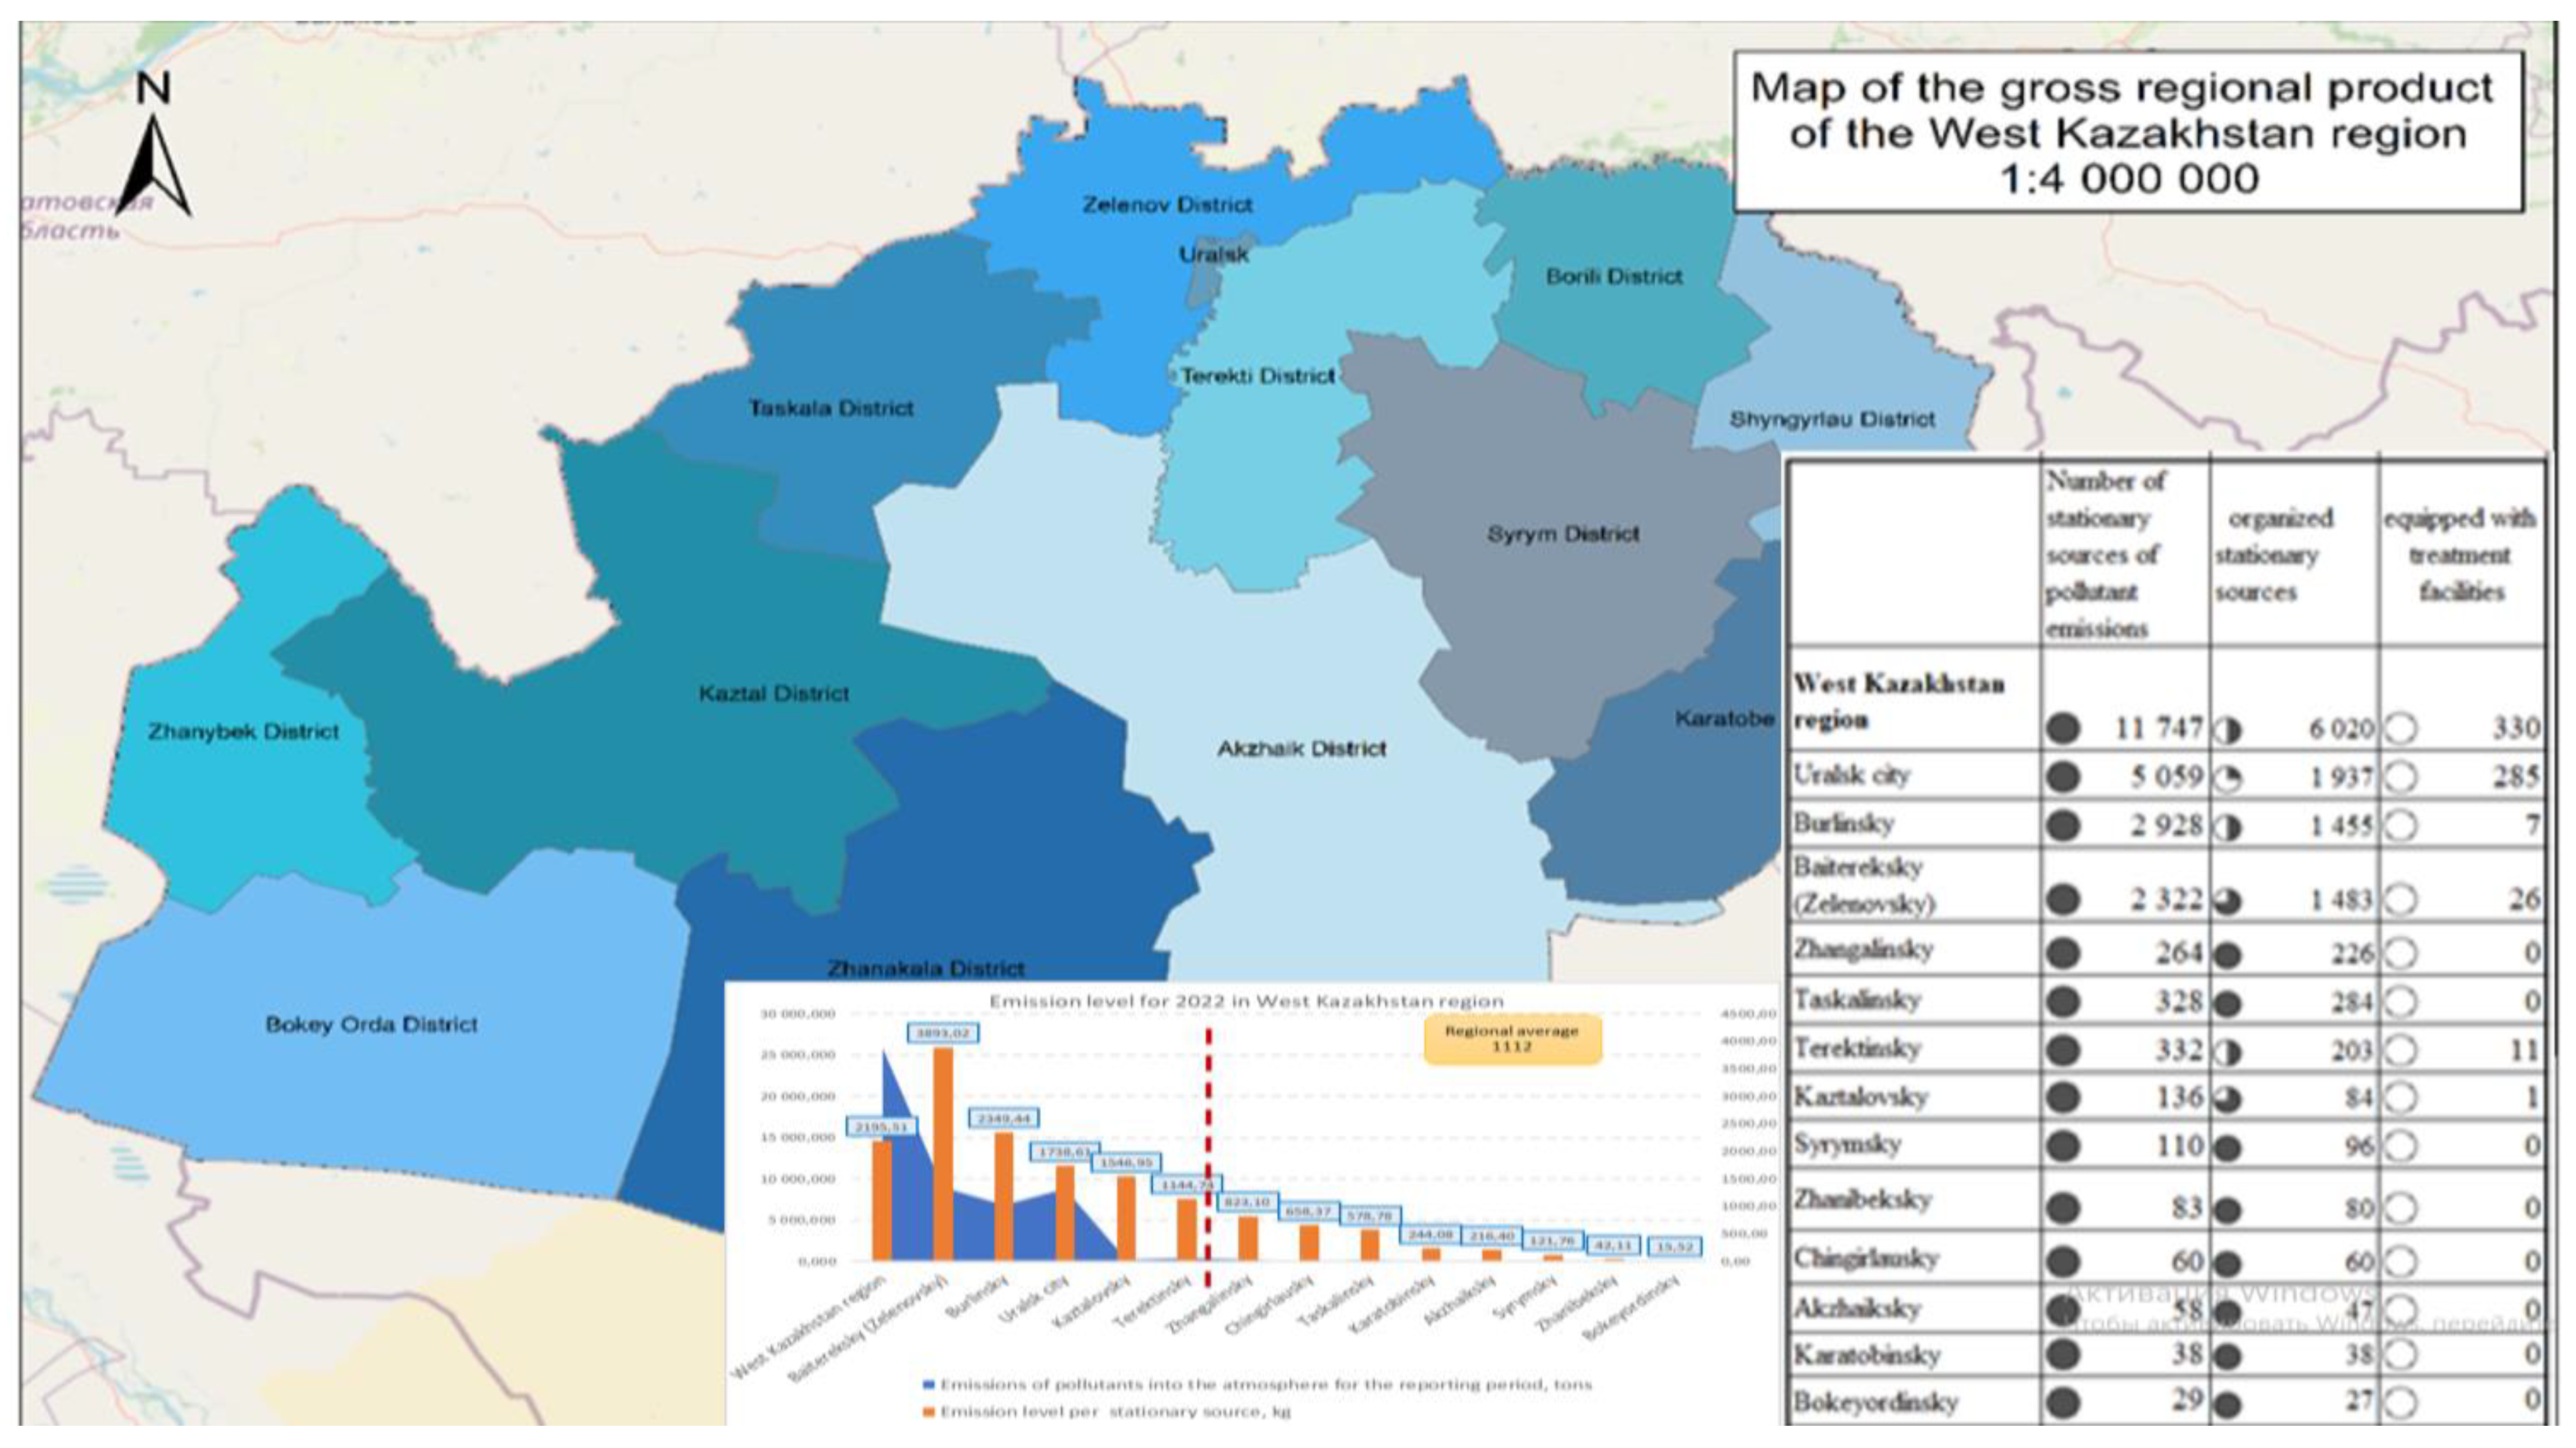
- The study of atmospheric emissions in the West Kazakhstan region made it possible to zonally identify two sectors: the industrial north - 95.8%, (Uralsk - 34.1%, Burli -26.7% and Baiterek - 35%), and – agricultural south, 4.2% from all atmospheric pollutants emissions in the West Kazakhstan region. Taking this factor into account allows you to adjust the strategy for developing decisions. In the north of the region, in the industrial center, it is necessary to install a coordinated system of automated monitoring and control of atmospheric air quality to promptly respond to changes, allowing adjustment of measures taken on the basis of the geoportal created in the region.
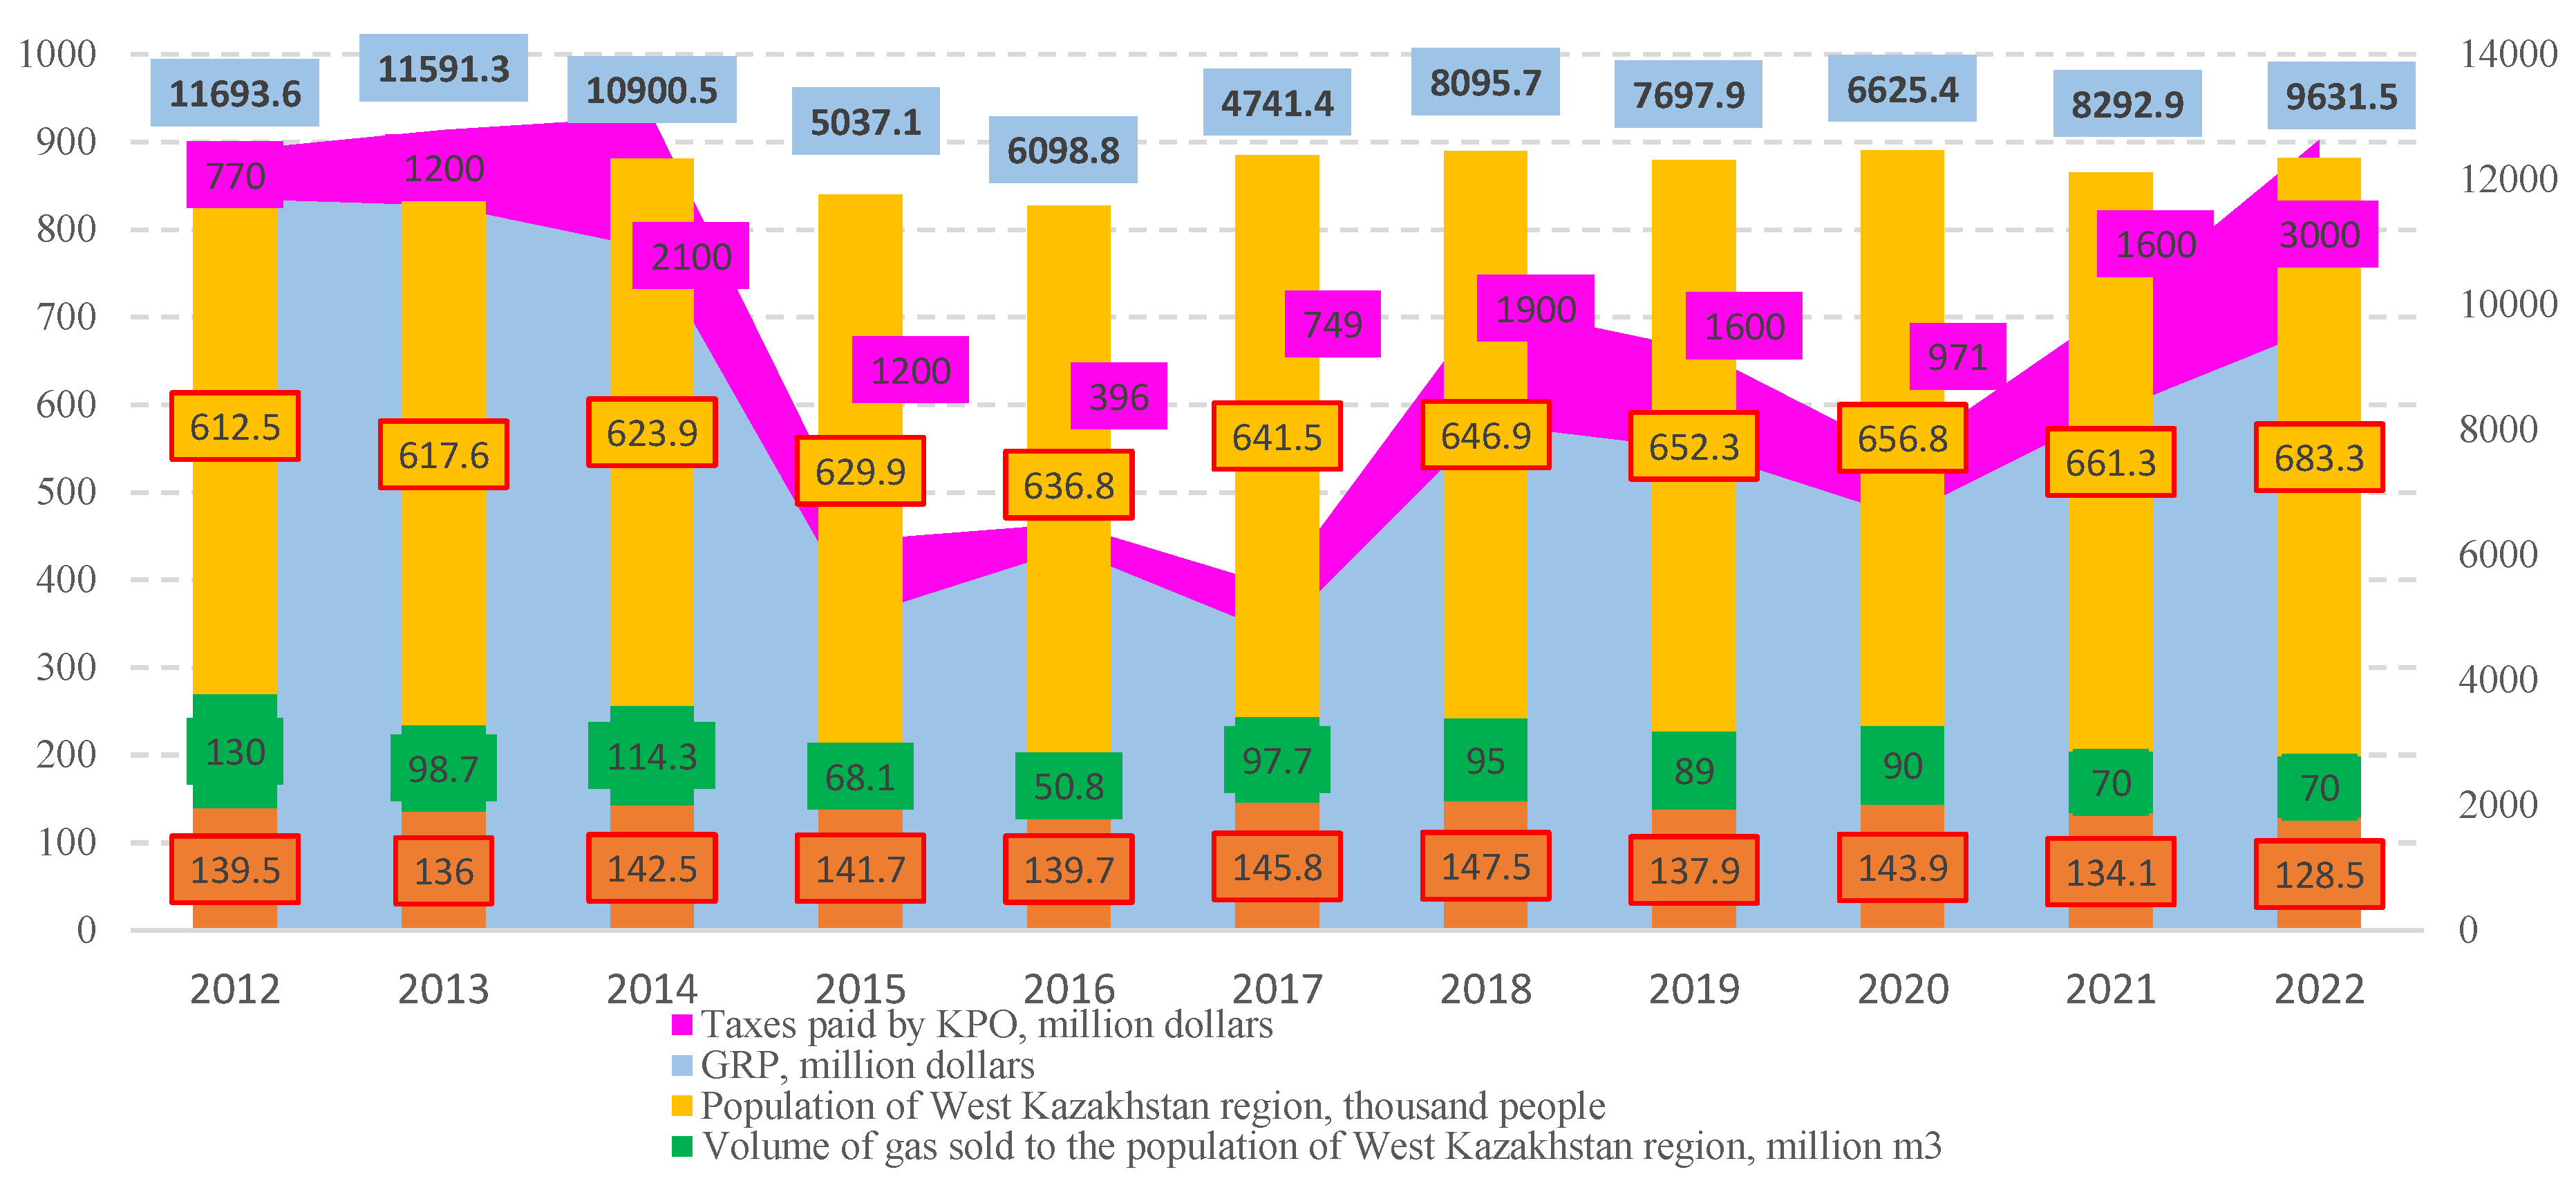
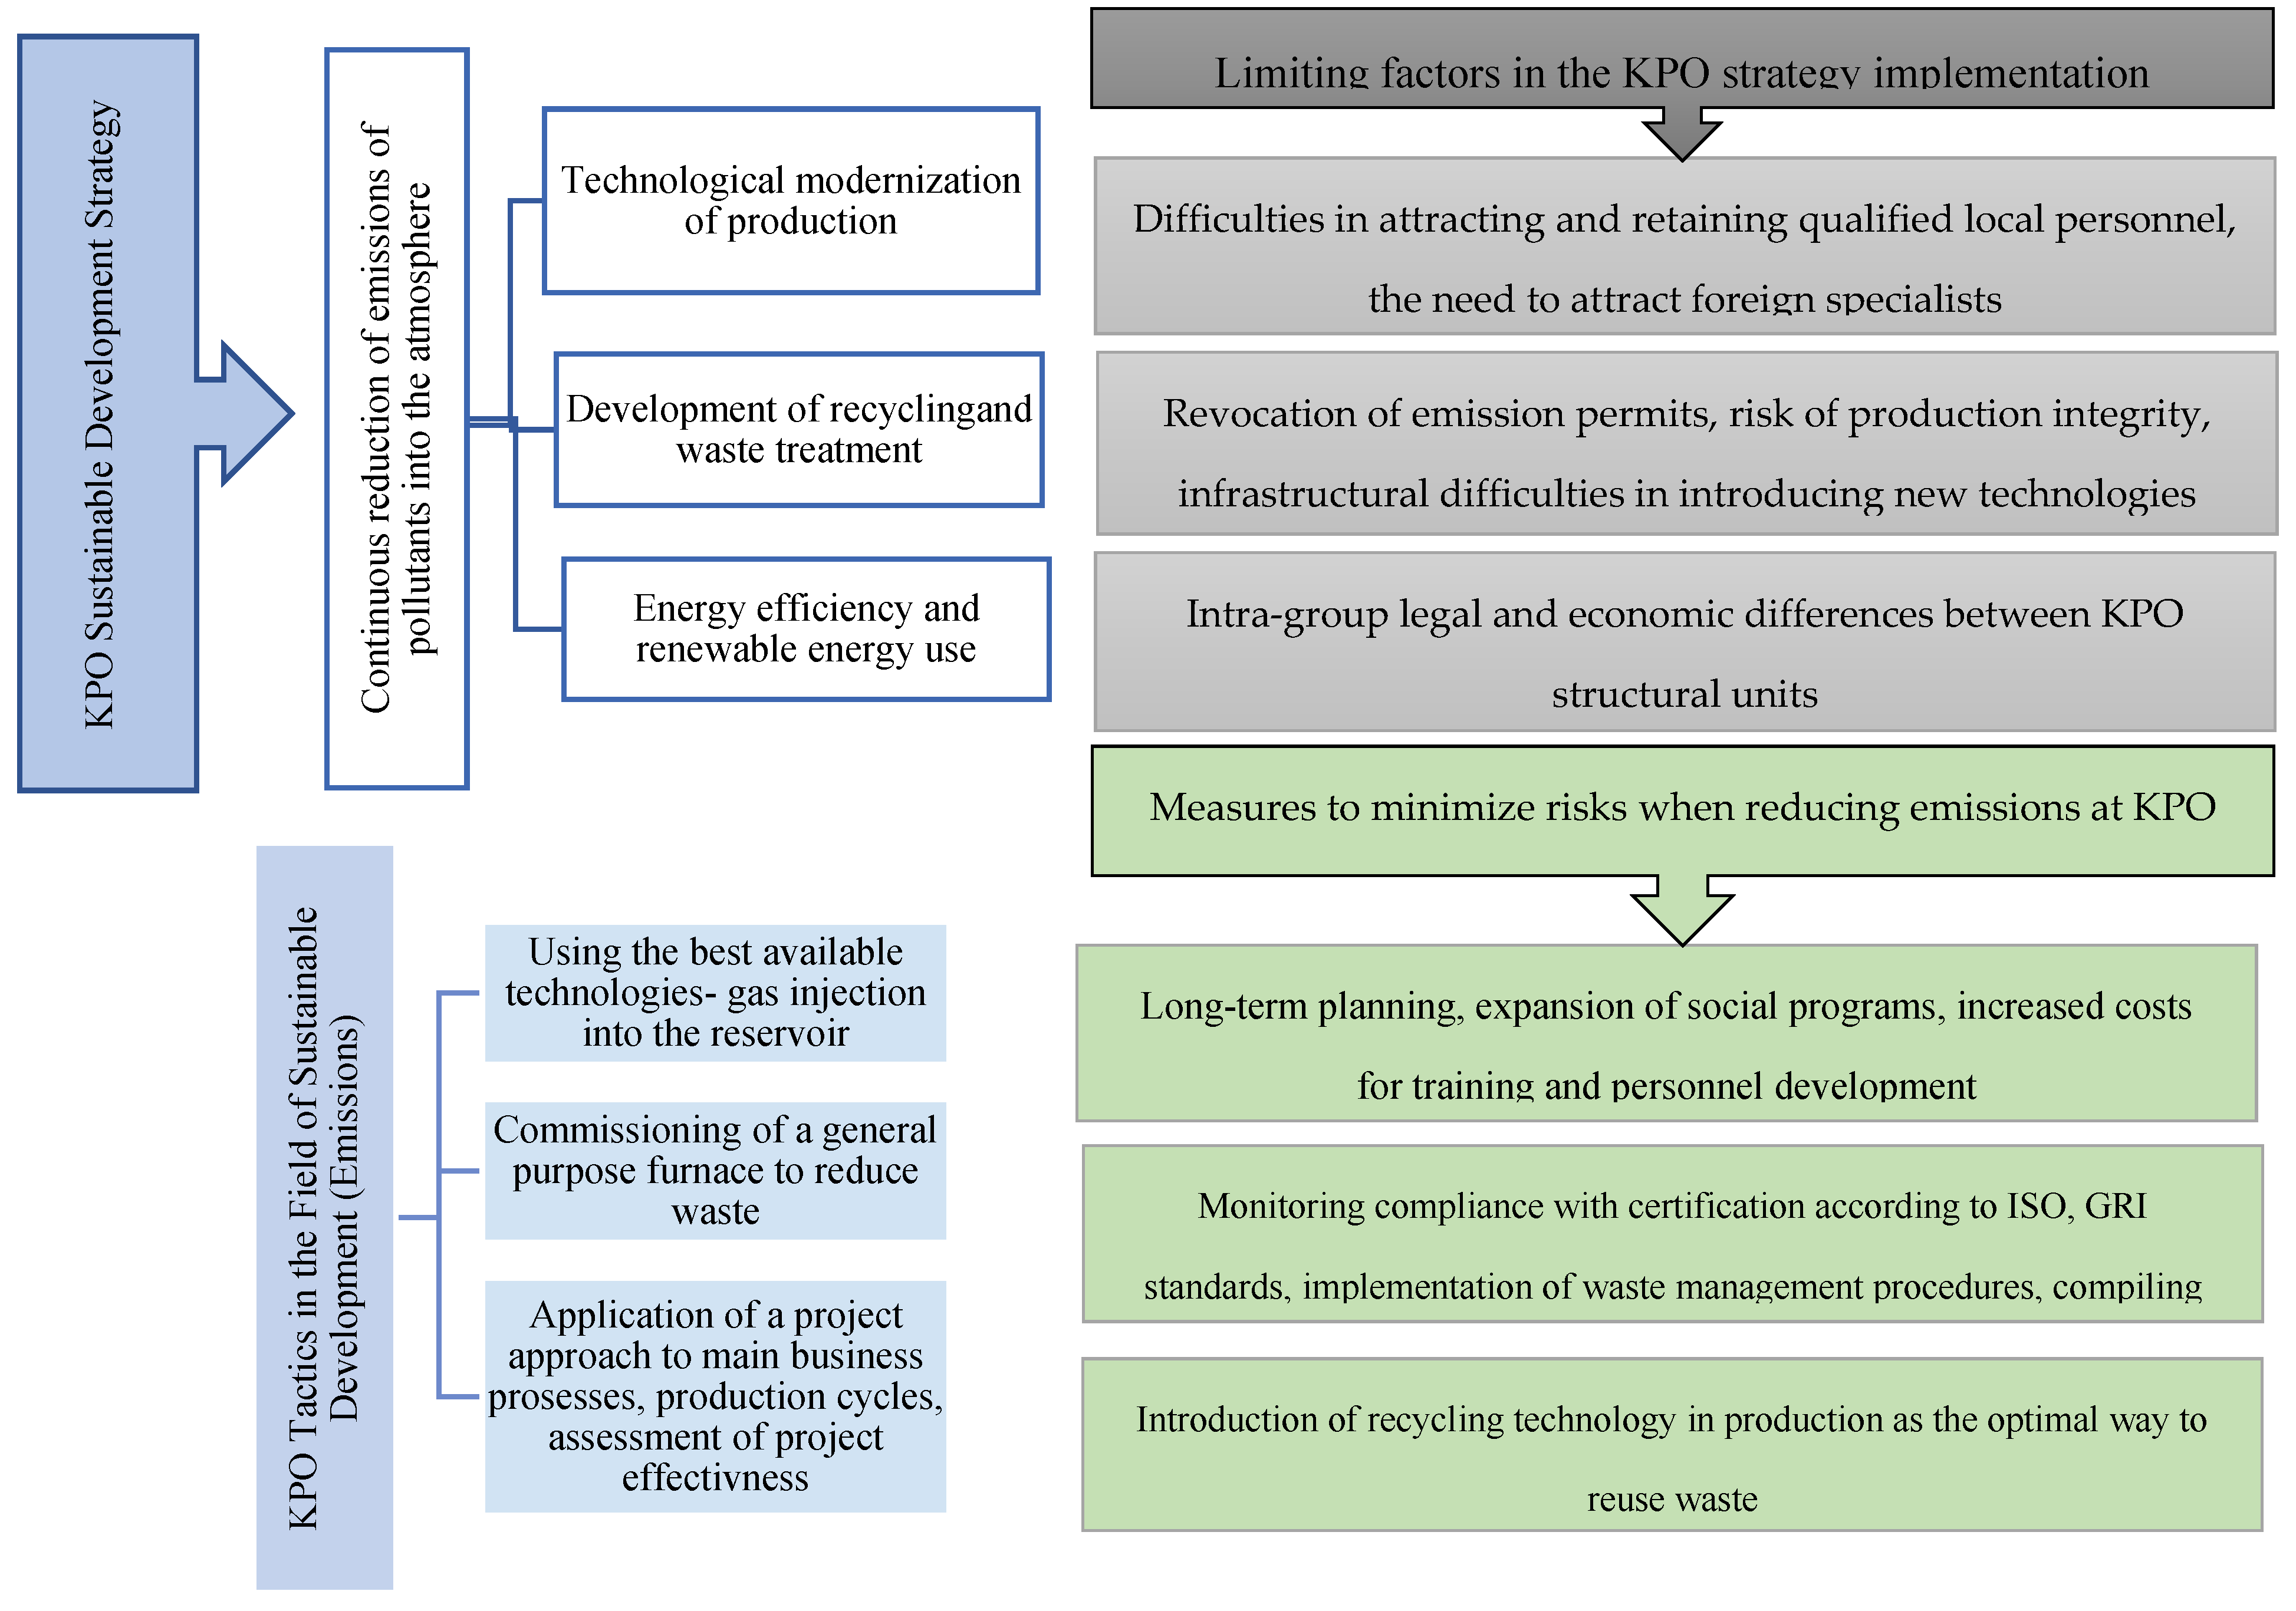
- It is shown that the international company KPO has the greatest economic (taxes in 2022 - $3 billion), environmental (68,5% of atmospheric emissions from the Burli region) and social impact (share of local content -63.2% in KPO work) on the regional sustainable development. Within the framework of the KPO strategy, implemented in the period 2012-2022 measures to reduce emissions and waste made it possible to note the effectiveness of these measures and the achievement of a reduction in KPO atmospheric emissions per capita by 2.2 times, the gas utilization rate was 99.95%.
- The analysis showed that at the moment, the introduction of the circular economy principles is possible only at the mezo level - of an individual international company, in particular KPO. The possibility of using circularity indicators in the company's work was assessed and a circular economy model was proposed. Correlation and regression analysis revealed a close relationship between the volume of atmospheric emissions and indicators reflecting the results of KPO’s activities to implement the best available technologies, energy saving, and spending funds on environmental protection. According to the forecast model for the period 2024-2028, it was determined that while maintaining independent indicators’ certain dynamics of development, the atmospheric emissions level at KPO can be reduced by 2 times.
- The scientific work results contain proven arguments for the prospects of further research into the circular economy models formation in the regions of Kazakhstan, aimed at protecting the environment in general, and in particular reducing air pollution.
- Experience of KPO company which was studied in the work on the formation of a circular economy in the region is relevant and can be applied in other Central Asian countries with the same commodity economy with significant influence of international companies. The governments of Central Asia countries during regulation of the operation of international companies need to form close cooperation with those companies within the framework of corporate social responsibility of business in order to implement sustainable development practices.
Author Contributions
Acknowledgments
Conflicts of Interest
Application A. Environmental Friendliness of Gas Production at KPO for 2012-2022

Application B. Compliance Matrix for Waste Management Strategy and Tactics at KPO

Application C. Transfer of KPO Waste for Processing to Third Parties for 2012-2022

Application D. KPO Matrix for the Forecast Period of the Study (2024-2028)
| 1 | |
| 2 |
References
- Adambekova,A.A., Mukan,M.M., Turebekova,B.U., Salimbayeva, R.A.,2024 Regional resource provision map: methodology and key approaches. Bulletin of Turan University, 2,124-138. [CrossRef]
- Adilet.zan.kz, 2023 The Strategy on Achieving Carbon Neutrality by 2060.Approved by the President of the Republic of Kazakhstan on February 2, 2023, No. 121. [Electronic resource]. https://adilet.zan.kz/rus/docs/U2300000121 (accessed 15 September 2024).
- Adilet.zan.kz, 2013 Concept on Transition towards Green Economy by2050. Approved by the President of the Republic of Kazakhstan on May 30, 2013, No.557 [Electronic resource], official website of the Coalition for a Green Economy G-Global. https://www.greenkaz.org/ images/for_news/pdf/npa/koncepciya-po- perehodu.pdf (accessed 15 September 2024).
- Adilet.zan.kz, 2021. Codex Respubliki Kazakhstan ot 2 yanvarya 2021 goda № 400-VI ZRК. [Electronic resource].https://adilet.zan.kz/rus/docs/K2100000400 (accessed ) (in Russian). 15 September.
- Asrar G.R., Lucas P.L., Vuurenet D.P.,Pereira L.,2019. Global environment outlook 6. Part C: Outlooks and pathways to a healthy planet with healthy people. Chapter 19. New York: United Nations; 2019. https://wedocs.unep.org/bitstream/handle/20.500.11822/27671/GEO6_CH19.pdf?sequence=1&isAllowed=y (accessed 15 September 2024).
- A1–Vybrosy zagryaznyayushih veshestv v atmosphernyj vozduh. UNECE, 16aya Sessiya Sovmestnoj Tselevoj gruppy po ekologicheskim pokazatelyam i ststistike, Geneva, 28-29 oktyabrya 2019.
- https://unece.org/fileadmin/DAM/stats/documents/ece/ces/ge.33/2019/mtg4/5_3_RU_Ind_A1_A2_Air.pdf (accessed 15 September 2024) (in Russian).
- AQCA,2023. Econonichtskie posledstviya zagryaznennogo vozduha. https://aqcaplatform.asia/analytics/12 (accessed 15 July 2024) (in Russian).
- Bailey, M.K., Drake, D.M., Salerno, J., Cassidy,L., Gaughan E.A., Stevens R.F., Pricope G.N.,2020. WoodwardD.K., Luwaya H., Hartter J.,2020. Mapping natural resource collection areas from household survey data in Southern Africa.Applied Geography,125,102326. https://sites.warnercnr.colostate.edu/jdsal/wp-content/uploads/sites/127/2020/09/Bailey-et-al-2020-Applied-Geo.pdf.
- Bobylev, S.N., Solovyeva, S.V., Astapkovich, M.,2022. Air quality as a priority issue for the new economy. The World of the New Economy,16(2),76-88. [CrossRef]
- Brodny,J., Tutak,M., 2021.The analysis of similarities between the European Union countries in terms of the level and structure of the emissions of selected gases and air pollutants into the atmosphere, Journal of Cleaner Production, 2021 https://www.sciencedirect.com/science/article/abs/pii/S0959652620336866.
- Browder,G.,Ozment,S., Bescos,R., Gartner,I., Lange,T.,Glenn,M., 2018. Integrating green and gray: Creating next generation infrastructure. The World Bank Group and WRI, 2018. https://openknowledge.worldbank.org/handle/10986/31430.
- Bureau of National Statistics of the Republic of Kazakhstan. https://stat.gov.kz/ (accessed 15 September 2024).
- Circle Economy and Shifting Paradigms,2019. 2nd Circularity gap report: Circular economy strategies would tip balance in battle against dangerous climate change; https://shiftingparadigms.nl/projects/circular-economy-strategies-would-tip-balance-in-battle-against-dangerous-climate-change/ (accessed 15 September 2024).
- Circle Economy, 2020. European Commission,2020. A new Circular Economy Action Plan. For a cleaner and more competitive Europe. – European Commission, 2020. https://eur-lex.europa.eu/legalcontent/EN/TXT/HTML/?uri=CELEX: 52020DC0098&from, (accessed 15 September 2024).
- D’Amato,D., Toppinen, A., Kozak,R.,Eds.,2022. The Role of Business in Global Sustainability Transformations, Routledge, London. 2022. [CrossRef]
- EEAR,2013. European Environmental Agency Report Towards a Green Economy in Europe: EU Environmental Policy Targets and Objectives 2010–2050 / European Environment Agency Report No 8/2013. Copenhagen, 2013. https://www.eea.europa.eu/publications/towards-a-green-economy-in-europe (accessed 15 September 2024).
- Eurostat,2021. Monitoring Framework for the Circular Economy. – Eurostat, 2021. https://ec.europa.eu/eurostat/web/circulareconomy/indicators/monitoring-framework (accessed 15 September 2024).
- EEAR, 2022. European Environment Agency Report, 2022. Emissions of the main air pollutants in Europe. https://www.eea.europa.eu/data-and-maps/indicators/main-anthropogenic-air-pollutant emissions/assessment-6 (accessed 15 September 2024).
- Friedlingstein, P. , O'Sullivan, M., Jones, M.W. Andrew, R.M. Gregor, L. Hauck, J. Le Quéré, C., Luijkx, et al.,2022. Global Carbon Budget 2022. Earth System Science Data 14 (11) 4811-4900. 10.5194/essd-14-4811-2022. [CrossRef]
- Global Reporting Initiative Standards,2023. Official Website. https://www.globalreporting.org/ (accessed 15 September 2024).
- https://www.zoominfo.com/c/karachaganak-petroleum-operating-bv/369394468 (accessed 15 September 2024).
- Hoerber, T., Weber, G., Cabras, I., (Eds.).,2021. The Routledge Handbook of European Integrations, Routledge, 2021 https://www.taylorfrancis.com/books/edit/10.4324/9780429262081/routledge-handbook-european-integrations-thomas-hoerber-gabriel-weber-ignazio-cabras.
- Information bulletins on the state of the environment of the Republic of Kazakhstan. https://www.kazhydromet.kz/ru/ecology/ezhemesyachnyy-informacionnyy-byulleten-o-sostoyanii-okruzhayuschey-sredy) (accessed 15 September 2024).
- IPCC Special Report, 2018. Special Report Change I. C. An IPCC Special Report on the impacts of global warming of 1.5 C above pre-industrial levels and related global greenhouse gas emission pathways, in the context of strengthening the global response to the threat of climate change, sustainable development, and efforts to eradicate poverty //IPCC, Switzerland. – 2018. https://www.ipcc.ch/sr15/(accessed 15 September 2024).
- ISO 50001:2018 Energy Management Systems https://www.bsigroup.com/globalassets/localfiles/en-nz/ISO%2050001%20Energy%20Management/bsi0161---1808_nz_iso-50001-implemention-guide-web.pdf (accessed 15 September 2024).
- ISO45001-2018 Occupational health and safety management systems — Requirements with guidance for use. https://www.iso.org/ru/standard/63787.html (accessed 15 July,2024).
- ISO 14001:2018 Environmental Management System https://www.greenwgroup.com/iso-140012018-environmental-management-system/ (accessed 15 September 2024).
- Jailaybekov,Y.,Berkinbayev,G., Yakovleva,N., Askarov, S.,2022. Influence of the motor transport emissions on the atmospheric air quality in the city of Almaty and ways of the problem’ solution, Sustainable Technologies for Green Economy, 2022 https://www.extrica.com/article/22627.
- Kazhiakhmetov, S.A.; Khazhiakhmetov, R.M. Sovremennoe sostoyanie iperspektivy razvitiya selskogo hozyajstva Zapadno-Kazakhstanskoj oblasti. 2023, 1, 57–61. (in Russian). Available online: https://cyberleninka.ru/article/n/sovremennoe-sostoyanie-i-perspektivy-razvitiya-selskogo-hozyaystva-zapadno-kazahstanskoy-oblasti. [CrossRef]
- Kozhagulov,S.,Salnikov,V.,2024. Otsenka vliyaniya promyshlennyh vybrosov na kachestvo atmosfernogo vozduha v Burliskom rajone Zapadno-Kazakhsnskoj oblasti.Neft i gas, 140,140-151. (in Russian). [CrossRef]
- KPOBV site: Sustainability. https://www.kpo.kz/en/sustainability (accessed 15 September 2024).
- Morozov,А.,Starodubzeva,N.,2020. Meteorologicheskie usloviya i zagryaznenie atmosphery: uchebnoe posobie – Ekaterinburg: UGLTU, 2020. – 128 s. https://elar.usfeu.ru/bitstream/123456789/9800/1/Morozov_20.pdf https://elar.usfeu.ru (in Russian).
- Nyashina, G.S., Kurgankina,G.S., Strizhak,P.A.,Eds.2018. Environmental, economic and energetic benefits of using coal and oil processing waste instead of coal to produce the same amount of energy.Energy Conversion and Management. 174, 175–187 https://www.researchgate.net/publication/327184685_Environmental_economic_and_energetic_benefits_of_using_coal_and_oil_processing_waste_instead_of_coal_to_produce_the_same_amount_of_energy.
- OHSAS 18001:2007 Occupational health and safety management systems.
- http://www.aims.org.pk/wp-content/uploads/2014/08/OHSAS-18001-2007-Standards.pdf (accessed 15 September, 2024).
- Papetti, A., Menghi R., Di Domizio, G., Germani, M., Marconi M.,2019. Resources value mapping: A method to assess the resource efficiency of manufacturing systems. Applied Energy, 249,326–342. https://ideas.repec.org/a/eee/appene/v249y2019icp326-342.html.
- Pearson, L.A., Rzotkiewicz, A., Mwita, E., Lopez, C., Richardson, R.,2017. Participatory mapping of environmental resources: A comparison of a Tanzanian pastoral community over time Land Use Policy,69,259–265. https://health.geo.msu.edu/peer-reviewed/pearson2017b.pdf.
- Podderzhka sotsialnoj infrastruktury. https://www.kpo.kz/ru/ustoichivoe-razvitie/socialnaja-otvetstvennost/podderzhka-socialnoi-infrastruktury (accessed 15 July, 2024.
- Popkova,E., Sergi,B., Eds.,2021. "Smart Technologies" for Society, State and Economy, Springer Lecture Notes in Networks and Systems Volume 155, Science and Business Media LLC, 2021. https://dokumen.pub/smart-technologies-for-society-state-and-economy-1st-ed-9783030591250-9783030591267.html.
- Popkova,E., Sergi, B., Eds.,2023. ESG Management of the Development of the Green Economy in Central Asia, Springer Science and Business Media LLC, 2023 https://www.springerprofessional.de/esg-management-of-the-development-of-the-green-economy-in-centra/26324650.
- PottingJ,Hekkert,MP,Worrell,E, Hanemaaijer,A.,2017. Circular economy: measuring innovation in the product chain.Planbureau voor de Leefomgeving,2017,2544. Available at: https://www.researchgate.net/publication/319314335_Circular_Economy_Measuring_innovation_in_the_product_chain.
- Razvitie organicheskogo selskogo hozyajstva https://www.fao.org/agroecology/database/detail/ru/c/443701/ (accessed 15 July 2024) (in Russian).
- Report-Circular-Economy-Almaty, 2019. Metabolicheskij analiz s tselyu vyrabotki videniya resursoeffektivnogo i nizkouglerodnogo razvitiya goroda v budushem Available at: https://shiftingparadigms.nl/wp-content/uploads/2019/07/Report-Circular-Economy-Almaty-Web-Spread-RUS.pdf (accessed 15 July 2024) (in Russian).
- Reshenie problem promyshlennogo zagryazneniya vozduha v Kasakhstane: Rukovodyashie printsipy reformirovaniya politiki v oblasti ecologicheskih platezhej, OECD Publishing, Paris. [CrossRef]
- Salnikov, V., Kozhagulov, S., Rysmagambetova, A.,2024. Management of atmospheric air quality at mining fields based on ESG principles. Technoeconomics, 3.1 (8). 71–80. Available at: https://creativecommons. org/licenses/by-nc/4.0/, technoeconomics.spbstu.ru. [CrossRef]
- Safonov, G.,Kozeltsev, M., Stetsenko, A., Dorina, A., Saphonova. Y., Semakina, A., Sizonov, A., Safonov, M.,2022. Perspectives of Decarbonization of World Economy in the Context of Implementation of the UN Paris Climate Agreement. International Organizations Research Journal, 17(4), 38–61. [CrossRef]
- Sistema upravleniya othodami v stranah ЕС, http://waste-nn.ru/sistema-upravleniya-othodami-v-stranah-es (accessed 15 July 2024) (in Russian).
- Song, L., Dai, S., Cao, Z., Liu, Y., Chen, W.,2021. High spatial resolution mapping of steel resources accumulated above ground in mainland China: Past trends and future prospects. Journal of Cleaner Production,297(15),126482. https://research.utwente.nl/en/publications/high-spatial-resolution-mapping-of-steel-resources-accumulated-ab.
- Sysoev, S. , Apanasovich, N.,2021. Indikatory tsirkylyarnosti kompanij:obzor zarubezhogo opyta i perspektivy ispolzovaniya v Belorusi//BEROC Policy Paper Series, PP no. 23 https://www.beroc.org/publications/policy_papers/indikatory-tsirkulyarnosti-kompaniy-obzor-zarubezhnogo-opyta-i-perspektivy-ispolzovaniya/ (in Russian).
- The World Bank Group,2021. Nature Hires: How Nature-based Solutions can power a green jobs recovery. The World Bank Group and World-Wide Fund for Nature, 2021. https://www.ilo. org/wcmsp5/groups/public/ed_emp/documents/publication/wcms_757823.pdf.
- Tleppayev, A. , Zeinolla, S., 2021. Assessment of Indicators of the Circular Economy on the Example of the Countries of the European Union and the Possibility of Application in the Conditions of Kazakhstan. Economics:the Strategy and Practice,16(3),128-141. [CrossRef]
- Tseny na gas v Evrope (TTF, Niderlandy) Available at: https://index.minfin.com.ua/markets/gas/ttf/ (accessed 15 September 2024), (in Russian).
- Tsena na neft segodnya. https://index.minfin.com.ua/markets/oil/ (accessed 15 July 2024), (in Russian).
- TurbinaK and Yurgens Yu, Eds.,2022. ESG-transformaciya kak vеktor ustoychivogo raxvitiya: V treh tomah. Tom 2 / Pod obsh. Red.. K. E. Turbinoy i I. Yu. Yurgensa. — M.: Izdatelstvo «Aspect Press», 2022. — 650 s. https://mgimo.ru/upload/2022/10/esg-transformatsiya-kak-vektor-ustoychivogo-razvitiya-tom2.pdf (in Russian).
- Tyaglov, S.A.; Sheveleva, A.V. Formirovanie zelenyh klasterov: opyt evropejskih stran I Rossii. Sovremennaya Evropa 2022, 2, 100–116. [Google Scholar] [CrossRef]
- Vozdejstvie proizvodstva energii na okruzhayushuyu sredu,2021. https://www.eionet.europa.eu/gemet/ru/concept/2833 (accessed 15 September 2024) (in Russian).
- Vybrosy v atmosphery- Otchet ob ustojchivom razvitii KPO,2023. https://www.kpo.kz/docs/sustainability_report_2023/024-vybrosy_v_atmosferu.php (accessed 15 July 2024) (in Russian).
- Wang,Qing,Peszko,Grzegorz,Zlatev,VasilBorislavov,Amann,Markus,Schoepp,Wolfgang, Kleiman, Gary, Kerimray,Aiymgul, Yakovleva,Yelena, Olga Besedina,2021. Chistyj vozduh i zdorovay planeta Chast II Kompleksnoe upravlenie kachestvom vozduha i sokrashenie vybrosov parnikovyh gazov v Almaty i Nur-Sultane (in Russian). Washington, D.C.: World Bank Group. https://openknowledge.worldbank.org/server/api/core/bitstreams/3e468b32-bf55-572d-8cf6-f175f4bf171d/content (accessed 15 September 2024).
- Woolven, J. 2021. A new measure of business success. – Medium, 2021. – Available at: https://medium.com/circulatenews/a-new-measure-of-business-success-9e53b7aafafa.
- Yan, Li, Junkai Wang, Zi Mu, Lingxiao, Li,2023. The impact of corporate environmental responsibility on green technological innovation: A nonlinear model including mediate effects and moderate effects.Economic Analysis and Policy,80,754-769. [CrossRef]
- Zhidebekkyzy, A., Moldabekova, A., Amangeldiyeva, B., & Šanova, P.,2023. Transition to a circular economy: Exploring stakeholder perspectives in Kazakhstan. Journal of International Studies,16(3),144-158. Available online: https://www.researchgate.net/publication/374691361_Transition_to_a_circular_economy_Exploring_stakeholder_perspectives_in_Kazakhstan. [CrossRef]
- Zlatev,V.,Kofala,J.,Peshko,G.,Wang,C.,2021.Chistyj vozduh i zdorovay planeta: ekonomicheski effektivnoe upravlenie kachestvom vozduha v Kazakhstane i ego vliyanie na vybrosy parnikovyh gazov. Chast I, (in Russian). Washington,D.C.: World Bank Group. https://documents.worldbank.org/en/publication/documentsreports/documentdetail/099345012232191779/p1708700d2bd3a09093fa0cd27991d0662 (accessed 15 September 2024).
| EMISSION3 | OIL GAS PROD |
FLARED GAS | ENV TECH | PRO WASTE | ENV PROT COST |
ENERGY_ CONS |
|
|---|---|---|---|---|---|---|---|
| EMISSION3 | 1 | ||||||
| OIL GAS PROD |
0,381727 | 1 | |||||
| FLARED GAS | 0,904194 | 0,029387 | 1 | ||||
| ENV TECH | -0,7176 | -0,45938 | -0,5966 | 1 | |||
| PRO WASTE | 0,131856 | 0,450074 | -0,07479 | -0,38974 | 1 | ||
| ENV PROT COST |
0,303915 | 0,365131 | 0,340601 | -0,34042 | 0,060849 | 1 | |
| ENERGY_ CONS |
-0,55713 | -0,06261 | -0,55508 | 0,731779 | 0,100638 | -0,20968 | 1 |
Disclaimer/Publisher’s Note: The statements, opinions and data contained in all publications are solely those of the individual author(s) and contributor(s) and not of MDPI and/or the editor(s). MDPI and/or the editor(s) disclaim responsibility for any injury to people or property resulting from any ideas, methods, instructions or products referred to in the content. |
© 2024 by the authors. Licensee MDPI, Basel, Switzerland. This article is an open access article distributed under the terms and conditions of the Creative Commons Attribution (CC BY) license (http://creativecommons.org/licenses/by/4.0/).


