
Submitted:
29 October 2024
Posted:
29 October 2024
You are already at the latest version
Abstract
The molten salt reactor (MSR) specific 3D spatial dynamics code leveraging the neutronics and thermal-hydraulics (TH) coupling method, TMSR3D, has been extended for static and transient analysis of large advanced light water reactors (LWRs), particularly focusing on control rod ejection accidents. The code is built upon the neutron diffusion model leveraging the widely used "two-step" strategy in three-dimensional Cartesian coordinates. A polynomial nodal expansion method (NEM) is utilized to handle spatial variables, while the neutron kinetics solver employs the exponential transformation technique. The code also integrates a single-channel TH module and a steam table set at 15.5 Mpa. The accuracy of the code has been validated through three transient benchmarks, including the 3D-LRA benchmark for boiling water reactors (BWRs), the NEACRP 3D benchmark, and the MOX/UO2 core benchmark for pressurized water reactors (PWRs). These benchmarks cover both static and transient behaviors, and the results have been thoroughly analyzed. The close alignment of extended version of TMSR3D outcomes with reference data and other codes supports its reliability, making it a promising tool for future dynamic analyses of large-scale advanced PWRs.
Keywords:
nodal method
; dynamics
; single-channel
; benchmark
; coupled
1. Introduction
Reducing the volume of nuclear waste per unit of energy, extending reactor lifetimes, and achieving deeper burnup are three practical approaches for existing Light Water Reactors (LWRs) to enhance their economic competitiveness while maintaining nuclear safety [1]. Nonetheless, these efforts encountered a series of industry challenge problems, for instance, fuel clad creep and growth [2], CRUD (Chalk River Unidentified Deposits) formation and subsequent localized corrosion and power shift [3], etc. These phenomena are expected to be precisely modeled and simulated by the most advanced multi-physics reactor core simulators [4,5,6], by which coupled neutronics, thermal-hydraulics (TH), thermomechanics and chemistry calculations can be carried out. During the multi-physical simulation of reactors, spatial dynamics analysis based on neutronics/TH coupling [7] is a fundamental and crucial aspect [8].
As numerical core physics models and state-of-the-art parallel computing continue to advance, significant attention has been drawn to integrating the "one-step" strategy for full-core neutron transport with a high-fidelity TH model in recent years. In 2010, the U.S. Department of Energy initiated the Consortium for the Advanced Simulation of Light Water Reactors (CASL), which led to the creation of the whole-core neutron transport code system MPACT and the TH module CTF leveraging the subchannel model. These two tools were integrated to conduct fully coupled neutronics/TH simulations for entire reactor cores [1]. The comprehensive high-precision neutronics/TH coupling code NECP-X/SUBSC [8] constructed and verified by Xi’an Jiaotong University is analogous to MPACT/CTF and exhibits a comparable accuracy, in which a neutron transport module including 1D method and 2D Method of Characteristics (MOC) and a subchannel TH model were implemented. Seoul National University combined the subchannel TH module MATRA with an enhanced version of the neutron transport code DeCART to perform core transient simulations [9]. In comparison to Computational Fluid Dynamics (CFD) software, the subchannel TH model is more efficient for neutronics/TH coupling. Nonetheless, in neutronics aspect, the whole core neutron transport method (e.g., MOC and SPn based on finite element method) requires large parallel computers and its computational burden is still unacceptable in nuclear engineering practice. Instead, the fast-running, assembly-wise "two-step" approach, which involves fuel assembly homogenization followed by core diffusion, remains commonly employed across the global nuclear power industry. Recently, Zhang et al. investigated the propagation of indeterminacies from the fundamental nuclear library to crucial parameters in the reactor start-up experiments of the CPR1000 with initial fuel loading. These parameters include temperature coefficients, critical boron concentrations, power distributions and integral worth of the Rod Cluster Control Assembly (RCCA). The analyses were conducted by adopting the "two-step" code system Bamboo-C [10]. Seoyoon et al. developed the GPU-based accelerating code system VANGARD, which incorporated the Source Expansion Nodal Method (SENM) and a highly parallelized depletion simulation and solution model leveraging the Chebyshev Rational Approximation Method (CRAM). The code’s performance was evaluated using realistic AP1000 core problems, showcasing its impressive efficiency and accuracy [11]. György et al. conducted transient simulations of Xe behaviors in the VVER-type reactor by adopting the enhanced "two-step" code system KARATE, whose obtained solutions have good agreement with the measured values [12].
TMSR3D [7] is a molten salt reactor (MSR) specific 3D spatial dynamics code system including 4 modules: 1) Assembly few-group parameters production and functionalization code TMSR-LINK based on DRAGON5 [13]; 2) Neutronics model incorporates the standard polynomial nodal expansion method (NEM) [14] for dealing with spatial variables and exponential transformation model for discretizing the time-dependent terms; 3) Transient multi-channel TH module for obtaining the core temperature profile and distributions of fuel velocity and pressure drop for molten salt; 4) Postprocessing module for data collection, analyses and visualization. In this work, a simple single-channel module including a corresponding steam table is newly developed to expand the applicability of this code for simulating the dynamic behavior of LWRs. Based on this model, integrating the NEM neutronics module, a critical Boron concentration search model and a feedback model of macro cross sections entirely different from an MSR, the dynamics code TMSR3D is extended for simulation of LWRs. To validate the accuracy of the new version of TMSR3D code, three international benchmarks including 3D-LRA [7], NEACRP 3D [15], and MOX/UO2 core [16] are modeled and simulated, capturing both the static and transient behaviors of the benchmark cores. Detailed analyses of these characteristics were performed, and the comparison of results demonstrates that the new version of TMSR3D can reliably predict the dynamic responses of LWRs.
2. Numerical Model and Solution Method
2.1. Brief Description of the Neutronics Model
As all the nodes will be homogenized in advance for modern nodal methods, the conservation equation of neutron current in node k and energy group g in Cartesian geometry could be described by adopting the standard notation of neutronics [17]:
where , , , and the whole volume of a node could be written as , as depicted in Figure 1a; g stands for the index of energy group ; k denotes the index of node ; stands for the size (cm) of homogenized node k in u-direction ; and represent the node-averaged flux and the node surface-averaged net currents , as displayed in Figure 1b; denotes the fission energy spectrum; denotes the macroscopic total neutron cross-section ; and are the scattering matrix and the production cross-section , respectively; stands for the effective multiplication factor.
In most nodal methods, transverse integration generally entails performing integration of the 3D formula along the 2 axes orthogonal to every coordinate direction. Through this procedure, the original 3D equation is divided into 3 separate 1D equations, each of which remains linked by transverse leakage terms. For example, the 1D equation along the u-axis is given as follows:
where is the diffusion coefficient (cm); The 1D transverse integrated partial flux could be described in following manner:
and the integration term of transverse-leakage is written in a similar manner:
In the TMSR3D code, the 1D partial neutron fluxes obtained from Equation (3) are approximated using a method of orthogonal polynomial expansion. In the NEM, these fluxes are represented by polynomials up to the 4th order:
where stand for the expansion coefficients of 1D partial fluxes, and the orthogonal Legendre polynomials are selected as base functions [14].
The coefficients for the lower-order terms, and , can be determined based on the node-averaged neutron flux , and the outgoing/incoming partial neutron currents across the node boundaries, and , by applying corresponding neutronics boundary conditions at the edges of the nodes [14,18]. To derive the higher-order coefficients, and , a weighted residual method is applied to Equation (2), ensuring these terms are obtained systematically [14,18].
In the wake of dealing with transverse-leakage terms by implementing a 2nd order polynomials approximation [14], the final coupling equations of partial neutron currents can be written as:
where and stand for the incoming and outgoing partial neutron currents, respectively; and represent the leakage and source terms, respectively; and denote the response matrices that encapsulate the nodal coupling coefficients. A detailed derivation of spatial discretization in TMSR3D can refer to the literature [14,19].
In comparison to traditional point kinetic approximation, 3D spatial dynamics based on coupled neutronics/TH model can explicitly simulate the well-localized reactor perturbation and capture the core response due to unintended reactivity insertion, which is required by reactor safety analysis [18]. In general, the 3D multi-group spatial-kinetic equations for node k are defined as:
and concentration balance equations of the delayed neutron precursors (DNP):
Here refers to the neutrons average velocity of energy group g; The index i identifies the DNP group; stands for the DNP concentration ; signifies the yield of prompt neutrons that released in group g, whereas denotes the probability that delayed neutrons decayed from ith-group DNP and deposited in neutron energy group g; indicates the yield of delayed neutrons for group i, with representing the total sum across all groups; Finally, stands for the decay constant of the delayed neutrons in ith-group.
In TMSR3D, the time derivative terms in Equation (7) are handled by implementing the exponential transformation of neutron flux [18] since the simulation accuracy can be improved for the transients in which an exponential variation is anticipated [20]:
Here the term is an intermediate variable in the exponential transformation method (ETM), it evolves gradually over time, assuming that the exponential transformation factors are appropriately chosen.
By thoroughly organizing Equations (7) to (9) and implementing the fully implicit backward difference scheme (FIBDS) on time derivative terms (the detailed theoretical derivation about above-mentioned procedure can be found in literature[14,18]), the original 3D multi-group spatial-kinetic equations for the node k could be derived and simplified as follows:
Here the index n denote the current time point, and represents the next time point, with standing for the time step. and are related to the scattering and fission sources term, whose definitions can refer to the literature [14,18].The generalized removal cross-section is described in the following manner:
The exponential transformation factors derived from the solutions of last time step [21]:
As for the DNP equations, applying FIBDS to Equation (8) would result:
It is essential to recognize that Equation (10) has a similar structure to the static nodal equation. In this formulation, all source terms, except the neutron fluxes from the prior calculations, will be updated in each neutronics/TH iteration according to corresponding core parameters at a given time. Consequently, the static solver remains applicable for solving transient problems.
2.2. Single-Channel TH Model
In order to model and simulate the transient problems (e.g., the reactivity-initiated accident, RIA) for LWR with TH feedback, a simple single channel model characterized by one phase flow, no cross flow between channels, constant mass flow rate and constant pressure and its steam table at 15.5 Mpa [22] is newly implemented into the TMSR3D code.
Under the abovementioned assumptions, the coolant’s total flow rate is uniformly distributed to the inlet of each channel flow area adjacent to the fuel pin. The temperature profile of coolant is first obtained during the TH calculations by an axial 1D energy conservation equation:
where h and stand for specific enthalpy and density of the coolant, respectively; w and s denote coolant’s mass flow rate and its flow area , respectively; represents coolant’s linear power density , which characterizes the heat convected from fuel pin cladding.
The spatial partial derivative of specific enthalpy in Equation (14) can be approximately discretized by following difference scheme [18]:
where index j represents the axial node j coinciding with the neutronics module; is the node height; is the inlet specific enthalpy of node j and can be approximated by linear interpolation [23]:
Multiplying Equation (16) by node height and simultaneously implementing FIBDS, yields the discretized equation for coolant specific enthalpy:
Subsequently, the coolant temperature and density of each node could be calculated from the steam table by linear interpolation according to the obtained specific enthalpy.
Preventing the meltdown of fuel pin is the ultimate safeguard for the safe operation of LWRs during both static and accident work conditions. This safety requirement mandates that the maximum centerline temperature should not surpass its melting point for the fuel pin. In the new version of the TMSR3D code, a one-dimensional radial heat transfer simulation and solution model is adopted to determine the heat transferred from the pin cladding to the moderator and fuel centerline temperature. The heat conduction equation governing the fuel pin is written in following manner [18]:
with the heat flux being zero at the fuel pellet center, where k, and denote thermal conductivity , heat capacity and density of the fuel pin material; represents the volumetric source of heat ; T stands for fuel pin temperature (K).
The time-dependent term in Equation (20) can also be discretized by FIBDS:
The spatial mesh for solving Equation (21) is displayed in Figure 2, where the fuel pin is divided into meshes, and the dash lines represent the mesh centerlines. Implementing an integration on Equation (21) over yields the discretized form:
where
The heat transfer equations across material boundaries describing heat conduction in gas gap and heat convection from cladding to coolant are written as:
and
respectively. Here q denotes heat flux ; and are inner and outer radii (m) of cladding, respectively; and represent equivalent gap conductance and convection heat transfer coefficient on the cladding surface , respectively; is the fuel pellet radius (m); stands for the coolant temperature (K).
2.3. Coupling Scheme
In the new version of TMSR3D, the macroscopic cross-section at the realistic work conditions could be obtained according to the following formula:
where is water density; c is Boron concentration in ppm; is moderator temperature; is Doppler temperature, which is a sum of the surface temperature and the centerline temperature of the fuel pellet with corresponding weights, and can be obtained via the relation [24]:
In Equation (26), subscript 0 denotes the macroscopic cross sections generated at reference point .
In addition to abovementioned coupling scheme, multi-dimensional tabular cross section libraries whose feedback parameters include Boron concentration, moderator density and temperature, and fuel temperature could also be handled by TMSR3D. As depicted in Figure 3, during static or transient simulations, the group constants and kinetics parameters are updated according to Equation (26) or by multidimensional linear surface interpolation along with the variation of cross sections caused by control rod (CR) movement in each time step or iteration step, by which the TH and neutronics modules are coupled, and the local feedback of core variables to group constants and kinetics parameters are taken into account.
3. Results and Discussion
3.1. 3D-LRA Benchmark
The 3D-LRA benchmark focuses on a prompt supercritical transient scenario, explicitly modelling and simulating a cruciform control assembly (CA) drop accident for a boiling water reactor (BWR). This event featured a substantial reactivity introduction and notable negative temperature feedback. This study uses a 1/4 section of the 3D-LRA benchmark featuring a stuck CA pattern for the dynamic analysis. As displayed in Figure 4, the active core includes 4 distinct types of fuel assemblies (materials 1, 2, 3, and 4), each measuring 300 cm×15 cm×15 cm.
The axial and radial reflectors are modeled using material 5, which has a width of 15 cm. Neutron energy and DNP are categorized into two groups. At the onset of the transient, the cruciform CA drops from the upper to the lower of the reactor core over a 2-s period with a velocity of 150 cm/s. Detailed information regarding group constants and kinetics parameters for this problem is available in the existing literature [25].
A Doppler feedback and an adiabatic heating model are included in the 3D-LRA simulation, which is written as:
Here parameters = 3.83 × 10⁻¹¹ K·cm3, = 3.034 × 10⁻³ K−0.5. denotes the start time, and the original core average temperature is preset as 300 K. During the calculation, the original neutron fluxes are normalized according to the preset power density of 1.0 × 10⁻⁶ W·cm−3, and the released energy per fission of 3.204 × 10⁻¹¹ J/fission is adopted. The flux-volume weighted method, used to calculate group constants and kinetics parameters in the nodes with partially inserted CRs, mitigates the CR cusping effect [7]. Moreover, Equation (28) is iteratively solved by the Crank-Nicholson semi-implicit scheme to obtain the core averaged temperature.
Figure 5 compares the power density and core temperature profiles simulated by TMSR3D with those of the reference code TNGFM [26]. Following the introduction of the perturbation, the density of normalized power rapidly grows ten times over a short time, peaking at 5717 around 0.9 s, signaling the occurrence of a prompt supercritical event with minimal influence from delayed neutrons on reactivity. Almost concurrently, negative temperature feedback from the Doppler effect begins to take effect as the core temperature starts rising at 0.82 s, causing a subsequent decline in power density. As the CA continues to drop, and due to its relatively sizeable differential worth when its tip is at the core’s center, the inserted reactivity surpasses the negative temperature feedback, leading to a second power density peak of 362 at approximately 1.5 s. The CA is entirely inserted after 2.0 s, making the reactor core subcritical. Consequently, the density of normalized power gradually decreases, though the core temperature continues to rise, reaching around 1000 K at 3 s because of the absence of the heat sink.
As shown in Figure 5, the maximal percent errors of power density and core temperature are 3.7% and 5.6%, respectively, which both occur near the first power peak. Despite the relatively small discrepancies, the TMSR3D solutions during the RIA have a good agreement with those from the reference code, which implies that the neutron kinetics model proposed in this paper is correct and adequate for preliminary neutronics/TH calculation.
3.2. NEACRP 3D PWR Benchmark
The core configuration and operation data of the NEACRP 3D PWR benchmark, such as geometry, physical properties and the few group parameters, are extracted from realistic PWR. An additional CR is placed at the core’s center to address the issue of a single CR ejection with complete rotational symmetry during the verification process. CR ejection incidents, as described in this benchmark, may result from the failure of the CR drive mechanism casing located above the reactor pressure vessel in a PWR. Such an event may cause a rapid localized disturbance to core safety parameters, posing a significant challenge to the accuracy of any neutronics/TH coupling code that relies on the nodal method.
The radial core layout of the NEACRP 3D PWR benchmark is depicted in Figure 6, where the size of each fuel assembly is 21.606 cm×21.606 cm. In this study, a quarter core is modeled in the radial direction, with each fuel assembly consisting of 2×2 nodes. Vertically, the reactor core is discretized into 18 layers. The 1st and 18th layers, starting from the bottom, represent the axial reflector, each with a height of 30 cm, while the remaining 16 layers make up the reactor active core, which has a height of 367.3 cm. Table 1 provides the primary design parameters for the benchmark core. Detailed information on cross-section data, thermal relations, and properties is available in related literature [24]. The accident scenarios in this problem are triggered by a quick ejection of the CR at hot zero power (HZP) and hot full power (HFP). These scenarios include six cases, referred to as cases A, B, and C under both HZP and HFP conditions, as outlined in Table 2.
Table 3 shows the steady state results obtained by TMSR3D including the maximal power peaking factor, critical Boron concentration and the reactivity introduced by rod ejection compared with the refined PANTHER solutions [27]. Table 3 indicates that the maximal discrepancy of critical Boron concentration is −0.119%, which occurs in case A1. Therefore, the critical Boron concentration search model and the coupling scheme, which updates the few-group parameters by their derivatives, are effectively and correctly implemented in corresponding modules. The maximal discrepancies of maximal power peaking factor and reactivity introduced by rod ejection are −2.468% and −5.370%, respectively, which might be caused by the different schemes of spatial and temporal discretization adopted in the two nodal methods. Generally, the static results from the new version of TMSR3D agree well with the revised reference solutions and could be adopted as the initial conditions for further transient analyses.
For cases A2 and B2, before the transient processes start, the reactor is operated at static condition with the full power of 2775 MWth, and the average fuel and coolant temperatures are 538 °C and 310 °C, respectively. It can be seen from Figure 7b,d that with reactivities of 91.58 pcm and 99.45 pcm being inserted into the core in 0.1 s for cases A2 and B2, respectively, the increments of relative power for both cases are less than 10%, which implies that delayed-critical transient conditions happen and the effect of delayed neutrons on core reactivity is considerable.
In comparison to Cases A1 and B1, core parameters including relative power and average fuel temperature of cases A2 and B2 exhibit a quicker response to the perturbation. This is because the initial relative power of Cases A1 and B1 is 10−6, and the fuel temperature has a uniform distribution and is identical with the inlet coolant temperature 286 °C. Significant increase of power can be seen after 0.3 s, and the lag effect of heat transfer leads to the delayed rise of fuel temperature. In cases A2 and B2, with the timely increases of fuel and coolant temperatures, the induced negative reactivities balance the inserted reactivity, the relative powers drop sharply after reaching the peak in 0.1 s. Eventually, the reactor core reaches a new steady state without implementing any safety strategy. As displayed in Figure 7, the solutions obtained from the new version of TMSR3D including peak power, final power and fuel temperature are compared to that from the PANTHER code for all the four cases. The maximal deviations of the calculated power peak, final power and final fuel temperature are −2.44%, −1.82% and 1.08%, respectively, by which a good agreement is shown. Therefore, the developed scheme for dealing with the neutronics/TH coupling problem in the new version of TMSR3D is correct and effective. It is likely that these benchmark problems are particularly sensitive, especially regarding the CR reactivity. As a result, a sensitivity analysis should be implemented to understand the source of the deviations better.
To show the well-localized perturbations of core parameters in a more intuitive way, for instance, the initial and final distributions of fuel temperature on axial core section for Case C2 are depicted in Figure 8. It could be found that with the cooling of coolant and the insertion of different types of CRs at HFP condition, the static distribution of fuel temperature depicted in Figure 8a is axisymmetric and the peak values move to bottom half of the reactor active core. The transient is perturbed by a 128 cm ejection of CR during the first 0.1 s, which inserts 79.23 pcm reactivity to the core. Analogous to cases A2 and B2, the self-regulation capacity of the reactor at HFP is much better than that at HZP; a stable state is achieved at 5 s, and the obtained average fuel temperature is merely increased by 8.81 °C, while the localized perturbation can be clearly found in Figure 8b. In the region near the assembly whose CR is ejected, the local fuel temperature has increased significantly during the transient, and the peak value on the left side of the reactor core also encounters a sharp rise, which eventually results in an asymmetrical distribution of fuel temperature.
3.3. PWR MOX/UO2 Core Benchmark
In this section, the PWR MOX/UO2 core benchmark [28] is chosen to evaluate the precision and stability of the updated TMSR3D code. This benchmark originates from a realistic Westinghouse PWR with four thermal loops, which features a partial loading of weapons-grade mixed-oxide (MOX) fuel. The use of MOX, comprising a blend of Pu and U in oxide form, combined with burnup variations within the core, leads to a substantial neutron flux gradient across the fuel assemblies [18]. This poses challenges for neutronics/TH coupling codes that utilize nodal methods.
The quarter core configuration of this benchmark problem is depicted in Figure 9, and the primary design and TH parameters of the active core are displayed in Table 4. Detailed neutronics and TH parameters can be referred to the literature [28]. This benchmark consists of four parts: (1) 2D steady state neutronics calculation with fixed TH parameters; (2) 3D Boron concentration search at HFP condition with TH feedback; (3) 3D Boron concentration search at HZP condition with TH feedback; (4) CR ejection accident simulation at HZP condition. In this work, Part 3 is omitted for saving space, and the rest three parts are simulated and analyzed in detail to verify the updated TMSR3D code. Two-group assembly homogenization parameters for this benchmark including assembly discontinuity factors (ADF), macroscopic cross sections, neutron diffusion coefficients and kinetic parameters at different burnup points, moderator densities, fuel and moderator temperatures, and Boron concentrations are produced by DRAGON5 [13] leveraging the nuclear library in SHEM-361 format generated from the ENDF/B-VII.0 data.
In Part 1, the Boron concentration, fuel temperature and moderator density are set as 1000 ppm, 560 K and 752.06 kg/m3, respectively. During the calculation, two layers of nodes are modeled in the axial direction to simulate the 2D problems. In the radial direction, the division of 2×2 nodes for each fuel assembly is implemented to obtain solutions with better accuracy. at all rods in (ARI) and all rods out (ARO) conditions and total CR worth obtained by the updated TMSR3D are listed in Table 5, and the solutions are compared to those from the reference codes DeCART [29], PARCS [30] and CITATION [31] storing in the benchmark book [28]. Among the three codes, DeCART is a heterogeneous high-order multi-group neutron transport simulation code leveraging the MOC, and its solution is selected as a reference in the comparison, PARCS adopts both analytic nodal method (ANM) and NEM while CITATION uses finite difference method (FDM). Table 5 indicates that in comparison to DeCART, obtained from the new version of TMSR3D at ARO and ARI conditions show discrepancies of 0.5% and 0.42%, respectively, and the relative error of total CR worth is only 0.706%, which agrees well with the reference solutions. It also could be found that the solutions from PARCS are closer to those from the new version of TMSR3D than the other two codes since both of them use nodal methods.
The radial power peaking factor is an essential reactor variable that characterizes the intensity and profile of heat production. It is defined as the ratio of the highest heat production within a fuel assembly to the mean heat production throughout the reactor core in the radial plane. Figure 10a and Figure 10b present the power profile normalized by the average value in radial direction, along with the relative deviation between the updated TMSR3D and DeCART under ARO and ARI conditions, respectively. The maximal difference for ARO conditions is −3.755% at (C, 2), while for the assembly with the most significant radial power peaking factor (B, 1), the relative error is −2.421%. For the ARI condition, the maximal difference of −3.358% occurs at (H, 2), and the most significant radial power peaking factor of 2.495 is still located at (B, 1) with a difference of −1.5%. In general, the TMSR3D static solutions are pretty close to the heterogeneous solution from the neutron transport code DeCART despite the slightly higher errors in local areas mainly caused by the loading of MOX fuel, the CR insertion, and the burnup variation of fuel assemblies.
In Part 2, critical Boron concentration search is conducted at HFP condition with TH feedback. In this section, the SKETCH code leveraging ANM is added to the reference codes. After the critical Boron concentration is obtained, neutronics/TH coupled steady-state calculation is performed. Table 6 indicates that the final critical Boron concentration and core averaged TH parameters agree well with that from reference codes, which further proves the availability and accuracy of the proposed Boron concentration search model and the single channel TH model including the steam table at 15.5 Mpa implemented in the new version of TMSR3D.
Furthermore, the 3D steady-state distributions of moderator temperature, density and fuel temperature at HFP condition calculated by the updated TMSR3D are displayed in Figure 11, from which the effect of CR insertion on core parameters could be clearly found. The fuel temperature profile exhibits a symmetrical distribution, similar to the distribution of nuclear heat deposited in fuel pins. The moderator (water) flows from the reactor core inlet with an average temperature of 286.85 °C and is gradually heated when it flows through the active core because of the heat convection from fuel pin and the deposition of a small fraction of nuclear heat in moderator. Eventually, the moderator flows out of the active core with a mean temperature of 308.1 °C. On the contrary, the moderator density decreases when the moderator flows from the reactor core inlet to outlet, and the mean outlet density of moderator is 0.6615 g/cm3. Multi-phase flow might occur during this process, which is envisaged to be probed in the future work with a subchannel TH model.
In Part 4, the reactor is operated at static HZP condition with a critical Boron concentration of 1341 ppm before the perturbation of CR in assembly (E, 5) ejecting from bottom to top of the reactor core in 0.1 s is introduced. A comparison of calculated (effective yield of delayed neutrons) peak time, peak power and peak reactivity during the transient among the new version of TMSR3D and the reference codes is displayed in Table 7. It could be found that the results of peak time, peak reactivity and from these codes are consistent with each other. Nonetheless, there are significant discrepancies of peak power among these codes. Notably, the PARCS 8G solution results in a 30% increase in transient peak power compared to the 2G solution, while the group effect in PARCS has a minimal influence on other parameters. In general, as the PARCS 8G solution is more like that from TMSR3D, it is selected as the reference code in the subsequent verification process.
The power profile and reactivity evolution obtained from updated TMSR3D compared to the reference are depicted in Figure 11a. It could be found that with the CR ejection, the reactivity has risen to 1.12 $ (649.6 pcm) in the first 0.1 s. Therefore, a prompt supercritical phenomenon occurs. The core power first grows sharply from 0.0001% to 173% of the full power (3565 MWth) and then drops quickly since the negative reactivity caused by the increases of coolant and fuel temperature begins to be gradually introduced to the core, which can be found in Figure 11b. Eventually, the core power stabilizes at a relatively lower power level of 20% of full power, and the corresponding reactivity is 0.57 $. Therefore, the moderator and fuel temperature are slowly increasing at 1 s.
The TMSR3D solutions are in good agreement with reference results in terms of curve trends and values of some special points, for instance, the start, peak and end points, while there still are some nonnegligible discrepancies. For example, the peak value of relative power from TMSR3D is 0.02 s late compared to that of PARCS 8G, and moderator temperature obtained by TMSR3D is larger than the reference result during the whole transient. In fact, while the 8G solution is expected to reduce energy discretization errors for PARCS, it introduces a more significant spatial discretization error due to the more complex spatial distribution of neutron flux. This is particularly evident in the low-energy groups, in which the interactions between groups are more pronounced. The effect of increasing neutron energy group on core parameters at static and transient conditions depends on the competing effects of group and spatial discretization [28].
Moreover, the adoption of various discretization methods for spatial and time-dependent terms, node sizes, time steps, and TH properties might also contribute to the discrepancies. Within acceptable computational errors, the TMSR3D solutions are in good agreement with that from PARCS 8G, which further verifies the correctness and availability of the kinetics and TH models implemented in the updated TMSR3D.
4. Conclusions
In this study, the 3D spatial dynamics code TMSR3D, originally designed for MSRs using the neutronics/TH method, has been extended for simulating LWRs. The neutronics module incorporates the 4th-order NEM for discretization of spatial variables and the ETM dealing with the time derivative terms in the 3D neutron kinetics equations, both adopted from the original TMSR3D without DNP flow. A simplified single-channel TH model, including a steam table at 15.5 MPa, has been newly developed to account for thermal feedback. Additionally, a critical boron concentration search model has been introduced specifically for LWRs. A comprehensive discussion of the numerical models and solution methods adopted in the extended code is provided.
To verify the theoretical models and solution methods implemented in the updated code, the 3D-LRA benchmark problem is initially employed to test its performance in addressing BWR problems. Subsequently, two PWR benchmarks, NEACRP 3D and MOX/UO2 cores, are simulated, with both steady-state characteristics and transient behaviors thoroughly analyzed. The numerical solutions demonstrate that the extended TMSR3D is an effective tool for dynamic analysis of domestic large-scale advanced PWRs, such as the CPR1000, CAP1400, and HPR1000 (Hualong Pressurized Reactor).
Future developments for the code aim to replace the current NEM neutronics module with a more advanced modern nodal method, for instance, the Semi-Analytic Nodal Method (SANM), incorporating nonlinear iterations and GPU acceleration technology. Additionally, further extensions could include a subchannel TH model that accounts for cross-flow, multi-phase flow, and flow distribution at the core inlet.
Author Contributions
writing—original draft preparation, software, conceptualization, investigation, Y.C.; writing—review and editing, supervision, J.S.; methodology, data curation, project administration, L.M.; validation, formal analysis, J.T. All authors have read and agreed to the published version of the manuscript.
Funding
This research was funded by the Young Potential Program of Shanghai Institute of Applied Physics, Chinese Academy of Sciences (Grant No. SINAP-YXJH-202204), National Natural Science Foundation of China (Grant No. 11805033) and State Key Laboratory of Nuclear Power Safety Monitoring Technology and Equipment (Grant No. K-A2019.418).
Data Availability Statement
Data will be made available on request.
Conflicts of Interest
The authors declare no conflict of interest.
References
- Turinsky, P.J.; Kothe, D.B. Modeling and simulation challenges pursued by the Consortium for Advanced Simulation of Light Water Reactors (CASL). J. Comput. Phys. 2016, 313, 367–376. [CrossRef]
- He, Y.N.; Chen, P.; Wu, Y.W.; Su, G.H.; Tian, W.X.; Qiu, S.Z. Preliminary evaluation of U3Si2-FeCrAl fuel performance in light water reactors through a multi-physics coupled way. Nucl. Eng. Des. 2018, 328, 27–35. [CrossRef]
- Short, M.P.; Hussey, D.; Kendrick, B.K.; Besmann, T.M.; Stanek, C.R.; Yip, S. Multiphysics modeling of porous CRUD deposits in nuclear reactors. J. Nucl. Mater. 2013, 443, 579–587. [CrossRef]
- Gaston, D.; Newman, C.; Hansen, G.; Lebrun-Grandié, D. MOOSE: A parallel computational framework for coupled systems of nonlinear equations. Nucl. Eng. Des. 2009, 239, 1768–1778. [CrossRef]
- Cammi, A.; Di Marcello, V.; Luzzi, L.; Memoli, V.; Ricotti, M.E. A multi-physics modelling approach to the dynamics of Molten Salt Reactors. Ann. Nucl. Energy 2011, 38, 1356–1372. [CrossRef]
- Yang, G.; Jaradat, M.K.; Yang, W.S.; Lee, C. Development of coupled PROTEUS-NODAL and SAM code system for multiphysics analysis of molten salt reactors. Ann. Nucl. Energy 2022, 168, 108889. [CrossRef]
- Cui, Y.; Chen, J.G.; Wu, J.H.; Zou, C.Y.; Cui, L.; He, F.; Cai, X.Z. Development and verification of a three-dimensional spatial dynamics code for molten salt reactors. Ann. Nucl. Energy 2022, 171, 109040. [CrossRef]
- Liu, Z.Y.; Chen, J.; Cao, L.Z.; Zhao, C.; He, Q.M.; Wu, H.C. Development and verification of the high-fidelity neutronics and thermal-hydraulic coupling code system NECP-X/SUBSC. Prog. Nucl. Energy 2018, 103, 114–125. [CrossRef]
- Jung, Y.S.; Shim, C.B.; Lim, C.H.; Joo, H.G. Practical numerical reactor employing direct whole core neutron transport and subchannel thermal/hydraulic solvers. Ann. Nucl. Energy 2013, 62, 357–374. [CrossRef]
- Zhang, L.M.; Xie, H.Y.; Mao, W.C.; Ping, J.L. Nuclear-data uncertainty analysis for the start-up physics test of CPR1000 reactor. Ann. Nucl. Energy 2021, 156, 108197. [CrossRef]
- Jeon, S.; Hong, H.; Choi, N.; Joo, H.G. Methods and performance of a GPU-based pin wise two-step nodal code VANGARD. Prog. Nucl. Energy 2023, 156, 104528. [CrossRef]
- Hegyi, G.; Maráczy, C.; Temesvári, E. Simulation of xenon transients in the VVER-1200 NPP using the KARATE code system. Ann. Nucl. Energy 2022, 176, 109258. [CrossRef]
- Marleau, G.; Hébert, A.; Roy, R. A User Guide for DRAGON Version 5. Technical Report IGE–335, Institut de génie nucléaire, Département de génie mécanique, École Polytechnique de Montréal, 2019.
- Cui, Y.; Chen, J.G.; Dai, M.; Cai, X.Z. Development of A Steady State Analysis Code for Molten Salt Reactor based on Nodal Expansion Method. Ann. Nucl. Energy 2021, 151, 107950. [CrossRef]
- Pinem, S.; Sembiring, T.M.; Liem, P.H. NODAL3 sensitivity analysis for NEACRP 3D LWR core transient benchmark (PWR). Sci. Technol. Nucl. Ins. 2016, 2016, 7538681. [CrossRef]
- Biery, M.; Avramova, M. Investigations on coupled code PWR simulations using COBRA-TF with soluble boron tracking model. Prog. Nucl. Energy 2014, 77, 72–83. [CrossRef]
- Liao, C.K. Study on Numerical Solution for Three Dimensional Nodal Space-Time Neutron Kinetic Equations and Coupled Neutronic/Thermal-Hydraulic Core Transient Analysis (in Chinese). PhD thesis, Xi’an Jiaotong University, Xi’an, China, 2002.
- Imron, M. Development and verification of open reactor simulator ADPRES. Ann. Nucl. Energy 2019, 133, 580–588. [CrossRef]
- Lawrence, R.D. Progress in nodal methods for the solution of the neutron diffusion and transport equations. Prog. Nucl. Energy 1986, 17, 271–301. [CrossRef]
- Hendricks, J. Finite difference solution of the time dependent neutron group diffusion equations. PhD thesis, Massachusetts Institute of Technology, Massachusetts, The U.S., 1975. [CrossRef]
- Kim, D.S.; Cho, N.Z. Kinetics calculation under space-dependent feedback in analytic function expansion nodal method via solution decomposition and Galerkin scheme. Nucl. Sci. Eng. 2002, 140, 267–284. [CrossRef]
- Wagner, W.; Kretzschmar, H. International Steam Tables: Properties of Water and Steam Based on the Industrial Formulation. Technical Report IAPWSIF97, Springer-Verlag, Berlin, Heidelberg, 2008.
- Hong, L.P.; Surian, P.; Malem, S.T.; Hoai, N.T. Status on development and verification of reactivity initiated accident analysis code for PWR (NODAL3). Nucl. Sci. Tech. 2016, 6, 1–13. [CrossRef]
- Finnemann, H.; Galati, A. NEACRP 3-D LWR Core Transient Benchmark-Final Specifications. Technical Report NEACRP-L-335, OECD Nuclear Energy Agency, 1991.
- Ban, Y.; Endo, T.; Yamamoto, A. A unified approach for numerical calculation of space-dependent kinetic equation. J. Nucl. Sci. Technol. 2012, 49, 496–515. [CrossRef]
- Institute of Nuclear and New Energy Technology. Verification report of the TNGFM code. Technical report, Tsinghua University, Beijing, 2009.
- Kinght, M.P.; Bryce, P. Derivation of a Refined PANTHER Solution to the NEACRP PWR Rod-Ejection Transient. In Proceedings of the Joint International Conference on Mathematical Method Applications, Saratoga, Springs, 1997; Vol. 1, pp. 302–313.
- Kozlowski, T.; Downar, T. PWR MOX/UO2 Core Transient Benchmark Final Report. Technical report, Purdue University, 2007.
- Han, G.J.; Jin, Y.C.; Ha, Y.K.; Sung, Q.Z.; Moon, H.C. Dynamic Implementation of the Equivalence Theory in the Heterogeneous Whole Core Transport Calculation. In Proceedings of the PHYSOR 2002, Seoul, Korea, 2002.
- Thomas, J.D.; Douglas, A.B.; Miller, R.M.; Deokjung, Chang, H.L.; Tomasz, K.; Deokjung, L.; Xu, Y.L.; Gan, J.; Cho, H.G.; Joo, J.Y.; et al. PARCS: Purdue Advanced Reactor Core Simulator. In Proceedings of the PHYSOR 2002, Seoul, Korea, 2002.
- Wu, J.H.; Guo, C.; Cai, X.Z.; Yu, C.G.; Zou, C.Y.; Han, J.L.; Chen, J.G. Flow effect on 135I and 135Xe evolution behavior in a molten salt reactor. Nucl. Eng. Des. 2017, 314, 318–325. [CrossRef]
Figure 1.
Schematic view of node (a) and neutron current (b).
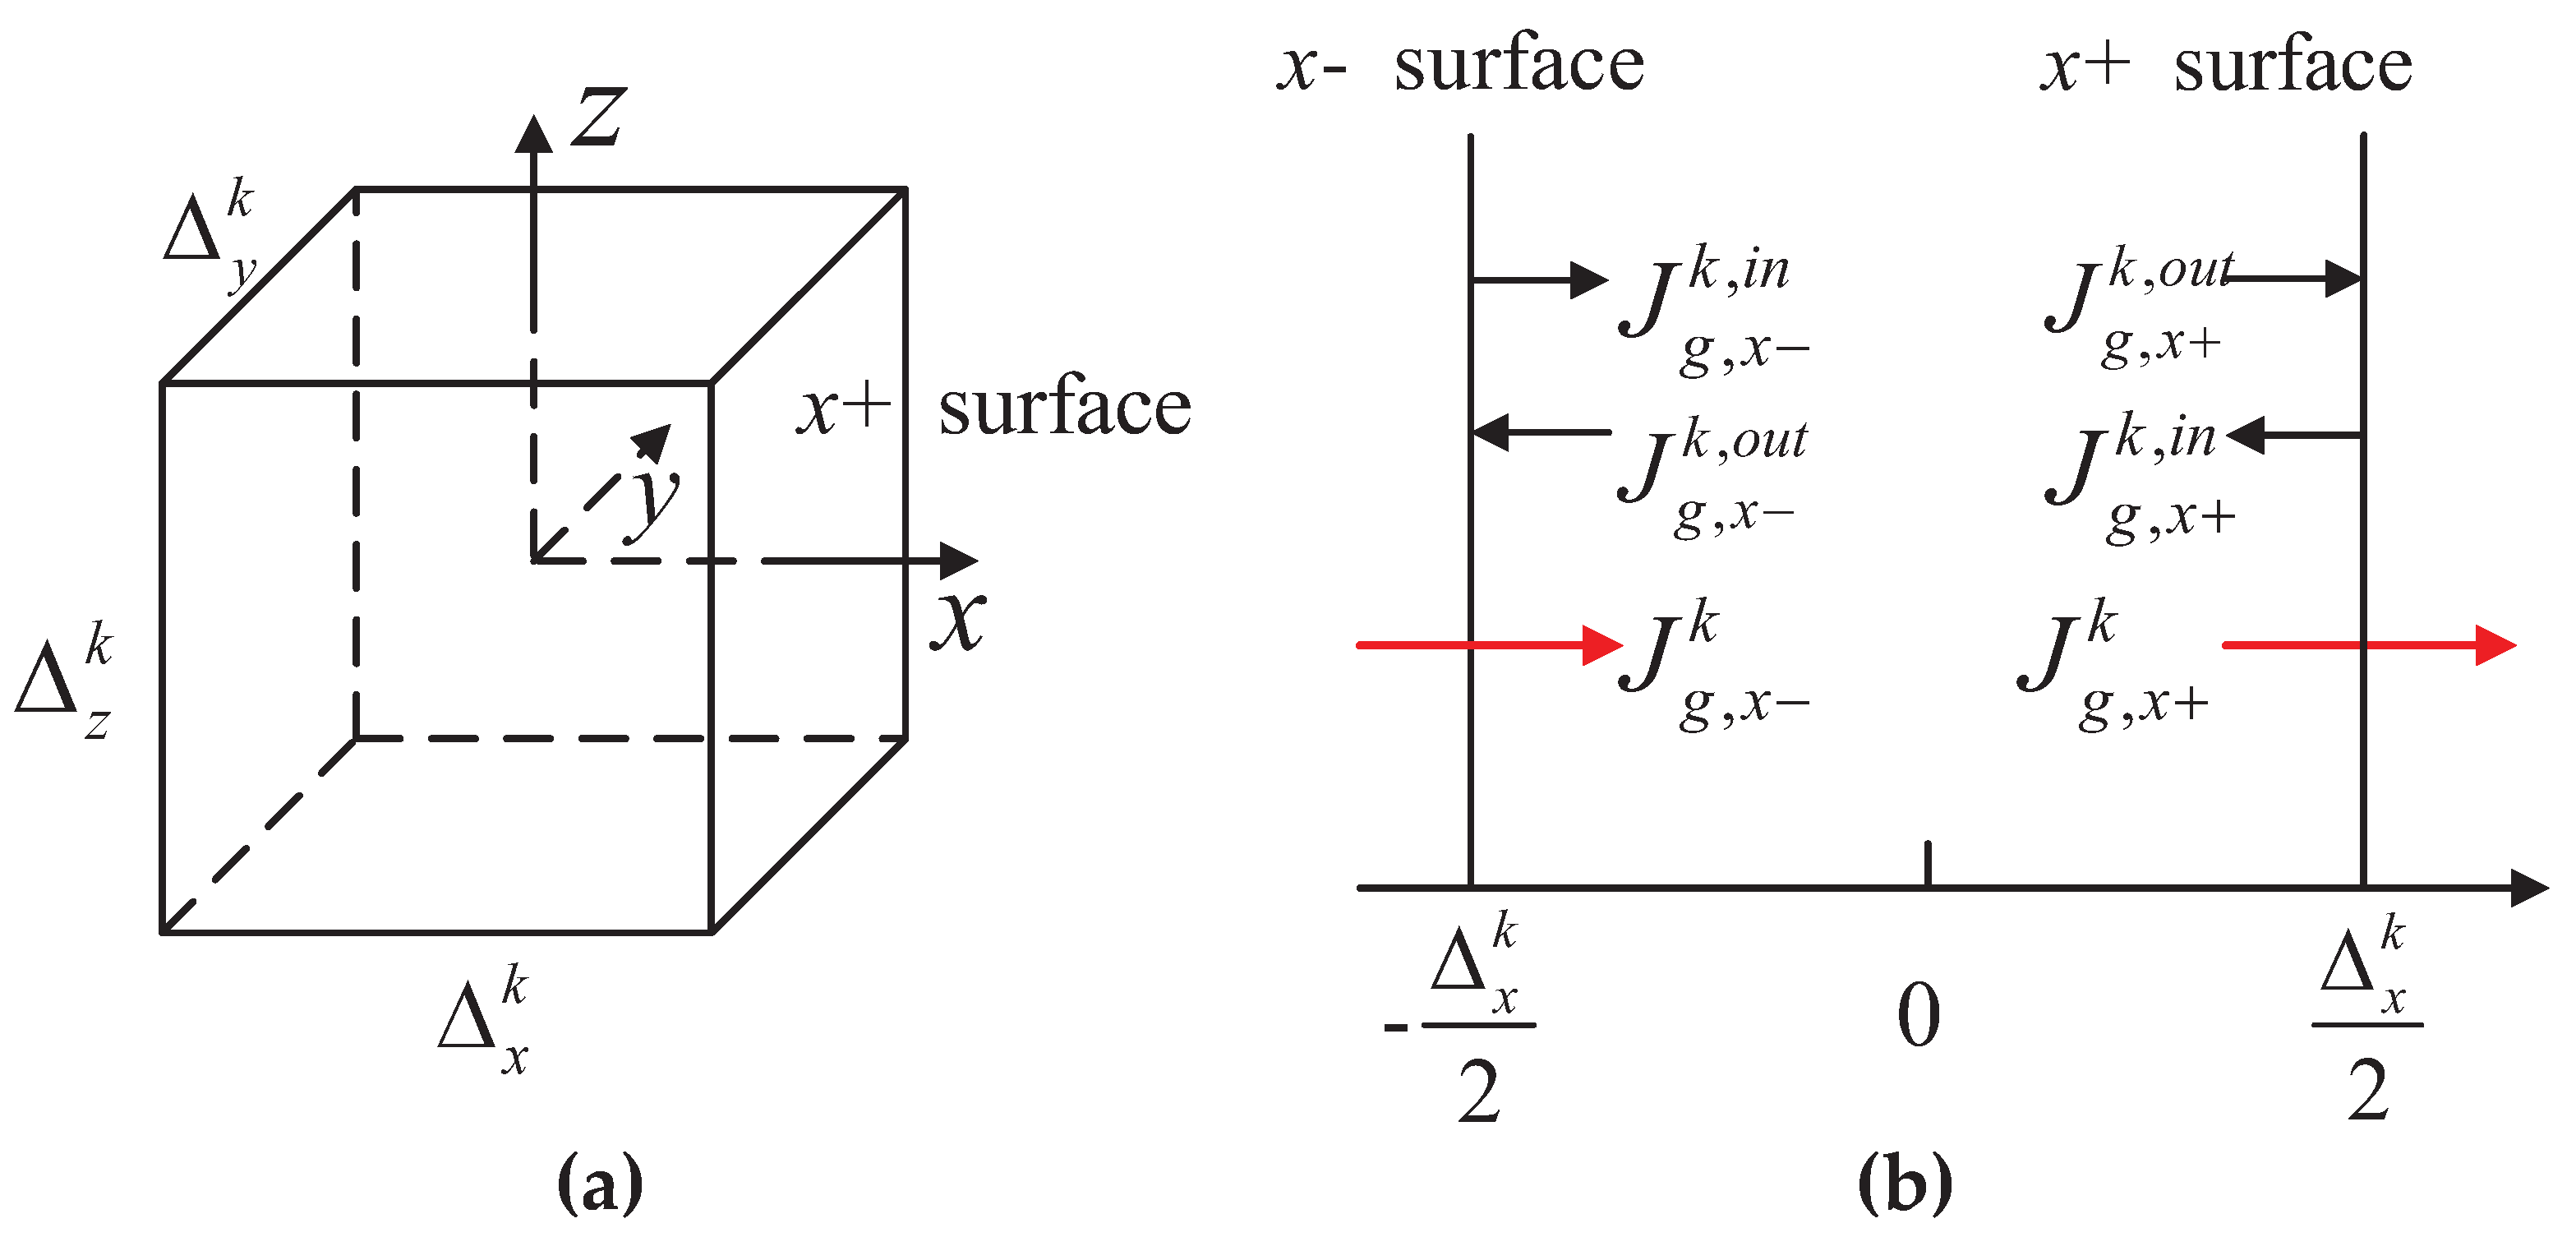
Figure 2.
Spatial discretization of the heat conduction model for fuel pins.
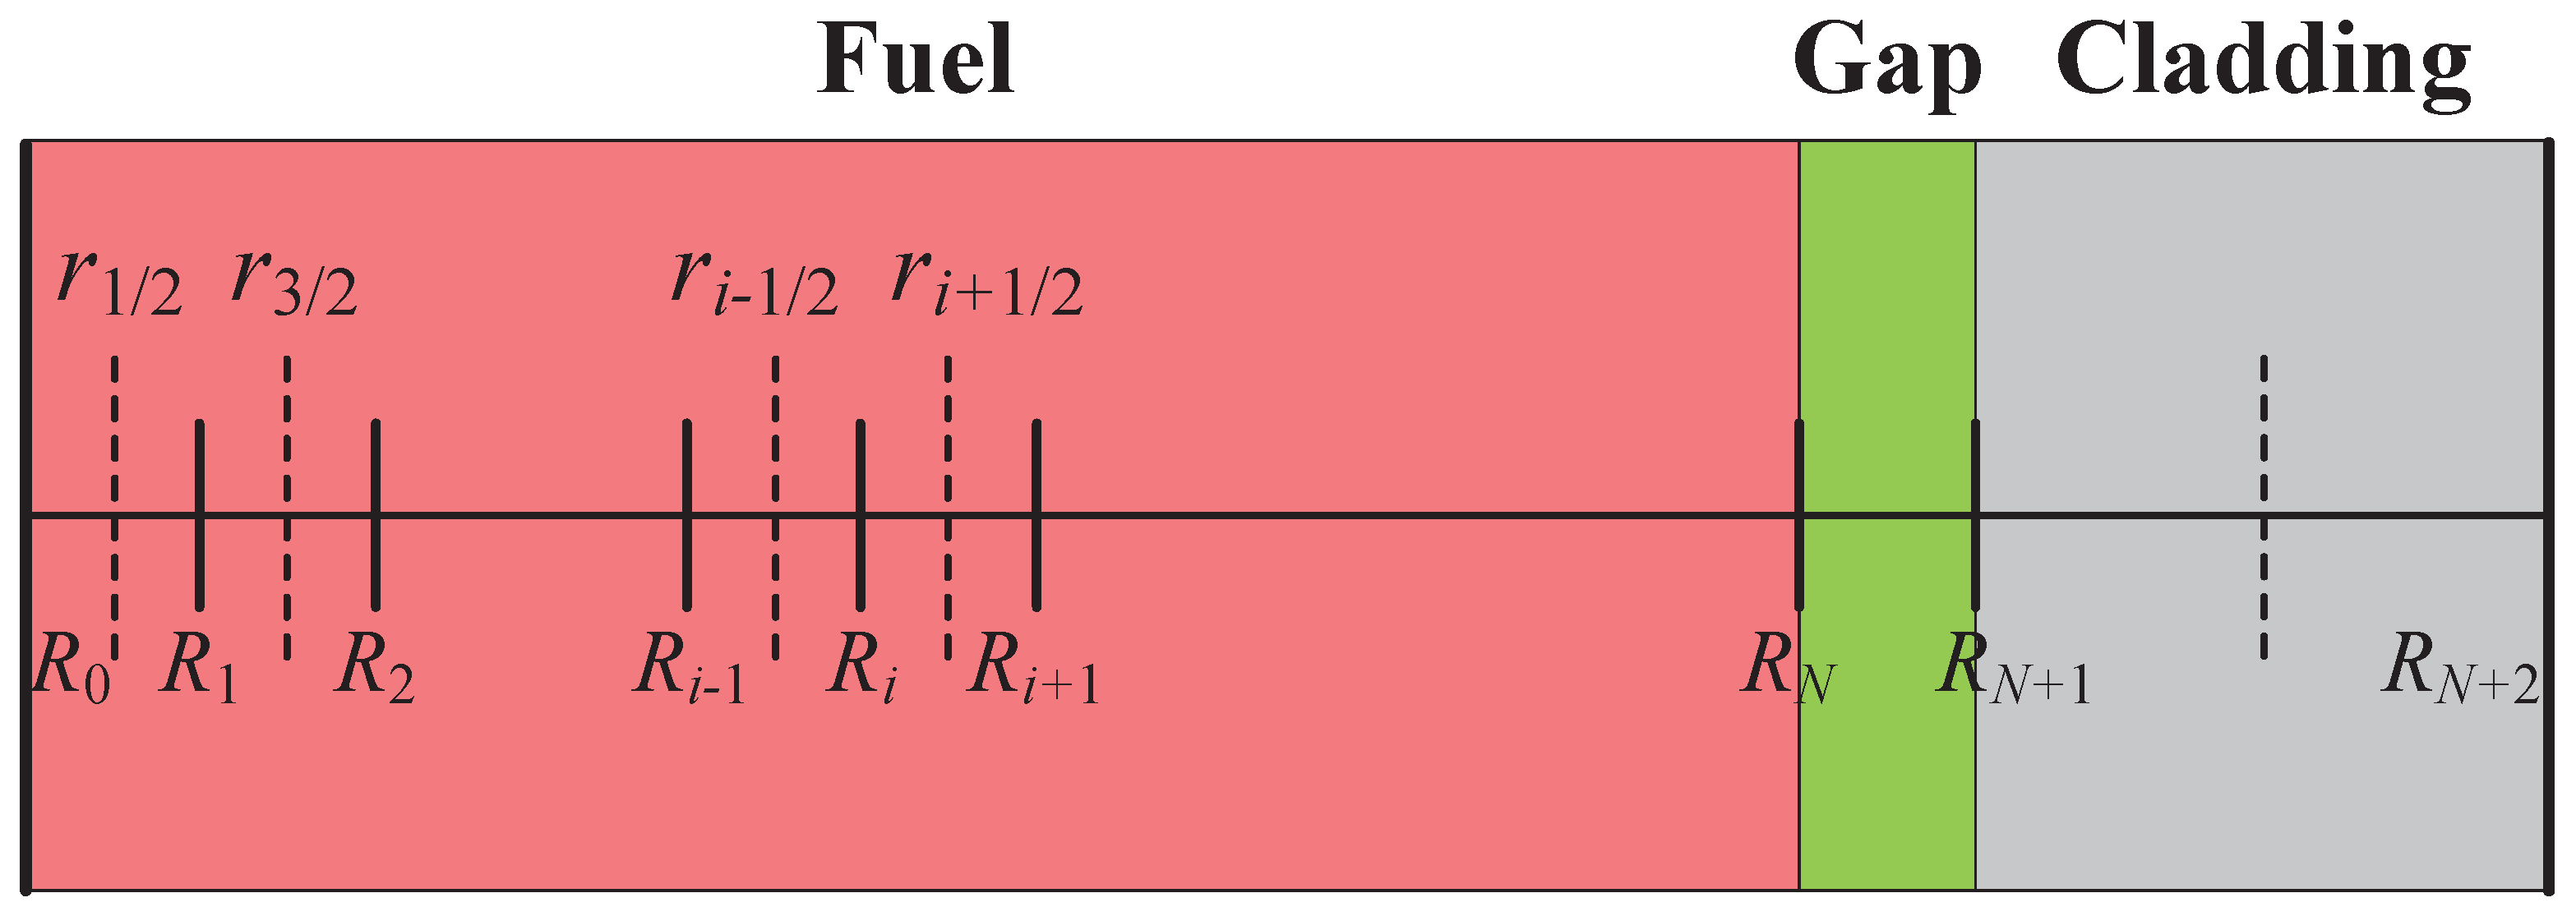
Figure 3.
Calculation procedure of the new version of TMSR3D.
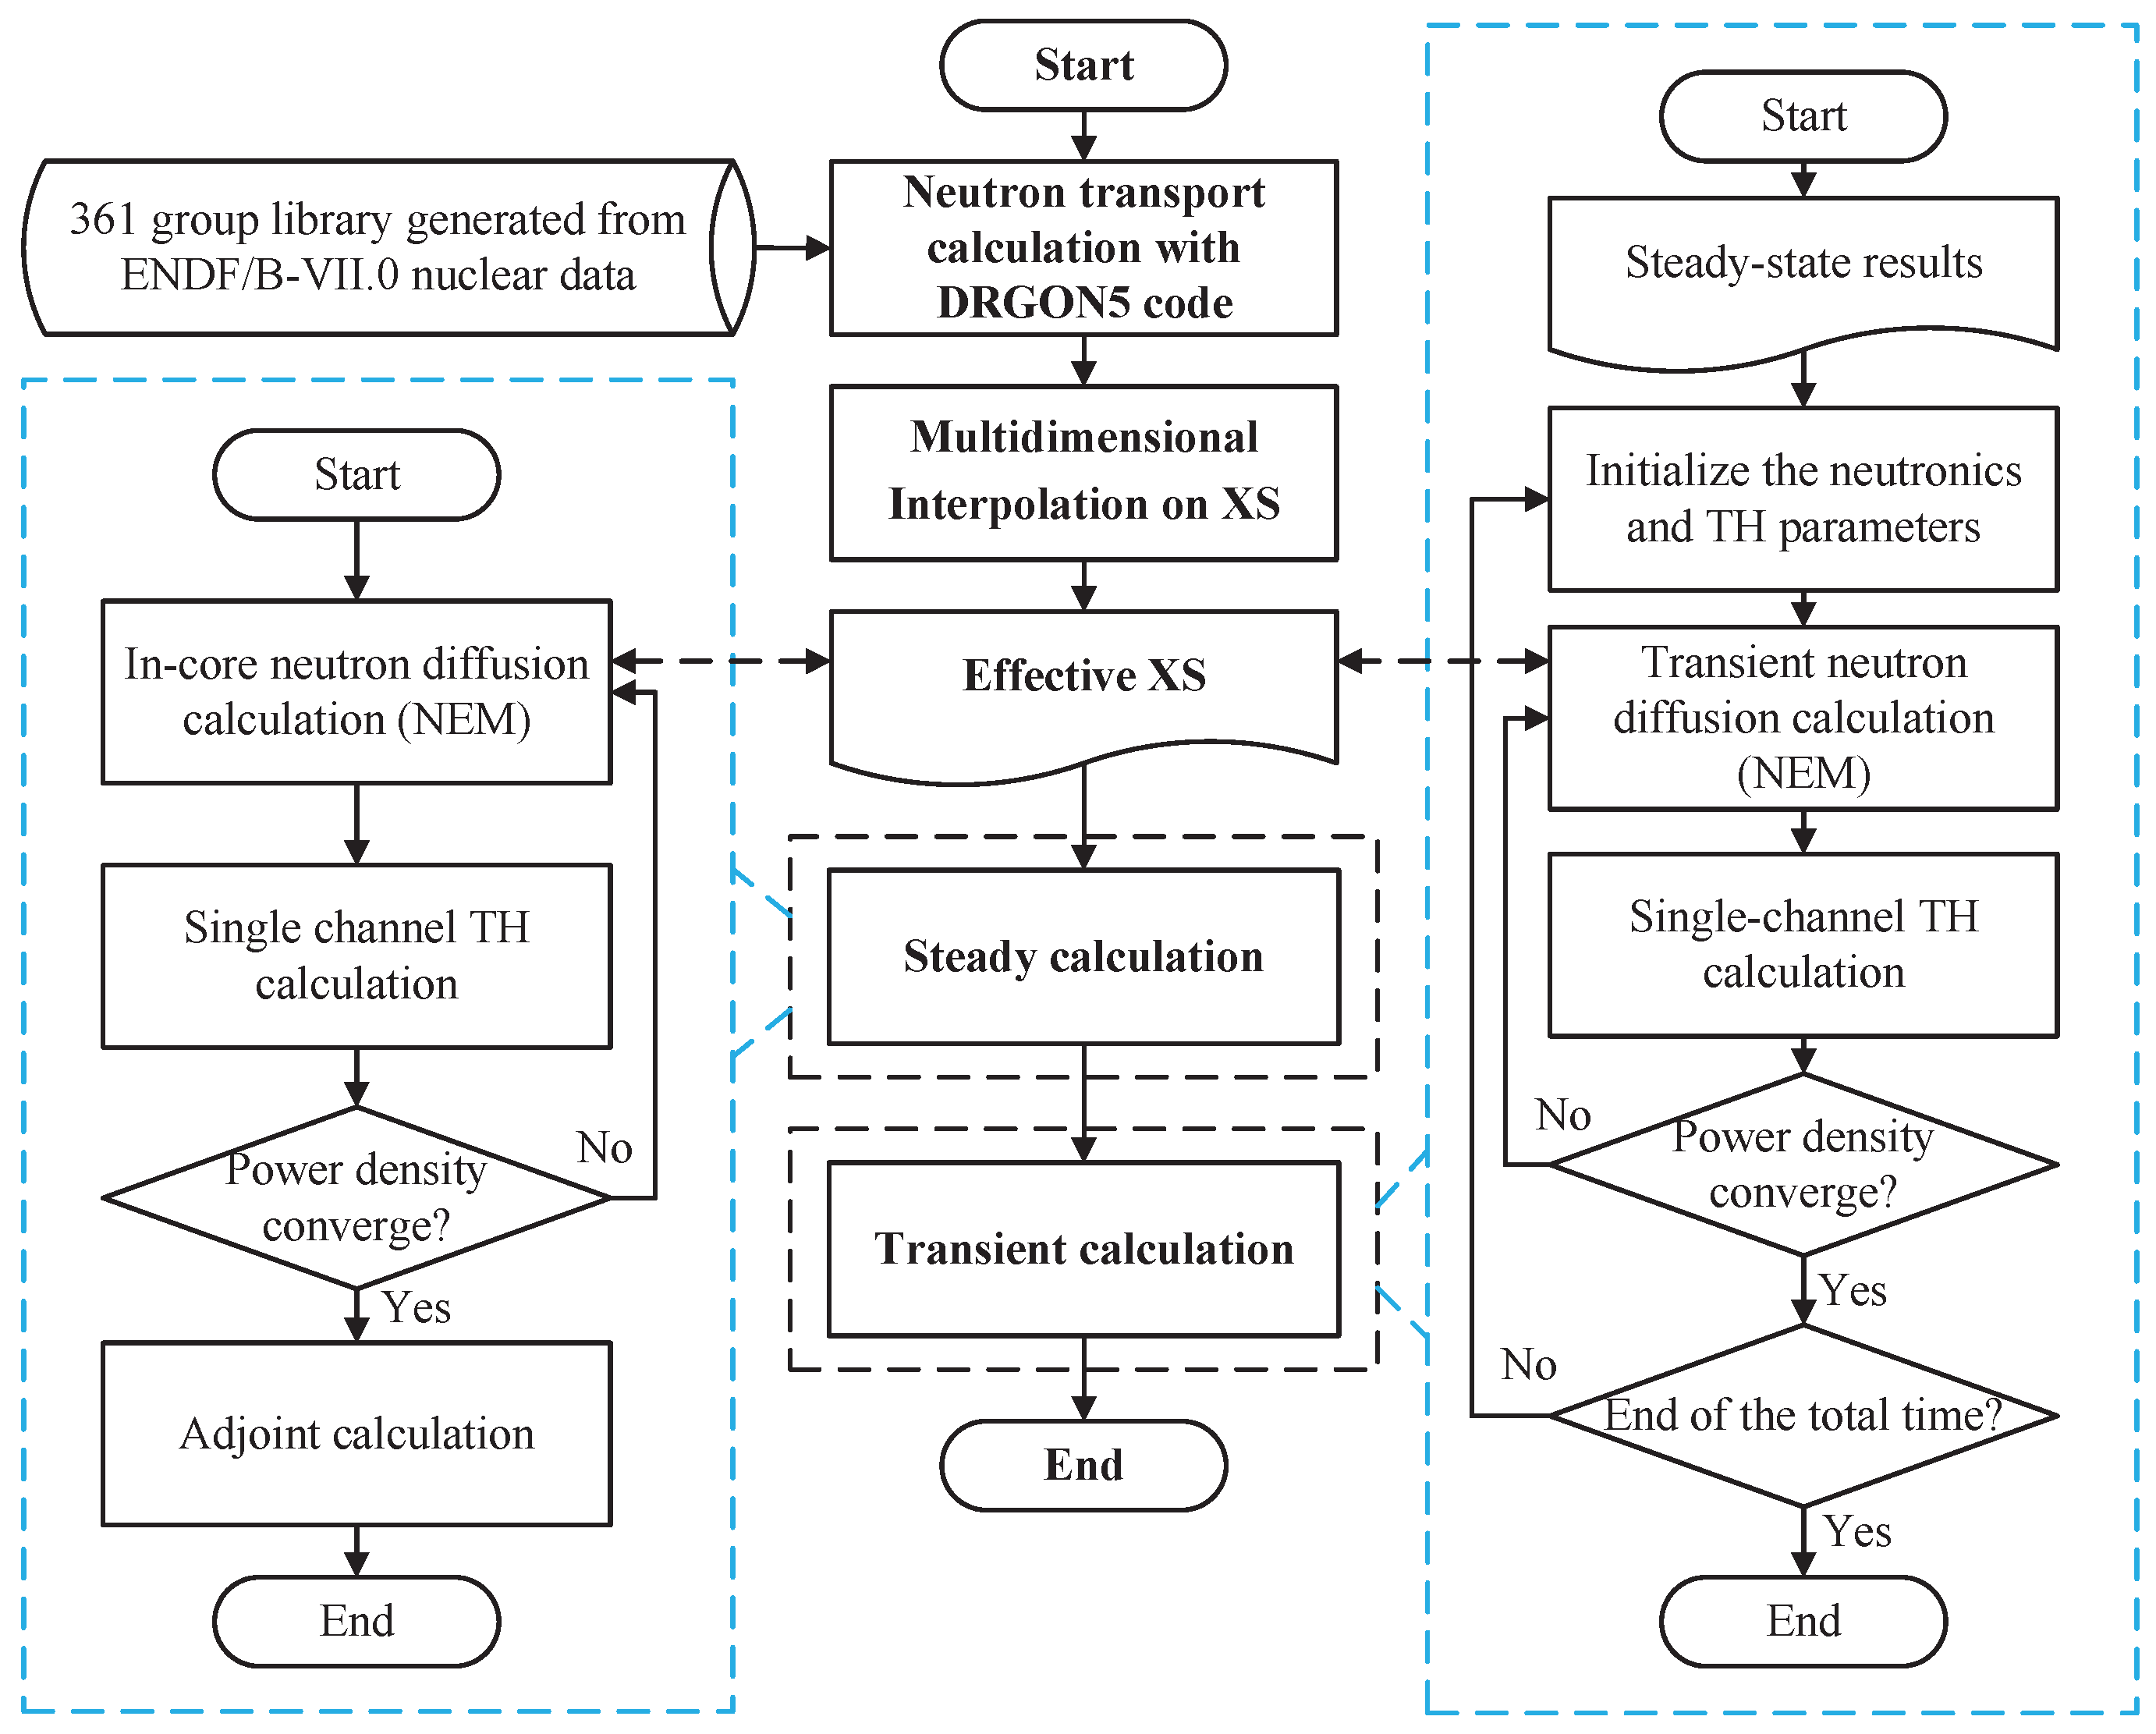
Figure 4.
Core pattern in radial (a) and axial (b) directions.
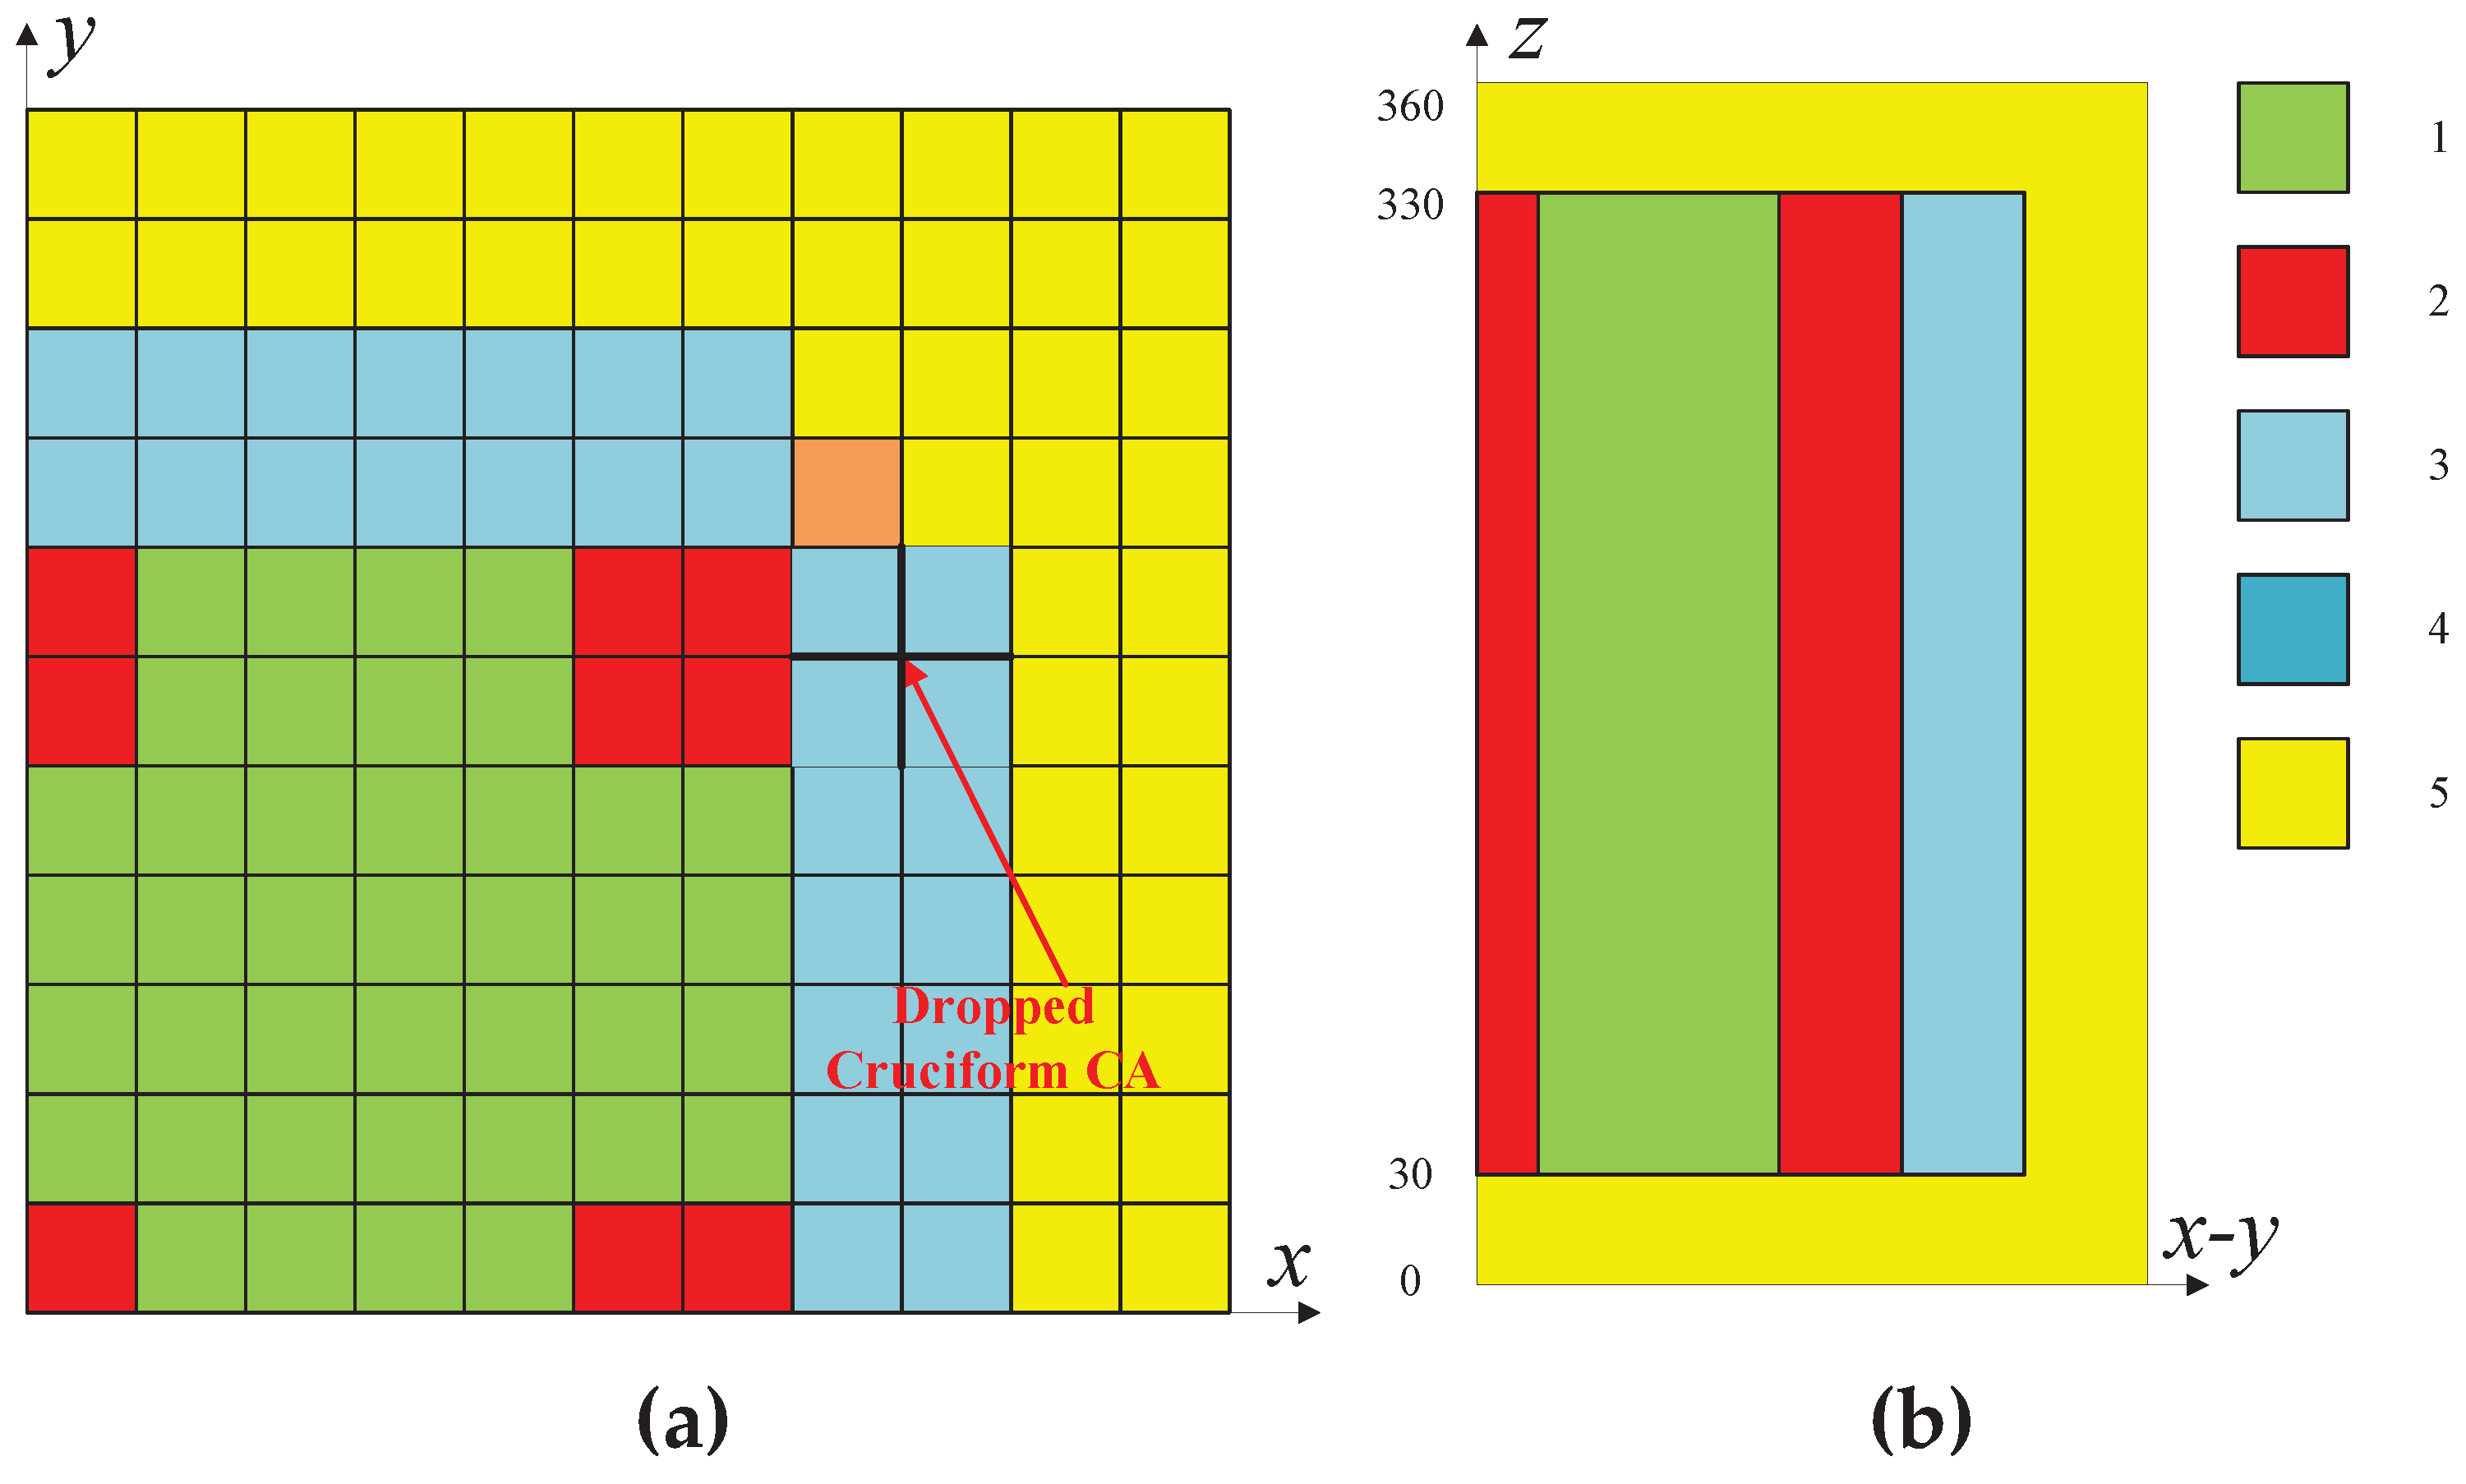
Figure 5.
Power density and core temperature from TMSR3D compared to the reference.
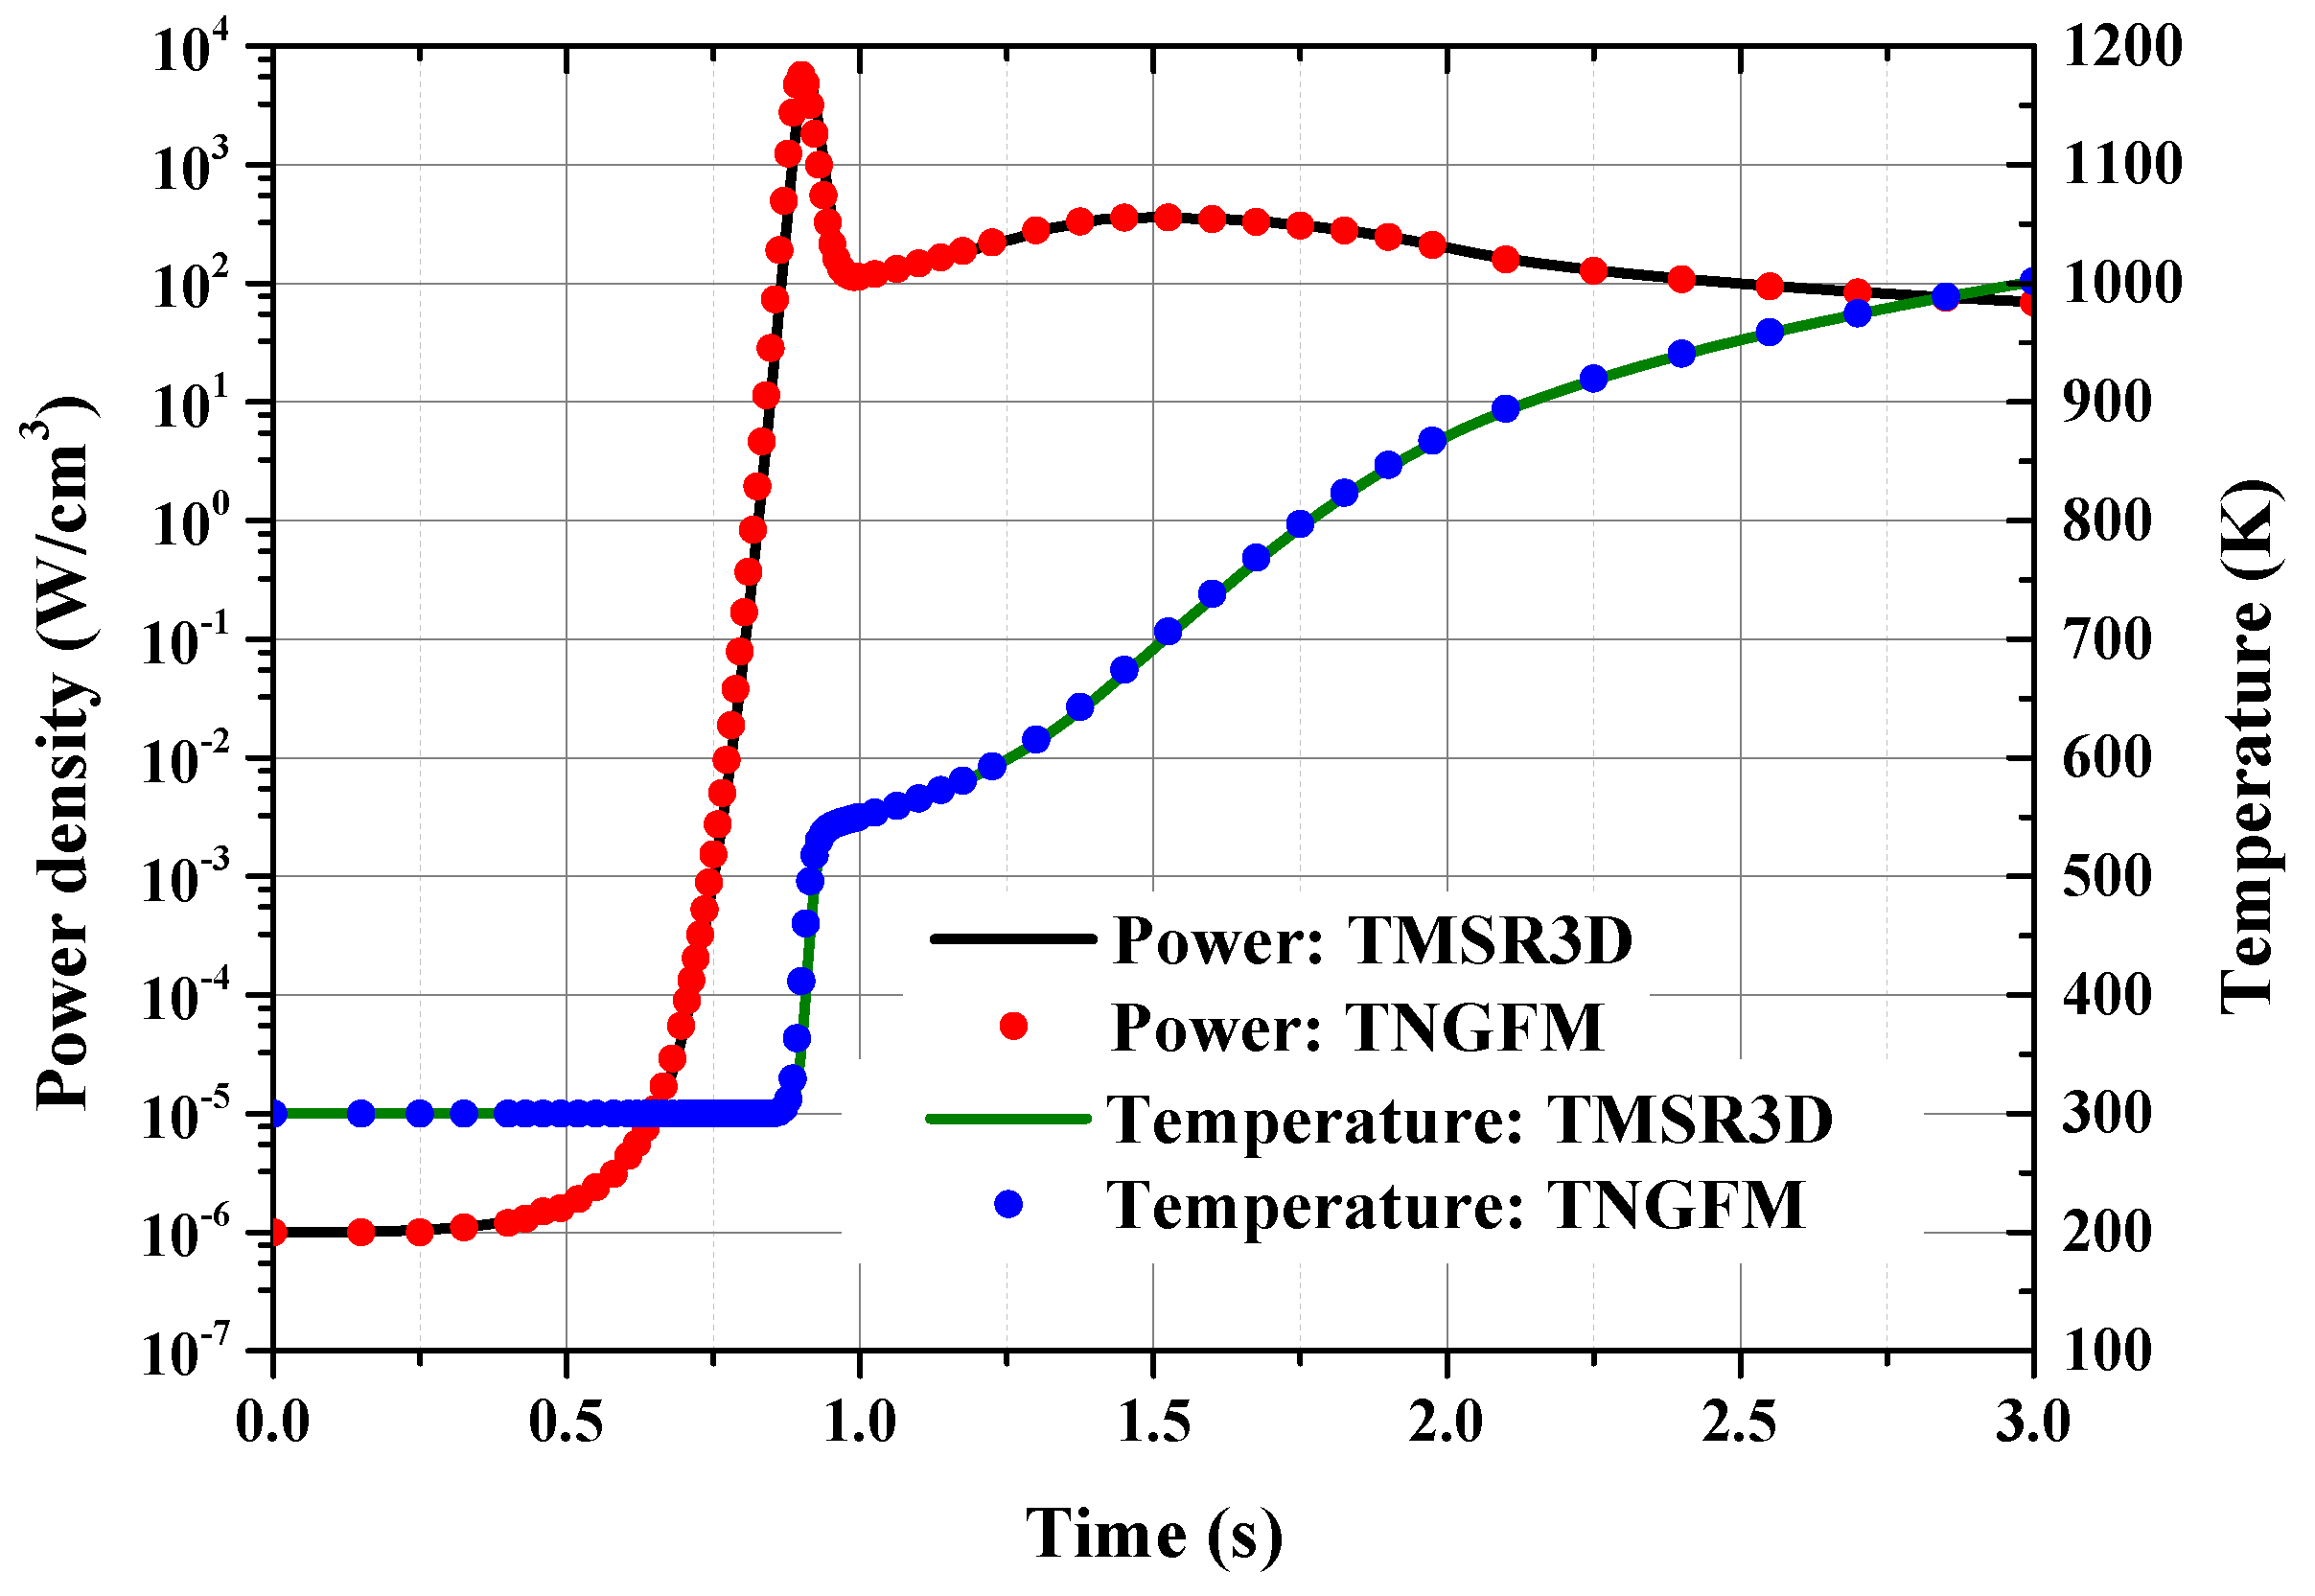
Figure 6.
Radial core configuration of the NEACRP 3D PWR benchmark (1 and 2 denote different types of CR).
Figure 6.
Radial core configuration of the NEACRP 3D PWR benchmark (1 and 2 denote different types of CR).
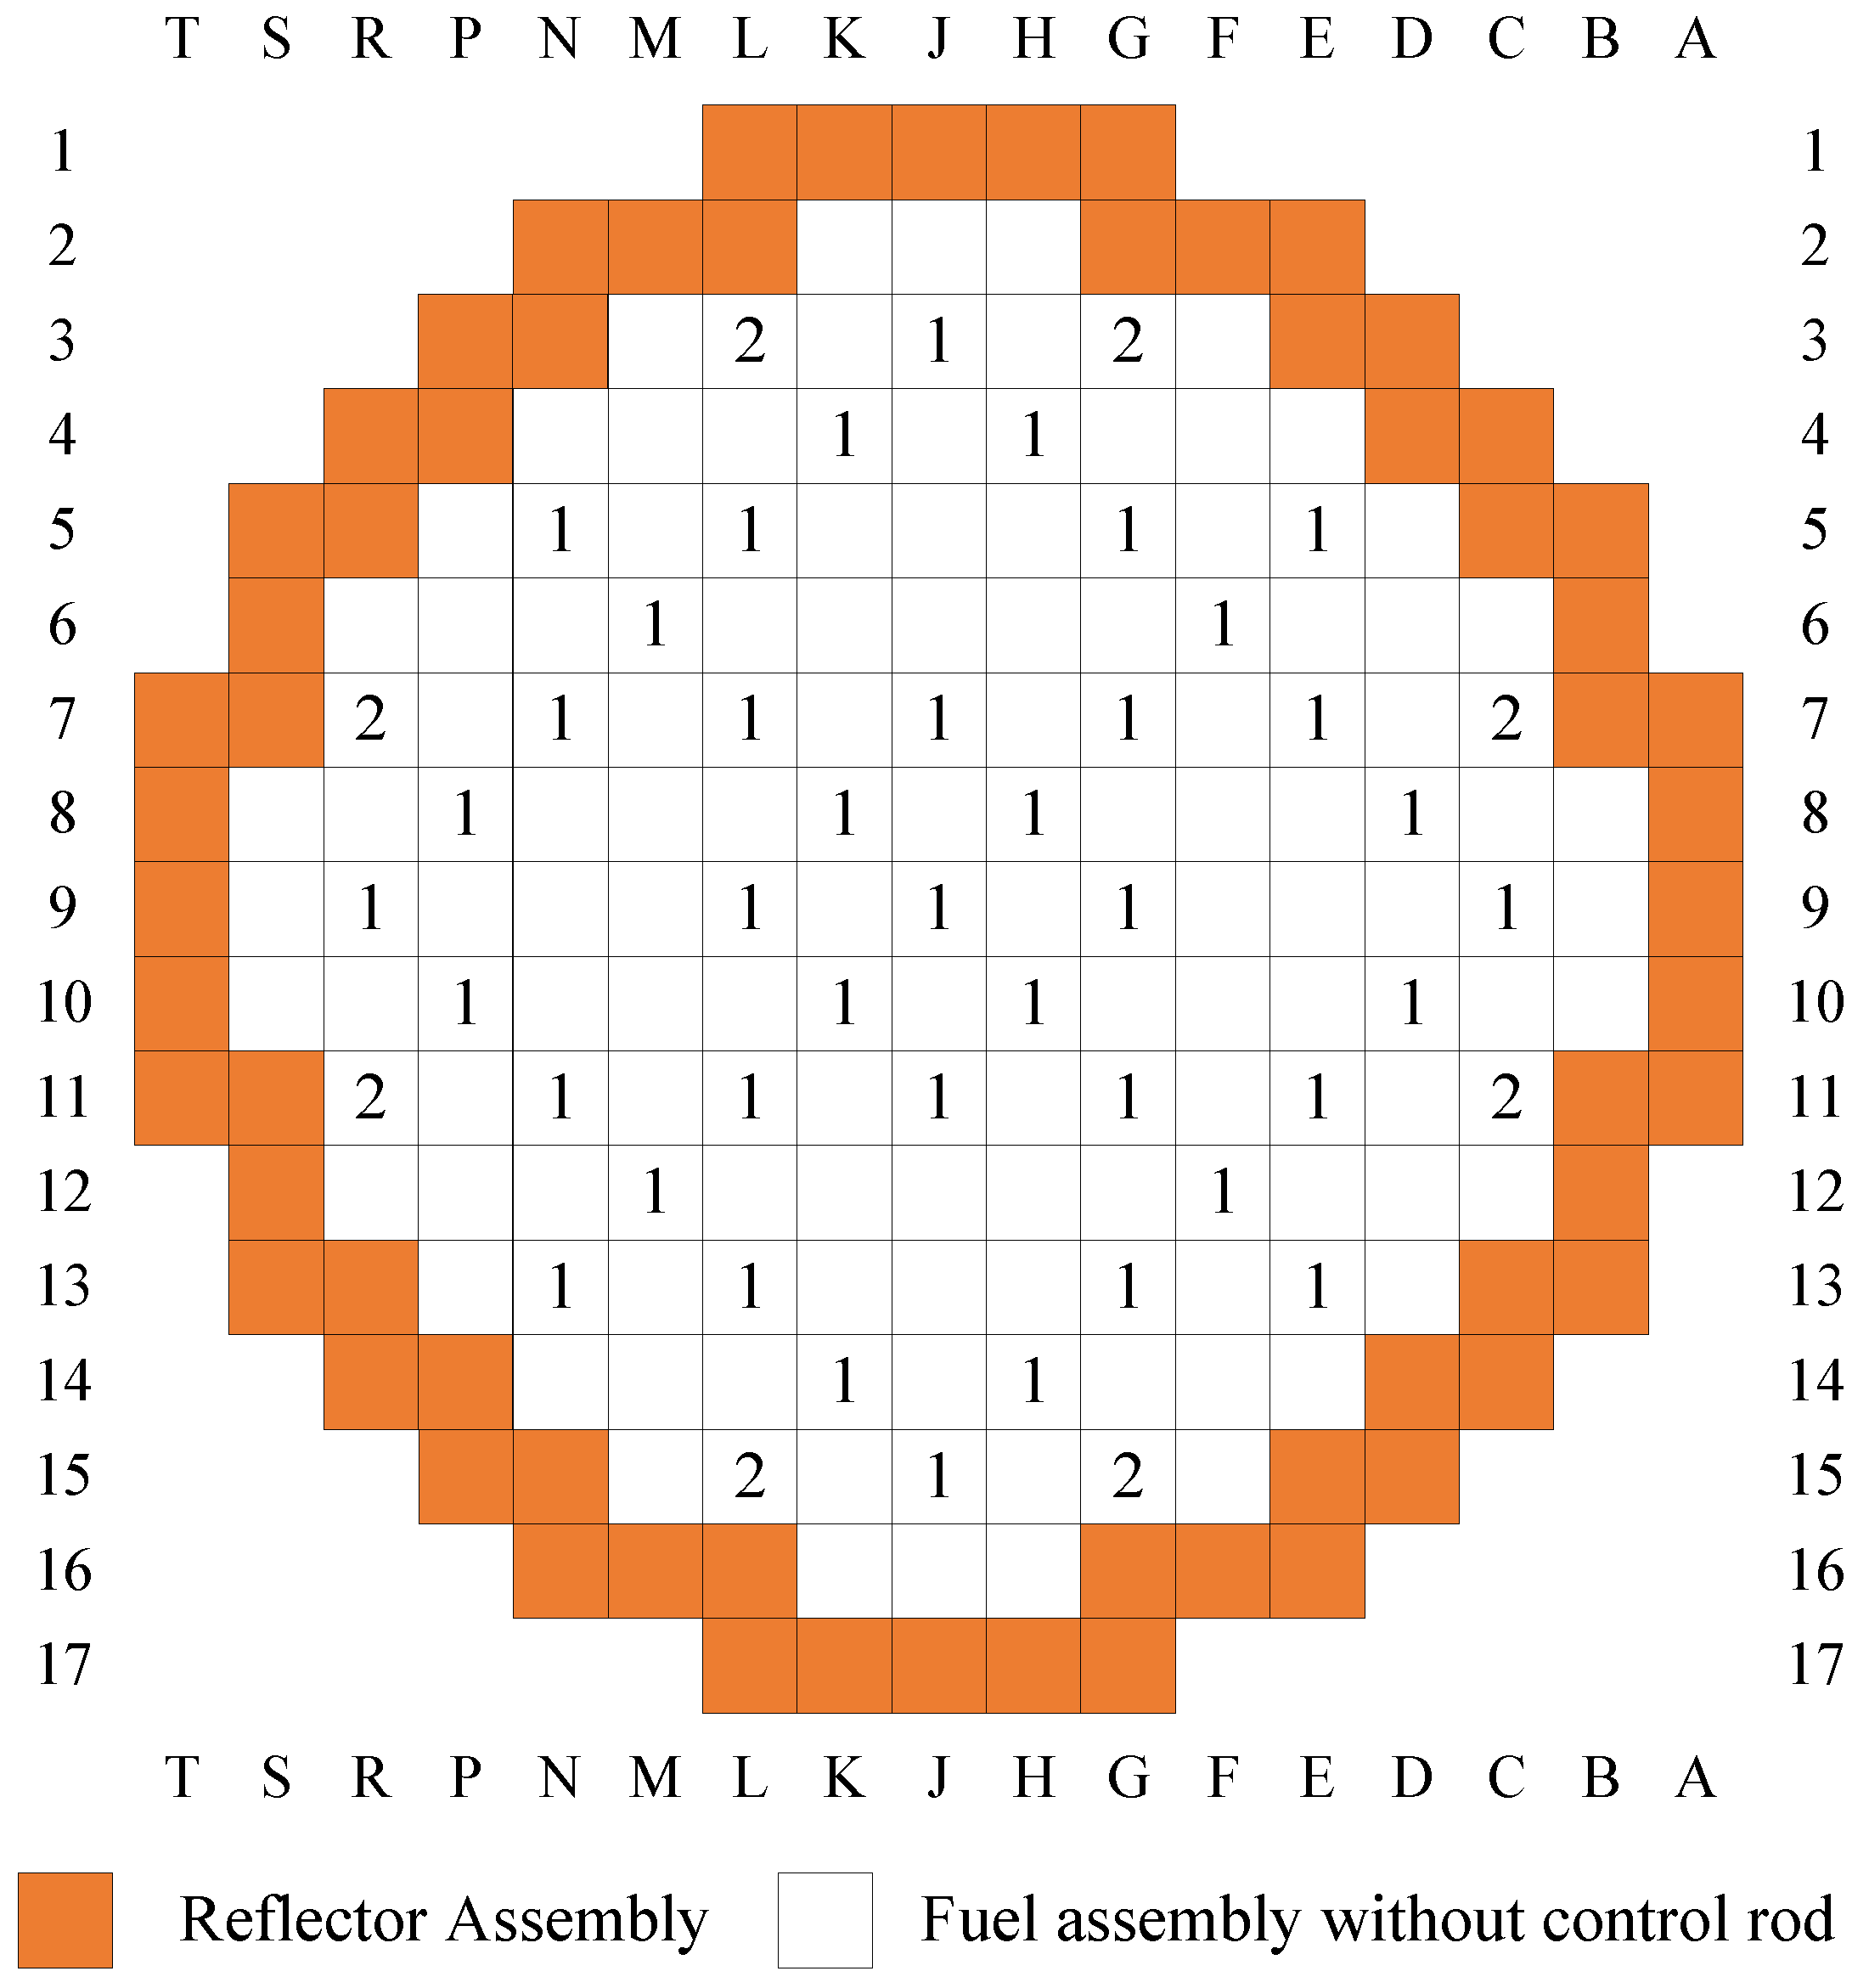
Figure 7.
Comparisons between TMSR3D and reference results for the transients.
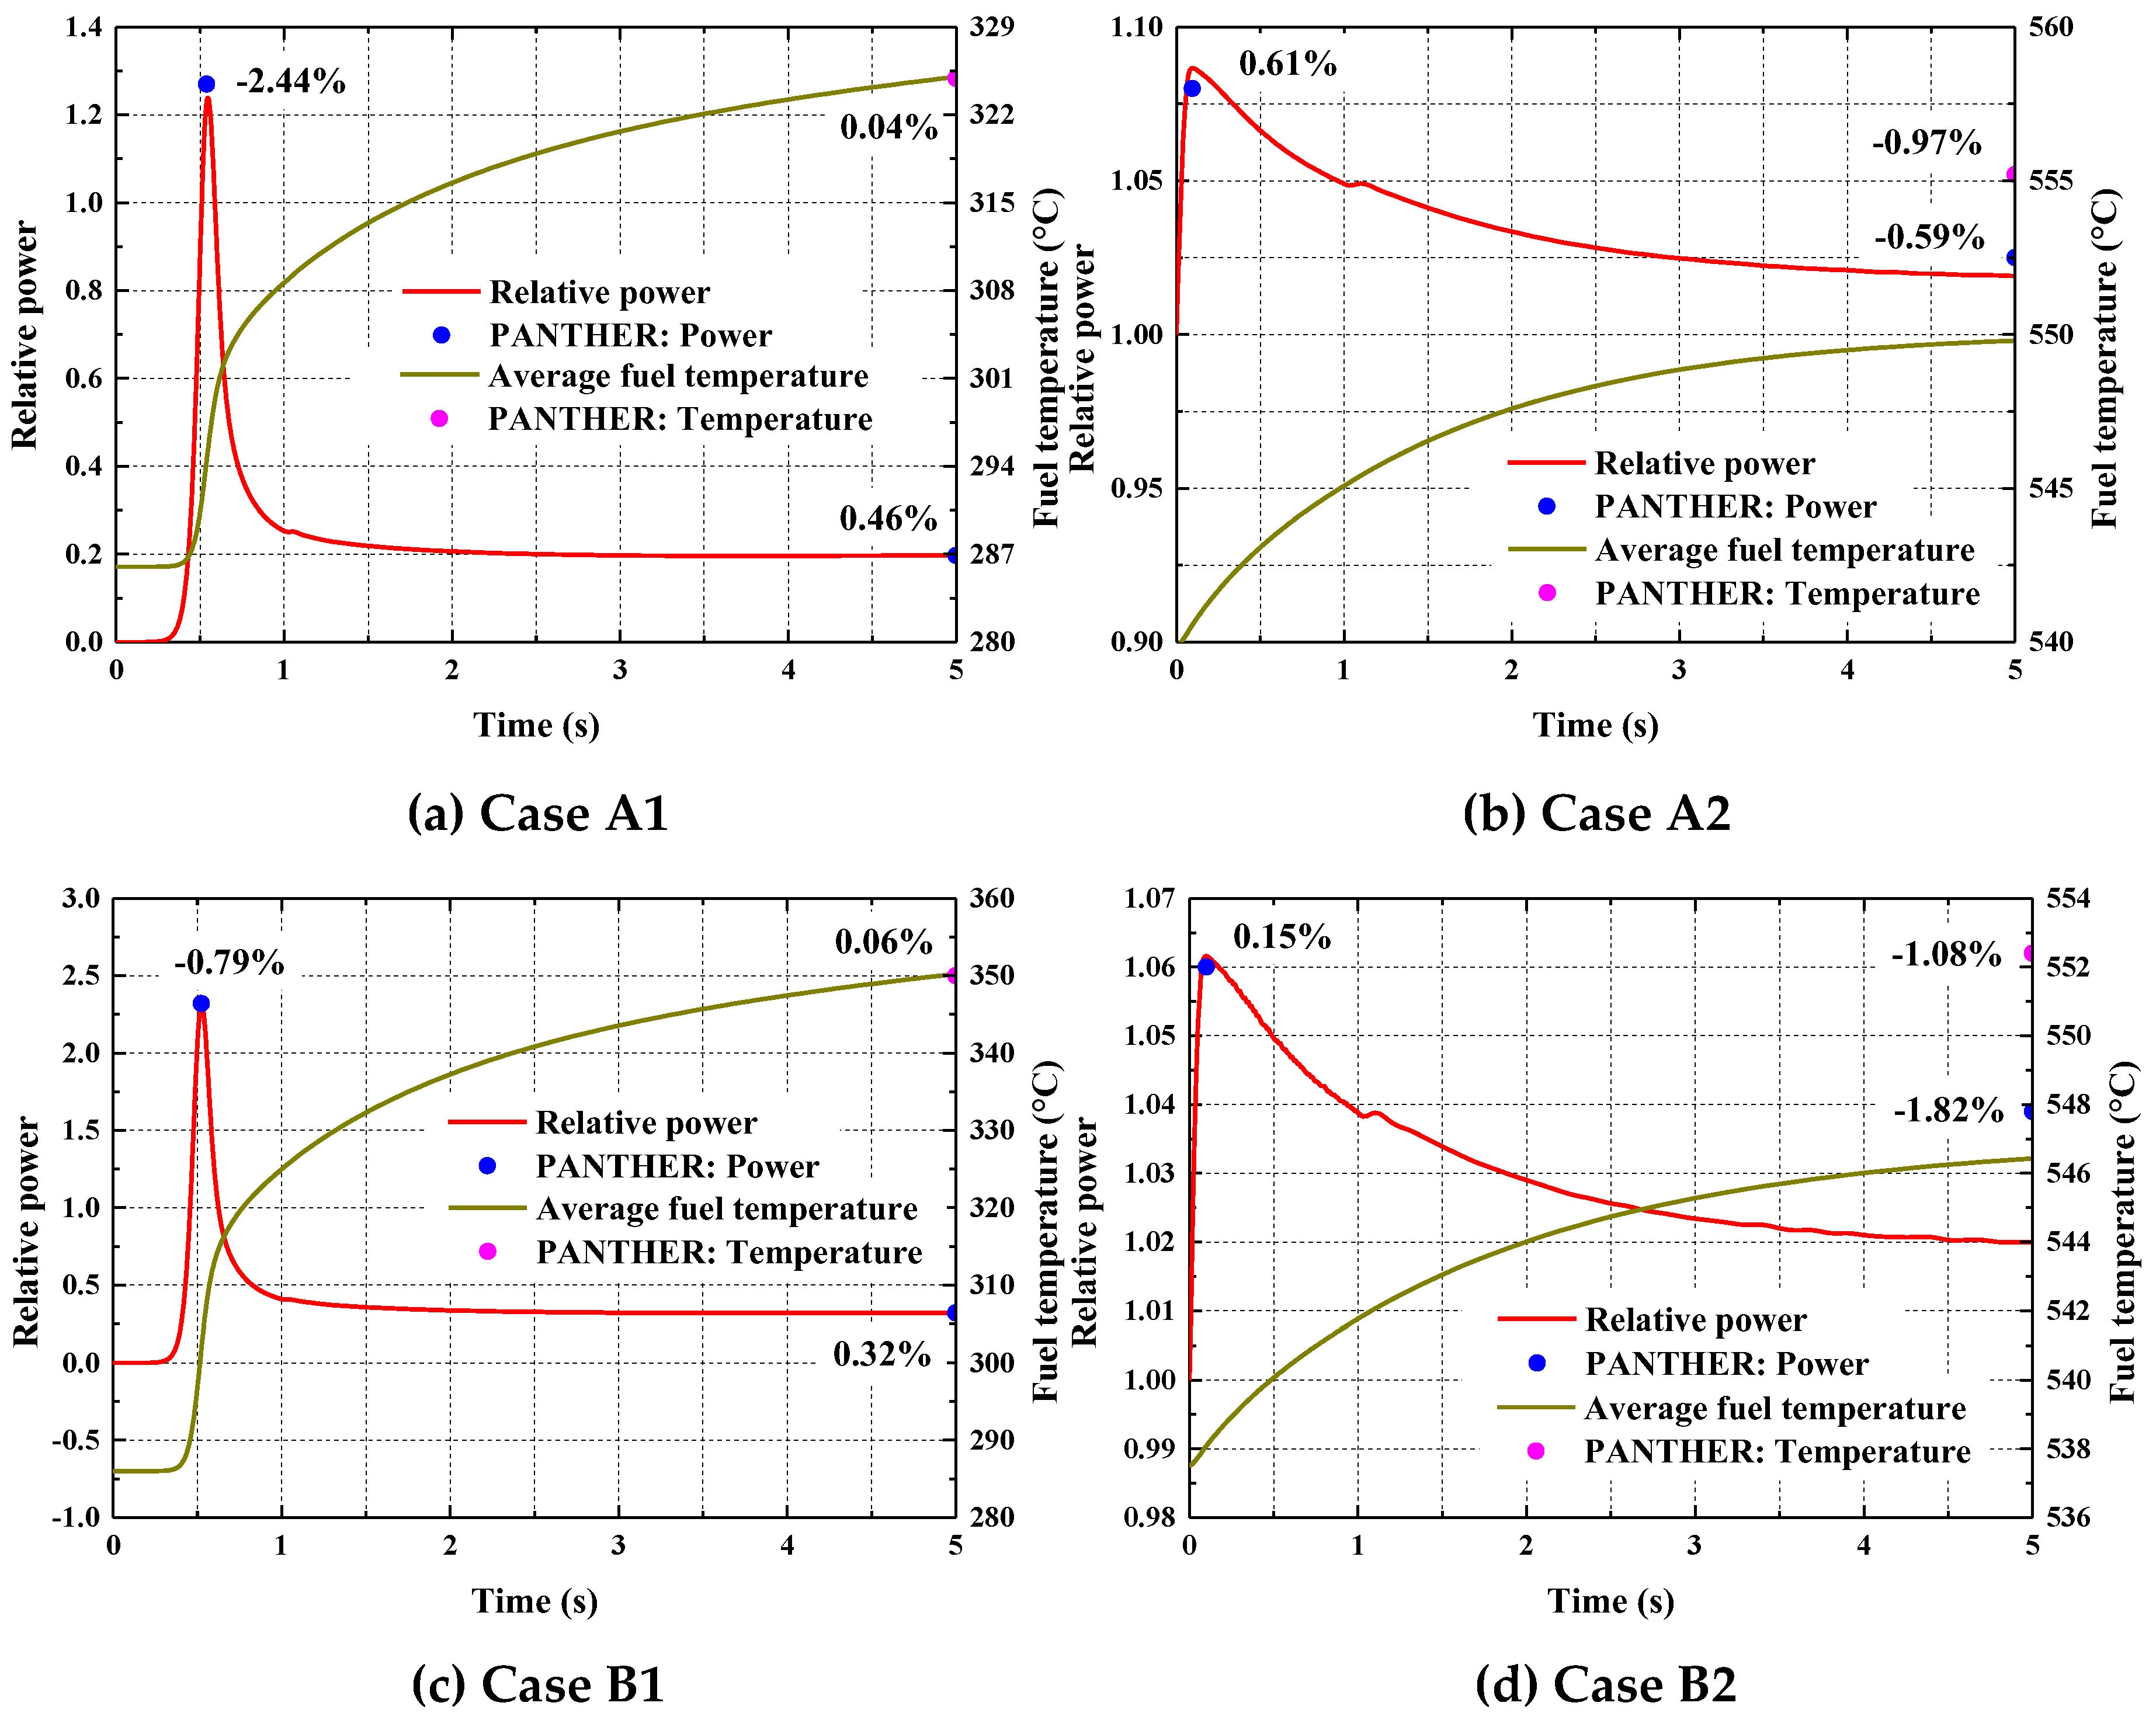
Figure 8.
Fuel temperature distribution on axial core section at 0 s (a) and 5 s (b) for Case C2.
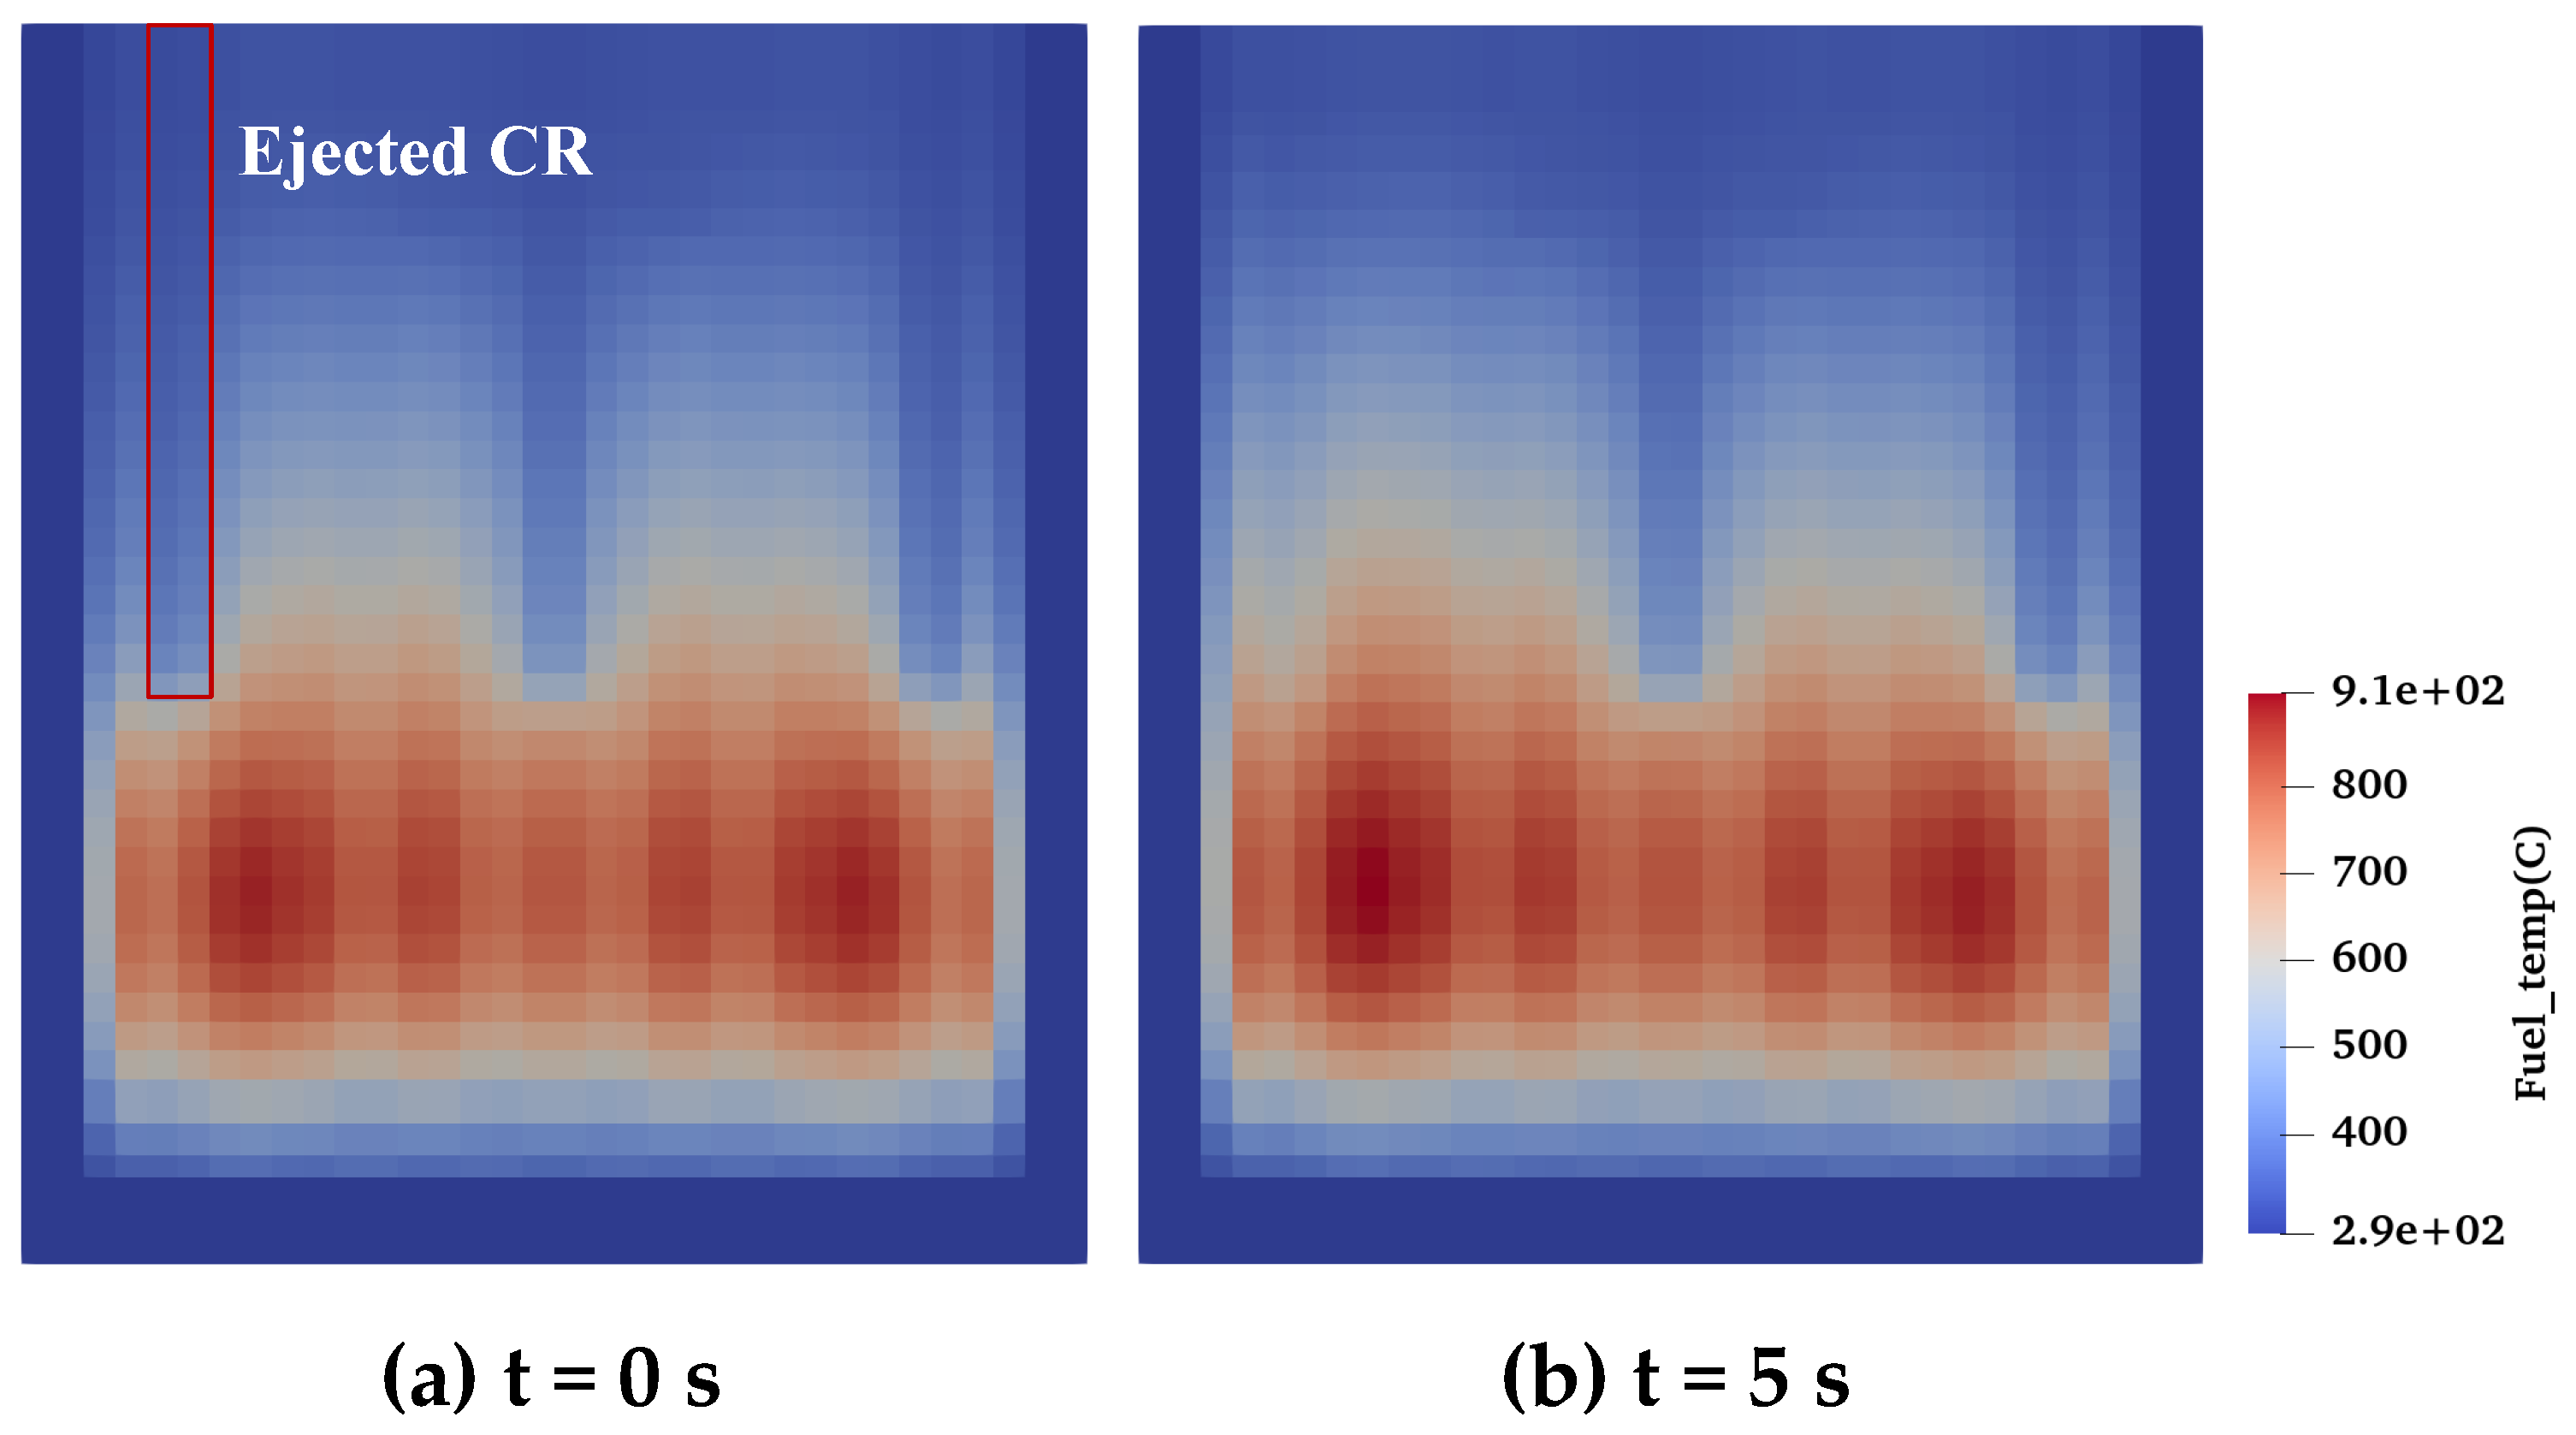
Figure 9.
Core configuration of a quarter of the PWR MOX/UO2 core benchmark [28].
Figure 9.
Core configuration of a quarter of the PWR MOX/UO2 core benchmark [28].
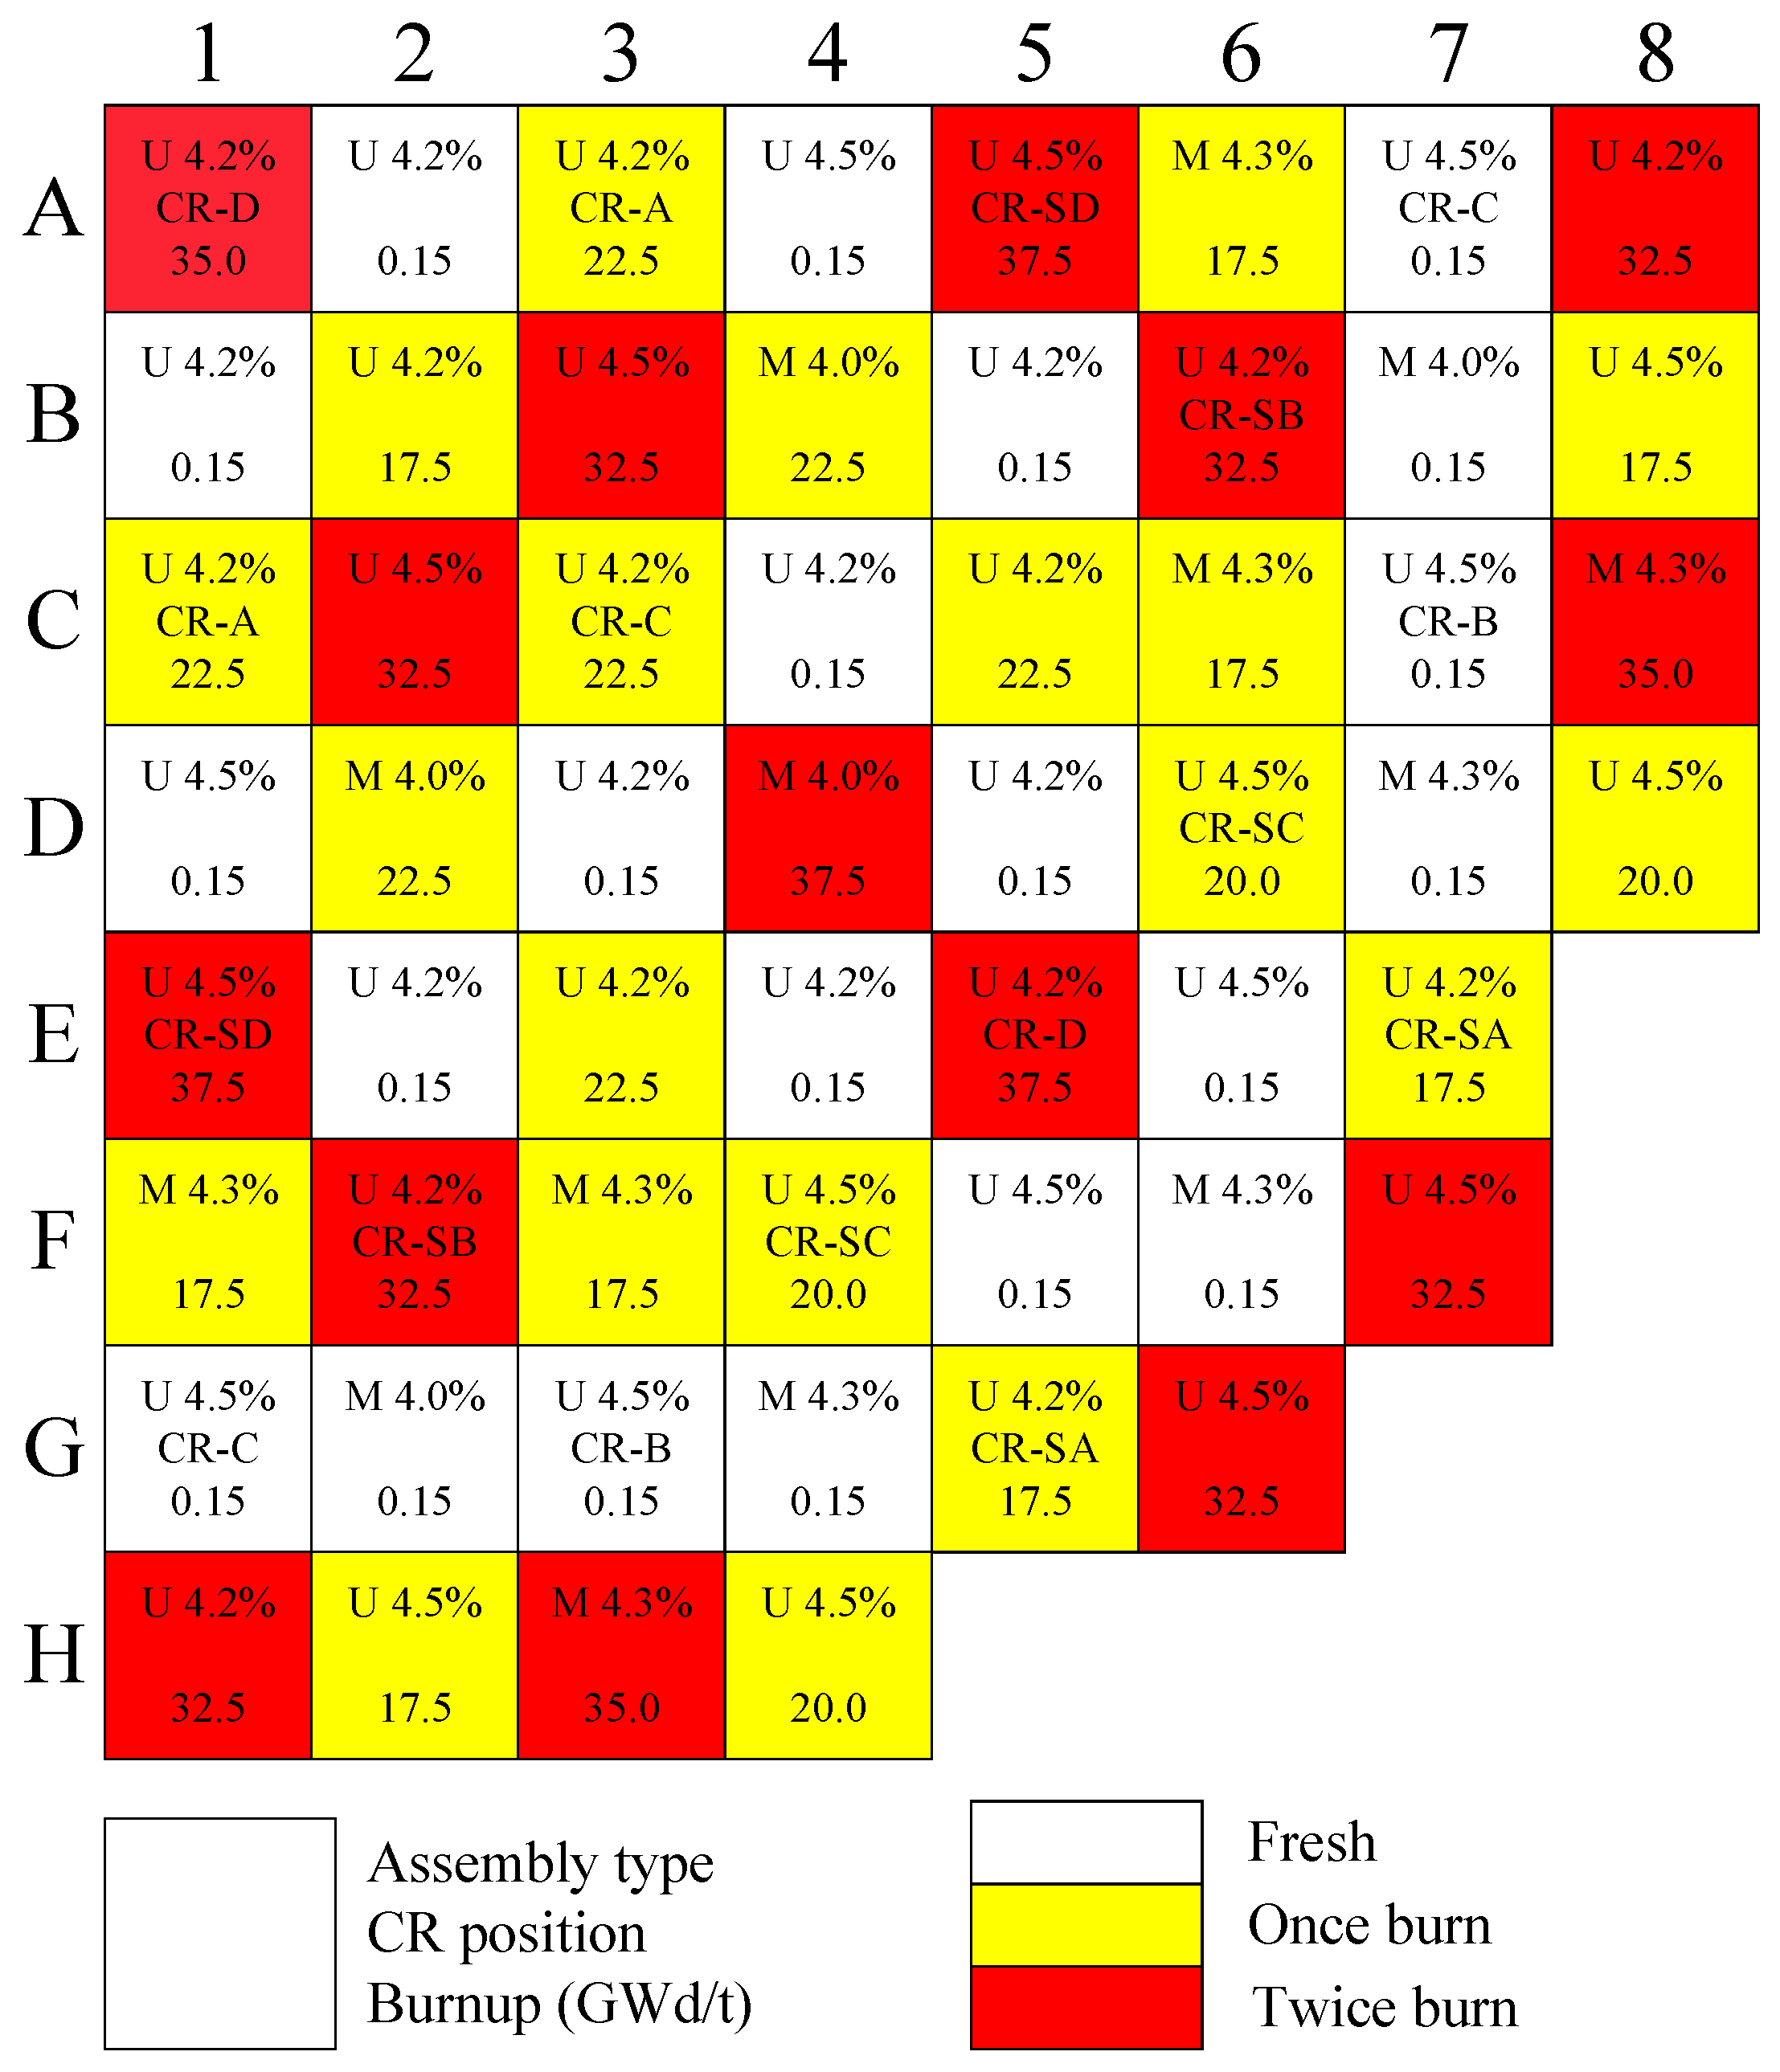
Figure 10.
Normalized power profile in radial direction at ARO (a) and ARI (b) conditions.
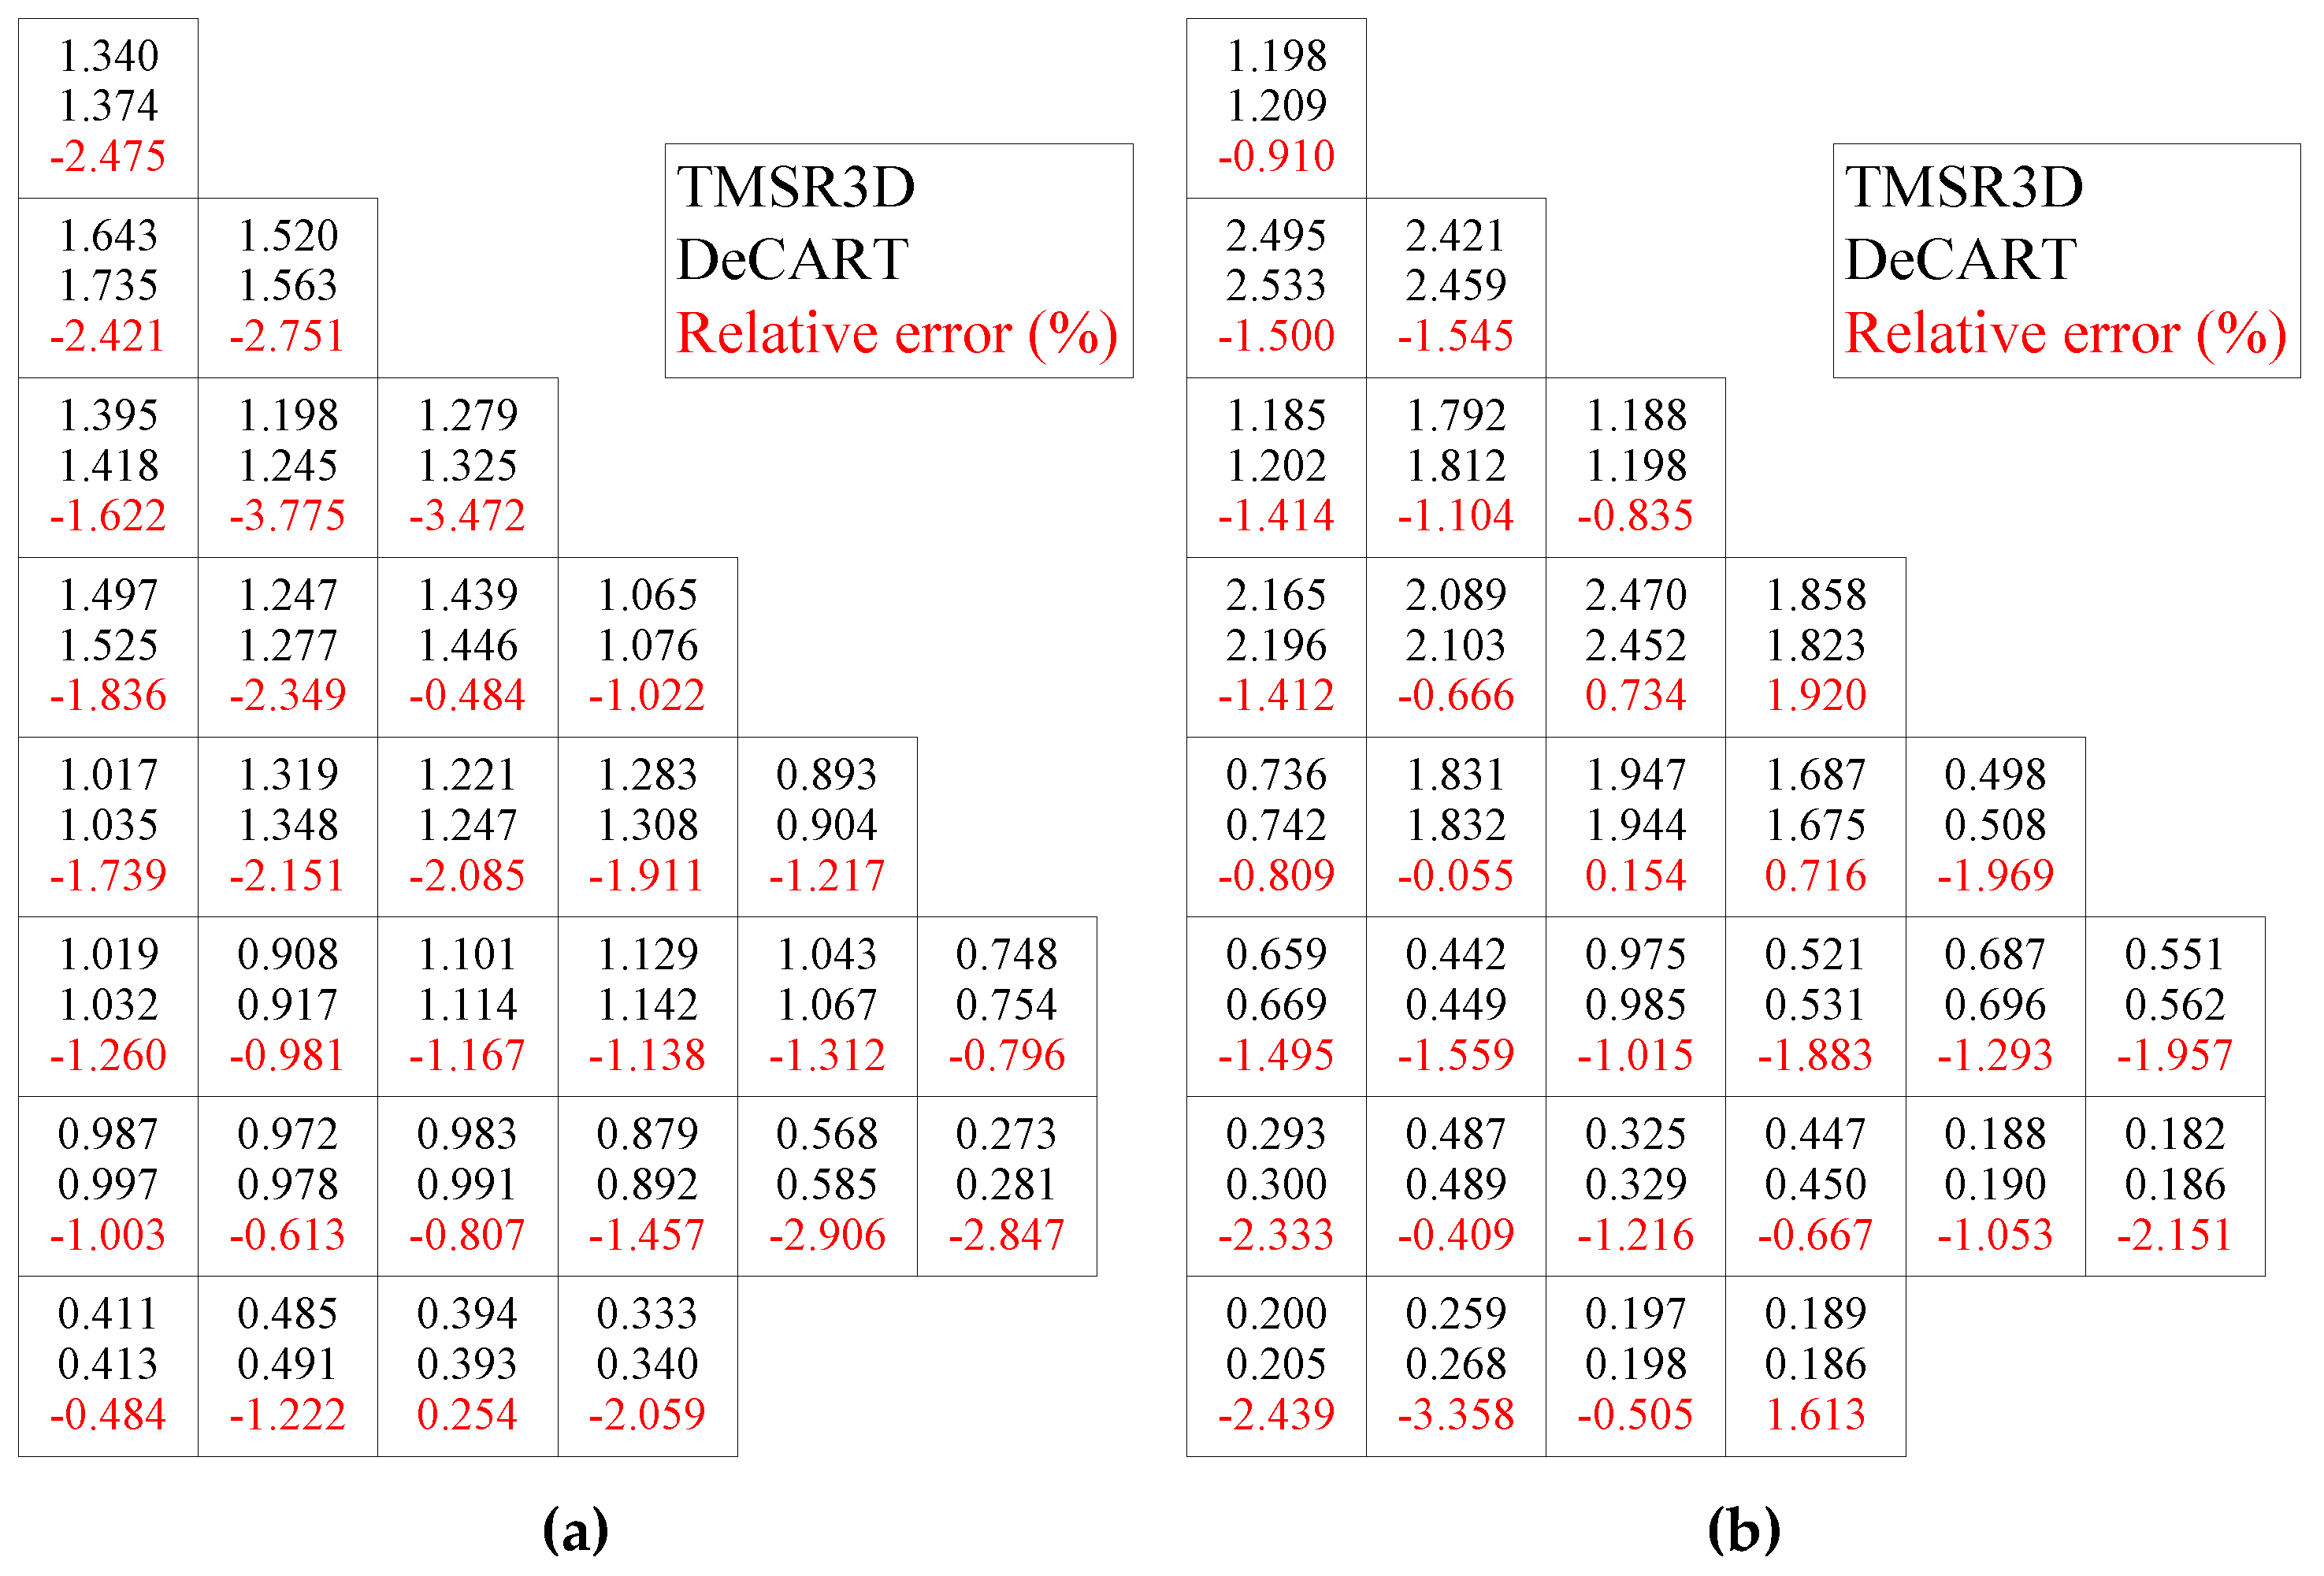
Figure 11.
Steady-state profiles of fuel temperature (a), moderator temperature (b) and density (c).
Figure 11.
Steady-state profiles of fuel temperature (a), moderator temperature (b) and density (c).
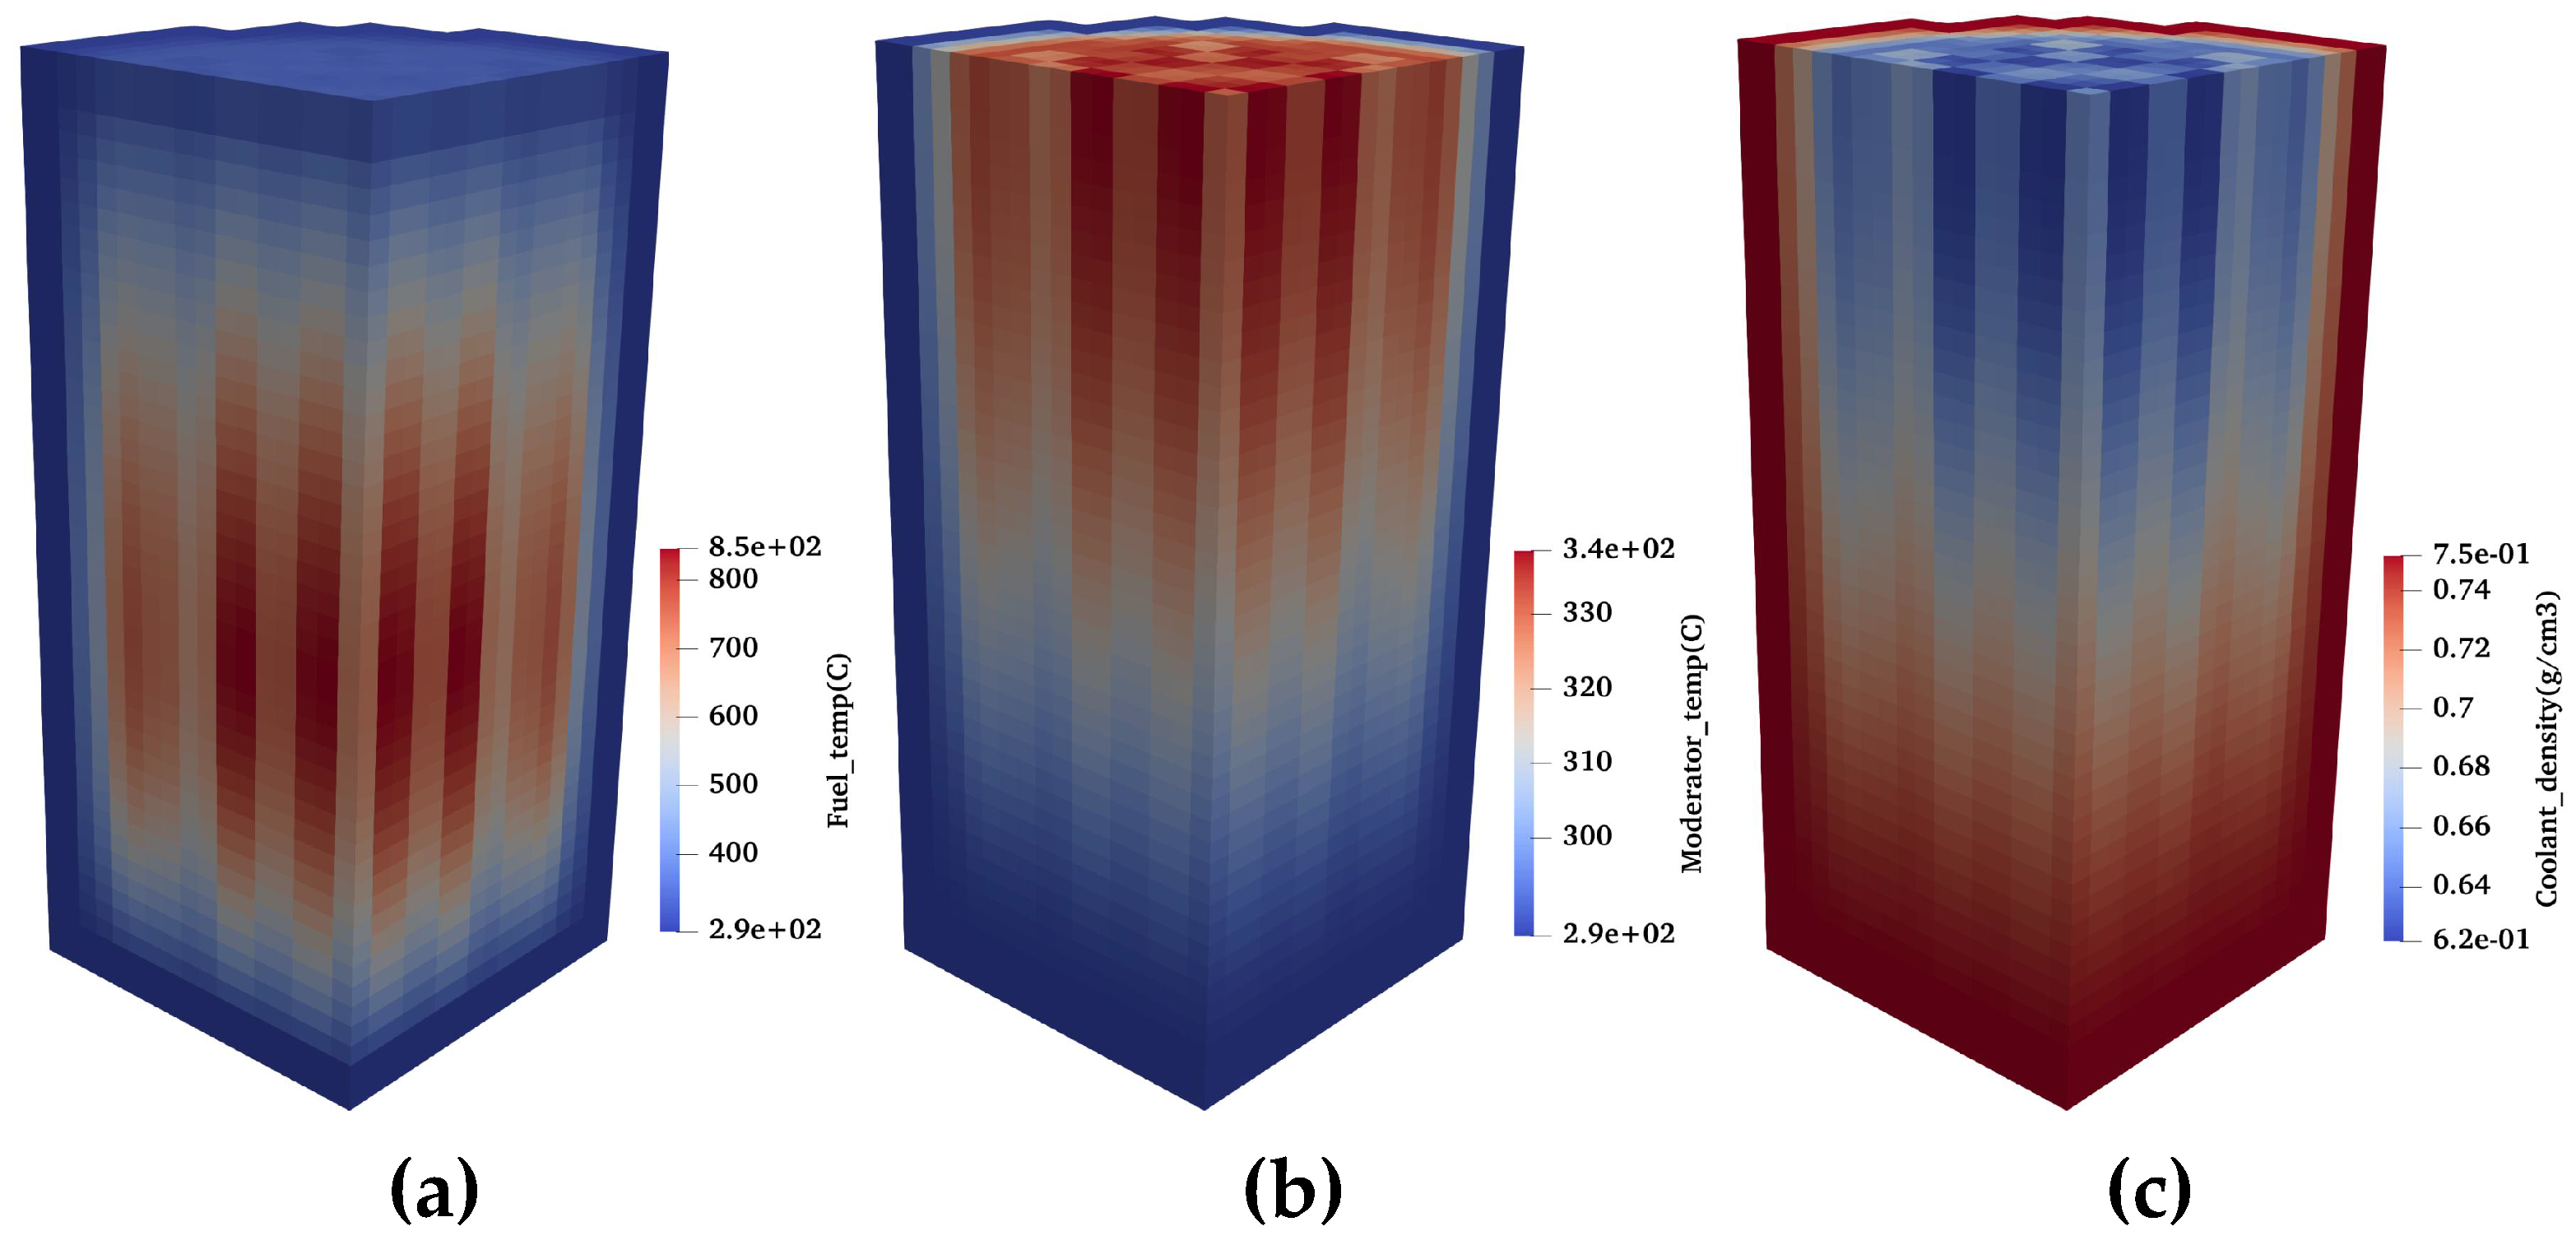
Figure 12.
Evolution profiles of the normalized power, reactivity (a) and core temperature (b) obtained by the updated TMSR3D compared to those from the reference codes.
Figure 12.
Evolution profiles of the normalized power, reactivity (a) and core temperature (b) obtained by the updated TMSR3D compared to those from the reference codes.
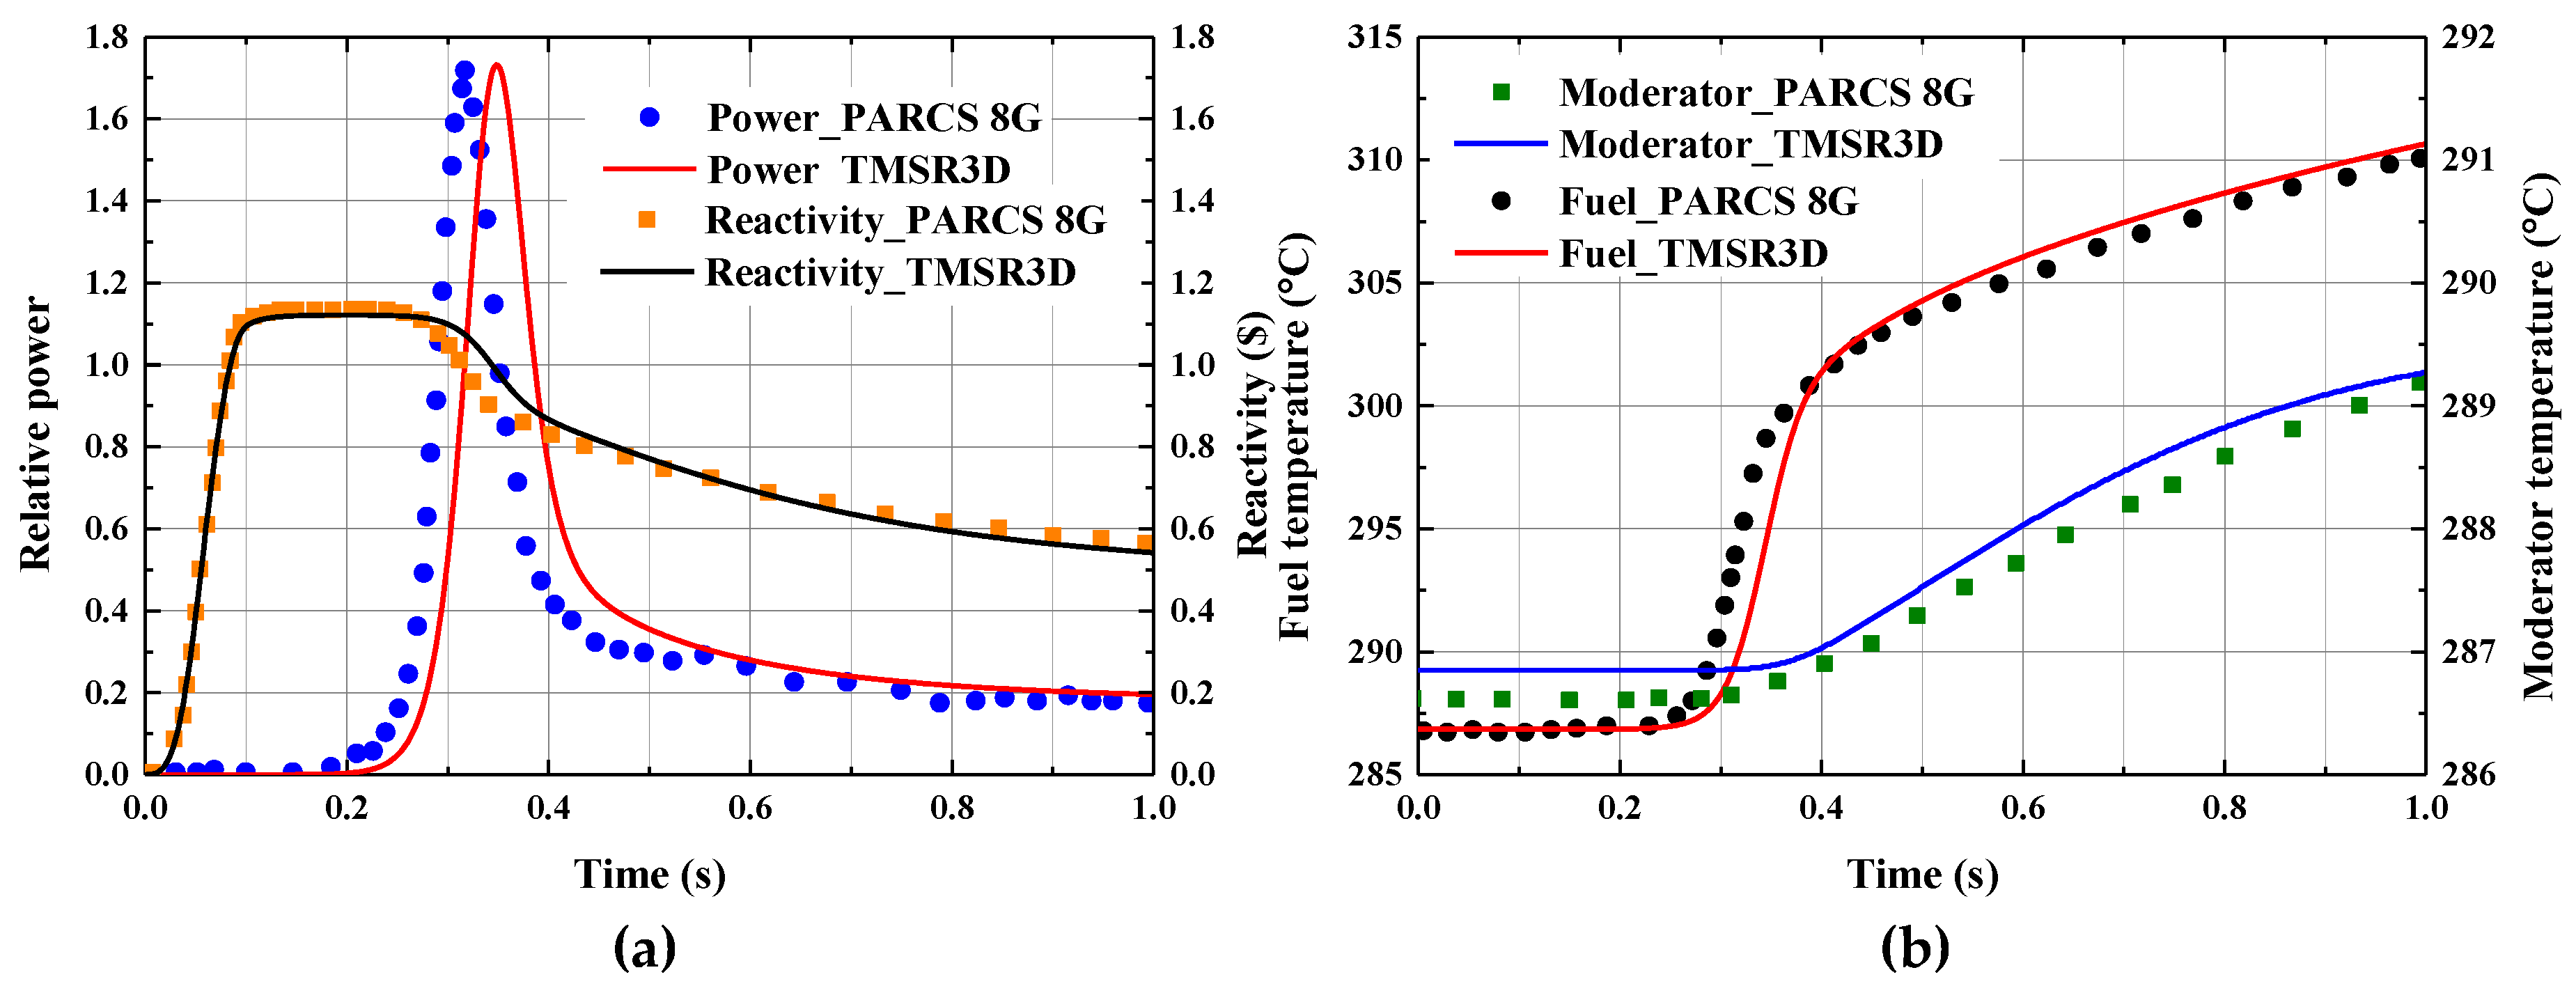

Table 1.
Primary core parameters for the NEACRP 3D PWR benchmark.
| Parameters | Values | Parameters | Values |
|---|---|---|---|
| Thermal power (MW) | 2775 | Clad wall thickness (mm) | 0.571 |
| Inlet temperature (°C) | 286 | Fuel rod pitch (mm) | 12.655 |
| Inlet mass flow rate (kg/s) | 12893 | Inner diameter of guide tube (mm) | 11.448 |
| Fraction of heat deposited in coolant (%) | 1.9 | Outer diameter of guide tube (mm) | 12.259 |
| Fuel pellet diameter (mm) | 8.239 | Fuel pin number/Assembly | 264 |
| Cladding outer diameter (mm) | 9.517 | Guide tube number/Assembly | 25 |
Table 2.
Operation data for the rod ejection transients *.
| Case | Ejected CR Number | Work Condition | Position of Ejected Rod (Steps) | |
|---|---|---|---|---|
| Initial | Final | |||
| A1 | 1 (central) | HZP | 0 | 228 |
| A2 | 1 (central) | HFP | 100 | 228 |
| B1 | 4 (peripheral) | HZP | 0 | 228 |
| B2 | 4 (peripheral) | HFP | 150 | 228 |
| C1 | 1 (Full core) | HZP | 0 | 228 |
| C2 | 1 (Full core) | HFP | 100 | 228 |
* The maximal number of steps is 228, 0 means the CR is entirely inserted.
Table 3.
TMSR3D results for the NEACRP 3D PWR at steady state compared against benchmark results.
| Cases | A1 | A2 | B1 | B2 | C1 | C2 |
|---|---|---|---|---|---|---|
| Reactor conditions | HZP | HFP | HZP | HFP | HZP | HFP |
| Critical Boron Concentration (ppm) | ||||||
| PANTHER | 561.20 | 1156.63 | 1247.98 | 1183.83 | 1128.29 | 1156.63 |
| TMSR3D | 560.53 | 1156.14 | 1247.38 | 1184.54 | 1127.69 | 1156.06 |
| Relative Error (%) | −0.119 | -0.042 | −0.048 | 0.060 | −0.053 | -0.049 |
| Maximal power peaking factor | ||||||
| PANTHER | 2.8792 | 2.2073 | 1.9330 | 2.0954 | 2.1867 | 2.2073 |
| TMSR3D | 2.8467 | 2.2171 | 1.8853 | 2.0688 | 2.1729 | 2.2690 |
| Relative Error (%) | −1.129 | 0.444 | -2.468 | −1.269 | −0.631 | 2.795 |
| Reactivity introduced by control rod ejection (pcm) | ||||||
| PANTHER | 824.31 | 91.58 | 826.18 | 99.45 | 949.09 | 79.23 |
| TMSR3D | 820.12 | 91.32 | 822.97 | 94.11 | 944.10 | 80.93 |
| Relative Error (%) | -0.508 | −0.284 | −0.389 | −5.370 | −0.526 | 2.146 |
Table 4.
Primary design parameters of the MOX/UO2 core.
| Parameters | Values | Parameters | Values |
|---|---|---|---|
| Core power (MWt) | 3565 | Core pressure (Mpa) | 15.5 |
| Inlet temperature (°C) | 286.85 | Guide tubes per assembly | 25 |
| Inlet mass flow rate (kg/s) | 15849.4 | Active fuel length (cm) | 365.76 |
| Fuel lattice, fuel rods per assembly | 17 ×17, 264 | Assembly pitch (cm) | 21.42 |
| Number of fuel assemblies | 193 | Pin pitch (cm) | 1.26 |
Table 5.
and total worth of control rods *.
| Code | Total CR worth (pcm) | Error (%) | ||
|---|---|---|---|---|
| ARI | ARO | |||
| DeCART | 0.987430 | 1.058520 | 6801 | / |
| PARCS 2G | 0.991536 | 1.063786 | 6850 | 0.710 |
| CITATION | 0.988785 | 1.060337 | 6825 | 0.339 |
| TMSR3D | 0.991535 | 1.063782 | 6849 | 0.706 |
* PARCS 2G means PARCS code with 2 neutron energy groups, similarly hereinafter.
Table 6.
Comparison of core averaged TH parameters and critical Boron concentration.
| Code | Core Critical Boron Concent. (ppm) |
Core Average TH Properties | ||||
|---|---|---|---|---|---|---|
| Fuel | Coolant | Coolant | Outlet Cool. | Outlet Cool. | ||
| Temp. | Density | Temp. | Density | Temp. | ||
| (°C) | (g/cm3) | (°C) | (g/cm3) | (°C) | ||
| PARCS 2G | 1679 | 562.9 | 0.7061 | 308.2 | 0.6621 | 325.7 |
| PARCS 4G | 1674 | 563.0 | 0.7061 | 308.2 | 0.6621 | 325.7 |
| PARCS 8G | 1672 | 563.1 | 0.7061 | 308.2 | 0.6621 | 325.7 |
| SKETCH | 1675 | 563.5 | 0.7055 | 307.8 | 0.6596 | 325.8 |
| TMSR3D | 1673 | 562.8 | 0.7057 | 308.1 | 0.6615 | 325.5 |
Table 7.
Peak power, time, reactivity and obtained from the updated TMSR3D in comparison to those from reference codes.
Table 7.
Peak power, time, reactivity and obtained from the updated TMSR3D in comparison to those from reference codes.
| Code | Peak Power (%) | Peak Time (s) | Peak Reactivity ($) | (pcm) |
|---|---|---|---|---|
| PARCS 2G | 142 | 0.34 | 1.12 | 579 |
| PARCS 4G | 152 | 0.33 | 1.12 | 579 |
| PARCS 8G | 172 | 0.32 | 1.14 | 580 |
| SKETCH | 144 | 0.34 | 1.12 | 579 |
| TMSR3D | 173 | 0.35 | 1.12 | 580 |
Disclaimer/Publisher’s Note: The statements, opinions and data contained in all publications are solely those of the individual author(s) and contributor(s) and not of MDPI and/or the editor(s). MDPI and/or the editor(s) disclaim responsibility for any injury to people or property resulting from any ideas, methods, instructions or products referred to in the content. |
© 2024 by the authors. Licensee MDPI, Basel, Switzerland. This article is an open access article distributed under the terms and conditions of the Creative Commons Attribution (CC BY) license (http://creativecommons.org/licenses/by/4.0/).
Copyright: This open access article is published under a Creative Commons CC BY 4.0 license, which permit the free download, distribution, and reuse, provided that the author and preprint are cited in any reuse.


