1. Introduction
The stability of slopes is a critical challenge in various civil engineering projects, such as embankments [
1], cut-slopes, landfills [
2], dams, transportation infrastructure [
3], and riverbank restoration [
1,
4]. Geosynthetic materials for erosion control have demonstrated their effectiveness in improving shallow slope stability. These materials can reinforce the topsoil, increasing its shear strength and reducing the risk of shallow slope failures. Alongside the use of geosynthetics for erosion control, the use of vegetation in slope stabilization systems has gained increasing attention. Through their extensive root systems, living plants can stabilize shallow slopes [
5] and offer sustainable, long-term solutions. Researchers have explored the synergistic relationship between geosynthetics and living plants, recognizing the potential to create a comprehensive and sustainable approach to slope stabilization.
Ecological slope protection not only has the function of traditional slope protection; it also integrates various aspects such as landscape, culture, and ecology, thereby achieving the maintenance and restoration of natural ecosystems [
6]. The roots of plants developed on the entire slope generate both hydrological and mechanical effects, contributing to erosion protection and slope stabilization of the complex as a whole [
7]. Also, it is considered that this practice is strongly dominated by empiricism [
4].
Tension-bearing plant roots infiltrate soil pores, enhancing the shear strength of the soil-root matrix. In past decades, mechanical root reinforcement has been extensively quantified experimentally and analytically, and this effect is usually included in slope stability calculations [
8].
In civil and environmental engineering projects, geosynthetic materials for erosion control are often essential during construction to mitigate soil loss and prevent sediment runoff in the short and long term to support the growth and maintenance of dense vegetation. This vegetation, after a period, protects slopes from splash and sheet erosion, thereby effectively preventing the formation of rill erosion [
9].
Water-induced erosion degrades soil quality, leading to reduced crop yields. Understanding how crop yields respond to soil erosion is crucial for evaluating agriculture's susceptibility to such degradation. Research conducted by [
10] suggests that quantifying the reduction in crop yields due to erosion is a challenging topic. Soil erosion occurs when topsoil is displaced by natural forces such as wind and water [
11]. The erosion process increases with greater soil exposure, especially during rain or windstorms. When topsoil is lost, the soil's most nutrient-dense layer is removed, leading to a decline in overall soil quality.
Additionally, many studies investigate how soil erosion affects soil and plant properties, as well as its impact on associated ecosystem services. Research conducted by [
12] emphasized that soil erosion has profound consequences on the functioning of ecosystems and the services they provide. They recommended soil conservation and ecosystem restoration measures to prevent further degradation and to protect soil, biodiversity, and agricultural productivity. Turcu et al. (2024) point out that plowing in hilly areas can affect soil surface roughness, altering flow rate, water infiltration time, and infiltration and runoff processes [
13].
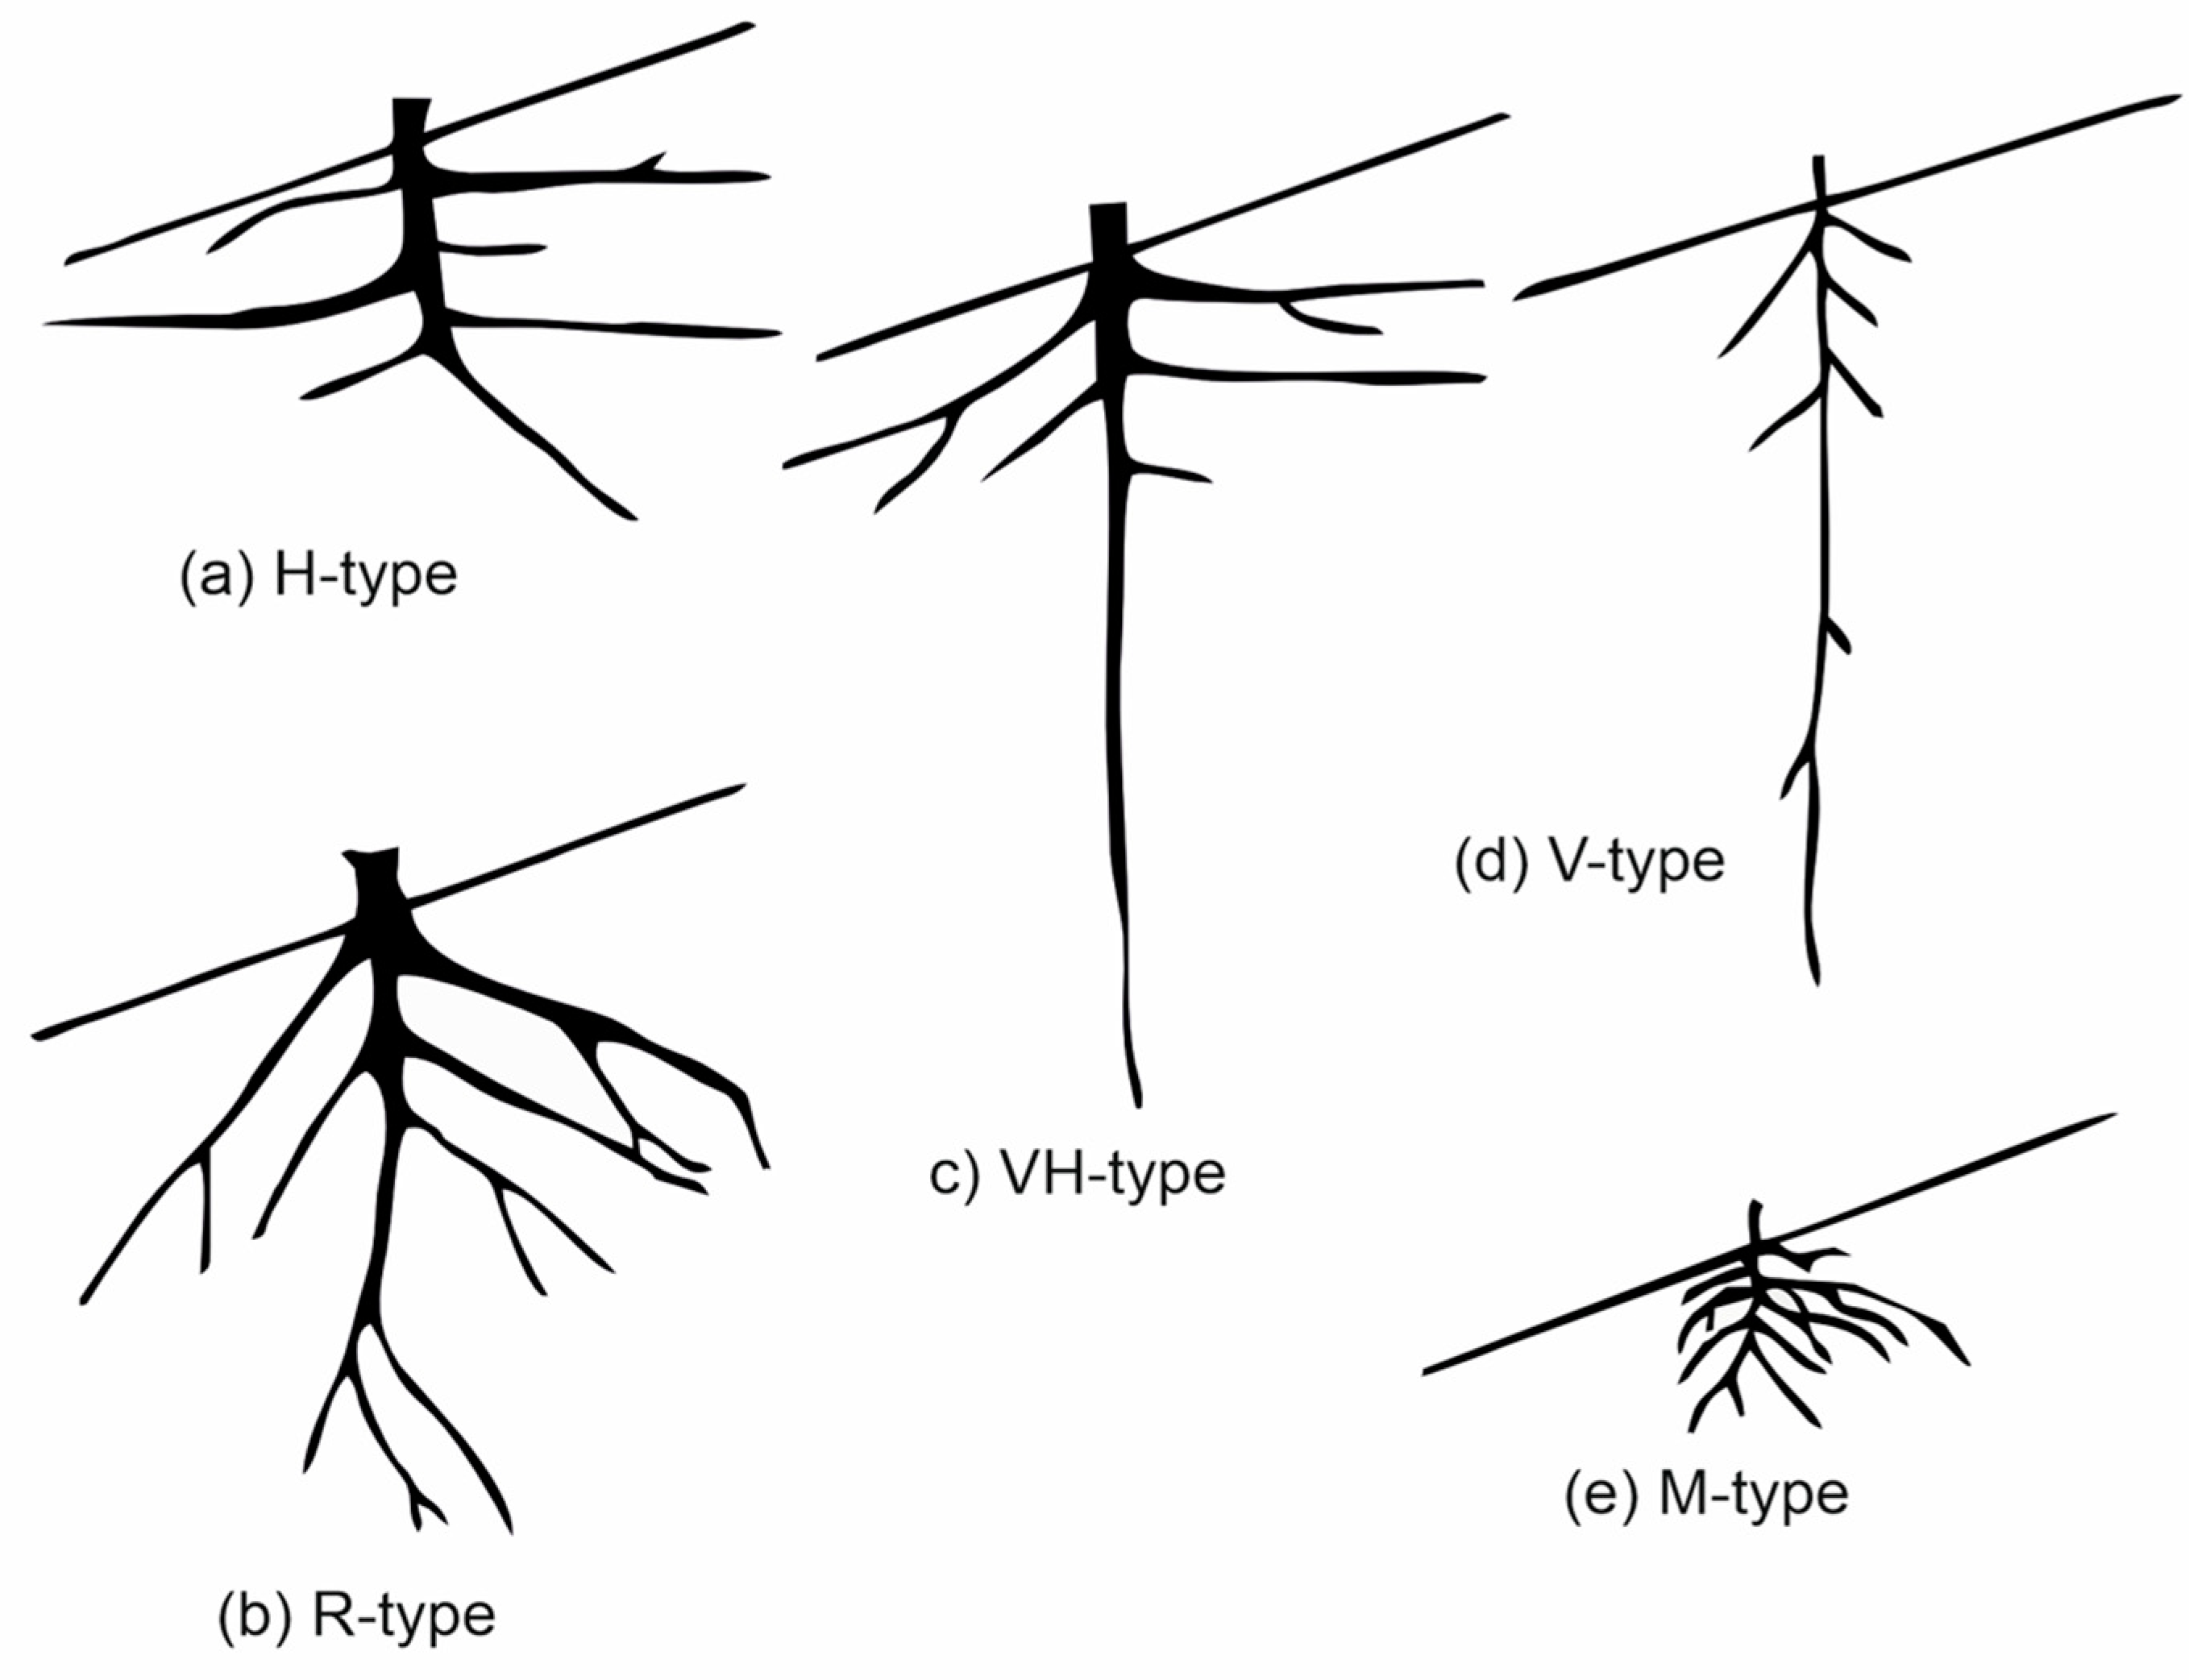
Vegetation affects slope stability and erosion through mechanical and hydrological effects. Yen, cited by Cazzuffi et al., 2014, classified the root structure into five classes based on branching patterns: VH-type, H-type, V-type, R-type, and M-type. The branching pattern scheme was recreated based on Yen's original work and cited by [
14] in
Figure 1. Based on the analysis performed by Yen, he reported that the best roots used for slope stabilization and wind resistance are the H-type and the VH-type patterns.
A study by Mairaing et al., 2024, investigated the significance of root systems of various plant species well known for erosion control benefits and slope stabilization in the highland areas of Thailand. The plants chosen for the research were either native to or well-adapted to Thailand's mountainous regions, recognized for their effectiveness in preventing erosion. These roots provided a strong anchor within the soil, particularly on steep terrains. Additionally, extensive lateral roots contributed to the distribution of forces on the soil surface, which helped prevent surface erosion from water runoff. The study ultimately recommended using plants with robust root systems for rehabilitation and slope stabilization efforts in mountainous areas [
15].
Engineering judgment involves using various methods, including horizontal drains, slope reinforcement techniques, soil hardening measures, surface water management techniques, groundwater control methods, and proper vegetation management [
16], to prevent slope failure under rainfall conditions.
Stabilizing slopes using bioengineering methods is a sustainable approach that limits the negative impact of engineering works; such methods should be implemented and adopted worldwide.
3. Results and Discussions
3.1. Optimum Organic Soil Thickness
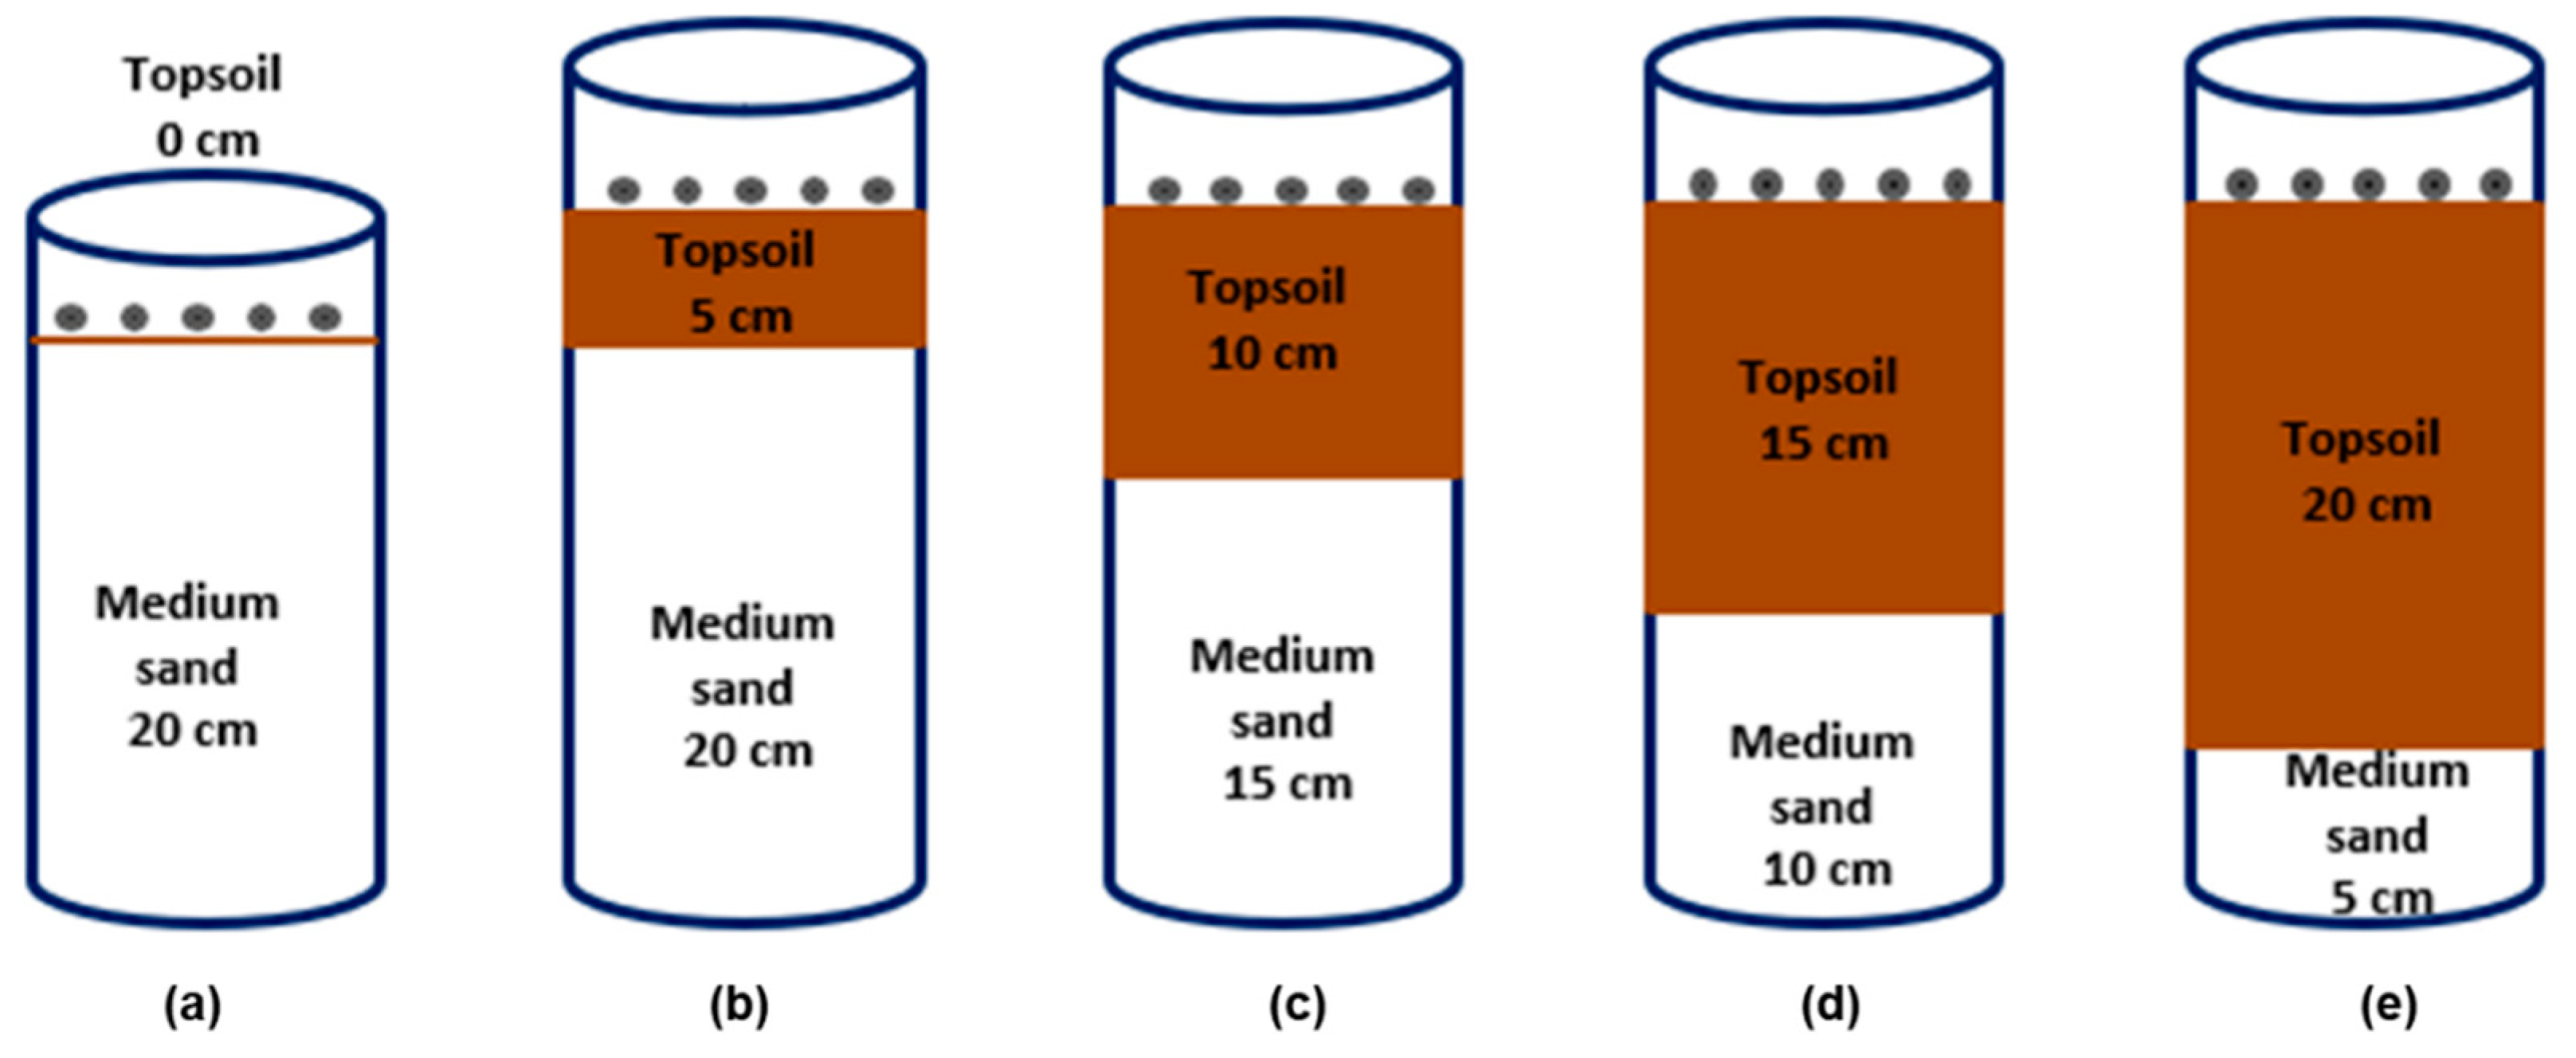
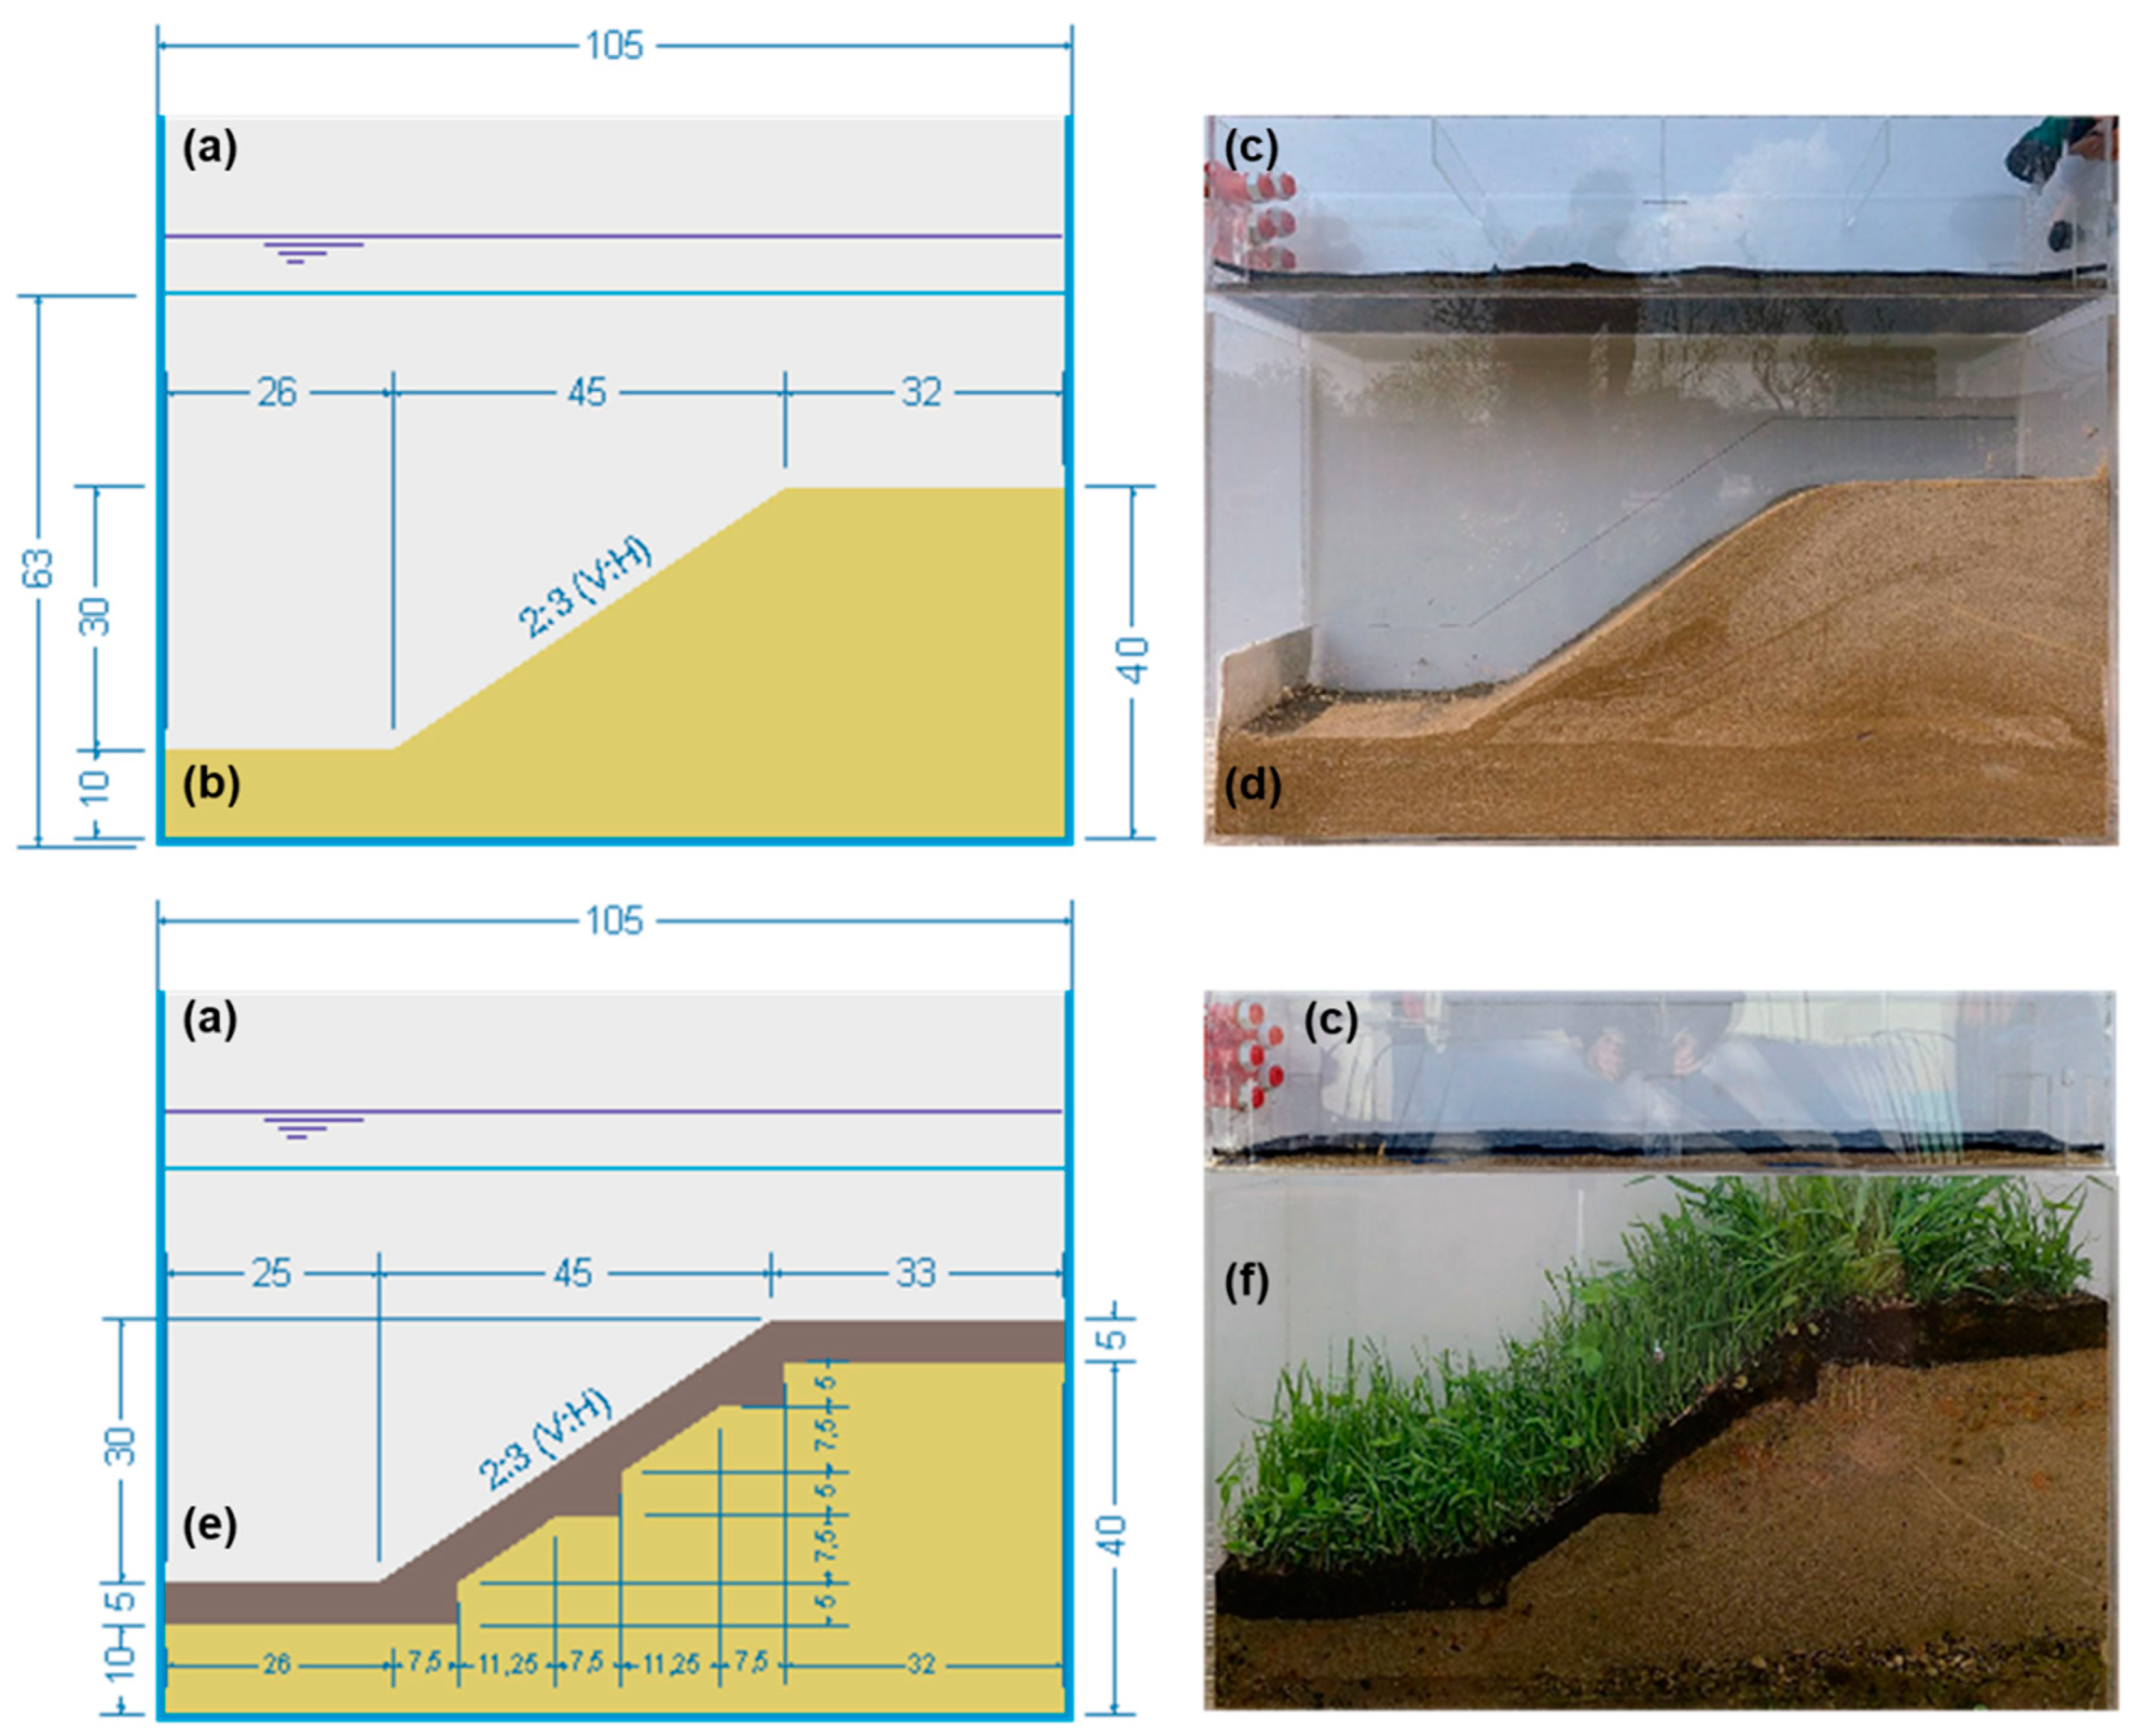
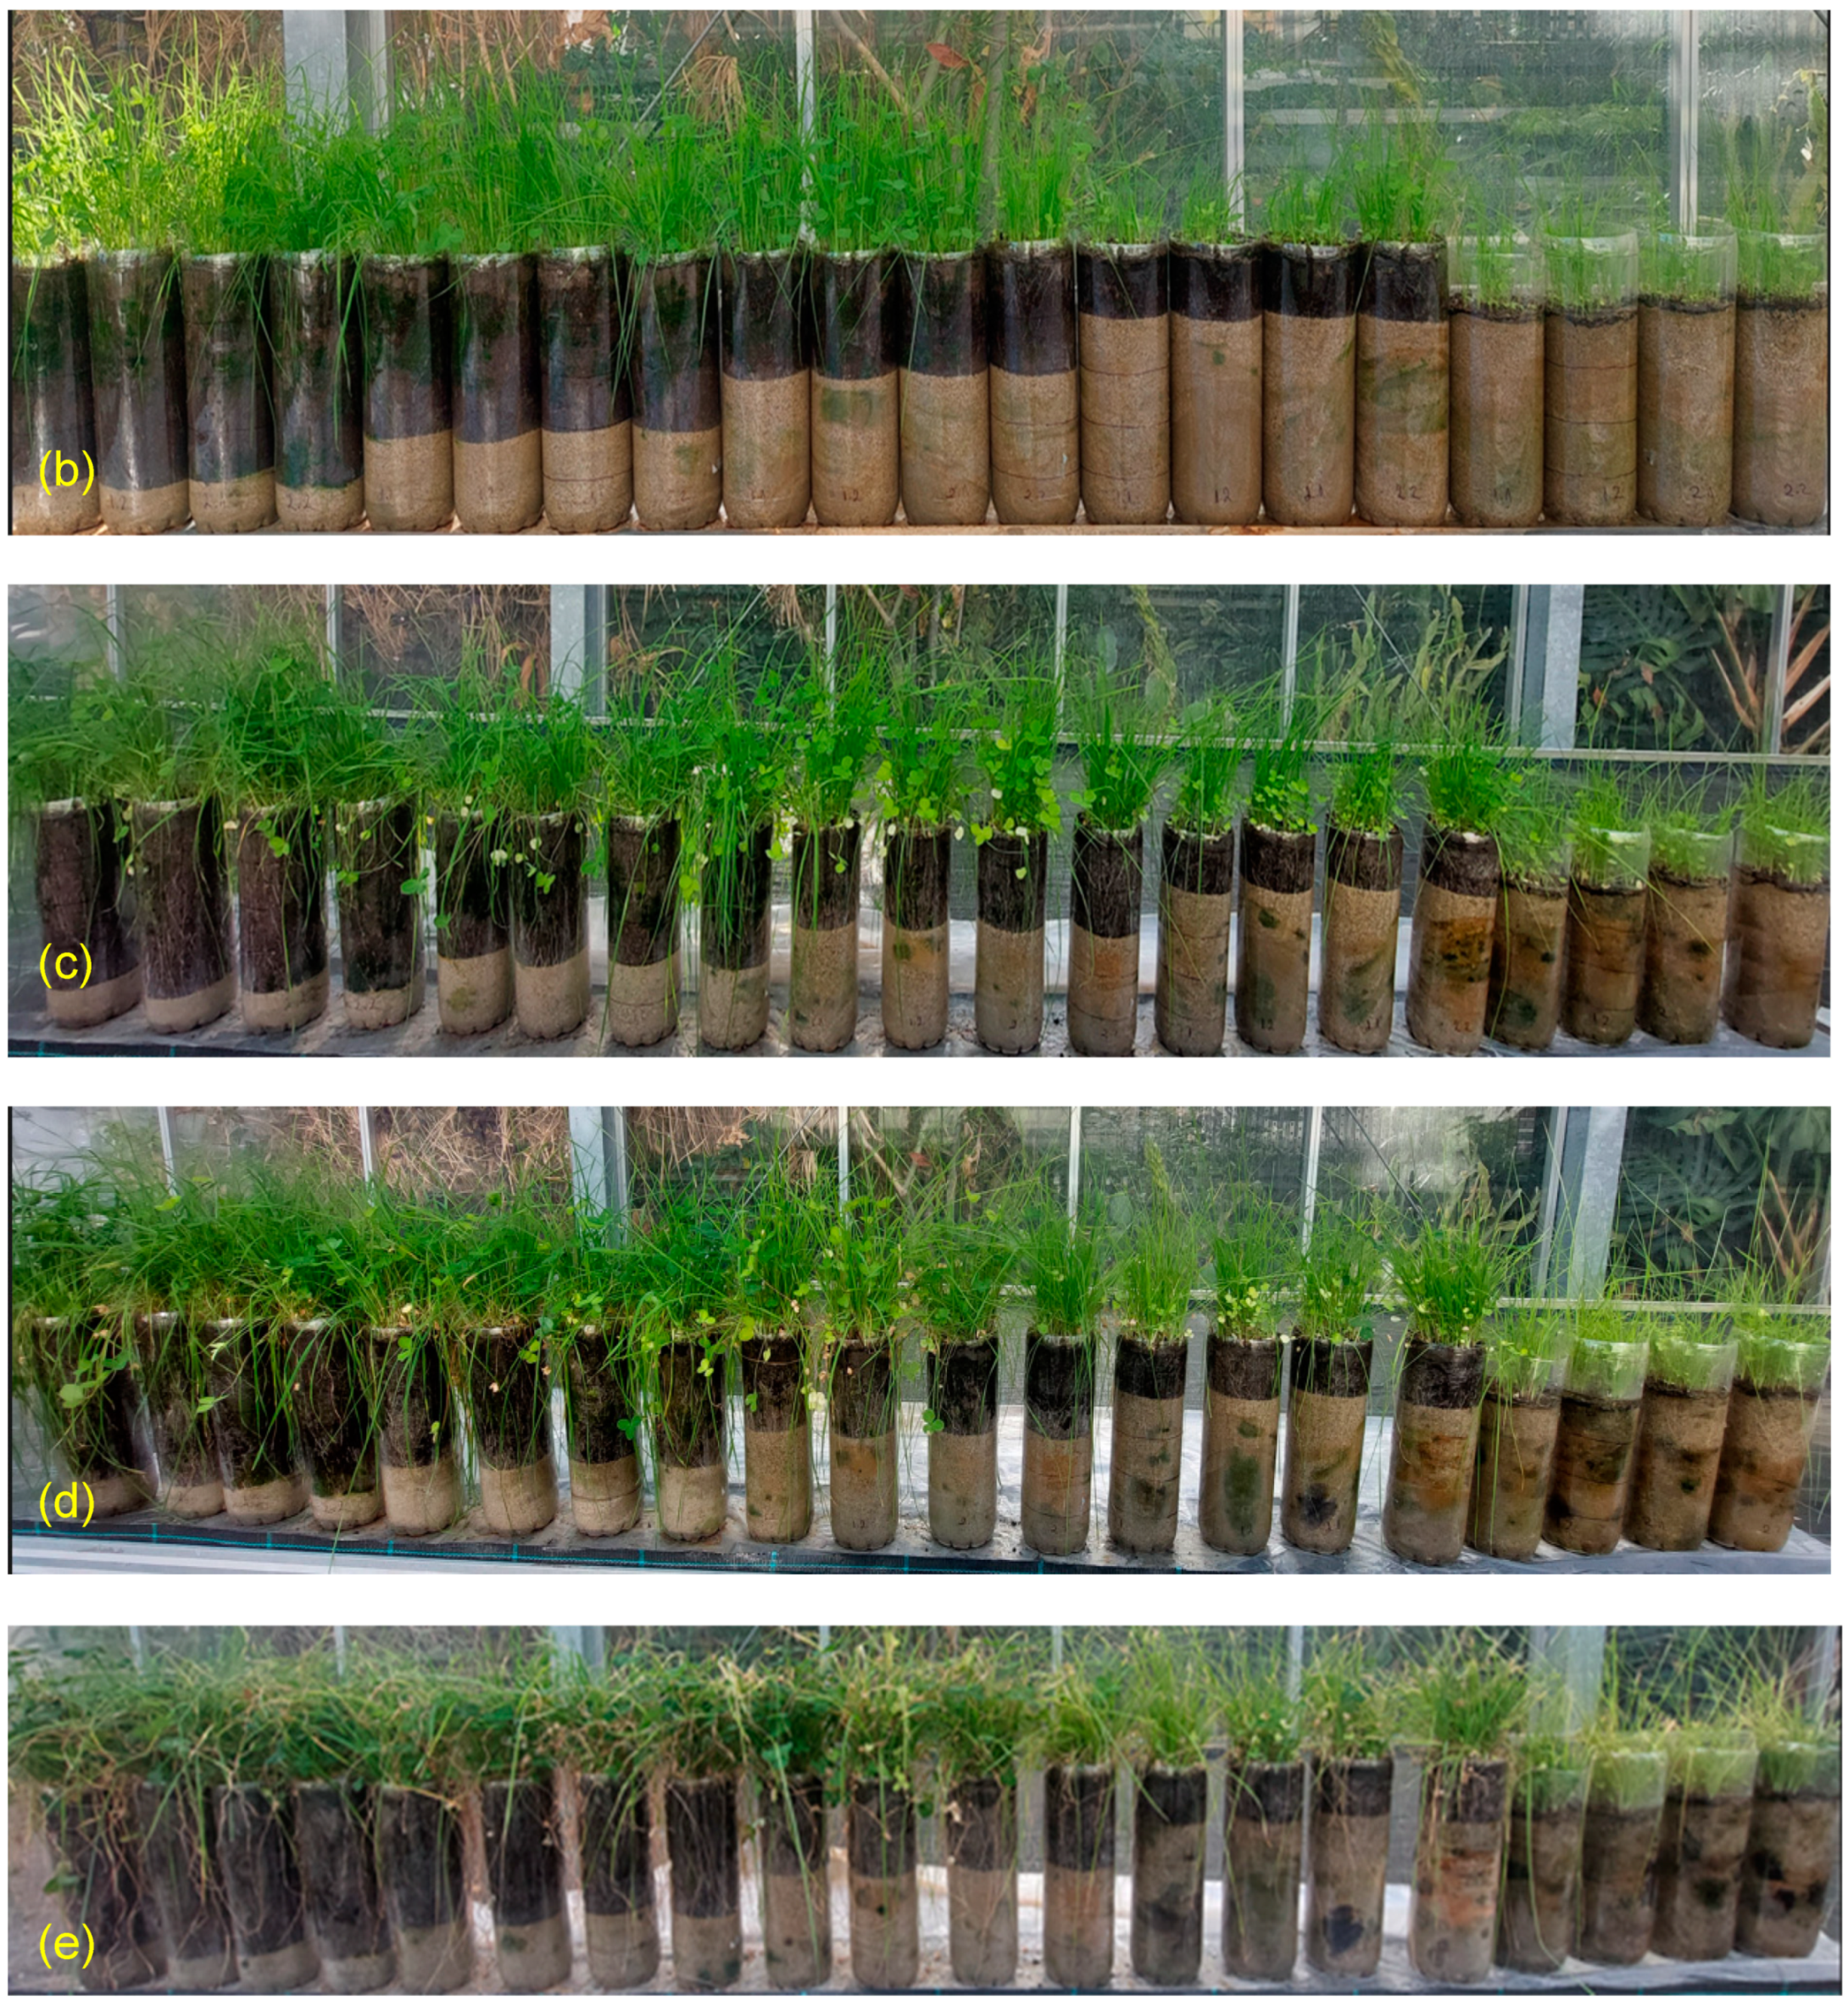
To understand how plants develop in different thicknesses of organic and sandy soil, visual observations were made on the cylinders filled with soil and sown with herbaceous seeds presented in this paper. The tests start on 30.09.2022 by seeding Mix 1 and Mix 2 (in the simple and double number of seeds) cylindrical containers. The seeds germinated after 4 days, on 3 October 2022. Conducting this experimental program is essential for designing and correctly selecting the optimal mixtures to be sown in the erosion control chamber (transparent boxes with a length of 1.05 m, thickness of 0.20 m, and height of 0.63 m), as well as determining the optimal thickness of the OS layer for both the development of the plant root system and the improvement of shear strength parameters for the soil-root system and at the soil-sand interface.
From the sowing until 02.11.2022, the plants were watered with 50 ml of water every 3-4 days. On 02.11.2022, it was observed that the plants were showing slight water stress, and the watering rate was increased to 100 ml for the devices with 20, 15, and 10 cm of topsoil, while it remained at 50 ml for those with 5 and 0 cm of topsoil (
Figure 9). The watering interval remained constant. Starting on 24.11.2022, the watering rate was increased to 150 ml for the devices with 20, 15, and 10 cm of topsoil and 100 ml for those with 5 and 0 cm of topsoil, with the remaining watering interval unchanged.
From visual observations and measurements of growth parameters from 30.09.2022 to 27.02.2023 (170 days), it was concluded that in the cylinders where a double number of seeds was sown, the results are not relevant to the research project because the density of the sprouted plants is too high, causing the plants to crowd each other and preventing proper root development. It was also observed that the plants that developed in the container with 5 cm of topsoil developed roots as strong as the plants developed in thicker layers of topsoil; this led to the conclusion that a layer of 5 cm of topsoil is optimal for the development of plants and their roots.
3.2. Roots Characteristics
Root system development when the OS layer varies between 0 and 20 cm was analyzed.
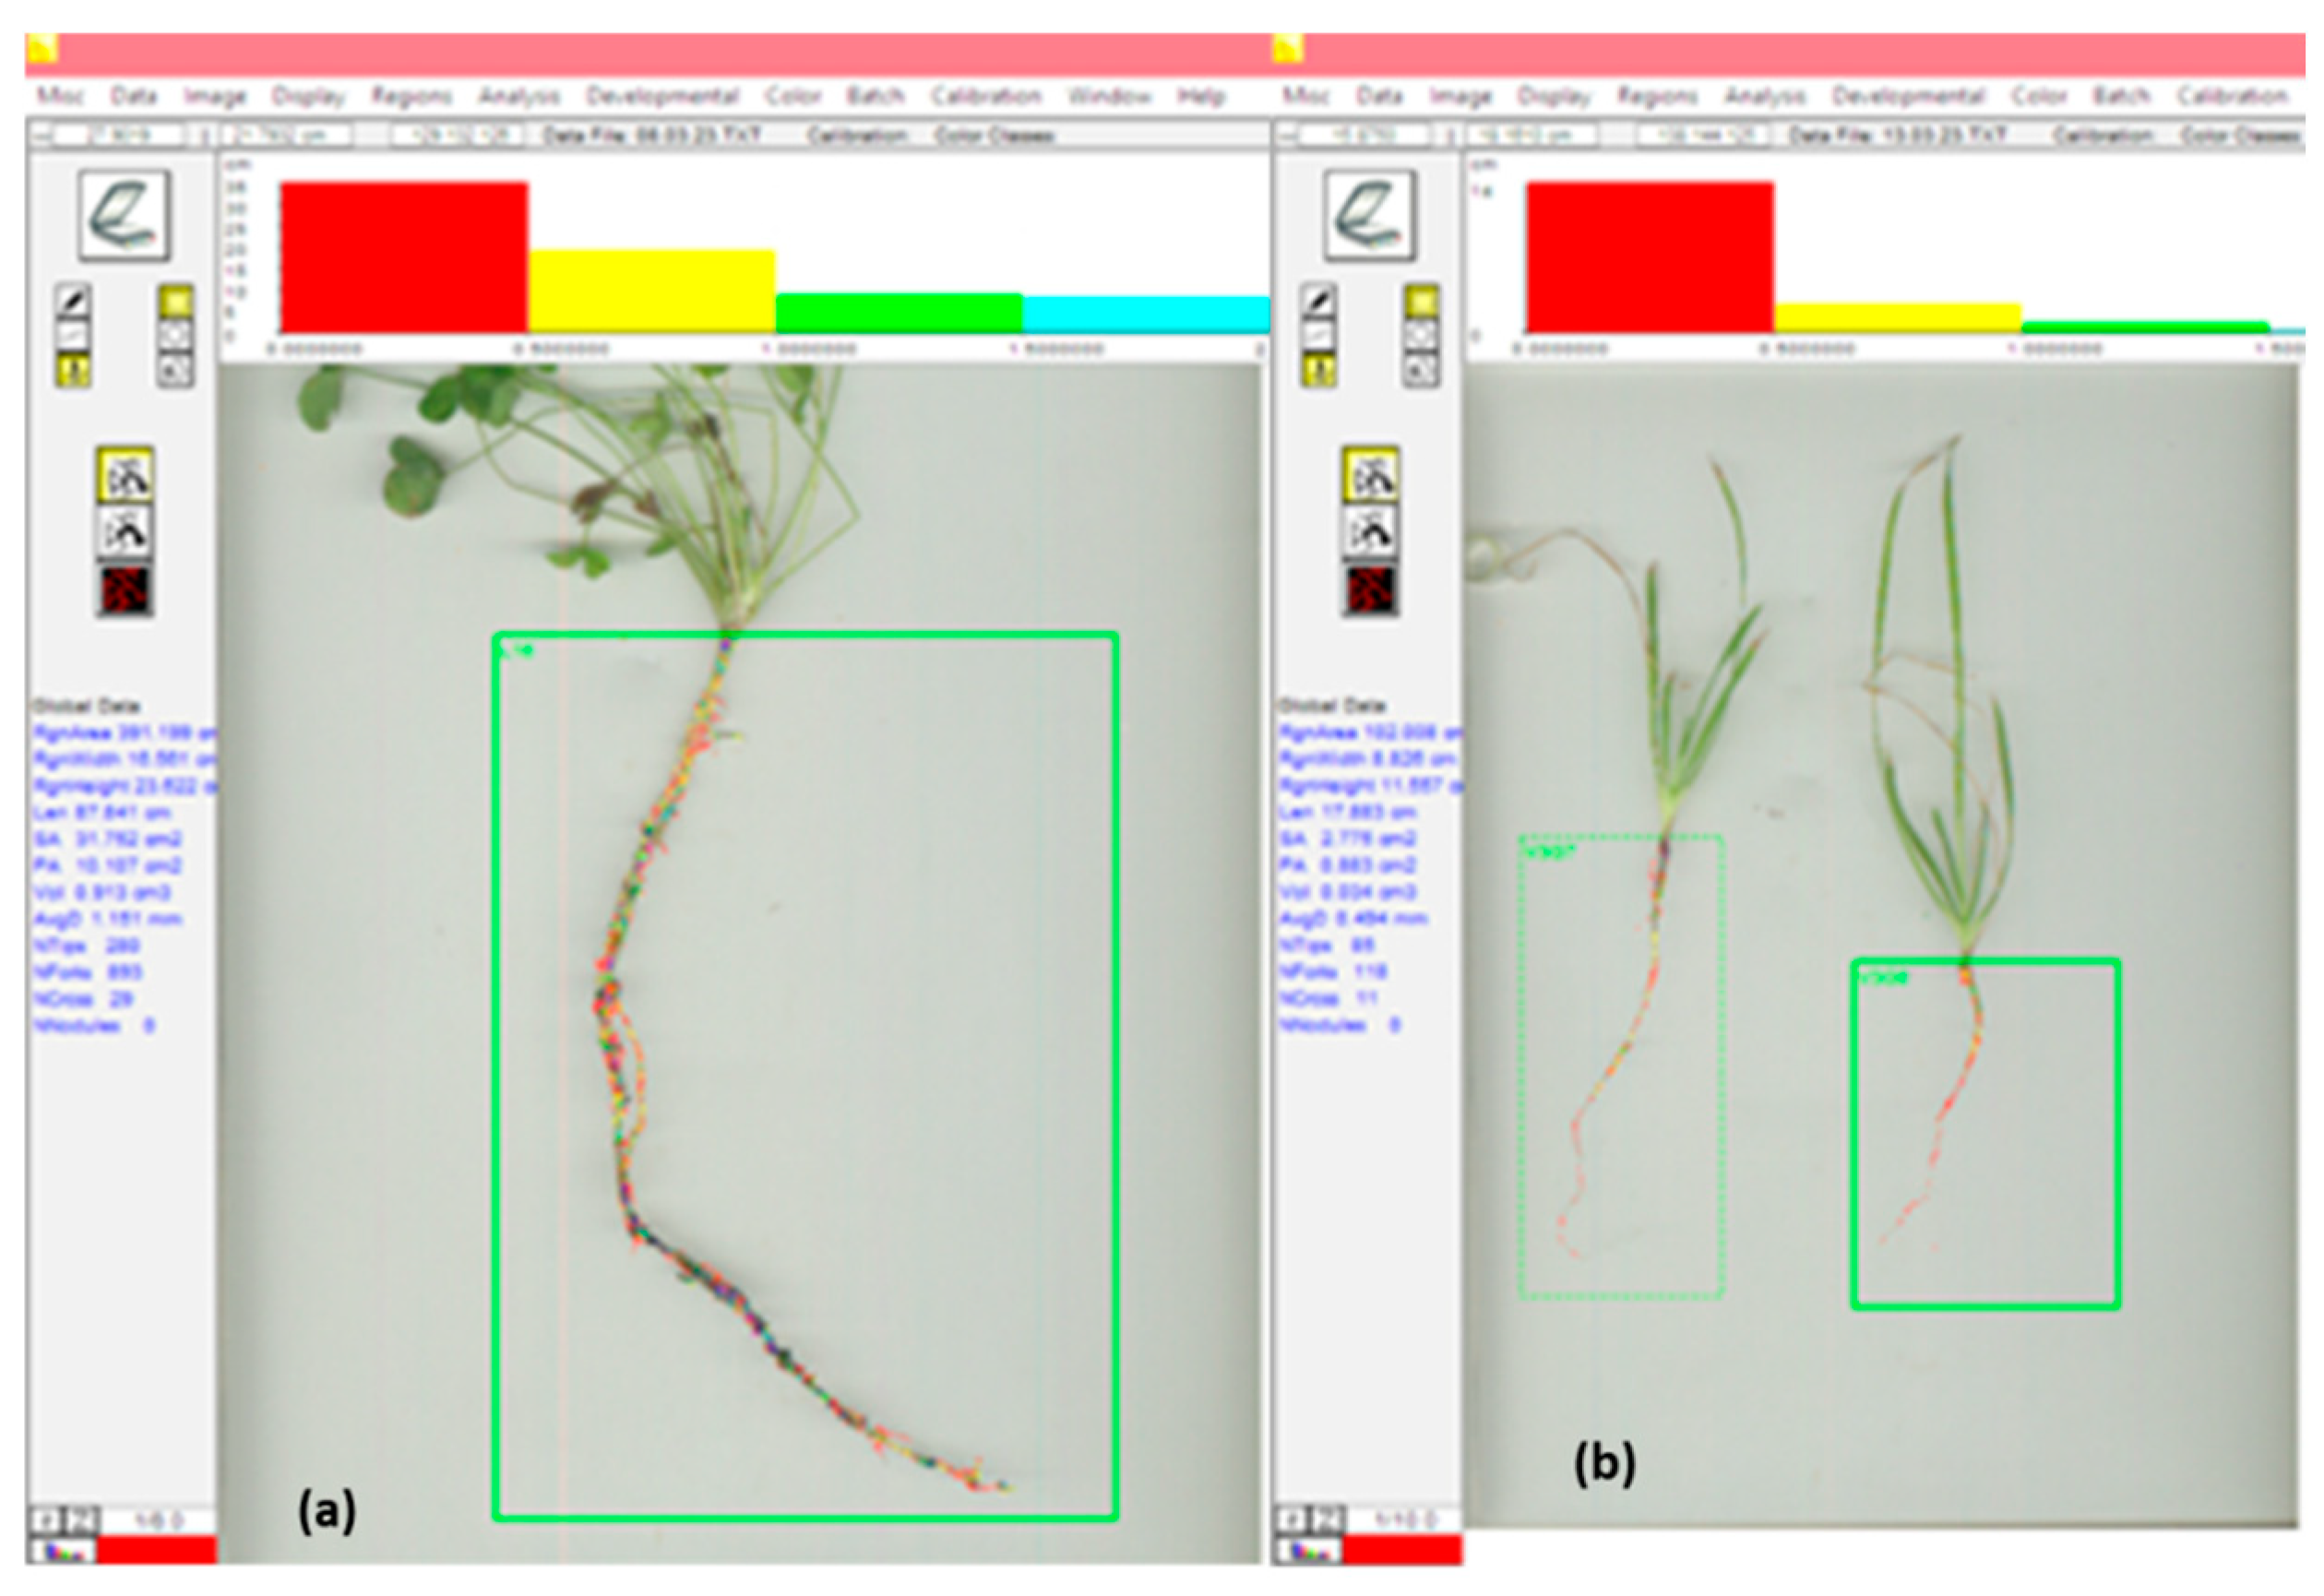
Figure 10 presents a comparison between manually measured root lengths and WinRHIZO measurements.
When we measured the absolute length of the roots, all the variants presented similar values. WinRHIZO measured length showed differences between Gramineae and Leguminous, and its methods considered all the segments, not only the direct line between the starting and ending points of the root systems. Gramineae presented lower values than Leguminous. The Gramineae plants grown in 5 and 10 cm OS layers had lower length values than those grown in 0 and 20 cm, and at Leguminous plants grown in 0 and 10 cm OS layers presented lower root developments (
Figure 10).
WinRHIZO measurements were slightly lower than the manual ones for analyzing the root volume due to the method specificity and digital precision. For Gramineae plants, those grown in 0 and 5 cm OS layers showed slightly lower values than those grown in 10 and 20 cm OS layers. For leguminous plants, those grown in 10 and 20-cm OS layers exhibited lower root development. The results differ from those of Pang et al., 2009 [
24] but are similar to those of Meng-Ben and Qiang, 2009 [
33], which have differences between different volume method measurements.
The density of roots is significant; it has been observed that soil loosening occurs after a specific root density value is reached [
34]. Kaushal et al., 2020, studied the variation in root density at depths of 0–0.90 m for different bamboo species. The study found that bamboo species with higher root densities contributed significantly to soil reinforcement, water retention, and the overall enhancement of soil properties, making them highly effective for soil conservation in the Western Himalayan foothills [
35].
The development of roots in soil is directly influenced by the following soil parameters: particle size, bulk density, pore size and tortuosity, suction and water content, organic matter content, and mineral composition. Simultaneously, the soil alters or improves its properties in the presence of roots based on factors such as root diameter, tensile strength, root type, root architecture, and the number and condition of roots (living or dried roots).
Research conducted on four types of herbaceous species by Gobinath et al., 2020, showed that roots with high tensile strength and good cellulose content act as an excellent reinforcing agent for hill slope stability [
36].
3.3. Shear Strength Characteristics
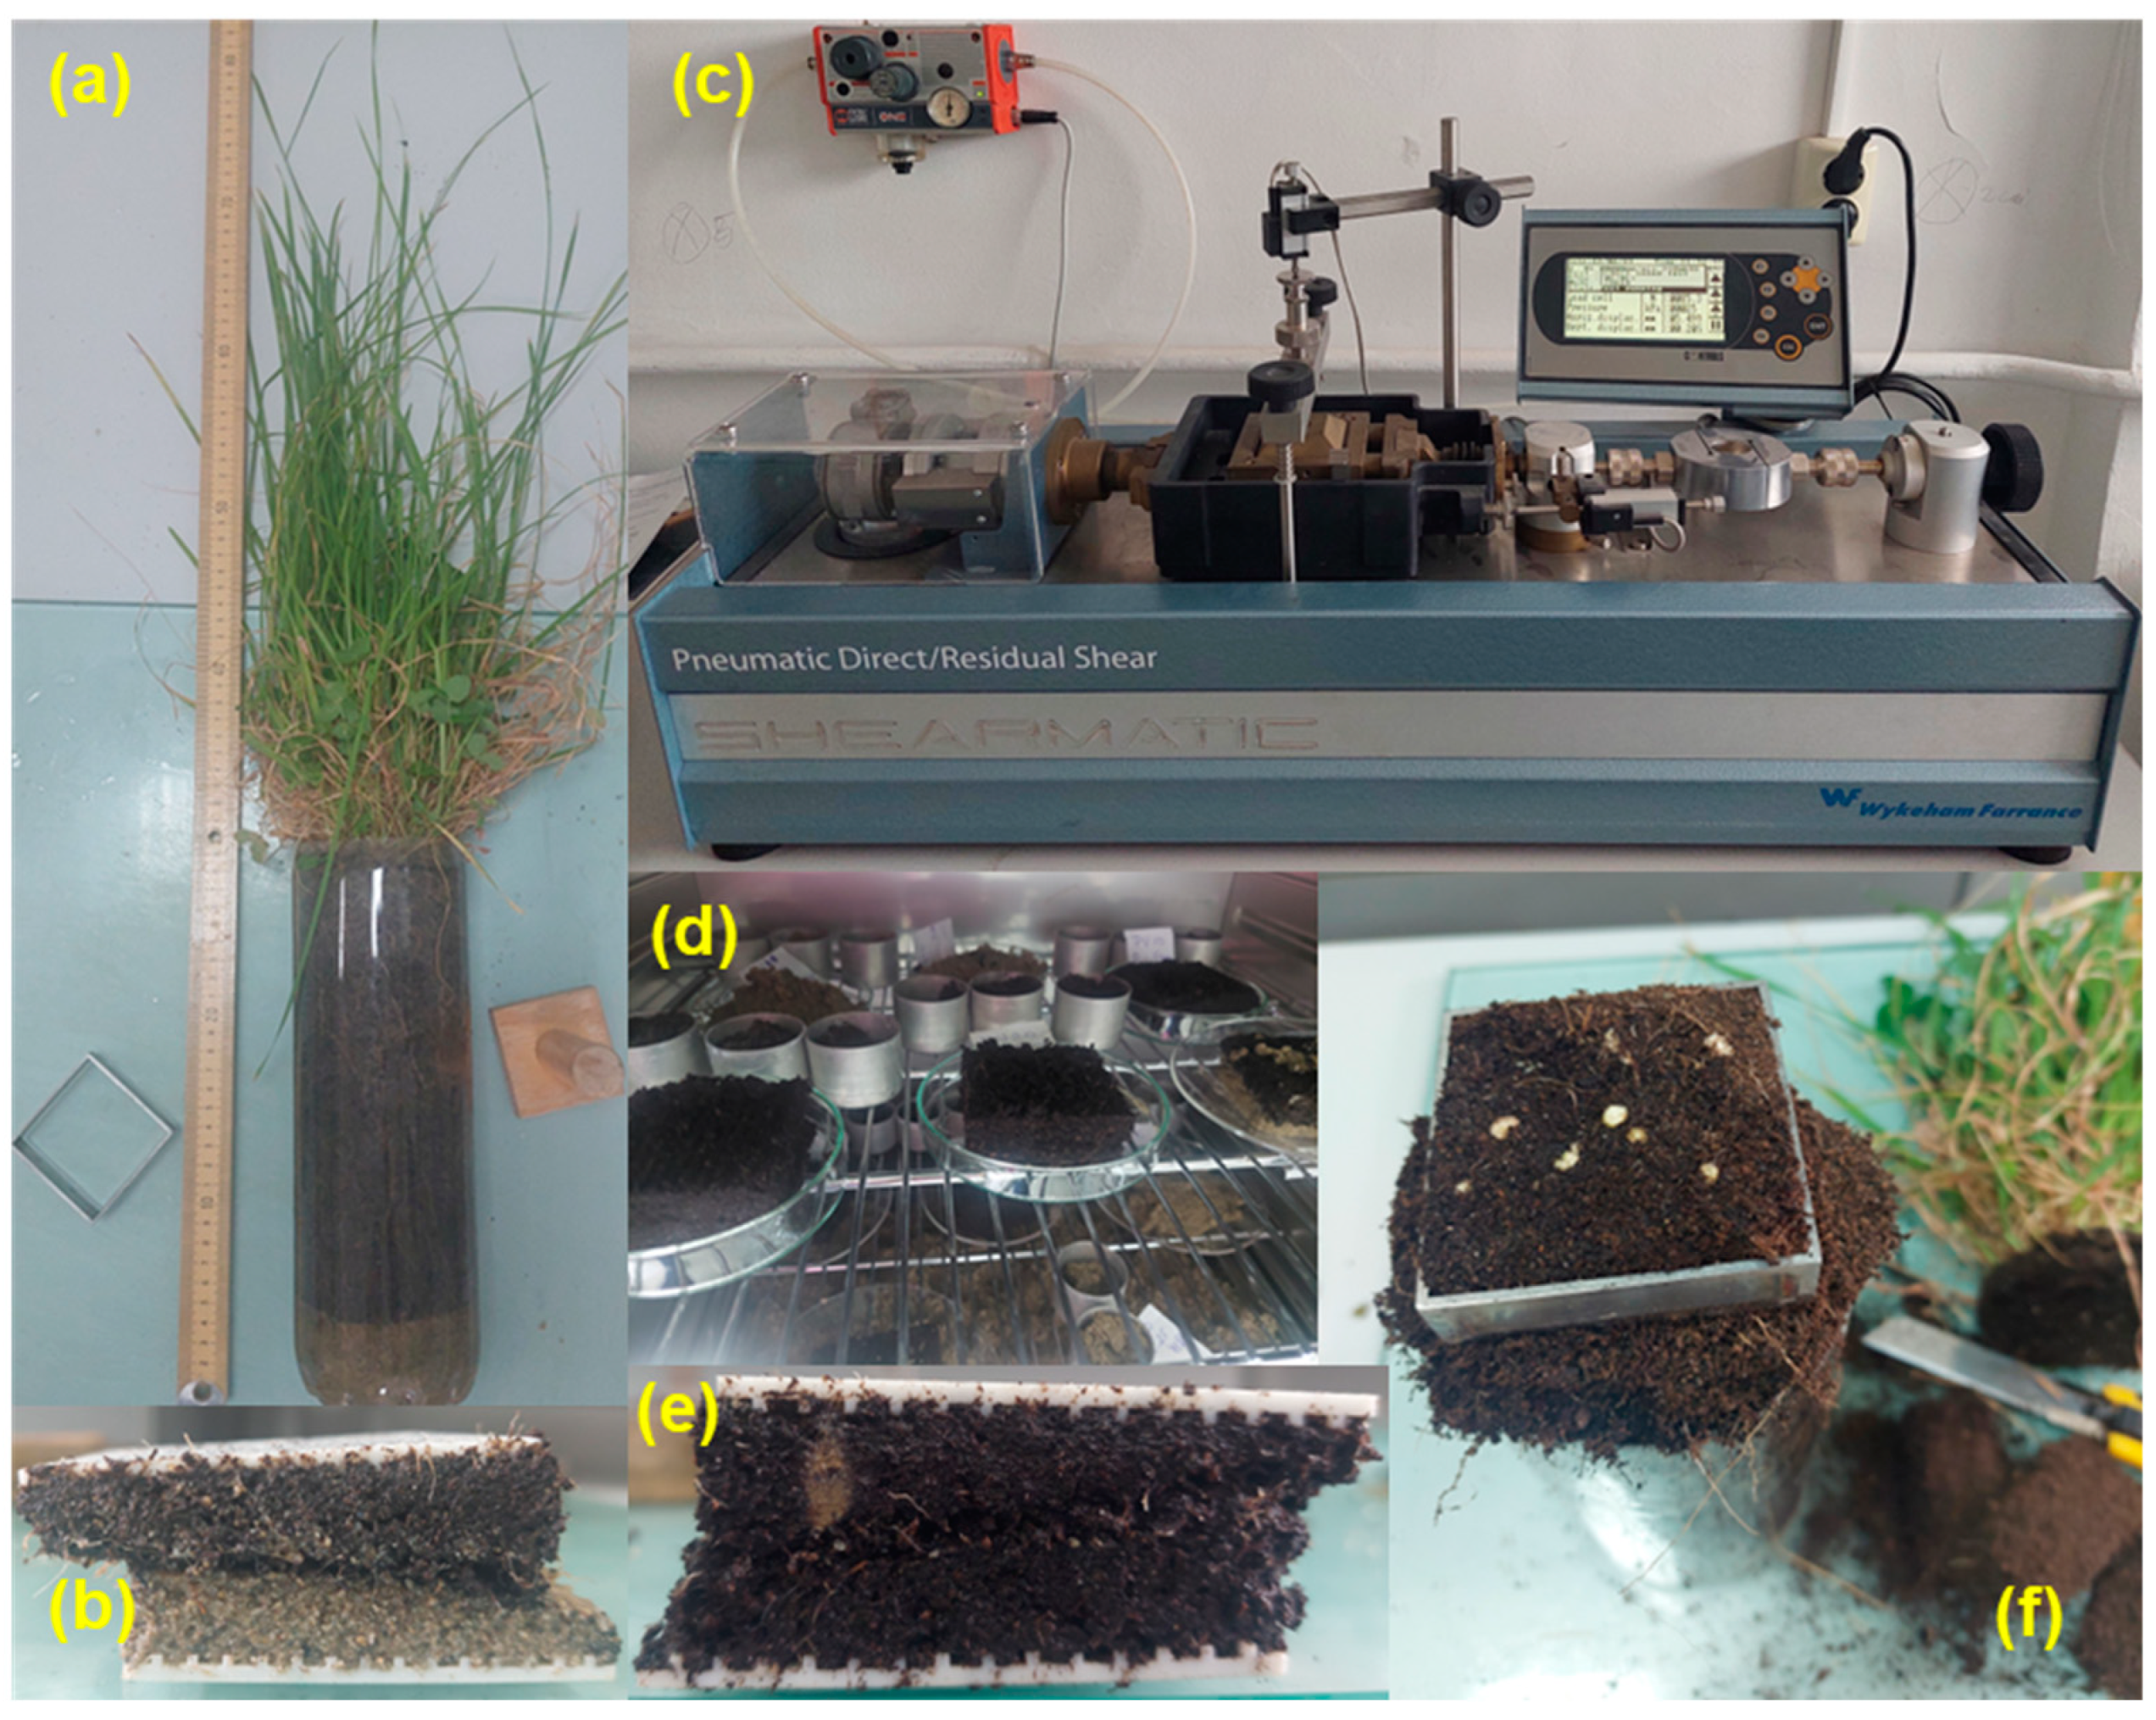
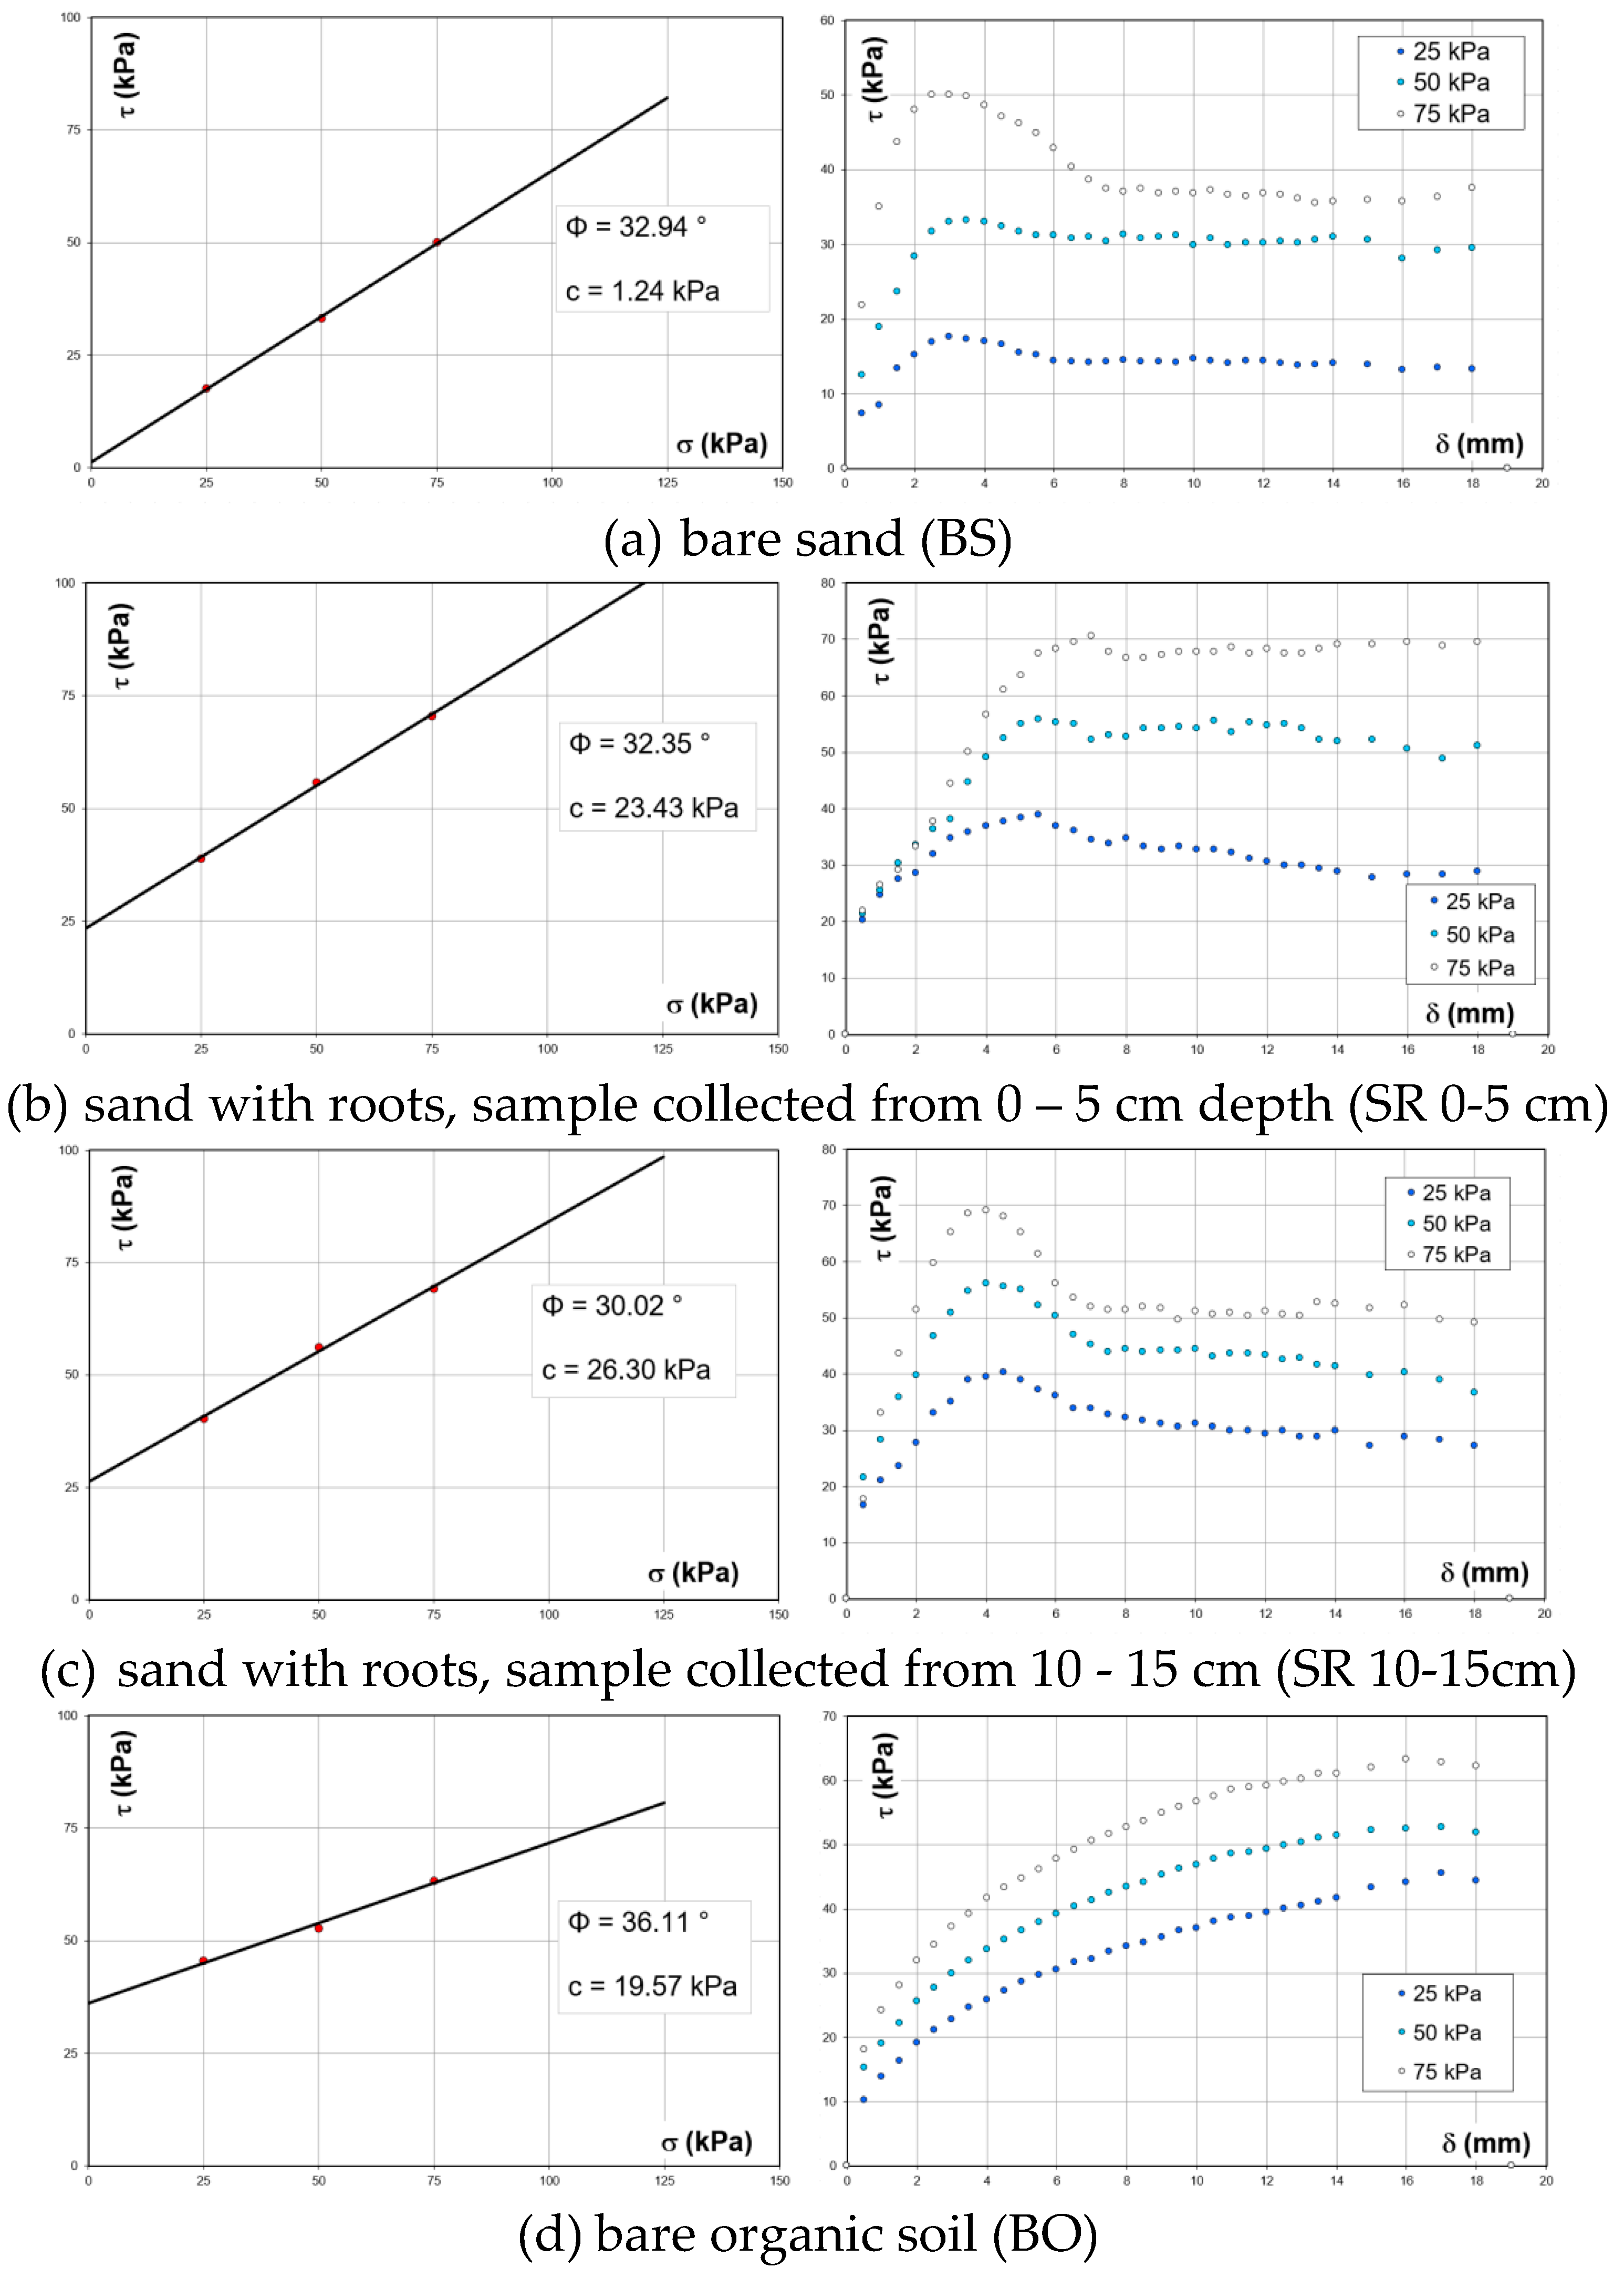
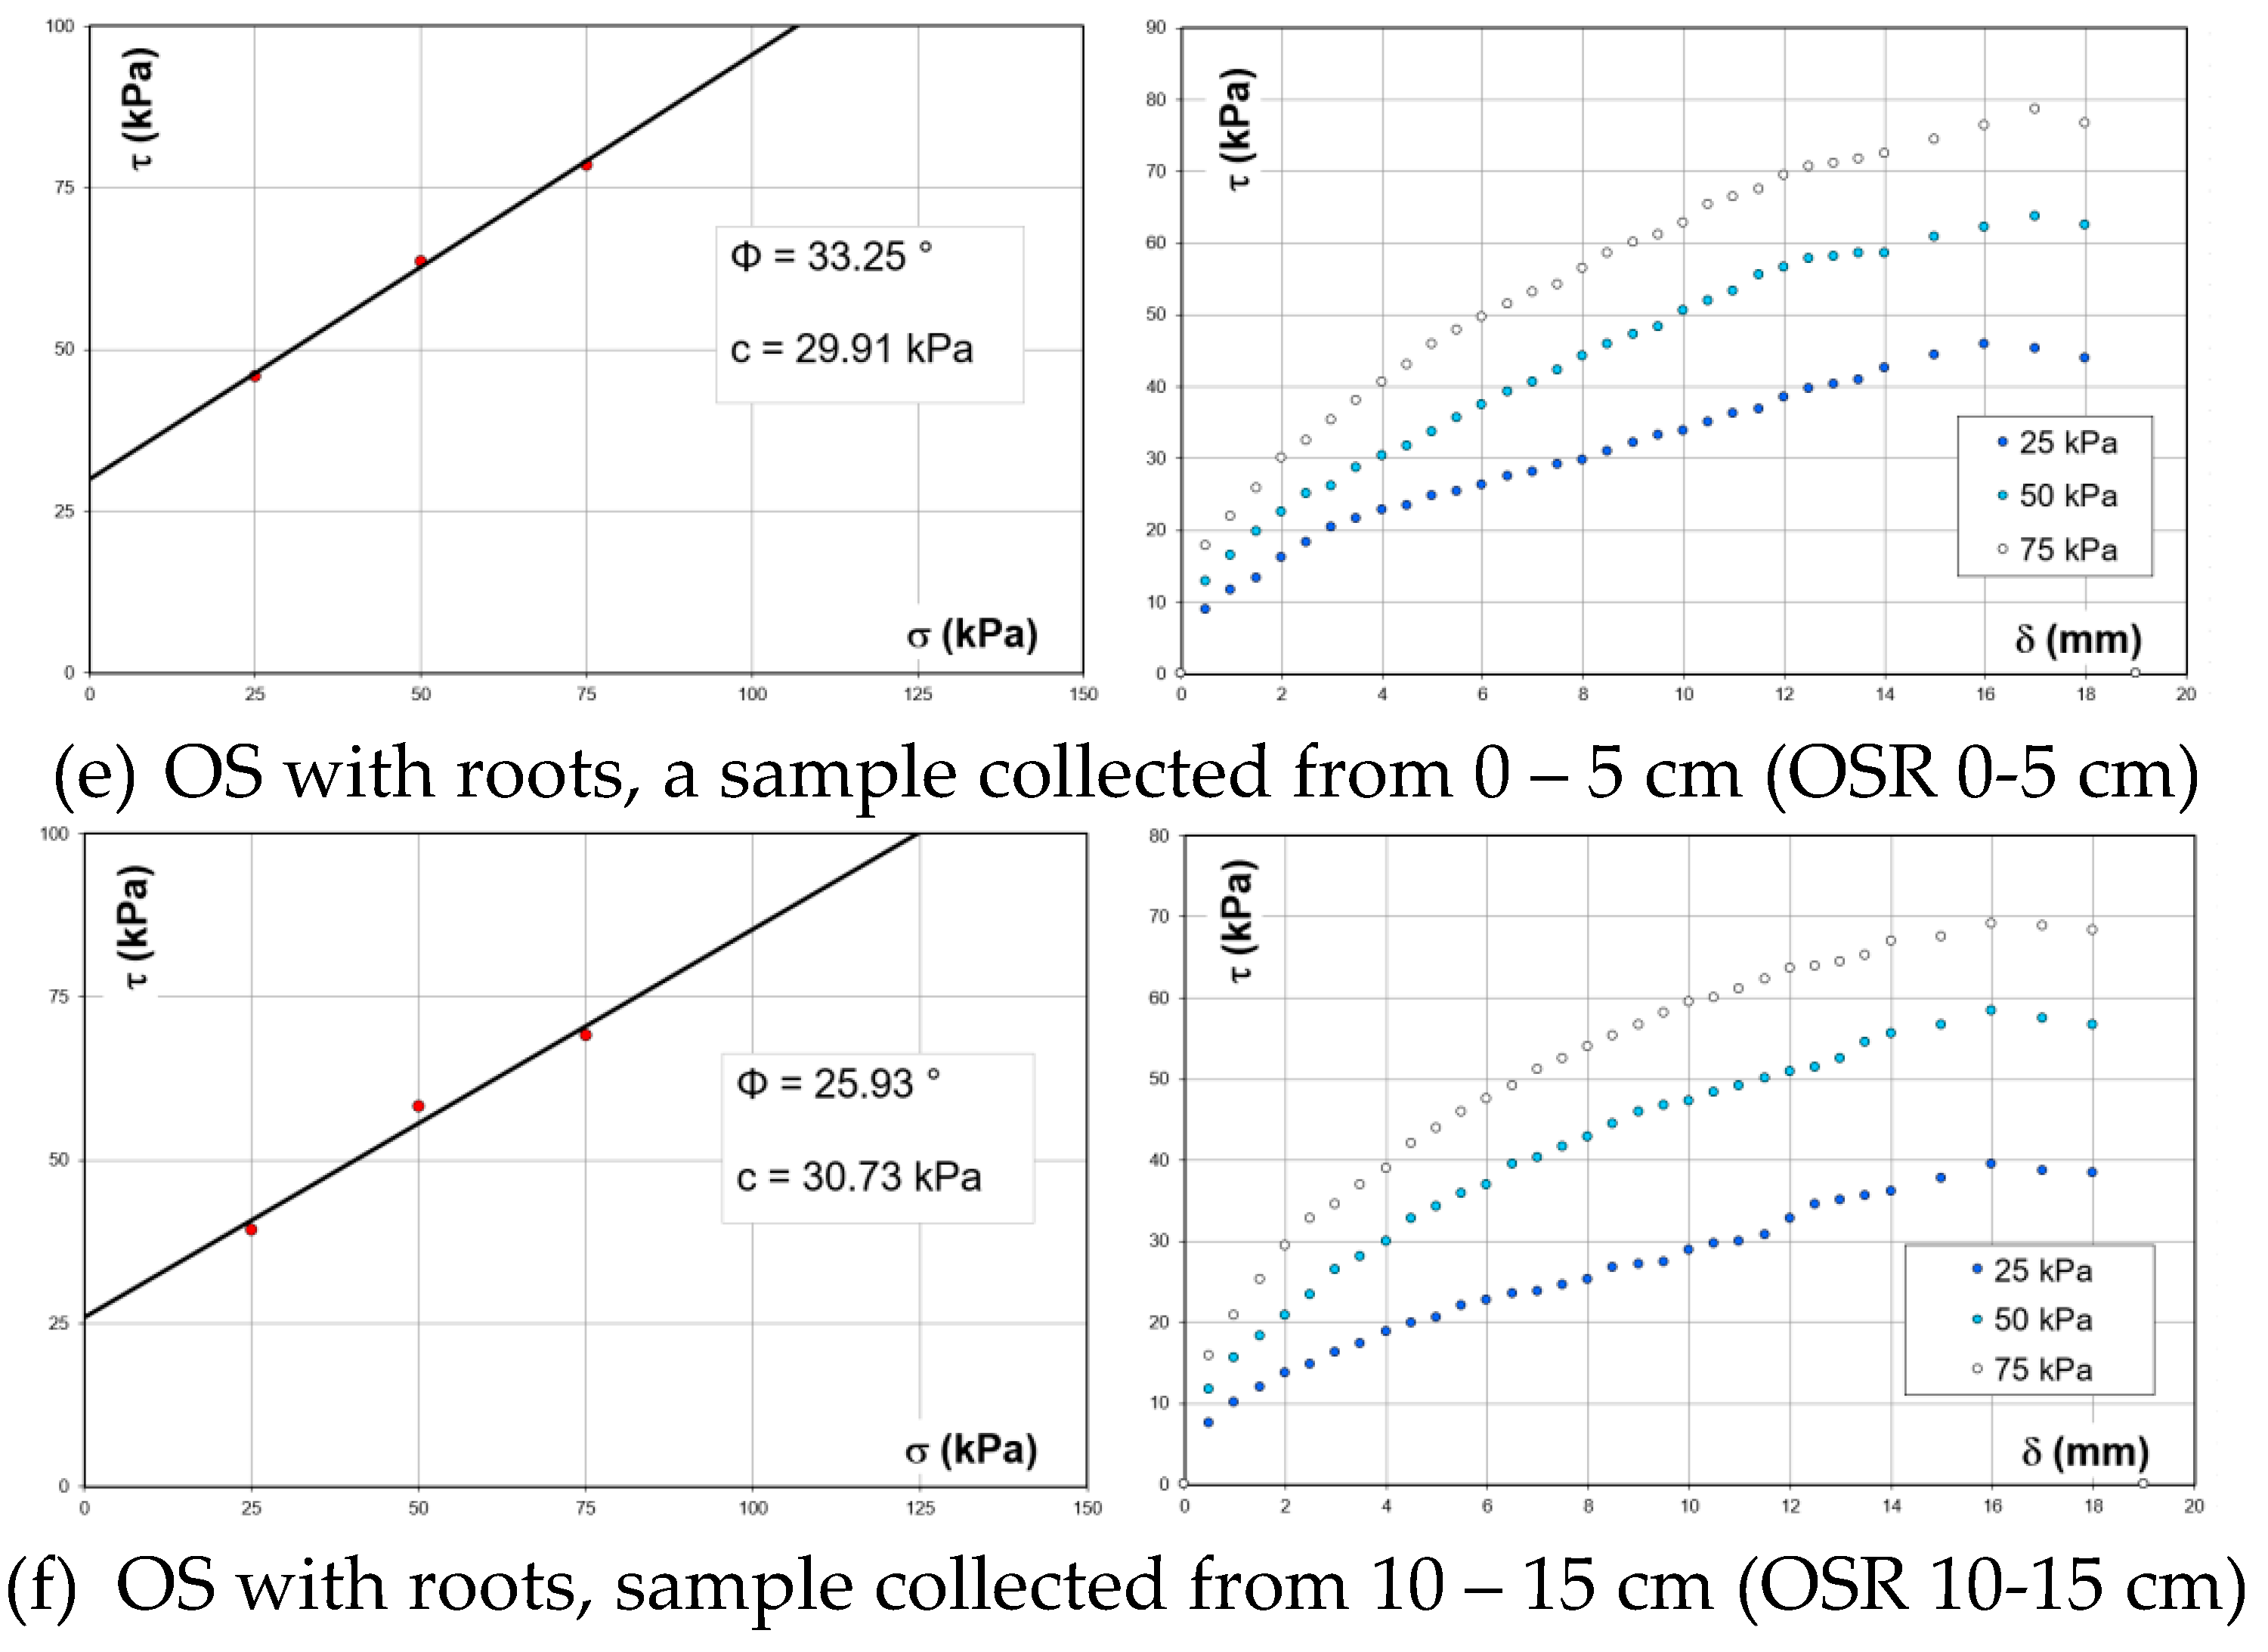
Direct shear tests were performed to assess the shear strength of various soil types. Samples were taken from different layers, as shown in
Figure 12. These included bare sand (without vegetation) - BS, sand reinforced by plant roots - SR, bare OS - BO, OS with roots - OSR, and samples positioned at the boundary between the OS and sand layers, where roots were present - INT. The results allowed for comparing how roots and soil compositions influence shear resistance (
Table 1).
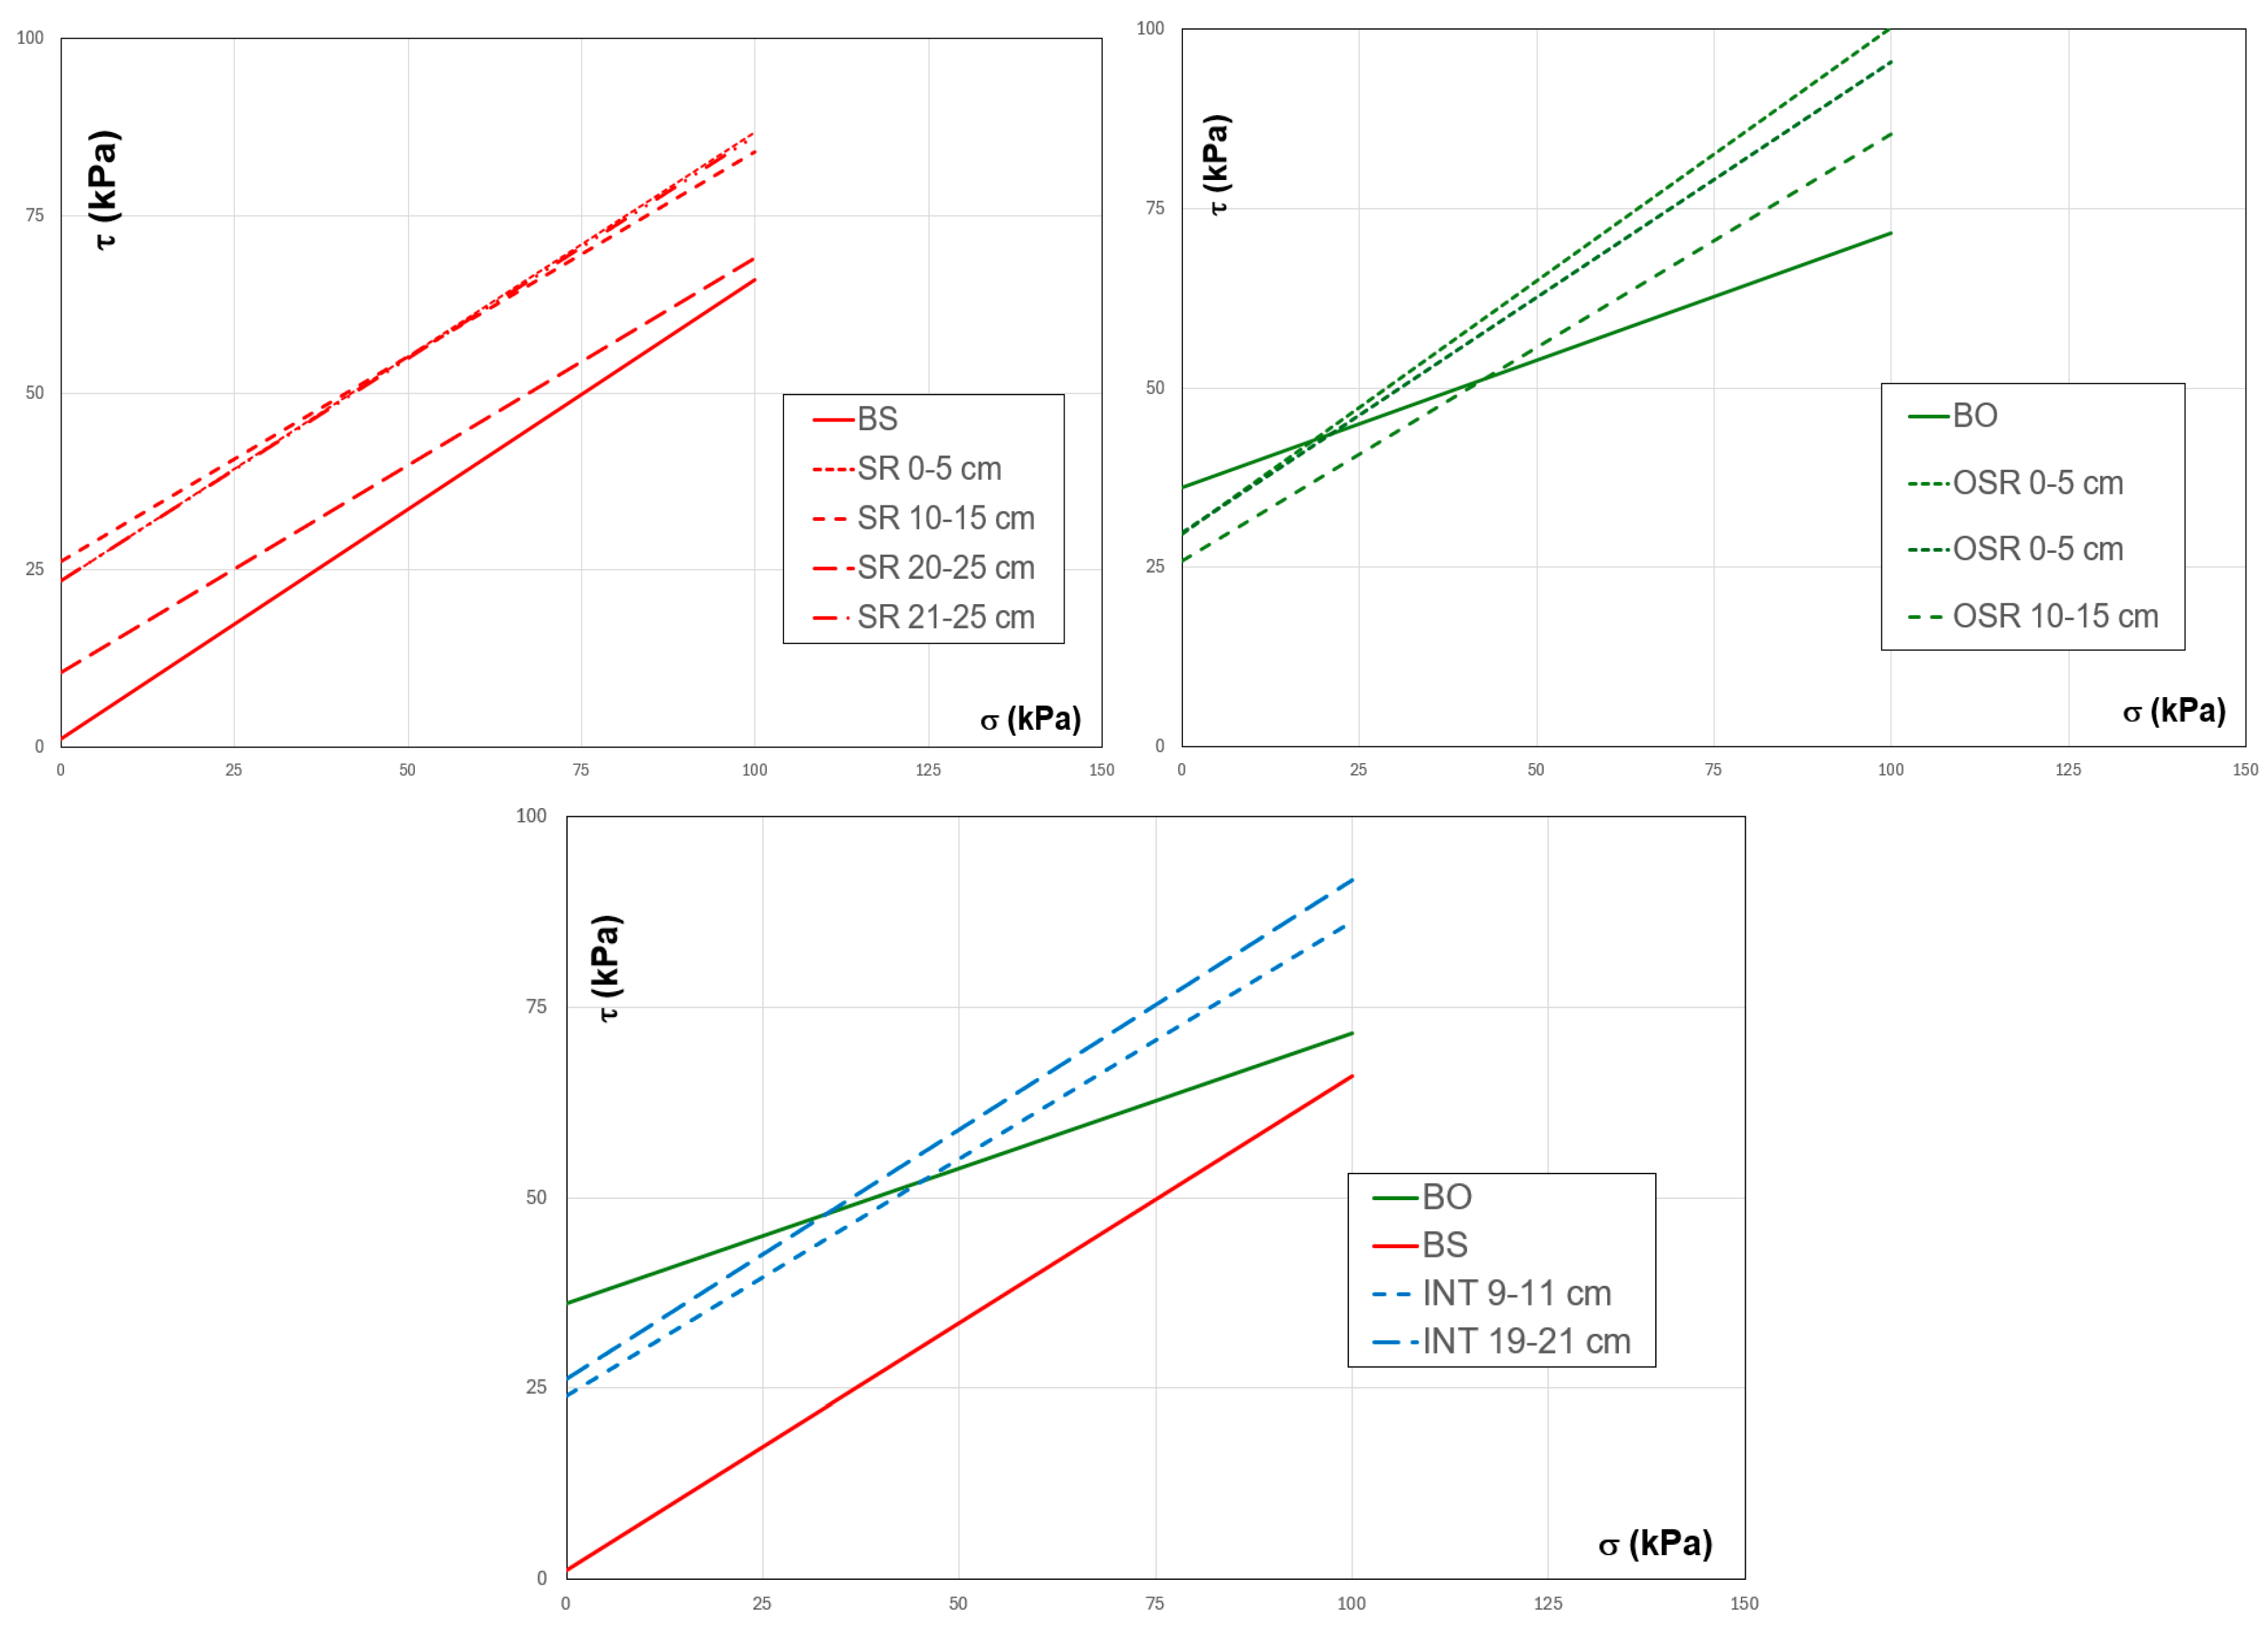
The experimental results indicate that the presence of roots introduces a cohesion added by roots (c
r) when the mechanical behavior at failure is described using Mohr-Coulomb’s law. At the same time, the shear strength angle (ϕ) remains in the same range. The summary of the results from the direct shear tests is presented in
Table 1.
Based on shear strength parameters, slope stability is evaluated; the more significant the internal friction angle and the cohesion of rooted soils, the higher the slope’s stability factor. Research conducted by Li et al., 2022, showed that the shear strength parameters of rooted soils increase with the growth of root diameter. They also examined four models of root distribution in the soil, specifically with distribution angles of 0°, 30°, 60°, and 90°. The vertical root distribution model in the soil (at a 90° distribution angle) can increase cohesion by up to 150 % [
23]. In our paper, the shear strength parameters were determined on natural roots, developed naturally with a distribution angle of 90°; in conclusion, all the shear strength parameters determined are at the maximum increase value.
3.4. Erosion Tests Under Rainfall Conditions
The tests conducted using the experimental model, which simulates the effect of torrential rainfall of 400 l/s,ha (144 mm/h) on a slope of 2:3 (V:H) at scale, focus on assessing the changes in the slope profile over time.
For the test performed on an unprotected sandy slope, it was observed that after a maximum of 20 minutes of rainfall, the slope experienced complete degradation, with the material being eroded and the slope reaching a gradient of approximately 1:5.5 (V) (
Figure 14). The rainfall was applied for 30 minutes.
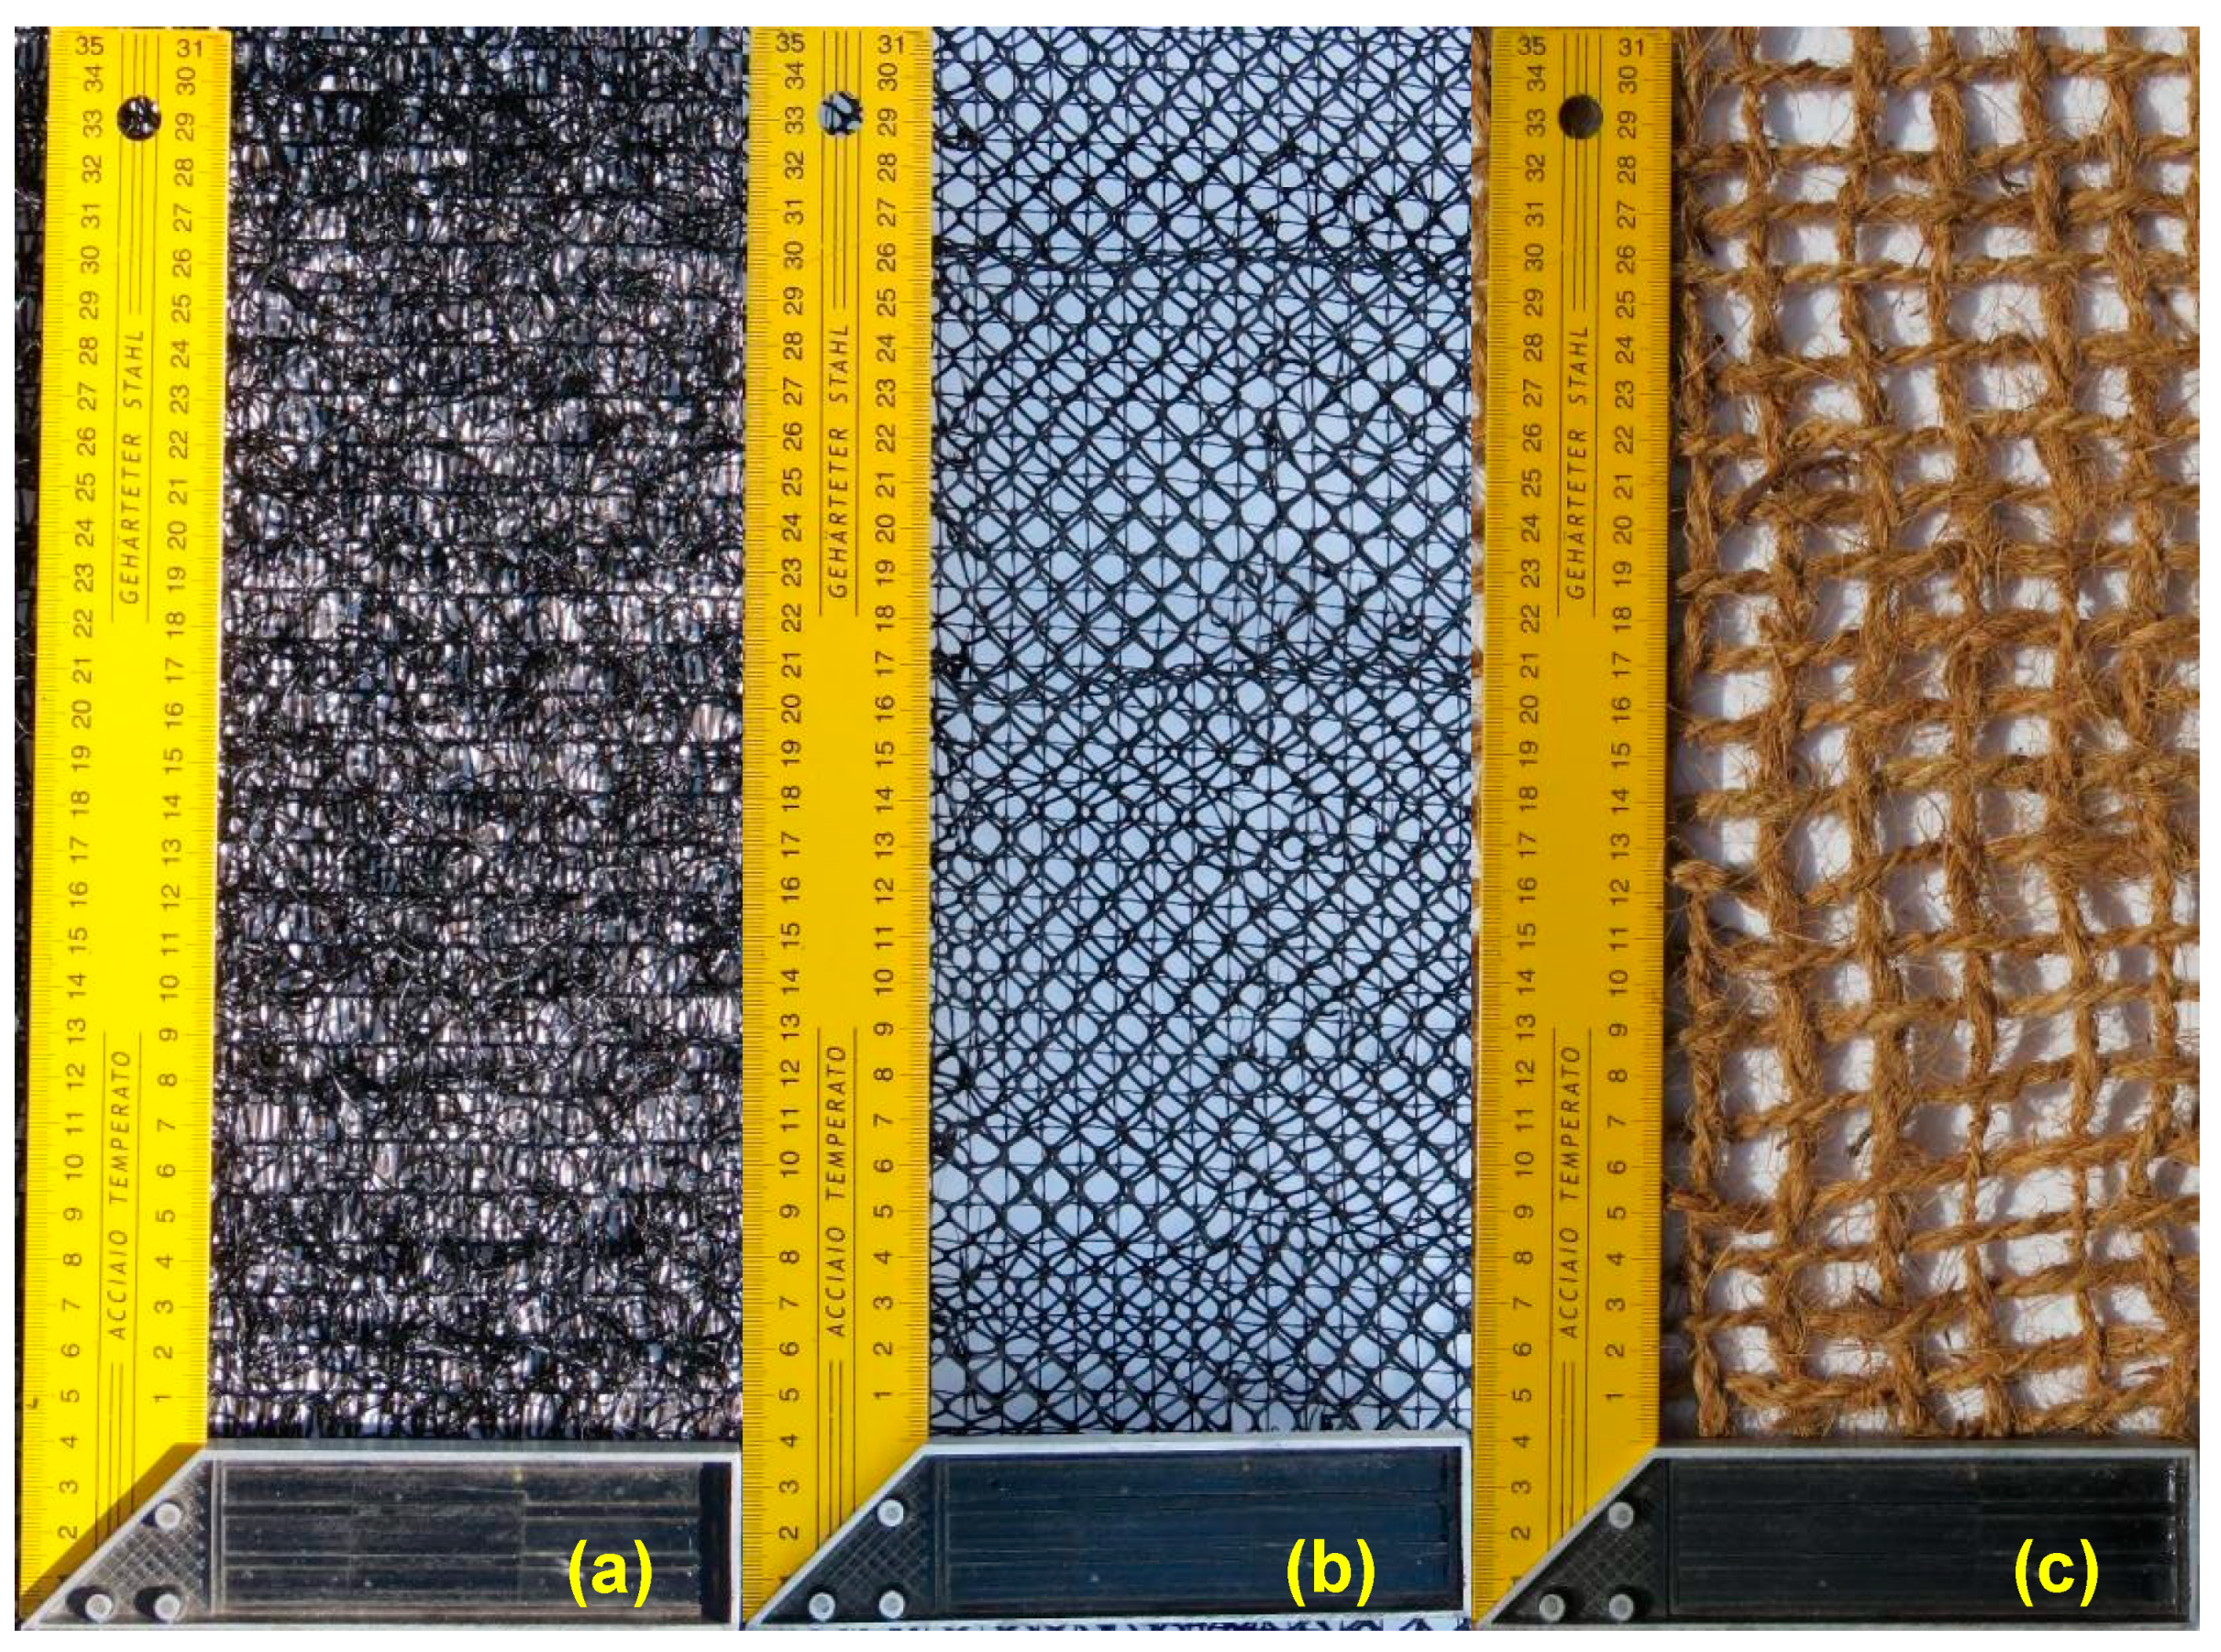
When geosynthetic materials were used for erosion control, the onset of erosion was delayed, varying in effectiveness depending on the specific materials applied (
Figure 15,
Figure 16 and
Figure 17). It was observed that erosion caused by raindrops was practically eliminated, as the shape of these geosynthetic materials is specifically designed for this purpose. The displaced material was carried underneath the geosynthetic material because the soil mass was fully saturated during the rainfall simulation. The rainfall was applied for 30 minutes in the case of the slope protected by GEC 2 and 40 minutes in the case of the slope protected by GEC 1 and GEC 3. It was decided not to display the captures after 40 minutes of rainfall because the geometry of the slope remained approximately the same, the amount of eroded material was roughly the same, and it was decided that all the representations in
Figure 15–17 should be on the same scale.
For the same slope, protected by a thin layer of 0.5 cm of OS and immature vegetation, no significant improvement was observed under similar rainfall conditions compared to the other tests (the slope unprotected or the slope protected by only a thin layer of OS layer). The seeds were planted on April 15, 2023, and the torrential rainfall simulation was conducted on May 14, 2023, just one month after sowing. The vegetation exhibited minimal, anemic growth, as the plants had only a very thin layer of topsoil of 0.5 cm (
Figure 18). This stunted growth is correlated with the development of very thin, superficial roots, as validated in the cylindrical containers discussed in subsection 3.1.
Simulating torrential rainfall over an area where excavation had been made in sandy soil, topped with a layer of 5 cm of OS that had been seeded but where the vegetation had not yet developed, had severe effects. In the scaled model, landslides occurred, completely altering the initial profile after just 10 minutes of intense rainfall (
Figure 19).
This rapid and massive shallow landslide occurred because the topsoil, without plant roots, absorbed all the rainwater quickly, increasing its weight. Since the soil beneath the topsoil layer was not saturated, a failure plane formed below the saturated topsoil layer, causing a general instability in 10 minutes. The scale model test remained undisturbed during the winter, from January 2023 until April 2023. Because during the winter of 2023-2024, there were a few days below-freezing temperatures, the seeds germinated, sprouted, and grew. It was observed that during the landslide caused by the torrential rainfall simulation, the seedlings also slid to the base of the slope.
To observe the effect of rainfall simulation on slopes protected with 5 cm OS, vegetation, and geosynthetic materials, four erosion chambers were placed in an experimental plot located in Chiajna, Ilfov County, Romania. They were exposed to natural climatic humidity and temperature conditions from 01.05.2023 to 01.09.2023. Their evolution in two important stages can be observed in
Figure 20 and
Figure 21.
The effect of mature vegetation on slope stability can be observed in
Figure 22. For this test, a seed mixture was planted on May 1, 2023, consisting of
Festuca arundinacea (25%),
Dactylis glomerata (25%),
Phleum pratense (20%),
Trifolium pratense (10%), and
Trifolium repens (20%) over a 5 cm thick layer of OS. The rainfall simulation was conducted on June 15, 2023, one and a half months after the seeds were sown. The rainfall simulation was applied at the most unfavorable time possible after trimming the plants. It was observed that mature vegetation is very effective in controlling slope erosion. After the rainfall simulation, the slope of the embankment remained the same, and no signs of erosion appeared, not even after 50 minutes.
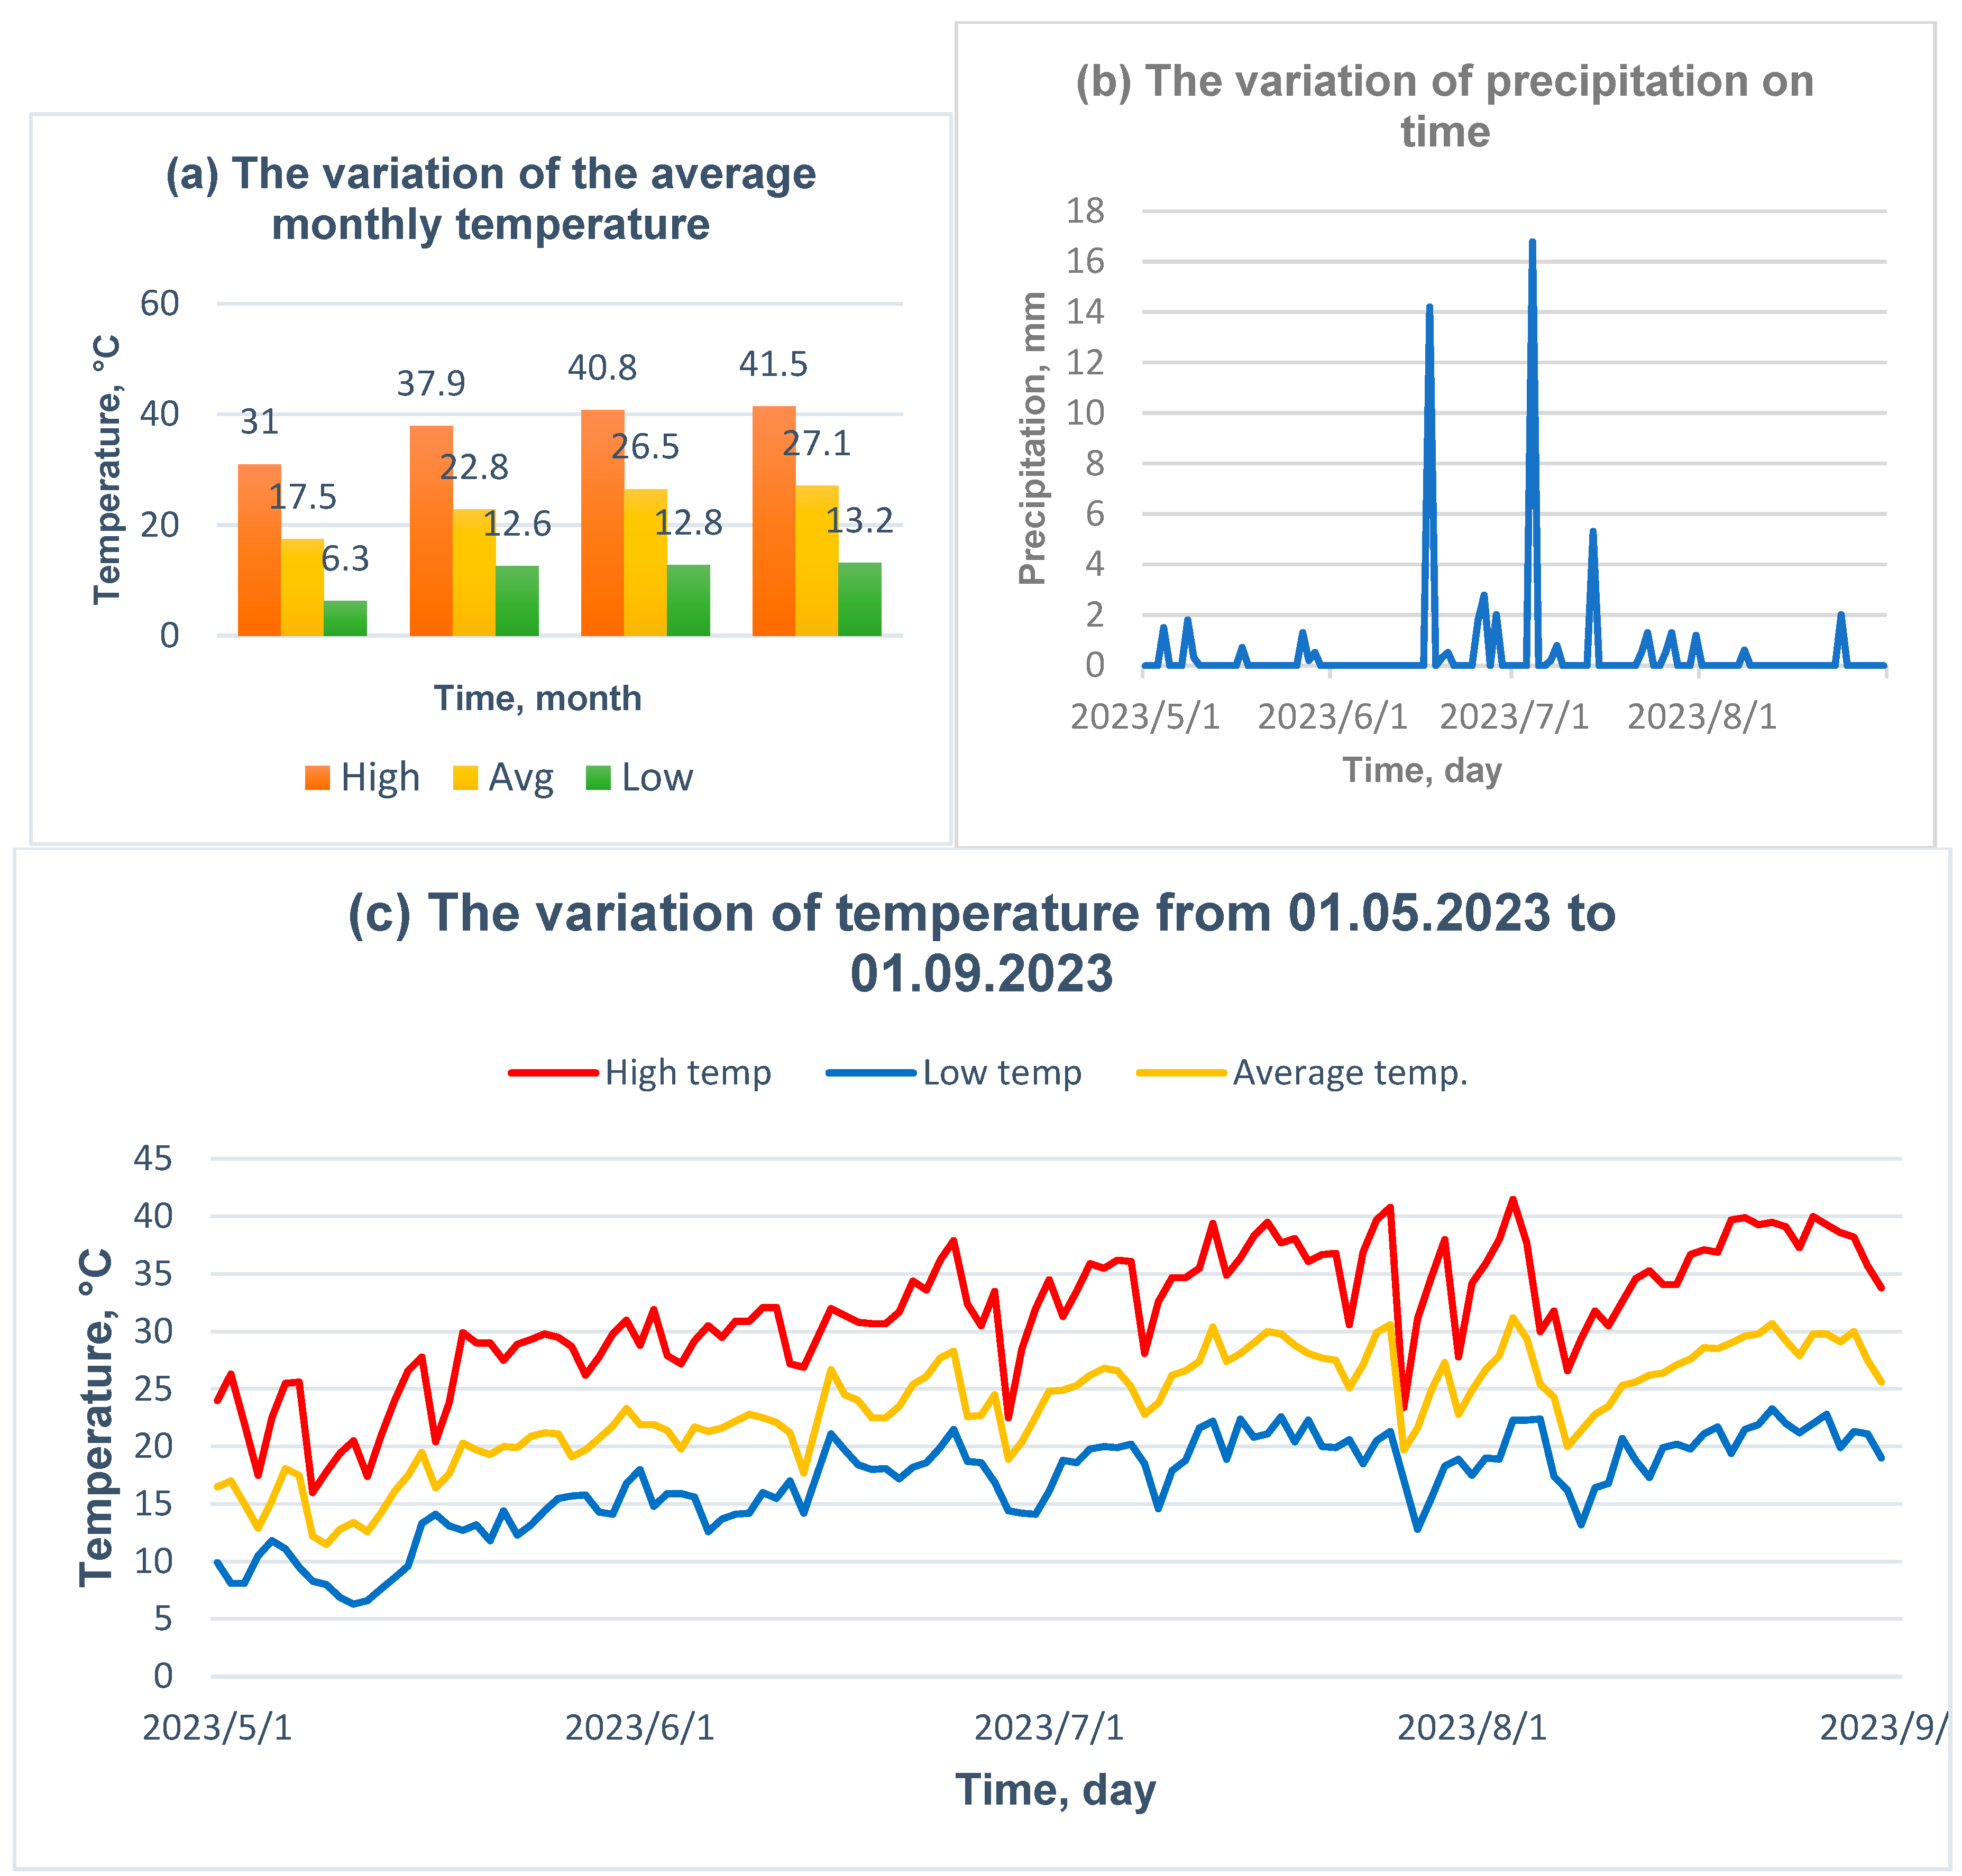
This test was conducted under the most favorable conditions, when temperatures support plant growth and development and water needs are met by precipitation or irrigation. Unfortunately, the effects of climate change have also been felt by these plants, leading them to dry out by the end of the summer. To observe how plants are influenced by the increased summer temperatures and the drought caused by the lack of precipitation, the grass-covered slopes were left in natural temperature and humidity conditions until September 1, 2023. During this period, there were 78 days with temperatures exceeding 30°C and 60 mm of precipitation. These climatic conditions caused the plants to dry out, allowing for simulations of torrential rains under the most unfavorable situation: mature, dry vegetation (
Figure 23).
The samples were irrigated and developed in the first two weeks after sowing, reaching maturity approximately one and a half months after sowing. After this period, they were left under the natural environmental humidity and temperature (as shown in
Figure 23,
Figure 24,
Figure 25,
Figure 26 and
Figure 27) during a summer period characterized by high temperatures and no recorded precipitation. Under these conditions, the topsoil contracted, and upon contact with the plexiglass walls of the erosion chamber, cracks of 0.3 – 0.5 mm formed. In the simulated torrential rain tests, no erosion was recorded in the entire soil mass, even with dry vegetation. Still, sand was displaced in the interface areas with the plexiglass wall.
Research on soil massive erosion will be further developed by replacing the sand with loess—a soil sensitive to moisture (a material that covers approximately 18% of Romania's territory, according to NP 125:2010 [
38])—and a clayey material, predominantly used in earthworks. Another research directive focuses on modeling the scaled tests through stability calculations using limit equilibrium and finite element analysis.
During the rainfall simulations on the slope protected by 5 cm of OS and mature dry vegetation, it was observed that the sand was displaced on the side opposite the filmed area after approximately 75 minutes, and the camera was moved.
Figure 24 shows the amount of displaced material.
4. Conclusions
Vegetation as a bio-reinforcement method is often more cost-effective and environmentally friendly than traditional engineering solutions, such as concrete. However, this bio-stabilization approach is unsuitable for applications requiring deep stabilization.
Bio-stabilization techniques contribute to the ecological restoration of slopes by supporting biodiversity and improving the aesthetic value of landscapes. The selection of appropriate species and planting techniques depends on the area's specific soil and climate conditions to ensure optimal root development and stabilization efficiency. The vegetation can be combined with other mechanical stabilization methods for hybrid approaches to slope management.
Leguminous and Gramineae plants used in slope stabilization are common in areas prone to landslides, erosion, or surface runoff. These plants are often applied to roadside slopes, riverbanks, and areas affected by deforestation or construction activities.
The roots of plants play a crucial role in stabilizing slopes by improving soil cohesion, reducing water content, and providing long-term reinforcement, making them a valuable natural solution for slope erosion control. In designing artificial slopes, an important stability analysis should be conducted for the scenario where the vegetation has dried out following a drought period. This scenario does not correspond to the scenario without vegetation, as the plant roots remain fixed in the soil and can regenerate after rainy periods.
The bio-stabilization of slopes or bio-reinforcement with living plants is a current topic that requires the involvement of specialists from Geotechnical Engineering, Agriculture, Horticulture, Environmental Engineering, and Landscaping.
Author Contributions
Conceptualization, T.O. and E.D.O.; methodology, T.O., E.D.O., and A.C.B.; analysis, T.O. and A.C.B.; investigation, T.O., E.D.O., and A.C.B.; resources, E.D.O.; writing—original draft preparation, T.O.; writing—review and editing, T.O., E.D.O., and A.C.B.; supervision, T.O., E.D.O. and A.C.B.; funding acquisition, T.O. All authors have read and agreed to the published version of the manuscript.
Figure 1.
The root structure classified by Yen (recreated figure).
Figure 1.
The root structure classified by Yen (recreated figure).
Figure 2.
The geosynthetic materials used for this study: (a) GEC 1, (b) GEC 2, and (c) GEC 3.
Figure 2.
The geosynthetic materials used for this study: (a) GEC 1, (b) GEC 2, and (c) GEC 3.
Figure 3.
Grain size distribution of the sand sample.
Figure 3.
Grain size distribution of the sand sample.
Figure 4.
The distribution of the topsoil layer in the cylindrical containers to determine the optimum OS thickness: (a) 0 cm OS, (b) 5 cm OS, (c) 10 cm OS, (d) 15 cm OS, and (e) 20 cm OS.
Figure 4.
The distribution of the topsoil layer in the cylindrical containers to determine the optimum OS thickness: (a) 0 cm OS, (b) 5 cm OS, (c) 10 cm OS, (d) 15 cm OS, and (e) 20 cm OS.
Figure 5.
Scanning images analyzed with WinRHIZO software: (a) Leguminous plant, (b) Gramineae plants.
Figure 5.
Scanning images analyzed with WinRHIZO software: (a) Leguminous plant, (b) Gramineae plants.
Figure 6.
The direct shear methodology: (a) the sample of 20 cm OS with living vegetation, (b) sheared sample at the interface between OS and sand with roots, (c) the Shearmatic automatic direct/residual shear machine, (d) sheared samples in the oven, (e) OS with roots sheared sample, and (f) sample taken from the upper part of the cylinder.
Figure 7.
Scale model devices [
27]: (a) the sketch of the rainfall simulator at the upper part, (b) the sketch of the erosion control chamber with a slope of 2:3 (V:H), (c) the image of the rainfall simulator at the upper part, (d) the image of the erosion control chamber with an artificial slope of 2:3 (V:H) realized by compacted sand (e) the sketch of the erosion control chamber with the dimensions of the artificial slope protected by a 5 cm OS layer placed in steps, and (f) the image of the erosion control chamber with an artificial slope protected by OS and mature vegetation.
Figure 8.
The meteorological data: (a) the variation of the highest, average, and lowest temperature recorded in May, June, July, and August 2023, (b) the variation of the precipitation recorded from 01.05.2023 to 01.09.2023, and (c) the variation of highest, average and lower daily temperature.
Figure 8.
The meteorological data: (a) the variation of the highest, average, and lowest temperature recorded in May, June, July, and August 2023, (b) the variation of the precipitation recorded from 01.05.2023 to 01.09.2023, and (c) the variation of highest, average and lower daily temperature.
Figure 9.
The growing plant's stages at different periods: (a) 30.09.2022 (day 0), (b) 25.10.2022 (25 days), (c) 19.11.2022 (50 days), (d) 14.12.2022 (75 days), and (e) 27.02.2023 (150 days).
Figure 9.
The growing plant's stages at different periods: (a) 30.09.2022 (day 0), (b) 25.10.2022 (25 days), (c) 19.11.2022 (50 days), (d) 14.12.2022 (75 days), and (e) 27.02.2023 (150 days).
Figure 10.
The comparison of the influence of the OS layer thickness on root length measured (a) manually, (b) with WinRHIZO.
Figure 10.
The comparison of the influence of the OS layer thickness on root length measured (a) manually, (b) with WinRHIZO.
Figure 11.
The comparison of the influence of the OS layer thickness on root volume measured (a) manually, (b) with WinRHIZO.
Figure 11.
The comparison of the influence of the OS layer thickness on root volume measured (a) manually, (b) with WinRHIZO.
Figure 12.
Variation of shear stress vs. everyday stress (left) and shear strength vs. horizontal displacement (right) on soil/soil-roots samples [
37].
Figure 12.
Variation of shear stress vs. everyday stress (left) and shear strength vs. horizontal displacement (right) on soil/soil-roots samples [
37].
Figure 13.
The variation of shear stress vs everyday stress on all analyzed samples: (a) sandy samples, (b) OS samples, and (c) samples collected from the interface between OS and sand [
37].
Figure 13.
The variation of shear stress vs everyday stress on all analyzed samples: (a) sandy samples, (b) OS samples, and (c) samples collected from the interface between OS and sand [
37].
Figure 14.
Variation of the profile for the unprotected sandy slope during a rainfall simulation at different periods [
27]: (a) t = 0 minutes, (b) t = 10 minutes, (c) t = 20 minutes, and (d) t = 30 minutes.
Figure 14.
Variation of the profile for the unprotected sandy slope during a rainfall simulation at different periods [
27]: (a) t = 0 minutes, (b) t = 10 minutes, (c) t = 20 minutes, and (d) t = 30 minutes.
Figure 15.
The variation in the profile of a sandy excavation unprotected and protected with GEC1 during rainfall simulation at different periods [
27]: (a) t = 0 minutes, (b) t = 10 minutes, (c) t = 20 minutes, and (d) t = 30 minutes.
Figure 15.
The variation in the profile of a sandy excavation unprotected and protected with GEC1 during rainfall simulation at different periods [
27]: (a) t = 0 minutes, (b) t = 10 minutes, (c) t = 20 minutes, and (d) t = 30 minutes.
Figure 16.
The variation in the profile of a sandy excavation unprotected and protected with GEC2 during rainfall simulation at different periods [
27]: (a) t = 0 minutes, (b) t = 10 minutes, (c) t = 20 minutes, and (d) t = 30 minutes.
Figure 16.
The variation in the profile of a sandy excavation unprotected and protected with GEC2 during rainfall simulation at different periods [
27]: (a) t = 0 minutes, (b) t = 10 minutes, (c) t = 20 minutes, and (d) t = 30 minutes.
Figure 17.
The variation in the profile of a sandy excavation unprotected and protected with GEC3 during rainfall simulation at different periods [
27]: (a) t = 0 minutes, (b) t = 10 minutes, (c) t = 20 minutes, and (d) t = 30 minutes.
Figure 17.
The variation in the profile of a sandy excavation unprotected and protected with GEC3 during rainfall simulation at different periods [
27]: (a) t = 0 minutes, (b) t = 10 minutes, (c) t = 20 minutes, and (d) t = 30 minutes.
Figure 18.
The variation in the profile of a sandy excavation protected by 0.5 cm of OS with immature vegetation during rainfall simulation at different periods [
27]: (a) t = 0 minutes, (b) t = 10 minutes, (c) t = 20 minutes, and (d) t = 30 minutes.
Figure 18.
The variation in the profile of a sandy excavation protected by 0.5 cm of OS with immature vegetation during rainfall simulation at different periods [
27]: (a) t = 0 minutes, (b) t = 10 minutes, (c) t = 20 minutes, and (d) t = 30 minutes.
Figure 19.
The variation in the profile of a sandy excavation protected by 5 cm of OS (with seeds) during rainfall simulation at different periods: (a) t = 0 minutes, (b) t = 10 minutes, and (c) after approx—four months, during the winter.
Figure 19.
The variation in the profile of a sandy excavation protected by 5 cm of OS (with seeds) during rainfall simulation at different periods: (a) t = 0 minutes, (b) t = 10 minutes, and (c) after approx—four months, during the winter.
Figure 20.
The sandy slope protected by 5 cm OS layer after seeding (01.05.2023): (a) slope protected by 5 cm OS, (b) slope protected by 5 cm OS and GEC 1, (c) slope protected by 5 cm OS and GEC 2, and (d) slope protected by 5 cm OS and GEC 3.
Figure 20.
The sandy slope protected by 5 cm OS layer after seeding (01.05.2023): (a) slope protected by 5 cm OS, (b) slope protected by 5 cm OS and GEC 1, (c) slope protected by 5 cm OS and GEC 2, and (d) slope protected by 5 cm OS and GEC 3.
Figure 21.
The sandy slope protected by a 5 cm OS layer and mature vegetation after 45 days of seeding (15.06.2023): (a) slope protected by 5 cm OS, (b) slope protected by 5 cm OS and GEC 1, (c) slope protected by 5 cm OS and GEC 2, and (d) slope protected by 5 cm OS and GEC 3.
Figure 21.
The sandy slope protected by a 5 cm OS layer and mature vegetation after 45 days of seeding (15.06.2023): (a) slope protected by 5 cm OS, (b) slope protected by 5 cm OS and GEC 1, (c) slope protected by 5 cm OS and GEC 2, and (d) slope protected by 5 cm OS and GEC 3.
Figure 22.
The variation in the profile of a sandy excavation protected by 5 cm of OS with trimmed mature vegetation during rainfall simulation at different periods: (a) t = 0 minutes, (b) t = 10 minutes, (c) t = 30 minutes and (d) t= 50 minutes.
Figure 22.
The variation in the profile of a sandy excavation protected by 5 cm of OS with trimmed mature vegetation during rainfall simulation at different periods: (a) t = 0 minutes, (b) t = 10 minutes, (c) t = 30 minutes and (d) t= 50 minutes.
Figure 23.
The variation in the profile of a sandy excavation protected by 5 cm of OS with dried mature vegetation during rainfall simulation at different periods: (a) t = 0 minutes, (b) t = 10 minutes, (c) t = 30 minutes and (d) t= 50 minutes.
Figure 23.
The variation in the profile of a sandy excavation protected by 5 cm of OS with dried mature vegetation during rainfall simulation at different periods: (a) t = 0 minutes, (b) t = 10 minutes, (c) t = 30 minutes and (d) t= 50 minutes.
Figure 24.
The variation in the profile of a sandy excavation protected by 5 cm of OS with dried mature vegetation during rainfall simulation at different periods: (a) t = 0 minutes, (b) t = 80 minutes, (c) t = 100 minutes and (d) t= 120 minutes.
Figure 24.
The variation in the profile of a sandy excavation protected by 5 cm of OS with dried mature vegetation during rainfall simulation at different periods: (a) t = 0 minutes, (b) t = 80 minutes, (c) t = 100 minutes and (d) t= 120 minutes.
Figure 25.
The variation in the profile of a sandy excavation protected by 5 cm of OS with dried mature vegetation and GEC 1 during rainfall simulation at different periods: (a) t = 0 minutes, (b) t = 10 minutes, (c) t = 30 minutes and (d) t= 50 minutes.
Figure 25.
The variation in the profile of a sandy excavation protected by 5 cm of OS with dried mature vegetation and GEC 1 during rainfall simulation at different periods: (a) t = 0 minutes, (b) t = 10 minutes, (c) t = 30 minutes and (d) t= 50 minutes.
Figure 26.
The variation in the profile of a sandy excavation protected by 5 cm of OS with dried mature vegetation and GEC 2 during rainfall simulation at different periods: (a) t = 0 minutes, (b) t = 10 minutes, (c) t = 30 minutes and (d) t= 50 minutes.
Figure 26.
The variation in the profile of a sandy excavation protected by 5 cm of OS with dried mature vegetation and GEC 2 during rainfall simulation at different periods: (a) t = 0 minutes, (b) t = 10 minutes, (c) t = 30 minutes and (d) t= 50 minutes.
Figure 27.
The variation in the profile of a sandy excavation protected by 5 cm of OS with dried mature vegetation and GEC 3 during rainfall simulation at different periods: (a) t = 0 minutes, (b) t = 10 minutes, (c) t = 30 minutes and (d) t= 50 minutes.
Figure 27.
The variation in the profile of a sandy excavation protected by 5 cm of OS with dried mature vegetation and GEC 3 during rainfall simulation at different periods: (a) t = 0 minutes, (b) t = 10 minutes, (c) t = 30 minutes and (d) t= 50 minutes.
Table 1.
The shear strength parameters of bare soil and soils with roots [
37].
Table 1.
The shear strength parameters of bare soil and soils with roots [
37].
| Shear strength |
Sandy samples |
|
| BS |
SR 0-5 |
SR 10-15 |
SR 20-25 |
SR 21-25 |
|
| c (kPa) |
1.24 |
23.43 |
26.3 |
10.65 |
23.52 |
|
| cr (kPa) |
- |
22.19 |
25.06 |
9.41 |
22.28 |
|
| Φ (°) |
32.94 |
32.35 |
30.02 |
30.26 |
32.12 |
|
| Shear strength |
OS samples |
Interface samples |
| BO |
OSR 0-5 |
OSR 0-5 |
OSR 10-15 |
INT 10-15 |
INT 19-21 |
| c (kPa) |
36.11 |
29.72 |
29.91 |
25.93 |
23.98 |
26.2 |
| cr (kPa) |
- |
-6.39 |
-6.2 |
-10.18 |
|
|
| Φ (°) |
19.57 |
35.21 |
33.25 |
30.73 |
31.89 |
33.25 |
