Submitted:
29 October 2024
Posted:
30 October 2024
You are already at the latest version
Abstract
Keywords:
1. Introduction
2. Materials and Methods
2.1. Study area
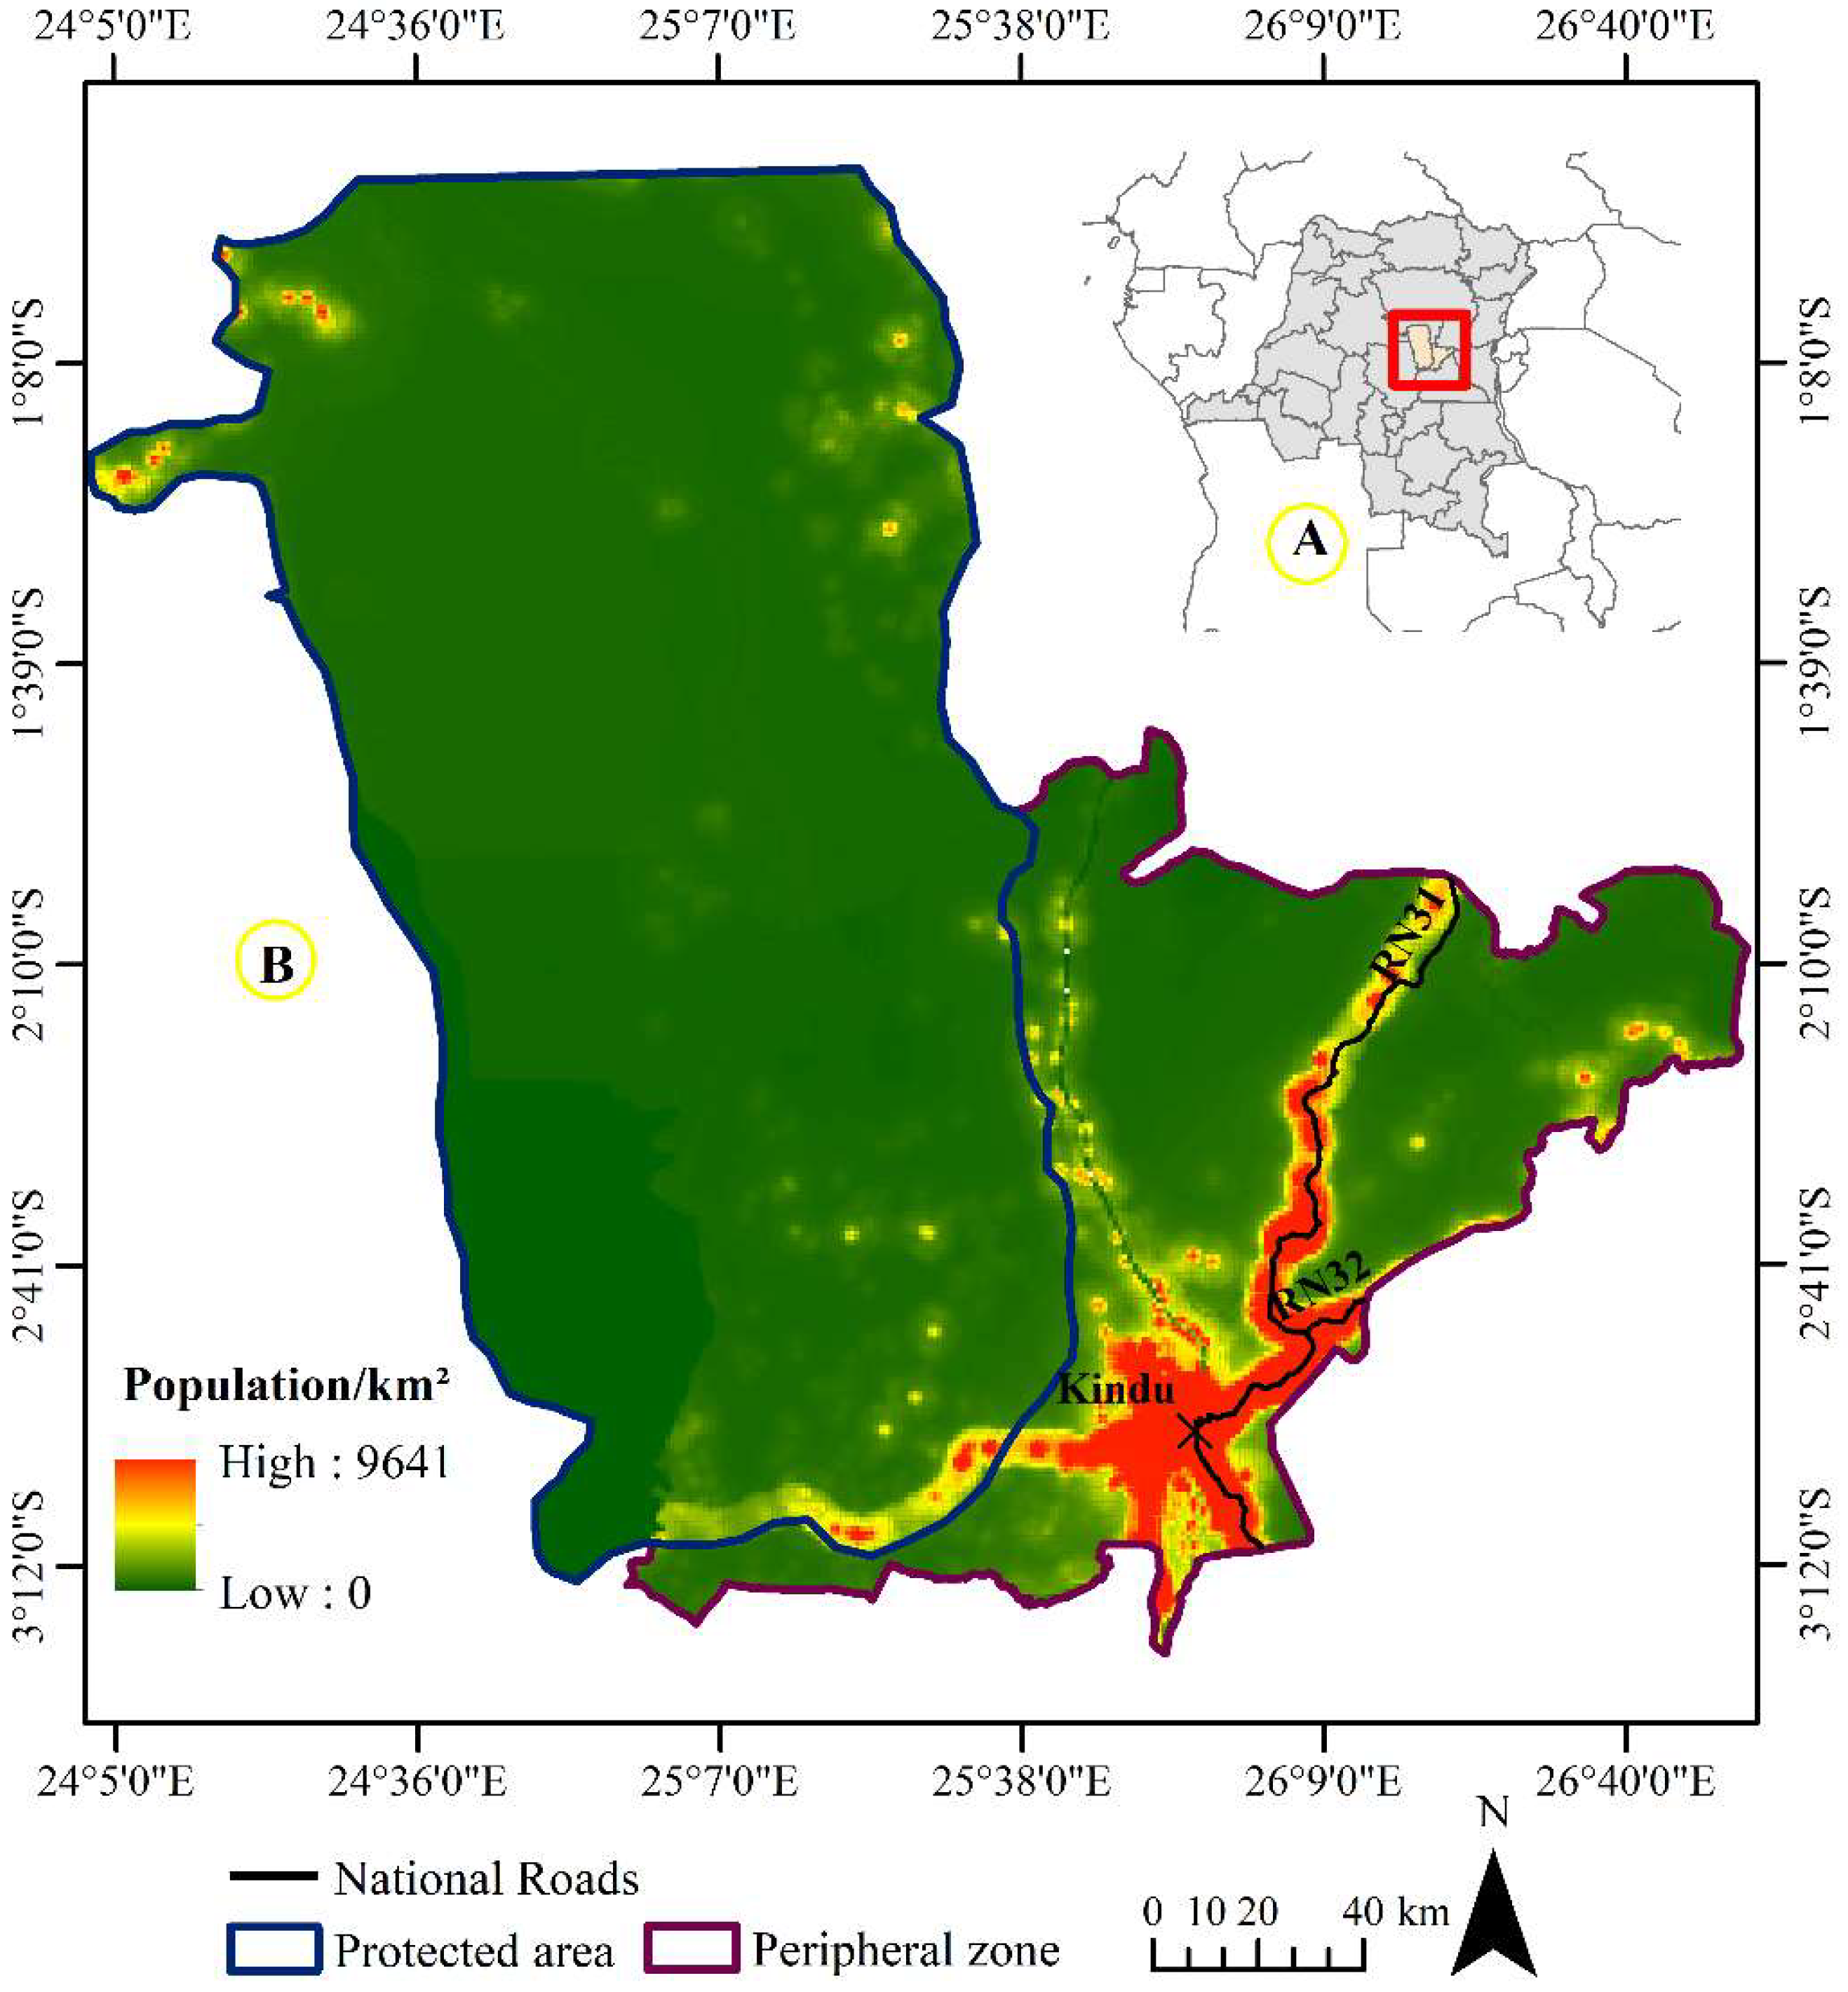
2.2. Data
2.3. Landsat images’ classification
2.4. Assessment of landscape dynamics
3. Results
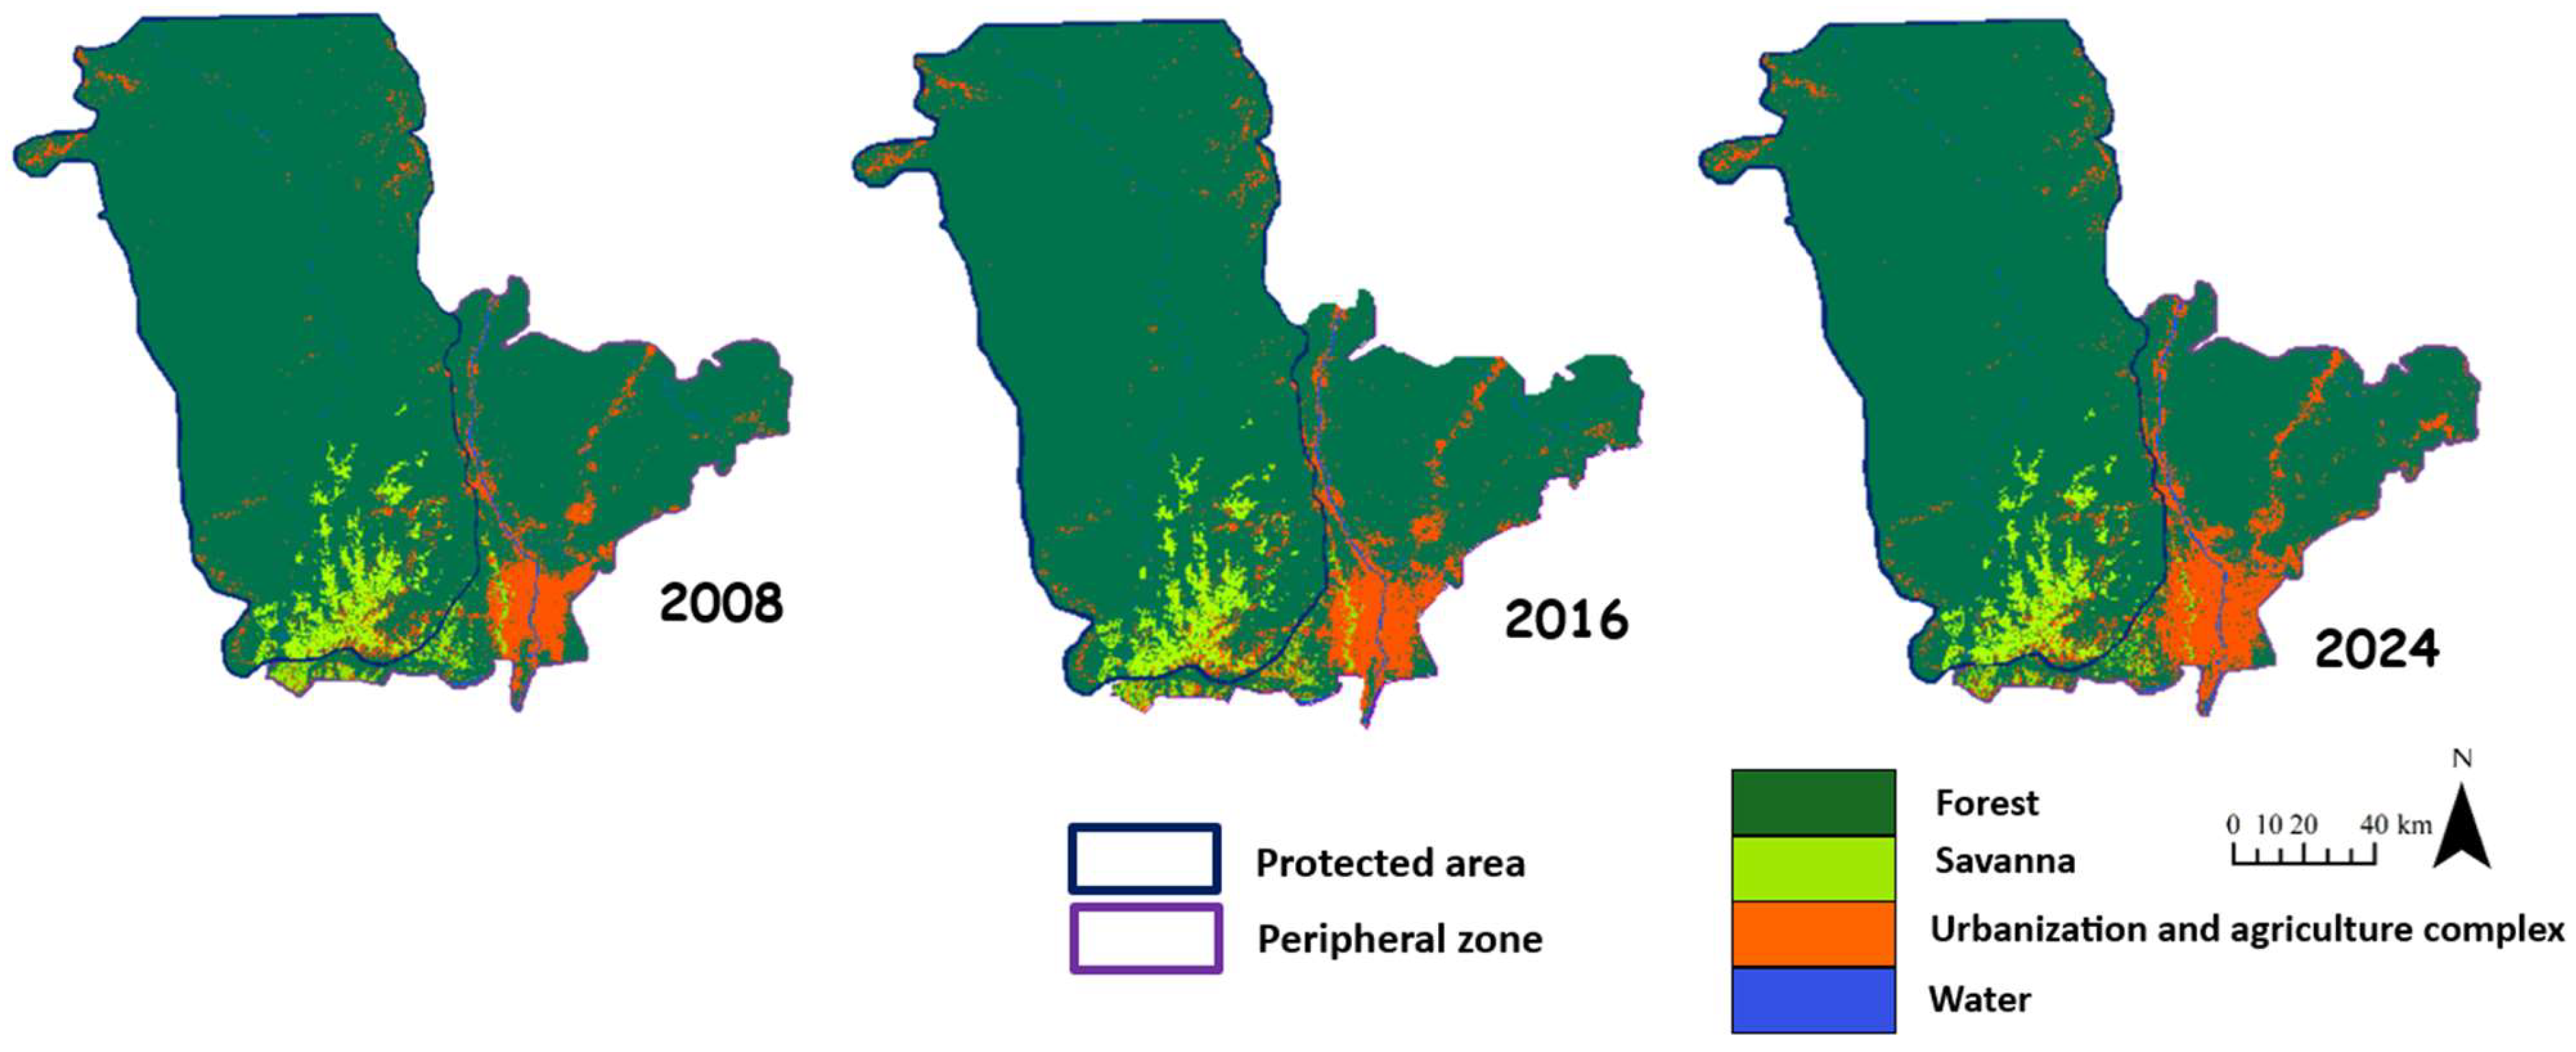
3.1. Classification and mapping
3.2. Dynamics of land cover composition in Lomami National Park and its periphery between 2008 and 2024
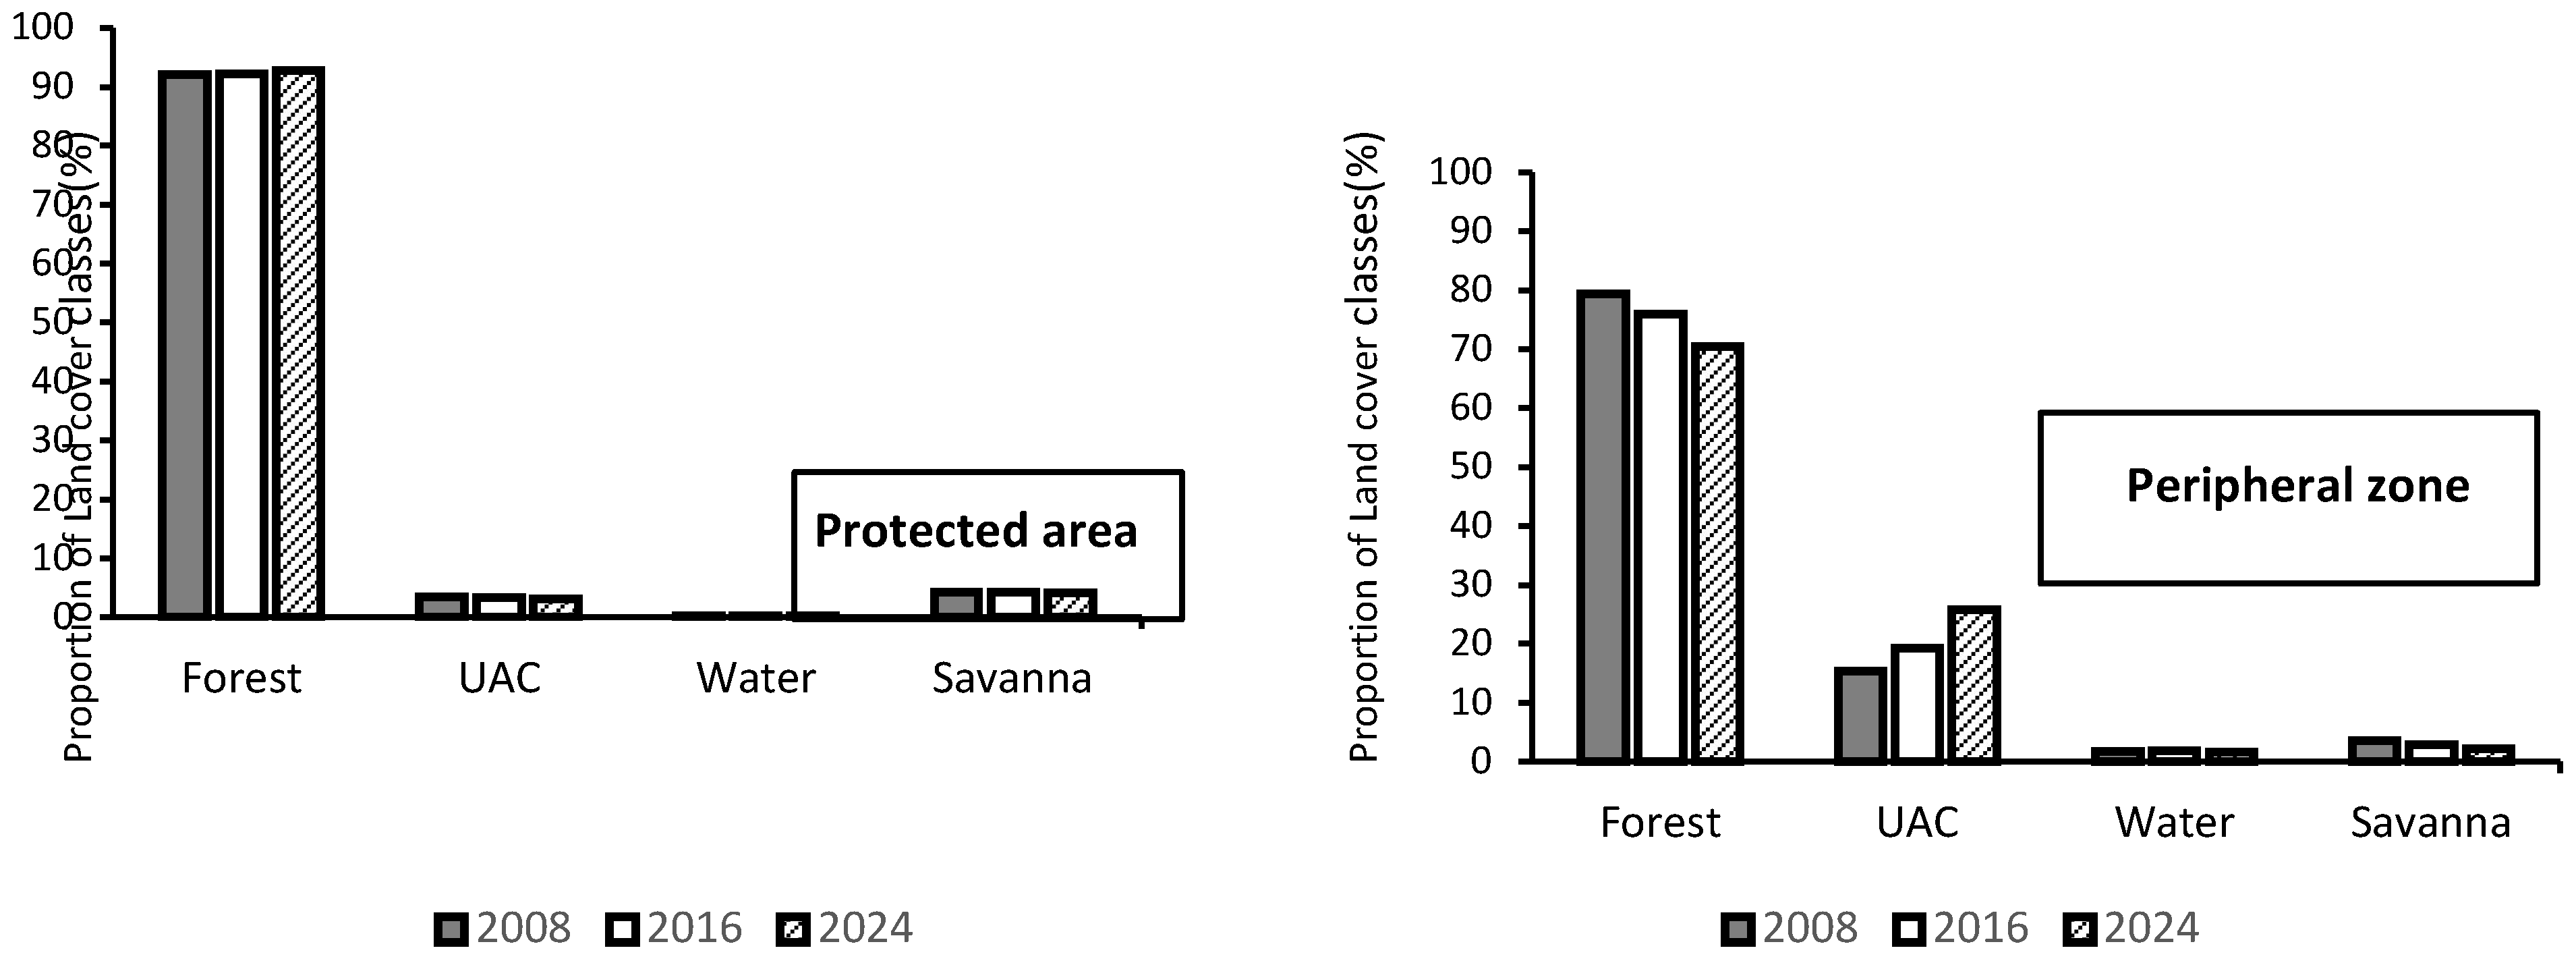
| Protected area | |||||
|---|---|---|---|---|---|
| UAC | Forest | Water | Savanna | Total 2008 | |
| UAC | 1.29 | 2.08 | 0.00 | 0.03 | 3.40 |
| Forest | 1.80 | 90.09 | 0.02 | 0.15 | 92.06 |
| Water | 0.00 | 0.00 | 0.25 | 0 | 0.25 |
| Savanna | 0.19 | 0.07 | 0 | 4.03 | 4.29 |
| Total 2016 | 3.28 | 92.24 | 0.27 | 4.21 | |
| UAC | Forest | Water | Savanna | Total 2016 | |
| UAC | 1.56 | 1.46 | 00.0 | 0.26 | 3.28 |
| Forest | 1.48 | 90.68 | 0.01 | 0.07 | 92.24 |
| Water | 0.00 | 0.03 | 0.24 | 00.0 | 0.27 |
| Savanna | 0.06 | 0.28 | 0.00 | 3.87 | 4.21 |
| Total 2024 | 3.10 | 92.45 | 0.25 | 4.20 | |
| Periphery | |||||
| UAC | Forest | Water | Savanna | Total2008 | |
| UAC | 12.81 | 2.44 | 0.06 | 0.05 | 15.36 |
| Forest | 5.86 | 73.18 | 0.08 | 0.19 | 79.32 |
| Water | 0.01 | 0.01 | 1.70 | 00.0 | 1.71 |
| Savanna | 0.59 | 0.28 | 0.01 | 2.72 | 3.6 |
| Total 2016 | 19.27 | 75.91 | 1.85 | 2.97 | |
| UAC | Forest | Water | Savanna | Total2016 | |
| UAC | 17.04 | 2.02 | 0.01 | 0.20 | 19.27 |
| Forest | 7.97 | 67.67 | 0.01 | 0.26 | 75.91 |
| Water | 0.12 | 0.11 | 1.59 | 0.03 | 1.85 |
| Savanna | 0.6 | 0.68 | 0.01 | 1.67 | 2.96 |
| Total 2024 | 25.73 | 70.48 | 1.62 | 2.16 | |

3.3. Dynamics of forest configuration in Lomami National Park and its periphery between 2008 and 2024
| Metrics | Date | ||
|---|---|---|---|
| 2008 | 2016 | 2024 | |
| Protected area | |||
| CA | 28189.21 | 28279.63 | 28317.68 |
| PN | 17934 | 16546 | 161400 |
| LPI | 55.27 | 56.22 | 56.58 |
| ED | 8.62 | 8.59 | 8.57 |
| AI | 98.12 | 98.27 | 98.51 |
| Periphery | |||
| CA | 10062.11 | 9629.98 | 8941.13 |
| PN | 30161 | 35274 | 35354 |
| LPI | 48,10 | 46.60 | 46,49 |
| ED | 36.65 | 36.92 | 38.84 |
| AI | 83.99 | 82.25 | 81.64 |
| Period | Protected area | Periphery |
|---|---|---|
| 2008-2016 | Aggregation | Dissection |
| 2016-2024 | Aggregation | Dissection |
4. Discussion
4.1. Methodological approach
4.2. Spatial dynamics of Lomami National Parc and its periphery between 2008 and 2024
4.3. Implications for conservation and management of Lomami National Parc and its periphery
5. Conclusions
Author Contributions
Funding
Data Availability Statement
Acknowledgments
Conflicts of Interest
References
- Laurance, W.F.; Sayer, J.; Cassman, K.G. Agricultural expansion and its impacts on tropical nature. Trends Ecol. Evol. 2014, 29, 107–116. [Google Scholar] [CrossRef] [PubMed]
- Malhi, Y.; Roberts, J.; Betts, R.; Killeen, T.; Li, W.; Nobre, C.A. Climate change, deforestation, and the fate of the Amazon. Science 2008, 319, 169–172. [Google Scholar] [CrossRef] [PubMed]
- Nepstad, D.; McGrath, D.; Stickler, C.; Alencar, A.; Azevedo, A.; Swette, B.; Bezerra, T.; Digiano, M.; Shimada, J.; Seroa Da Motta, R.; Armijo, E.; Castello, L.; Brando, P.; Hansen, M.C.; Mcgrath-Horn, M.; Carvalho, O.; Hess, L. Slowing Amazon deforestation through public policy and interventions in beef and soy supply chains. Science 2014, 344, 1118–1123. [Google Scholar] [CrossRef]
- Ramutsindela, M.; Guyot, S.; Boillat, S.; Giraut, F.; Bottazzi, P. The Geopolitics of Protected Areas. Geopolitics 2020, 25, 240–266. [Google Scholar] [CrossRef]
- Saatchi, S.S.; Harris, N.L.; Brown, S.; Lefsky, M.; Mitchard, E.T.; Salas, W.; Zutta, B.R.; Buermann, W.; Lewis, S.L.; Hagen, S.; Petrova, S.; White, L.; Silmani, M.; Morel, A. Benchmark map of forest carbon stocks in tropical regions across three continents. Proc. Natl. Acad. Sci. USA 2011, 108, 9899–9904. [Google Scholar] [CrossRef] [PubMed]
- Dalimier, J.; Achard, F.; Delhez, B.; Desclée, B.; Bourgoin, C.; Eva, H.; Gourlet-Fleury, S.; Hansen, M.; Kibambe, J.-P.; Mortier, F.; Ploton, P.; Réjou-Méchain, M.; Vancutsem, C.; Jungers, Q.; Defourny, P. Distribution of forest types and evolution according to their use. Landscape Ecol. Eng. 2018, 14, 135–146. [Google Scholar] [CrossRef]
- Eba’a Atyi, R.; Hiol Hiol, F.; Lescuyer, G.; Mayaux, P.; Defourny, P.; Bayol, N.; Saracco, F.; Pokem, D.; Sufo Kankeu, R.; Nasi, R. Congo Basin Forests: Forest Status 2021. CIFOR, Bogor, Indonesia, 2022. Available online: https://publications.cirad.fr/une_notice.php?dk=601271 (accessed on 28 Oct 2024).
- De Wasseige, C.; Tadoum, M.; Eba’a Atyi, R.; Doumenge, C. The Forests of the Congo Basin: State of the Forests 2021. CIFOR, 2022.
- Hansen, M.C.; Potapov, P.V.; Moore, R.; Hancher, M.; Turubanova, S.A.; Tyukavina, A.; Thau, D.; Stehman, S.V.; Goetz, S.J.; Loveland, T.R.; Kommareddy, A.; Egorov, A.; Chini, L.; Justice, C.O.; Townshend, J.R.G. High-Resolution Global Maps of 21st-Century Forest Cover Change. Science 2013, 342, 850–853. [Google Scholar] [CrossRef]
- FAO. State of the World's Forests 2009; FAO, 2009. Available online: https://www.fao.org/4/i0350e/i0350e00.htm (accessed on 28 Oct 2024).
- Kabanyegeye, H.; Masharabu, T.; Sikuzani, Y.U.; Bogaert, J. Perception sur les Espaces Verts et leurs Services Écosystémiques par les Acteurs Locaux de la Ville de Bujumbura (République du Burundi). Tropicultura 2020, 38, 1–17. [Google Scholar]
- WWF. Wildlife and protected areas. Worldwide Fund for Nature 2021. Available online: https://www.wwfdrc.org/en/our_work/wildlife___protected_areas/ (accessed on 27 October 2024).
- Hart, J.; Lomami National Park: A New Protected Area in D.R. Congo. Searching for Bonobo in Congo, 2016. Available online: https://www.bonoboincongo.com/2016/07/13/lomami-national-park-a-new-protectedarea-in-d-r-congo (accessed on 27 October 2024).
- 14Hart, J.A.; Omene, O.; Hart, T.B. Vouchers Control for Illegal Bushmeat Transport and Reveal Dynamics of Authorised Wild Meat Trade in Central Democratic Republic of Congo (DRC). Afr. J. Ecol. 2022, 60, 222–228. [Google Scholar] [CrossRef]
- Martin, T.G.; Nally, S.; Burbidge, A.A.; Arnall, S.; Garnett, S.T.; Hayward, M.W.; Lumsden, L.F.; Menkhorst, P.; McDonald-Madden, E.; Possingham, H.P. Acting fast helps avoid extinction. Conserv. Lett. 2012, 5, 274–280. [Google Scholar] [CrossRef]
- Possingham, H.P.; Wintle, B.A.; Fuller, R.A.; Joseph, L.N. The conservation return on investment from ecological monitoring. In Biodiversity Monitoring in Australia, 2nd ed.; Lindenmayer, D.B., Gibbons, P., Eds.; CSIRO Publishing: Collingwood, Australia, 2012; pp. 49–61. [Google Scholar]
- Salomon, W.; Sikuzani, Y.U.; Kouakou, A.T.M.; Barima, Y.S.S.; Joseph, K.H.; Theodat, J.M.; Bogaert, J. Landscape dynamics of the Forêt des Pins National Natural Park in Haiti (1973–2018). Tropicultura 2021, 2. [Google Scholar] [CrossRef]
- König, C.; Weigelt, P.; Schrader, J.; Taylor, A.; Kattge, J.; Kreft, H. Biodiversity data integration—the significance of data resolution and domain. PLoS Biol. 2019, 17, e3000183. [Google Scholar] [CrossRef] [PubMed]
- Potapov, P.V.; Turubanova, S.A.; Hansen, M.C.; Adusei, B.; Broich, M.; Altstatt, A.; Mane, L.; Justice, C.O. Quantifying Forest Cover Loss in Democratic Republic of the Congo, 2000–2010, with Landsat ETM+ Data. Remote Sens. Environ. 2012, 122, 106–116. [Google Scholar] [CrossRef]
- Alempijevic, D.; Boliabo, E.M.; Coates, K.F.; Hart, T.B.; Hart, J.A.; Detwiler, K.M. A natural history of Chlorocebus dryas from camera traps in Lomami National Park and its buffer zone, Democratic Republic of the Congo, with notes on the species status of Cercopithecus salongo. American Journal of Primatology 2021, 83, e23261. [Google Scholar] [CrossRef]
- Batumike, R.; Imani, G.; Urom, C.; Cuni-Sanchez, A. Bushmeat hunting around Lomami National Park, Democratic Republic of the Congo. Oryx 2021, 55, 421–431. [Google Scholar] [CrossRef]
- Fasbender, D.; Yamba, U.; Keuk, K.; Hart, T.; Hart, J.; Furuichi, T. Bonobo social organization at the seasonal forest-savanna ecotone of the Lomami national park. Am. J. Primatol. 2022, 84, e23448. [Google Scholar] [CrossRef]
- Shabani, E.; Tambwe, E.L.; Wembo, O.N.; Bolonga, A.B.; Lingofo, R.B.; Kankonda, A.B. Ichthyofauna in the Lomami National Park and Its Hinterlands, Democratic Republic of the Congo. Asian Journal of Fisheries and Aquatic Research 2023, 25, 166–184. [Google Scholar] [CrossRef]
- Batumike, R.; Imani, G.; Bisimwa, B.; Mambo, H.; Kalume, J.; Kavuba, F.; Cuni-Sanchez, A. Lomami Buffer Zone (DRC): Forest composition, structure, and the sustainability of its use by local communities. Biotropica 2022, 54, 289–300. [Google Scholar] [CrossRef]
- Hocking, M. & O’Regan, S. Carrion communities as indicators in fisheries, wildlife management, and conservation. Carrion ecology, evolution, and their applications. CRC Press, Boca Raton 2015, 495-516.
- Powlen, K.A.; Gavin, M.C.; Jones, K.W. Management effectiveness positively influences forest conservation outcomes in protected areas. Biological Conservation 2021, 260, 109192. [Google Scholar] [CrossRef]
- Useni, S.Y.; Mpanda, M.M.; Mwenya, I.K.; Muteya, H.K.; Nghonda, D.D.N.; Mukendi, N.K.; Malaisse, F.; Kaj, F.M.; Mwembu, D.D.D.; Bogaert, J. Quantifying Forest Cover Loss during the COVID-19 Pandemic in the Lubumbashi Charcoal Production Basin (DR Congo) through Remote Sensing and Landscape Analysis. Ressources 2024, 13, 95. [Google Scholar] [CrossRef]
- Khoji, M.H.; Mpanda, M.M.; Mwenya, I.K.; Malaisse, F.; Nghonda, D.N.; Mukendi, N.K.; Bastin, J.-F.; Bogaert, J.; Useni, S.Y. Protected area creation and its limited effect on deforestation: Insights from the Kiziba-Baluba hunting domain (DR Congo). Trees, Forests and People 2024, 18, 100654. [Google Scholar] [CrossRef]
- Useni, S.Y.; Khoji, M.H.; Bogaert, J. Miombo woodland, an ecosystem at risk of disappearance in the Lufira Biosphere Reserve (Upper Katanga, DR Congo)? A 39-year analysis based on Landsat images. Glob. Ecol. Conserv. 2020, 24, e01333. [Google Scholar] [CrossRef]
- Wu, J. Key concepts and research topics in landscape ecology revisited: 30 years after the Allerton Park workshop. Landscape Ecol. 2013, 28, 1–11. [Google Scholar] [CrossRef]
- Allen, B.; Olsvig-Whittaker, L.; Aronson, J. ZEV NAVEH 1919–2011: A lifetime of leadership in restoration ecology and landscape ecology. Restoration Ecology 2011, 19, 431–432. [Google Scholar] [CrossRef]
- Musavandalo, C.M.; Sambieni, K.R.; Mweru, J.-P.M.; Bastin, J.-F.; Ndukura, C.S.; Nguba, T.B.; Balandi, J.B.; Bogaert, J. Land cover dynamics in the northwestern Virunga landscape: An analysis of the past two decades in a dynamic economic and security context. Land 2024, 13, 566. [Google Scholar] [CrossRef]
- Useni, S.Y.; Mpanda, M.M.; Malaisse, F.; Kazaba, K.P.; Bogaert, J. The spatiotemporal changing dynamics of miombo deforestation and illegal human activities for forest fire in Kundelungu National Park, Democratic Republic of the Congo. Fire 2023, 6, 1–21. [Google Scholar] [CrossRef]
- Reddy, C.S. Remote sensing of biodiversity: What to measure and monitor from space to species? Biodivers. Conserv. 2021, 30, 2617–2631. [Google Scholar] [CrossRef]
- Ganivet, E.; Bloomberg, M. Towards rapid assessments of tree species diversity and structure in fragmented tropical forests: A review of perspectives offered by remotely-sensed and field-based data. For. Ecol. Manag. 2019, 432, 40–53. [Google Scholar] [CrossRef]
- Abbas, S.; Wong, M.S.; Wu, J.; Shahzad, N.; Muhammad Irteza, S. Approaches of satellite remote sensing for the assessment of above-ground biomass across tropical forests: Pan-tropical to national scales. Remote Sensing 2020, 12, 3351. [Google Scholar] [CrossRef]
- ICCN. Annual Activity Report of Lomami National Park; Congolese Institute for Nature Conservation: Maniema, D.R. Congo, 2019. [Google Scholar]
- Sosef, M.S.M.; Dauby, G.; Blach-Overgaard, A.; van der Burgt, X.; Catarino, L.; Damen, T.; Deblauwe, V.; Dessein, S.; Dransfield, J.; Droissart, V.; et al. Exploring the floristic diversity of tropical Africa. BMC Biol. 2017, 15, 15. [Google Scholar] [CrossRef]
- Sosef, M.S.M.; Gereau, R.E.; Janssens, S.B.; Kompanyi, M.; Simoes, A.R. A Curious New Species of Xenostegia (Convolvulaceae) from Central Africa, with Remarks on the Phylogeny of the Genus. Syst. Bot. 2019. [Google Scholar] [CrossRef]
- Hart, J.; Detwiler, K.M.; Gilbert, C.C.; Burrell, A.S.; Fuller, J.L.; Emetshu, M.; Hart, T.B.; Vosper, A.; Sargis, E.J.; Tosi, A.J. Lesula: A New Species of Cercopithecus Monkey Endemic to the Democratic Republic of Congo and Implications. PLoS ONE 2012, 7, e44271. [Google Scholar] [CrossRef] [PubMed]
- Khoji, M.H.; Kaki, H.M.; Kouagou., *!!! REPLACE !!!*; Sambieni, K.R.; Useni, S.Y.; Biloso, M.A.; Bogaert, J. Assessment of the spatial dynamics of primary forests within the southern Salonga National Park (DR Congo) using Landsat satellite images and in situ data. VertigO - the electronic journal in environmental sciences 2024, 24. [Google Scholar]
- Oszwald, J.; Lefebvre, A.; de Sartre, X.A.; Thales, M.; Gond, V. Analyse des directions de changement des états de surface végétaux pour renseigner la dynamique du front pionnier de Maçaranduba (Pará, Brésil) entre 1997 et 2006. Teledetection 2010, 9, 97–111. [Google Scholar]
- Demagistri, L.; Lin, Y.; Rouge, T.L. Virtual Observatory for Disseminating and Reusing Expertise in Remote Sensing. Proceedings of SAGEO 2012, Liège, Belgique, Nov 2012; Available online: https://hal.science/hal-01830214/file/sageo_20120915.pdf.
- Gorelick, N.; Hancher, M.; Dixon, M.; Ilyushchenko, S.; Thau, D.; Moore, R. Google Earth Engine: Planetary-Scale Geospatial Analysis for Everyone. Remote Sens. Environ. 2017, 202, 18–27. [Google Scholar] [CrossRef]
- Zhu, Z.; Wang, S.; Woodcock, C.E. Improvement and expansion of the Fmask algorithm: Cloud, cloud shadow, and snow detection for Landsats 4-7, 8, and Sentinel 2 images. Remote Sens. Environ. 2019, 224, 42–54. [Google Scholar] [CrossRef]
- Barima, Y.S.S.; Barbier, N.; Bamba, I.; Traore, D.; Lejoly, J.; Bogaert, J. Landscape dynamics in the Ivorian forest-savanna transition zone. Bois et Forêts des Tropiques 2009, 299, 15–25. [Google Scholar] [CrossRef]
- Phan, T.N.; Kuch, V.; Lehnert, L.W. Land Cover Classification using Google Earth Engine and Random Forest Classifier—The Role of Image Composition. Remote Sensing 2020, 12, 2411. [Google Scholar] [CrossRef]
- Di Shi; Yang, X. An Assessment of Algorithmic Parameters Affecting Image Classification Accuracy by Random Forests. Photogramm. Eng. Remote Sens. 2016, 82, 407–417. [Google Scholar] [CrossRef]
- Olofsson, P.; Foody, G.M.; Herold, M.; Stehman, S.V.; Woodcock, C.E.; Wulder, M.A. Good Practices for Estimating Area and Assessing Accuracy of Land Change. Remote Sens. Environ. 2014, 148, 42–57. [Google Scholar] [CrossRef]
- Cochran, W.G. Sampling Techniques, 3rd ed.; John Wiley & Sons: New York, NY, USA, 1977. [Google Scholar]
- Frazier, A.E.; Kedron, P. Landscape Metrics: Past Progress and Future Directions. Curr. Landscape Ecol. Rep. 2017, 2, 63–72. [Google Scholar] [CrossRef]
- 52Bogaert, J.; Mahamane, A. Landscape Ecology: Targeting Configuration and Spatial Scale. Annals of Agronomic Sciences of Benin 2005, 7, 1–15. [Google Scholar]
- Kumar, M.; Denis, D.M.; Singh, S.K.; Szabó, S.; Suryavanshi, S. Landscape Metrics for Assessment of Land Cover Change and Fragmentation of a Heterogeneous Watershed. Remote Sens. Appl.: Soc. Environ. 2018, 10, 224–233. [Google Scholar] [CrossRef]
- Cushman, S.A.; McGarigal, K.; Neel, M.C. Parsimony in landscape metrics: Strength, universality, and consistency. Ecol. Indic. 2008, 8, 691–703. [Google Scholar] [CrossRef]
- Gökyer, E. Understanding landscape structure using landscape metrics. Advances in landscape architecture, 2013. [Google Scholar]
- McGarigal, K.; Cushman, S.A.; Ene, E. FRAGSTATS v4: Spatial Pattern Analysis Program for Categorical and Continuous Maps. Computer software program produced by the authors at the University of Massachusetts, Amherst, 2012.
- Silveira dos Santos, J.; Vitorino, L.C.; Fabrega Gonçalves, C.; Corrêa Côrtes, R.M.; Cruz Alves, R.S.; Ribeiro, M.C.; Collevatti, R.G. Matrix dominance and landscape resistance affect the genetic variability and differentiation of a pioneer tree of the Atlantic Forest. Landsc. Ecol. 2022, 37, 2481–2501. [Google Scholar] [CrossRef]
- Camargo, J.A. La courbe de Lorenz : un cadre approprié pour définir des indices satisfaisants de la composition du paysage. Landsc. Ecol. 2019, 34, 2735–2742. [Google Scholar] [CrossRef]
- García-Ayllón, S.; Martínez, G. Analysis of Correlation between Anthropization Phenomena and Landscape Values of the Territory: A GIS Framework Based on Spatial Statistics. ISPRS Int. J. Geo-Inf. 2023, 12. [Google Scholar] [CrossRef]
- White, J.; Shao, Y.; Kennedy, L.M.; James, B. Campbell Landscape Dynamics on the Island of La Gonave, Haiti, 1990–2010. Land 2013, 2, 493–507. [Google Scholar] [CrossRef]
- Zhou, X.; Chu, Z.; Ji, X. Changes in the land-use landscape pattern and ecological network of Xuzhou planning area. Sci. Rep. 2024, 14, 8854. [Google Scholar] [CrossRef]
- McGarigal, K. Landscape Pattern Metrics. John Wiley & Sons, Ltd.: Hoboken, 2014. [CrossRef]
- Puyravaud, J.P. Standardizing the calculation of the annual rate of deforestation. For. Ecol. Manag. 2002, 177, 593–596. [Google Scholar] [CrossRef]
- Akanga, D.; Kyla, M.; Moore, N. Accelerating agricultural expansion in the greater Mau Forest Complex, Kenya. Remote Sensing Applications: Society and Environment 2022, 28, 100860. [Google Scholar] [CrossRef]
- Kayiranga, A.; Kurban, A.; Ndayisaba, F.; Nahayo, L.; Karamage, F.; Ablekim, A.; Ilniyaz, O. Monitoring forest cover change and fragmentation using remote sensing and landscape metrics in Nyungwe-Kibira park. J. Geosci. Environ. Protect. 2016, 4, 13–33. [Google Scholar] [CrossRef]
- Bogaert, J.; Ceulemans, R.; Salvador-Van Eysenrode, D. Decision Tree Algorithm for Detection of Spatial Processes in Landscape Transformation. Environmental Management 2004, 33, 62–73. [Google Scholar] [CrossRef] [PubMed]
- de Haulleville, T.; Rakotondrasoa, O.L.; Rakoto Ratsimba, H.; Bastin, J.F.; Brostaux, Y.; Verheggen, F.J.; Rajoelison, G.L.; Malaisse, F.; Poncelet, M.; Haubruge, É.; et al. Fourteen years of anthropization dynamics in the Uapaca bojeri Baill. For. Madagascar. Landsc. Ecol. Eng. 2018, 14, 135–146. [Google Scholar] [CrossRef]
- Bogaert, J.; Vranken, I.; Andre, M. Anthropogenic effects in landscapes: Historical context and spatial pattern. In Biocultural Landscapes Diversity, Functions and Values; Hong, S.-K., Bogaert, J., Min, Q., Eds.; Springer Science + Business Media: Dordrecht, The Netherlands, 2014; pp. 89–112. [Google Scholar] [CrossRef]
- Zaehringer, J.G.; Hett, C.; Ramamonjisoa, B.; Messerli, P. Beyond deforestation monitoring in conservation hotspots: Analysing landscape mosaic dynamics in northeastern Madagascar. Appl. Geogr. 2016, 68, 919. [Google Scholar] [CrossRef]
- Maja, M.; Ayano, S. The impact of population growth on natural resources and farmers’ capacity to adapt to climate change in low-income countries. Earth Syst. Environ. 2021, 5, 271–283. [Google Scholar] [CrossRef]
- Misra, A.; Lata, K.; Shukla, J.B. Effects of population and population pressure on forest resources and their conservation: A modeling study. Environ. Dev. Sustain. 2014, 16, 361–374. [Google Scholar] [CrossRef]
- Van Vliet, N.; Quintero, S.; Muhindo, J.; Nyumu, J.; Cerutti, P.O.; Nasi, R.; Rovero, F. Status of terrestrial mammals in the Yangambi Landscape, Democratic Republic of the Congo. Oryx 2023, 1–12. [Google Scholar] [CrossRef]
- Bamba, I.; Yedmel, M.S.; Bogaert, J. Effets des routes et des villes sur la forêt dense dans la province orientale de la République Démocratique du Congo. European Journal of Scientific Research 2010, 43, 417–429. [Google Scholar]
- Lhoest, S.; Dufrêne, M.; Vermeulen, C.; Oszwald, J.; Doucet, J.L.; Fayolle, A. Perceptions of Ecosystem Services Provided by Tropical Forests to Local Populations in Cameroon. Ecosyst. Serv. 2019, 38, 100956. [Google Scholar] [CrossRef]
- Jones, K.R.; Venter, O.; Fuller, R.A.; Allan, J.R.; Maxwell, S.L.; Negret, P.J.; Watson, J.E.M. One-Third of Global Protected Land Is under Intense Human Pressure. Science 2018, 360, 788–791. [Google Scholar] [CrossRef] [PubMed]
- Eklund, J.; Cabeza, M. Quality of governance and effectiveness of protected areas: crucial concepts for conservation planning. Ann. N. Y. Acad. Sci. 2017, 1399, 27–41. [Google Scholar] [CrossRef] [PubMed]
- Pulido-Chadid, K.; Virtanen, E.; Geldmann, J. Quelle est l’efficacité des aires protégées pour réduire les menaces qui pèsent sur la biodiversité ? Un protocole d’examen systématique. Environ. Evid. 2023, 12, 18. [Google Scholar] [CrossRef] [PubMed]
- Sloan, S.; Sayer, J. Forest Resources Assessment of 2015 shows positive global trends but forest loss and degradation persist in poor tropical countries. For. Ecol. Manag. 2015. [Google Scholar] [CrossRef]
- Decree establishing the PNL, 2016. Available online: https://www.bonoboincongo.com/wp-content/uploads/2016/12/161210_Brochure_Reduced_Size.pdf (accessed on 28 Oct 2024).
- Havyarimana, F.; Masharabu, T.; Kouao, J.K.; Bamba, I.; Nduwarugira, D.; Bigendako, M.J.; Hakizimana, P.; Mama, A.; Bangirinama, F.; Banyankimbona, G.; Bogaert, J.; De Cannière, C. La Dynamique Spatiale de la Forêt Située dans la Réserve Naturelle Forestière de Bururi au Burundi. Tropicultura 2017, 35, 158–172. [Google Scholar]
- Griscom, B.W.; Ashton, P.M.S. Restoration of Dry Tropical Forests in Central America: A Review of Pattern and Process. For. Ecol. Manag. 2011, 261, 1564–1579. [Google Scholar] [CrossRef]
- Bowman, D.M.J.S.; Balch, J.K.; Artaxo, P.; Bond, W.J.; Carlson, J.M.; Cochrane, M.A.; D'Antonio, C.M.; Defries, R.S.; Doyle, J.C.; Harrison, S.P.; Johnston, F.H.; Keeley, J.E.; Krawchuk, M.A.; Kull, C.A.; Marston, J.B.; Moritz, M.A.; Prentice, I.C.; Roos, C.I.; Scott, A.C.; Swetnam, T.W.; van der Werf, G.R.; Pyne, S.J. Fire in the Earth System. Science 2009, 324, 481–484. [CrossRef]
- Greenpeace. Landscapes of Intact Forests: Congo Basin Case Study. Available online: https://www.greenpeace.to/greenpeace/wp-content/uploads/2012/01/IFL-Congo-French.pdf (accessed on 27 October 2024).
- Banza, B.B.; Mbungu, N.T.; Siti, M.W.; Tungadio, D.H.; Bansal, R.C. Critical analysis of the electricity market in developing country municipality. Energy Reports 2022, 8, 329–337. [Google Scholar] [CrossRef]
- Bangirinama, F.B.; Nzitwanayo, B. & Hakizimana, P. Utilisation du charbon de bois comme principale source d’énergie de la population urbaine: un sérieux problème pour la conservation du couvert forestier au Burundi. Bois & Forêts des Tropiques 2016, 328, 45–53. [Google Scholar] [CrossRef]
- Trefon, T.; Hendriks, T.; Kabuyaya, N.; Ngoy, B. L’économie politique de la filière du charbon de bois à Kinshasa et à Lubumbashi. In Appui Stratégique à la Politique de Reconstruction Post-Conflit en RDC.; IOB.; GIZ.; University of Antwerp: Antwerpen, Belgium, 2010. [Google Scholar] [CrossRef]
- Andrade, G.S.; Rhodes, J.R. Protected areas and local communities: An inevitable partnership toward successful conservation strategies? Ecology and Society 2012, 17, 14. [Google Scholar] [CrossRef]
- Cabala, K.S.; Useni, S.Y.; Munyemba, K.F.; Bogaert, J. Activités Anthropiques et Dynamique Spatiotemporelle de La Forêt Claire Dans La Plaine de Lubumbashi. In Anthropisation des Paysages Katangais; Bogaert, J., Colinet, G., Mahy, G., Eds.; Presses Universitaires de Liège: Liège, Belgique, 2018; pp. 253–266. [Google Scholar]
- Balandi, J.B.; To Hulu, J.P.P.M.; Sambieni, K.R.; Sikuzani, Y.U.; Bastin, J.-F.; Musavandalo, C.M.; Nguba, T.B.; Molo, J.E.L.; Selemani, T.M.; Mweru, J.-P.M.; Bogaert, J. Urban Sprawl and Changes in Landscape Patterns: The Case of Kisangani City and Its Periphery (DR Congo). Land 2023, 12, 2066. [Google Scholar] [CrossRef]
- Kabanyegeye, H.; Useni Sikuzani, Y.; Sambieni, K.R.; Masharabu, T.; Havyarimana, F. & Bogaert, J. Trente-trois ans de dynamique spatiale de l’occupation du sol de la ville de Bujumbura, République du Burundi. Afrique Science: Revue Internationale des Sciences et Technologie 2021, 18, 203–2015. [Google Scholar]
- Meyfroidt, P.; Vu, T.P.; Hoang, V.A. Trajectories of deforestation, coffee expansion and displacement of shifting cultivation in the Central Highlands of Vietnam. Glob. Environ. Chang. 2013, 23, 1187–1198. [Google Scholar] [CrossRef]
- Useni, S.Y.; Mpanda, M.M.; Khoji, H.; Cirezi, C.; Malaisse, F.; Bogaert, J. Vegetation Fires in the Lubumbashi Charcoal Production Basin (The Democratic Republic of the Congo): Drivers, Extent and Spatiotemporal Dynamics. Land 2023, 12, 2171. [Google Scholar] [CrossRef]
- Zekeng, J.C.; Sebego, R.; Mphinyane, W.N.; Mpalo, M.; Nayak, D.; Fobane, J.L.; Onana, J.M.; Funwi, F.P.; Mbolo, M.M.A. Land use and land cover changes in Doume Communal Forest in eastern Cameroon: implications for conservation and sustainable management. Modeling Earth Syst. Environ. 2019, 5, 1801–1814. [Google Scholar] [CrossRef]
- Carmo de Souza, J.; Gonçalves Mendes, T.S.; Bignotto, R.B.; de Alcântara, E.H.; Massi, K.G. Land use dynamics in a tropical protected area buffer zone: Is the management plan helping? J. Environ. Stud. Sci. 2024. [Google Scholar] [CrossRef]
- UICN/PACO. Parks and Reserves of the Democratic Republic of Congo: Evaluation of the Management Effectiveness of Protected Areas; IUCN/PACO: Ouagadougou, BF, 2010; Available online: https://portals.iucn.org/library/node/9909 (accessed on 27 June 2024).
- Dede, M.; Sunardi, S.; Lam, K.C.; Withaningsih, S. Relationship between landscape and river ecosystem services. Glob. J. Environ. Sci. Manage. 2023, 9, 637–652. [Google Scholar]
- Nlom, J.H. A bio-economic analysis of conflicts between illegal hunting and wildlife management in Cameroon: The case of Campo-Ma’an National Park. Journal for Nature Conservation 2021, 61, 126003. [Google Scholar] [CrossRef]
- Eugé, M.C.A.; Shidiki, A.A.; Tchamba, N.M. Assessing Human-Wildlife Conflict in the Periphery of Loango National Park in Gabon. Open J. For. 2024, 14, 297–312. [Google Scholar] [CrossRef]
- Balole, E.; Ouedraogo, F.; Michel, B.; Chouamo, I.R.T. Croissance démographique et pressions sur les ressources naturelles du Parc National des Virunga. In Territoires périurbains: Développement, enjeux et perspectives dans les pays du Sud; Bogaert, J., Halleux, J.M., Eds.; Les Presses Agronomiques de Gembloux: Gembloux, Belgium, 2015; pp. 85–94. [Google Scholar]
- Aebischer, T.; Ibrahim, T.; Hickisch, R.; Furrer, R.D.; Leuenberger, C.; Wegmann, D. Apex predators decline after an influx of pastoralists in former Central African Republic hunting zones. Biological Conservation 2020, 241, 108326. [Google Scholar] [CrossRef]
- Correa Ayram, C.A.; Mendoza, M.E.; Etter, A.; Salicrup, D.R.P. Connectivité des habitats dans la conservation de la biodiversité : revue des études et applications récentes. Prog. Phys. Geogr. Earth Environ. 2016, 40, 7–37. [Google Scholar] [CrossRef]
- Alagador, D.; Trivino, M.; Cerdeira, J.O.; Bras, R.; Cabeza, M.; Araujo, M.B. Linking like with like: Optimising connectivity between environmentally-similar habitats. Landscape Ecology 2012, 27, 291–301. [Google Scholar] [CrossRef]
- Potapov, P.V.; Hansen, M.C.; Pickens, A. The role of satellite monitoring in the assessment of forest conservation and restoration: A case study in the tropics. Environmental Research Letters 2017, 12, 1–13. [Google Scholar]
- Liu, J.; Yang, H. Forest cover change: An overview of the process and monitoring systems. For. Ecol. Manag. 2013, 310, 1–10. [Google Scholar] [CrossRef]
- Berger, A.; Schofield, T.; Pickens, A.; Reiche, J.; Gou, Y. Looking for the Quickest Signal of Deforestation? Turn to GFW’s Integrated Alerts. Available online: https://www.globalforestwatch.org/blog/data-and-research/integrateddeforestation-alerts/ (accessed on 27 October 2024).
- Moffette, F.; Alix-Garcia, J.; Shea, K.; et al. The impact of near-real-time deforestation alerts across the tropics. Nat. Clim. Chang. 2021, 11, 172–178. [Google Scholar] [CrossRef]
- Jiménez López, J.; Mulero-Pázmány, M. Drones for Conservation in Protected Areas: Present and Future. Drones 2019, 3, 10. [Google Scholar] [CrossRef]
- Tang, G.; Shao, G. Drone remote sensing for forestry research and practices. J. For. Res. 2015, 26, 791–797. [Google Scholar] [CrossRef]
- Charbonneau, P.; Lemaître, J. Revue des applications et de l’utilité des drones en conservation de la faune. Nat. Can. 2021, 145, 3–34. [Google Scholar] [CrossRef]
- Petit, J.; Vancutsem, C. Use of Drones to Monitor Deforestation in Conservation Areas: The Gabonese Case. Journal of Environmental Management 2018, 213, 10–18. [Google Scholar] [CrossRef]
- Silva, C.A.; Barros, J.A. Drones for monitoring deforestation in the Amazon: A review of current applications and future prospects. Remote Sensing 2018, 10, 1–20. [Google Scholar] [CrossRef]
- Anderson, K.; Gaston, K.J. Lightweight unmanned aerial vehicles will revolutionize spatial ecology. Frontiers in Ecology and the Environment 2013, 11, 138–146. [Google Scholar] [CrossRef]
- UNESCO. Education and awareness for biodiversity conservation; UNESCO, 2022. Available online: https://www.unesco.org/en/biodiversity/education (accessed on 27 June 2024).
- Ballantyne, R.; Packer, J. Promoting environmentally sustainable attitudes and behavior through free-choice learning experiences: What is the state of the game? Environmental Education Research 2016, 22, 407–429. [Google Scholar] [CrossRef]
- Rojas, C.; Córdova, J. Drones for environmental monitoring in Ecuador: Applications and challenges. Journal of Environmental Management 2019, 245, 1–10. [Google Scholar] [CrossRef]
- Mora, F.; Stewardship, B. Drones transforman la agricultura en Ecuador y LATAM. El Productor, 2024. Available online: https://elproductor.com/2024/08/drones-transforman-la-agricultura-en-ecuador-y-latam/ (accessed on 27 June 2024).
- Jacobi, J.; Schneider, M.; Bottazzi, P.; Pillco, M.; Calizaya, P.; Rist, S. Agroforestry in Bolivia: Opportunities and Challenges in the Context of Food Security and Food Sovereignty. Environ. Conserv. 2016, 43, 307–316. [Google Scholar] [CrossRef]
- Brandt, R.; Zimmermann, H.; Hensen, I.; Mariscal Castro, J.C.; Rist, S. Agroforestry species of the Bolivian Andes: An integrated assessment of ecological, economic and socio-cultural plant values. Agrofor. Syst. 2012, 86, 1–16. [Google Scholar] [CrossRef]
- Tacconi, L.; Mahanty, S.; Suich, H. The livelihood impacts of payments for environmental services and implications for REDD+. Soc. Nat. Resour. 2013, 26, 733–744. [Google Scholar] [CrossRef]
- Chhetri, B.; Larsen, H.; Smith-Hall, C. Law enforcement in community forestry: Consequences for the poor. Small-Scale For. 2012, 11, 435–452. [Google Scholar] [CrossRef]
- Karsenty, A.; Ferron, C. Forest Governance and REDD+ in the Democratic Republic of Congo: The Need for Rethinking Participation and Institutional Arrangements. Forests 2020, 11, 953. [Google Scholar] [CrossRef]
- Mpoyi, A.M.; Nyamwoga, F.B.; Kabamba, F.M.; Assembe-Mvondo, S. The context of REDD+ in the Democratic Republic of Congo: Drivers, agents, and institutions. CIFOR. Available online: https://www.cifor.org/knowledge/publication/4267/ (accessed on 28 October 2024).
- Mpanda, M.M.; Khoji, M.H.; N’Tambwe, N.D.D.; Sambieni, R.K.; Malaisse, F.; Cabala, K.S.; Bogaert, J.; Useni, S.Y. Uncontrolled Exploitation of Pterocarpus tinctorius Welw. and Associated Landscape Dynamics in the Kasenga Territory: Case of the Rural Area of Kasomeno (DR Congo). Land 2022, 11, 1541. [Google Scholar] [CrossRef]
- Sylla, S.F.; Ndiaye, P.I.; Lindshield, S.M.; Bogart, S.L.; Pruetz, J.D. The western chimpanzee (Pan troglodytes verus) in the antenna zone (Niokolo Koba National Park, Senegal): Nesting ecology and sympatrics with other mammals. Appl. Ecol. Environ. Res. 2022, 20. [Google Scholar] [CrossRef]
| Land cover class | Description | Illustration | Number of training zones (Polygone) |
|---|---|---|---|
| Forest | Natural land cover class representing areas predominantly covered with trees and dense vegetation. |  |
100 |
| Urbanization and agriculture complex | Anthropogenic land cover class consisting of built-up and bare soil, as well as the adjacent agricultural lands. | 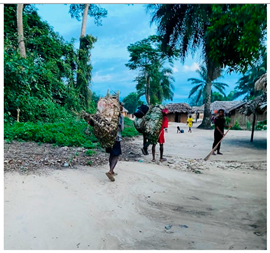 |
100 |
| Water | Natural land cover class including water bodies such as rivers and other water masses. | 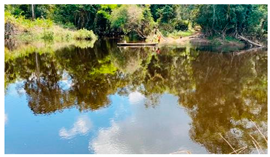 |
100 |
| Savannah | Anthropic land cover class characterized by grassy vegetation formations with a cover of tall grasses measuring less than 80 cm in height. | 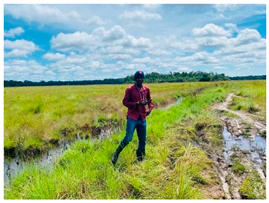 |
100 |
| Index | Ecological signification |
|---|---|
| Class area (CA) | This index measures the total area of all patches within a given land use class. A high total area in natural zones indicates continuity and integrity of ecosystems, whereas a reduced area suggests fragmentation due to anthropogenic activities [55 ,56]. An intact landscape will have a high total area for natural classes, reflecting minimally disturbed ecosystems. |
| Patch number (PN) | This index counts the number of distinct patches or fragments of a class within the landscape. An increase in the number of patches, coupled with a decrease in total area, reveals heightened fragmentation, often resulting from agricultural or urban activities [56]. A high number of patches in a disturbed landscape indicates division into smaller fragments, which reduces habitat connectivity. |
| Largest Pacth Index (LPI) | It represents the proportion of the area occupied by the largest patch of a class relative to the total area of all patches of that land cover class. A high value indicates low fragmentation, suggesting that the land cover class is relatively continuous [57,58]. This reflects a predominant presence of large patches in a minimally disturbed landscape. |
| Disturbance index (U) | This ratio between the cumulative area of anthropogenic classes and that of natural classes measures the predominance of anthropogenic pressure in the landscape [59,60]. A value less than 1 indicates dominance of natural classes, while a value greater than 1 reveals a strong anthropogenic influence. This index helps to understand the impact of human activities on the landscape pattern. |
| Agrégation Index (AI) | It measures the degree of aggregation or dispersion of patches within a class. A high index value indicates that the patches are closely grouped and form continuous blocks, whereas a low index value suggests greater dispersion and fragmentation [61]. This index provides insights into habitat continuity and ecological connectivity. |
| Edge density (ED) | This index quantifies the total length of patch edges per hectare, measuring the roughness of the patches. A high edge density indicates greater complexity of the patches, often associated with increased fragmentation [62]. Edge density provides information on patch structure and the extent of fragmentation. |
| 2008-2016 | ||||||||
| Forest | UAC | Water | Savanna | Forest Gain | UAC Gain | Water Gain | Savanna Loss | |
| Pr [%] | 84.22 | 84.25 | 83.22 | 83.34 | 83.12 | 84.23 | 83.55 | 85.22 |
| Pu [%] | 85.25 | 85.22 | 83.56 | 83.46 | 85.12 | 83.12 | 84.38 | 83.34 |
| 95% CI | 0.42 | 0.44 | 0.47 | 0.45 | 0.46 | 0.46 | 0.39 | 0.43 |
| PG | 85.33 | |||||||
| 2016-2024 | ||||||||
| Forest | Rural Complex | Water | Savanna | Forest Gain | Rural Complex Gain | Water Gain | Savanna Loss | |
| Pr [%] | 84.33 | 84.55 | 86.33 | 84.52 | 84.22 | 84.66 | 84.33 | 83.44 |
| Pu [%] | 84.88 | 83.46 | 85.56 | 83.23 | 84.75 | 82.23 | 84.66 | 88.24 |
| 95% CI | 0.36 | 0.41 | 0.42 | 0.48 | 0.38 | 0.47 | 0.42 | 0.46 |
| PG | 85.82 | |||||||
Disclaimer/Publisher’s Note: The statements, opinions and data contained in all publications are solely those of the individual author(s) and contributor(s) and not of MDPI and/or the editor(s). MDPI and/or the editor(s) disclaim responsibility for any injury to people or property resulting from any ideas, methods, instructions or products referred to in the content. |
© 2024 by the authors. Licensee MDPI, Basel, Switzerland. This article is an open access article distributed under the terms and conditions of the Creative Commons Attribution (CC BY) license (http://creativecommons.org/licenses/by/4.0/).


