Preprint
Article

Intensity-Based Quantification of Land Use Dynamics in Biodiversity Hotspot Area of Southern Rift Valley Basin, Ethiopia

This version is not peer-reviewed.

Submitted:

29 October 2024

Posted:

31 October 2024

You are already at the latest version

Abstract
Although enriched biodiversity and ecological services, most of Ethiopia’s protected areas currently operate at minimum functionality status with terrible biodiversity loss due to anthropogenic‑driven land use change(LUC) and degradation. Despite efforts made to quantify a few aspects, there is no full information regarding the entire LUC patterns and processes which are vital for better understanding and feasible interventions. This study quantified the LUC characteristics compressively at interval, category and transition levels(1986 to 2002 and 2002 to 2020) in Nechsar National Park(NNP) using intensity analysis model, based on the area coverage data of six land types extracted from Landsat imageries. Results revealed ≈78% of the study area exhibited LUC, of which 50.41% was net change during the last 34 years. The change intensity was faster(1.8%) in 2nd time interval than 1st (1.7%). Besides >82% persistent land, net gain was observed in bush/shrub(147%), cultivated(127%) and water(15%) at the cost of 39%(10435ha) net loss from woodland, forest and grassland. The most active gain of cultivated and bush/shrub was intensively targeted forest and woodland, respectively, and avoided others. Beyond losing ≈50% of land, woodland followed by forest experienced the most active loss, profoundly attributed to the intensiveness of the drivers rather than area proportion, while its gain was dormant. Generally, the study indicates NNP has been under serious transition processes with negative implications for biodiversity and ecosystem services. It also provides adequate evidence regarding stationarities, highly vulnerable ecosystems and targeted interventions to sustain and scale up the parks’ functionality.
Keywords: 
Subject: 
Environmental and Earth Sciences  -   Environmental Science

1. Introduction

Among the global challenges in the 21st Century, LUC is a rapidly growing environmental problem [1], negatively altering the entire functions of Earth [2]. Recent studies [3,4,5,6] confirm that the pressures of LUC inflicted on Earth’s ecological functions have been pervasive and intensive, resulting in unprecedented deterioration in global ecosystems and biodiversity over the last few decades. In this study, LUC refers to the conversion, modification, and management of landscapes/natural ecosystems/ primarily by human activities [7]. It is a long-lasting phenomenon derived from the effects of human and natural factors; essential for socioeconomic development and ecological balances [8]. Nevertheless, the widespread and intensive LUC, predominantly, massive transitions from natural ecosystems to human land uses have been observed over the last few decades because of increasing land and natural resources demand for agricultural activities [7,9], urbanization and industrialization [10] accompanied by environmentally harmful development strategies [3]. Despite the short-term contribution to socioeconomic enhancement [11]; these land transition processes are strikingly jeopardizing the earth’s ecosystems and biodiversity [4,12]; with estimated loss of >63% of ecosystem services [13]. As a result, people worldwide, largely in developing countries have suffered from catastrophic environmental and socioeconomic challenges: climate change [2] and chronic poverty and food security [1].
Following the multitudinous impacts of human-triggered LUC and degradation; sustainable conservation and use of biodiversity have become the agendas of researchers, planners and governments and measures have been undertaken from local to global levels [3]. Designating biodiversity hotspot sites as protected areas(PAs) is one of the measures taken [6]. Biodiversity hotspots are natural ecosystems, characterized by a significant concentration of flora and fauna diversity with a high level of endemism but susceptible to anthropogenic impacts [14]. PAs including National parks are conceived as the most important strategy for sustainable biodiversity conservation with marked improvement in ecosystems and the services they provide [6,15,16,17]. They have been also recognized as productive places for restoring critically/endangered species and maintaining ecological integrity [12]. Generally, cognizant the potential advantages, the area and number of PAs have shown a radical increment; today there are over 155,584 PAs worldwide [18]. However, due to rapidly growing human encroachments, PAs worldwide are under pervasive LUC and multifaceted ecological problems including massive habitat conversion and degradation, biodiversity loss, and species extinction [14,16]. The magnitude and adverse impacts are more deleterious in PAs found in developing countries because of cumbersome demographic, socioeconomic, political, and administrative challenges [12,17], specifically in Sub-Saharan Africa region where more than 82% of the PAs are under the state of deterioration/failures with 10% only in success/recovery [10].
In this region, Ethiopia has been recognized as one of the countries rich in biodiversity with a wide range of ecosystems [6]. Nevertheless, over the last few decades, due to rapid and intensive land conversion from forest, grass and woodlands to agricultural and settlement areas [9,19] and massive wood production for multitudinous socioeconomic benefits [20] coupled with unsustainable land management practices [21], the country has faced a substantial cascading of ecosystems and biodiversity; subsequently with serious land degradation and socioeconomic crises: prolonged poverty and food insecurity [22]. These situations coupled with aggressive population growth have forced anthropogenic pressures toward biodiversity-enriched/hotspots/areas and markedly worsened the deterioration of biodiversity and ecosystem services [6,23]. To tackle the daunting impacts of environmental degradation and preserve biodiversity-enriched areas from anthropogenic pressures, the government of Ethiopia has established different PAs including twenty national parks since the 1960s [24]. However, like other developing countries, PAs in Ethiopia including NNP (where this study was undertaken) have been under extensive LUC and degradation due to significant habitat conversion to agricultural and settlement areas, livestock grazing, and fuel and construction wood production [25,26,27]. Moreover, LUC and the resulting impacts such as habitat and biodiversity degradation are aggravated by the expansion of invasive species, recurrent wildfires and weak administrative measures [6]. There by, currently, almost all PAs have lost their functionality, the survival of many wildlife has reached a critical stage and they stand on the verge of failure [28].
Among gazetted PAs, NNP is the most biodiverse [flora and fauna} with a large number of endemic and critically/endangered species in Ethiopia [29] and multifold ecological and socioeconomic advantages [6]. Considering the huge potential for biodiversity conservation, it has been registered as one of the major African floristic areas and global biodiversity sites [27]. Nevertheless, NNP is currently one of Ethiopia’s Pas that extremely vulnerable to human-induced LUC and degradation where natural resources are the primary source of livelihood, economic and sociocultural practices for rapidly growing millions of semi/pastoralists and urban dwellers living in and around the park [30].
In general, the pressing loss of functionality of Ethiopia’s PAs is mainly attributed for anthropogenic-driven habitat conversion and degradation. Thus, to monitor the ongoing changes, restore degraded ecosystems and direct the future management and anthropogenic use plans toward sustaining the functionality of PAs; analyzing and mapping of the spatiotemporal dynamics of LUC is imperative. Although several studies have been conducted to address the problems of PAs in Ethiopia, the attention given to analysis and mapping LUC dynamics is scant [25,26,27,30,31,32,33,34]. Moreover, the LUC observed at any spatiotemporal level is characterized by interdependent and complex steps, transition patterns, and processes and also has a relationship with changes in other spatiotemporal levels [35]. Analyzing the entire LUC processes comprehensively and concurrently via a robust model with rigorous procedures is, therefore, necessary for sound conclusions, informed decisions and enhanced management plans [35,36]. Specifically, a detailed assessment and precise measurement of land transition patterns and process for PAs is imperative to show the extent of the change to local people and improve their awareness, identify vulnerable ecosystems, examine key transition and stationary patterns, and develop ecosystem-targeted restoration and protection strategies. However, the previous studies in PAs including NNP did not assess the complete LUC characteristics and have failed to provide full information about change processes and patterns. Even at the national level most of the studies have focused on some aspects of LUC [8]. Thus, the change analysis methods applied in these studies were not enough to accommodate all the necessary steps, patterns and processes of LUC and considerably excluded the effects of length of time intervals, areal extent, and strength of the changes, which markedly discourage, planners, policy and decision-makers from informed decision and policy-making processes for sustainable management and use of biodiversity.
Furthermore, due to considerable deviations in anthropogenic pressures, and ecological setups of PAs, the magnitude and transition patterns of LUC have deviations as shown by earlier studies in Ethiopia and other developing countries [17,37,38]. Thus, for a better understanding of the change extent and also to make actionable strategies considering conditions at local level including, demographic and socioeconomic variables; analysis of LUC for each protected area is extremely crucial and recommended by many researchers [25,26,37,39]. Therefore, based on the mentioned gaps above, this study aimed to quantify the entire LUC characteristics in NNP at three levels(interval, category and transition) using a compressive mathematical model; intensity analysis [35] from 1986 to 2002 (First Time Interval /FTIS/), and 2002 to 2020 (Second Time Interval/STIS/). The study also answered the following questions; in which the study’s time interval, the overall change intensity is fast/slow? which land types’ gain and loss are active/dormant? Why? Which land types are most intensively increased or decreased? Why? which transitions are most intensively avoided/targeted by a given land use type? which transitions in which land types are stationary across the study time interval? Finally, what is the implication of LUC observed in NNP for biodiversity, wild animals’ habitat, and livelihoods?

2. Methods and Materials

2.1. Study Area

The study area, NNP is located East of Arba Minch town at the upper part of Segen river catchment in the Southern part of Ethiopian Rift Valley Basin. With the area of 41400 ha and altitudinal range from 1,086 to 1642 m asl; NNP is situated between 50 51'- 60 05' N and 370 32'-370 48' E (Figure 1). The climate condition is a hot tropical type climate mainly characterized by inadequate and unpredictable trend of rainfall [29]. According to the data from the Ethiopian Meteorological Agency(EMA, 2022); the total annual rainfall ranges from 622 to 1177 mm with an average value of 888.38 mm. The average annual minimum and maximum temperature are between 16 and 20 0C, 30 and 35 0C, respectively (Figure S 1).
NNP is occupied by markedly diversified terrestrial and aquatic ecosystems. The terrestrial ecosystem ranges from evergreen natural riverain forest at the Western and Eastern edges; woodland and bushlands on the volcanic hill (locally named ‘God’s Bridge’) to savannah grassland on the plain of Eastern part [30]. NNP is also known for its hosting large number of endemic, and endangered species in Ethiopia [40,41]; protecting these species, specifically Swayne’s Hartebeest and plain Zebra is the main objective while it was primarily gazetted in 1974. As estimations show the park accounts for nearly 20% of the national biodiversity with more than 90 mammals, 350 bird and 800 – 1000 plant species [24,29]. Apart from ecological advantages, for a long time, the park has served as vital asset for the socioeconomic activities of many urban and rural populations. However, recently, due to population growth, the rapidly expanded and intensified socioeconomic interventions: cultivated and settlement areas, livestock grazing and wood production jointly with administrative and political complications exposed the park to widespread LUC and degradation, lead to significant habitats and biodiversity loss [29].

2.2. Data Source, Image Pre-Processing and Land Use Classification

In this study, a medium resolution(30 m) Landsat imagery of TM (1986), ETM+ (2002) and OLI (2020) that projected to UTM projection, zone 37 and WGS84 datum, were downloaded from USGS’s database(C2L2) (http://glovis.usgs.gov) for land use classification and change analyses. For the detailed descriptions of imageries used in this study (see Table S 1). In addition, ancillary data such as Google Earth, SAS Planet, and toposheet were utilized in this study.
Using ERDAS Imagine_ 2014; the necessary image preprocessing activities: geometric correction with a 1:50,000 topographic map (1986) and atmospheric correction were performed before the land classification process was undertaken. To identify the major land use types: forest land (FL), woodland (WL), bush/shrubland (BS), grassland (GL); water area (WA), and cultivated land (CL); interviews with elders living in and around and workers of NNP, intensive field surveys, and review of previous studies [27,30,34] were made. The reference and training points for 2020 were collected via GARMIN-GPS during field observations, while, the topographic map, Google Earth and NDVI values were utilized for 1986 and 2002. The Image classification process was undertaken in ArcGIS_10.8.1 using unsupervised (ISODATA) and Support Vector Machine (SVM) methods. SVM is a roust for land classification with less sensitivity to the effects of noise and unequal number of training points compared with other Supervised classification algorithms [42,43]. During the classification process, misclassification was observed between bush and shrubland, and cultivated and settlement areas. This problem was solved by amalgamation of shrubland with bushland, and cultivated land with settlement areas; which was applied and suggested by several researchers [44,45,46]. The nomenclature and descriptions for land use types are presented in (Table S 2)

2.3. Sampling and Accuracy Assessment(AC) Methods

AC is necessary and essential to check the quality of classified images [25,47]. Accordingly, the Kappa coefficient (Khat) was applied to check the accuracy of all classified land use maps in this study (equ. 1); the most widely used index for accuracy assessment in LUC research [48]. In addition, the total sample size(number of ground truth points) for AC was specified based on equation (2), and sample size for each land type was also obtained based on the proportional stratified sampling method with consideration of the rule of thumb set by [48] and presented in(Table S 3).
  Khat = N i = 1 r X i i i = 1 r X i t X t i N 2 i = 1 r X i t X t i
Where; r is the number of rows in the matrix, xii is the number of observations in row i and column i, xit and xti are the marginal totals of row i and column i respectively, and N is the total number of observations.
n = B i   1 i b i 2
Where; n is the total sample, B is determined from a chi-square table with 1 degree of freedom and 1 - α /k, (for this study, χ2 (1, 0.01) = 6.63. k is the number of land types (k = 6); a is the precision error tolerance (0.05), b is desire precision (96%) and ∏i is the proportionate size of the ith land type out of k types.
The results of AC are presented in (Table S 4). The OA and Khat levels for the classified land use map of 2020 were 96.22 and 95.20%, respectively. Similarly, 92.92 and 94.97% of OA and 90.84 and 93.52% of Khat coefficients were attained for land use maps of 1986 and 2002, respectively. These results indicate the agreement across all land types between the ground truth points and classified maps for all years is strong enough(Khat > 80%), and the classified maps are adequately sufficient to post classification operations including change detections [48].

2.4. Intensity Analysis (IA)

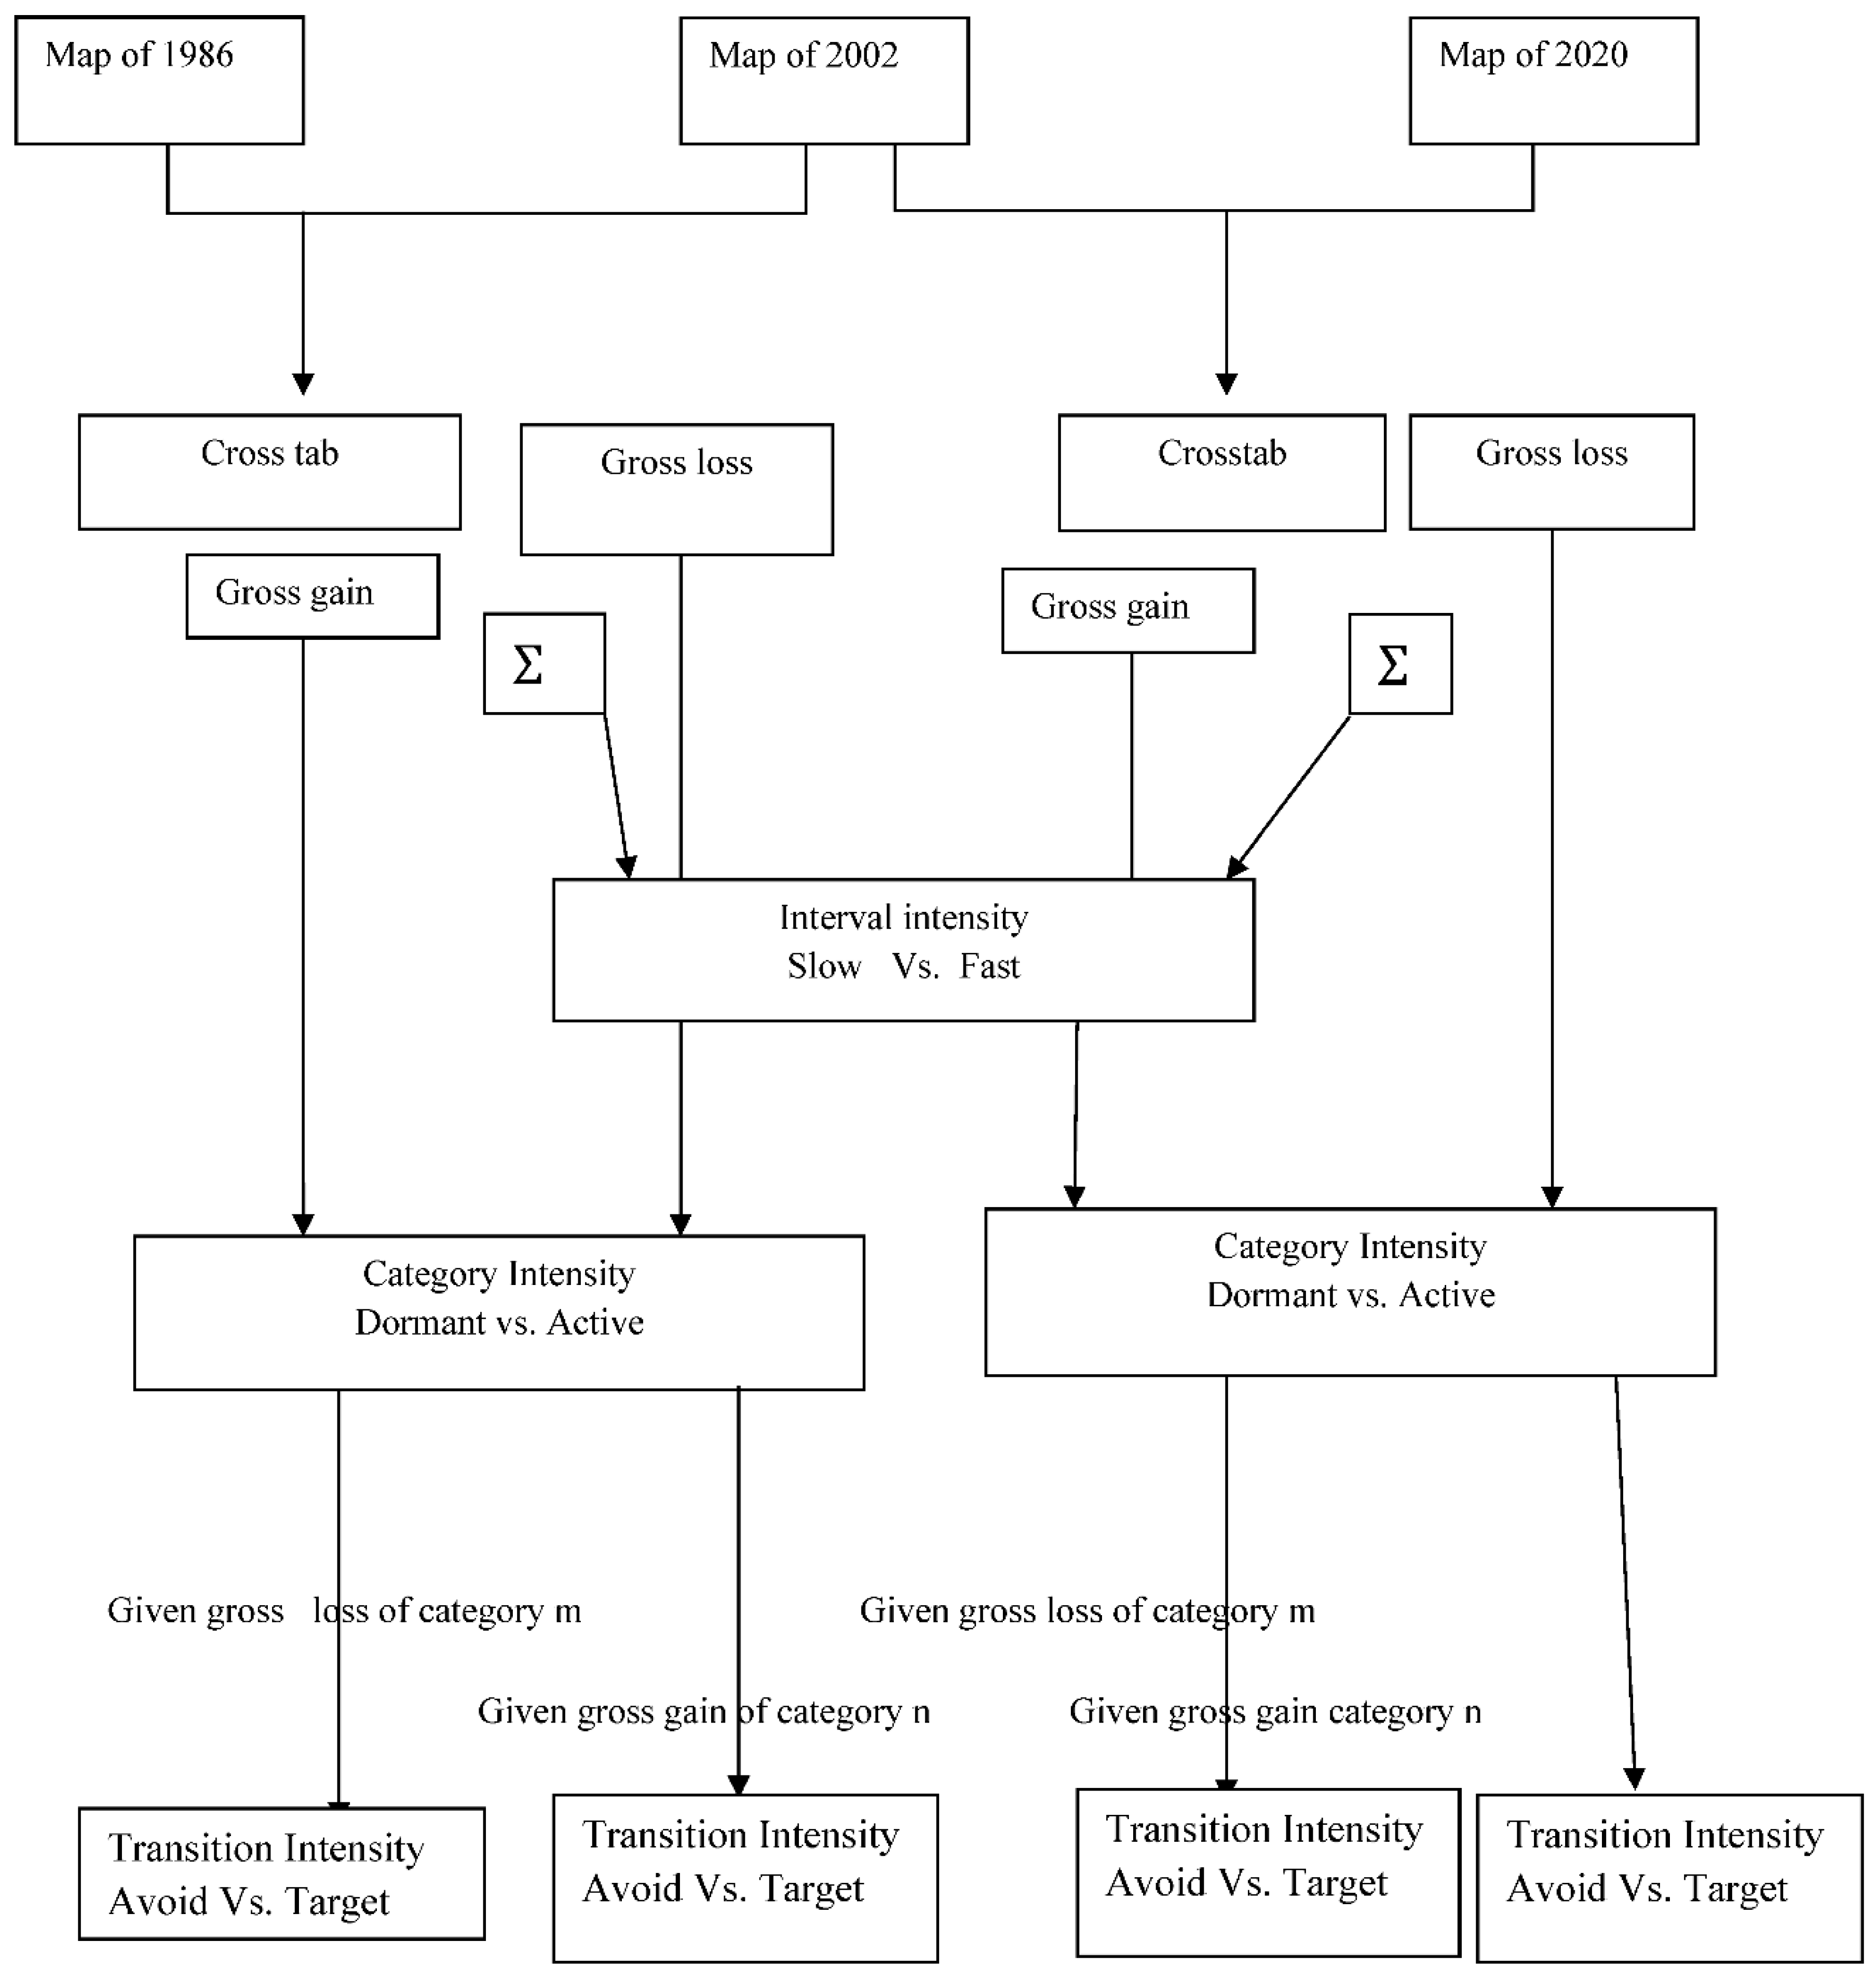
The transition matrix was used to examine the gross gain, gross loss, persistent, swap and net changes. Although this matrix widely applied for land use and land change analysis, it doesn’t consider the necessary steps and spatiotemporal relationship of land change processes during the analysis [8] and indicate the change intensities and reasons why the size of changes are observed among the land types [36]. Considering its ability to characterize and show the entire LUC characteristics compressively, IA was applied to examine the LUC processes at interval, category and transition levels. [35]. It also indicates stationery trends and rational reasons for each land transition in all levels [36,49]. The detailed procedure and steps of IA framework located in Figure 2.
Interval level of intensity analysis(ILI) is 1st level of intensity analysis that used to computes the magnitude and rate of LUC for each time interval. At this level, IA helps us to get information about in which time interval the annual rate of overall change is relatively slow versus fast by comparing the observed change intensity with a uniform change intensity that would exist if the annual changes in the study area were uniformly distributed throughout the study period [35]. Accordingly, equation (3) was used for calculating the observed annual rate/intensity/ of LUC for each time interval and Equation (4) for quantifying the uniform annual change intensity that would exist if LUC process were uniformly distributed over the spatiotemporal extent of the study. In other words, if values of St were equal for all t, then those values of St would equal U [35].
Category level of intensity analysis(CLI), 2nd level of IA which applied to analyze the intensity of annul gain and loss among the land use types. It indicates which land types exhibited dormant/active change in a given time interval comparing with the intensity of uniform the change that could observed among the land types over the study area [35,36]. The intensity of annual gain and loss for each land type were calculated (equ.5) and ( equ. 6) [35], respectively.
Transition level of intensity analysis(TLI) is the 3rd level of IA used to examine the intensity of transitions(gain and loss) of a land type across other land types available for each time interval [8]. It is important to analyze the transition from a particular land type m to different types of n and compare with a uniform intensity of transition that would exist uniformly among the land types available in the transition and to identify which land types are intensively avoided/targeted during the transition period [35]. Equation (7) was applied to calculate the intensity of the annual transition from type i to n during the interval [Yt, Yt + 1], where I # n and equation (8) for the uniform intensity of the transitions from all non-n types to type n (Yt, Yt + 1). If Rtin is greater than Wtn, then the gain in n displaces i; if Rtin is less than Wtn, then the gain in n does not affect i [35]. Likewise, the losing component of TLI is important to quantify the size of land transitions from the losing land types. Equation (9) was employed to compute the observed intensity of the annual transition from type m to type j during the given time interval (Yt, Yt + 1) relative to the size of type j at time t+1, where j # m and equation (10) used for the uniform intensity of annual transition from type m to all other non-m types (Yt, Yt+1) relative to the size of all non-m types at time t+1. If Qtmj is greater than Vtm, then j targets the loss in m; if Qtmj is less than Vtm, then j avoids the loss in m [35]. The following equations are the statistical formulas of IA, and the nations for symbols presented(Table 1) adopted from [35].
S t = j = 1 J   i = 1 J C t i j C t i j / j = 1 J i = 1 J C t i j Y t + 1   Y t x 100  
U = t = 1 T 1 j = 1 J j = 1 J C t i j C t i j / j = 1 J i = 1 J C t i j Y T Y 1 x 100
G tj = i = 1 J C t i j   C t i j / Y t + 1 Y t i = 1 J C t i j x 100
L ti = j = 1 J C t i j C t i j / Y t + 1 Y t j = 1 J C t i j x 100
tin = C t i n Y t + 1 Y t j = 1 J C t i j   x 100
W tn = i = 1 J C t i n   C t n n Y t + 1 Y t j = 1 J i = 1 J C t i j C t n j x   10
Q tmj = C t m j Y t + 1 Y t i = 1 J C t i j x 100
V t m = j = 1 J C tmj C tmm Y t + 1 Y t j = 1 J i = 1 J C t i j C t i m x 100  

3. Results and Discussions

3.1. Magnitude and Trend of LUC

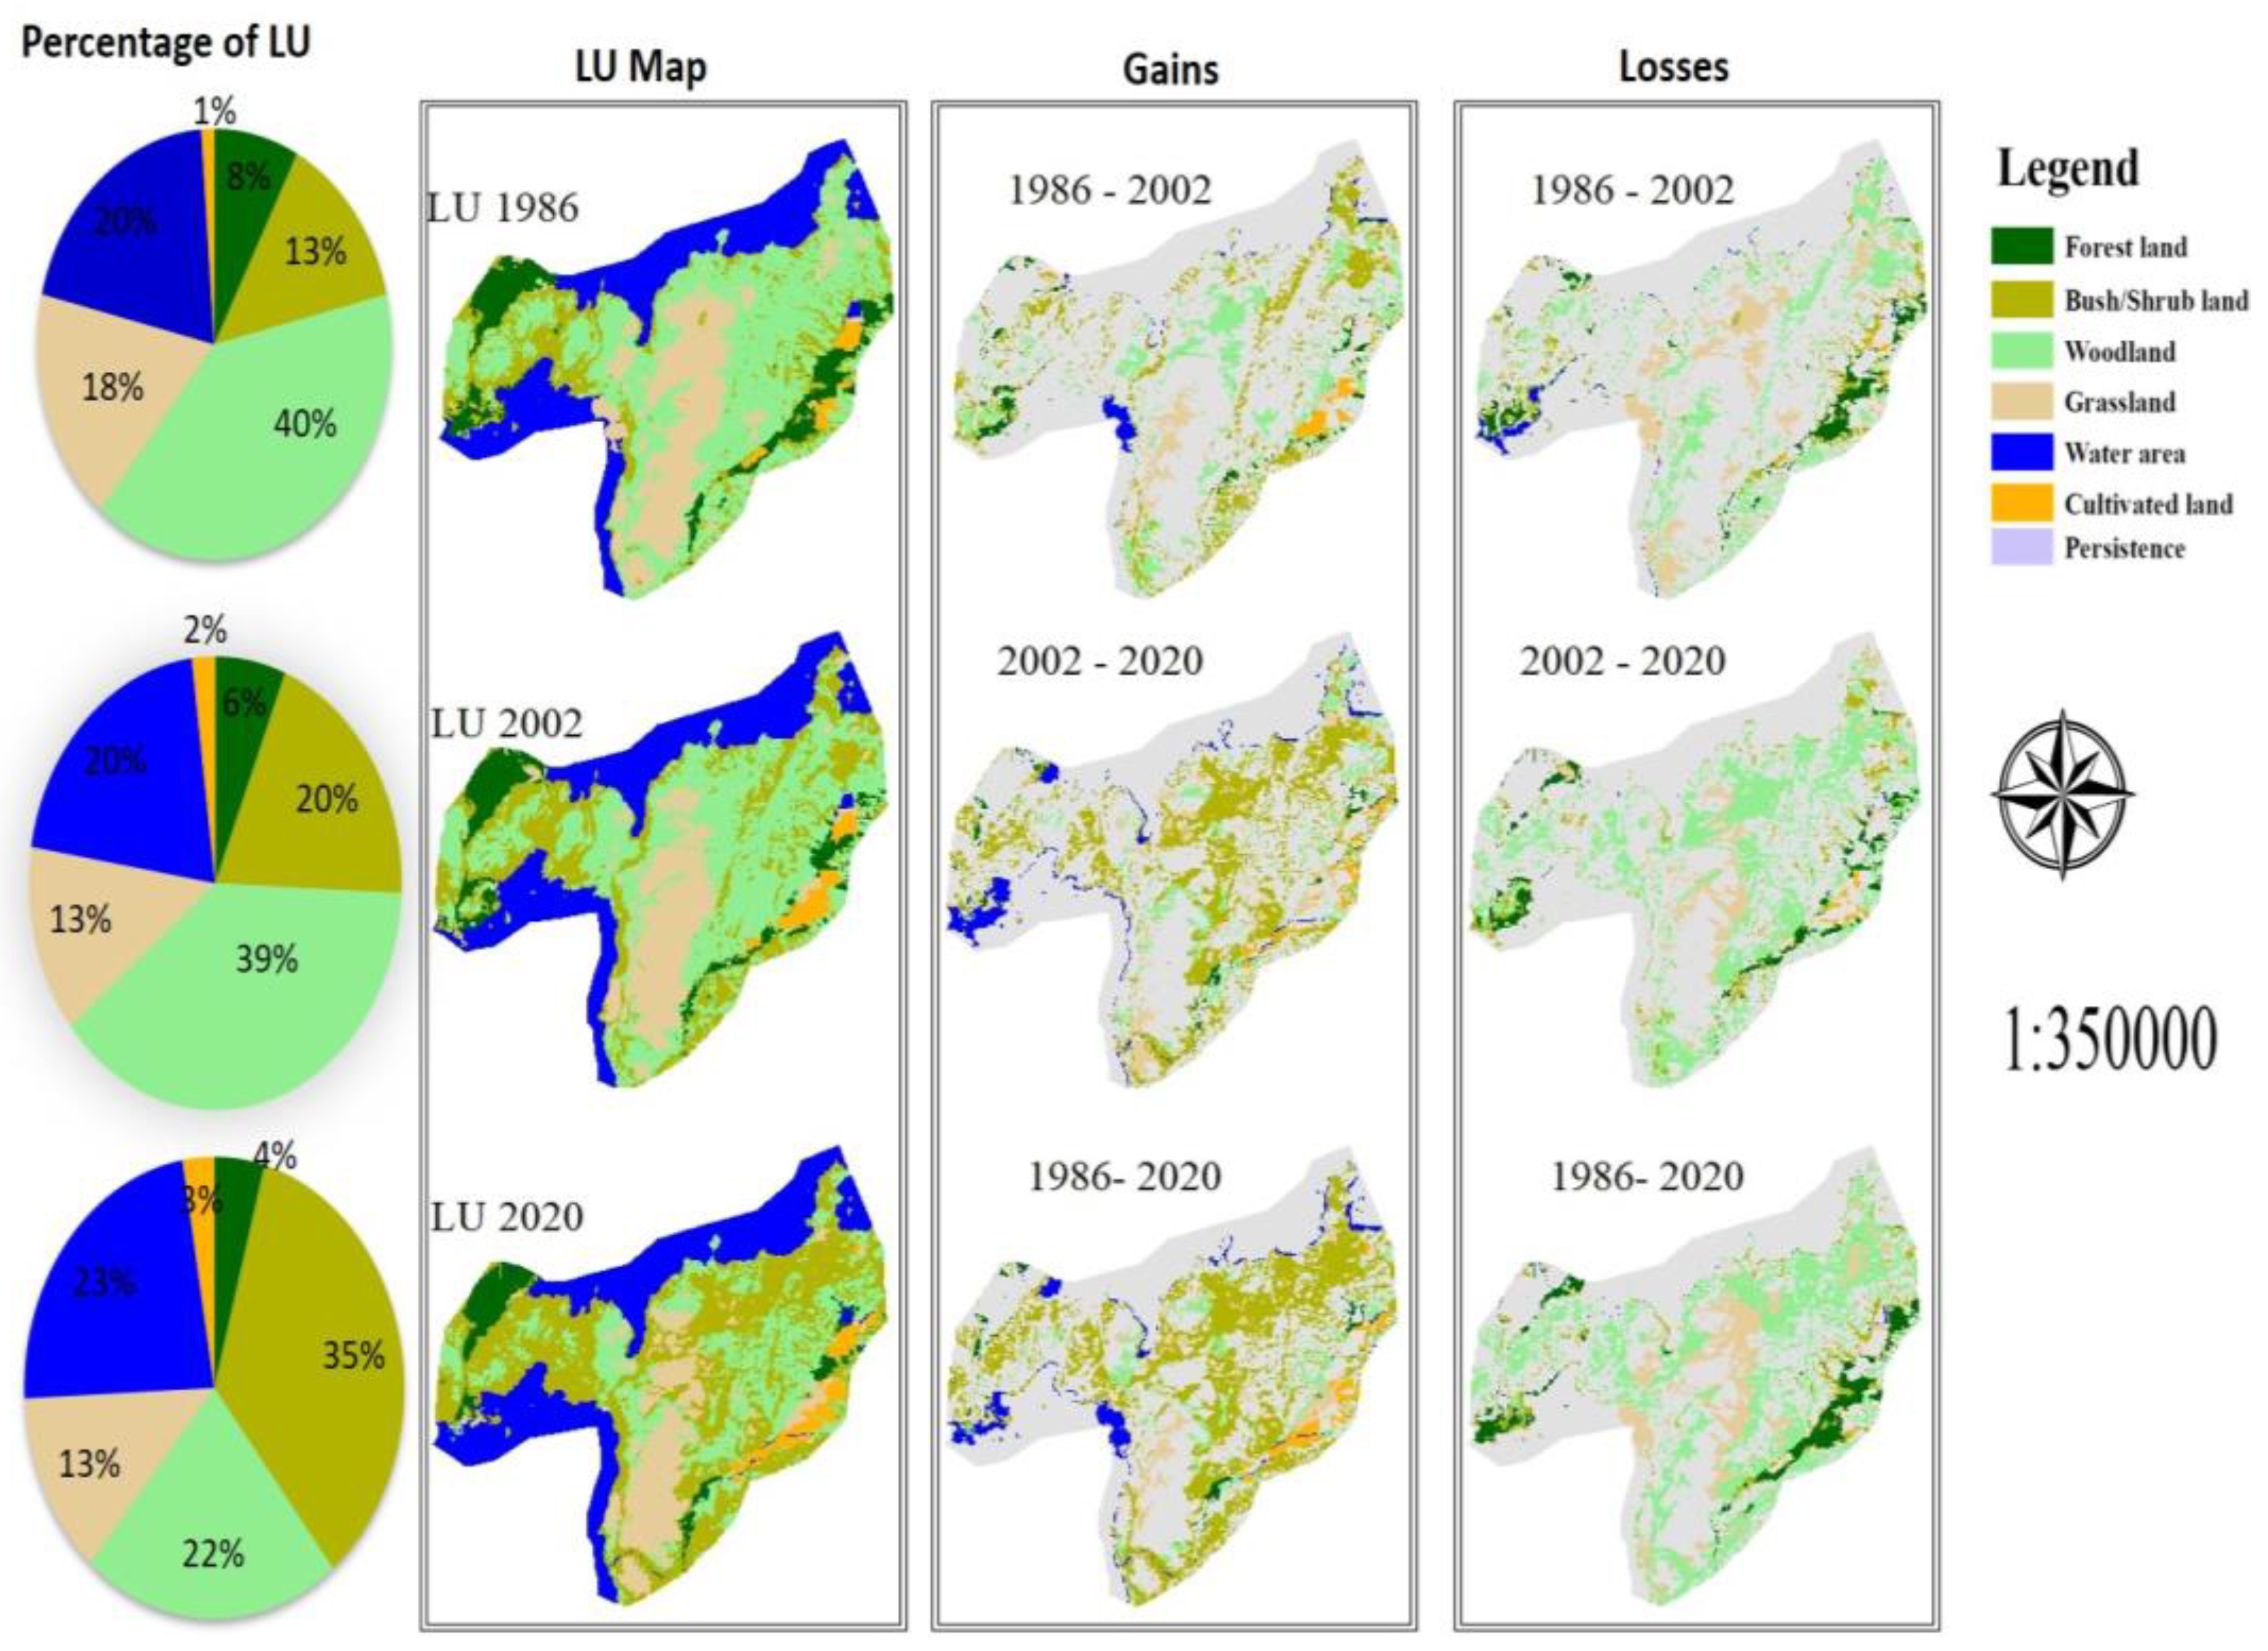
The study's results in (Figure 3and Table 2) reveal that although the values differed during the FTIS(1986 -2002) and STIS(2002 - 2020), all land use types experienced considerable changes in spatial extent and percent proportion as a result of the land transition processes covered above 2/3 of the study area from 1986 to 2020. Regarding area-shared proportion from 4140ha of NNP, in all reference time points(1986, 2002 & 2020) WA and FL were in the 2nd and 5th position, respectively. In 1st and 2nd time points, WL shared the largest proportion (39.24 and 38.25%) while CL had the smallest (1.17 and 2.00%), respectively. During the last time point, WL moved to the 3rd level when BS took over the largest proportionate size (34.82%) mainly by displacing the land of WL (3426 & 6738 ha), FL (330 & 314ha) and GL (280 & 714ha) at the FTIS and STIS, respectively (Table 3).
Concerning the changes in spatial extent, WL exhibited an increased trend of decline and lost 7043ha (43.53%), of land over the last 34 years; of which 6632ha was in the STIS, while CL expanded by 615 ha(126.44%) with the larger expansion in FTIS (341ha). Similarly, GL downsized by 1965ha over the study period; of which 9204ha was in FTIS. Even though the contraction tended down significantly during the STIS, till, GL was under losing land types with 204ha net loss. Moreover, significant shrinkage(44.60%) with an increasing decline trend was also observed in FL; 658ha in FTIS and 768ha in STIS from its total area of 3198ha in 1986. On the contrary, the largest areal expansion was observed in BS by 8587ha, of which 6229 ha was during STIS. Likewise, WA enlarged by 14.84%; 132ha in FTIS, and 1101ha during STIS. Overall, the study indicates that NNP is under an extensive land transition process profoundly dominated by net gain and progression in bush/shrub, cultivated and water areas at the cost of negative net change in forest, grass and woodland. Researchers, like [9,50] pinpointed that such types of land transition processes not only in biodiversity hotspot sites but elsewhere have considerable implications for biodiversity degradation and disturbance of the natural land transition processes among land types and interventions are needed to stop or reverse these transition processes and ecosystem restoration. Moreover, similar to the findings of this study, sizable agricultural land expansion at the expense of more than 3 million km2 of vegetation cover of PAs was reported in USA [16]. Moreover, a continued transition of PA’s forest and woodland to anthropogenic land use in developing countries has also been revealed by several researchers [17,37,39,51]. Similarly, previous studies in Ethiopia‘s PAs found rampant LUC dynamics with significant wildlife habitat and biodiversity loss because of increasing human land uses and degradation. For example, a recent study by [26] in Semien Mountain Park found about 366 and 159% expansion in cultivated and built-up areas at the cost of 31 and 16% forest and grassland decline, respectively from 1984 to 2020.
Likewise, the study by [31] in Gibe Sheleko National Park also reported an increment in bush and shrubland by 51.5% and a decline in forest coverage by 66.8%. Furthermore, consistent with the finding of this study, several recent studies conducted on non-protected areas in Ethiopia [45,52,53] have found a rapid expansion of bush and shrubs by displacing forests, grass, and woodlands. This indicates push and shrub encroachment is becoming a serious and common environmental problem, so urgent measures are imperative.

3.2. Gross Gain, Loss, and Persistence of Land Use Types

The total number of pixels for gross gain, loss and persistence, swap and net change of each land type are displayed in (Table 3). The change analysis reveals from the entire landscape of NNP, 53.65% and 64.79% were under LUC/land transitions/ during FTIS and STIS, respectively. Of the total LUC, the net change accounted for 13.67% in FTIS and 36.73% in STIS and the rest for swap. Similarly, from 1986 to 2020 the net change(50.41%) also was higher than the swap(28.41%); which signifies the prevalent of quantity/net gain and loss/ in land types instead of location (land exchange/ change which further escalate the tendency of advancement in gaining land types and degradation in losing types(forest, grass and woodland). Moreover, with different sizes; all land use types experienced gross gains, losses and persistency (Table 3). During the FTIS and STIS, the gross loss of FL, WL and GL were markedly higher than the loss; the reverse is true for other types. BS was first gaining land type with gross gain of 50.34% (4122.36ha) and 54.19%) (7812.72ha) and loss of 30.27% (1764.81ha) and19.34% (1583.46ha) during FTIS and STIS, respectively; while CL was the second by gross gain of 53.25% in FTIS and 42.21% in STIS. Over the study period, with 57.12% of gross loss, WL was the first losing land type followed by FL(55.78%) and GL(49.00%). Regarding persistency, the diagonal axis of (Table 3) shows that from the total land of the study area, 30312.18ha in FTIS and 27988.74ha in STIS were persistent. Among the land types, the highest percentage of persistent land was observed in WA(99.53%), followed by CL (85.54%) and BS (73.40%) with positive net change values of 1233, 615, and 8587ha, respectively from 1986 to 2020. On the contrary, the lowest persistent land was in WL(42.88%), followed by FL(44.22%) and GL(51%). Similarly, these land types experienced net loss in FTIS and STIS. Additionally, the absolute value of their net change was higher than swap change, except GL in STI (Table 3); demonstrating the exceeding of destructive interventions than the rehabilitation and protection measures in the study area.
Furthermore, the change vulnerability indices were computed and presented (Table S 5). According to [23,26] when the value of gain/persistent and loss/persistence ratios are greater than one, a given land type is more likely susceptible to gain from and loss to other types rather than to persist, respectively. The net change/persistence ratio signifies the gain and loss of a land type is how many times its persistent land [45]. The gain/persistent ratio for BS and CL was > 1 and highest among the land types between 1986 and 2020, as shown in Table S 5. At the same time, their loss/persistence ratio was < 1 and the lower, following WA(≈ 0). These results indicate that in the study area, these land types had the highest tendency to expand their territory by displacing other types instead of remaining as persistent with a very low(0.36 =BS and 0. 17= CL) likelihood of losing to others. On the contrary, the gain/persistence ratio of FL, WL and GL was < 1 while its loss/persistency was above and equal to 1; indicating its exposure to intensive degradation with a very low tendency for restoration/gaining/. Similarly, the net change/persistence ratio demonstrates the net gain of BS and CL was 201 and 148% times its persistence, respectively while the net loss of FL and WL was 101% times its persistence. Overall, the vulnerability indices show almost all the land types tended to enlarge/dwindle rather than remain persistent; which indicates the extensive and intensiveness of the LUC processes. Further, the pressures caused deterioration in grass, forest and woodland; provided the opportunities for advancement of bush and shrubs. This result is consistent with the findings of studies done by [25,26] elsewhere in protected areas. Regarding vulnerability status, similar findings were reported by studies conducted in non-protected areas adjacent to NNP and Northern Ethiopia [23,45]. This indicates protection given to NNP is poor or its exposure to anthropogenic pressures is very high. Thus, quantifying and mapping the human influence index is important for the future management plans of the park.

3.3. Intensities of LUC

3.3.1. Interval Level of Intensity Analysis (ILI)

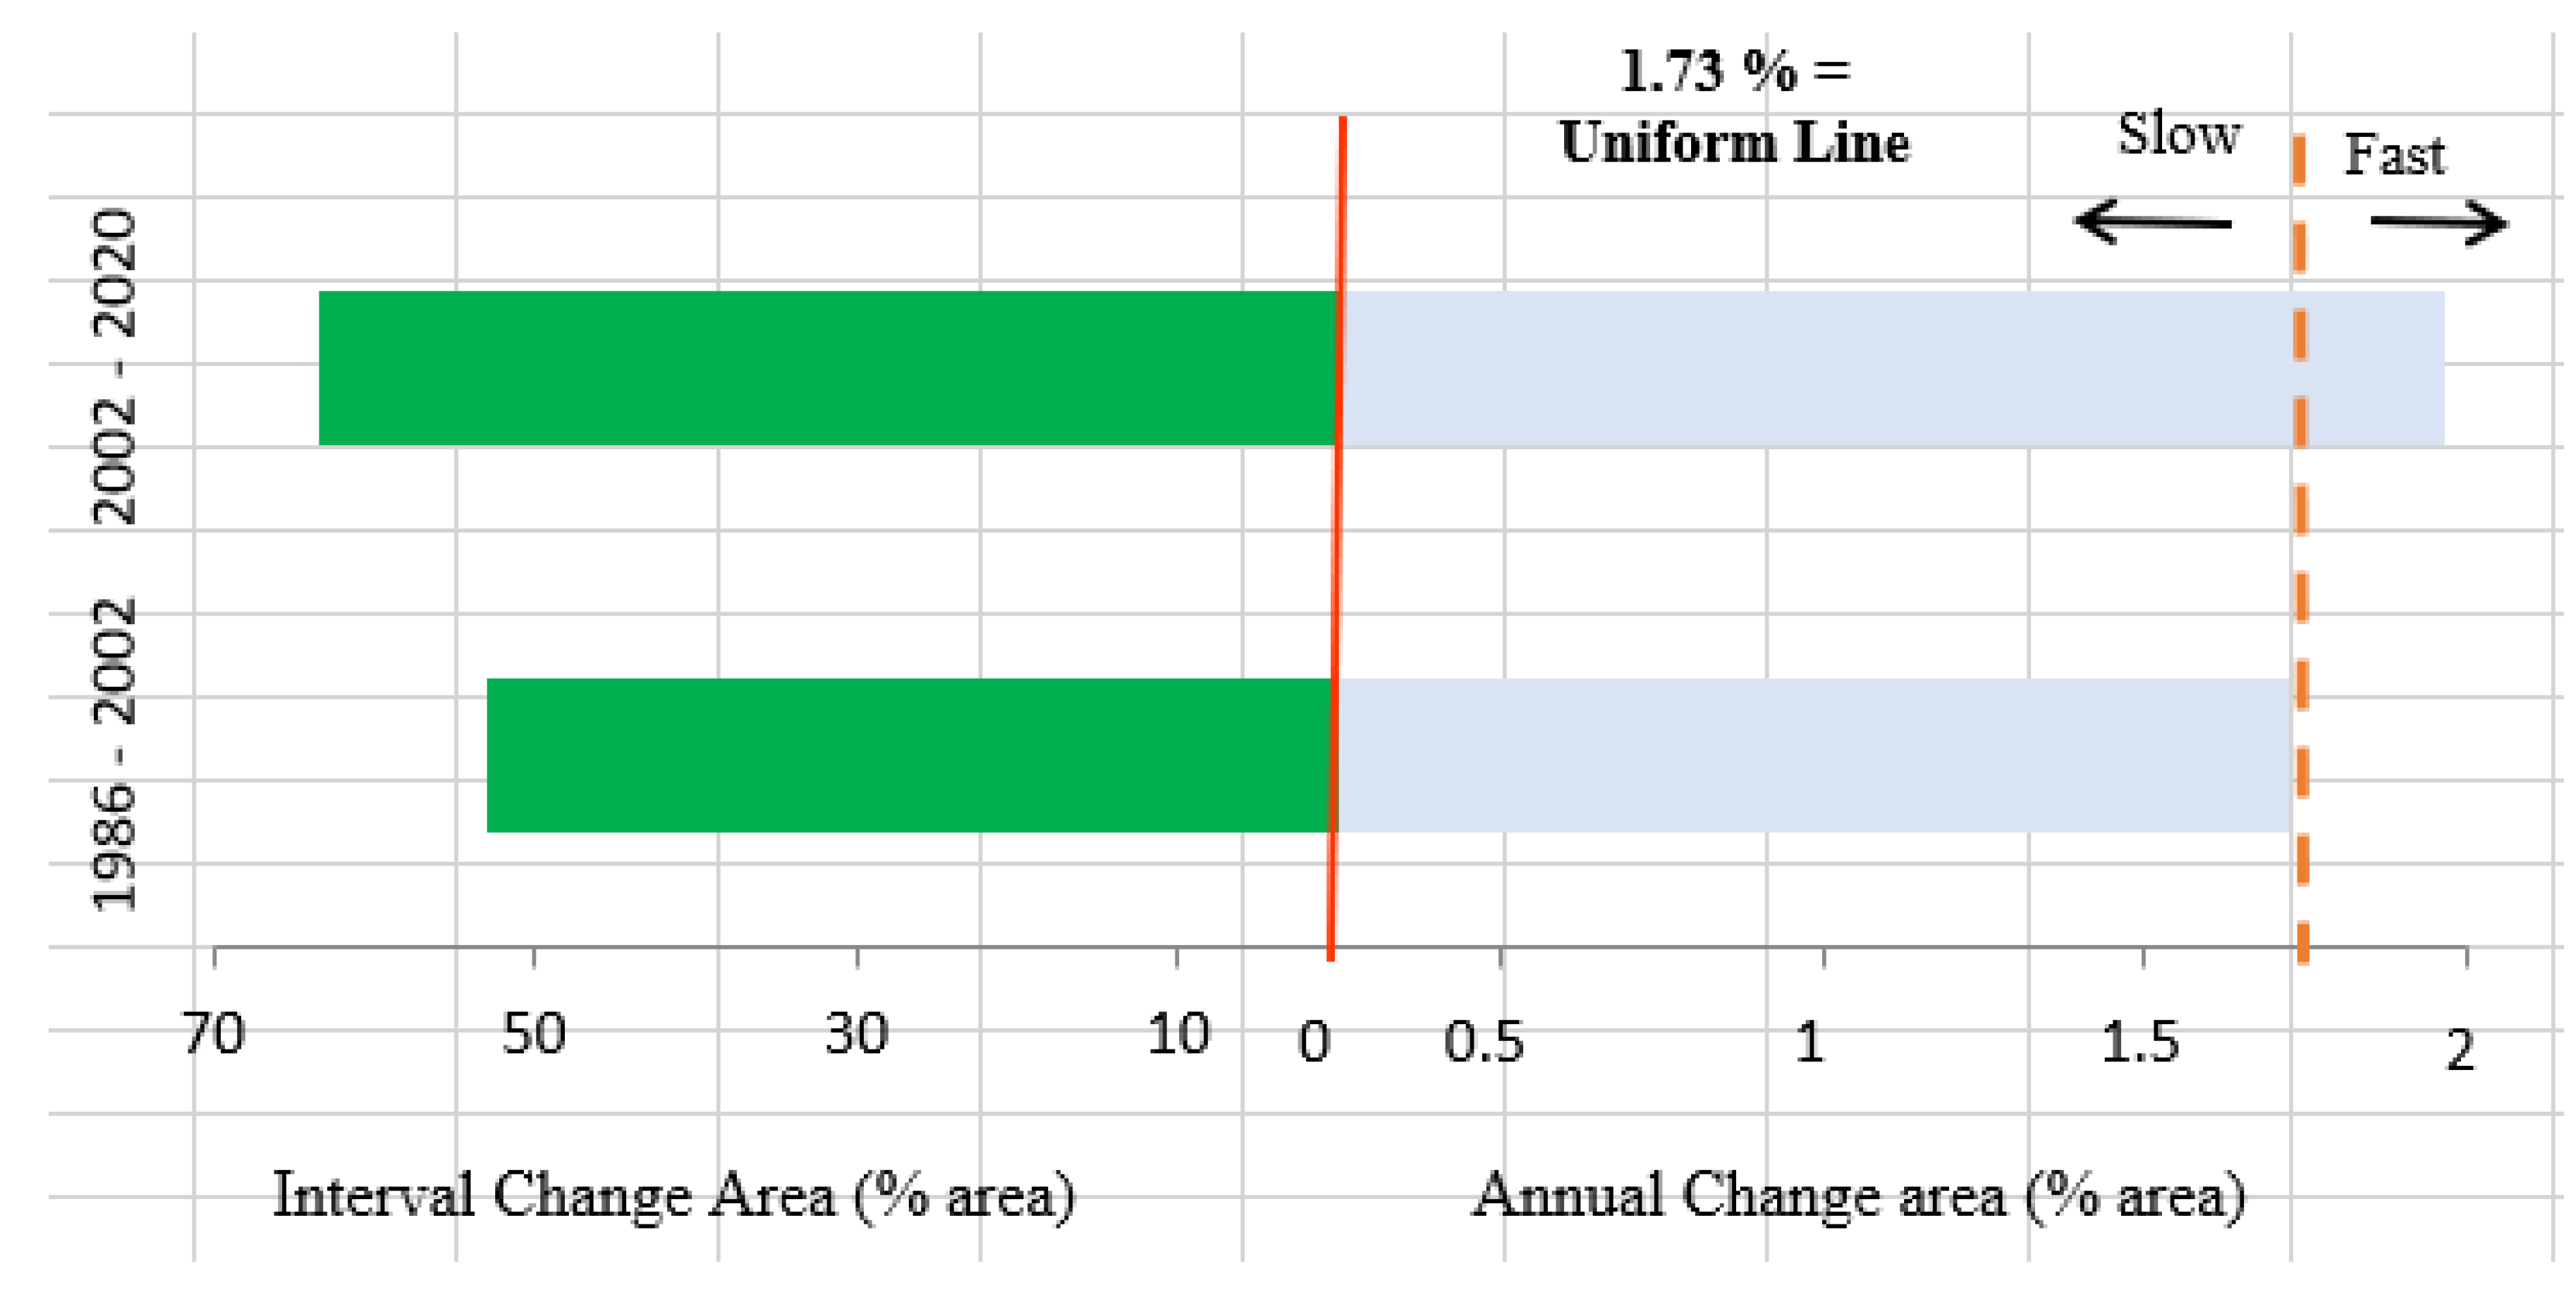
The ILI results present in (Figure 4); the graphs on the left side show the percentage of total land change and on the right side the change intensity. The intensity bar ends to the right of the uniform line indicating the change is fast; whereas if it ends to the left the change is slow [35]. Accordingly, the LUC undertaken in the study area was relatively quicker during STIS(1.80 %) than FTIS(1.66%). Similarly, the total area subjected to land transitions/gain and loss/ was larger during the STIS(64.79%) than FTIS(53.56%). Although the STIS was longer than FTIS by 2 years, the ILI indicates that more intensive change was observed in this time interval. Thus, the plausible reason for accelerating LUC is the rapidly intensified and diversified socioeconomic pressures to realize the need for the increasing population in and around the park as suggested [6,30]. Supporting this argument, the study by [54] identified human interventions as the main driver for pervasive land change in Nijhum Dwip National Park. During the study time, if the LUC was uniformly distributed, . However, the graphs on the right side in Figure 4 show that the overall change intensities in both time intervals were not equal with the intensity of uniform change (1.73 %) indicating the observed LUC in the study area was not uniform and stationary for ILI. similar results were reported by [8,35,36]. The overall statistical output IA displayed in (Table S 6)

3.3.2. Category Level of Intensity Analysis (CLI)

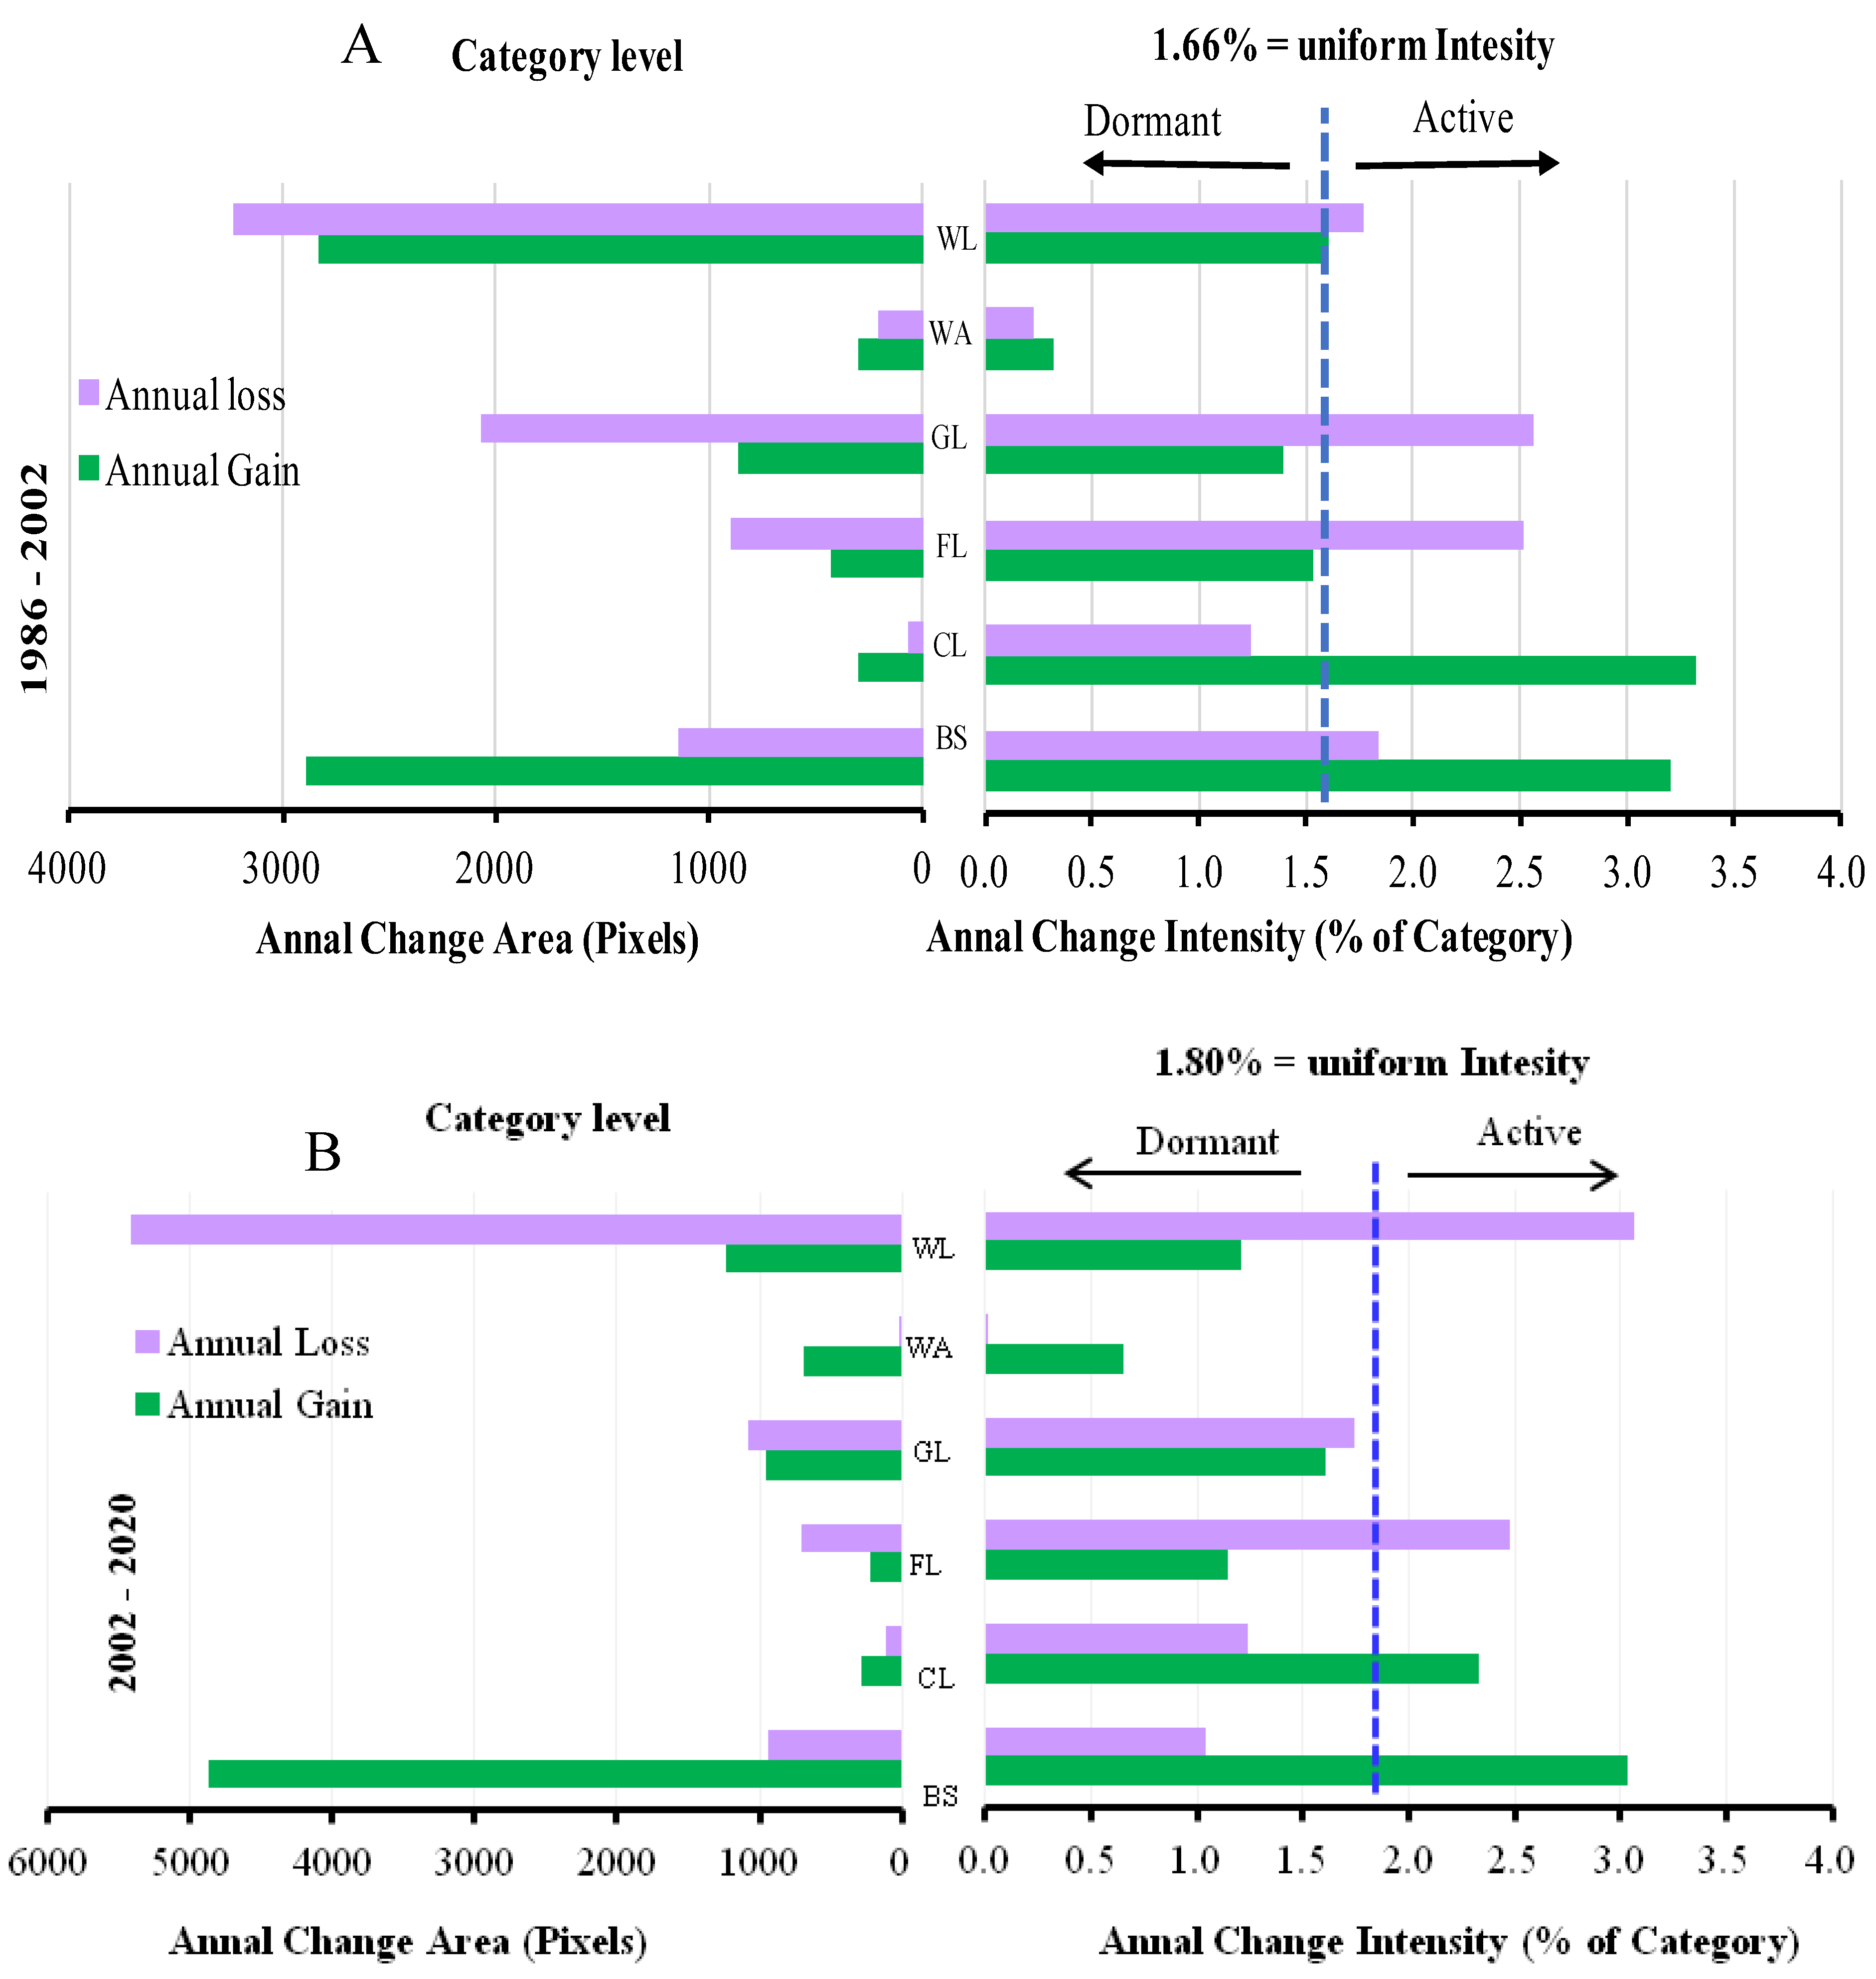
The graphs on the left side of Figure 5A&B display the size of the annual gain and loss of each land type. In terms of size, BS had the largest annual gain while WL followed by GL had the largest loss in both time intervals. The smallest percentage of annual gain and loss was observed in WA and CL. However, the intensities of changes were not proportional to the size of the changes for most of the land types(see on the right side of Figure 5A&B). For example, the gain intensity of CL was the highest in FTIS and higher in STIS, although the size of its gain(≈ 4%) and total area proportion was the smallest. From this it can be noted that land types with the largest annual gain/loss may not have the most active intensity and land types with the lowest annual gain/loss also may not have the most dormant intensity because the transitions/gain and loss/ in a given land type could be caused by either the proportionate size at initial time or intensity of activities on it [8,35]. To understand the reason/s for the gain/loss/ of a given land type; quantification the intensity of observed changes and comparison with intensity of uniform change is, therefore, necessary and helpful [8].
On the right side of Figure 5A &B, the bar graphs show the intensity of annual gain and loss and the vertical broken lines indicate the intensity of uniform change. If the intensity’s bar of a land type stops to the left of the uniform line, the change is dormant; while it extends to the right, the change is active. As the study indicates WA was the only land type that had dormant gain and loss during both time intervals. However, this land type accounted for relatively the larger portion of the study area. It had also a 0.72% gross loss with 0.32% net gain in FTIS and 0.05% gross loss with a 2.63% net gain during STIS. Therefore, changes in WA were significantly associated with its proportionate size and partially for the occasional increase and decrease of water in Lake Abaya and Chamo rather than the intensiveness of the changes. This implies if the LUC was distributed uniformly among the land use types, WA would have less intensive gain and loss, proportional to its size at the initial points; which is consistent with the argument given by [8].
The results indicate WL was leading land types intensively subjected to the LUC process with the largest share of (21%, 8799.30ha in FTIS and 26%,10742.40ha in STIS) the total change. The annual gain of WL was dormant with a lower intensity value (1.60% in FTIS and 1.21% in STIS) in the study area. On the contrary, the annual loss intensity was intensively active and three times higher in STIS (3.05%) than the FTIS (1.77%). As a result, the land transited to other types was increased from 11.2% (287.80 ha yr-1) with a net loss of 1.38% (411.84 ha) in FTIS to 21.2% (486.62 ha yr-1) with net loss of 16.39% (6631.19 ha) in STIS. Throughout the study period, the size of the loss accounted for the highest percentage (56.88%) of the entire loss in the study area. These results signify that the WL’s gain was markedly contributed to its larger proportionate size, whereas, its loss was mainly caused by high-intensity driving pressures; i.e., overutilization by local people for livestock grazing and wood production. Similarly, the study done by [49] reported dormant gain and anthropogenic-driven active loss in woodland. On the contrary, due to distant location from human influences; dormant loss in woodland was reported by [55].
The gain intensity(3.20%, FTIS and 3.03%, STIS) of BS was intensively active and higher than its loss intensity(1.89%, FTIS and 1.07%, STIS). In terms of size, it had a gain of 10.03% (262.65 ha yr-1) and 19.08% (434.07 ha yr-1) with a net gain of 6.05% (235.55ha) and 15.42% (6229.26 ha) during the FTIS and STIS, respectively. However, the loss intensity of BS was less active in FTIS and dormant in STIS with 4% (110.30 ha yr-1) and 3.67% (87.97 ha yr-1) of land loss, respectively. These results indicate that the active gain of BS was primarily linked with the intensiveness of its gaining processes rather than its larger area proportion and the opposite is true for its loss. Researchers, [50] explained that when other vegetation ecosystems are under pressure from anthropogenic activities and changes in abiotic factors: climate change, and soil erosion, the bush and shrubs have advanced opportunities for reproduction and territorial expansion with less likelihood to be replaced by others. Regarding the less active loss in FTIS in the study area, the plausible reason could be the non-discriminable destruction of natural forests throughout the country during the period of political power transition from Dergue to the People Revolutionary Democratic Front; which is in line with the justification given by several researchers for massive deforestation in protected and other areas of Ethiopia [8,24,26,47,56].
Recent studies such as [25,32,38,39,54] found a substantial and continuous decline in forest and grassland in PAs linked with anthropogenic land expansion and overutilization. Similarly, our findings confirm that during the study time, FL and GL experienced intensively active losses. The net loss in FL was 1.62% (657.81 ha) and 1.86% (768.50 ha), while, in GL 4.22% (1761.30ha) and 0.47% (203.49ha) during FTIS and STIS, respectively. FL’s annual gain declined from 1.5% (39.35ha yr-1) in FTIS to 0.88% (20.61ha yr-1) in STIS, but GL’s gain increased from 3% (78.95ha yr-1) to 3.78% (88.11ha yr-1). However, the graphs on the right sides of Figure 5A&B show the gain intensity of both land types was dormant in both time intervals; which indicates the annual gain of FL and GL was mainly attributed to their relatively larger area proportion rather than the changes intensiveness. In line with this finding, forest’s dormant gain was reported by [49,57]. Concerning intensity of loss, during the FTIS, GL (2.58%) had the most active; followed by FL (2.52%). However, in the STIS, the loss intensity in GL significantly declined to1.79% and became dormant. The convincing reason is due to the high degradation in the grassland during FTIS, the local community shifted to woodland areas for their livestock grazing and fodder collection which resulted in a reduction of pressures and active regeneration in grassland during STIS [30]. The second important factor could be the resettlement of people outside the park during the early time of STIS. Overall, at CLI, the study displays that, the gain and loss in WA, CL, FL, and WL, and gain in BS and GL were stationary, although not perfectly stationary( Figure 5).

3.3.3. Transition Level of Intensity Analysis (TLI)

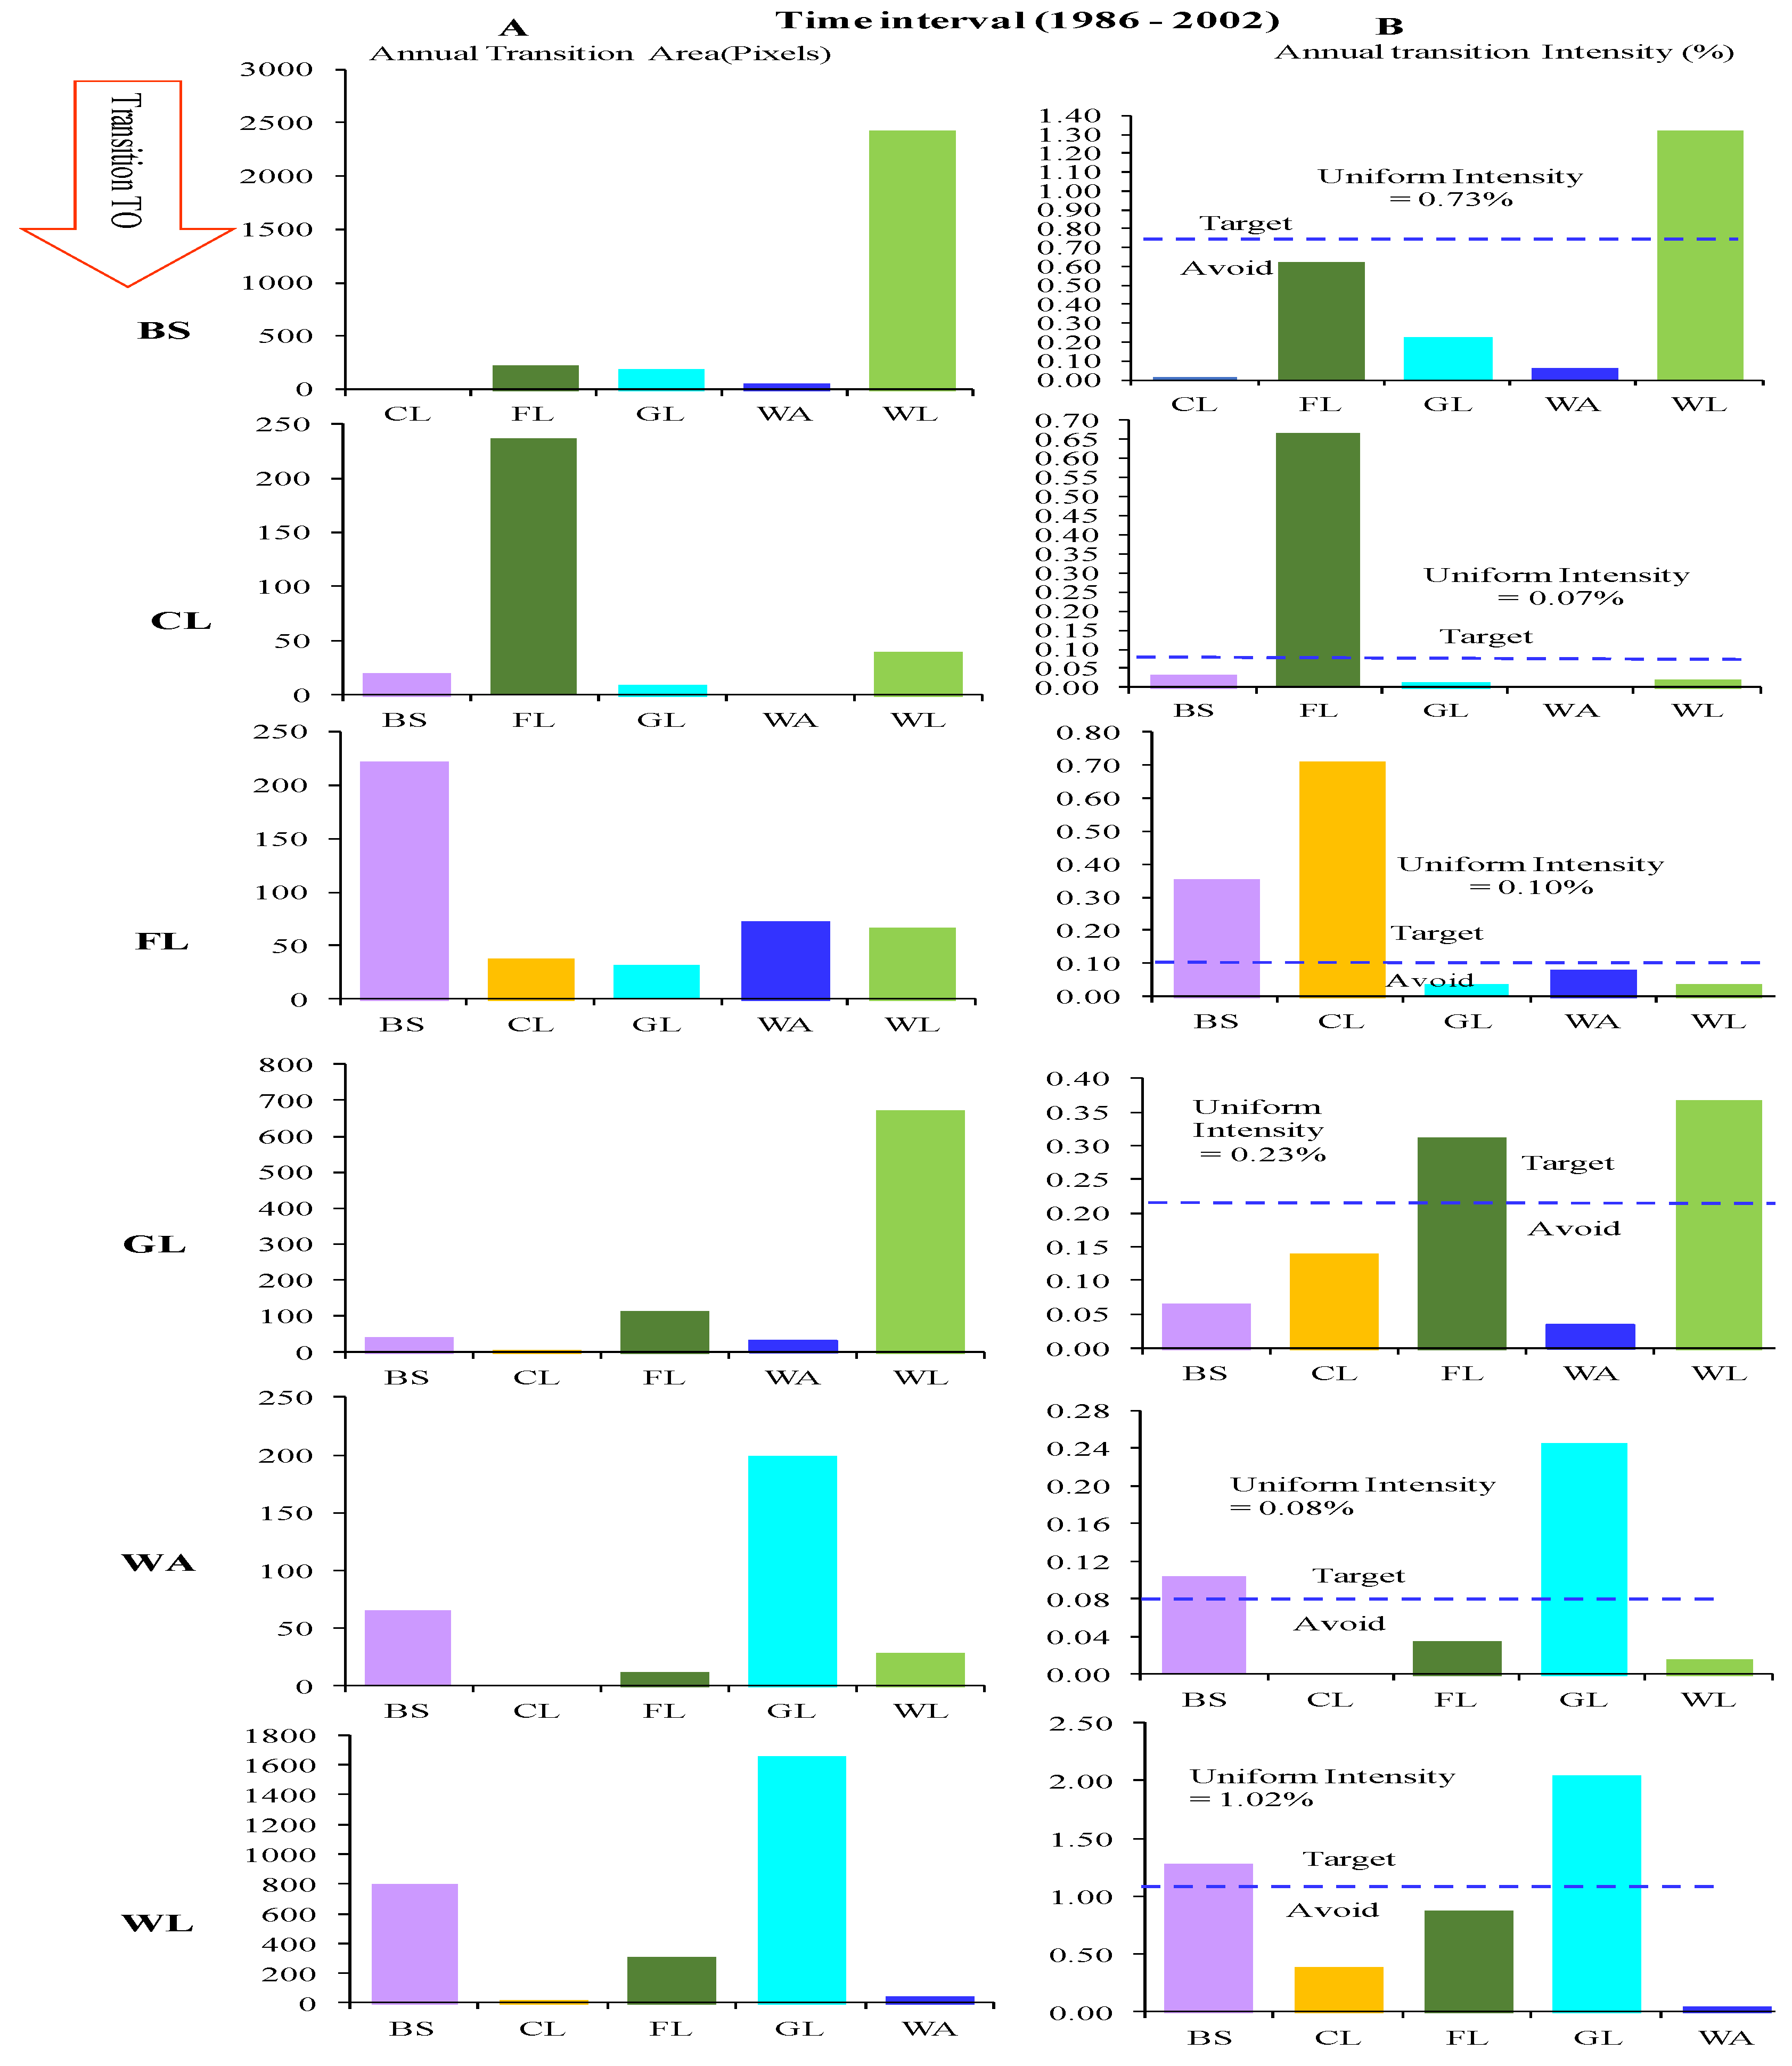
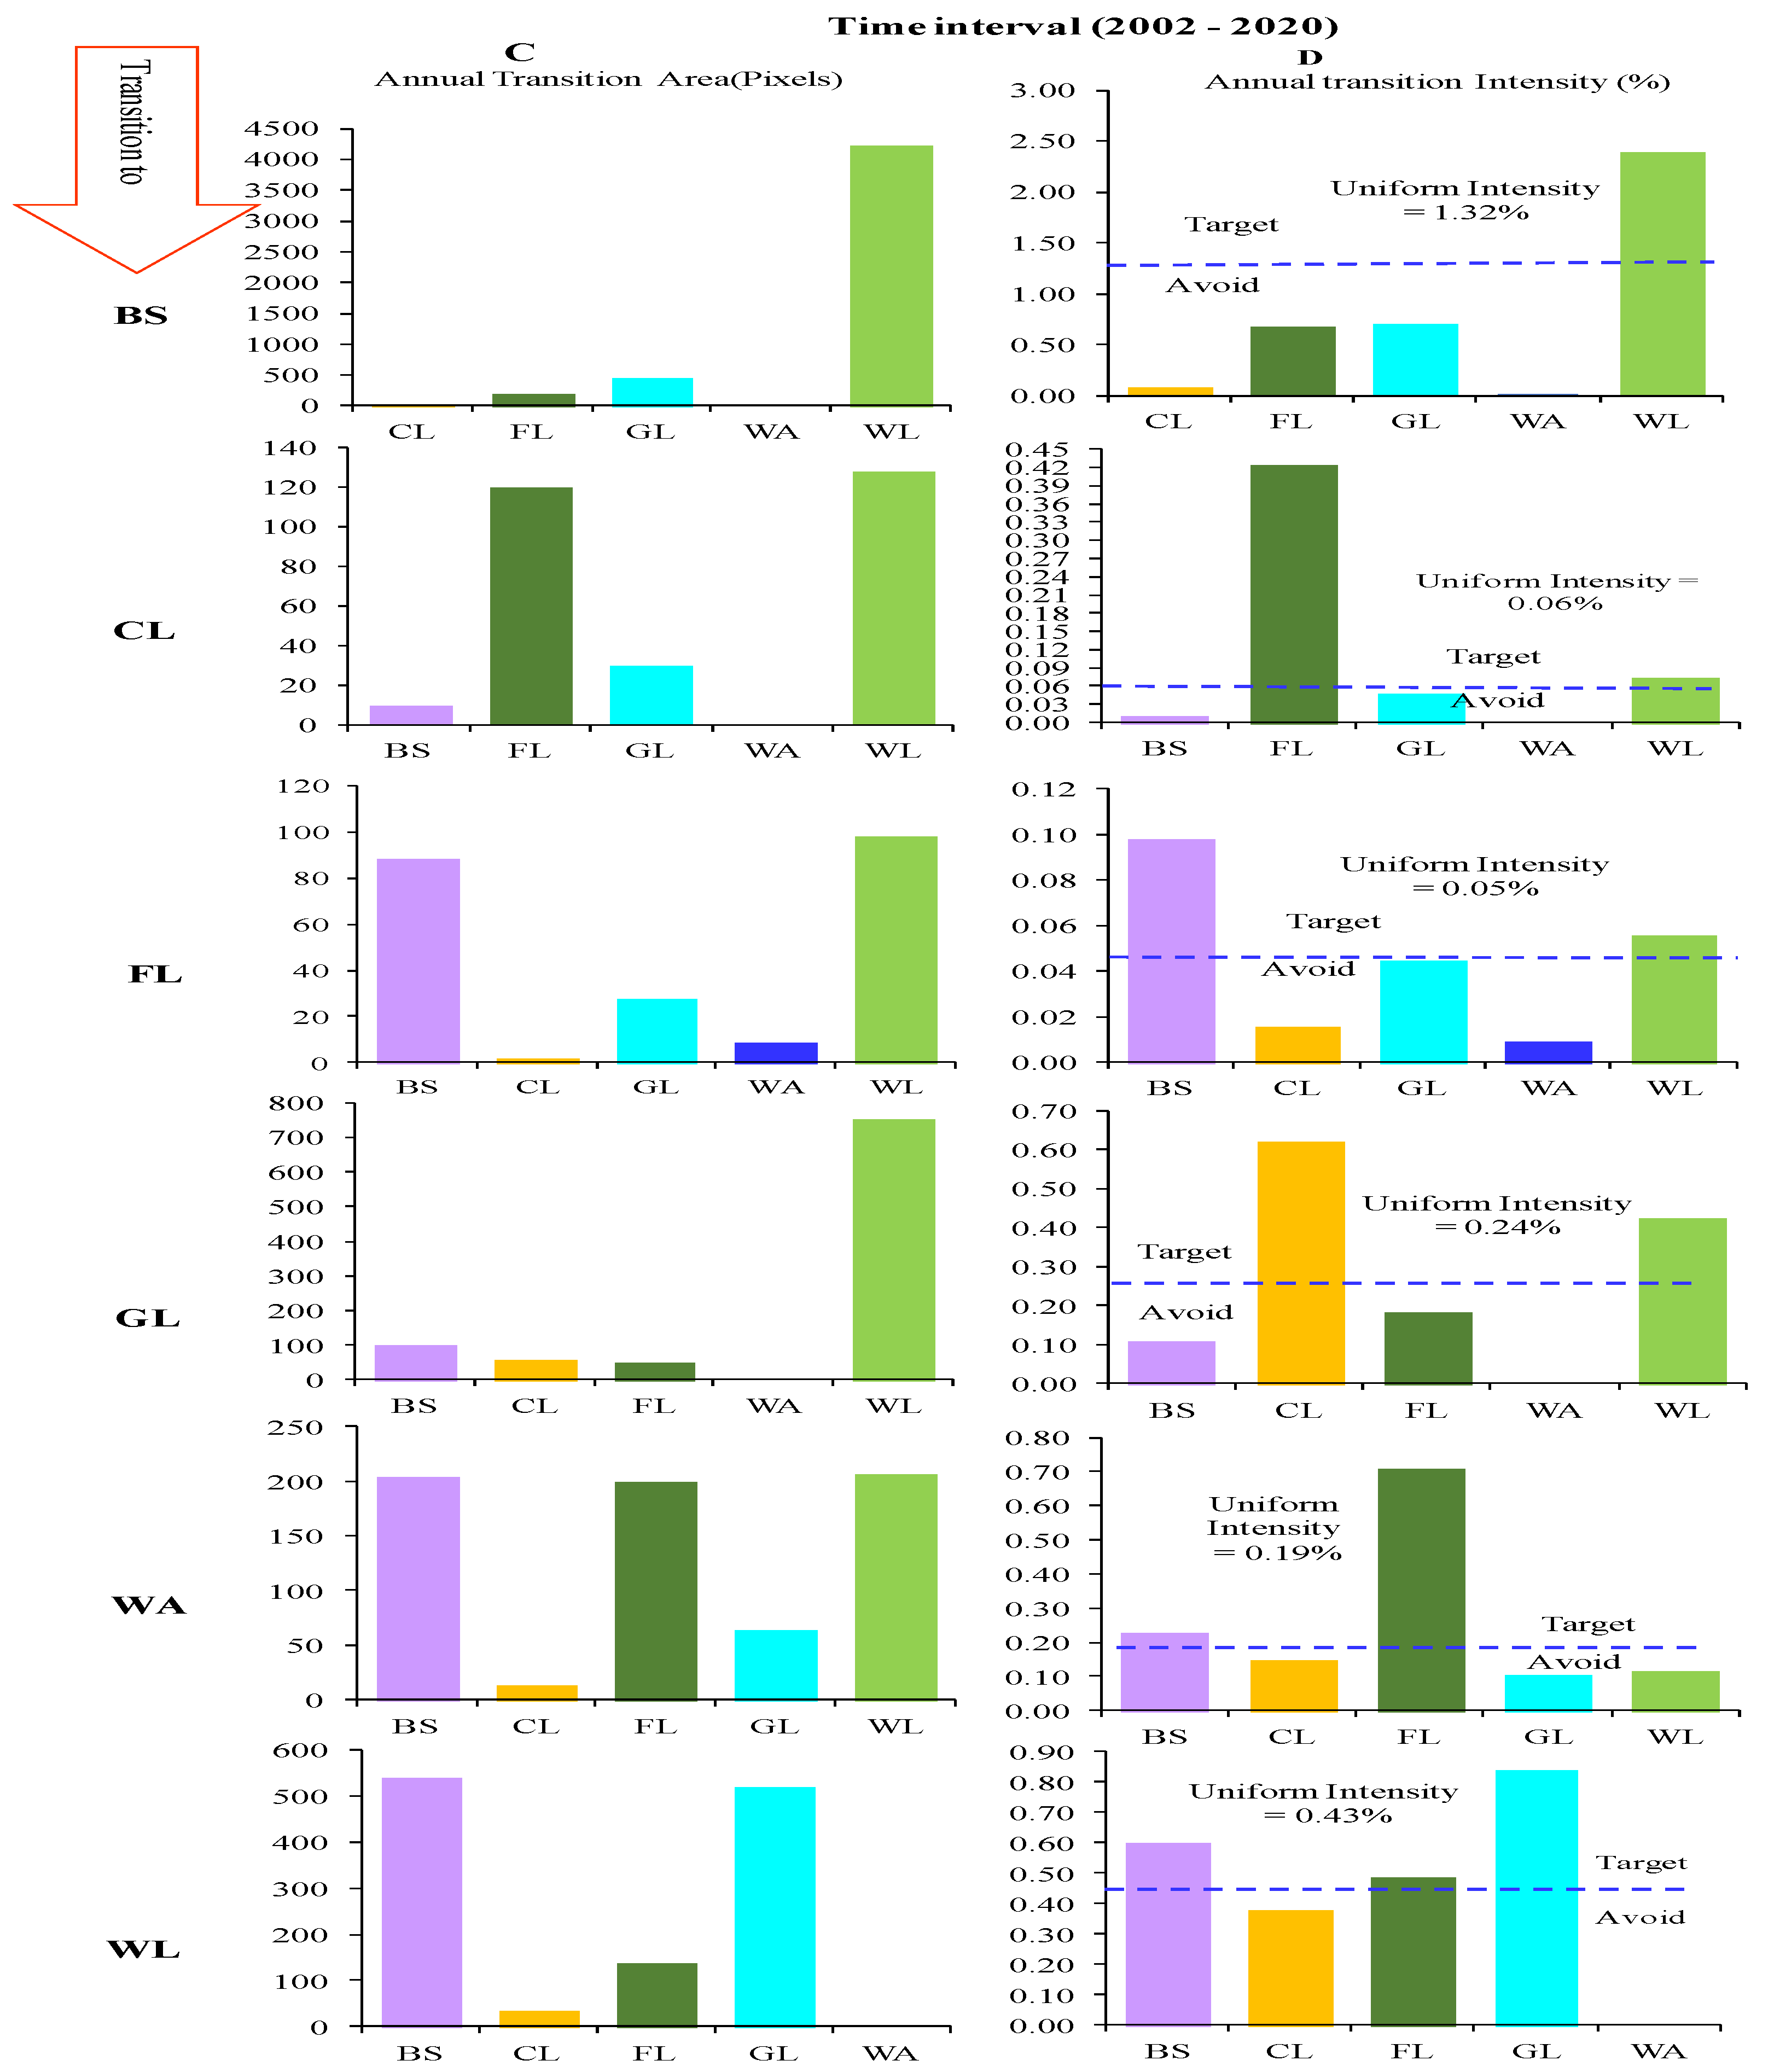
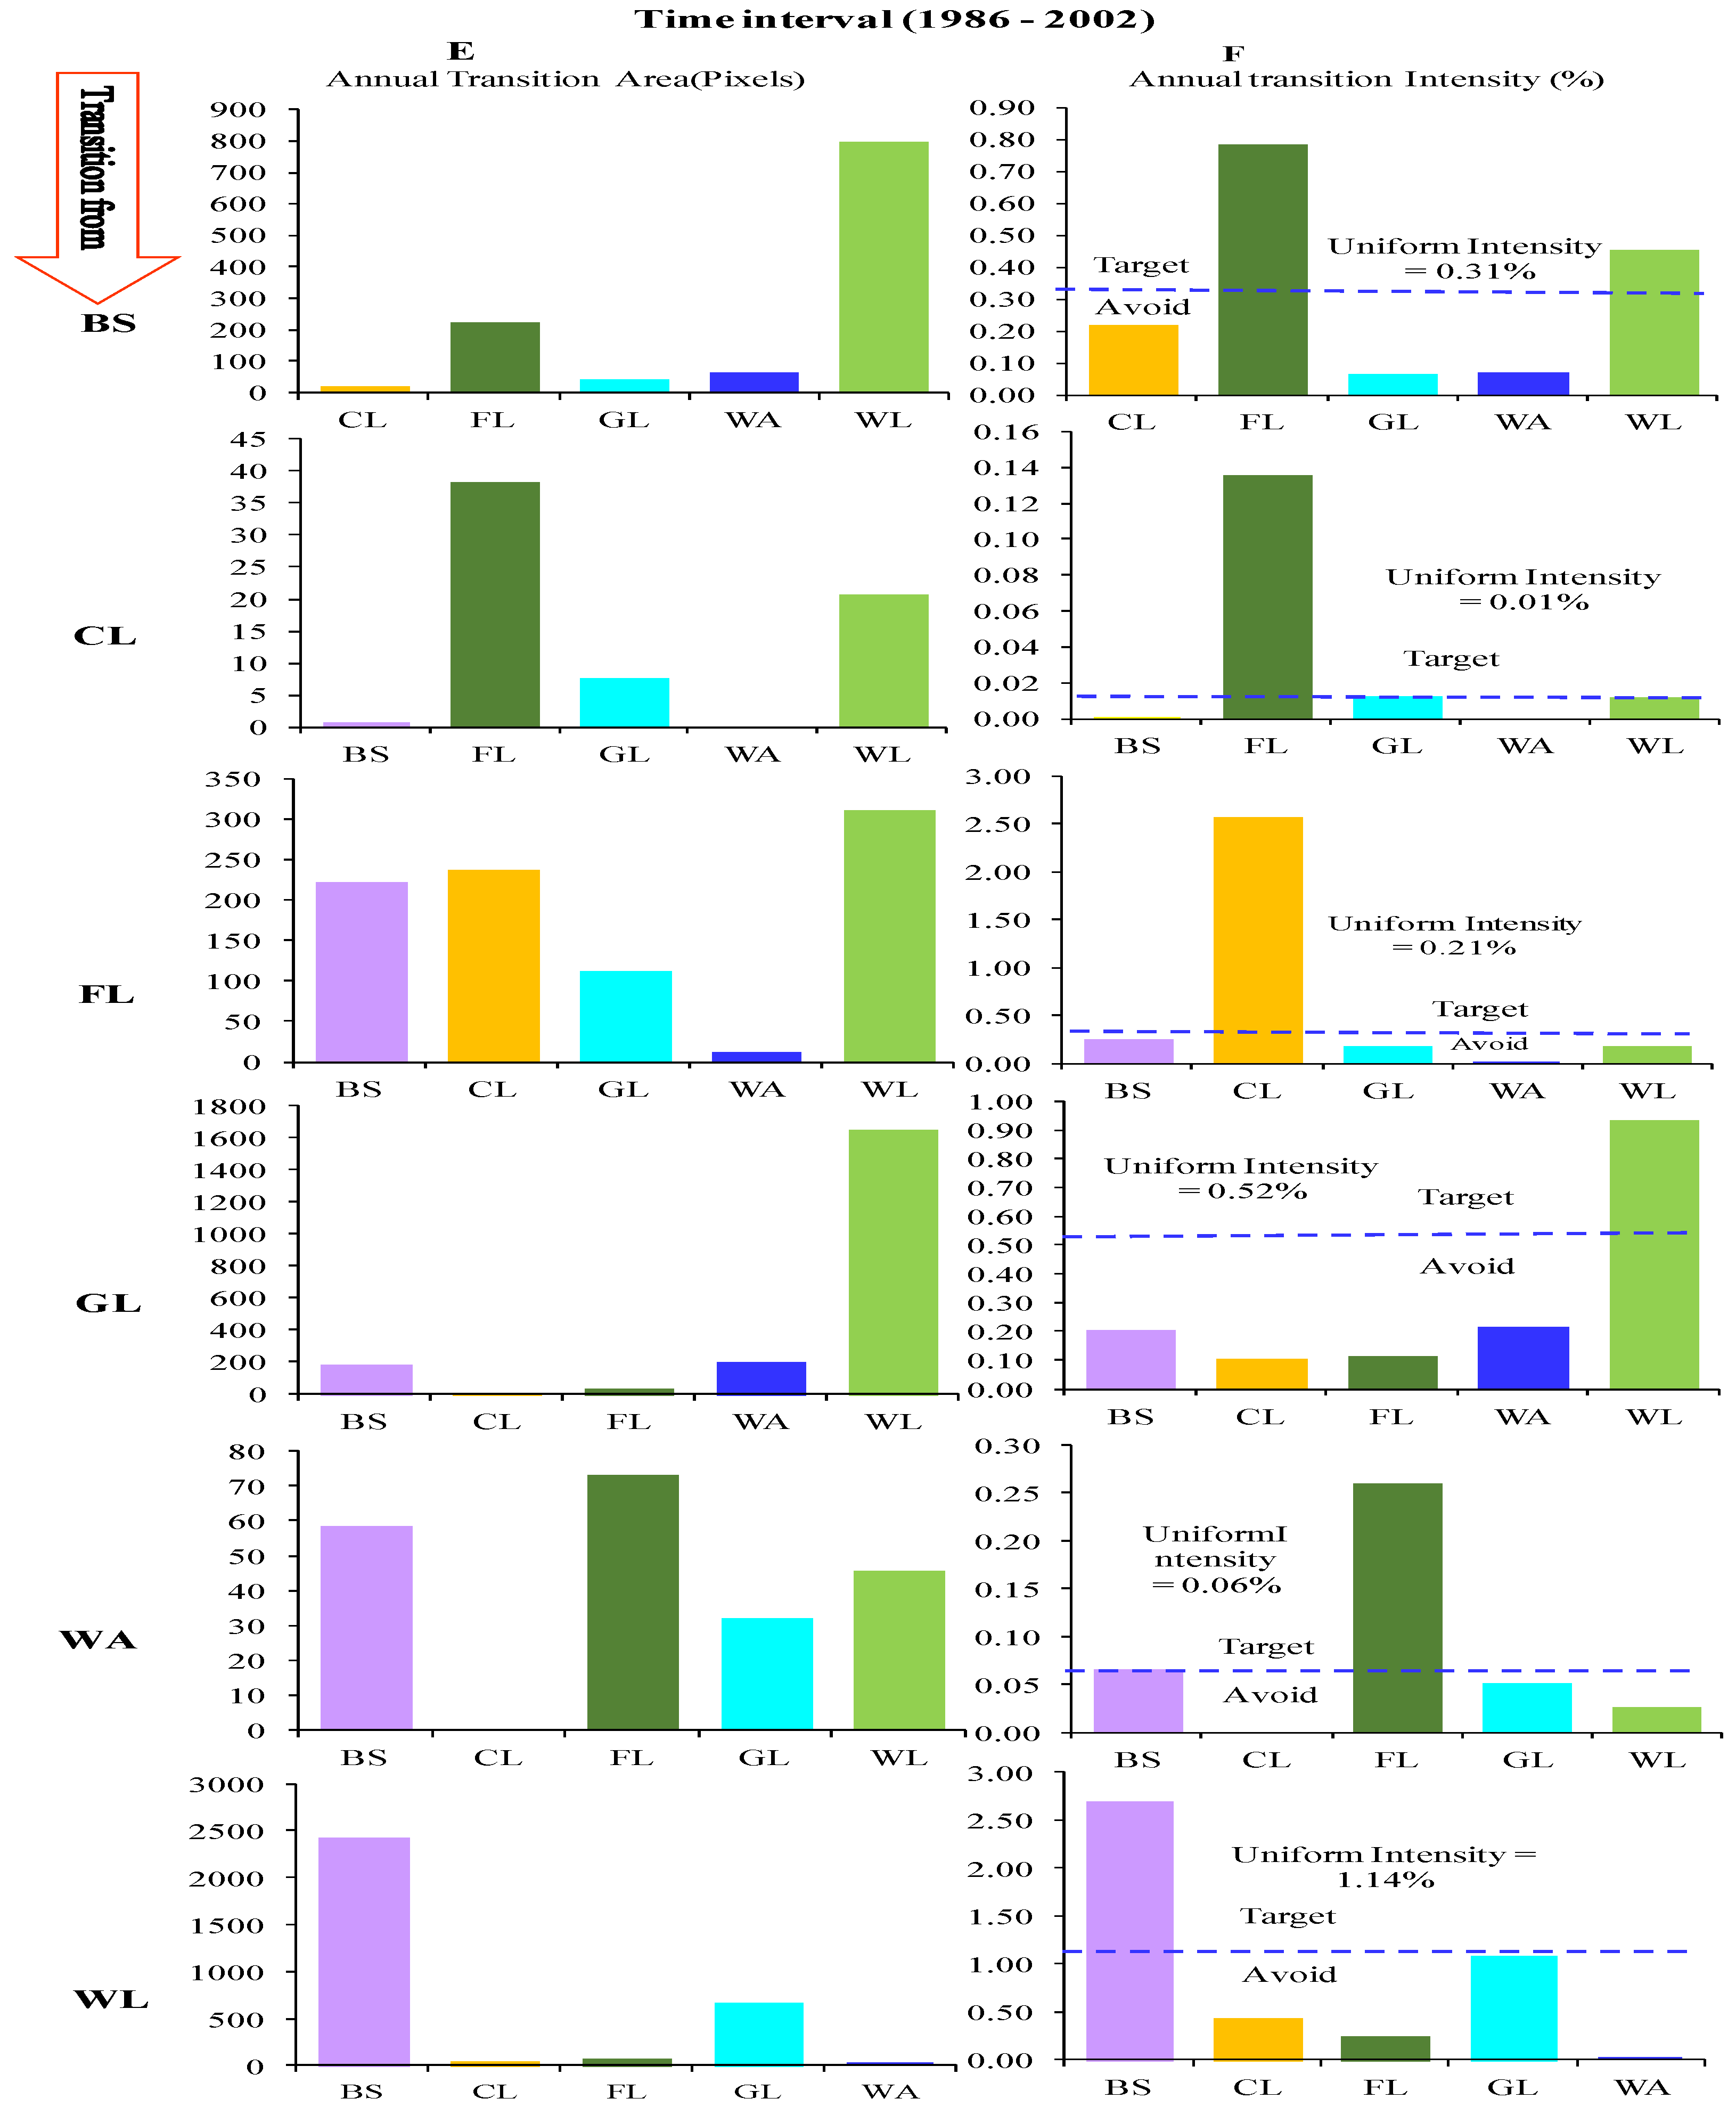
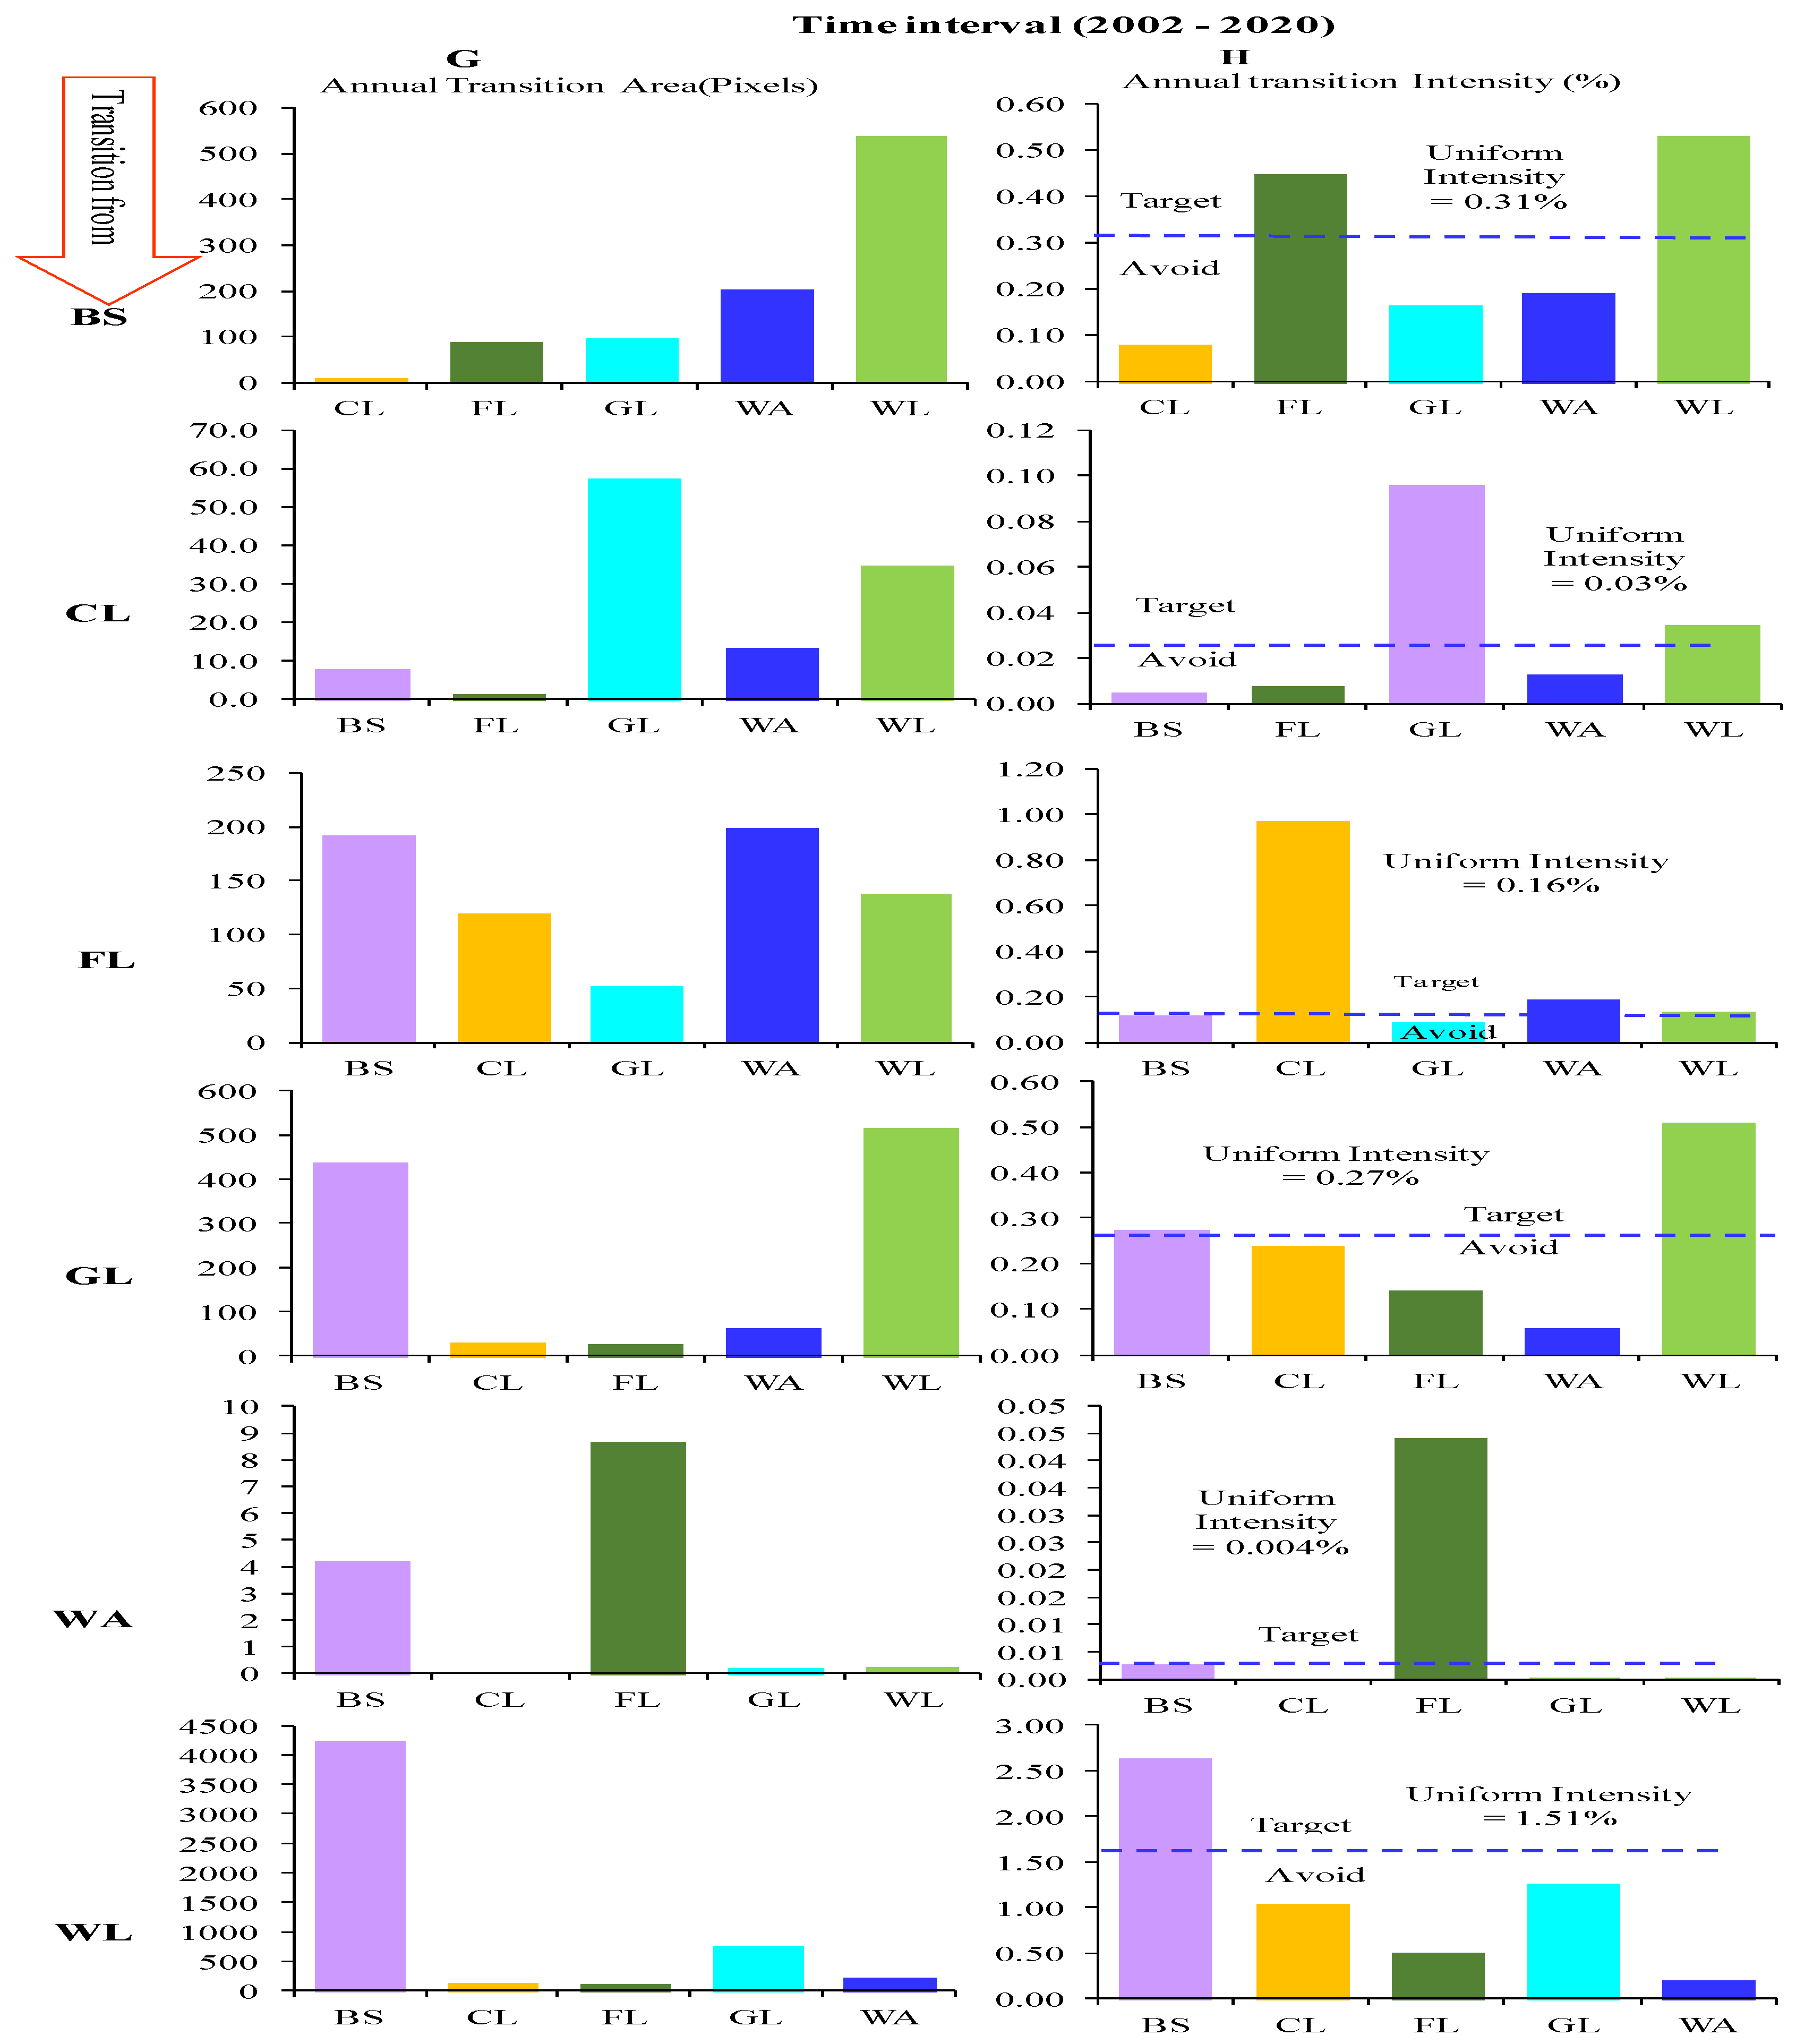
In Figure 6 the graphs under columns A and C show the annual area (count of pixels) transited to the gaining land type from other types and under columns B and D show the intensity of gain transition. Similarly, in Figure 7 the graphs under E and G display the annual area transition from losing land type, and under columns F and H show the intensity of loss transitions. Since 1986, the LUC observed in the study area is predominantly characterized by the intensive expansion in BS and LC at the cost of FL, GL, and WL, although vital for biodiversity conservation and ecosystem services including livelihood opportunities for local people. Therefore, our TLI focused on the transitions to BS and CL and from FL, WL and GL.
As displayed in Figure 6 and Table 3, the gain of BS was from all land types, but the largest portion was from WL, 83.95% (214.10ha yr-1) in FTIS and 86.81% (374.30ha yr-1) in STIS. Likewise, the transition intensity confirms that the gain of this land more intensively targeted WL and avoided others in both time intervals. Therefore, the transitions to BS were stationary, although not perfect. Moreover, the largest gain of BS from WL could be associated with its proportionate size or strength/intensity/of the transition. However, As shown in the graph almost half of the gain transition intensity bars from WL extends above the uniform lines; signifying the systematically targeted transition to BS from WL was significantly contributed to the intensiveness of the change. Similarly, CL’s gain was transferred from all others, except WA. However. the largest portion (above 80%) was intensively targeted from FL in both time intervals, slightly targeted from WL in STIS and avoided others. Thus, even though not perfect, all the transitions to this land were stationary, except from WL. The main logical reason for FL being intensively targeted by the expansion of CL was its closest location to cultivated and rural settlement areas, particularly in the Southeastern part of the park.
Regarding the loss transition, TLI shows from the total annual area transited from GL (189 and 99ha) to all other land types, the largest portion (79.29% in FTIS & 47.62% in STIS) intensively targeted towards WL. The all transitions from GL were stationary but not perfectly stationary. Similarly, When the area of WL annually declined by (287.84 and 482.62ha) the largest transition (74.39%, FTIS, and 77.50%, STIS) was intensively targeted by BS and avoided by others; which were also stationary but none of them perfectly stationary. Subsequently, when FL shirked down by (80.46 and 63.23ha yr-1), a significant portion was taken by BS (27.53 and 25.77%, WL (19.68 and 34.83%) and CL (16.88 and 26.44%) during STIS and FTIS, respectively. However, intensively targeted by CL in both time intervals, less intensively targeted WA in STIS, and avoided others; therefore, its transition to WL, GL, and CL were stationary.

3.4. Implications of Land Use Change

A widespread and anthropogenic-oriented LUC occurring in biodiversity hotspot areas has significant adverse implications for natural ecosystems and biodiversity [12,56]. The natural forest and woodland are the major natural ecosystems in accommodating biodiversity and provision of multifold ecosystem services in NNP. However, the study’s results show during the last 34 years 1426ha forest and 7043ha woodland was neatly degraded from 3198ha and 16247ha in 1986; the largest portion contributed to the expansion of bush/shrubland (147.27%) and cultivated (126.44%); which profoundly impoverished the functionality of the forest and woodland ecosystems and resulting in substantial wild animals’ habitat destruction and biodiversity loss accompanied by species extinction ( See Figure S 3). In line with this, researchers, such as [12,39,54,58] found that human-induced LUC and degradation have been the major threat to the drastic loss of habitat and biodiversity in many protected areas across the world. Similar findings were also reported in Ethiopia by [25,26].
Moreover, In NNP, Savanna grassland is another important natural ecosystem, playing crucial in biodiversity conservation, and ecosystem services (economic and ecological). It has been serving as a home and vital ground for forage, drinking water, and reproduction for many birds, herbivorous and omnivorous animals [30]. Particularly, it is known for the highest number of plain Zebra; one of the most threatened wild animals in Ethiopia. However, our study reveals that due to the observed LUC, the grassland declined by 1965ha (27%) of net loss, of which more than 80% was attributed to invasive bush and shrub. Certainly, this vast land transition, particularly towards bush and shrubs considerably daunt the roles of grassland in NNP and comes up with multiple ecological consequences; scarcity of fodders and water for wild animals and decline of biodiversity(see Figure 4 and Figure 5). Supporting this finding, the experimental study carried out by [50] confirmed that the land transition process from grassland to bushland often ended with a wide range and prolonged environmental and economic problems.
Apart from biodiversity conservation, NNP is known for its multitudinous ecological services: regulation of precipitation and hydrological processes, carbon sequestration, and climate monitoring which have global and local importance. In addition, the natural springs and rivers that supply water for local people (urban and rural dwellers) and wild animals, emanate and flow inside the park, particularly in the forested areas. In flowless speaking, continued deforestation for human land uses and benefits has deleterious consequences on the ecological services of the park including disturbance of precipitation cycles and shortage of rainfall, prolonged drought, and scarcity of water supply in the park and surrounding areas. In addition, anthropogenic-driven land conversions and degradation have been considered the major causes of soil erosion and sedimentation [8,59]. Among the land types, grassland is more important for controlling soil erosion and transportation activities [59]. Therefore, the degradation of grassland coupled with forest destruction significantly escalates the rate of soil erosion from terrestrial parts and sedimentation in water areas of NNP, which have also negative consequences on the aquatic ecosystems. Furthermore, the expansion of cultivated, and settlement areas certainly amplifies the degradation of important ecosystems and ecological services in different ways. In line with this, [8] explained that forest and grassland degradation and conversion to cultivated land lead to disturbance in hydrological processes, high runoff, increased soil degradation, and water pollution.
Empirical studies [12,37] reported most of PAs are important sources of livelihood for people living in the adjacent areas, particularly, in developing countries. Likewise, for a long time, NNP has played a paramount role in supporting the socioeconomic life of many rural and urban dwellers in different ways: livestock rearing, crop cultivation, fishing, fuel wood production, and so on. Thus, the widespread degradation of forest, woodland and grassland resulting in long-term socioeconomic repercussions, particularly for farmers living in and around the park profundal depending on natural resources for their survival. Therefore, monitoring the ongoing serious LUC and directing the management practices and human interventions towards sustaining the natural resources not only for biodiversity conservation but also significantly important for harnessing socioeconomic opportunities of the park sustainably. In light of this further studies should be carried out on anthropogenic and natural drivers integrated with spatiotemporal LUC in the park.

4. Conclusions and Recommendation

This study comprehensively examined the LUC processes between 1986 & 2002 and 2002 and 2020 using intensity analysis model in Nechsar National Park(NNP); one of the global biodiversity hotspot areas but under the threat of biodiversity loss resulting from human-driven LUC and degradation. The results show that the overall LUC covered above 2/3 of the study area over the last 34 years, prevailed slowly in FTIS and rapidly in STIS, and turned-out in continued expansion in bush/shrub cultivated and water with net gain and downsized in forest, grass and woodland with net loss. The annual gain in forest, woodland and grassland was dormant while its loss intensively active in both time intervals, except grassland during STIS. The most active annual gain of bush/shrubland was displaced all land types but intensively targeted woodland and avoided others while its loss was dormant. Despite nearly ½ of the land overtaken by other all land types, forest and woodland intensively targeted by cultivated and bush/shrub, respectively during the FTIS and STIS. Similarly, the loss from grass transferred to all but intensively targeted to woodland. Furthermore, although not perfect, stationarity trends were observed at category and transition levels. Generally, the results obtained from intensity analysis and vulnerability indexes indicate the ongoing LUC has negative implications for biodiversity and ecosystem services in NNP. Therefore, adequate and targeted interventions are needed not only for protecting the remnants but also resorting the degraded grass, forest, and woodland and abating the continued expansion in cultivated and bush/shrubland to maintain the natural land transition process and then sustain the park’s functionality.

Supplementary Materials

The following supporting information can be downloaded at the website of this paper posted on Preprints.org.

Author Contributions

Conceived, M.S., B.S., and E.T. designed the study, M.S., B.S. and E.T. and data curation, M.S. and A. B.; carried out the field-work, M.S.; writing—original draft preparation, M.S.; writing—review, B.S., and E.T.; supervision, B.S. and E.T. All authors have read and agreed to the published version of the manuscript.

Funding

The financial budget was supported by AMU, Ethiopia under the grant code: GOV/AMU/TH24/CSSH/GES/05/12.

Data Availability Statement

Data available in a publicly accessible repository.

Acknowledgments

Our acknowledgement goes to ArbaMinch University (AMU) for financial support. We have also a special thanks to Abdulselam Turke for his language editing and moral support.

Conflicts of Interests

The authors declared that they have no any competing interest.

References

  1. Winkler, K., Fuchs, R., Rounsevell, M., Herold, M.: Global land use changes are four times greater than previously estimated. Nat. Commun. 12, 1–10 (2021). [CrossRef]
  2. Akbar, A., Zhoolideh, M., Azadi, H., Lee, J., Scheffran, J.: Interactions of land-use cover and climate change at global level : How to mitigate the environmental risks and warming effects Intergovernmental Panel on Climate Change. Ecol. Indic. 146, 1–9 (2023). [CrossRef]
  3. Xie, G., Zhang, C., Zhen, L., Zhang, L.: Dynamic changes in the value of China’s ecosystem services. Ecosyst. Serv. 26, 146–154 (2017). [CrossRef]
  4. Costanza, R., Groot, R. De, Sutton, P., Ploeg, S. Van Der, Anderson, S.J., Kubiszewski, I., Farber, S., Turner, R.K.: Changes in the global value of ecosystem services. Glob. Environ. Chang. 26, 152–158 (2014). [CrossRef]
  5. Davison, C.W., Rahbek, C., Morueta-Holme, N.: Land-use change and biodiversity: Challenges for assembling evidence on the greatest threat to nature. Glob. Chang. Biol. 00, 1–16 (2021). [CrossRef]
  6. Mekonnen, M.: Human Activity , Biodiversity and Ecosystem Services in Protected Areas. Springer Nature Switzerland AG, Cham, Switzerland (2022).
  7. Ziaul Hoque, M., Islam, I., Ahmed, M., Shamim Hasan, S., Ahmed Prodhan, F.: Spatio-temporal changes of land use land cover and ecosystem service values in coastal Bangladesh. Egypt. J. Remote Sens. Sp. Sci. 25, 173–180 (2022). [CrossRef]
  8. Anteneh, Y., Stellmacher, T., Zeleke, G.: Dynamics of land change:insights from a three-level intensity analysis of the Legedadie-Dire catchments, Ethiopia. Env. Monit Assess. 190, 1–22 (2018). [CrossRef]
  9. Fenta, A., Tsunekawa, A., Haregeweyn, N., Tsubo, M., Yasuda, H.: Cropland expansion outweighs the monetary effect of declining natural vegetation on ecosystem services in sub-Saharan Africa. Ecosyst. Serv. 45, 1–17 (2020). [CrossRef]
  10. Robson, A., Trimble, M., Bauer, D., Loveridge, A., Thomson, P., Western, G., Lindsey, P.: Over 80% of Africa’s savannah conservation land is failing or deteriorating according to lions as an indicator species. Conserv. Lett. 15, 1–12 (2022). [CrossRef]
  11. Voumik, Ll., Sultana, T.: Impact of urbanization, industrialization, electrification and renewable energy on the environment in BRICS: fresh evidence from novel CS-ARDL model. Heliyon. 8, 1–9 (2022). [CrossRef]
  12. Menbere, I.P.: The implication of land use land cover change on Biodiversityconservation: An overview from protected areas in Ethiopia. J. Earth Environ. Sci. Res. 3, 1–15 (2021). [CrossRef]
  13. Birch, J., Newton, A., Aquino, C.: Cost-effectiveness of dryland forest restoration evaluated by spatial analysis of ecosystem services. Proc. Natl. Acad. Sci. 107, (2010). [CrossRef]
  14. Marchese, C.: Biodiversity hotspots: A shortcut for a more complicated concept. Glob. Ecol. Conserv. 3, 297–309 (2015). [CrossRef]
  15. Cunha, E., Santos, C., Silva, R., Bacani, V., Pott, A.: Future scenarios based on a CA-Markov land use and land cover simulation model for a tropical humid basin in the Cerrado/Atlantic forest ecotone of Brazil. Land use policy. 101, (2021). [CrossRef]
  16. Lu, X., Zhou, Y., Liu, Y., Le, Y.: The role of protected areas in land use/land cover change and the carbon cycle in the conterminous United Satates. Int. J. Lab. Hematol. 38, 42–49 (2018). [CrossRef]
  17. Oduro, J., Agyemang-duah, W., Kweku, A., Kpienbaareh, D.: Trees , Forests and People Analysing patterns of forest cover change and related land uses in the Tano-Offin forest reserve in Ghana : Implications for forest policy and land management. Trees, For. People. 5, 100105 (2021). [CrossRef]
  18. Jin, Y., Fan, H.: Land use / land cover change and its impacts on protected areas in Mengla County , Xishuangbanna , Southwest China. 2012, (2018).
  19. Abera, W., Tamene, L., Tibebe, D.: Characterizing and evaluating the impacts of national land restoration initiatives on ecosystem services in Ethiopia. L. Degrad. Dev. 31, 37–52 (2020). [CrossRef]
  20. Gebreselassie, S., Kirui, O.K., Mirzabaev, A.: Economics of Land Degradation and Improvement in Ethiopia. In: Nkonya, E., Braun, J. von, and Mirzabaev, A. (eds.) Economics of Land Degradation and Improvement - A Global Assessment for Sustainable Development. pp. 401–430. Springer Science+Business Media (2016).
  21. Seid, M., Simane, B., Teferi, E., Azmeraw, A.: Determinants of farmers ’ multiple-choice and sustainable use of indigenous land management practices in the Southern Rift Valley of Ethiopia. Curr. Res. Environ. Sustain. 4, 1–11 (2022). [CrossRef]
  22. Mengie, B., Teshome, Y., Dereje, T.: Effects of soil and water conservation practices on soil physicochemical properties in Gumara watershed , Upper. Ecol. Process. 1–14 (2019).
  23. Teferi, E., Bewket, W., Uhlenbrook, S., Wenninger, J.: Understanding recent land use and land cover dynamics in the source region of the Upper Blue Nile, Ethiopia: Spatially explicit statistical modeling of systematic transitions. Agric. Ecosyst. Environ. 165, 98–117 (2013). [CrossRef]
  24. Seid, M., Kakiso, T.: Critical solutions for critical problems:Threats to sustainable use and management of Nech Sar National Park (NSNP) in Ethiopia. Eur. J. Res. 8, 110–133 (2018). [CrossRef]
  25. Temesgen, F., Bikila, W., Hailemicael Alemayehu: Seasonal land use/land cover change and the drivers in Kafta Sheraro national park, Tigray, Ethiopia. Heliyon. 8, e12298 (2022). [CrossRef]
  26. Debebe, B., Senbeta, F., Teferi, E., Diriba, D., Teketay, D.: Analysis of forest cover change and its drivers in biodiversity hotspot areas of the Semien Mountains National Park, Northwest Ethiopia. Sustainability. 15, 1–22 (2023). [CrossRef]
  27. Fetene, A., Hilker, T., Yeshitela, K., Prasse, R., Cohen, W., Yang, Z.: Detecting trends in land use and land cover change of Nech Sar National Park, Ethiopia. Environ. Manage. 137–147 (2015). [CrossRef]
  28. Admasu, S., Scholte, P., Berhanu, L.: The State of protected areas and conservation of Ethiopia’s iconic large mammals: Implications for the post-2020 Global Biodiversity Framework. J. Int. Wildl. Law Policy. 26, 222–237 (2023). [CrossRef]
  29. Muhammed, A., Bufebo, B., Elias, E.: Potential and threats on National Parks:The case of Nech Sar National Park. J. Harmon. Res. 4, 176–184 (2016).
  30. Deribew, K.T.: Spatially explicit statistical modeling of random and systematic land cover transitions in the main grassland plain of Nech Sar National Park, Ethiopia. Ecol. Process. 8, 1–20 (2019). [CrossRef]
  31. Hailu, Y., Tilahun, B., Kerebeh, H., Tafese, T.: Land use land cover change detection in Gibe Sheleko national Park, Southwestern Ethiopia. AgEcon. 4, 20–30 (2018).
  32. Belay, S., Amsalu, A., Abebe, E.: Land use and land cover changes in Awash National Park, Ethiopia: Impact of decentralization on the use and management of resources. Open J. Ecol. 4, 950–960 (2014). [CrossRef]
  33. Hailemariam, S., Soromessa, T., Teketay, D.: Land use and land cover change in the Bale mountain Eco-region of Ethiopia during 1985 to 2015. land. 5, 1–22 (2016). [CrossRef]
  34. Tadesse, L.: Application of remote sensing and geographical information system in mapping land cover of the national park. Int. J. Hum. Cap. Urban Manag. 5, 139–152 (2020). [CrossRef]
  35. Aldwaik, S., Pontius, R.: Intensity analysis to unify measurements of size and stationarity of land changes by interval, category,and transition. Landsc. Urban Plan. 106, 103–114 (2012). [CrossRef]
  36. Quan, B., Gilmore, R., Jr, P.: Intensity analysis to communicate land change during three time intervals in two regions of Quanzhou City, China. GIScience Remote Sens. 1–16 (2019). [CrossRef]
  37. Bailey, K., Mccleery, R., Binford, M., Zweig, C.: Land-cover change within and around protected areas in a biodiversity hotspot. J. Land Use Sci. 1–25 (2015). [CrossRef]
  38. Olaniyi, O.E.: Land use / land cover dynamics and its drivers in Okomu National Park , Nigeria : A geospatial analysis approach. World Environ. Conserv. Conf. 61–69 (2018).
  39. Silva, I., Dupas, F., Costa, C., Medeiros, G., de Souza, A.: Spatiotemporal changes in land cover land use in protected areas of Serra da Mantiqueira, Southeastern Brazil. Environ. Challenges. 4, 1–11 (2021). [CrossRef]
  40. Mamo, Y.: Status of the Swayne’s Hartebeest, (Alcelaphus buselaphus swaynei) meta-population under land cover changes in Ethiopian Protected Areas. Int. J. Biodivers. Conserv. 4, 416–426 (2012). [CrossRef]
  41. Doku, Y., Bekele, A., Balakrishnan, M.: Population status of plains zebra (Equus quagga) in Nechisar plains, Nechisar National Park, Ethiopia. Trop. Ecol. 48, 79–86 (2007).
  42. Lu, Y., Wu, P., Ma, X., Li, X.: Detection and prediction of land use/land cover change using spatiotemporal data fusion and the Cellular Automata–Markov model. Environ. Monit. Assess. 191, (2019). [CrossRef]
  43. Medina, A., Elena, B., Atehort, A.: Comparison of maximum likelihood, support vector machines, and random forest techniques in satellite images classifion. Tecnura. 23, 13–26 (2019). [CrossRef]
  44. Berihun, M., Tsunekawa, A., Haregeweyn, N., Meshesha, D., Adgo, E.: Exploring land use/land cover changes, drivers and their implications in contrasting agro-ecological environments of Ethiopia. Land use policy. 87, 1–15 (2019). [CrossRef]
  45. Yesuph, A., Dagnew, A.: Land use/cover spatiotemporal dynamics, driving forces and implications at the Beshillo catchment of the Blue Nile Basin, North Eastern Highlands of Ethiopia. Environ. Syst. Res. 8, (2019). [CrossRef]
  46. Rahman, T., Tabassum, F., Rasheduzzaman, Saba, H., Sarkar, L., Ferdous, J.: Temporal dynamics of land use/land cover change and its prediction using CA-ANN model for southwestern coastal Bangladesh. Environ. Monit. Assess. 189, 1–18 (2017). [CrossRef]
  47. Ketema, H., Wei, W., Legesse, A., Wolde, Z., Temesgen, H., Yimer, F., Mamo, A.: Quantifying smallholder farmers’ managed land use/land cover dynamics and its drivers in contrasting agro-ecological zones of the East African Rift. Glob. Ecol. Conserv. 21, 1–16 (2020). [CrossRef]
  48. Congalton, R., Green, K.: Assessing the accuracy of remotely sensed data: Principles and practices. Taylor & Francis Group (2008).
  49. John, L.R., Hambati, H., Armah, F.A.: An Intensity Analysis of land-use and land-cover change in Karatu District, Tanzania: Community perceptions and coping strategies. African Geogr. Rev. 33, 150–173 (2014). [CrossRef]
  50. Pierce, N., Archer, S., Bestelmeyer, B., James, D.: Grass-Shrub competition in Arid lands:An overlooked driver in grassland-shrubland state transition? Ecosystems. 22, 619–628 (2019). [CrossRef]
  51. Verburg, P.H., Overmars, K.P., Huigen, M.G.A., Groot, W.T. De, Veldkamp, A.: Analysis of the effects of land use change on protected areas in the Philippines. 26, 153–173 (2006). [CrossRef]
  52. Legesse, A.: CA-Markov Chain model based deforestation modeling in the lower catchment of Gidabo Basin, (2019).
  53. Shiferaw, H., Bewket, W., Alamirew, T., Zeleke, G., Teketay, D.: Implications of land use/land cover dynamics and Prosopis invasion on ecosystem service values in Afar Region, Ethiopia. Sci. Total Environ. 675, 354–366 (2019). [CrossRef]
  54. Islam, R., Khan, N., Khan, Z., Roy, B.: A three decade assessment of forest cover changes in Nijhum dwip national park using remote sensing and GIS. Environ. Challenges. 4, 1–13 (2021). [CrossRef]
  55. Zhou, P., Huang, J., Pontius, R., Hong, H.: Land classification and change intensity analysis in a coastal watershed of Southeast China. Sensors. 14, 11640–11658 (2014). [CrossRef]
  56. Tesfaw, A.T., Pfaff, A., Golden, R.E., Qin, S., Medeiros, R.: Land-use and land-cover change shape the sustainability and impacts of protected areas. (2018). [CrossRef]
  57. Yuanyuan, Y., Yansui, L., Di, X., Shuwen, Z.: Use of intensity analysis to measure land use changes from 1932 to 2005 in Zhenlai County, Northeast China. Chin. Geogra. Sci. 27, 441–455 (2017). [CrossRef]
  58. Yadeta, T., Tessema, Z.K., Kebede, F., Mengesha, G., Asefa, A.: Land use land cover change in and around Chebera Churchura National Park, Southwestern Ethiopia: implications for management effectiveness. Environ. Syst. Res. 11, (2022). [CrossRef]
  59. Milazzo, F., Fernández, P., Peña, A., Vanwalleghem, T.: The resilience of soil erosion rates under historical land use change in agroecosystems of Southern Spain. Sci. Total Environ. 822, 1–11 (2022). [CrossRef]
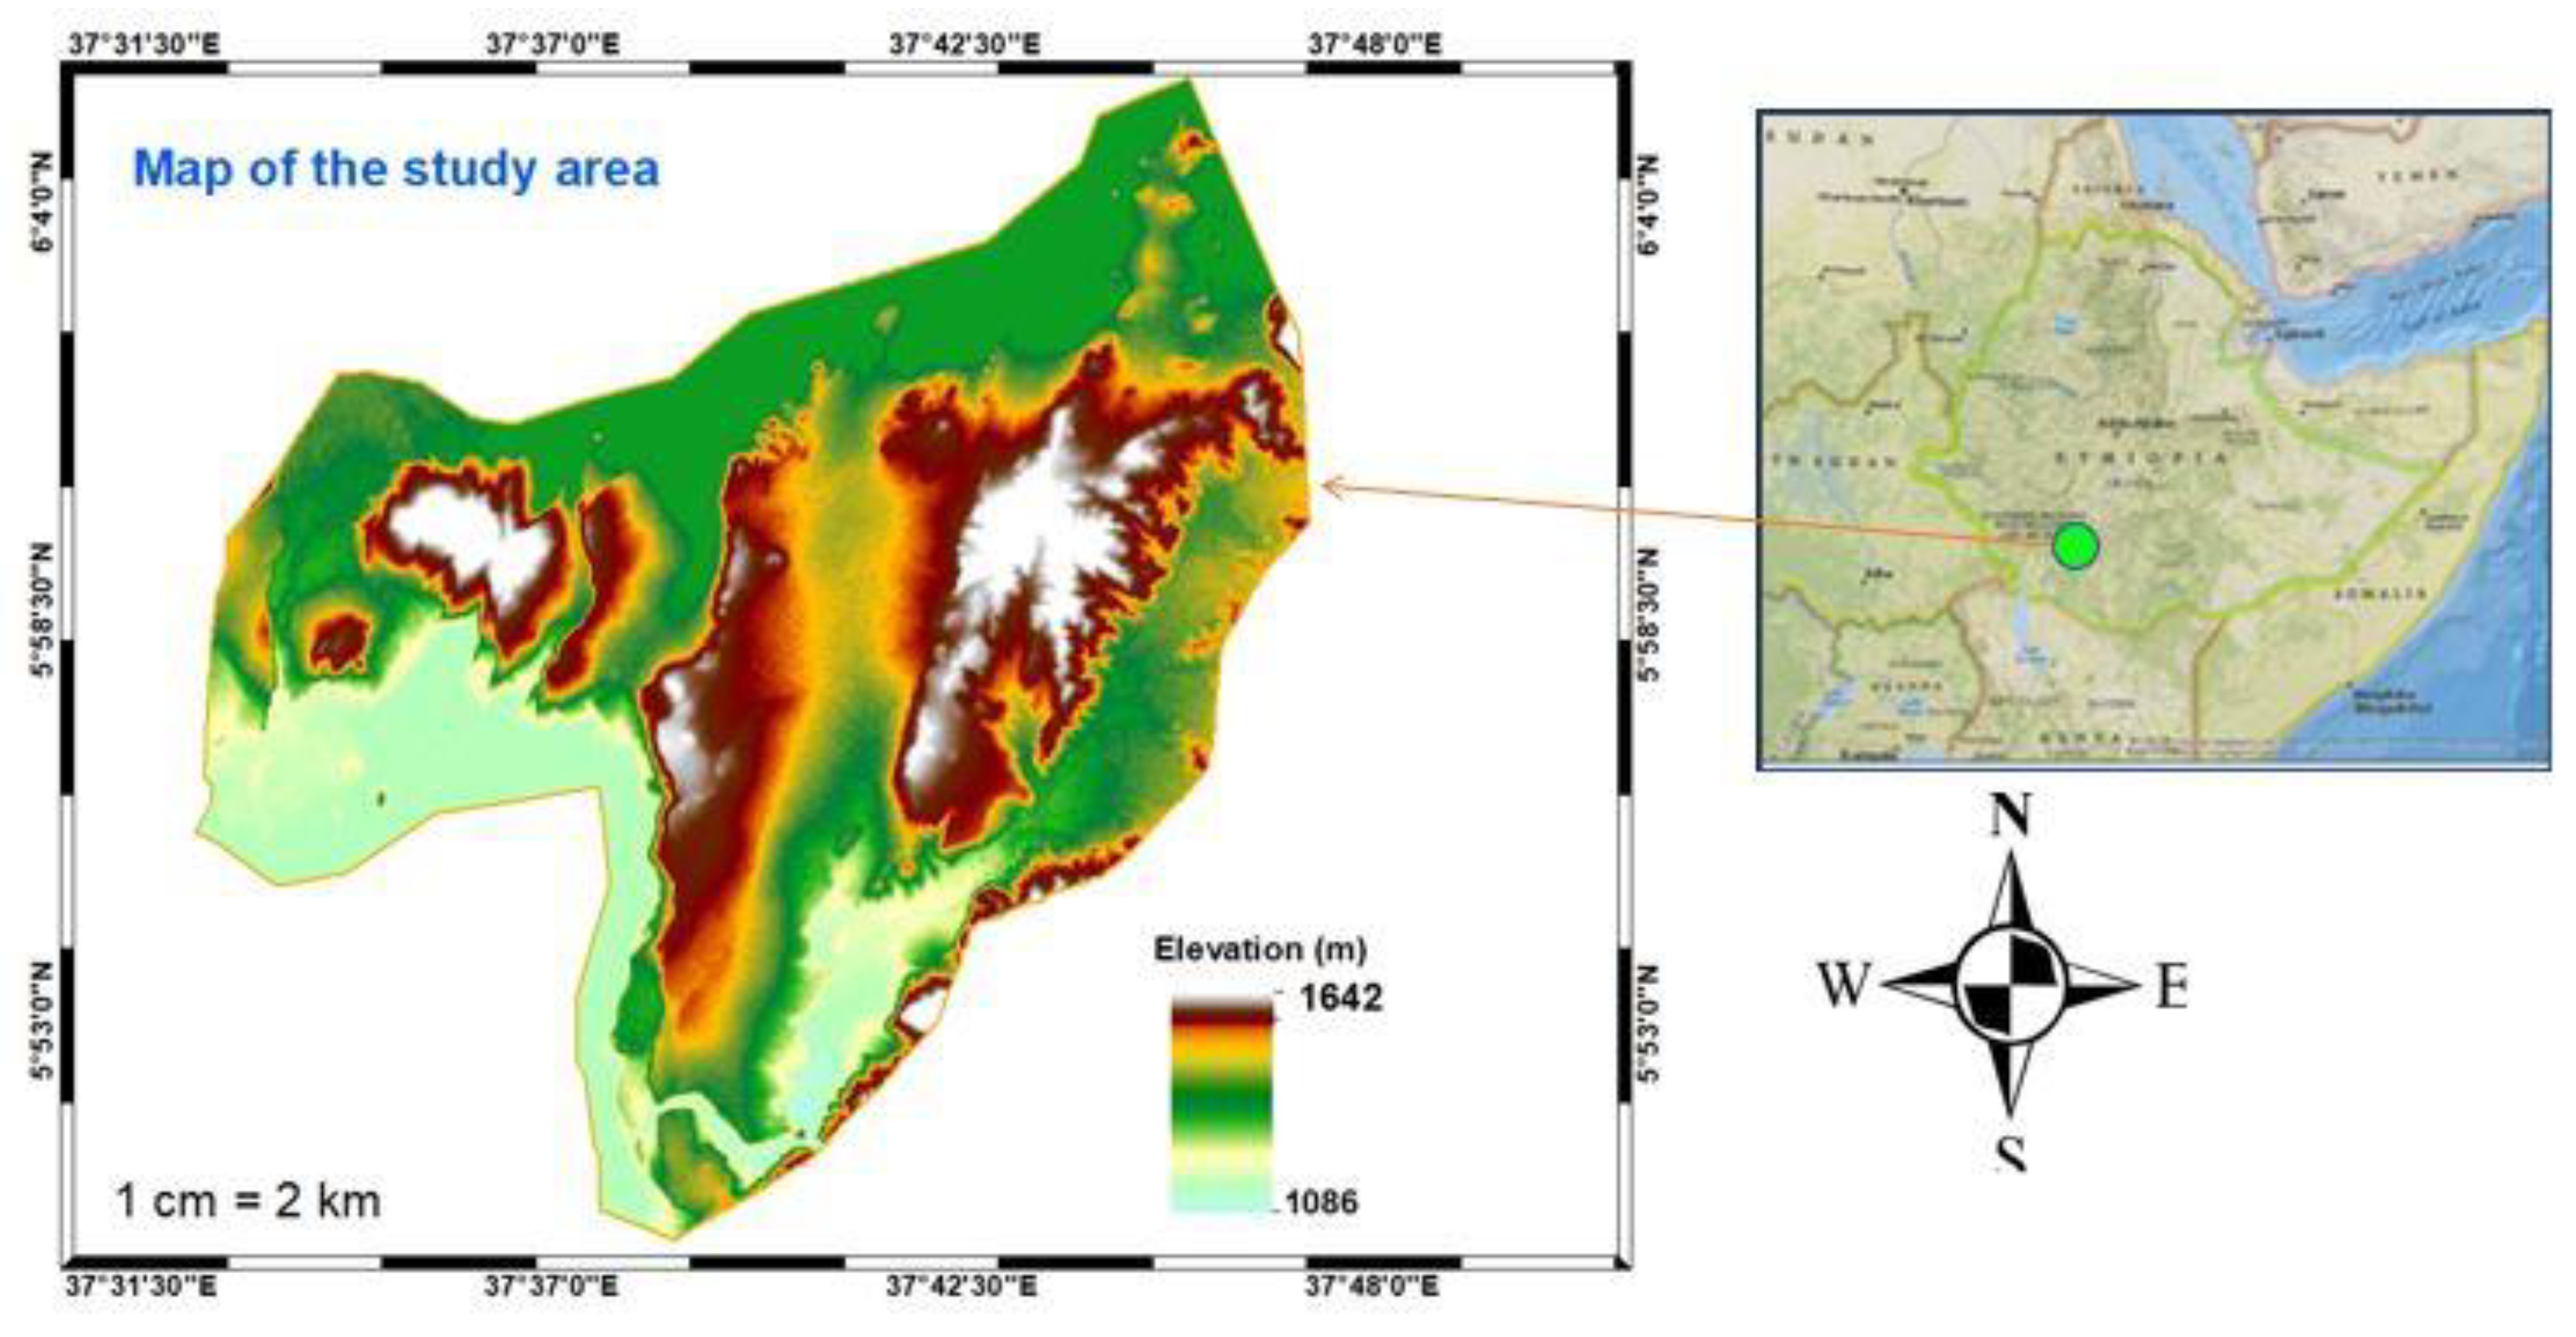
Figure 1. Map of the study area (Note: This study area map is produced merely for research purposes).
Preprints 137853 g001
Figure 2. The stepwise flow chart of intensity analysis: adapted from [35].
Preprints 137853 g002
Figure 3. Land use map of the study area: percentage of land use types(1986, 2002& 2020) and land change (1986 – 2002, 2002 – 2020, and 1986 – 2020).
Preprints 137853 g003
Figure 4. Interval level intensity analysis for 1986 – 2002 and 2002 - 2020.
Preprints 137853 g004
Figure 5. Category level intensity analysis for 1986 – 2002(A) and 2002 – 2020(B).
Preprints 137853 g005
Figure 6. Transition level intensity analysis ( transitions to a land type) during 1986 – 2002 and 2002 - 2020.
Preprints 137853 g006aPreprints 137853 g006b
Figure 7. Transition level intensity analysis (transitions from a land use type) during 1986 – 2002 and 2002 - 2020.
Preprints 137853 g007aPreprints 137853 g007b
Table 1. Mathematical symbols and notation of variables used in intensity analysis [35].
Symbols Meaning for Symbols
j Index for a category at the final time point for a particular time interval
i Index for a category at the initial time point for a particular time interval
T Number of time points
m Losing category index for the selected transition
n Gaining category index for selected transition
t Index for the initial time point of interval [Yt, Yt+1], where t ranges from 1 to T-1
Yt Year at time point t
Ctij Number of pixels that transition from category i at time Yt to category j at time Yt+1
St Annual change for time interval [Yt, Yt+1]
U Value of uniform line for time intensity analysis
Gtj Annual intensity of gross gain of category j for time interval [Yt, Yt+1] relative to the size of category j at time t + 1
Lti Annual intensity of the gross loss of category i for time interval [Yt, Yt+1] relative to the size of category i at time t
Rtin Annual intensity of transition from category i to category n during the time interval [Yt, Yt+1] ; where I # n
Wtn Value of uniform intensity of transition to category n from all non-n categories at time Yt during the time interval [Yt, Yt+1]
Qtmj Annual intensity of transition from category m to category j during the time interval [Yt, Yt+1]; where j # m
Vtm Uniform intensity of transition from category m to all non-m categories at time Yt+1 during time interval [Yt, Yt+1]
Table 2. Area coverage and change of each land use type.
Land use types Area in ha(%) Area changes in ha(%)
1986 2002 2020 1986- 2002 2002 - 2020 1986 -2020
FL 3198(7.73) 2540(6.14) 1772(4.28) 658(-20.57) 768(-30.25) 1426(-44.60)
BS 5831(14.08) 8188(19.78) 14418(34.82) 2358(40.43) 6229(76.08) 8587(147.27)
WL 16247(39.24) 15836(38.25) 9204(22.23) 411(-2.53) 6632(-41.88) 7043(-43.35)
GL 7327(17.70) 5566(13.44) 5362(12.95) 1761(-24.04) 204(-3.66) 1965(-26.82)
WA 8311(20.08) 8443(20.39) 9544(23.05) 132(1.59) 1101(13.04) 1233(14.84)
CL 486(1.17) 827(2.00) 1101(2.66) 341(70.15) 274(33.08) 615(126.44)
Total 41400
Table 3. Total number of Pixels for persistence land on the main diagonal (underlined) and land changes off the main diagonal from 1986 - 2002 and 2002 – 2020 (In Bold).
Land use Type Final year of the Time interval Initial Total Gross Loss Absolute value of
net change
Swap
FL BS WL GL WA CL
Initial year of the Time interval
FL 21232 3665 4953 1737 194 3755 35536 14304 7309 13990
15570 3484 2490 932 3615 2136 28227 12657 8539 8236
BS 3615 45177 13880 677 1064 373 64786 19609 26195 39218
1653 73387 10231 1876 3624 210 90981 17594 69214 35188
WL 1062 38071 129353 10972 453 613 180524 51171 4572 93198
1792 74865 79428 13768 3807 2292 175952 96524 73688 45672
GL 536 3112 26641 47804 3164 153 81410 33606 19570 28072
486 8222 9473 41959 1176 524 61840 19881 2261 35240
WA 1156 940 786 526 88940 0 92348 3408 1467 6816
153 78 7 3 93574 0 93815 241 12234 482
CL 626 16 339 124 0 4296 5401 1105 3789 2210
34 159 635 1041 253 7068 9190 2122 3040 4244
Final Total 28227 90981 175952 61840 93815 9190 460005
19688 160195 102264 59579 106049 12230 460005
Gross
Gain
6995 45804 46599 14036 4875 4894 123203
4118 86808 22836 17620 12475 5162 149019
Disclaimer/Publisher’s Note: The statements, opinions and data contained in all publications are solely those of the individual author(s) and contributor(s) and not of MDPI and/or the editor(s). MDPI and/or the editor(s) disclaim responsibility for any injury to people or property resulting from any ideas, methods, instructions or products referred to in the content.
Copyright: This open access article is published under a Creative Commons CC BY 4.0 license, which permit the free download, distribution, and reuse, provided that the author and preprint are cited in any reuse.
Alerts
Prerpints.org logo

Preprints.org is a free preprint server supported by MDPI in Basel, Switzerland.

Subscribe

© 2025 MDPI (Basel, Switzerland) unless otherwise stated