Submitted:
30 October 2024
Posted:
30 October 2024
Read the latest preprint version here
Abstract
Psychological momentum dynamics in tennis have triggered interest for a long time, but measuring their impact presents substantial obstacles. In this paper, we present an approach to quantify momentum that combines real-time winning probabilities, leverage, and an exponentially weighted moving average (EWMA). We test the method on a high-profile match between Carlos Alcaraz and Novak Djokovic, demonstrating how changes in leverage affect momentum. Furthermore, we use feature extraction methods from time series analysis to derive momentum-related characteristics, which are critical inputs for creating an eXtreme Gradient Boosting (XGBoost) binary classification model to predict game winners. The algorithm has an average accuracy of 84% and provides real-time predictions of each player’s chances of winning the match. Our findings indicate that momentum is a somewhat relevant element in forecasting match outcomes, highlighting its potential value in improving match prediction systems.
Keywords:
tennis
; momentum
; quantification
; match prediction
; XGBoost
1. Introduction
Professional tennis matches require a great combination of the player’s technical performance, tactics, endurance, and psychological conditions. Many players have profound skills but is hard to win the match due to hidden factors. Therefore, it is important to develop models to help players and coaches formulate corresponding game strategies to improve the winning rate.
Momentum in sports, refers to the positive or negative shifts in cognition, emotions, physiology, and behavior that result from an event or series of events, potentially influencing performance and competition outcomes [1]. This concept is often described as the “Hot Hand” or being “In The Zone”.
Previous studies have shown that tactical momentum and psychological momentum both exist in tennis matches, especially at some clutch points. Tactical Momentum (TM) is the advantage gained as a result of a strategy or tactical adjustment employed by a player or team during a match. On the other hand, Psychological Momentum (PM) refers to psychological energy that affects players’ performance when it is positive or harmful [1],[3]. When a player is controlling the match, the positive PM will provide a physiological boost involving a positive change in activity level, rhythm, posture, or frequency [2]. It is harder to quantify.
Specifically, previous research mainly focused on proving the existence of PM. Dietl and Nesseler (2017) used the binary approach and established the OLS and Logit model to demonstrate the effect of PM [2]. Through analyzed break-serve points and serve points, statistical hypothesis tests were also used to verify the significance of players' performance before and after key points. (Moss & O’Donoghue, 2015) [4]. Based on the results of the theoretical model, direct testing, and indirect testing, Depken et al. (2022) concluded that the historical score has some influence on the current winning percentage [3].
There are also studies focused on the prediction of the tennis match outcome before the match. Gu et al. (2019) employ the Analytic Network Process (ANP) to combine tangible and intangible variables to better assess match outcomes. The model’s overall prediction accuracy reached 84%, significantly higher than the accuracy of traditional statistical methods, which was around 70% [18].
However, limited research has been done to combine real-time momentum and match outcome prediction. Focusing on this gap is significant which is helpful to develop players’ tactics, mindset, and performance.
In this paper, our analysis mainly focuses on PM. First, we develop the tennis momentum quantification methodology and apply it to predict the outcome of matches. Based on the changes in winning and losing probability, we calculate momentum and provide the visualization of momentum, which is crucial for the analysis of a match.
In our match outcomes prediction, we establish the classification model of machine learning and use it to predict the game-winner. Additionally, we calculate several error indicators to evaluate the accuracy of the model and interpret whether the momentum is an important factor in the prediction.
With our study, the player and his coach can know the dynamic changes in his momentum and winning probability. This system can be used to analyze the rival before or after the match, and even in the match with the help of a data analyst. In that case, our study will help improve the winning percentage of players and promote the development of professional tennis matches.
2. Research Objectives
Our research aims to demonstrate the impact of momentum in a match and contribute to the advancement of tennis players’ competitive level.
To reach our objectives, our first step entails quantifying the momentum and creating visual representations. By analyzing these visualizations, we can draw valuable conclusions. The next step involves effectively training models and predicting the game-winner based on real-time player momentum. Finally, we will evaluate the model’s performance in various matches to demonstrate its reliability.
3. Data and Methods
3.1. Data collection
The data is collected from the playing record of Men’s singles at Wimbledon 2023. This tournament includes a lot of surprises, especially in the final match, Carlos Alcaraz against Novak Djokovic. The dramatic match flow impresses everyone and seems to imply the existence of the concept of momentum in tennis. As a result, we collect the data from this tournament to analyze the player’s momentum.
3.2. Methods
To quantify the momentum, our core idea is based on probabilities of serve and receive. To reflect the dynamic flow, we elicit the quantity of Leverage and use it to compute momentum (Seidl & Lucey, 2022) [8]. After that, the momentum graph can significantly reflect the psychological and tactical changes. Finally, we extract and select features to establish the eXtreme Gradient Boosting (XGBoost) [9] classification model to predict players’ winning rates in the current game (as shown in Figure 1).
4. Momentum Quantification
4.1. Mechanism
Momentum refers to the force that keeps the objects moving in Physics. If two objects collide with each other, the momentum will also switch between them. Based on this idea, the momentum must reflect two players’ status after they are against at a certain point.
To illustrate the quantification system and show its importance, we select the final match in the tournament, Carlos Alcalas 3:2 Novak Djokovic.
4.1.2. Real-Time Winning Probability
First of all, due to the characteristics of tennis, the server has significant advantages in winning the current point [17], which should be reflected in the model (Gillet et al., 2009).
We calculate the winning probability for each player at a specific point based on the now and previous 19 points served and received successful rates. When player A is serving, there are two situations, mathematically,
where n is the number of wins, P is the probability, and . Based on this idea, the winning probability of each player is shown in Figure 2.
In Figure 2, the blue line refers to Player 1 Carlos Alcaraz, and the orange line refers to Player 2 Novak Djokovic. When one player’s winning probability is rising, the other’s will drop. It is obvious to figure out which player has more chance to win the current point. However, the momentum should reflect the changes in the flow. For example, if the player who has been trailing suddenly wins several crucial points in a row, even if they are still behind in the overall score, the momentum shift can provide them with a psychological boost. So we elicit the concept of “leverage” next.
4.1.2. Leverage based on Counterfactual Prediction Framework
The counterfactual prediction framework can reflect the dynamic flow. The main idea is to calculate the “leverage”. Leverage is a measurement that refers to how the probability will vary after winning or losing a point [8]. We define the leverage as a positive quantity and the player will gain the leverage only if he wins the current point. Mathematically, the player’s leverage
where
For visualization purposes, we assign the two players’ leverage to the opposite sign (positive versus negative). The leverage gained by each player can be shown in Figure 3. The blue and orange bars are the leverage of Alcaraz and Djokovic respectively, and Lt = 0 is the turning point.
4.1.3. Momentum and Visualization
To turn the discrete leverage into continuous momentum flow. Finally, we let momentum be constructed with the Exponentially Weighted Moving Average (EWMA) [19] of the leverage gained by a player, which is denoted by
where is the leverage at point , and is the smoothing factor. The large implies the large magnitude of smoothness. A player gains leverage when he wins a point, and it decreases when he loses. Recent points are weighted more in the momentum calculation [8].
We utilize , after all the calculations, the final momentum visualization and illustrations are shown in Figure 4. The blue area stands for Alcaraz’s momentum and the orange area stands for Djokovic’s momentum. When the player’s momentum is approximately zero but not zero, he is still not in the total downdraft. On the other hand, only if one player has momentum while his rival’s is zero, does the momentum swing happen. In that case, the player has less pressure from his rival and has more chance to win or swing the match.
The momentum graph is generally consistent with the trend of the match, to be more specific, the situations of score versus momentum can be described as follows.
- Djokovic’s Dominance
In the first set, Djokovic seemed destined to win easily as he dominated 6–1. The orange area from points 0 to 45 shows Djokovic’s momentum, despite fluctuations, was significantly overwhelming Alcaraz.
- First Swing
The second set was tense and finally won by Alcaraz in a tie-breaker 7–6. The curve section from points 46 to 139 shows the momentum of both players fluctuating frequently towards the end, reflecting the intensity of the situation.
- Alcaraz’s Fight Back
In the third set, Djokovic struggled with a low momentum, while Alcaraz continued his high momentum. From points 140 to 209, the curve shows that, after some initial intersections, the young Spaniard’s momentum significantly leads over Djokovic, mirroring the actual scoreline.
- Second Swing
In the final two sets, our model showcased its superiority. In the fourth set, the young Spaniard seemed in total control as the set started, but Djokovic took complete control to win the set 6–3. This is reflected in our model by the orange curve overcoming the blue.
- Alcaraz’s Victory
Carrying the edge from the fourth set, Djokovic seemed poised to maintain the lead, but a shift occurred, and Alcaraz gained control, winning 6–4. In our model, the blue curve overtakes the orange in the midsection, eventually surpassing Djokovic’s representation.
As a result, the momentum does but does not always reflect the match’s scoreline. Compared with the current scoring condition, momentum has a more evident trend with our quantification. It can be used to analyze the player and his rival in a tennis match.
4.2. Interpretation of Momentum and Break-Serve Points
Utilizing our momentum graph is crucial, for example, we can analyze the important factors that affect the momentum swing (or turning point).
We find that the break-serve point affects the momentum significantly, as shown in Figure 5. The blue points stand for Alcaraz’s break points and the orange points stand for Djokovic’s. The sets and game boundaries are all marked in the plot. It is obvious that when a player wins the break-serve point, he is more likely to have a rapid increase in his momentum, especially for Alcaraz. As a result, break-serve points play an important role in players’ wins in the next few points.
In this situation, the momentum shift is crucial because it not only impacts the immediate game but can also influence the overall match dynamics. Carlos’s recent performance might make Novak more cautious, causing him to adjust his strategy and potentially leading to a different outcome than expected based solely on the current score.
5. Game Winner Prediction
In this section, we establish an XGBoost Classification model. This is because of the accuracy of XGBoost in machine learning models and its interpretability combined with feature importance. In this case, we can evaluate whether momentum plays an important role.
5.1. Model Training
5.1.1. Training and Testing Set Splitting
All 31 matches are used in our model establishment. As shown in Figure 6, we select 28 matches to train our model and 3 matches to test the model. In training sets, we proceed with 5-fold cross-validation to turn the best parameters.
5.1.2. Feature Engineering
To ensure the best performance of the XGBoost model, we proceed with feature engineering in this part. First, we add some new variables from the original dataset that can reflect the match flow. The selected variables contain:
- Momentum: M(t) = M1(t) – M2(t);
- Distance Run Difference (D_DR): p1_distance_run – p2_distance_run;
- Served Score (SrvScr): the cumulative points won when p1 served in the game;
- Received Score (RcvScr): the cumulative points won when p1 received in the game;
- Score Difference (D_Scr): p1_score – p2_score;
- Game won Difference (D_Gm): p1_game – p2_game;
- Others: Serve (Srv), Set number (St), Game number (Gm), Point number (Pt), and Point Victor (PtVct).
After selecting the variables, we process them to derive useful features. To reveal the pattern of momentum flow, we apply the time series decomposition method for feature extraction. Initially, we set the window size to 5 points and calculate the mean (Mn), kurtosis (Kr), skewness (Sk), numerical derivative mean (NDM), and numerical integral (NI). After feature extraction, we obtained more than 100 features as input to the XGBoost binary classification model to improve its accuracy.
The model accuracy was evaluated by using 5-fold Cross-Validation (CV) [15], and we combined our judgment and the results of Bayesian optimization (BO) [16] to obtain the best parameters. Subsequently, we obtained the best parameter combination and selected suitable features. The feature engineering process is outlined in the flowchart provided below (Figure 7).
5.2. Model Accuracy
5.2.1. Training Set Accuracy
We compute the Accuracy, Precision, Recall, F1-score, and AUC-value [13],[14] with 5-Fold CV, the result in Table 2 suggests that our model performs well with an accuracy of 85.2026%, and other metrics are all greater than 80%, which ensure the good performance in the training set.
To analyze the model accuracy deeply, we generate the confusion matrix as shown in Figure 8. In the confusion matrix, “0” stands for player 1 winning, and “1” stands for player 2 (rival) winning. The True Positive (TP), False Positive (FP), False Negative (FN), and True Negative (TN) sample numbers are all shown in the confusion matrix. The number of TP cases is similar to TN cases, but the FP number is slightly higher than FN, which is acceptable.
In the right plot of Figure 8, the dashed line stands for the random situation, the green line is the ROC curve. In ideal situations, the ROC curve should be away from the dashed line as much as possible. From the plot, we get an ROC curve that is smooth and close to the upper left, this implies the model performs well.
After training the model, we analyze the feature importance. As shown in the SHapley Additive exPlanation (SHAP) value [10] graph (Figure 9), momentum is the top 5th important feature in the XGBoost classification model. Its SHAP value is 0.215892. However, the serve is the most important factor for the game-winner, with the dominant SHAP value.
As a result, momentum is a medium important factor in winning the game in general. The most important features are the serve, different scores, and point victor, so the model can identify the serve wins and receive wins by highly important features. As a result, serving and receiving are the key factors that determine the outcome of a match. Psychological factors are not the dominant factor for a game-winner, but they do play a role and contribute to the prediction.
5.2.2. Testing Set Accuracy
In the testing set, our model performs well with an accuracy of 79.1367%, and the recall value is 86% (Table 3). A high Recall rate indicates that the model performs well in detecting positive samples, which can help coaches make conservative decisions. However, the accuracy is lower than the validation set, which means there may still be hidden factors that are out of our model.
Our model is impacted by unexpected factors, which bring some uncertainty to the prediction, as psychological reversal [3] suggested by Depken et al. (2022). “Psychological Reversal (PR)” refers to a significant change in an athlete’s mental state during a competition, resulting in a performance that is contrary to the previous trend.
To be more specific, as Figure 11 suggested, if the performance of two players has significant differences, their momentum will reflect their future performance. However, the performance of our model will drop when PR happens.
To assess the strength of our model, we divided the data into training, validation, and testing sets across 5 different splits. Each time, we calculated metrics to evaluate model accuracy and then computed the average performance. The resulting data suggests a high degree of reliability as we can see in table 4.
A visual depiction of the metrics is shown below. In Figure 12, the blue and red bars represent the mean values of the validation and test sets, respectively. The accuracy, F1 score, and AUC values are similar, hanging around 84%. In terms of precision and recall, the validation and test set means differ by only 1%. The validation set mean appears to lack consistency, whereas the test set mean remains stable at 84%. The difference in the validation set mean can be attributable to our match selection; heated matches and one-sided matchups may have influenced overall performance. In summary, the model scores between 83% and 84% on average across all measures.
6. Discussion
We made progress in several areas of our analysis. First, our quantification method has shown some improvements. Compared to linear approaches and logit models (Dietl & Nessele, 2017), our probability-based momentum quantification represents players’ real-time psychological status more explicitly, dynamically, and intuitively. In addition, we discovered that break-serve scores can increase momentum through visualization, which is consistent with Moss and O’Donoghue’s (2015) research, confirming the effectiveness of our strategy. As a result, this strategy can assist tennis coaches in better understanding their players’ psychological situation and cultivating their mentality.
For match prediction, our model can predict the winner by using momentum, which considers the match's dynamic aspects. Unlike typical pre-match forecasts, which rely solely on historical data (Gu et al., 2019), our system evaluates players’ game performance in real time. This method can more accurately track the chance of winning during the game, giving a more nuanced understanding of how little changes affect the outcome.
Although our game-winning prediction model shows good accuracy, there are still some misclassifications due to unaccounted factors. Future research can focus on optimizing the momentum quantification system and further improving the prediction accuracy. Specifically, combining historical data and the characteristic factors of both players may be helpful. Future analysis of fixed players can lead to better prediction results compared to relying solely on the generative model.
7. Conclusion
This paper presents a method for quantifying the real-time psychological momentum of players during a game. It underscores the significant impact of break-serve points on momentum and emphasizes the effectiveness of the XGBoost model in accurately predicting game winners by using momentum as a valuable and moderately important feature. This method has potential applications in predicting the outcomes of tennis matches.
References
- L. Crust and M. Nesti, A review of psychological momentum in sports: Why qualitative research is needed, Athletic Insight 2006, 8, 1–15.
- H. Dietl and C. Nesseler, Momentum in tennis: Controlling the match, UZH Business Working Paper Series 2017, 365.
- C. A. Depken, J.M. Gandar, and D. A. Shapiro, Set-level strategic and psychological momentum in best-of-three-set professional tennis matches, J. Sports Econ. 2022, 23, 598–623. [Google Scholar] [CrossRef]
- B. Moss and P. O’Donoghue, Momentum in US Open men’s singles tennis, Int. J. Perform. Anal. Sport 2015, 15, 884–896. [Google Scholar]
- P. Meier, R. Flepp, M. Ruedisser, and E. Franck, Separating psychological momentum from strategic momentum: Evidence from men’s professional tennis, J. Econ. Psychol. 2020, 78, p 102269. [Google Scholar] [CrossRef]
- P. O’Donoghue and E. Brown, Sequences of service points and the misperception of momentum in elite tennis, Int. J. Perform. Anal. Sport 2009, 9, 113–127. [Google Scholar]
- Wimbledon, "Wimbledon Official Website," 2024; website available at https://www.wimbledon.com/index.
- R. Seidl and P. Lucey, Live counter-factual analysis in women's tennis using automatic key-moment detection, in Proc. MIT Sloan Sports Anal. Conf, 2022.
- T. Chen and C. Guestrin, XGBoost: A scalable tree boosting system, in Proc. 22nd ACM SIGKDD Int. Conf. Knowl. Discov. Data Min. (KDD'16), Assoc. Comput. Mach., 2016, 785-794.
- SHAP, "SHAP Documentation," 2024; documentation available at https://shap.readthedocs.io/en/latest/api.
- E. Colino, J. García-Unanue, J.L. Felipe, and others, Mechanical properties influencing athlete–surface interaction on tennis court surfaces, Sports Eng. 2024, 27, p 18.
- T. K. Kim, T test as a parametric statistic, Korean J. Anesthesiol. 2015, 68, 540–546. [Google Scholar]
- C. Goutte and E. Gaussier, A probabilistic interpretation of precision, recall, and F-score, with implications for evaluation, in Advances in Information Retrieval, Vol. 3408, Springer, 2005.
- J. Huang and C. X. Ling, Using AUC and accuracy in evaluating learning algorithms, IEEE Trans. Knowl. Data Eng. 2005, 17, 299–310. [Google Scholar] [CrossRef]
- M. W. Browne, Cross-validation methods, J. Math. Psychol. 2000, 44, 108–132. [Google Scholar] [CrossRef] [PubMed]
- J. Snoek, H. J. Snoek, H. Larochelle, and R. P. Adams, Practical Bayesian optimization of machine learning algorithms, Adv. Neural Inf. Process. Syst. 2012, 25. [Google Scholar]
- E. Gillet, D. Leroy, R. Thouvarecq, and J. F. Stein, A notational analysis of elite tennis serve and serve-return strategies on slow surface, J. Strength Cond. Res. 2009, 23, 532–539. [Google Scholar]
- W. Gu and T. L. Saaty, Predicting the outcome of a tennis tournament: Based on both data and judgments, J. Syst. Sci. Syst. Eng. 2019, 28, 317–343. [Google Scholar] [CrossRef]
- J. S. Hunter, The Exponentially Weighted Moving Average, J. Qual. Technol. 1986, 18, 203–210. [Google Scholar] [CrossRef]
Figure 1.
Flow of Our Work.
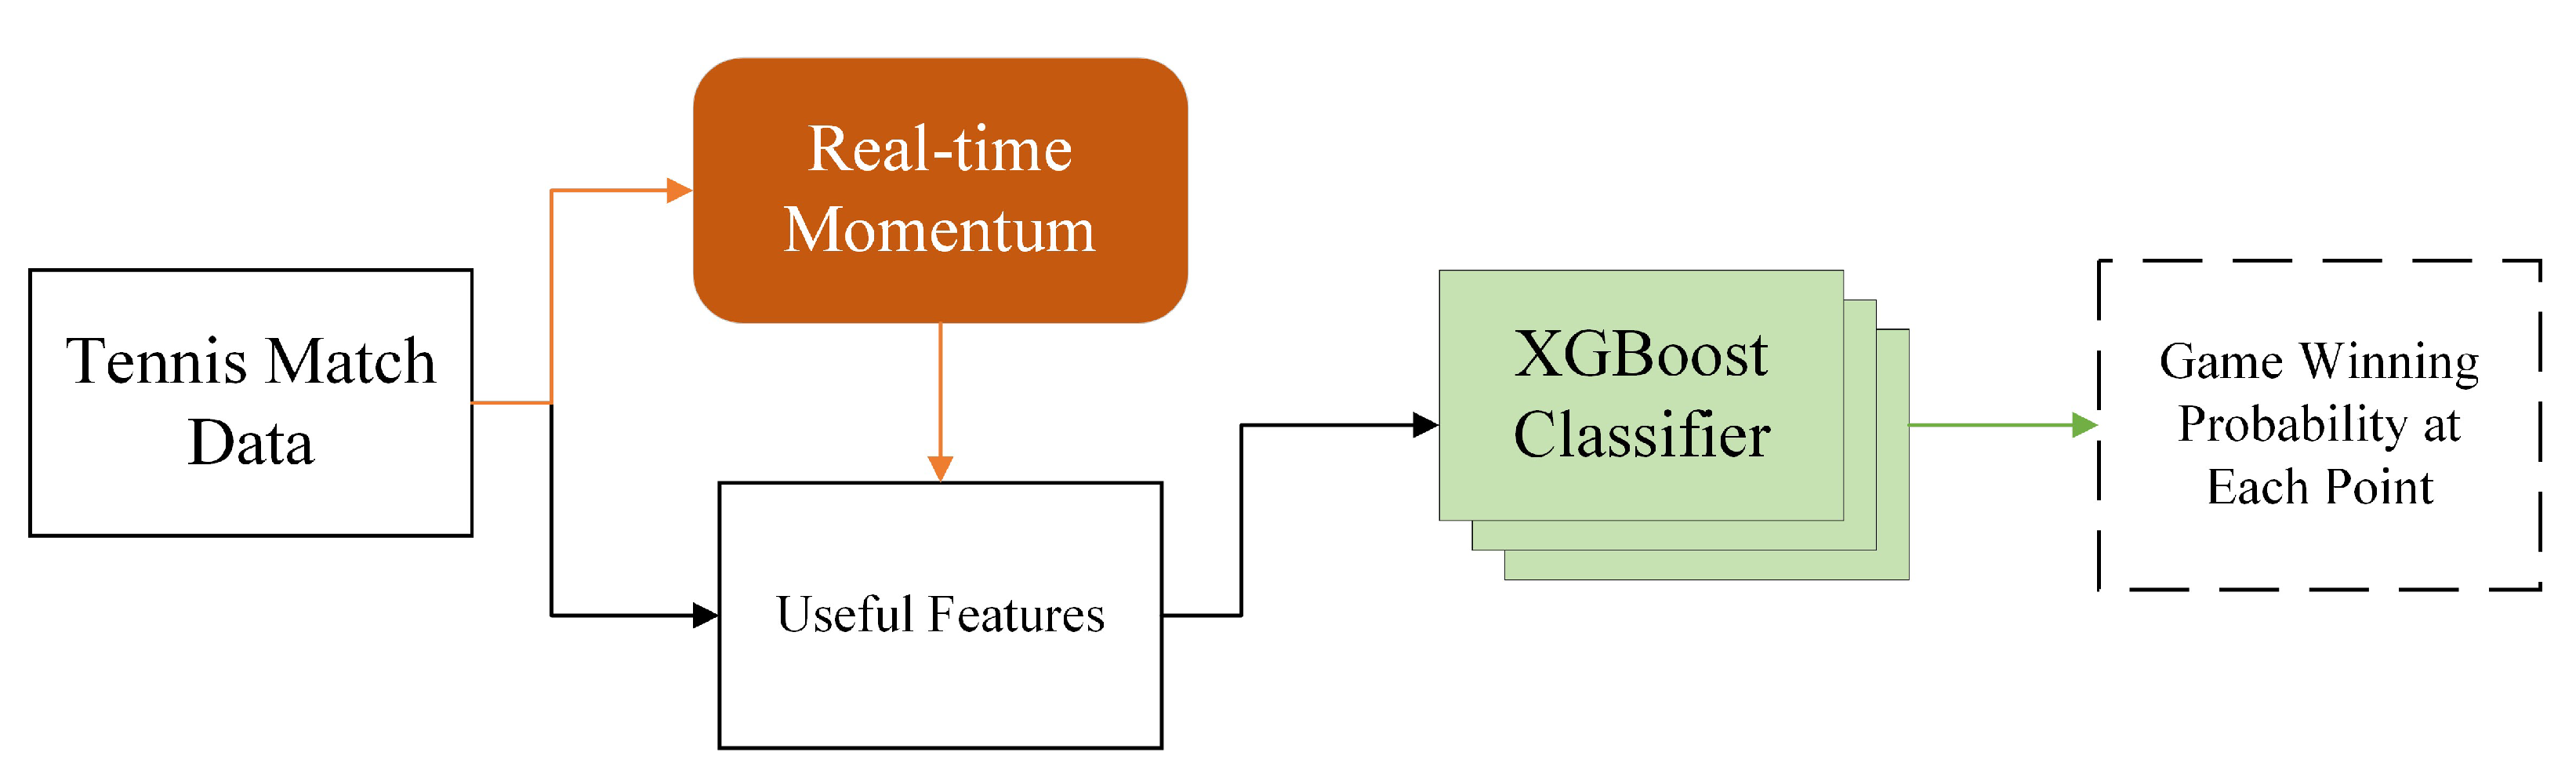
Figure 2.
Real-Time Winning Probability for Two Players.
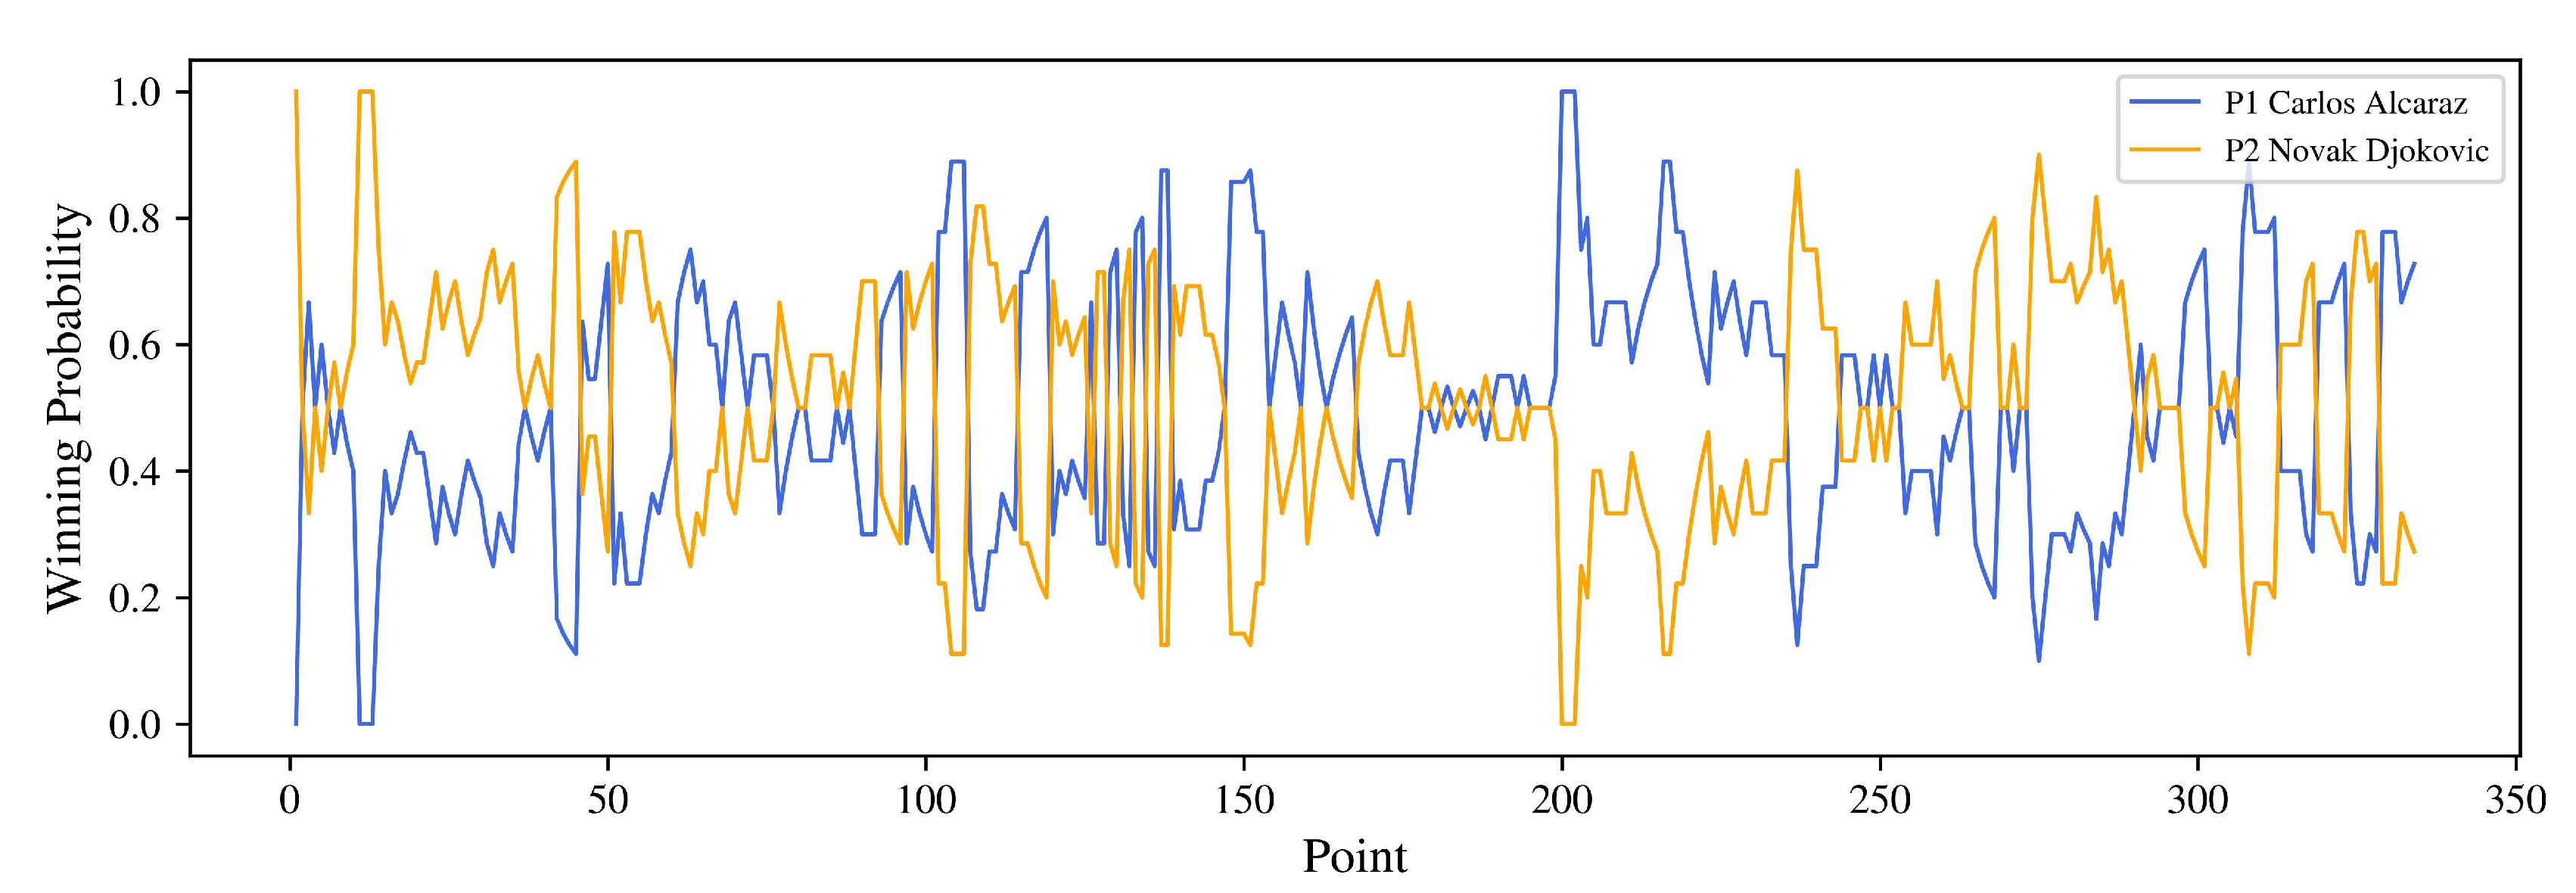
Figure 3.
Leverage Gained for Two Players.
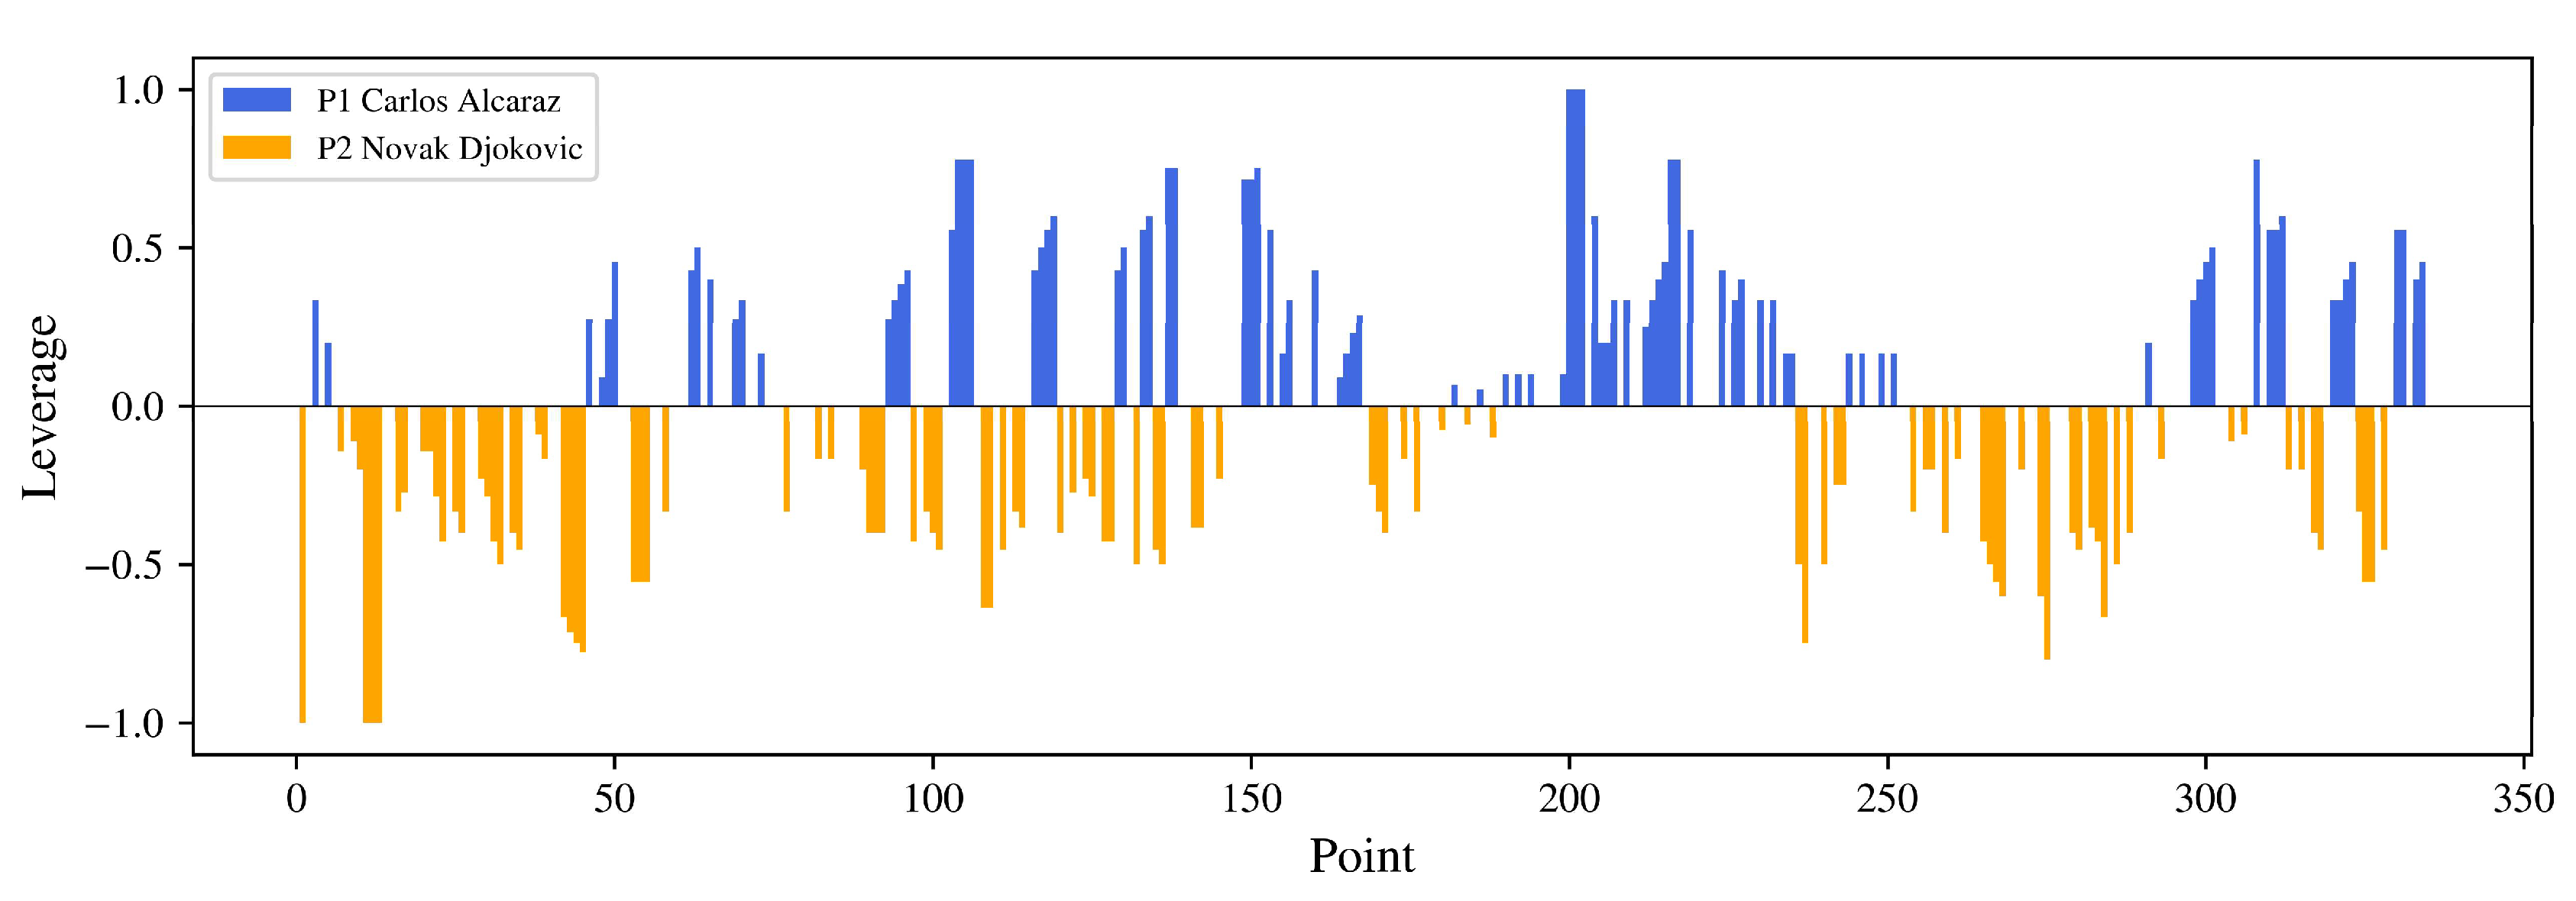
Figure 4.
Dynamic Momentum Graph and Illustrations (Alcaraz 3:2 Djokovic).
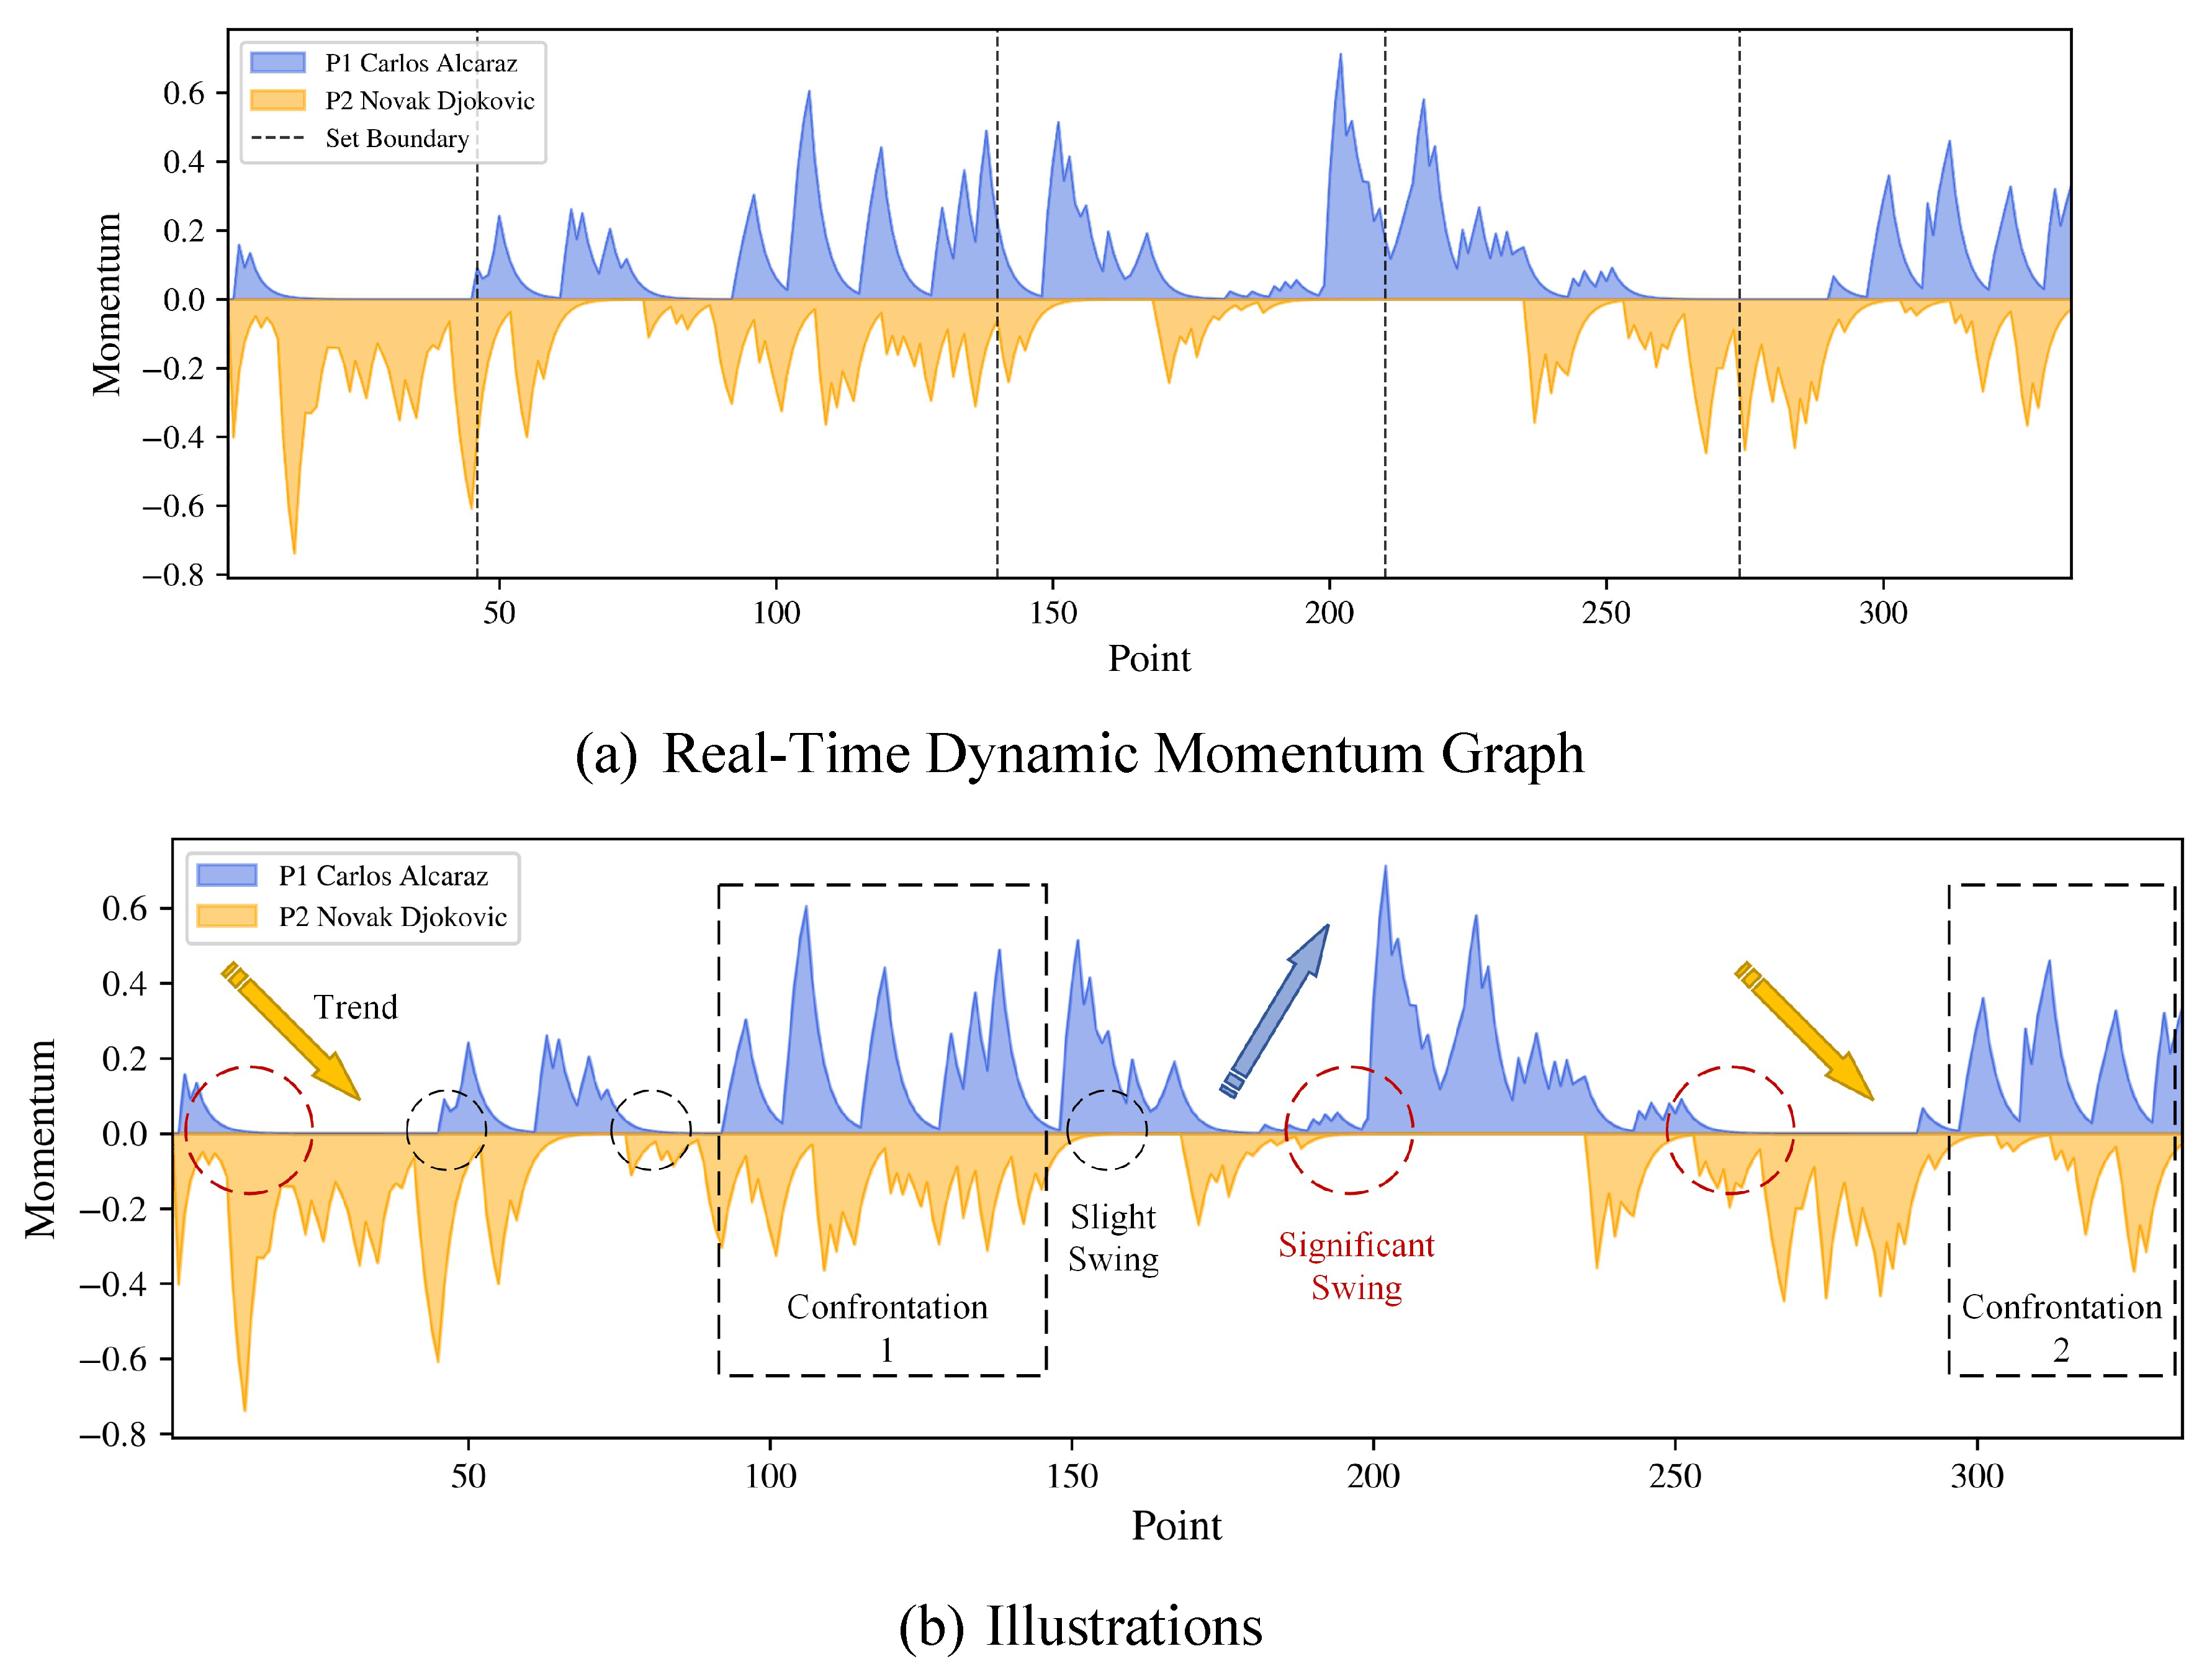
Figure 5.
Interpretation of Dynamic Momentum Graph with Break Points (Alcaraz 3:2 Djokovic).
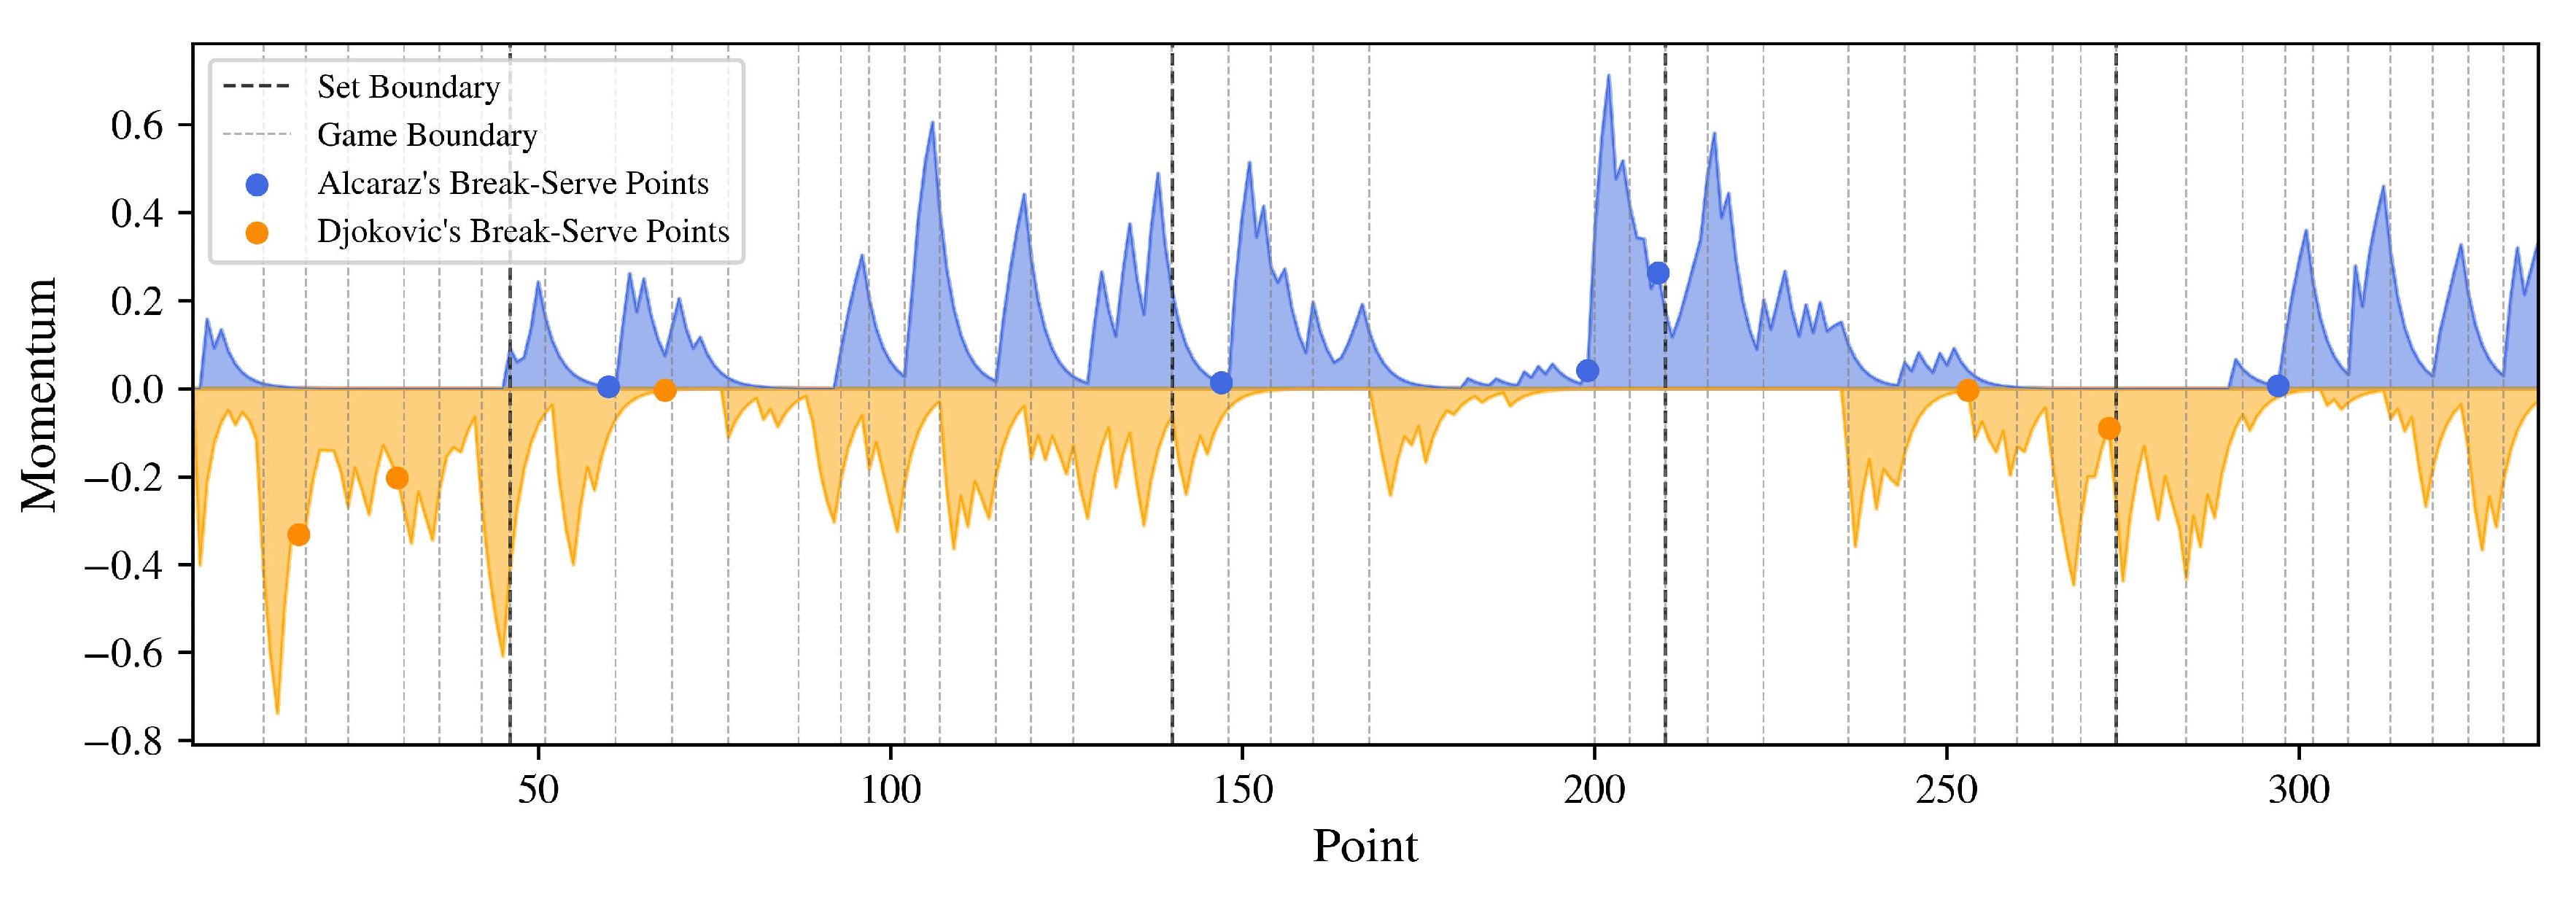
Figure 6.
Training and Testing Set Splitting.
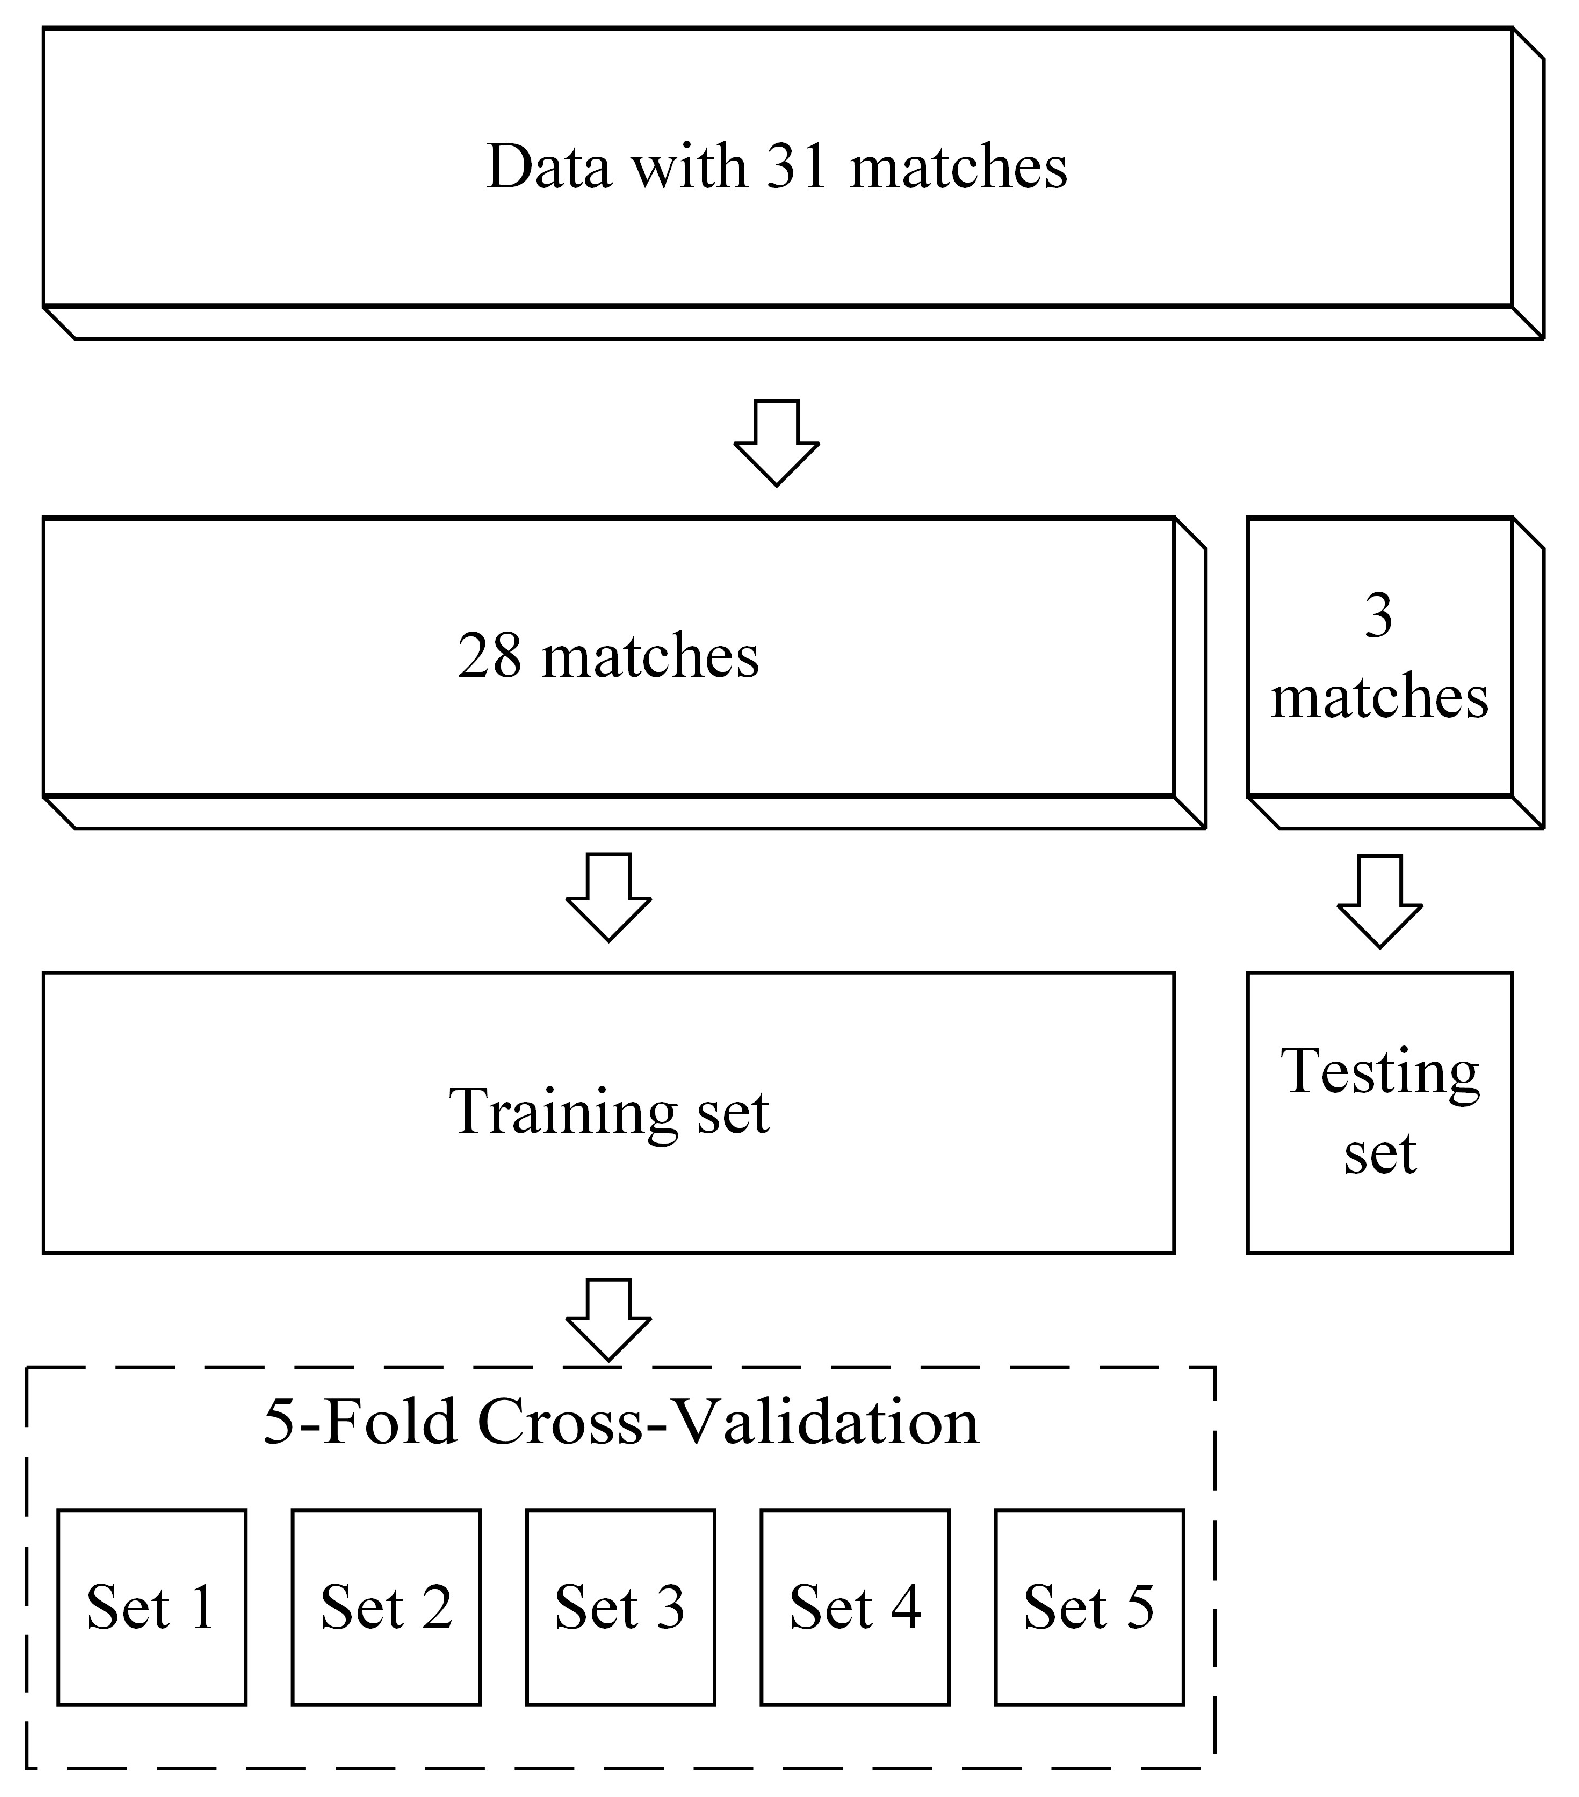
Figure 7.
Feature Engineering Flow.
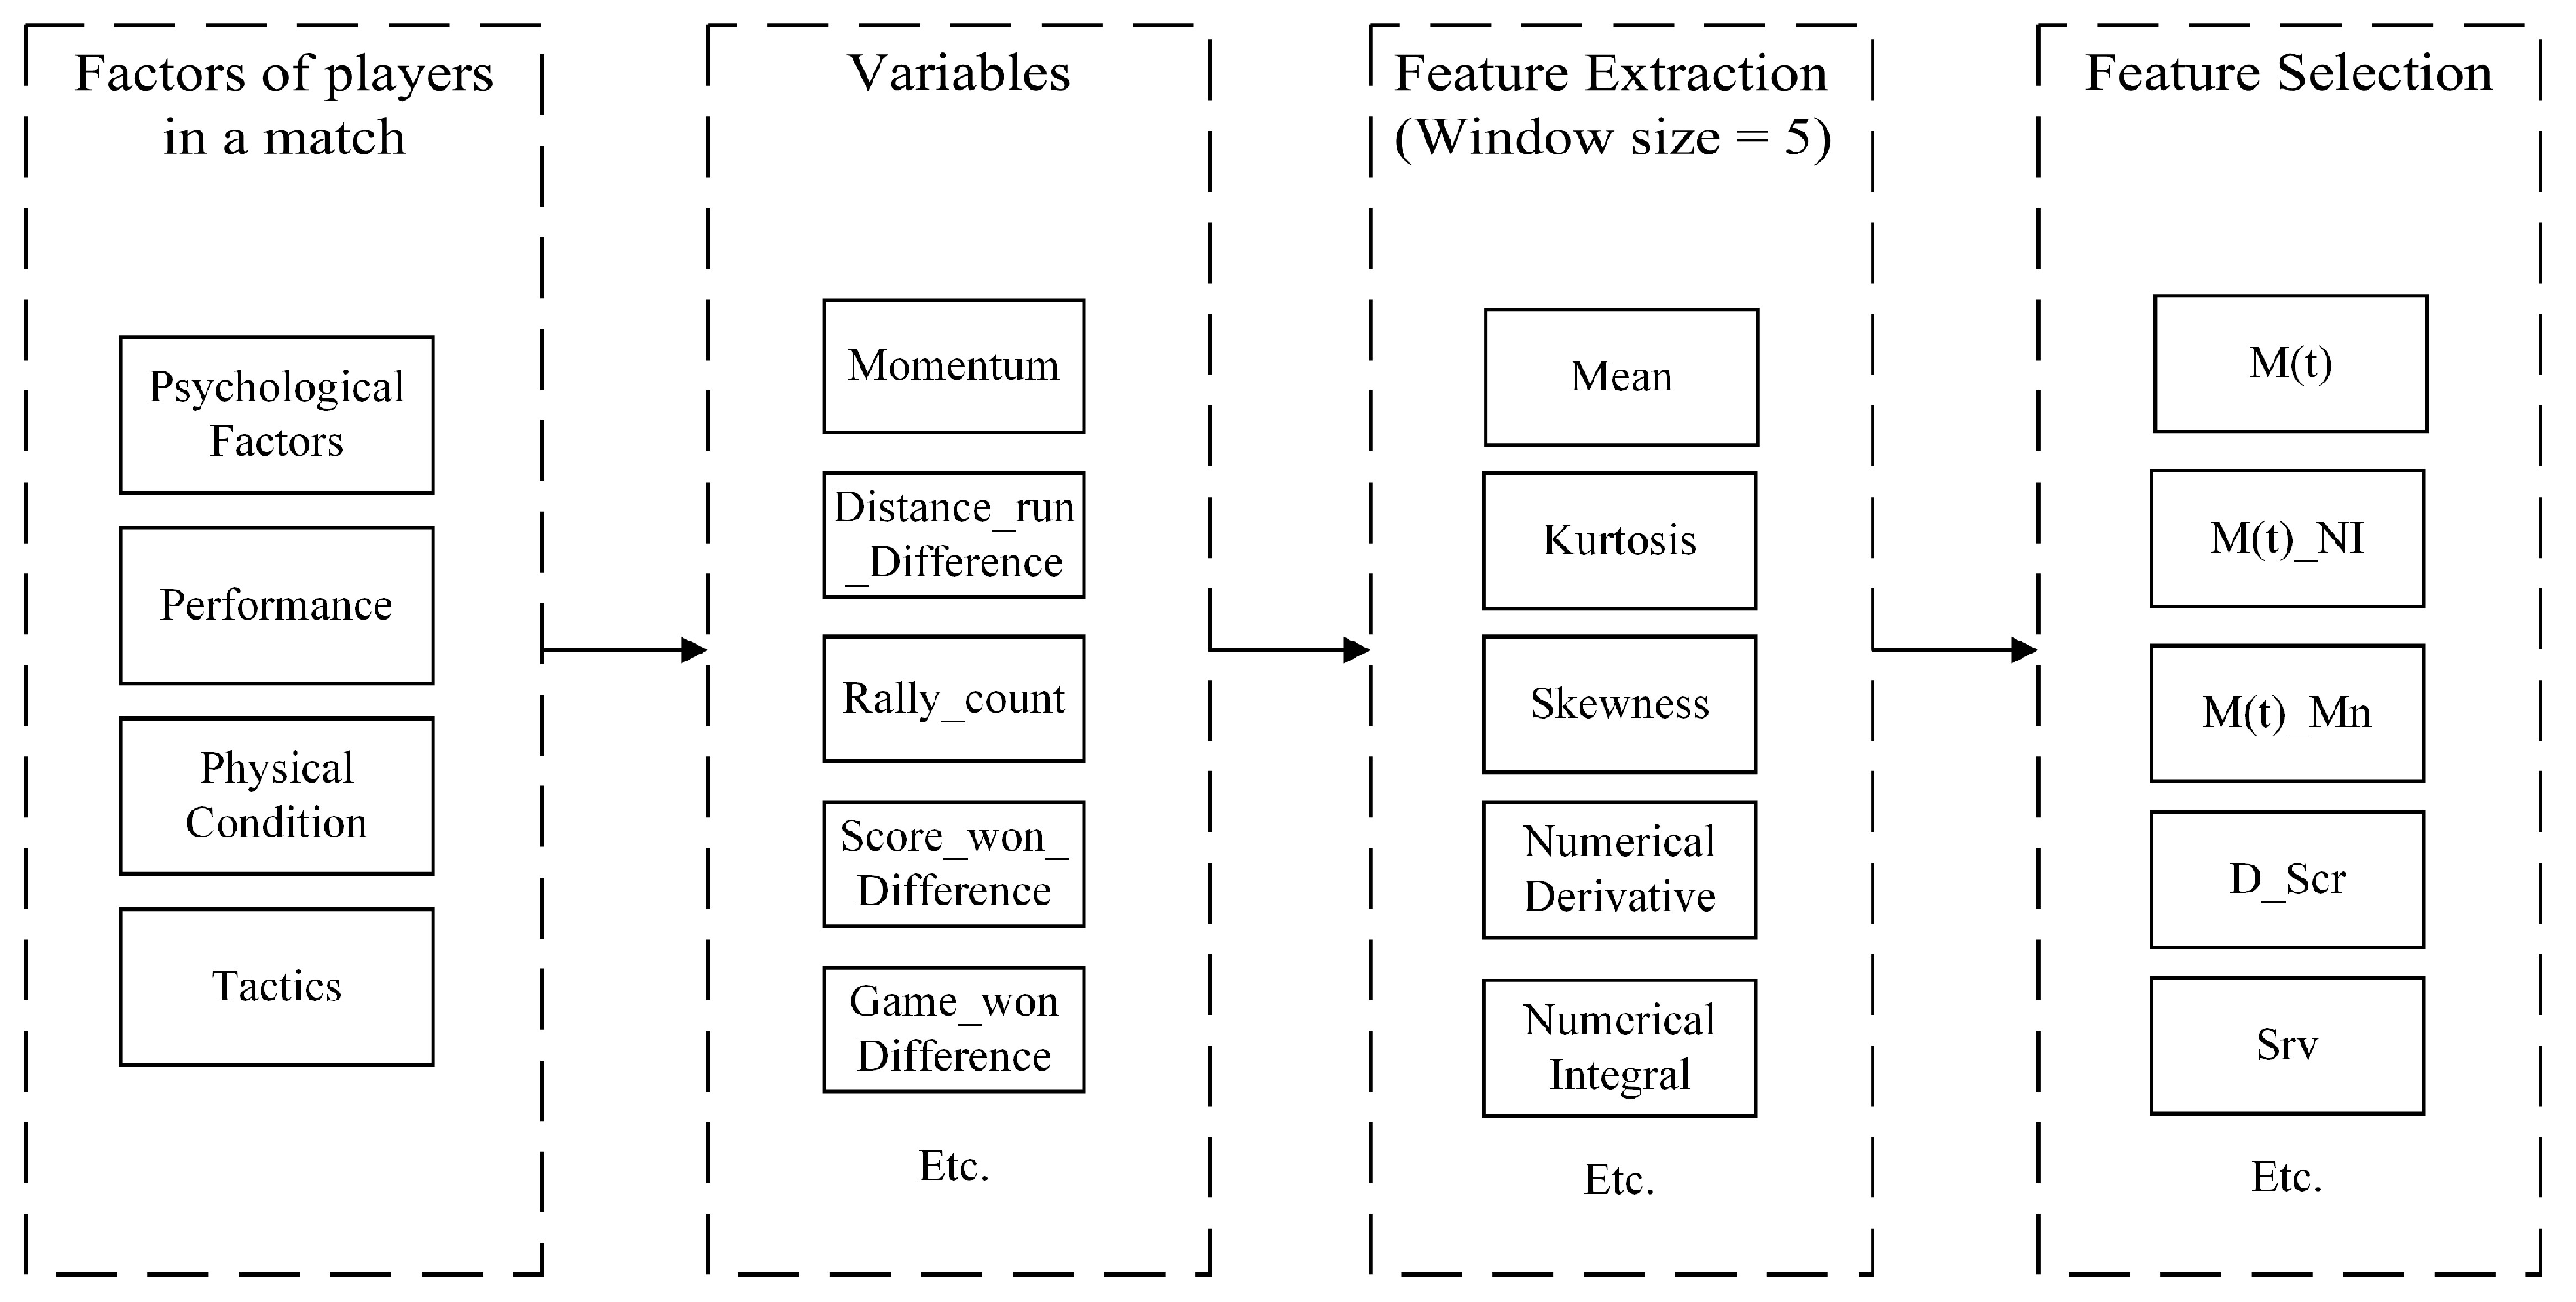
Figure 8.
Confusion Matrix and ROC Curve in the Validation set.
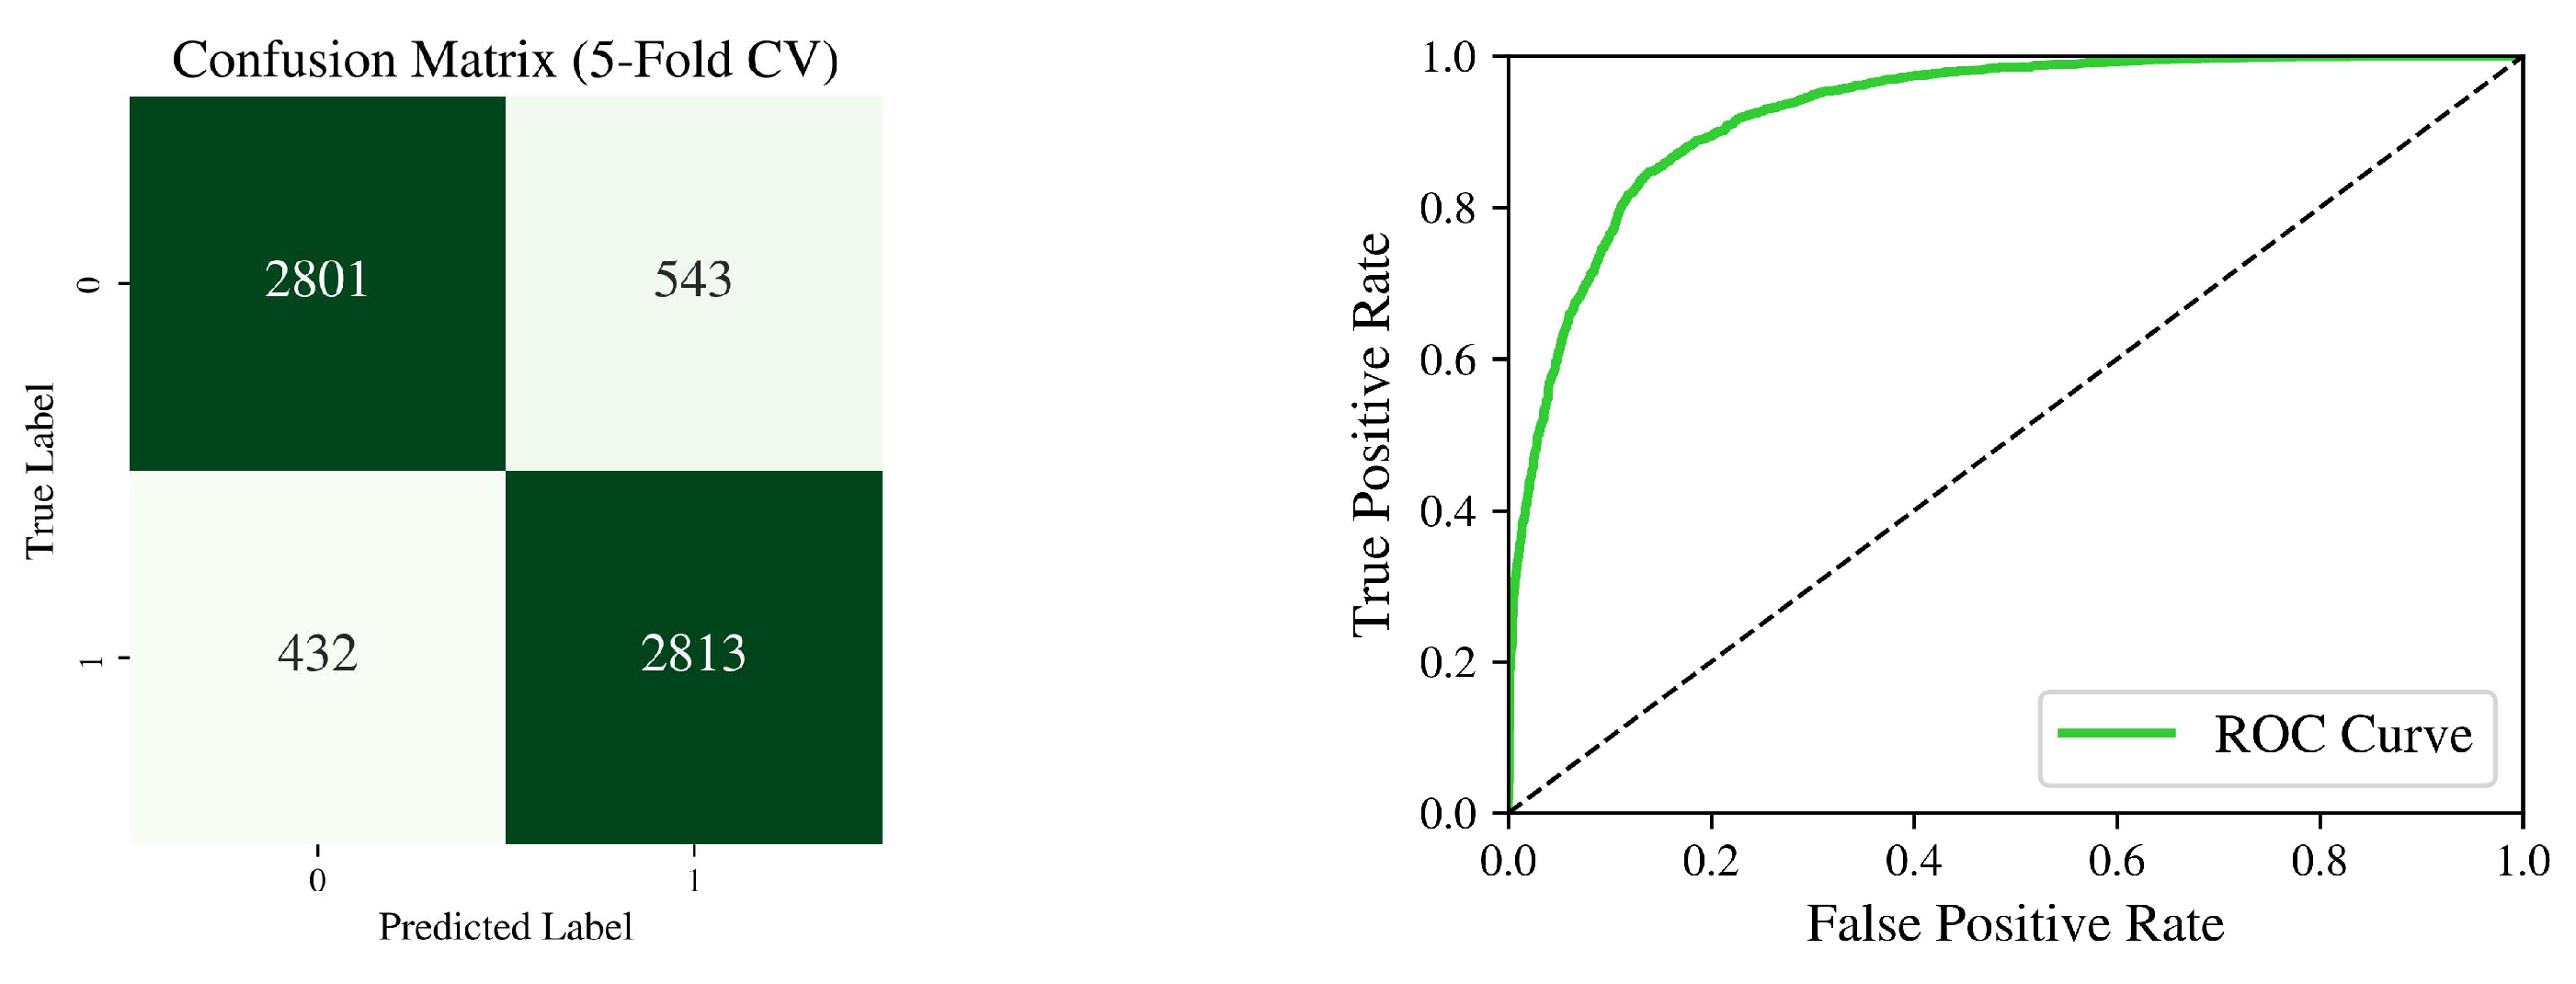
Figure 9.
SHAP Value Bar Chart.
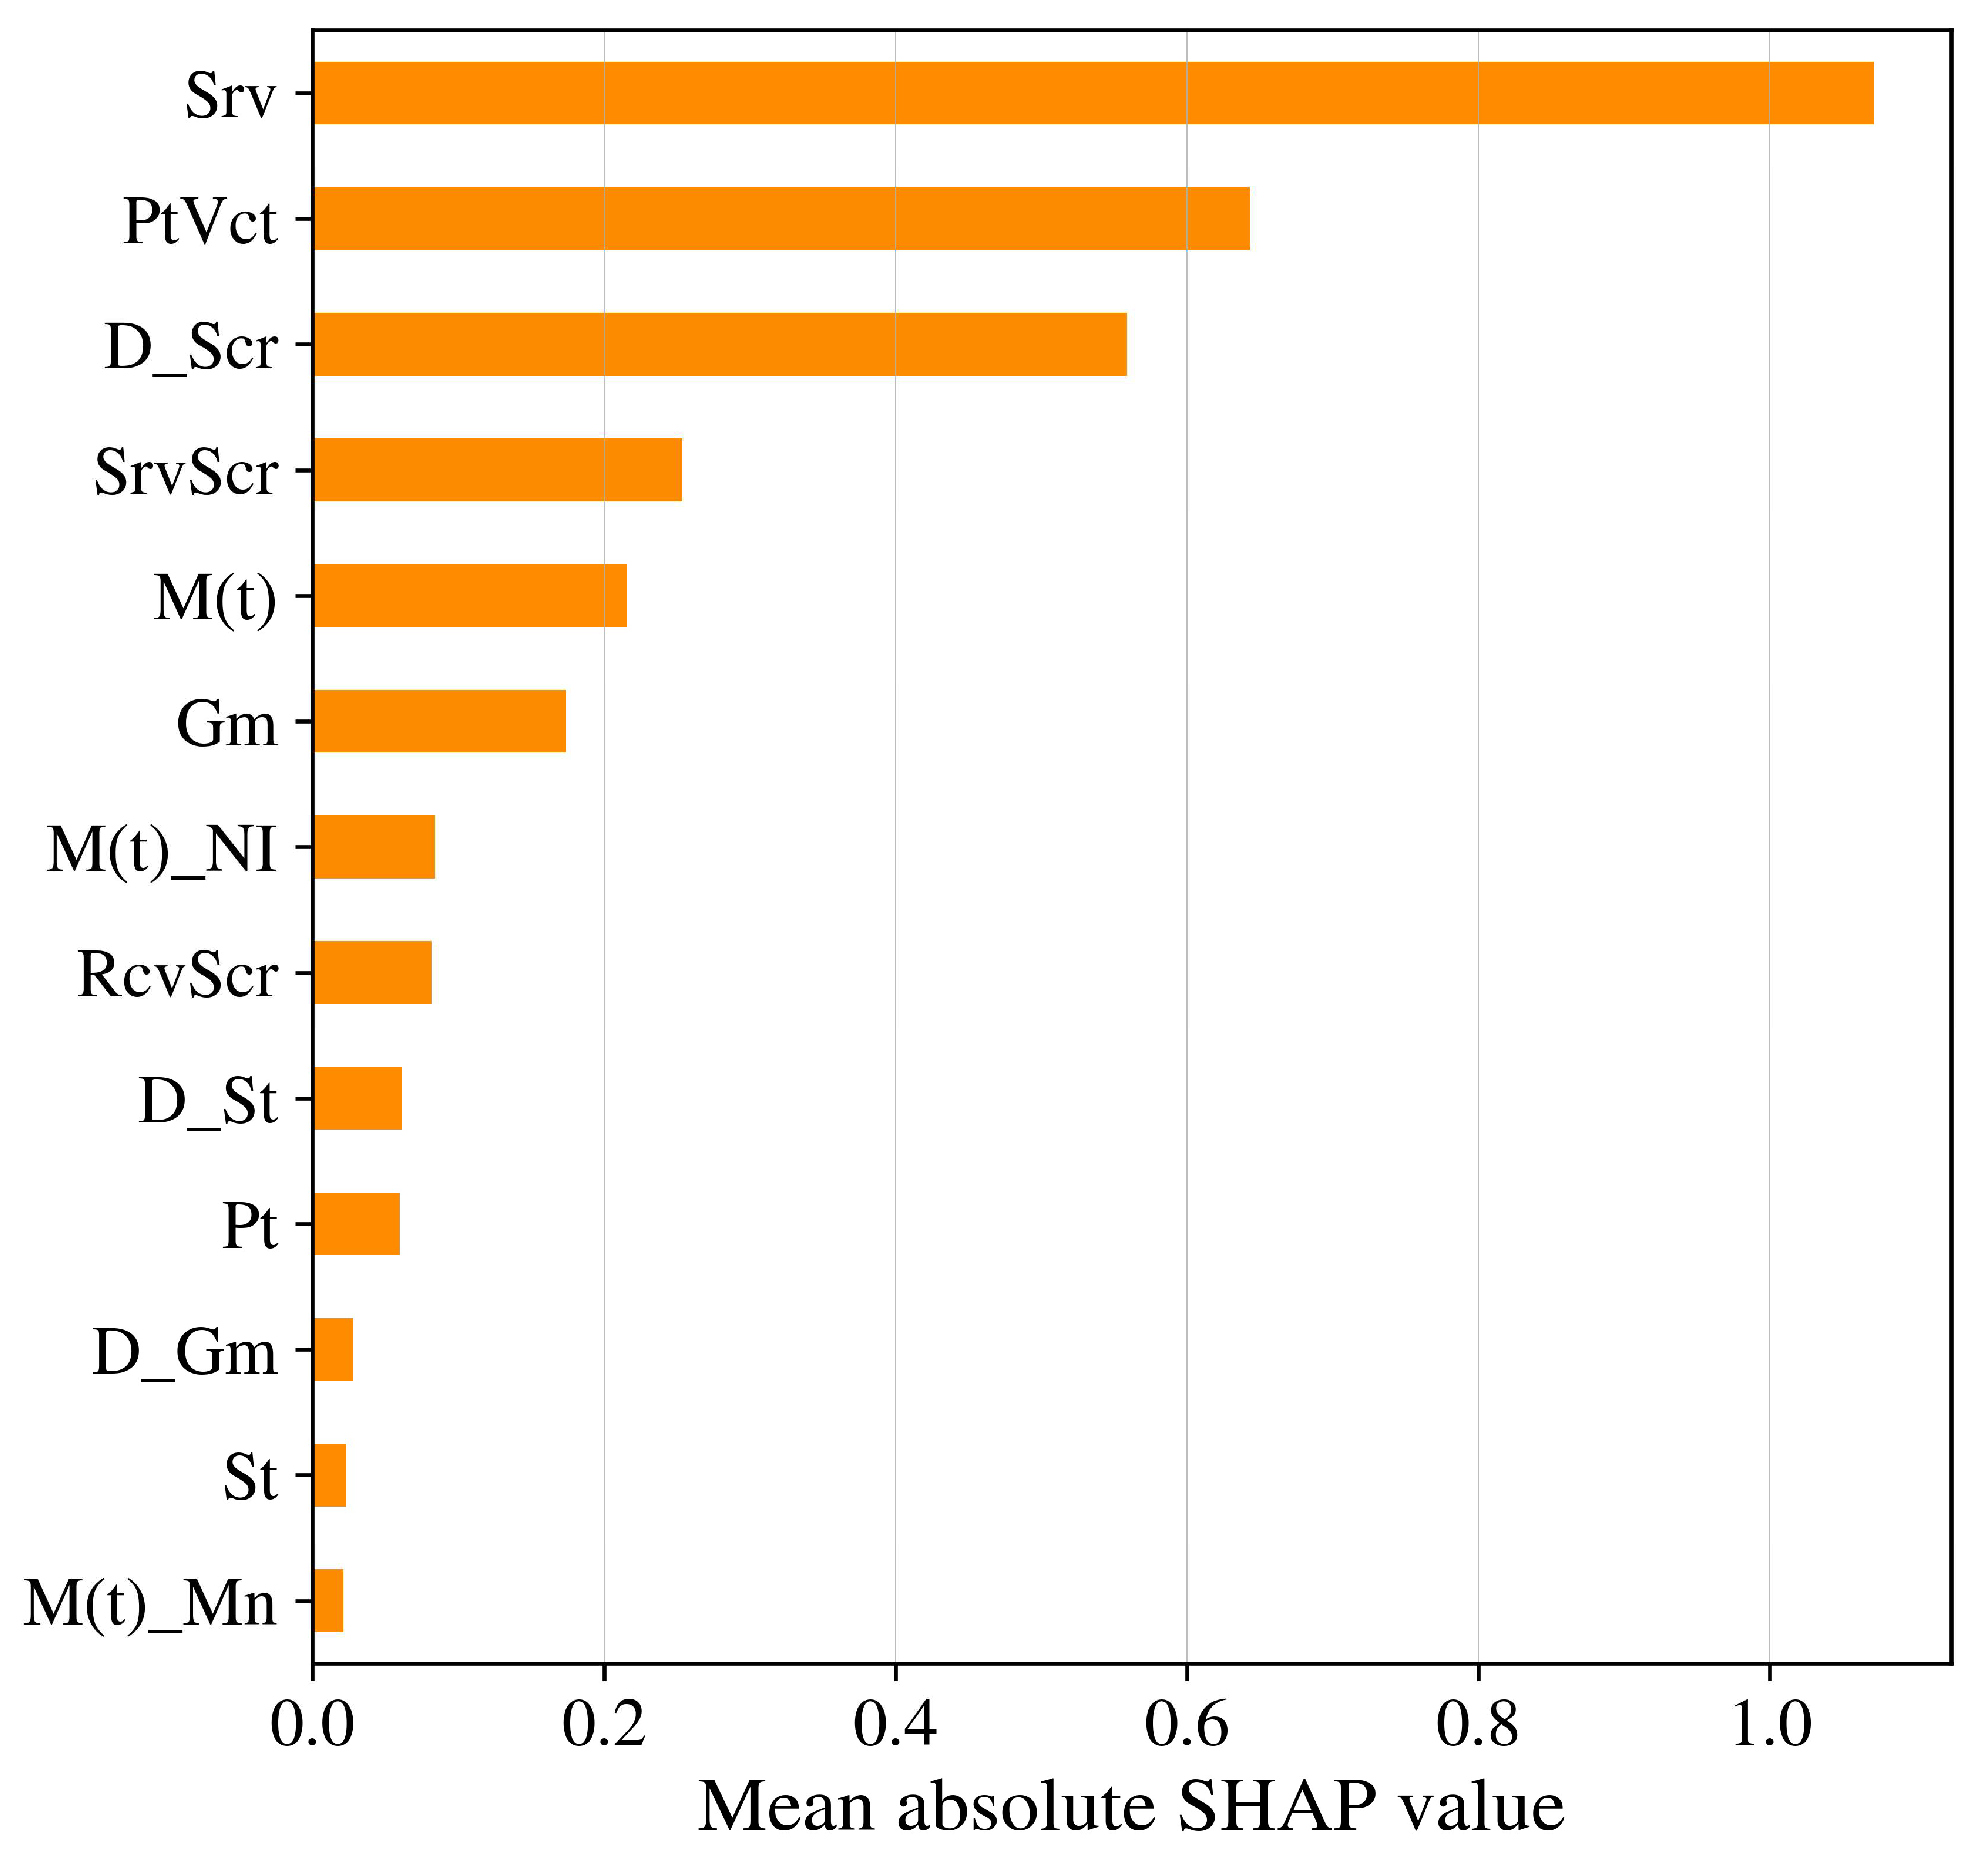
Figure 10.
Confusion Matrix and ROC Curve in Testing Set.
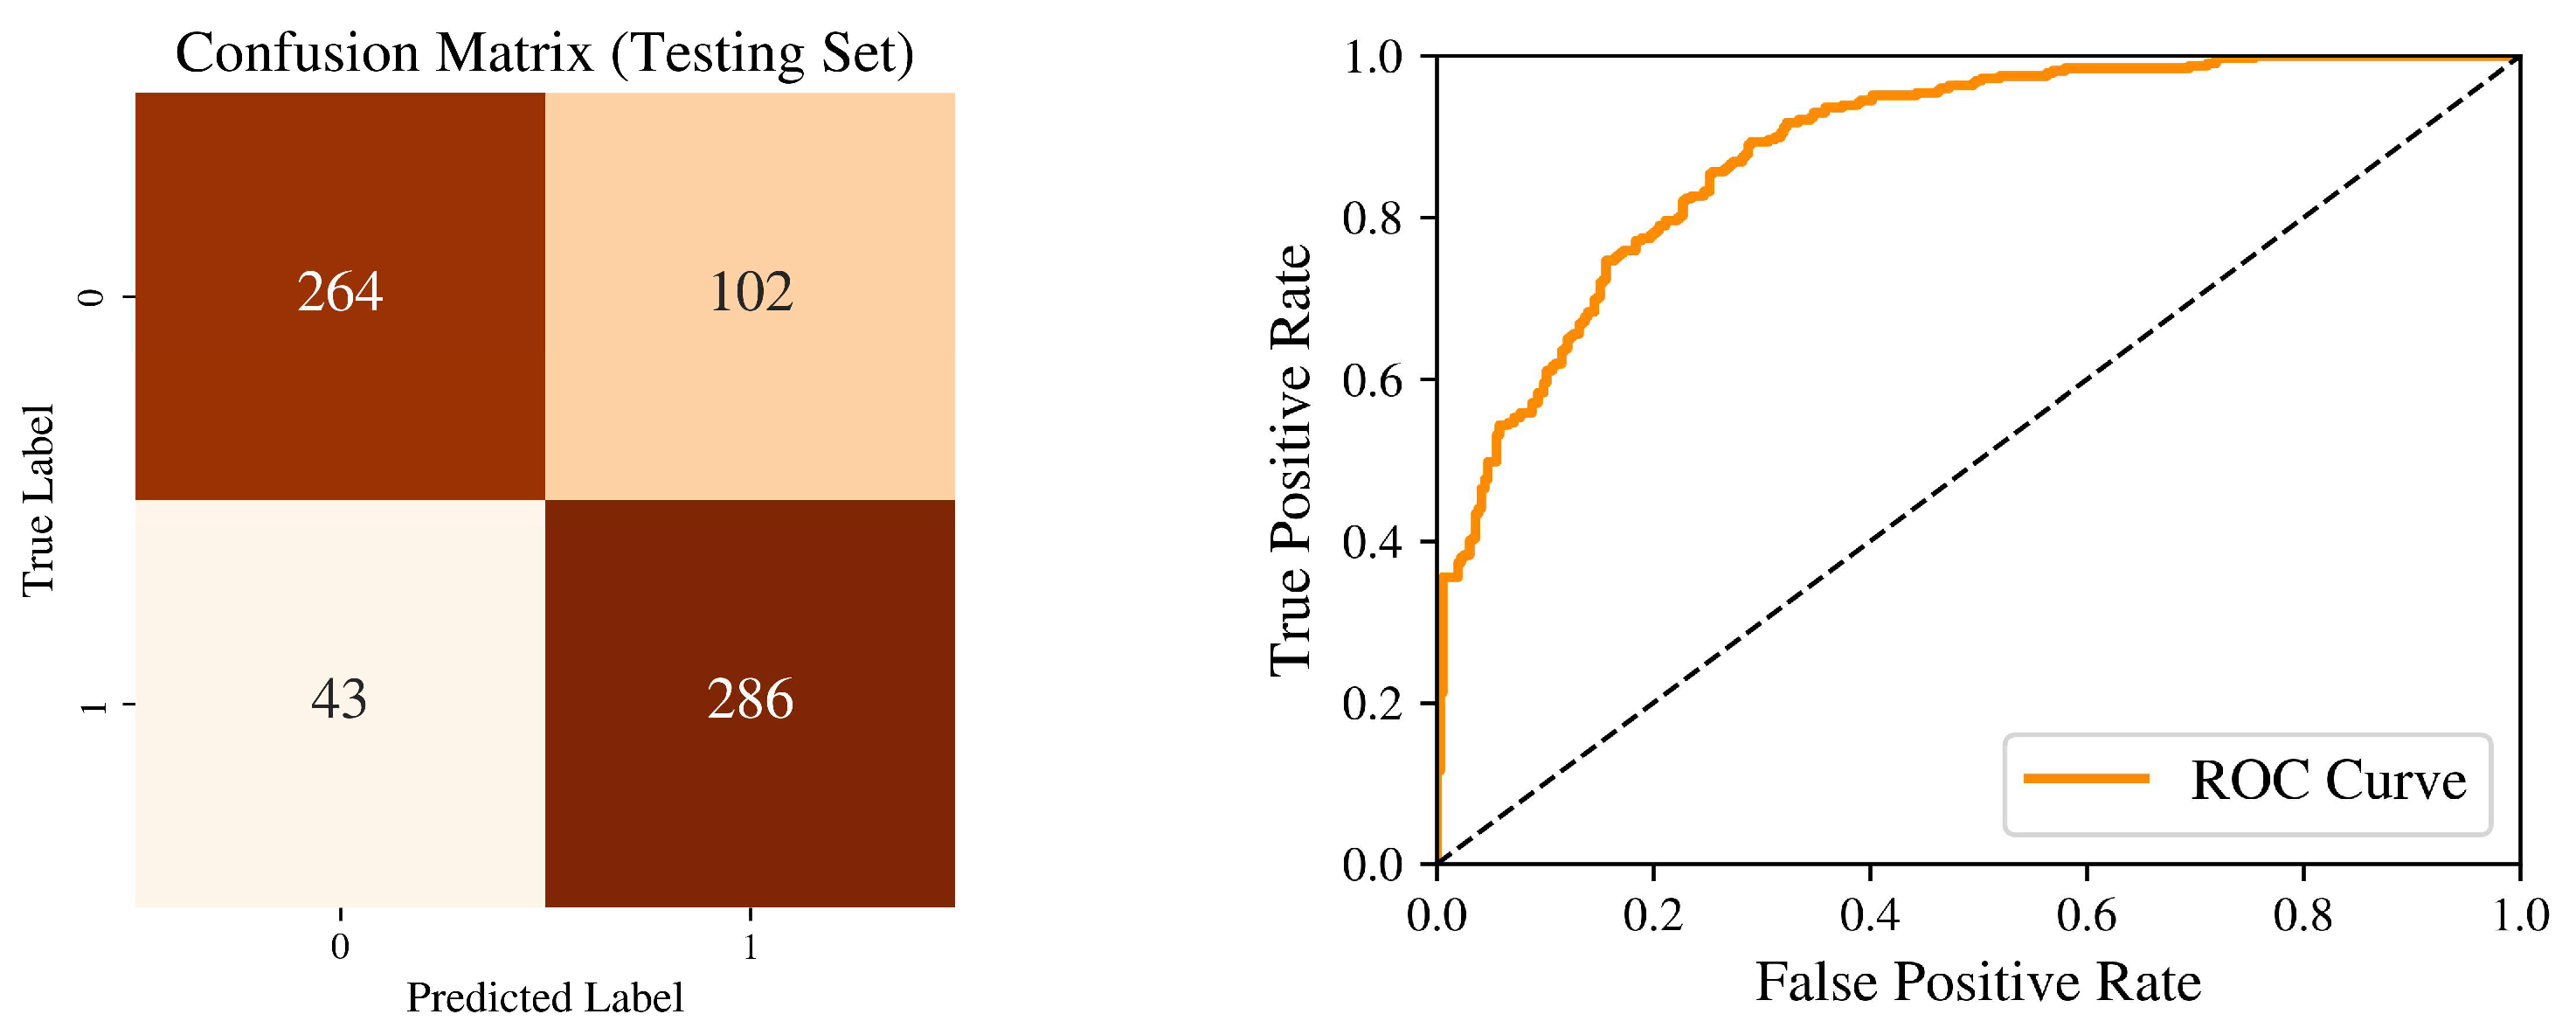
Figure 11.
Predicted probability of XGBoost classification model in Testing set.
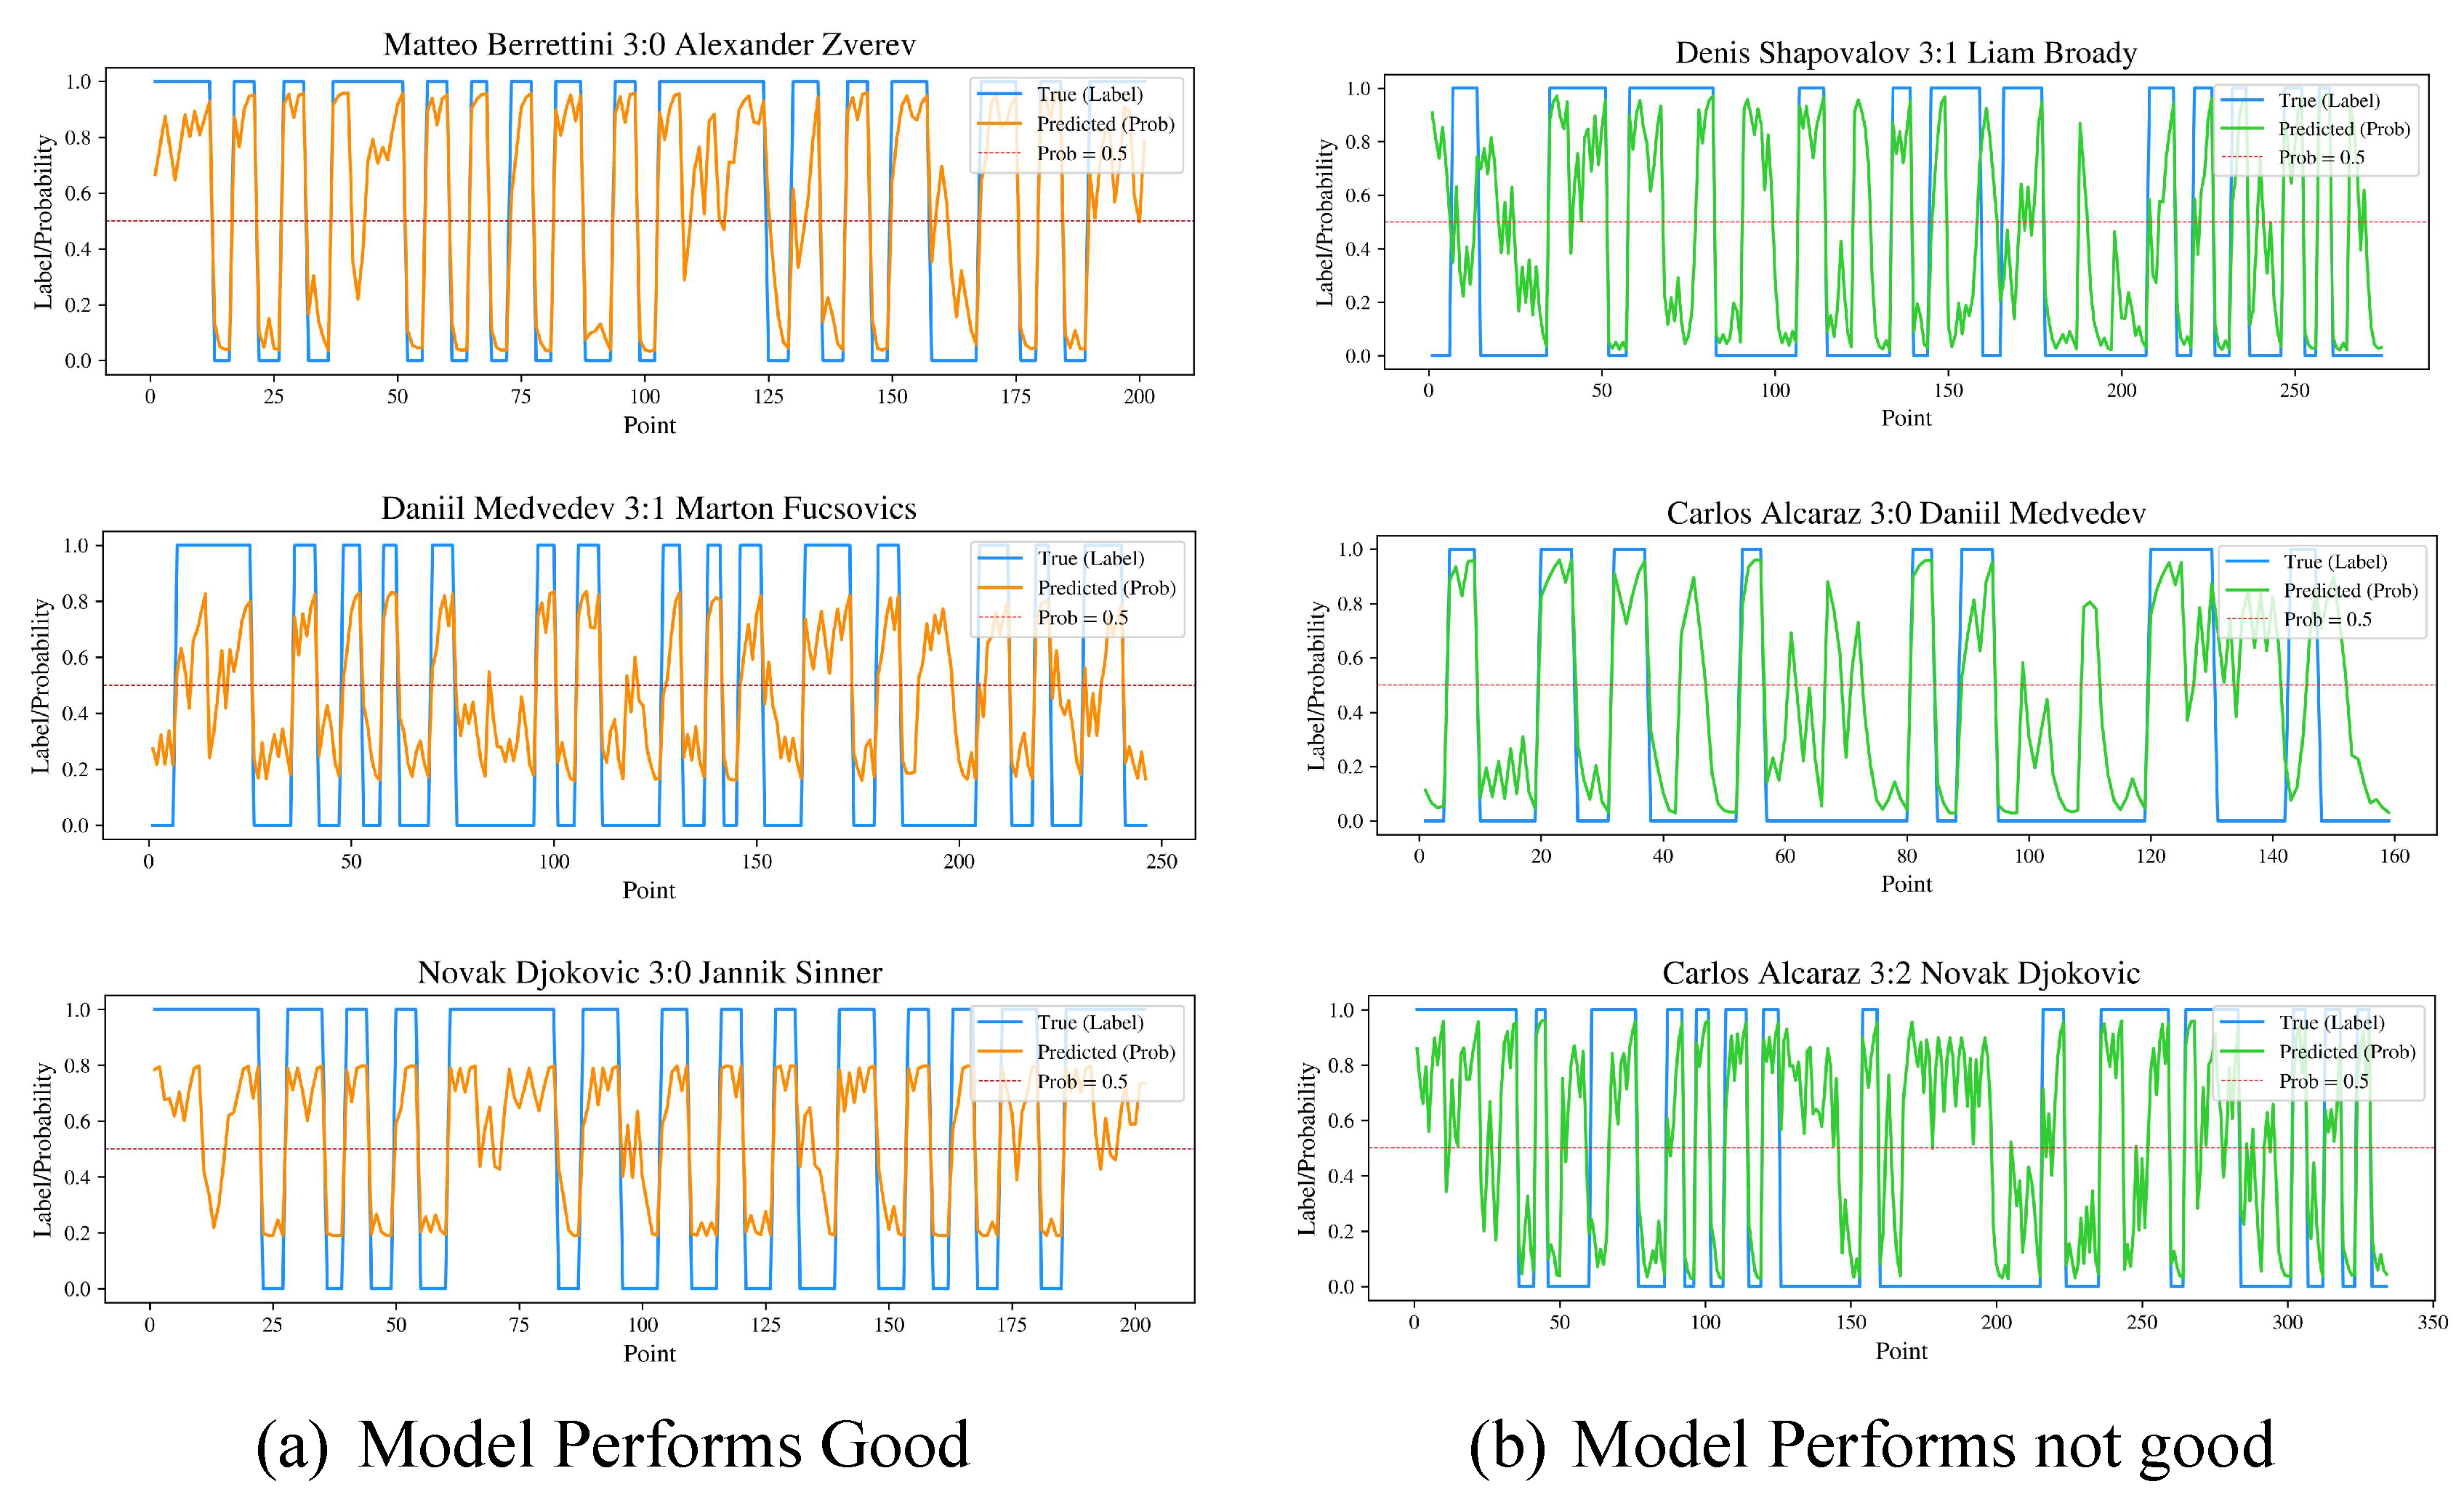
Figure 12.
Average Metrics Bar Chart.
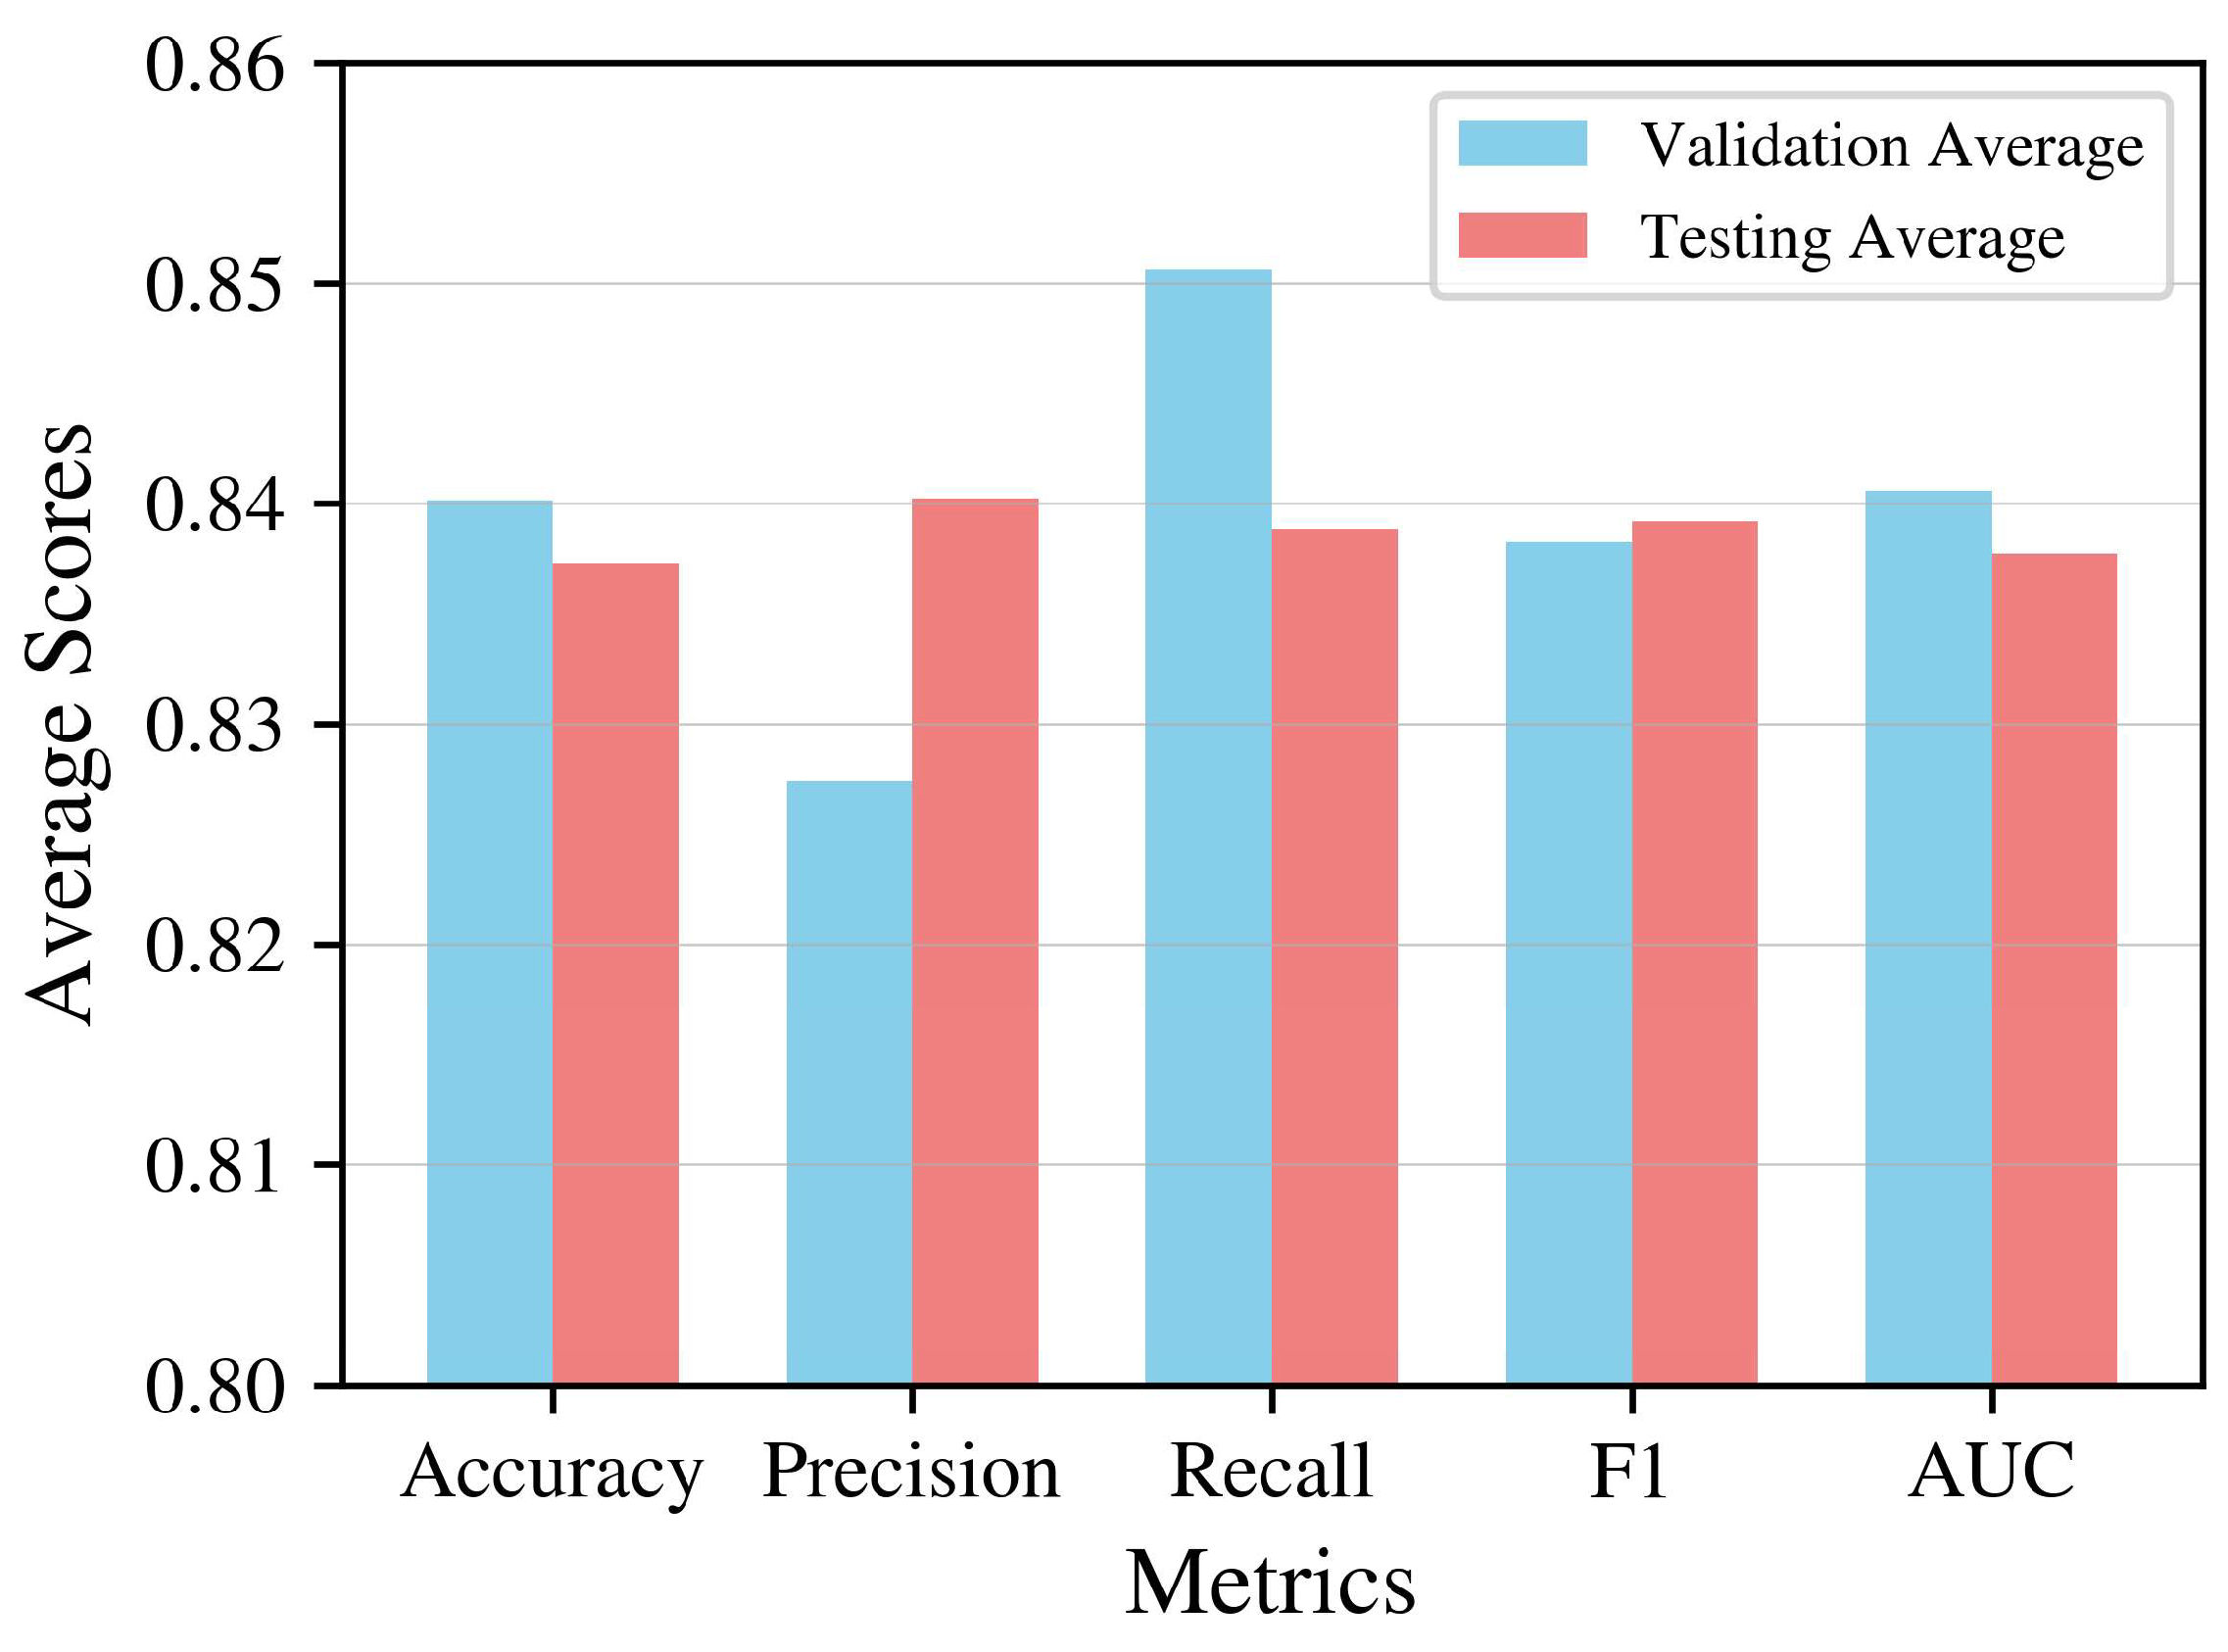

Table 1.
Main Variables Description.
| Variable | Symbol | Description |
|---|---|---|
| sets | St | Number of Sets won by Player 1/2 |
| games | Gm | Number of Games won by Player 1/2 |
| score | Scr | Scores of Player 1/2 |
| serve | Srv | Serve by Player 1/2 |
| points | Pt | Number of Points won by Player 1/2 |
| point_victor | PtVct | Point Victor is Player 1/2 |
| ace | Ace | Ace by Player 1/2 |
| break_pt_won | BPtW | Break points won by Player 1/2 |
| double_fault | DF | Double Fault made by Player 1/2 |
| rally_count | Ra | The number of rallies |
| distance_run | DR | The meters of running distance for Player 1/2 |
Table 2.
5-Fold CV results in Training Set.
| Accuracy | Precision | Recall | F1 | AUC |
| 0.852026 | 0.838200 | 0.866872 | 0.852295 | 0.852246 |
Table 3.
Accuracy in Testing Set.
| Accuracy | Precision | Recall | F1 | AUC |
| 0.791367 | 0.737113 | 0.869301 | 0.797768 | 0.795306 |
Table 4.
Sensitive Analysis in Different Sets.
| Multiple Splitting | Accuracy | Precision | Recall | F1 | AUC | |
| Set 1 | Validation | 0.831157 | 0.819723 | 0.838059 | 0.82879 | 0.831323 |
| Testing | 0.876129 | 0.878109 | 0.882500 | 0.880299 | 0.875917 | |
| Set 2 | Validation | 0.843791 | 0.829513 | 0.858286 | 0.843654 | 0.844046 |
| Testing | 0.812048 | 0.794258 | 0.825871 | 0.809756 | 0.812468 | |
| Set 3 | Validation | 0.840432 | 0.825561 | 0.851446 | 0.838304 | 0.840736 |
| Testing | 0.818008 | 0.848921 | 0.816609 | 0.832451 | 0.818176 | |
| Set 4 | Validation | 0.835654 | 0.827597 | 0.842481 | 0.834972 | 0.835742 |
| Testing | 0.893191 | 0.881020 | 0.891117 | 0.886040 | 0.893059 | |
| Set 5 | Validation | 0.848803 | 0.834629 | 0.860853 | 0.847538 | 0.849081 |
| Testing | 0.788827 | 0.800905 | 0.778022 | 0.789298 | 0.789011 | |
Disclaimer/Publisher’s Note: The statements, opinions and data contained in all publications are solely those of the individual author(s) and contributor(s) and not of MDPI and/or the editor(s). MDPI and/or the editor(s) disclaim responsibility for any injury to people or property resulting from any ideas, methods, instructions or products referred to in the content. |
© 2024 by the authors. Licensee MDPI, Basel, Switzerland. This article is an open access article distributed under the terms and conditions of the Creative Commons Attribution (CC BY) license (http://creativecommons.org/licenses/by/4.0/).
Copyright: This open access article is published under a Creative Commons CC BY 4.0 license, which permit the free download, distribution, and reuse, provided that the author and preprint are cited in any reuse.


