Submitted:
30 October 2024
Posted:
31 October 2024
Read the latest preprint version here
Abstract
Keywords:
Introduction
Methods
Harm Reduction Encompasses the Concepts of Relative Risk and Risk Reversal
Considerations Impacting Precision and Accuracy of Observational Studies
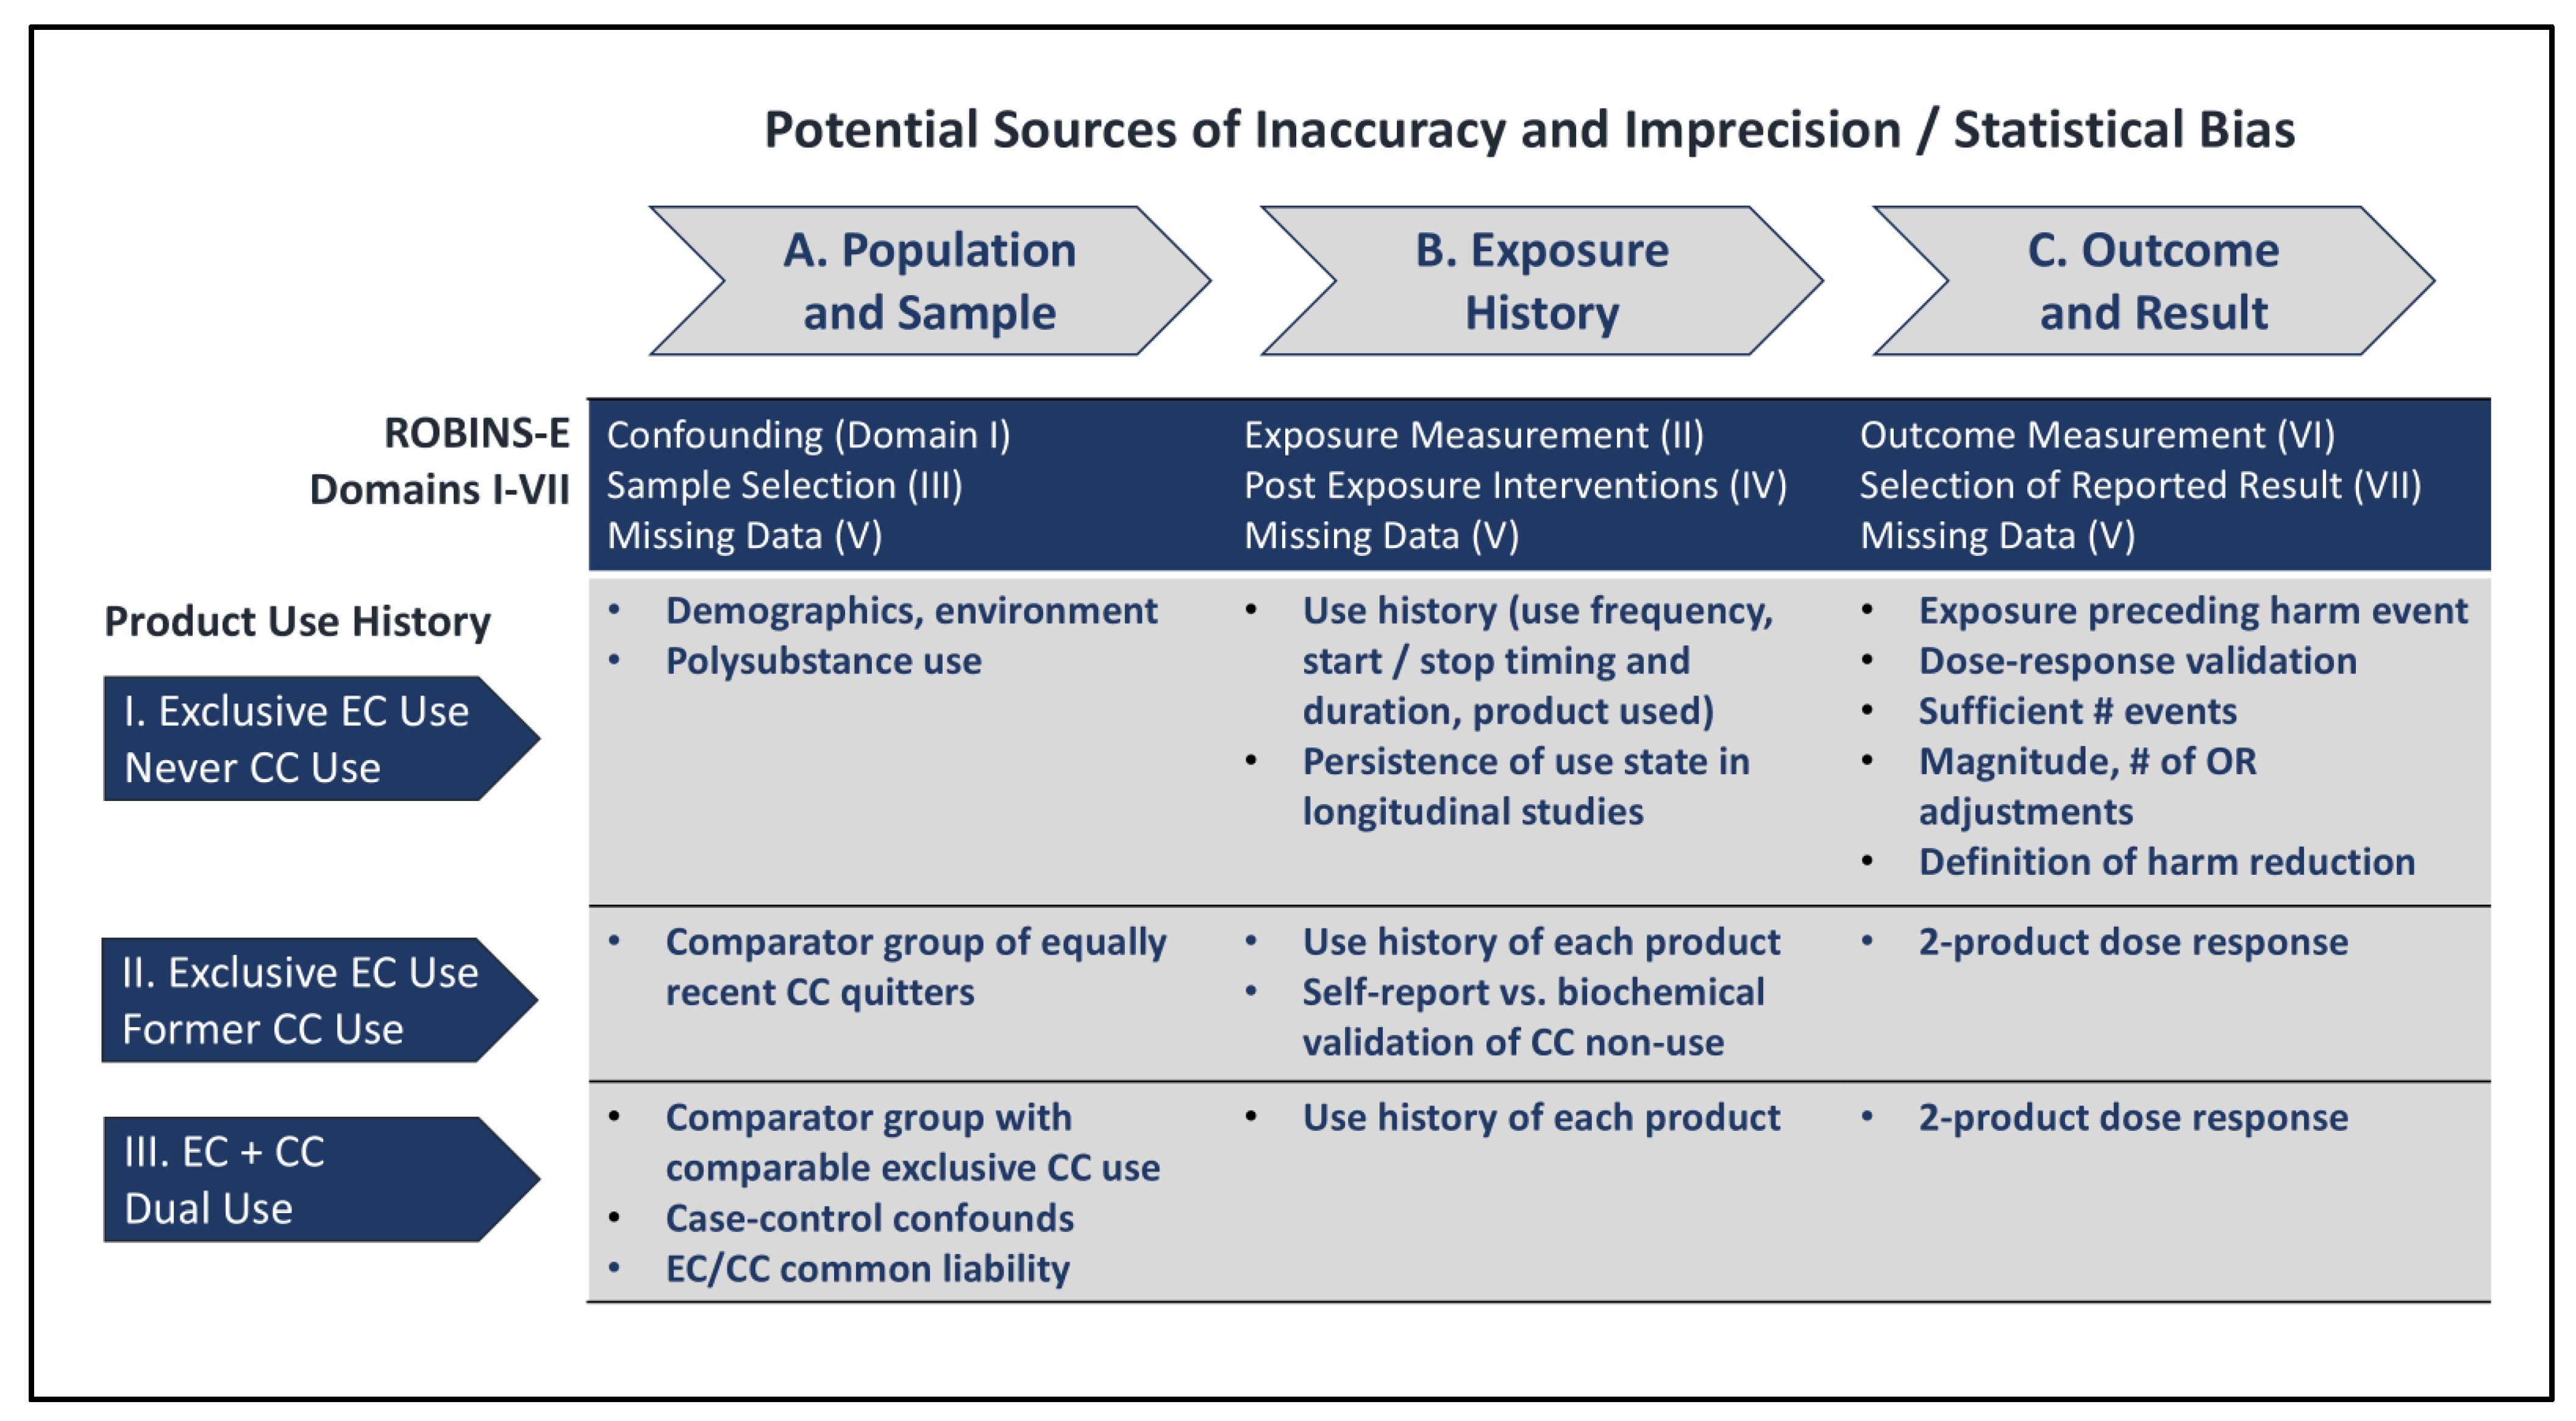
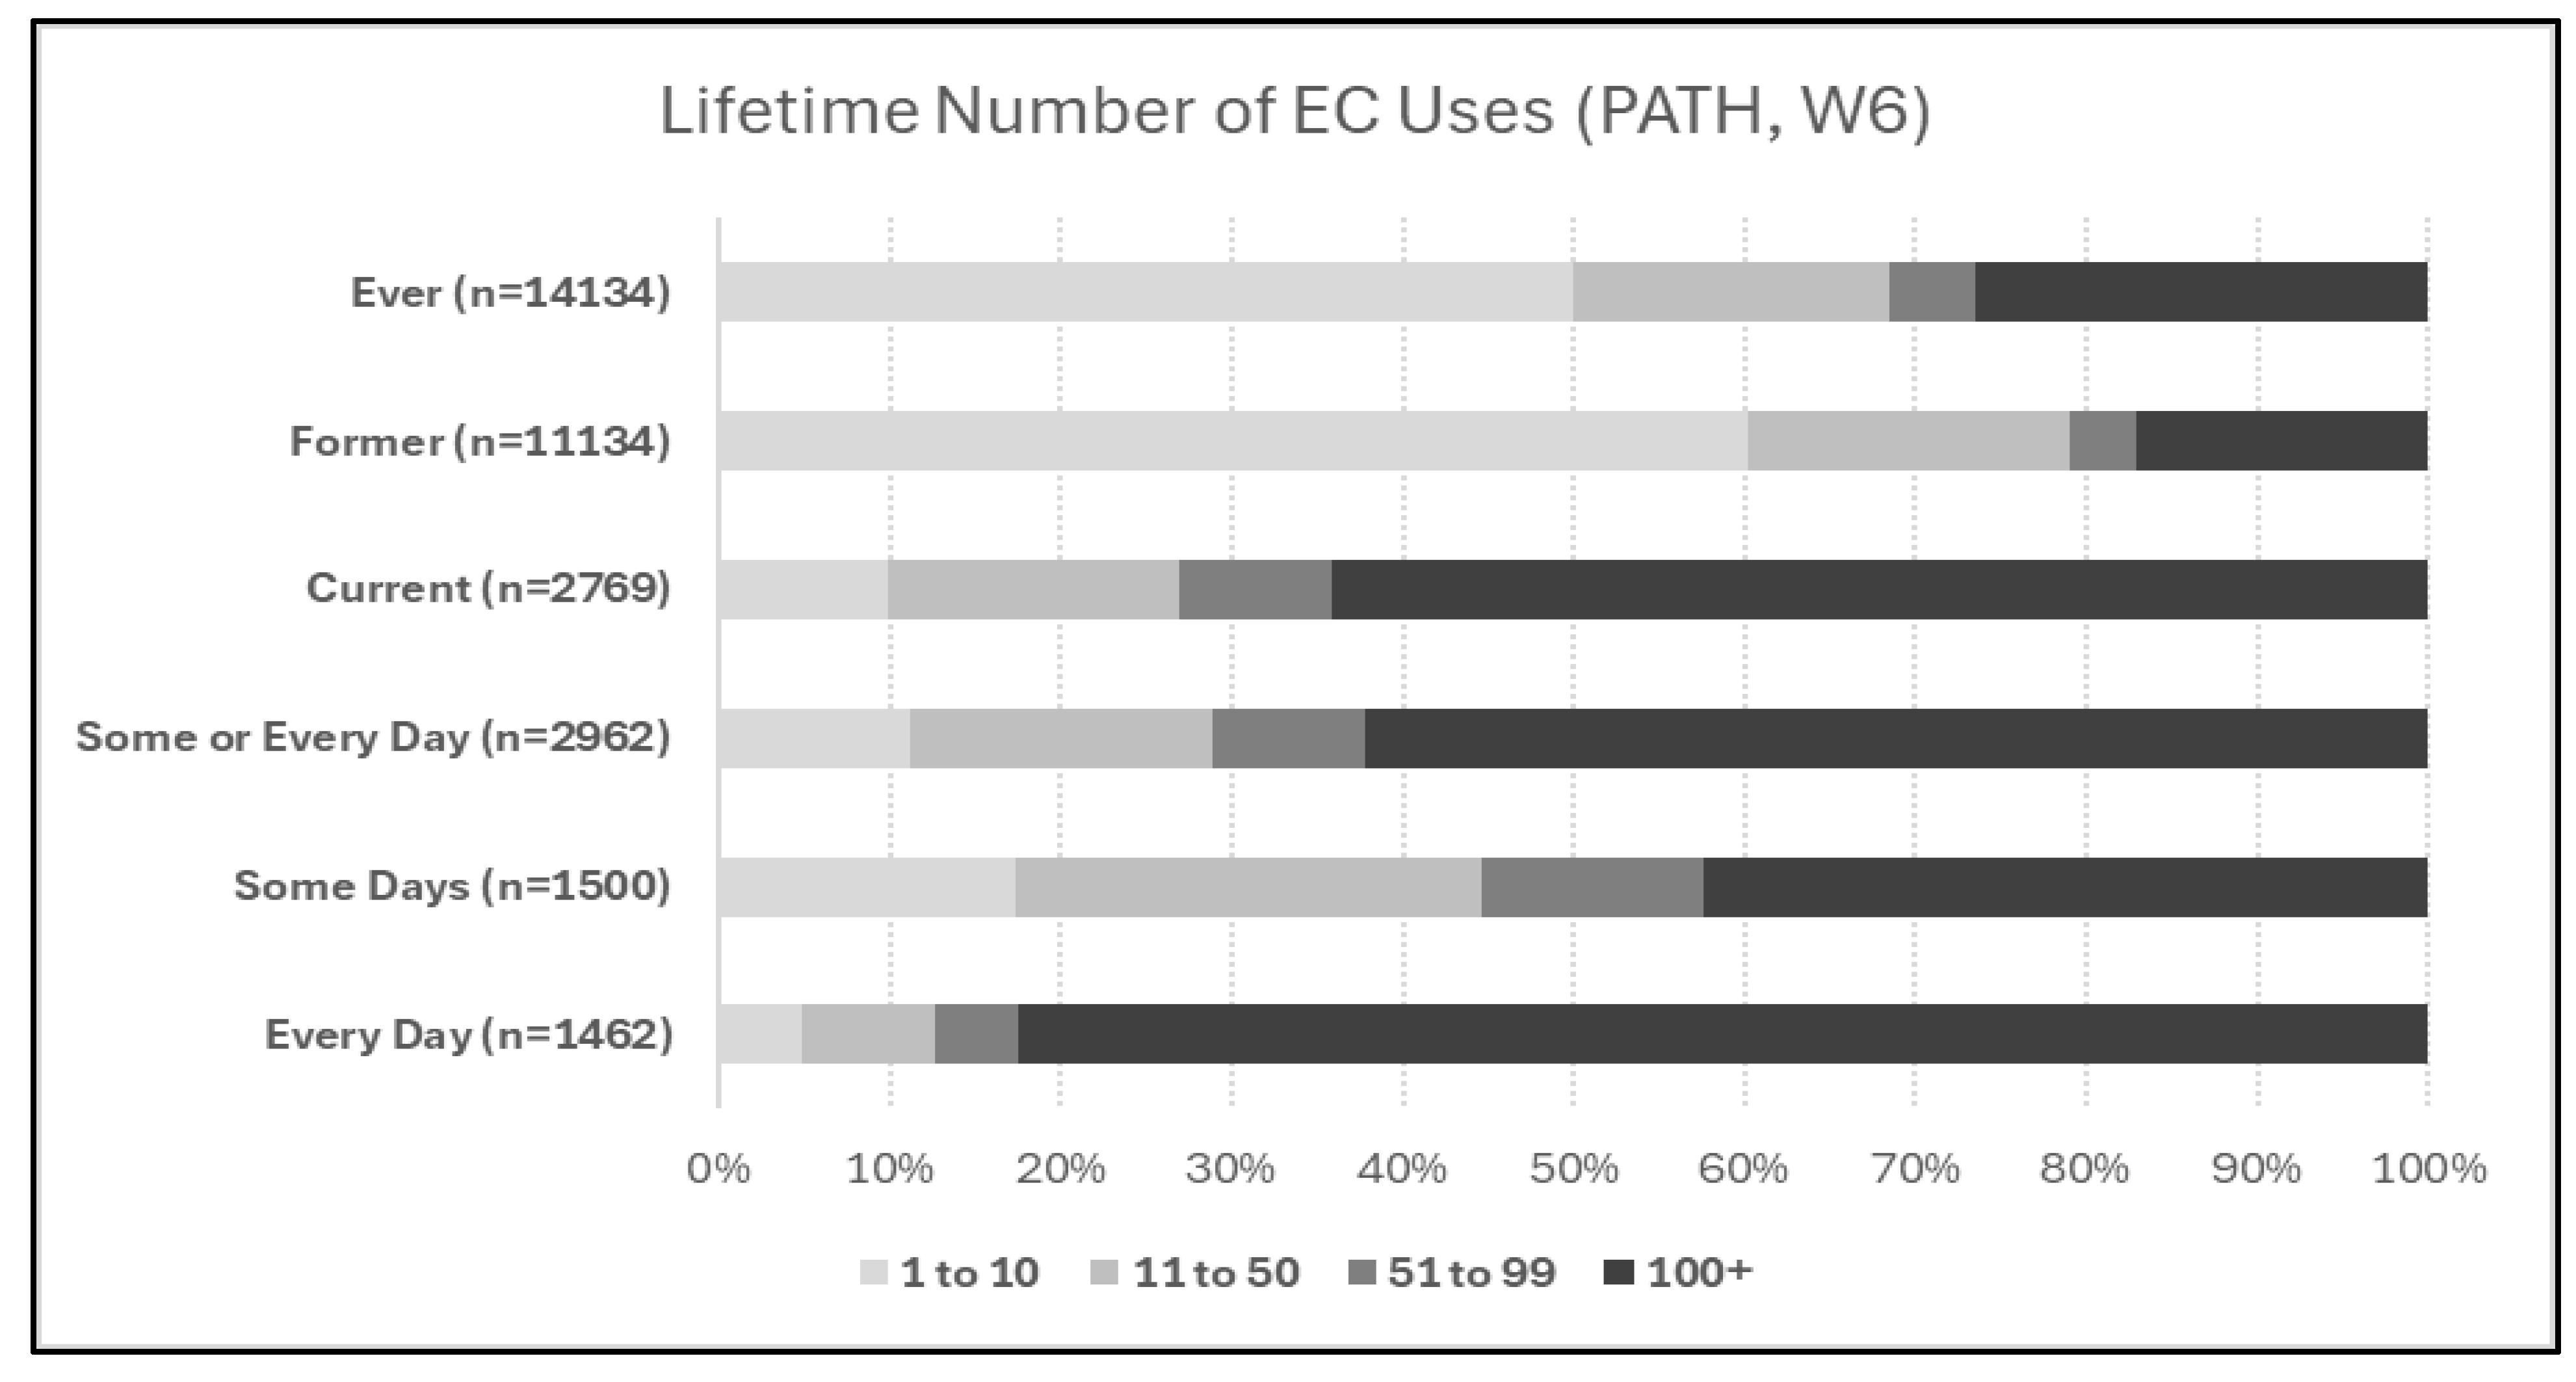
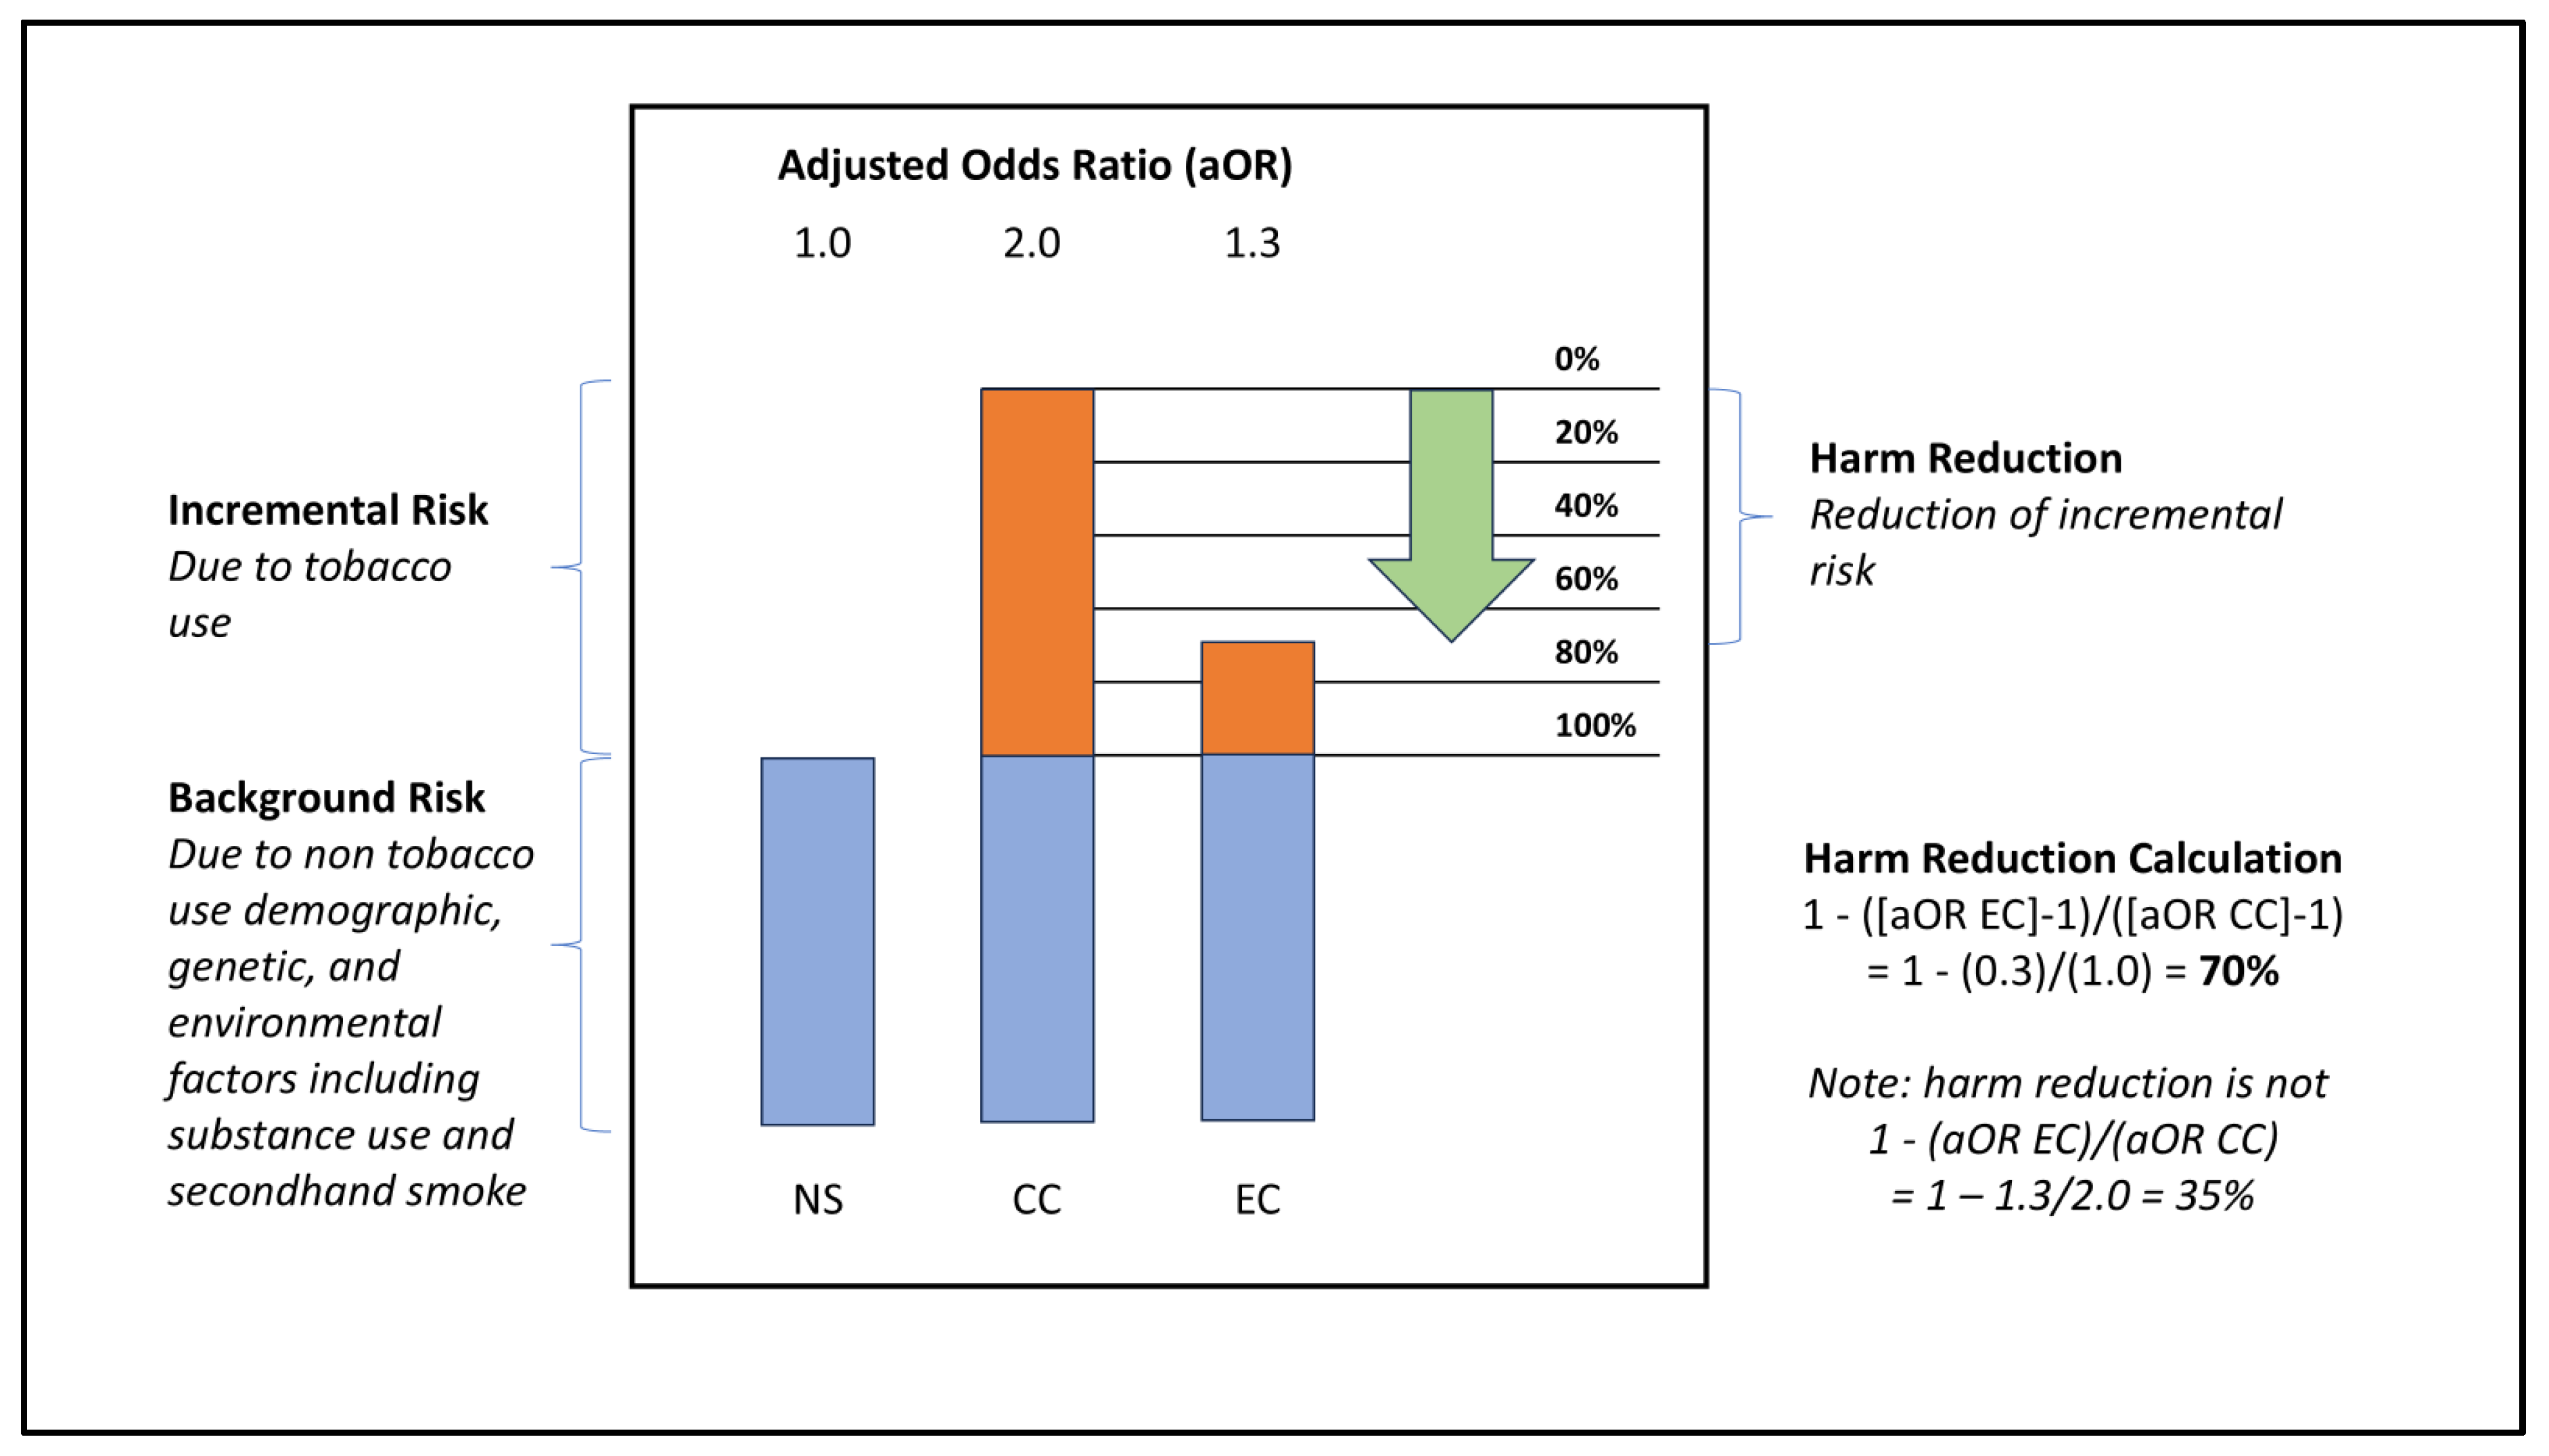
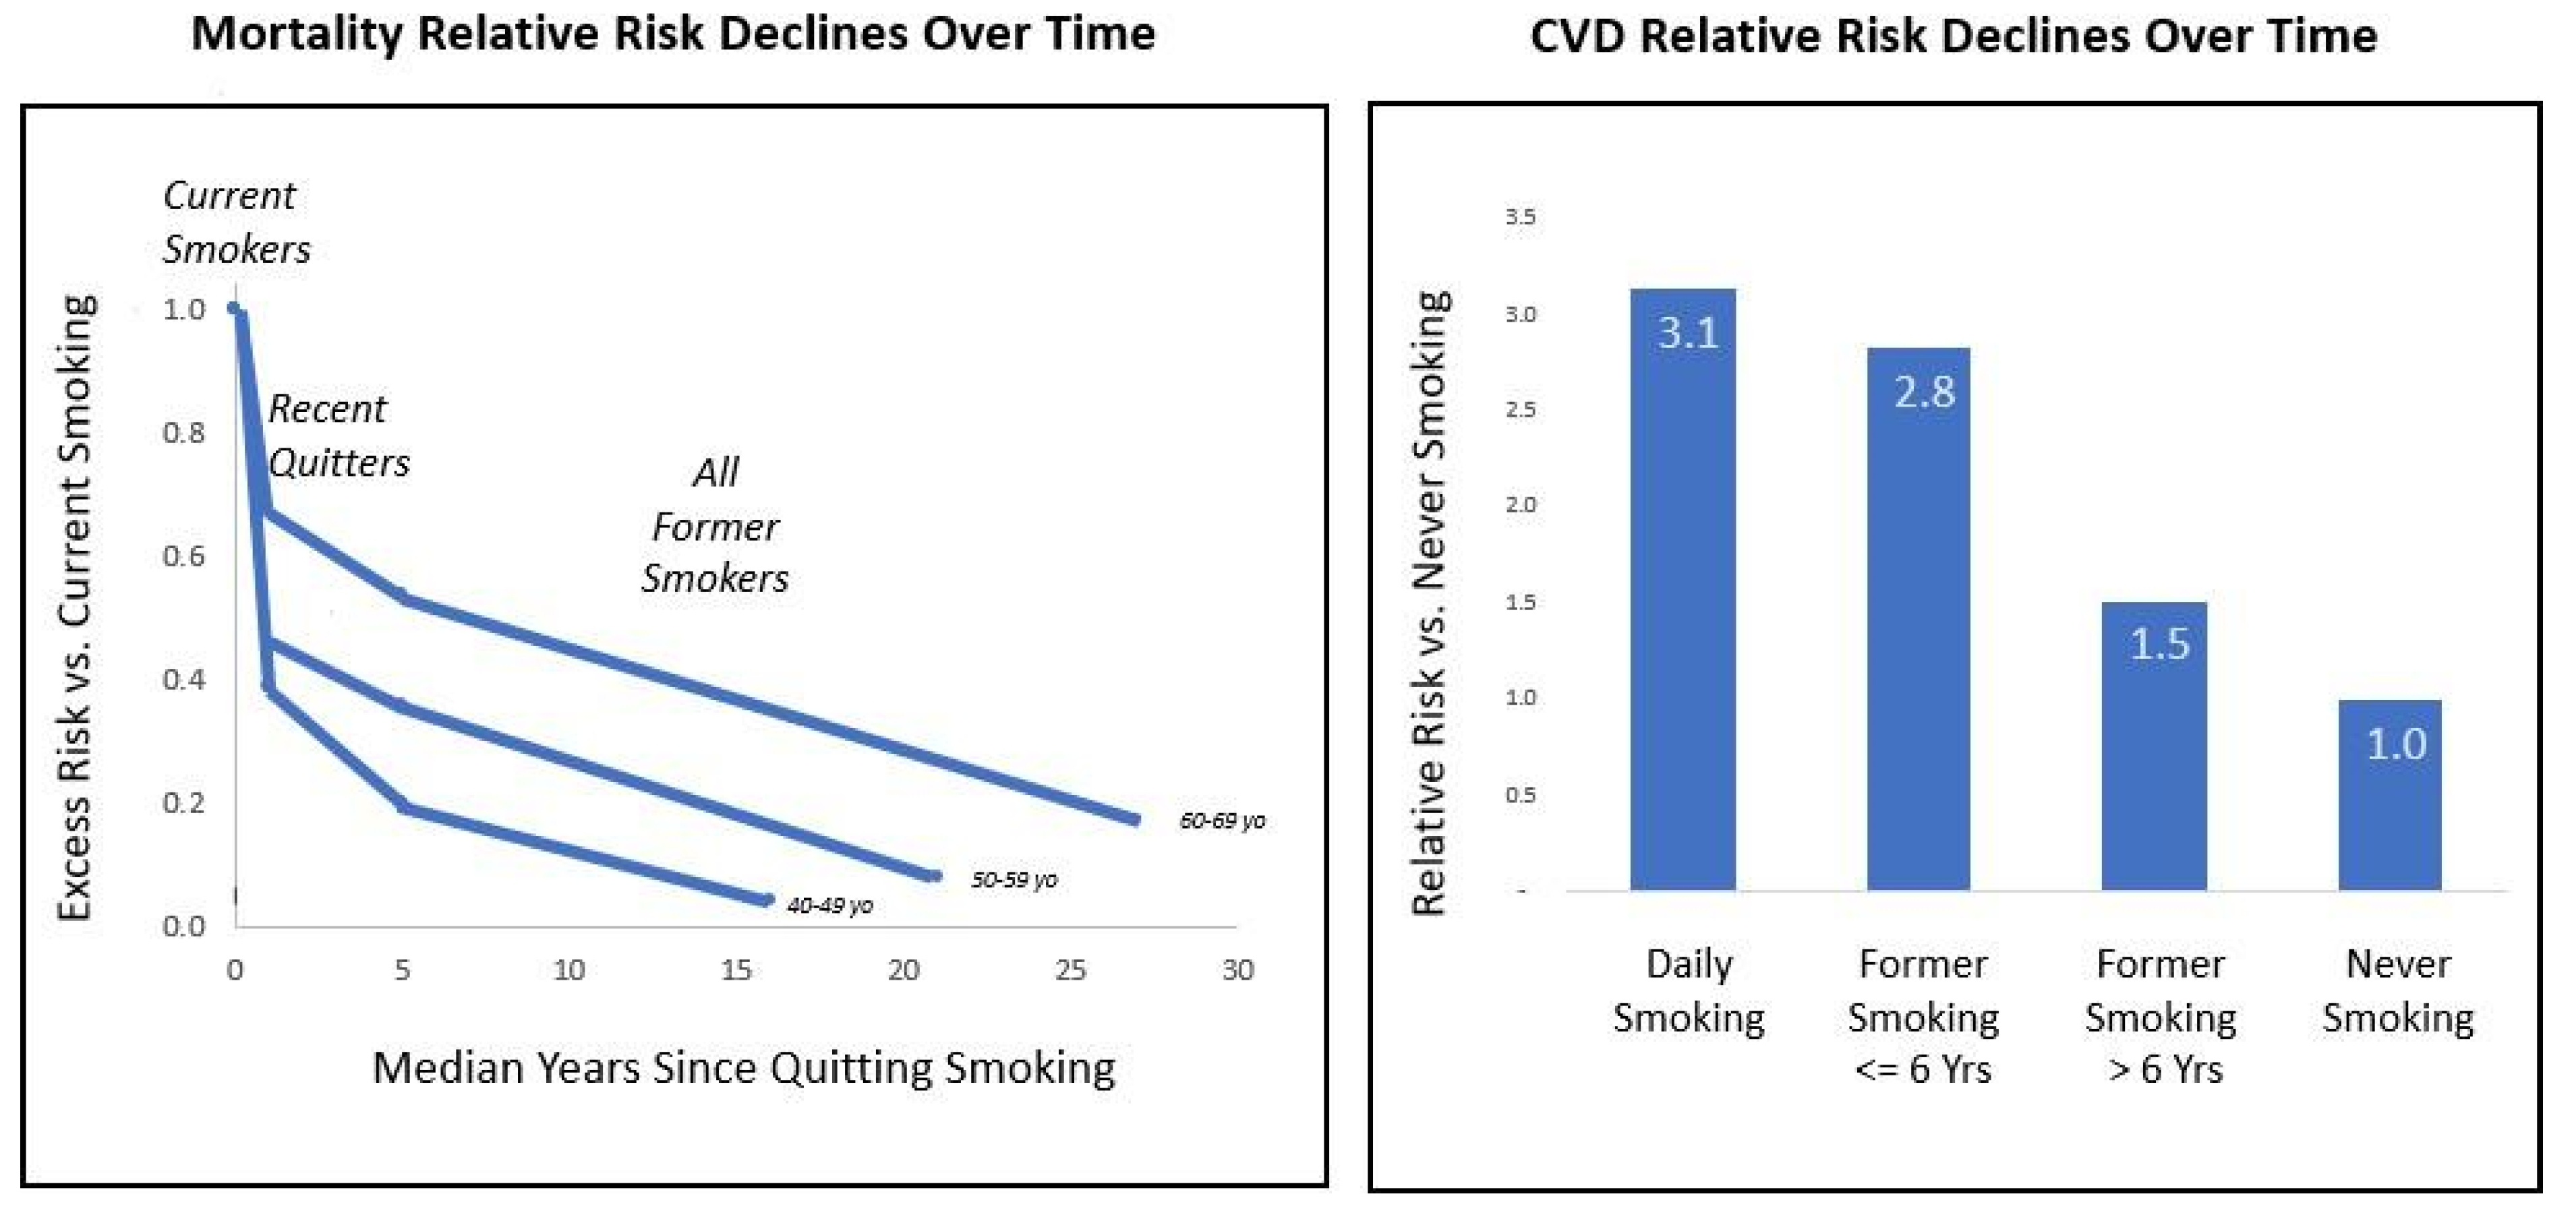
Case Study
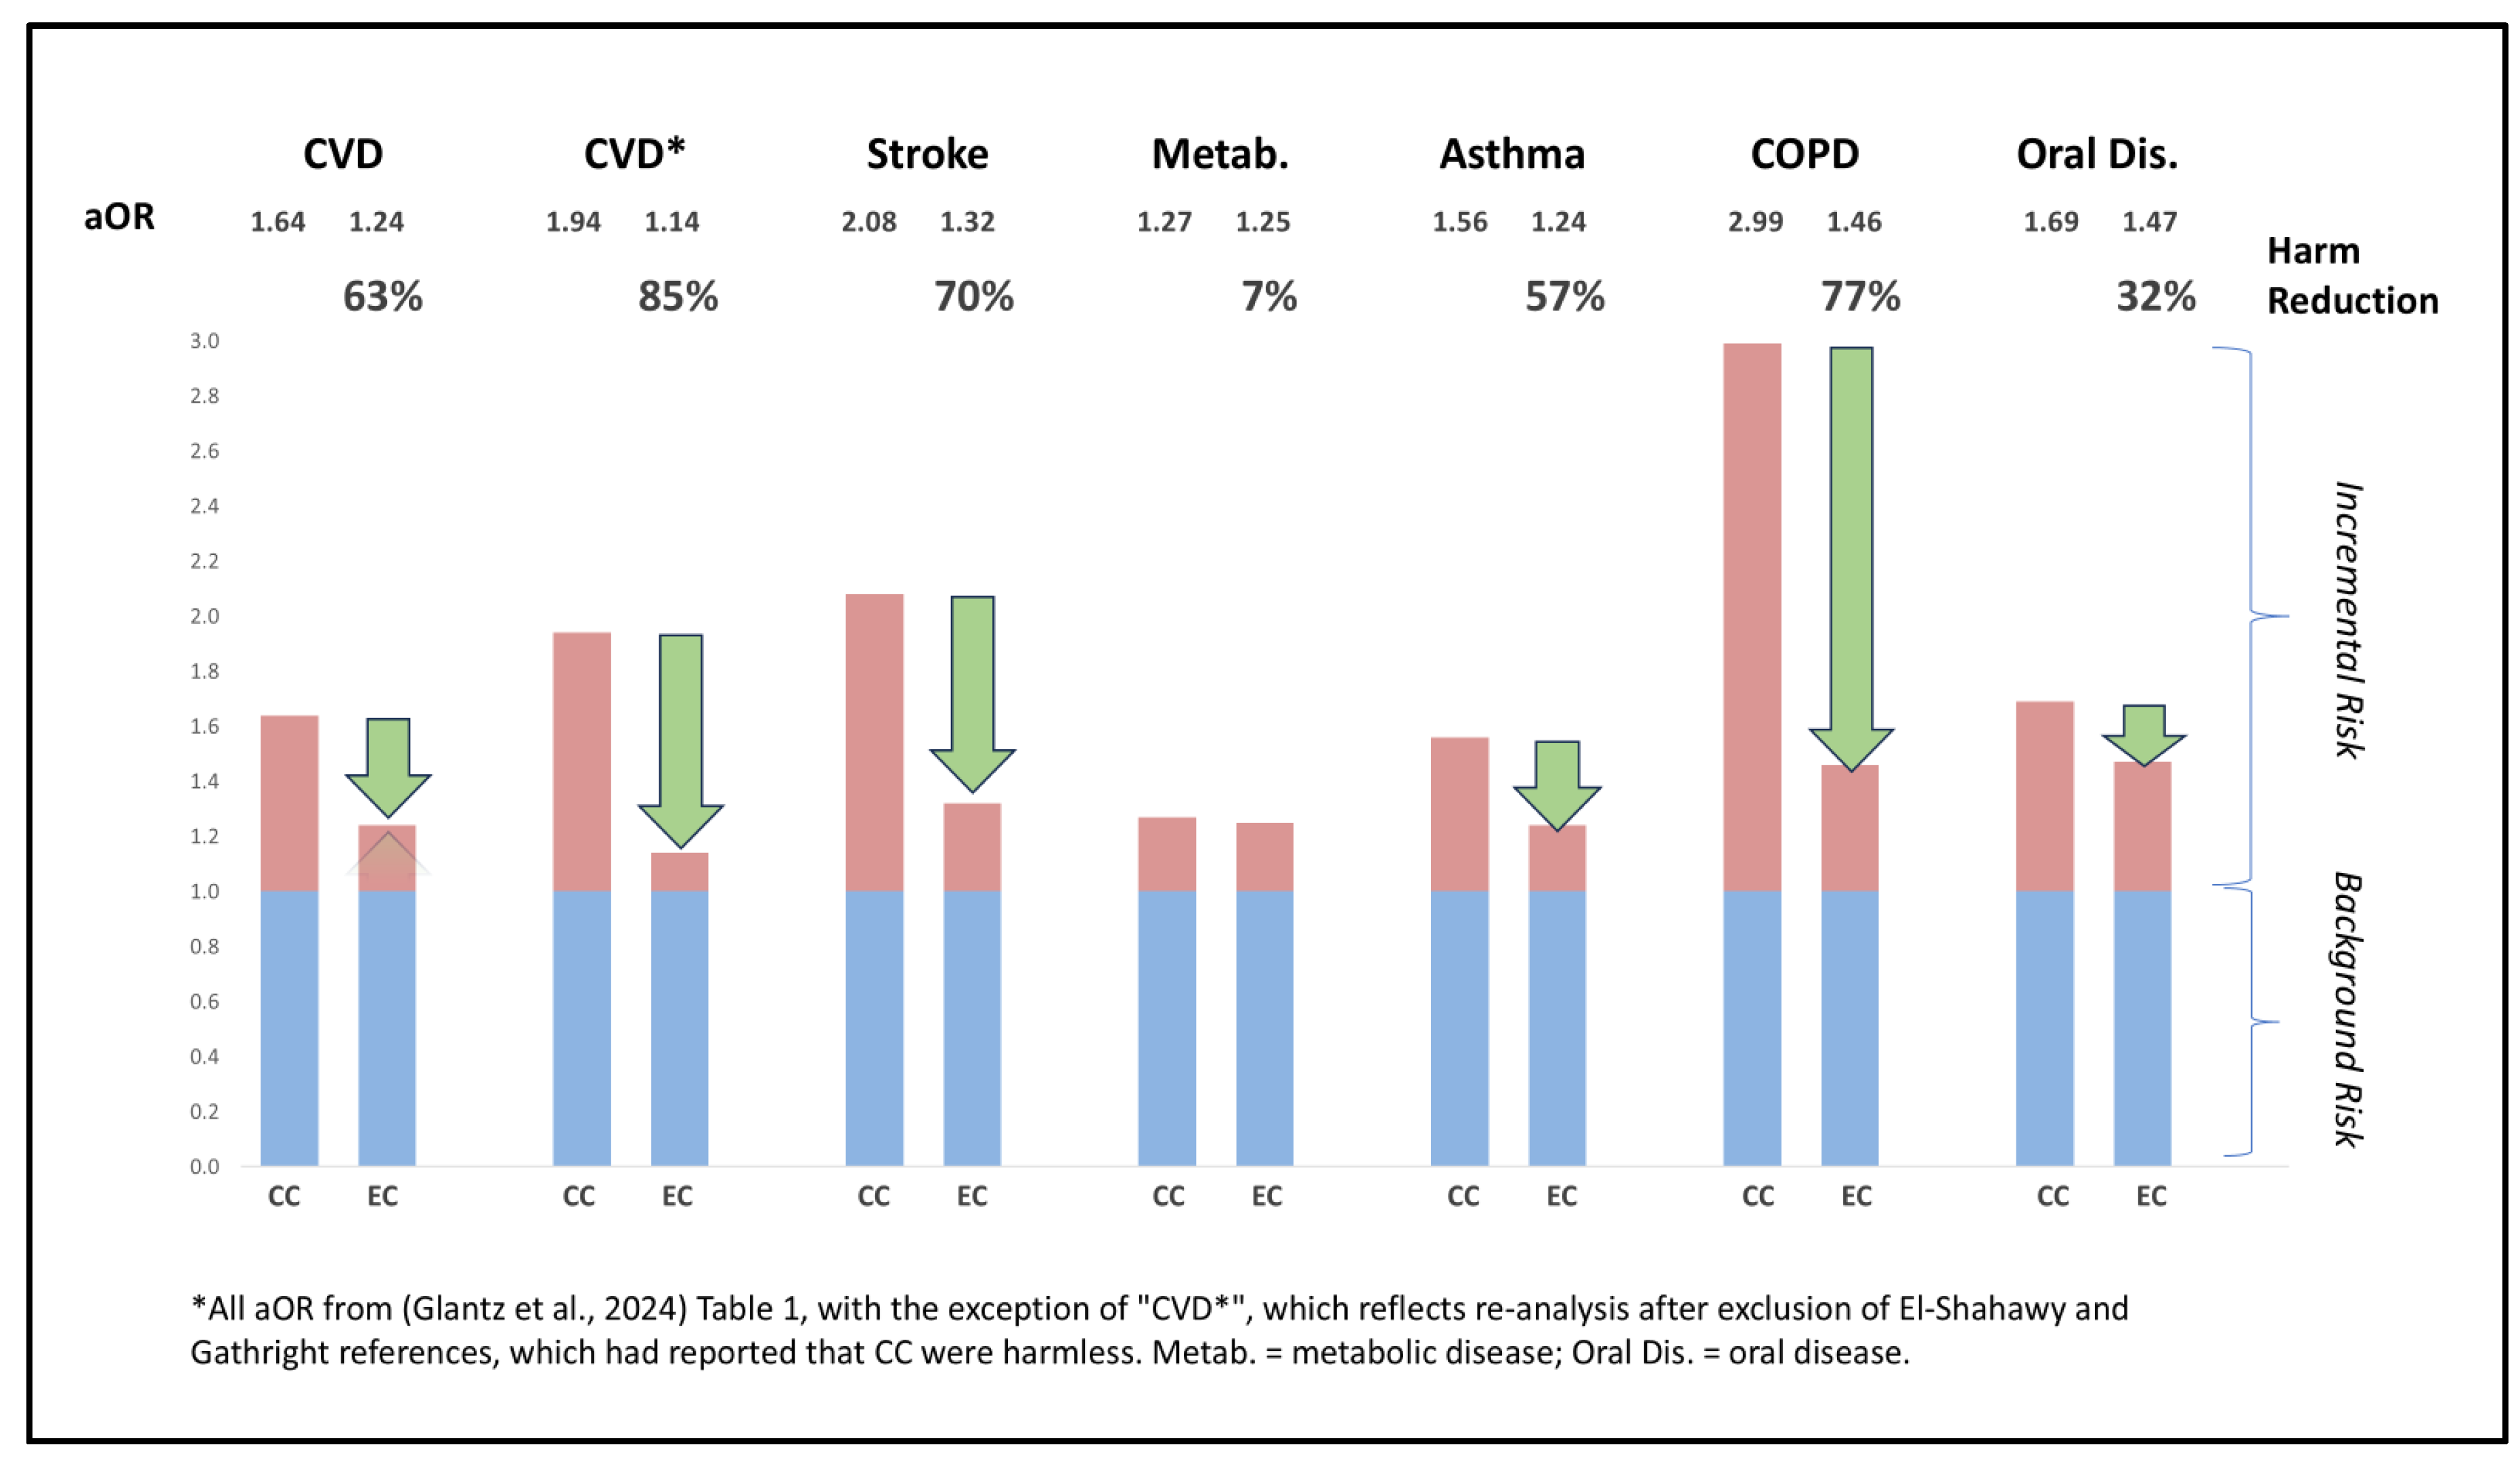
Discussion
Conclusions
Supplementary Materials
Acknowledgments
Disclosures
Appendix A
| Terms | |
| CC | Combusted / conventional cigarette |
| EC | Electronic cigarette; electronic nicotine delivery system |
| NRSE | Non-randomized study of exposure; longitudinal parallel cohort study |
| OR | Odds ratio; aOR is adjusted to normalize for covariate imbalances across cohorts |
| National Surveys Mentioned | |
| BRFSS | Behavioral Risk Factor Surveillance System (CDC) |
| NHANES | National Health and Nutrition Examination Survey (CDC) |
| NHIS | National Health Interview Survey (CDC) |
| PATH | Population Assessment of Tobacco and Health (FDA, NIH, NIDA) |
References
- Alzahrani, T., Pena, I., Temesgen, N., & Glantz, S. A. (2018). Association Between Electronic Cigarette Use and Myocardial Infarction. American Journal of Preventive Medicine, 55(4), 455–461. [CrossRef]
- American Lung Association. (2024). Tobacco Facts | State of Tobacco Control. https://www.lung.org/research/sotc/facts.
- Anic, G. M., Rostron, B. L., Hammad, H. T., van Bemmel, D. M., Del Valle-Pinero, A. Y., Christensen, C. H., Erives, G., Faulcon, L. M., Blount, B. C., Wang, Y., Wang, L., Bhandari, D., Calafat, A. M., Kimmel, H. L., Everard, C. D., Compton, W. M., Edwards, K. C., Goniewicz, M. L., Wei, B., … Chang, C. M. (2022). Changes in Biomarkers of Tobacco Exposure among Cigarette Smokers Transitioning to ENDS Use: The Population Assessment of Tobacco and Health Study, 2013–2015. International Journal of Environmental Research and Public Health, 19(3), 1462. [CrossRef]
- Auer, R., Schoeni, A., Humair, J.-P., Jacot-Sadowski, I., Berlin, I., Stuber, M. J., Haller, M. L., Tango, R. C., Frei, A., Strassmann, A., Bruggmann, P., Baty, F., Brutsche, M., Tal, K., Baggio, S., Jakob, J., Sambiagio, N., Hopf, N. B., Feller, M., … Berthet, A. (2024). Electronic Nicotine-Delivery Systems for Smoking Cessation. New England Journal of Medicine, 390(7), 601–610. [CrossRef]
- Austin, P. C., & Steyerberg, E. W. (2017). Events per variable (EPV) and the relative performance of different strategies for estimating the out-of-sample validity of logistic regression models. Statistical Methods in Medical Research, 26(2), 796–808. [CrossRef]
- Bhatt, S. P., Kim, Y., Harrington, K. F., Hokanson, J. E., Lutz, S. M., Cho, M. H., DeMeo, D. L., Wells, J. M., Make, B. J., Rennard, S. I., Washko, G. R., Foreman, M. G., Tashkin, D. P., Wise, R. A., Dransfield, M. T., & Bailey, W. C. (2018). Smoking duration alone provides stronger risk estimates of chronic obstructive pulmonary disease than pack-years. Thorax, 73(5), 414–421. [CrossRef]
- Black, N. (1996). Why we need observational studies to evaluate the effectiveness of health care. BMJ, 312(7040), 1215–1218. [CrossRef]
- Boakye, E., Erhabor, J., Obisesan, O., Tasdighi, E., Mirbolouk, M., Osuji, N., Osei, A. D., Lee, J., DeFilippis, A. P., Stokes, A. C., Hirsch, G. A., Benjamin, E. J., Robertson, R. M., Bhatnagar, A., El Shahawy, O., & Blaha, M. J. (2023). Comprehensive review of the national surveys that assess E-cigarette use domains among youth and adults in the United States. The Lancet Regional Health - Americas, 23, 100528. [CrossRef]
- Brouwer, A. F., Jeon, J., Hirschtick, J. L., Jimenez-Mendoza, E., Mistry, R., Bondarenko, I. V., Land, S. R., Holford, T. R., Levy, D. T., Taylor, J. M. G., Fleischer, N. L., & Meza, R. (2022). Transitions between cigarette, ENDS and dual use in adults in the PATH study (waves 1–4): Multistate transition modelling accounting for complex survey design. Tobacco Control, 31(3), 424–431. [CrossRef]
- Brouwer, A. F., Levy, D. T., Jeon, J., Jimenez-Mendoza, E., Sanchez-Romero, L. M., Mistry, R., & Meza, R. (2022). The Impact of Current Tobacco Product Use Definitions on Estimates of Transitions Between Cigarette and ENDS Use. Nicotine & Tobacco Research, 24(11), 1756–1762. [CrossRef]
- CDC. (2023). QuickStats: Percentage Distribution of Cigarette Smoking Status† Among Current Adult E-Cigarette Users by Age Group—National Health Interview Survey, United States, 2021. MMWR. Morbidity and Mortality Weekly Report, 72(10), 270. [CrossRef]
- Centers for Disease Control and Prevention (US), National Center for Chronic Disease Prevention and Health Promotion (US), & Office on Smoking and Health (US). (2010). How Tobacco Smoke Causes Disease: The Biology and Behavioral Basis for Smoking-Attributable Disease: A Report of the Surgeon General. Centers for Disease Control and Prevention (US). http://www.ncbi.nlm.nih.gov/books/NBK53017/.
- Chang, J. T., Meza, R., Levy, D. T., Arenberg, D., & Jeon, J. (2021). Prediction of COPD risk accounting for time-varying smoking exposures. PLOS ONE, 16(3), e0248535. [CrossRef]
- Cho, E. R., Brill, I. K., Gram, I. T., Brown, P. E., & Jha, P. (2024). Smoking Cessation and Short- and Longer-Term Mortality. NEJM Evidence, 3(3). [CrossRef]
- Cohen, G., Rose, J. E., & Polosa, R. (2024). Personalized and Adaptive Interventions for Smoking Cessation: Emerging Trends and Determinants of Efficacy. iScience, In Press.
- Cornelius, M. E. (2023). Tobacco Product Use Among Adults – United States, 2021. MMWR. Morbidity and Mortality Weekly Report, 72. [CrossRef]
- Cummings, M., Rigotti, N. A., Benowitz, N., & Hatsukami, D. (2024). An Exchange about “Population-Based Disease Odds for E-Cigarettes and Dual Use versus Cigarettes.” NEJM Evidence, 3(8). [CrossRef]
- Curtis, J. L., Bateman, L. A., Murray, S., Couper, D. J., Labaki, W. W., Freeman, C. M., Arnold, K. B., Christenson, S. A., Alexis, N. E., Kesimer, M., Boucher, R. C., Kaner, R. J., Barjaktarevic, I., Cooper, C. B., Hoffman, E. A., Barr, R. G., Bleecker, E. R., Bowler, R. P., Comellas, A., … Martinez, F. J. (2024). Design of the SPIROMICS Study of Early COPD Progression: SOURCE Study. Chronic Obstructive Pulmonary Diseases: Journal of the COPD Foundation. [CrossRef]
- D’Andrea, E., Vinals, L., Patorno, E., Franklin, J. M., Bennett, D., Largent, J. A., Moga, D. C., Yuan, H., Wen, X., Zullo, A. R., Debray, T. P. A., & Sarri, G. (2021). How well can we assess the validity of non-randomised studies of medications? A systematic review of assessment tools. BMJ Open, 11(3), e043961. [CrossRef]
- Department of Health and Human Services, U. (2014). The Health Consequences of Smoking—50 Years of Progress: A Report of the Surgeon General. US Department of Health and Human Services, CDC. http://www.surgeongeneral.gov/library/reports/50-years-of-progress/full-report.pdf.
- Duncan, M. S., Freiberg, M. S., Greevy, R. A., Kundu, S., Vasan, R. S., & Tindle, H. A. (2019). Association of Smoking Cessation With Subsequent Risk of Cardiovascular Disease. JAMA, 322(7), 642. [CrossRef]
- El Hourani, M., Shihadeh, A., Talih, S., & Eissenberg, T. (2022). Comparison of Nicotine Emissions Rate, “Nicotine Flux”, from Heated, Electronic, and Combustible Tobacco Products. Tobacco Control, tobaccocontrol-2021-056850. [CrossRef]
- El-Shahawy, O., Shah, T., Obisesan, O. H., Durr, M., Stokes, A. C., Uddin, I., Pinjani, R., Benjamin, E. J., Mirbolouk, M., Osei, A. D., Loney, T., Sherman, S. E., & Blaha, M. J. (2022). Association of E-Cigarettes With Erectile Dysfunction: The Population Assessment of Tobacco and Health Study. American Journal of Preventive Medicine, 62(1), 26–38. [CrossRef]
- Erhabor, J., Boakye, E., Obisesan, O., Osei, A. D., Tasdighi, E., Mirbolouk, H., DeFilippis, A. P., Stokes, A. C., Hirsch, G. A., Benjamin, E. J., Rodriguez, C. J., El Shahawy, O., Robertson, R. M., Bhatnagar, A., & Blaha, M. J. (2023). E-Cigarette Use Among US Adults in the 2021 Behavioral Risk Factor Surveillance System Survey. JAMA Network Open, 6(11), e2340859. [CrossRef]
- Erythropel, H. C., Jabba, S. V., Silinski, P., Anastas, P. T., Krishnan-Sarin, S., Zimmerman, J. B., & Jordt, S. E. (2024). Variability in Constituents of E-Cigarette Products Containing Nicotine Analogues. JAMA. [CrossRef]
- Farsalinos, K. E., Polosa, R., Cibella, F., & Niaura, R. (2019). Is e-cigarette use associated with coronary heart disease and myocardial infarction? Insights from the 2016 and 2017 National Health Interview Surveys. Therapeutic Advances in Chronic Disease, 10, 204062231987774. [CrossRef]
- Gathright, E. C., Wu, W.-C., & Scott-Sheldon, L. A. J. (2020). Electronic cigarette use among heart failure patients: Findings from the Population Assessment of Tobacco and Health study (Wave 1: 2013–2014). Heart & Lung, 49(3), 229–232. [CrossRef]
- Glantz, S. A., Nguyen, N., & Oliveira Da Silva, A. L. (2024). Population-Based Disease Odds for E-Cigarettes and Dual Use versus Cigarettes. NEJM Evidence, 3(3). [CrossRef]
- Hannel, T., Wei, L., Muhammad-Kah, R. S., Largo, E. G., & Sarkar, M. (2024). Modeling the population health impact of accurate and inaccurate perceptions of harm from nicotine. Harm Reduction Journal, 21(1), 145. [CrossRef]
- Harlow, A. F., Stokes, A. C., Brooks, D. R., Benjamin, E. J., Leventhal, A. M., McConnell, R. S., Barrington-Trimis, J. L., & Ross, C. S. (2022). Prospective association between e-cigarette use frequency patterns and cigarette smoking abstinence among adult cigarette smokers in the United States. Addiction, 117(12), 3129–3139. [CrossRef]
- Holt, N. M., Shiffman, S., Black, R. A., Goldenson, N. I., Sembower, M. A., & Oldham, M. J. (2023). Comparison of biomarkers of exposure among US adult smokers, users of electronic nicotine delivery systems, dual users and nonusers, 2018–2019. Scientific Reports, 13(1), 7297. [CrossRef]
- Joelving, F. (2024). Prescription for controversy. Science. [CrossRef]
- Kasza, K. A., Edwards, K. C., Kimmel, H. L., Anesetti-Rothermel, A., Cummings, K. M., Niaura, R. S., Sharma, A., Ellis, E. M., Jackson, R., Blanco, C., Silveira, M. L., Hatsukami, D. K., & Hyland, A. (2021). Association of e-Cigarette Use With Discontinuation of Cigarette Smoking Among Adult Smokers Who Were Initially Never Planning to Quit. JAMA Network Open, 4(12), e2140880. [CrossRef]
- Kasza, K. A., Rivard, C., Goniewicz, M. L., Fong, G. T., Hammond, D., Cummings, K. M., & Hyland, A. (2024). E-Cigarette Characteristics and Cigarette Cessation Among Adults Who Use E-Cigarettes. JAMA Network Open, 7(8), e2423960. [CrossRef]
- Khouja, J. N., Wootton, R. E., Taylor, A. E., Davey Smith, G., & Munafò, M. R. (2021). Association of genetic liability to smoking initiation with e-cigarette use in young adults: A cohort study. PLOS Medicine, 18(3), e1003555. [CrossRef]
- Kim, S., & Selya, A. S. (2020). The Relationship Between Electronic Cigarette Use and Conventional Cigarette Smoking Is Largely Attributable to Shared Risk Factors. Nicotine & Tobacco Research, 22(7), 1123–1130. [CrossRef]
- Kim, S., Shiffman, S., & Sembower, M. A. (2022). US adult smokers’ perceived relative risk on ENDS and its effects on their transitions between cigarettes and ENDS. BMC Public Health, 22(1), 1771. [CrossRef]
- Klonizakis, M., Gumber, A., McIntosh, E., & Brose, L. S. (2022). Medium- and longer-term cardiovascular effects of e-cigarettes in adults making a stop-smoking attempt: A randomized controlled trial. BMC Medicine, 20(1), 276. [CrossRef]
- Levy, D., Yuan, Z., & Li, Y. (2017). The Prevalence and Characteristics of E-Cigarette Users in the U.S. International Journal of Environmental Research and Public Health, 14(10), 1200. [CrossRef]
- Lindson, N., Theodoulou, A., Ordóñez-Mena, J. M., Fanshawe, T. R., Sutton, A. J., Livingstone-Banks, J., Hajizadeh, A., Zhu, S., Aveyard, P., Freeman, S. C., Agrawal, S., & Hartmann-Boyce, J. (2023). Pharmacological and electronic cigarette interventions for smoking cessation in adults: Component network meta-analyses. The Cochrane Database of Systematic Reviews, 2023(9), CD015226. [CrossRef]
- Lu, M., Zhong, W., Liu, Y., Miao, H., Li, Y., & Ji, M. (2016). Sample Size for Assessing Agreement between Two Methods of Measurement by Bland-Altman Method. The International Journal of Biostatistics, 12(2), 8p. [CrossRef]
- Lubin, J. H., Albanes, D., Hoppin, J. A., Chen, H., Lerro, C. C., Weinstein, S. J., Sandler, D. P., & Beane Freeman, L. E. (2016). Greater Coronary Heart Disease Risk With Lower Intensity and Longer Duration Smoking Compared With Higher Intensity and Shorter Duration Smoking: Congruent Results Across Diverse Cohorts. Nicotine & Tobacco Research, ntw290. [CrossRef]
- Lubin, J. H., Couper, D., Lutsey, P. L., Woodward, M., Yatsuya, H., & Huxley, R. R. (2016). Risk of Cardiovascular Disease from Cumulative Cigarette Use and the Impact of Smoking Intensity: Epidemiology, 27(3), 395–404. [CrossRef]
- Marrocco, A., Singh, D., Christiani, D. C., & Demokritou, P. (2022). E-cigarette vaping associated acute lung injury (EVALI): State of science and future research needs. Critical Reviews in Toxicology, 52(3), 188–220. [CrossRef]
- Martin, S. S., Aday, A. W., Almarzooq, Z. I., Anderson, C. A. M., Arora, P., Avery, C. L., Baker-Smith, C. M., Barone Gibbs, B., Beaton, A. Z., Boehme, A. K., Commodore-Mensah, Y., Currie, M. E., Elkind, M. S. V., Evenson, K. R., Generoso, G., Heard, D. G., Hiremath, S., Johansen, M. C., Kalani, R., … on behalf of the American Heart Association Council on Epidemiology and Prevention Statistics Committee and Stroke Statistics Subcommittee. (2024). 2024 Heart Disease and Stroke Statistics: A Report of US and Global Data From the American Heart Association. Circulation, 149(8). [CrossRef]
- Munafò, M. R. (2024, March 22). SRNT 2024 Plenary. SRNT 2024 Plenary Lecture: How to Avoid Being Precisely Wrong: Triangulation and Causal Inference in Observational Epidemiology. https://www.srnt.org/page/2024_Plenary_Lectures.
- Munafò, M. R., & Smith, G. (2018, January 25). Comment: Repeating experiments is not enough. Nature, 553, 399–401.
- Nance, R., Delaney, J., McEvoy, J. W., Blaha, M. J., Burke, G. L., Navas-Acien, A., Kaufman, J. D., Oelsner, E. C., & McClelland, R. L. (2017). Smoking intensity (pack/day) is a better measure than pack-years or smoking status for modeling cardiovascular disease outcomes. Journal of Clinical Epidemiology, 81, 111–119. [CrossRef]
- National Cancer Institute. (2023). HINTS 5 Cycle 4 (2020). https://hints.cancer.gov/view-questions/question-detail.aspx?PK_Cycle=13&qid=1282 .
- Patel, U., Patel, N., Khurana, M., Parulekar, A., Patel, A., Ortiz, J. F., Patel, R., Urhoghide, E., Mistry, A., Bhriguvanshi, A., Abdulqader, M., Mehta, N., Arumaithurai, K., & Shah, S. (2022). Effect Comparison of E-Cigarette and Traditional Smoking and Association with Stroke—A Cross-Sectional Study of NHANES. Neurology International, 14(2), 441–452. [CrossRef]
- Pavlou, M., Ambler, G., Seaman, S. R., Guttmann, O., Elliott, P., King, M., & Omar, R. Z. (2015). How to develop a more accurate risk prediction model when there are few events. BMJ, h3868. [CrossRef]
- Peduzzi, P., Concato, J., Kemper, E., Holford, T. R., & Feinstein, A. R. (1996). A simulation study of the number of events per variable in logistic regression analysis. Journal of Clinical Epidemiology, 49(12), 1373–1379. [CrossRef]
- Persoskie, A., O’Brien, E. K., & Poonai, K. (2019). Perceived relative harm of using e-cigarettes predicts future product switching among US adult cigarette and e-cigarette dual users. Addiction, 114(12), 2197–2205. [CrossRef]
- Rennard, S. I., & Drummond, M. B. (2015). Early chronic obstructive pulmonary disease: Definition, assessment, and prevention. The Lancet, 385(9979), 1778–1788. [CrossRef]
- Selya, A., Kim, S., Shiffman, S., Gitchell, J., & Foxon, F. (2024). What Substances Are Adolescents Vaping? Estimating Nicotine-Specific and Cannabis-Specific Vaping from US National Youth Surveys. Substance Use & Misuse, 59(2), 218–224. [CrossRef]
- Shiffman, S., McCaffrey, S. A., Hannon, M. J., Goldenson, N. I., & Black, R. A. (2023). A New Questionnaire to Assess Respiratory Symptoms (The Respiratory Symptom Experience Scale): Quantitative Psychometric Assessment and Validation Study. JMIR Formative Research, 7, e44036. [CrossRef]
- Sterne, J. A., Hernán, M. A., Reeves, B. C., Savović, J., Berkman, N. D., Viswanathan, M., Henry, D., Altman, D. G., Ansari, M. T., Boutron, I., Carpenter, J. R., Chan, A.-W., Churchill, R., Deeks, J. J., Hróbjartsson, A., Kirkham, J., Jüni, P., Loke, Y. K., Pigott, T. D., … Higgins, J. P. (2016). ROBINS-I: A tool for assessing risk of bias in non-randomised studies of interventions. BMJ, i4919. [CrossRef]
- Van Der Ploeg, T., Austin, P. C., & Steyerberg, E. W. (2014). Modern modelling techniques are data hungry: A simulation study for predicting dichotomous endpoints. BMC Medical Research Methodology, 14(1), 137. [CrossRef]
- Vittinghoff, E., & McCulloch, C. E. (2007). Relaxing the Rule of Ten Events per Variable in Logistic and Cox Regression. American Journal of Epidemiology, 165(6), 710–718. [CrossRef]
- Wang, R. J., Bhadriraju, S., & Glantz, S. A. (2021). E-Cigarette Use and Adult Cigarette Smoking Cessation: A Meta-Analysis. American Journal of Public Health, 111(2), 230–246. [CrossRef]
- WHO. (2023). WHO report on the global tobacco epidemic, 2023: Protect people from tobacco smoke. Geneva: World Health Organization.
- Yong, H.-H., Hitchman, S. C., Cummings, K. M., Borland, R., Gravely, S. M. L., McNeill, A., & Fong, G. T. (2017). Does the Regulatory Environment for E-Cigarettes Influence the Effectiveness of E-Cigarettes for Smoking Cessation?: Longitudinal Findings From the ITC Four Country Survey. Nicotine & Tobacco Research, 19(11), 1268–1276. [CrossRef]
| 1 | Note: in Figure 2, current use (past 30 day use) sample size does not exactly correspond to the sum of current some-day and current every-day use, and ever-use does not exactly correspond to the sum of former and current use, because of inconsistencies in participant answers across different questions. |
| 2 | A technical consideration is that lifetime smoking of fewer than 100 CC is typically considered “non-use”, while “even one or two puffs” is typically included in EC ever-use. For evaluations of the impact of chronic use of tobacco products, this difference may be immaterial, but studies seeking to precisely identify a health impact of ever-use or former-use of EC may be confounded by unaccounted-for CC smoking of under 100 cigarettes which could equal or exceed the limited exposure to EC in this sample. |
| 3 | In some cases, 5-9 events per adjustment variable may be sufficient, for instance with use of penalized regression approaches, or when the event fraction (incidence of harm events) is greater than ~10% (Lu et al., 2016). In other cases, an EPV of 20-50 may be necessary (Austin & Steyerberg, 2017; Pavlou et al., 2015; Van Der Ploeg et al., 2014; Vittinghoff & McCulloch, 2007). |
Disclaimer/Publisher’s Note: The statements, opinions and data contained in all publications are solely those of the individual author(s) and contributor(s) and not of MDPI and/or the editor(s). MDPI and/or the editor(s) disclaim responsibility for any injury to people or property resulting from any ideas, methods, instructions or products referred to in the content. |
© 2024 by the authors. Licensee MDPI, Basel, Switzerland. This article is an open access article distributed under the terms and conditions of the Creative Commons Attribution (CC BY) license (http://creativecommons.org/licenses/by/4.0/).


