
Submitted:
30 October 2024
Posted:
30 October 2024
You are already at the latest version
Abstract
Poly(butyl cyanoacrylate) (PBCA) nanoparticles have numerous applications, including drug and gene delivery, molecular imaging, and cancer therapy. To uncover the molecular mechanisms underlying their interactions with cell membranes, we utilized a Langmuir monolayer as a model membrane system. This approach enabled us to investigate the processes of penetration and reorganization of PBCA nanoparticles when deposited in a phospholipid monolayer subphase. Atomic force microscopy (AFM) was employed to visualize Langmuir–Blodgett (LB) films of these nanoparticles. Additionally, we examined the state of a monolayer of Pluronic F68, a stabilizer of PBCA nanoparticles in suspension, by measuring changes in relative surface area and surface potential over time in the barostatic regime following PBCA suspension spreading. Based on these findings, we propose a molecular mechanism for nanoparticle reorganization at the air–water interface.
Keywords:
Poly(butyl cyanoacrylate) nanoparticles
; Pluronic 68
; Langmuir monolayers
; atomic force microscopy (AFM)
1. Introduction
In recent years, submicron and nano-sized particles with diverse compositions and structures have opened a broad scientific horizon in modern technologies and the pharmaceutical industry for the development of new materials, biodegradable drug carriers, components for microelectronics, catalysts in fine organic synthesis, various nanoemulsions, and more [1,2,3]. Due to their small size—10 to 100 times smaller than a typical human body cell (5 – 10 μm)—these particles are well-suited as carriers for various drugs and biologically active molecules, including proteins, hormones, DNA, and RNA [4,5,6].
Poly(n-butyl cyanoacrylate) (PBCA) nanoparticles, synthesized from a polymer with a medium-length alkyl side chain, offer several advantages, including low toxicity and biodegradability, making them one of the most widely used biocompatible drug carriers. [7]. The drug-carrying PBCA nanoparticles are conventionally prepared by dispersing the drug during the polymerization of the nanoparticles. However, there are drawbacks to their use, mainly because some substances are not stable under the polymerization conditions, and the highly reactive alkyl cyanoacrylate monomer can irreversibly deactivate some drugs. Additionally, polymerization conditions significantly influence the size distribution of the nanoparticles and the molecular weight of the resulting polymer.
To overcome these drawbacks, nanoprecipitation is commonly used to obtain pure drug carriers. This method enables the incorporation of hydrophobic and chemically unstable drug substances by avoiding contact with the highly reactive monomer, thus preventing drug deactivation [8].
A notable model for the incorporation and release of drug substances from such carriers is the alkylating anticancer agent chlorambucil, a lipophilic drug used to treat chronic lymphocytic leukemia, lymphomas, and other malignancies. Chlorambucil contains electrophilic reactive groups that can alkylate nucleic acids and proteins at their nucleophilic centers, forming intrachain and interchain bonds. These changes disrupt replication, transcription, and translation processes within the cell, ultimately leading to the damage or death of neoplastic cells. However, chlorambucil's use is limited due to its chemical instability and toxic effects on the human body. A promising approach to address these limitations is incorporating the drug into PBCA nanoparticles and stabilizing the drug-carrier complex with the tri-block copolymer poly(ethylene oxide)-poly(propylene oxide)-poly(ethylene oxide), commonly known as Pluronic F68 [9].
While the production of nontoxic, biocompatible PBCA drug carriers is essential, a more intriguing aspect is understanding the mechanisms of interaction between these nanoparticles and cell membranes, as well as how they cross the cell barrier to enter the intracellular matrix. A reliable approach to studying the behavior and reorganization of PBCA nanoparticles containing encapsulated drugs at the cell membrane interface is to use a Langmuir monolayer of phospholipids spread at the air/water interface as a simplified and convenient cell membrane model. This approach has already been successfully applied to study the interfacial interaction of lipid nanocapsules (LNCs) with a Dipalmitoylphosphatidylcholine (DPPC) monolayer at the air/water interface. A monolayer of the saturated phospholipid DPPC is often preferred as a model cell membrane because DPPC is the most common lipid component of cell membranes [10,11,12,13,14], and drug insertion into preformed DPPC monolayers at the air/water interface closely resembles drug penetration through biological membranes [15,16].
This paper aims to investigate the mechanisms of destabilization and reorganization of polymer PBCA nanoparticles stabilized with Pluronic F68 in a colloidal suspension at the air/water interface, as well as their interactions with preformed DPPC monolayers. To achieve this, we employed a classical approach by measuring surface pressure and surface potential isotherms and monitoring changes in these interfacial thermodynamic properties of the Langmuir monolayer over time. Additionally, the monolayer studies at the air/water interface were complemented with Atomic Force Microscopy (AFM) imaging of Langmuir-Blodgett (LB) films, transferred from the air/water interface onto mica solid support.
2. Materials and Methods
Materials
Butyl cyanoacrylate (BCA), used as a monomer for nanoparticle synthesis, was purchased from Special Polymers Ltd (Bulgaria). The colloidal stabilizer, poloxamer 188 (Pluronic F-68; a triblock copolymer of poly(ethylene oxide)-poly(propylene oxide)-poly(ethylene oxide) with a molecular weight of 8400), and polysorbate 80 (Tween 80; polyoxymethylene (20) sorbitan monooleate) were purchased from Sigma-Aldrich (Germany). The phospholipid 1,2-dipalmitoyl-sn-glycero-3-phosphocholine monohydrate (DPPC), used for monolayer studies, was obtained from Avanti Polar Lipids (USA). All reagents were of analytical grade, and double-distilled water was used in all experiments.
Methods
Colloidal PBCA nanoparticles were prepared by controlled emulsion polymerization of butyl cyanoacrylate, as described elsewhere [9]. Briefly, the polymerization medium was prepared by dissolving 500 mg of Pluronic F68 and 400 mg of citric acid in 200 ml of distilled water. Then, 2 ml of butyl cyanoacrylate monomer was added dropwise to the medium under vigorous stirring at 600 rpm. Within the first 10 minutes, the emulsion turned milky white, and polymerization proceeded for six hours. The pH of the resulting dispersion was adjusted to 5.6 by adding 4 ml of 1M NaOH. Next, the polymerized dispersion was centrifuged at 14,500 rpm for 15 minutes and washed twice with double-distilled water. The resulting precipitate was dried under vacuum, yielding a fine white powder used for nanoparticle preparation.
For PBCA nanoparticle preparation, the precipitation medium was prepared with 20 mg of Pluronic F68 as a colloidal stabilizer and 20 mg of citric acid dissolved in 10 ml of 5% glucose solution. Then, 50–100 mg of pre-synthesized PBCA was dissolved in 5 ml of acetone and added dropwise to the nanoprecipitation medium under vigorous stirring at 600 rpm, allowing acetone to evaporate as the suspension was left in a fume hood for 5 hours. Residual acetone was removed by vacuum evaporation. Nanoparticle concentrations were determined gravimetrically by repeated centrifugation and washing of particles from an aliquot of the dispersion, followed by drying of the sediment to a constant mass in pre-weighed Eppendorf tubes in a vacuum desiccator. Water dispersions of PBCA nanoparticles with concentrations of 6–8 mg/ml were prepared, as well as PBCA nanoparticle solutions in chloroform with concentrations of 1.5 ± 0.2 mg/ml.
It should be noted that the prepared PBCA is soluble in acetone but not in water. Therefore, Pluronic F68, a triblock copolymer of poly(ethylene oxide)-poly(propylene oxide)-poly(ethylene oxide) (EO₇₆-PO₂₉-EO₇₆), was used as a colloidal stabilizer to stabilize the nanoparticles in the water phase. This polymer has a molecular weight of 8400 and consists of three parts: two hydrophilic EO blocks and a central hydrophobic PO block (Figure 1a). This structure enables Pluronic molecules to adsorb on the surface of PBCA nanoparticles, creating a hydrophilic shell around them (Figure 1b) that prevents aggregation.
The PBCA nanoparticles were characterized by atomic force microscopy (AFM). Sample preparation for AFM imaging involved depositing a freshly synthesized PBCA nanoparticle solution onto a freshly cleaved mica surface before the addition of Pluronic F68. Freshly cleaved Grade V-4 Muscovite mica sheets (10 × 10 mm) from SPI Supplies (USA) were used for deposition of approximately 100 μL of nanoparticle solution. These mica sheets were also used in LB experiments. After a 10-minute incubation, samples were gently dried with nitrogen gas for 5 minutes.
AFM imaging was performed on a NanoScope MultiMode V system (Bruker Inc., Germany) in tapping mode in air at room temperature. The system uses a stationary probe oscillated vertically by a piezoelectric stack, while the sample, mounted on a metal puck magnetically attached to the scanner tube, is translated horizontally. The probe detects sample surface information through the deflection of the cantilever as it encounters the surface, revealing vertical height and other features of the deposited material. Silicon cantilevers (Tap 300 Al-G, Budget Sensors, Innovative Solutions Ltd, Bulgaria) with a 30 nm-thick aluminum reflex coating were used, with a spring constant range of 1.5–15 N/m and a resonance frequency of 150 ± 75 kHz. The tip radius was under 10 nm.
Before imaging, samples were thoroughly dried with N₂ gas. Scans were conducted at a scanning rate of 1 Hz, capturing images in both height and phase modes at 512 × 512-pixel resolution and saved in JPEG format. Multiple areas along the mica sheets were scanned, and all images were flattened using Nanoscope software (v.7.30). These imaging settings were consistently applied across all AFM experiments.
Figure 2 shows typical AFM images of PBCA nanoparticles deposited on the mica surface in 2D topography format, with a scanned area of 5 × 5 μm² and a z-scale of 300 nm (Figure 2a), where the arrangement of the polymer nanoparticles in the X-Y plane is clearly distinguishable.
In the other images, the scanned area along the XY-plane was reduced to 2 × 2 μm², and the images were presented in both 2D (Figure 2b) and 3D (Figure 2c) formats. The analysis of nanoparticle size was performed through section analysis across individual nanoparticles, measuring their diameters while considering a well-known artifact in AFM metrology known as the convolution (rounding) effect. This effect arises from the interaction between the AFM tip and the surface, as well as the size of the tip's radius of curvature [17]. The histogram for the size distribution and the average size of the nanoparticles derived from the section analysis is presented in Figure 2d. The estimated diameter of the PBCA nanoparticles was d = 200 nm, consistent with reported results from scanning electron microscopy (SEM) and dynamic light scattering (DLS) measurements [8].
Phospholipid monolayers at the water-air interface are convenient and well-defined biological membrane models [18]. They are formed after the spreading of phospholipids from their volatile organic solutions on a liquid surface in a Langmuir trough (Figure 3a).
Due to the thermal motion of phospholipid molecules that is constrained within the plane of the phospholipid monolayer at the air/water interface and the difference in the surface tensions of the liquid phase and that of the phospholipid monolayer, a surface pressure (π) arises. This is an experimentally measurable quantity and the main characteristic of the thermodynamic state of the monolayer. Hence, using the Langmuir trough, equipped with movable barriers, by controlling the area of the monolayer one can obtain the dependence of the surface pressure (π) versus the area per one phospholipid molecule (), i.e. surface pressure/area isotherm.
In Figure 3b (blue curve), a typical DPPC isotherm is presented. At the largest areas per molecule, the monolayer exists in a molecular state where individual DPPC molecules are separated by distances too great for any force interactions among them to occur. This thermodynamic state is considered a 2D gas. Further compression of the monolayer leads to the appearance of different phases or states, which depend on surface concentration (or surface pressure), temperature, and molecular structure. It is now generally accepted that a DPPC monolayer can exist in four distinct pure phases below the critical temperature (~ 40 °C): gas (G), liquid expanded (LE), liquid condensed (LC), and solid or crystalline (S) phases (monolayer states) [18]. From the π-A curve (Figure 3b) under these conditions, the area per phospholipid molecule can be determined; for a DPPC monolayer, this area is 49 Ų.
On the other hand, at the air-water interface between the two phases, the dipole moments of the phospholipid molecules remain partially uncompensated, resulting in a potential difference known as the Volta potential. This potential is defined as the work required to transfer a unit charge from infinity to the interface and equals the difference between the potentials of the water substrate and the monomolecular layer spread at the air-water interface. The Volta potential is proportional to the effective dipole density (μ) for an uncharged monolayer and represents the main electrical characteristic of the monolayer. In a continuum approximation, the Helmholtz equation gives:
where ε is the dielectric constant (assuming it is unity), n corresponds to the number of molecules at the surface (or the surface concentration Γ), and is the vertical component of the dipole moment of the molecules. Measuring ΔV when the area of the monolayer changes provides information about the change in the perpendicular component of the dipole moments of the phospholipid molecules, reflecting structural changes in the monolayer [19]. In Figure 3b (red curve), a typical surface potential versus area isotherm of the DPPC monolayer is also presented, where all states of the monolayer during compression are distinguishable, particularly the phase transition from G to L, which is undetectable on the surface pressure/area isotherm.
In this study, the isotherms of Pluronic F68 monolayers were measured. The monolayers were spread on a water subphase in a Langmuir film balance (KSV 2200, Finland) with a maximum available trough area of 476 cm². A Hamilton microsyringe was used to spread 10 μl of Pluronic F68 from a chloroform solution at the water interface. Both surface potential (ΔV) and surface pressure (Δπ) were simultaneously measured, as shown in Figure 3a. For surface potential measurements, the ionization method was employed, which required a gold probe coated with an emitter of 241Am (approximately 750 μCi) positioned above the surface, and a reference calomel electrode, both connected to the KP511 electrometer (Kriona, Bulgaria). Real-time data acquisition was managed by a personal computer equipped with user-specific hardware and software.
After the monolayer was spread, surface pressure initially fluctuated around 0.1 mNm-1 and stabilized after approximately 10–15 minutes. The monolayer was then compressed at a constant velocity of Ub = 50 cm2min-1. Under these conditions, the isotherms were highly reproducible.
During the reorganization and possible penetration of PBCA nanoparticles into the DPPC monolayer, both the increase in surface area (ΔA) and the evolution of surface potential (ΔV) over time (t) were simultaneously measured at a constant surface pressure (π). A "zero-order" Langmuir trough, containing a reaction compartment with an area of 50 cm² connected to a reservoir compartment (area 260 cm²) by a 0.5 cm wide channel, was utilized (Figure 3a).
After spreading over the maximum available area (A = 310 cm²), the DPPC monolayer was compressed at a constant velocity of Ub = 100 cm2min-1 to a set endpoint surface pressure, after which the barostatic mode was activated. Ten minutes later, 50 μL of PBCA nanoparticle dispersion was injected into the reaction compartment containing a 0.15 M NaCl solution. Due to the penetration of PBCA nanoparticles into the DPPC monolayer and their reorganization at the air/water interface, surface pressure increased, with the surface pressure barostat adjusting by barrier displacement, thereby altering the surface area (ΔA). The final concentration of PBCA in the reaction compartment was . The bulk in the reaction compartment was continuously stirred at 250 rpm using a magnetic rod, and the reservoir compartment’s aqueous subphase was also 0.15 M NaCl solution.
The monolayers were transferred from the air/water interface onto mica supports via Langmuir–Blodgett (LB) deposition. For this, the solid support was dipped vertically into the subphase and then moved upward through the monolayer. The mica plates were removed from the subphase approximately 50 minutes after the injection of the PBCA nanoparticles, at a transfer rate of 5 mm/min. Before AFM imaging, the LB film was thoroughly dried with a gentle nitrogen gas flow for about 10–15 minutes and then imaged as described above.
3. Results and Discussion
To investigate the states and properties of Pluronic F68 monolayers, a preliminary and essential experimental step involved performing isotherm measurements at the water/air interface at 25℃, using a 0.15 M NaCl solution as a substrate. The results obtained provide valuable information on the interfacial thermodynamic state of the monolayers under investigation and can also be confirmed and compared with previously published data [20].
Figure 4 presents the surface pressure/area isotherm (blue curve) and the surface potential/area isotherm (red curve) on the same graph. Observing the progression of the surface pressure/area isotherm during the compression of the Pluronic F68 monolayer, it appears that for areas between 8000 Ų/molecule and 6000 Ų/molecule, the monolayer remains in the gas phase. Within this range, both the surface pressure remains close to zero, and the surface potential remains steady around 250 mV. As the monolayer is further compressed past 6000 Ų/molecule, a slight increase in surface pressure is observed, becoming more pronounced near 2700 Ų/molecule, where the slope of the pressure curve steepens significantly.
Comparing this trend with the surface potential, it is evident that, between the areas of 6000 Ų/molecule and 2700 Ų/molecule, the surface potential increases due to the freedom of the polymer’s monomer units at the air/water interface, which affects the vertical component of the total dipole moment. Beyond areas of 2000 Ų/molecule, the slope of the surface pressure curve increases sharply, reaching up to 35 mNm-1. Further compression from an area of 2700 Ų/molecule indicates a condensed state of the monolayer, with an inflection point in the isotherm marking the close packing of monomer units. Past this, surface pressure drops sharply, corresponding to the monolayer’s collapse, resulting in the formation of 3D multilayer structures.
It can be concluded that the monolayer remains organized up to a surface pressure of around 10.5 mNm-1 and an area of 2700 Ų/molecule. Assuming equal surface areas for the EO and PO monomer units of Pluronic F68, the average area per monomer unit at the water/air interface can be estimated by dividing the closely packed area of 2700 Ų/molecule by the total 182 monomer units in F68, yielding approximately 14.8 Ų/monomer. This result aligns well with previous findings [20].
Figure 5 illustrates the changes in surface pressure (blue curve) and surface potential (red curve) over time for monolayers formed by spreading a suspension of PBCA nanoparticles stabilized with Pluronic F68 at the air/water interface. From the surface pressure vs. time graph, two distinct stages are observed: an initial rapid increase from 0.5 ± 0.2 mNm-1 to 1.3 ± 0.2 mNm-1 within the first 10 minutes, followed by a slower increase from 1.3 ± 0.2 mNm-1 to 1.8 ± 0.2 mNm-1 over the next 110 minutes. Similarly, in the surface potential vs. time graph, the potential initially rises from 200 ± 10 mV to 250 ± 10 mV within 10 minutes, remaining constant thereafter.
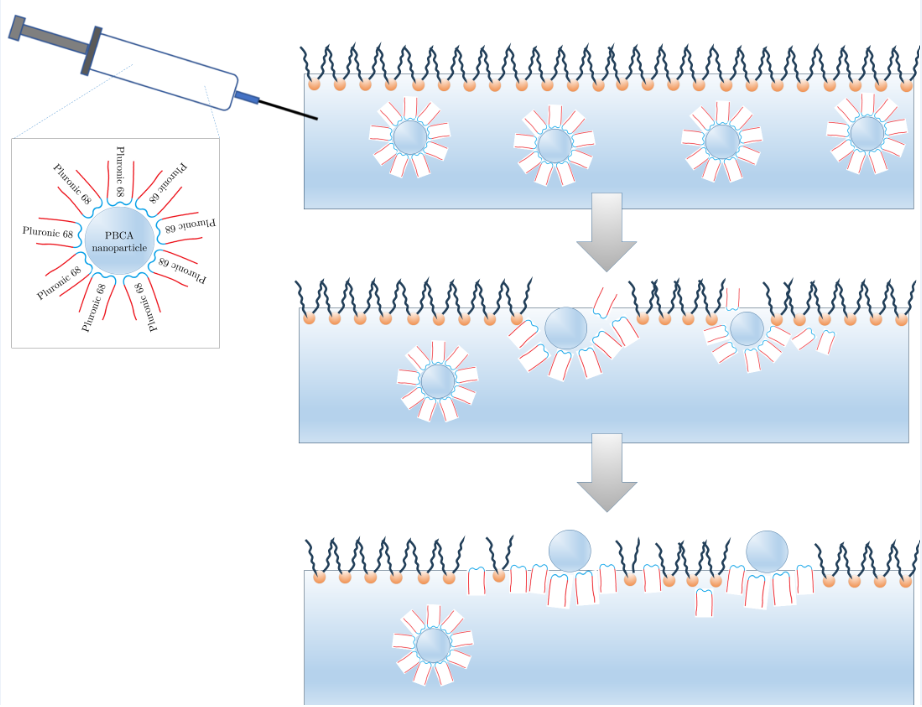
This kinetic behavior suggests two simultaneous processes following the spreading of the PBCA suspension: an irreversible diffusion of PBCA nanoparticles into the bulk liquid phase and a transformation at the air/water interface. In this second step, the nanoparticles adsorb, and as their Pluronic F68 shells disintegrate, they form a mixed monolayer of bare PBCA nanoparticles and Pluronic F68 molecules at the interface (Figure 5, the inset).
To further investigate the proposed mechanisms of molecular reorganization at the interface, we compared the behavior of a spread suspension of PBCA nanoparticles stabilized with Pluronic F68 to that of Pluronic F68 monolayers. These monolayers were compressed to specific surface pressures, held constant, and monitored for relative changes in area over time.
For instance, Figure 6 shows the relative surface area change over time for both spread PBCA nanoparticles (red curve) and the Pluronic F68 monolayer (blue curve) under barostatic conditions at π = 10 mNm-1. The Pluronic F68 monolayer, kept at this constant pressure, showed minimal solubility, with a slight decrease in the relative area to after 60 minutes. In contrast, the spread PBCA nanoparticle suspension, also compressed to π = 10 mNm-1, underwent interfacial reorganization, leading to significant increase in the relative monolayer area to under the same conditions.
These observations support the suggested molecular mechanism: upon spreading the PBCA dispersion, the interfacial layer likely comprises both the Pluronic molecules that originally formed the nanoparticle shells and the PBCA nanoparticles themselves.
The goal of the present study was to investigate the kinetics and mechanism of interactions of PBCA nanoparticles with a model membrane system, such as the Langmuir monolayer of DPPC, compressed to different states corresponding to specific surface pressures. Experimentally, the monolayer was compressed to a designated pressure, after which the barostat mode was activated. Once the target surface pressure was reached and held constant, a suspension of PBCA nanoparticles stabilized with Pluronic 68 was injected into the reaction compartment of the modified Langmuir trough.
Figure 7a presents the kinetic curves showing changes in relative monolayer area versus time for initial values of π = 5 mNm-1, π = 10 mNm-1, π = 15 mNm-1, and π = 20 mNm-1. From the kinetic curves for π = 5 mNm-1 and π = 10 mNm-1, the observed change in relative area can be formally divided into two phases. The first, characterized by a steeper curve slope, aligns with the accepted molecular model describing PBCA nanoparticle behavior at the air/water interface; it suggests that during this stage, the nanoparticles are adsorbed onto the monomolecular layer of DPPC. The second, slower stage reflects the gradual release and reorganization of Pluronic F68 molecules from the PBCA nanoparticle shells, followed by their incorporation into the monolayer.
Increasing the initial surface pressure leads to smaller relative area changes, indicating less Pluronic 68 penetration. At higher pressures (π = 15 mNm-1and π = 20 mNm-1), almost no change in monolayer surface area is observed. This result is consistent with the behavior observed during enzymatic hydrolysis of phospholipid monolayers by phospholipase A2 (PLA2), where enzyme activity ceases above a certain pressure due to the enzyme’s inability to penetrate a densely packed phospholipid monolayer [14].
In addition to tracking the monolayer area change over time, the ∆V potential was also measured as a function of time. The resulting curves for the respective initial surface pressures of the monolayer are shown in Figure 7b.
At all initial surface pressures, a sharp, jump-like change in potential was observed immediately after nanoparticle injection. This abrupt shift may result from monolayer perturbation during the injection, as surface potential is more sensitive to such disturbances compared to surface pressure. Additionally, it could be attributed to the rapid diffusion of PBCA nanoparticles toward the DPPC monolayer. The largest potential changes were observed at higher initial pressures (π = 15 mNm-1 and π = 20 mNm-1), with ∆V = 450 mV in both cases. At lower pressures (π = 5 mNm-1 and π = 10 mNm-1), ∆V values were 315 mV and 420 mV, respectively. Following these initial jumps, only a slight increase in surface potential was noted, likely due to monolayer reorganization. Notably, at π = 5 mNm-1, the surface potential increased from ∆V = 315 mV to approximately ∆V = 370 mV.
At the end of each experiment involving a DPPC monolayer, in which a suspension of PBCA nanoparticles stabilized with Pluronic 68 was injected into the aqueous support, the films from the water/air interface were vertically transferred to solid mica supports using the Langmuir-Blodgett (LB) method. These films were subsequently topographically scanned with atomic force microscopy (AFM) in semi-contact (tapping) mode.
Today, AFM is firmly established as a reliable method for studying the molecular organization of films obtained via the LB method. It provides valuable insights into the lateral organization of various monolayers and their interactions with biologically active molecules at the interface. The AFM visualization of surfaces transferred after the injection of the PBCA suspension corroborated the data obtained regarding changes in surface pressure and potential over time (Figure 7).
The AFM images presented in Figure 8 show the topography of the LB films, demonstrating different modes of reorganization and embedding of PBCA nanoparticles into the DPPC monolayers at four different pressures: π = 5 mNm-1, π = 10 mNm-1, π = 15 mNm-1, and π = 20 mNm-1. For example, at pressures of π = 5 mNm-1 and π = 10 mNm-1 (Figure 8a, b), some PBCA nanoparticles are observed integrated into the DPPC monolayer, while areas of the film exhibit distinguishable lateral organization. Since the DPPC monolayer at these pressures is either in a homogeneous liquid (L) state or at the boundary between the liquid (L) and liquid expanded (LE) states, regions of heterogeneous separation are not expected to be observed.
Therefore, the lighter areas observed in the AFM images (Figure 8 a, b) are likely composed of Pluronic 68 molecules that have been embedded in the DPPC monolayer and released from the PBCA nanoparticle shells. In contrast, the topography results for the films obtained at pressures of π = 15 mNm-1 and π = 20 mNm-1 (Figure 8 c, d), where the monolayer area shows minimal changes over time after the injection of the PBCA nanoparticle suspension, reveal only single nanoparticles on the imaged LB films, detectable primarily at the lower pressure. Furthermore, no significant alterations in the lateral organization of the LB films due to the penetration of Pluronic 68 molecules from the PBCA nanoparticle shells were observed.
4. Conclusions
To understand and elucidate the molecular mechanisms behind the interactions of PBCA nanoparticles stabilized with Pluronic 68, we investigated their penetration and reorganization properties upon injecting their suspension into the subphase of a preformed DPPC monolayer. This evaluation was conducted through measurements in a barostatic regime at different surface pressures, corresponding to various states of the DPPC monolayer.
First, we examined the state of the Pluronic F68 monolayer, which molecules form a shell around the PBCA nanoparticles and play a crucial role in these molecular processes. We measured surface pressure and surface potential versus area isotherms, estimating the area per molecule of Pluronic F68 and per monomer unit.
From the barostatic regime measurements of the relative surface area and surface potential changes over time following the spreading of the PBCA nanoparticle suspension, we proposed a molecular mechanism for their reorganization. The spreading of the nanoparticles exhibits two-stage kinetics: in the first stage, the nanoparticles undergo rapid adsorption at the interface, followed by a slower molecular reorganization that involves the disruption and release of the stabilizing Pluronic F68 shell.
We also utilized AFM to visualize the state of the DPPC at the completion of the kinetic process involving the penetration and reorganization of the PBCA nanoparticles. Future perspectives for elucidating the proposed mechanism and developing a quantitative model include conducting experiments with different suspension concentrations of PBCA nanoparticles and incorporating other experimental techniques, such as Brewster angle microscopy or epi-fluorescent microscopy [20].
Author Contributions
Conceptualization, G.Y. and K.B.; methodology, K.B.; validation, I.M., G.Y. and K.B.; formal analysis, I.M.; investigation, I.M. and G.Y.; resources, I.M.; data curation, I.M.; writing—original draft preparation, K.B.; writing—review and editing, G.Y.; visualization, I.M.; supervision, K.B. All authors have read and agreed to the published version of the manuscript.
Funding
This research received no external funding.
Conflicts of Interest
The authors declare no conflicts of interest.
References
- Geszke-Moritz, M.; Moritz, M. Biodegradable Polymeric Nanoparticle-Based Drug Delivery Systems: Comprehensive Overview, Perspectives and Challenges. Polymers 2024, 16, 2536. [Google Scholar] [CrossRef] [PubMed]
- Afzal, O.; Altamimi, A.S.A.; Nadeem, M.S.; Alzarea, S.I.; Almalki, W.H.; Tariq, A.; Mubeen, B.; Murtaza, B.N.; Iftikhar, S.; Riaz, N.; et al. Nanoparticles in Drug Delivery: From History to Therapeutic Applications. Nanomaterials 2022, 12, 4494. [Google Scholar] [CrossRef] [PubMed]
- Hsu, J.C.; Tang, Z.; Eremina, O.E.; Sofias, A.M.; Lammers, T.; Lovell, J.F.; Zavaleta, C.; Cai, W.; Cormode, D.P. Nanomaterial-Based Contrast Agents. Nat Rev Methods Primers 2023, 3, 30. [Google Scholar] [CrossRef]
- Zu, H.; Gao, D. Non-Viral Vectors in Gene Therapy: Recent Development, Challenges, and Prospects. AAPS J 2021, 23, 78. [Google Scholar] [CrossRef] [PubMed]
- The ADME Encyclopedia: A Comprehensive Guide on Biopharmacy and Pharmacokinetics; Talevi, A., Ed.; Springer: Cham, Switzerland, 2022; ISBN 978-3-030-84860-6.
- Wang, C.; Pan, C.; Yong, H.; Wang, F.; Bo, T.; Zhao, Y.; Ma, B.; He, W.; Li, M. Emerging Non-Viral Vectors for Gene Delivery. J Nanobiotechnol 2023, 21, 272. [Google Scholar] [CrossRef] [PubMed]
- Gao, S.; Xu, Y.; Asghar, S.; Chen, M.; Zou, L.; Eltayeb, S.; Huo, M.; Ping, Q.; Xiao, Y. Polybutylcyanoacrylate Nanocarriers as Promising Targeted Drug Delivery Systems. Journal of Drug Targeting 2015, 23, 481–496. [Google Scholar] [CrossRef] [PubMed]
- Yordanov, G.G.; Dushkin, C.D. Preparation of Poly(Butylcyanoacrylate) Drug Carriers by Nanoprecipitation Using a Pre-Synthesized Polymer and Different Colloidal Stabilizers. Colloid Polym Sci 2010, 288, 1019–1026. [Google Scholar] [CrossRef]
- Yordanov, G.G.; Bedzhova, Z.A.; Dushkin, C.D. Preparation and Physicochemical Characterization of Novel Chlorambucil-Loaded Nanoparticles of Poly(Butylcyanoacrylate). Colloid Polym Sci 2010, 288, 893–899. [Google Scholar] [CrossRef]
- Minkov, I.; Ivanova, Tz.; Panaiotov, I.; Proust, J.; Saulnier, P. Reorganization of Lipid Nanocapsules at Air–Water Interface. Colloids and Surfaces B: Biointerfaces 2005, 45, 14–23. [Google Scholar] [CrossRef] [PubMed]
- Minkov, I.; Ivanova, Tz.; Panaiotov, I.; Proust, J.; Saulnier, P. Reorganization of Lipid Nanocapsules at Air–Water Interface. Colloids and Surfaces B: Biointerfaces 2005, 44, 197–203. [Google Scholar] [CrossRef] [PubMed]
- Minkov, I.; Ivanova, Tz.; Panaiotov, I.; Proust, J.; Verger, R. Reorganization of Lipid Nanocapsules at Air–Water Interface. Colloids and Surfaces B: Biointerfaces 2005, 45, 24–34. [Google Scholar] [CrossRef] [PubMed]
- Ivanova, T.; Mircheva, K.; Balashev, K.; Minkov, I.; Saulnier, P.; Panaiotov, I. Interfacial Behavior of Lipid Nanocapsules Spread on Model Membrane Monolayers. Colloid Polym Sci 2014, 292, 1307–1318. [Google Scholar] [CrossRef]
- Mircheva, K.; Minkov, I.; Ivanova, Tz.; Panaiotov, I.; Proust, J.E.; Verger, R. Comparative Study of Lipolysis by PLA2 of DOPC Substrates Organized as Monolayers, Bilayer Vesicles and Nanocapsules. Colloids and Surfaces B: Biointerfaces 2008, 67, 107–114. [Google Scholar] [CrossRef] [PubMed]
- Orsi, D.; Guzmán, E.; Liggieri, L.; Ravera, F.; Ruta, B.; Chushkin, Y.; Rimoldi, T.; Cristofolini, L. 2D Dynamical Arrest Transition in a Mixed Nanoparticle-Phospholipid Layer Studied in Real and Momentum Spaces. Sci Rep 2015, 5, 17930. [Google Scholar] [CrossRef] [PubMed]
- Rojewska, M.; Skrzypiec, M.; Prochaska, K. Surface Properties and Morphology of Mixed POSS-DPPC Monolayers at the Air/Water Interface. Colloids and Surfaces B: Biointerfaces 2017, 150, 334–343. [Google Scholar] [CrossRef] [PubMed]
- Blackford, B.L.; Jericho, M.H.; Mulhern, P.J. A Review of Scanning Tunneling Microscope and Atomic Force Microscope Imaging of Large Biological Structures: Problems and Prospects. Scanning Microscopy 1991, 5, 907–918. [Google Scholar]
- Mohwald, H. Phospholipid and Phospholipid-Protein Monolayers at the Air/Water Interface. Annu. Rev. Phys. Chem. 1990, 41, 441–476. [Google Scholar] [CrossRef] [PubMed]
- Adamson, A.W.; Gast, A.P. Physical Chemistry of Surfaces; 6th ed.; Wiley: New York, 1997; ISBN 978-0-471-14873-9.
- Chang, L.-C.; Lin, C.-Y.; Kuo, M.-W.; Gau, C.-S. Interactions of Pluronics with Phospholipid Monolayers at the Air–Water Interface. Journal of Colloid and Interface Science 2005, 285, 640–652. [Google Scholar] [CrossRef] [PubMed]
Figure 1.
(a) Molecular structure of Pluronic F68, poly(ethylene oxide)-poly(propylene oxide)-poly(ethylene oxide) or shortly ; (b) Pluronic molecules adsorbing on the surface of PBCA nanoparticles and creating a shell around them.
Figure 1.
(a) Molecular structure of Pluronic F68, poly(ethylene oxide)-poly(propylene oxide)-poly(ethylene oxide) or shortly ; (b) Pluronic molecules adsorbing on the surface of PBCA nanoparticles and creating a shell around them.
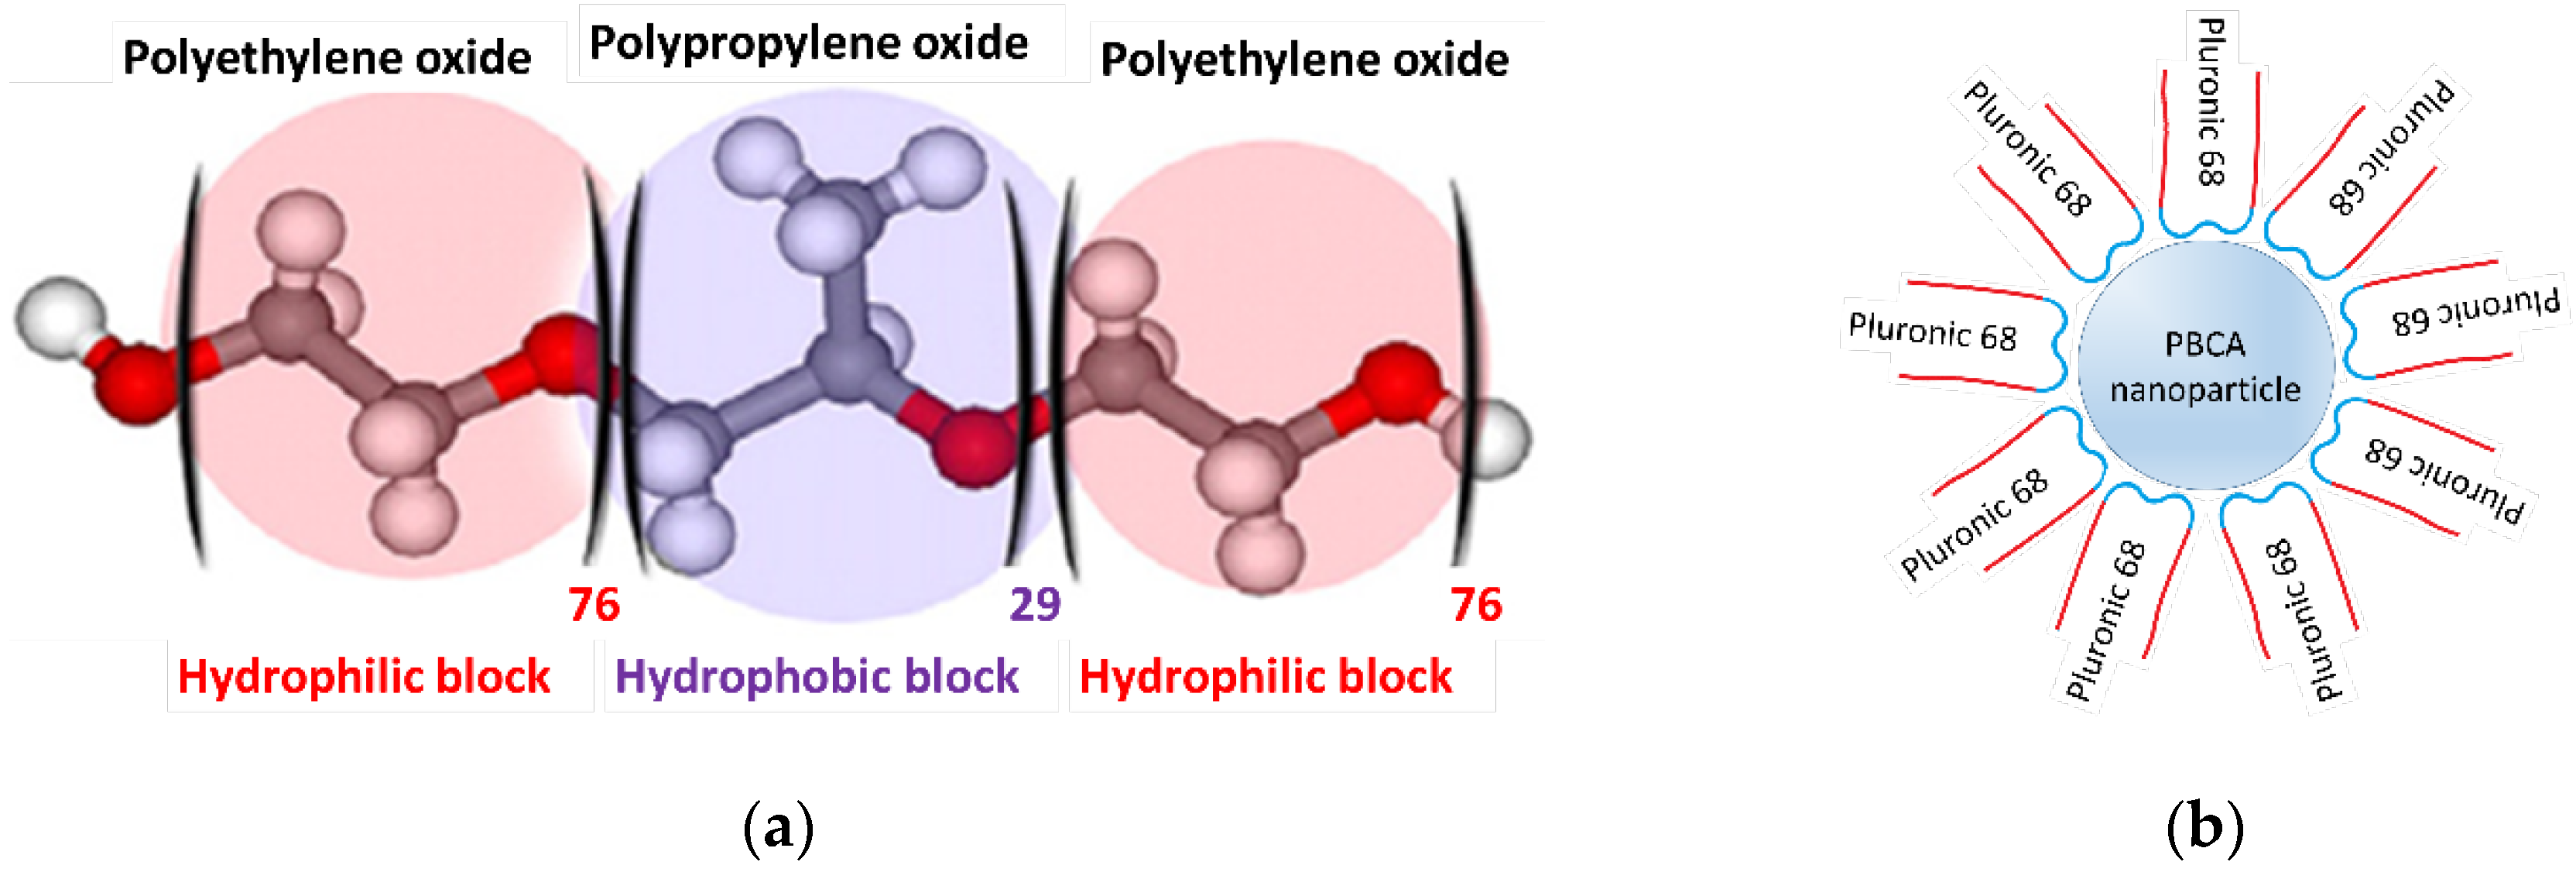
Figure 2.
AFM images of PBCA NPs deposited on freshly cleaved mica. (a) Scanned surface area- and scale at z= 300 nm (b) , z-scale is z= 250 nm and corresponding (c) 3d image of the surface (d) Histogram of the PBCA nanoparticles size distribution.
Figure 2.
AFM images of PBCA NPs deposited on freshly cleaved mica. (a) Scanned surface area- and scale at z= 300 nm (b) , z-scale is z= 250 nm and corresponding (c) 3d image of the surface (d) Histogram of the PBCA nanoparticles size distribution.
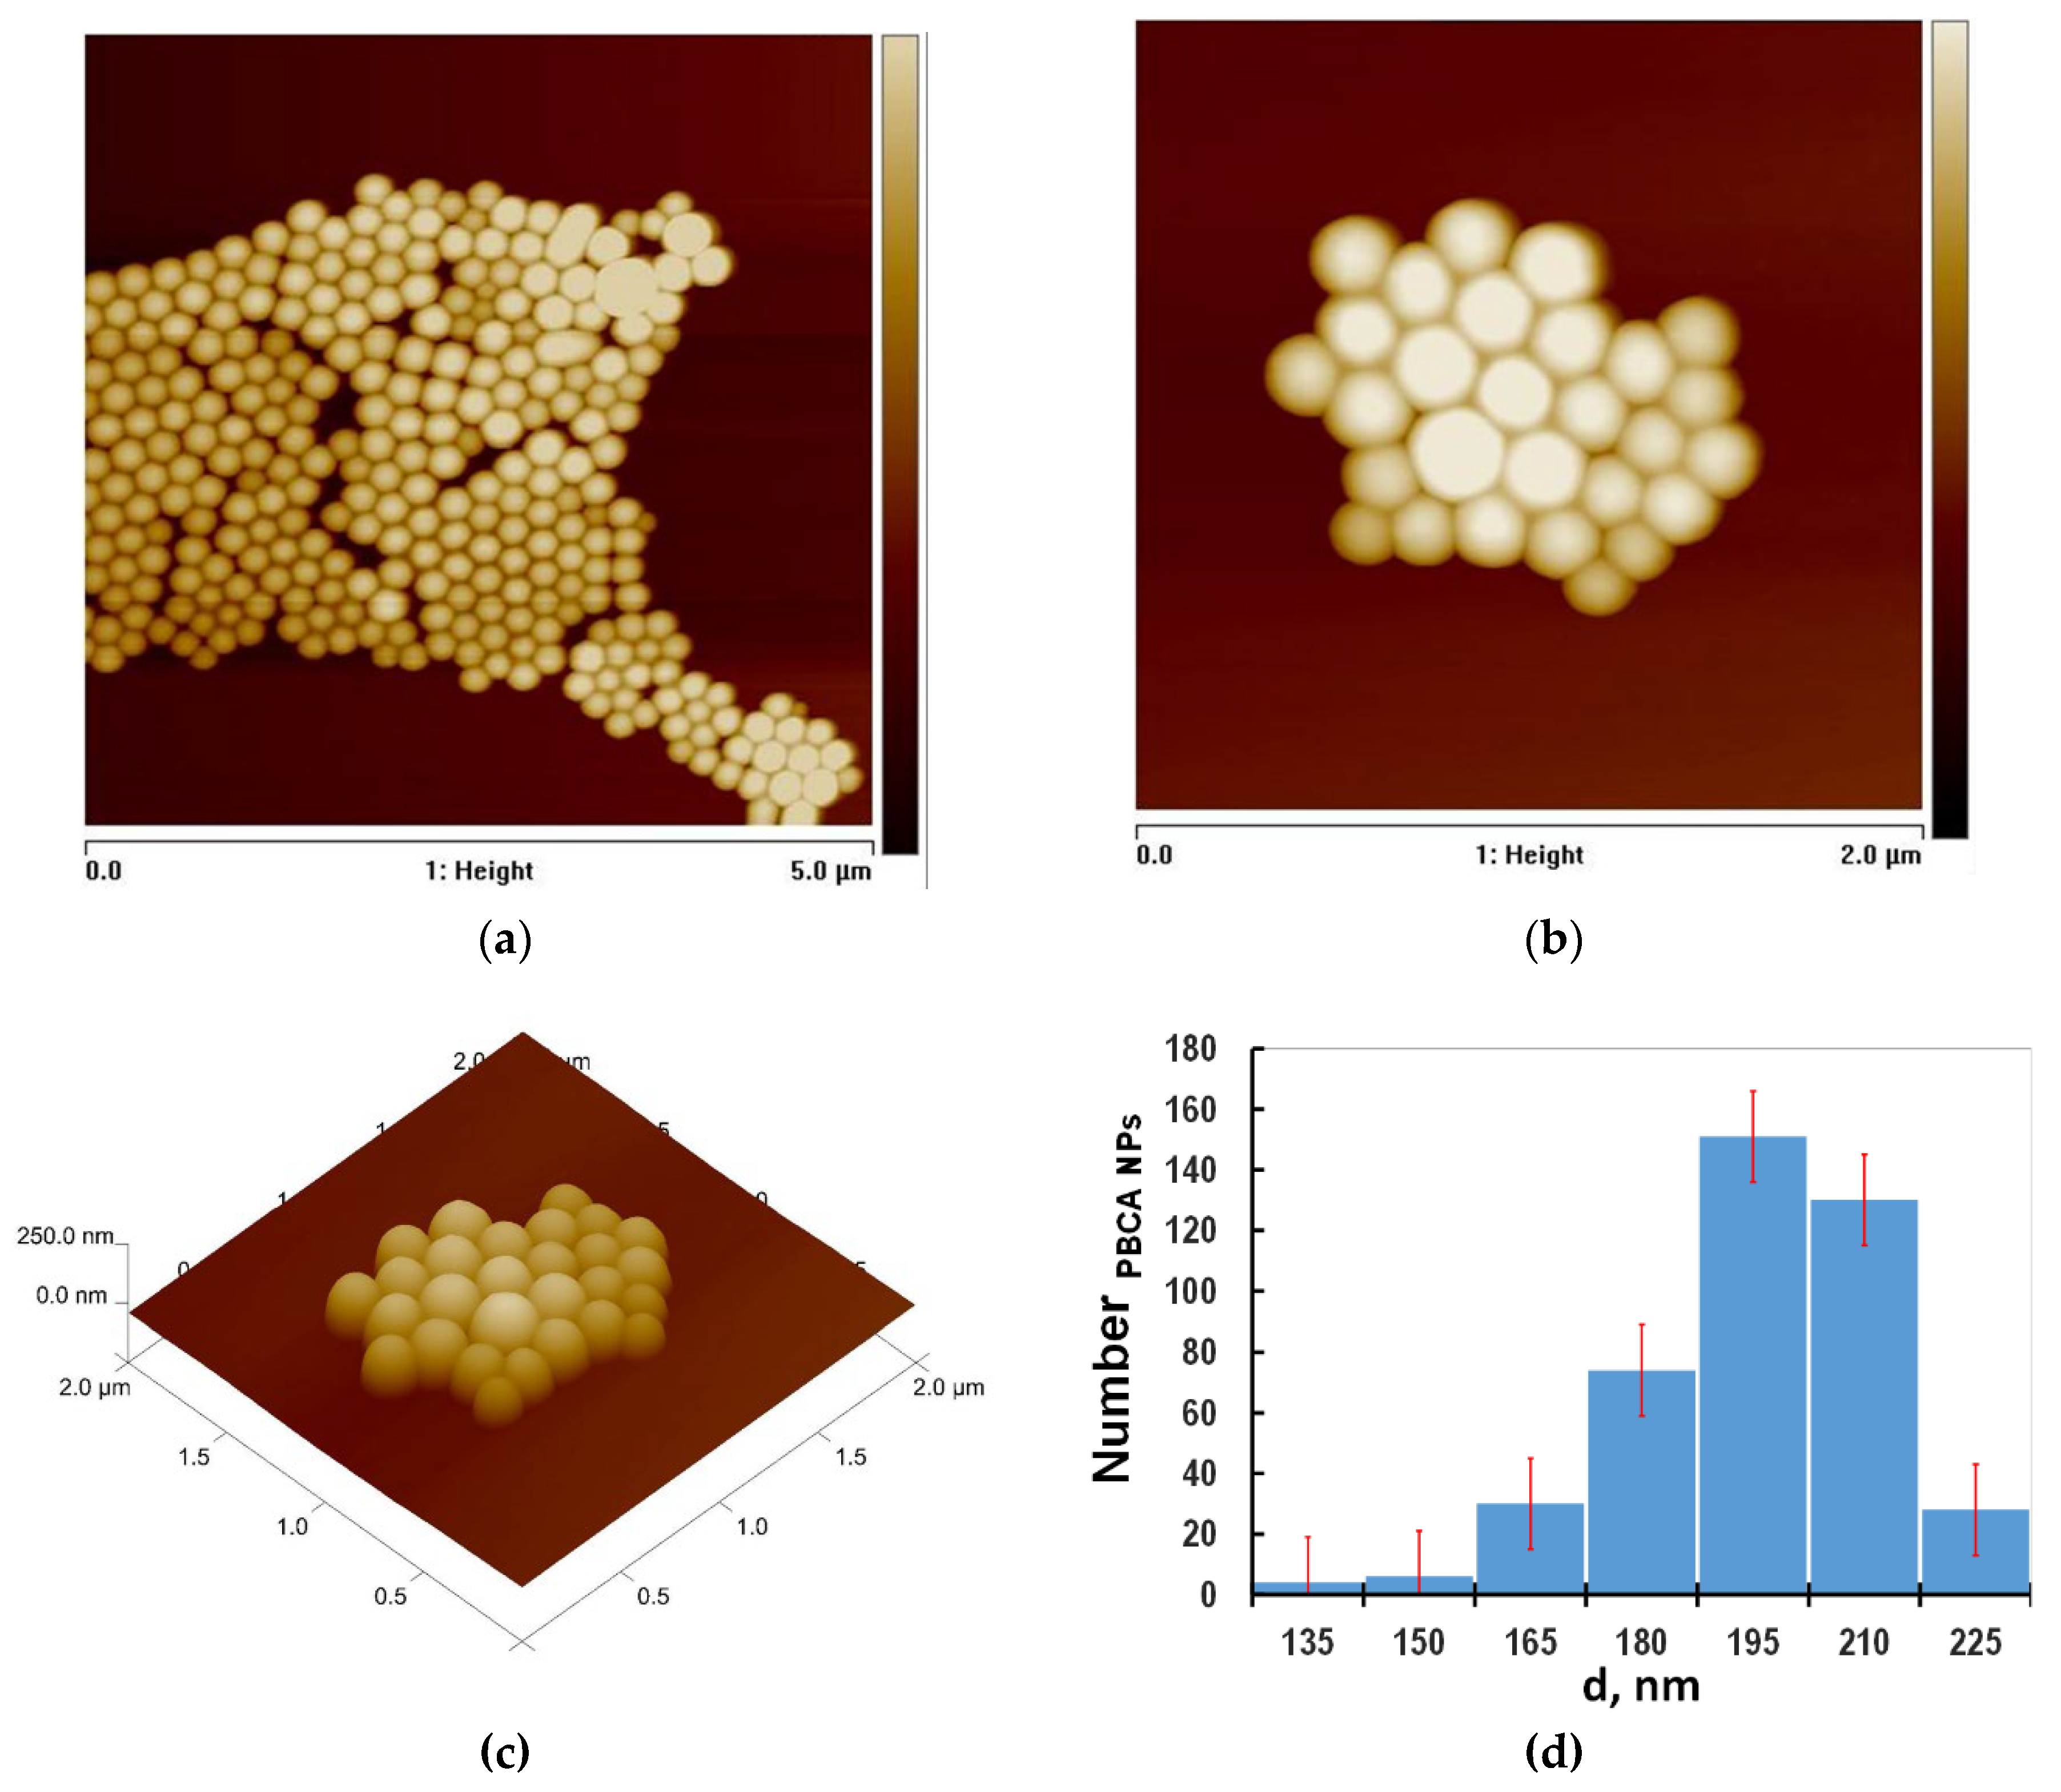
Figure 3.
(a) A modified Langmuir bath has a reaction compartment with area , that is interconnected with the reservoir compartment by two narrow channels. The surface pressure is measured by the Wilhelmy method and is kept constant by the feedback controller unit which regulates the trough’s barrier movement, so that π=const. (b) Surface pressure vs. Area (blue curve) and Surface potential vs. Area (red curve) isotherms. On both isotherms clearly are distinguished gaseous (G), liquid expanded (LE), liquid condensed (LC) and condensed states of DPPC monolayer as described elsewhere [18].
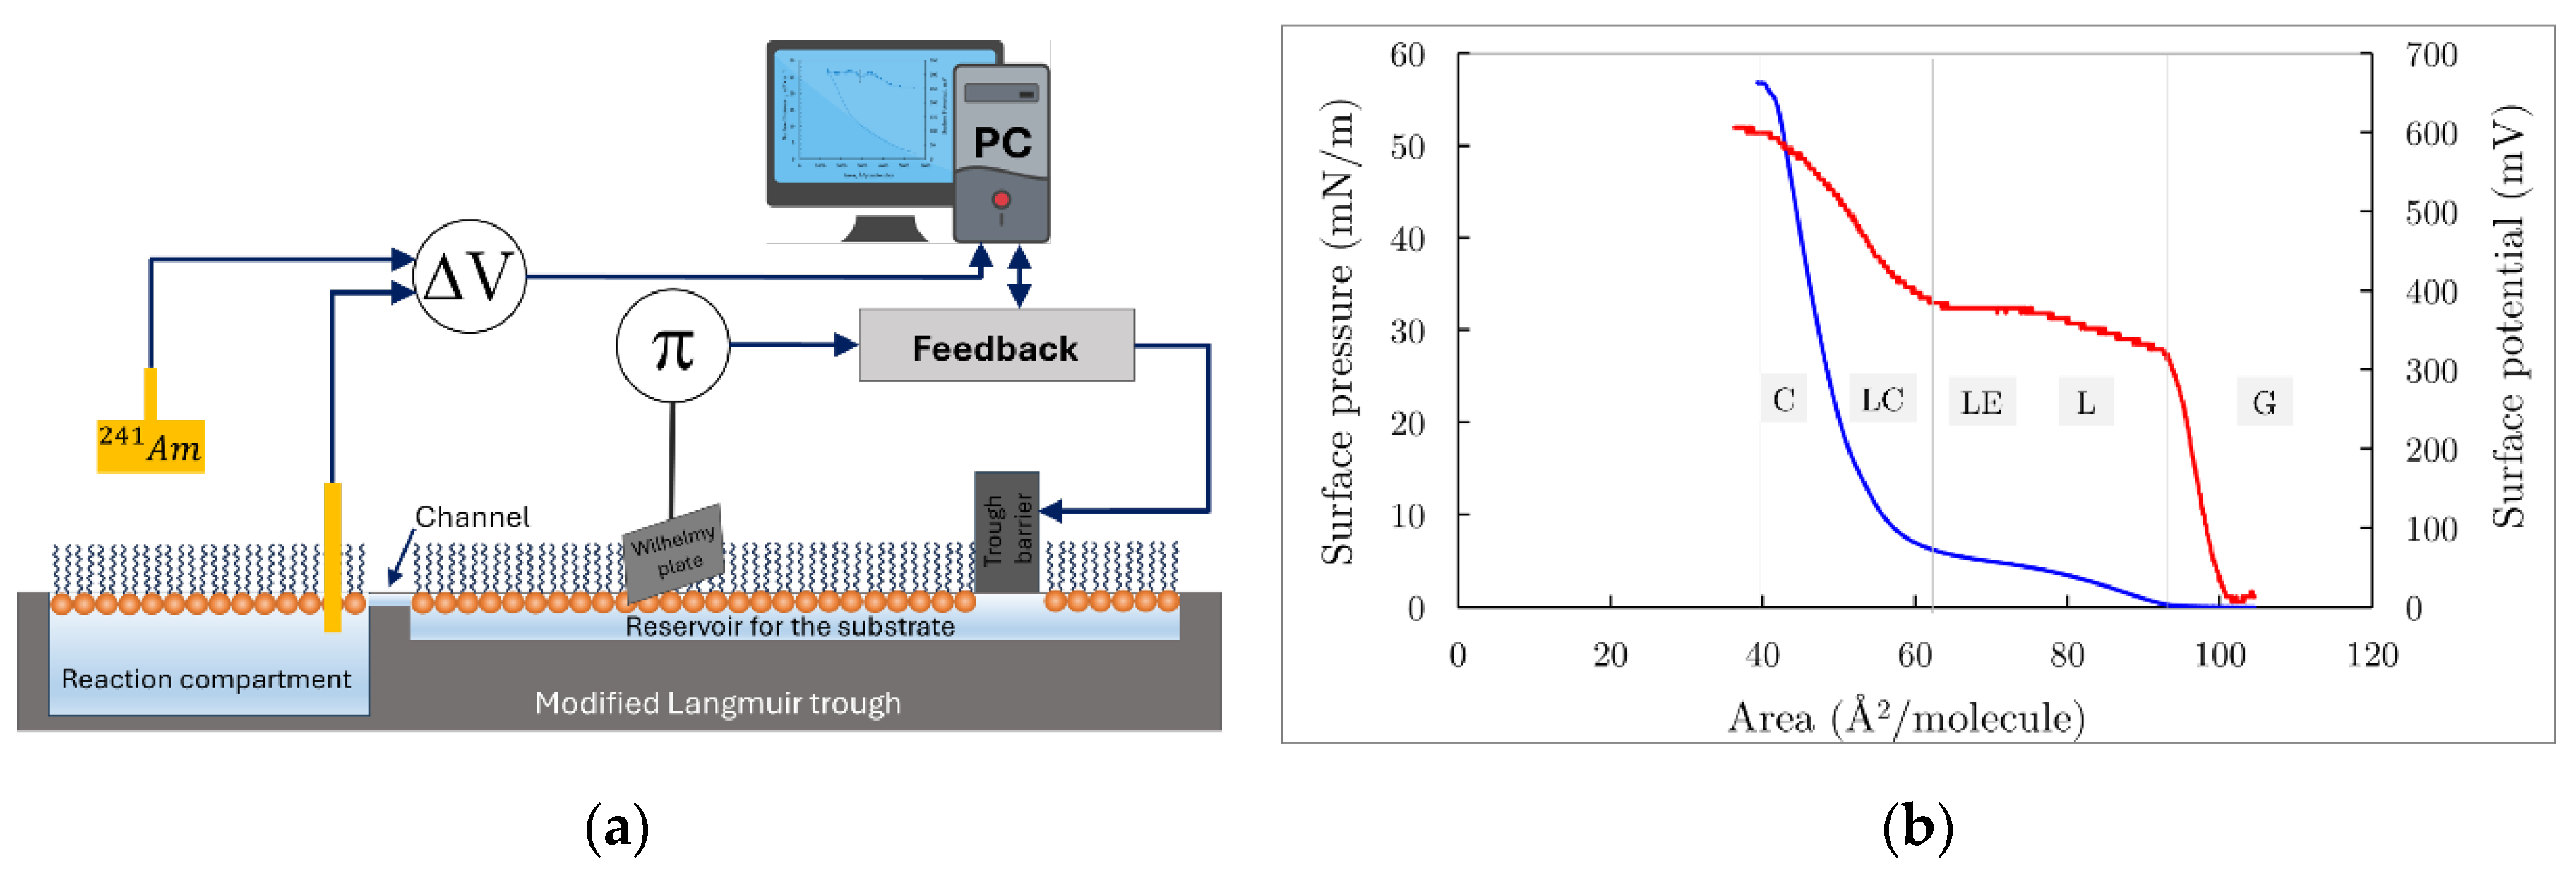
Figure 4.
The surface pressure–area (blue curve) and surface potential- area isotherms (red curve the secondary ordinate) isotherms of Pluronic F68 spread at the air/water interface. The arrow points to the area of 2700 Å2/molecule at which the molecules of Pluronic 68 monolayer are closely packed.
Figure 4.
The surface pressure–area (blue curve) and surface potential- area isotherms (red curve the secondary ordinate) isotherms of Pluronic F68 spread at the air/water interface. The arrow points to the area of 2700 Å2/molecule at which the molecules of Pluronic 68 monolayer are closely packed.
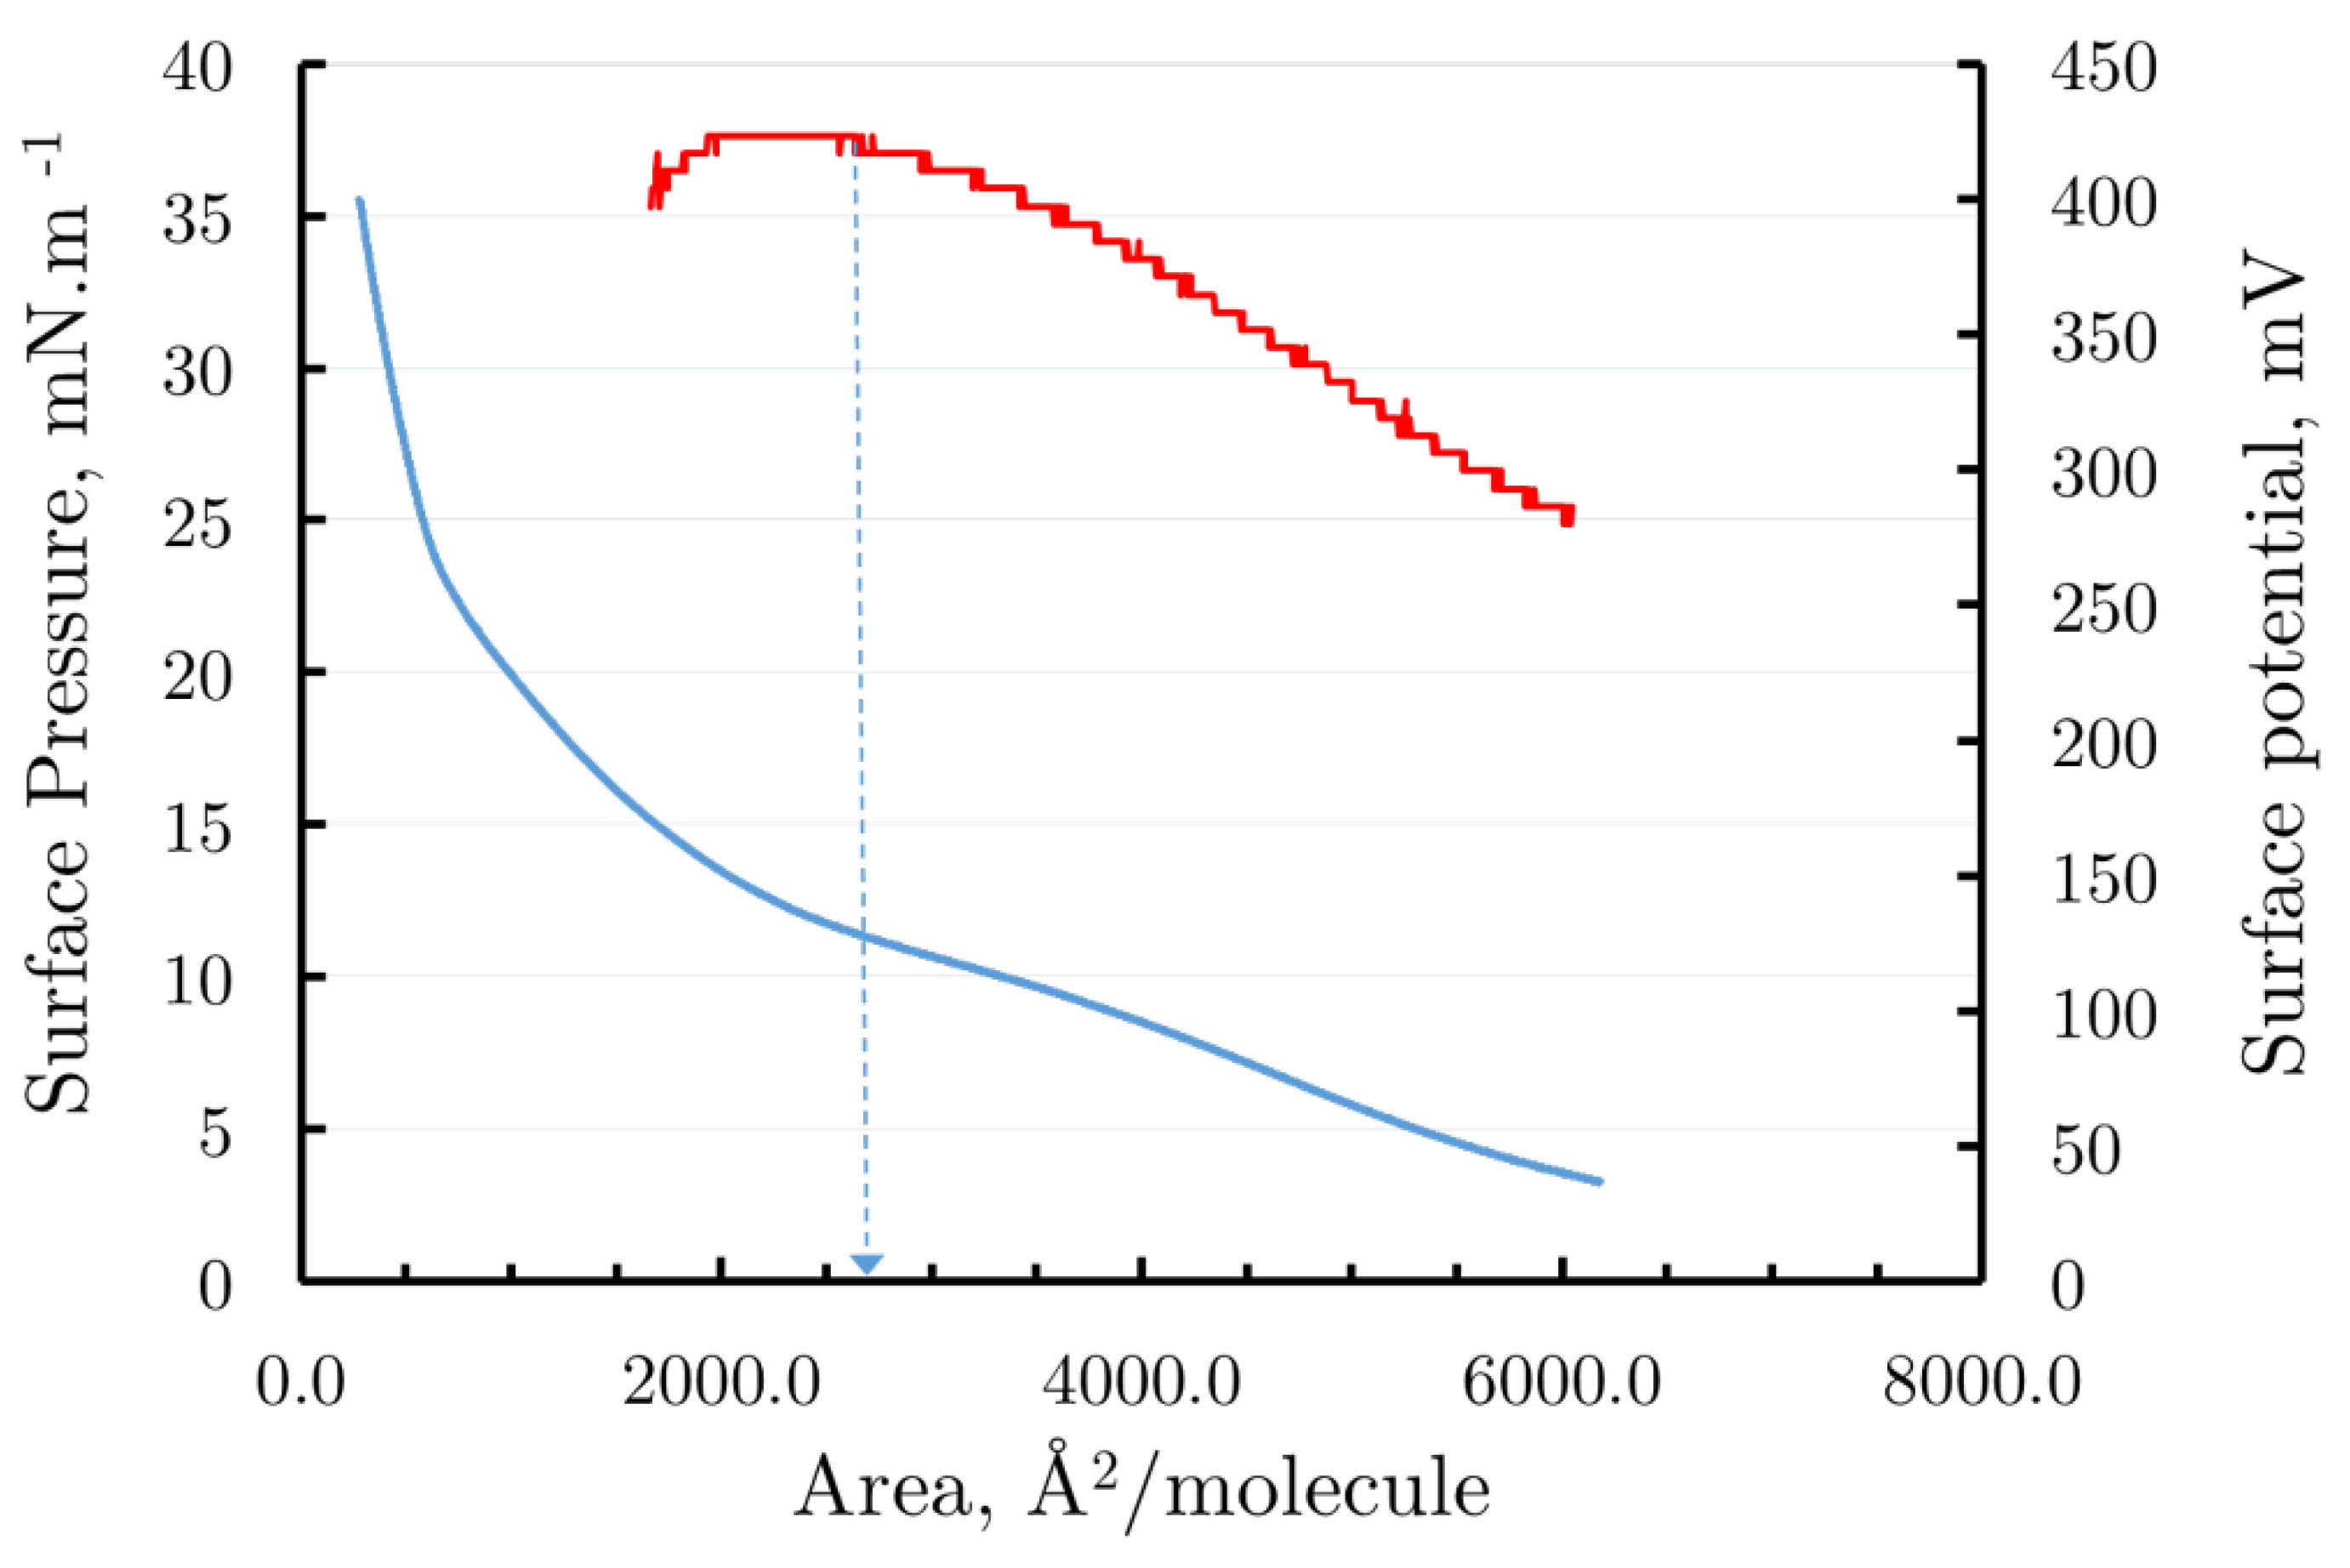
Figure 5.
Comparison of surface pressure changes vs time (blue curve) and surface potential vs. time (red curve, secondary ordinate) of PBCA nanoparticles spread at the air/water interface from water solution. The inset: Suggested molecular mechanism of the nanoparticles’ reorganization at the interface.

Figure 6.
Comparison of the change in relative monolayer of suspension of Pluronic 68 stabilized PBCA nanoparticles (red curve) and monolayer of Pluronic F68 (blue curve) versus in barostatic regime at constant surface pressure π = 10 mNm-1.
Figure 6.
Comparison of the change in relative monolayer of suspension of Pluronic 68 stabilized PBCA nanoparticles (red curve) and monolayer of Pluronic F68 (blue curve) versus in barostatic regime at constant surface pressure π = 10 mNm-1.
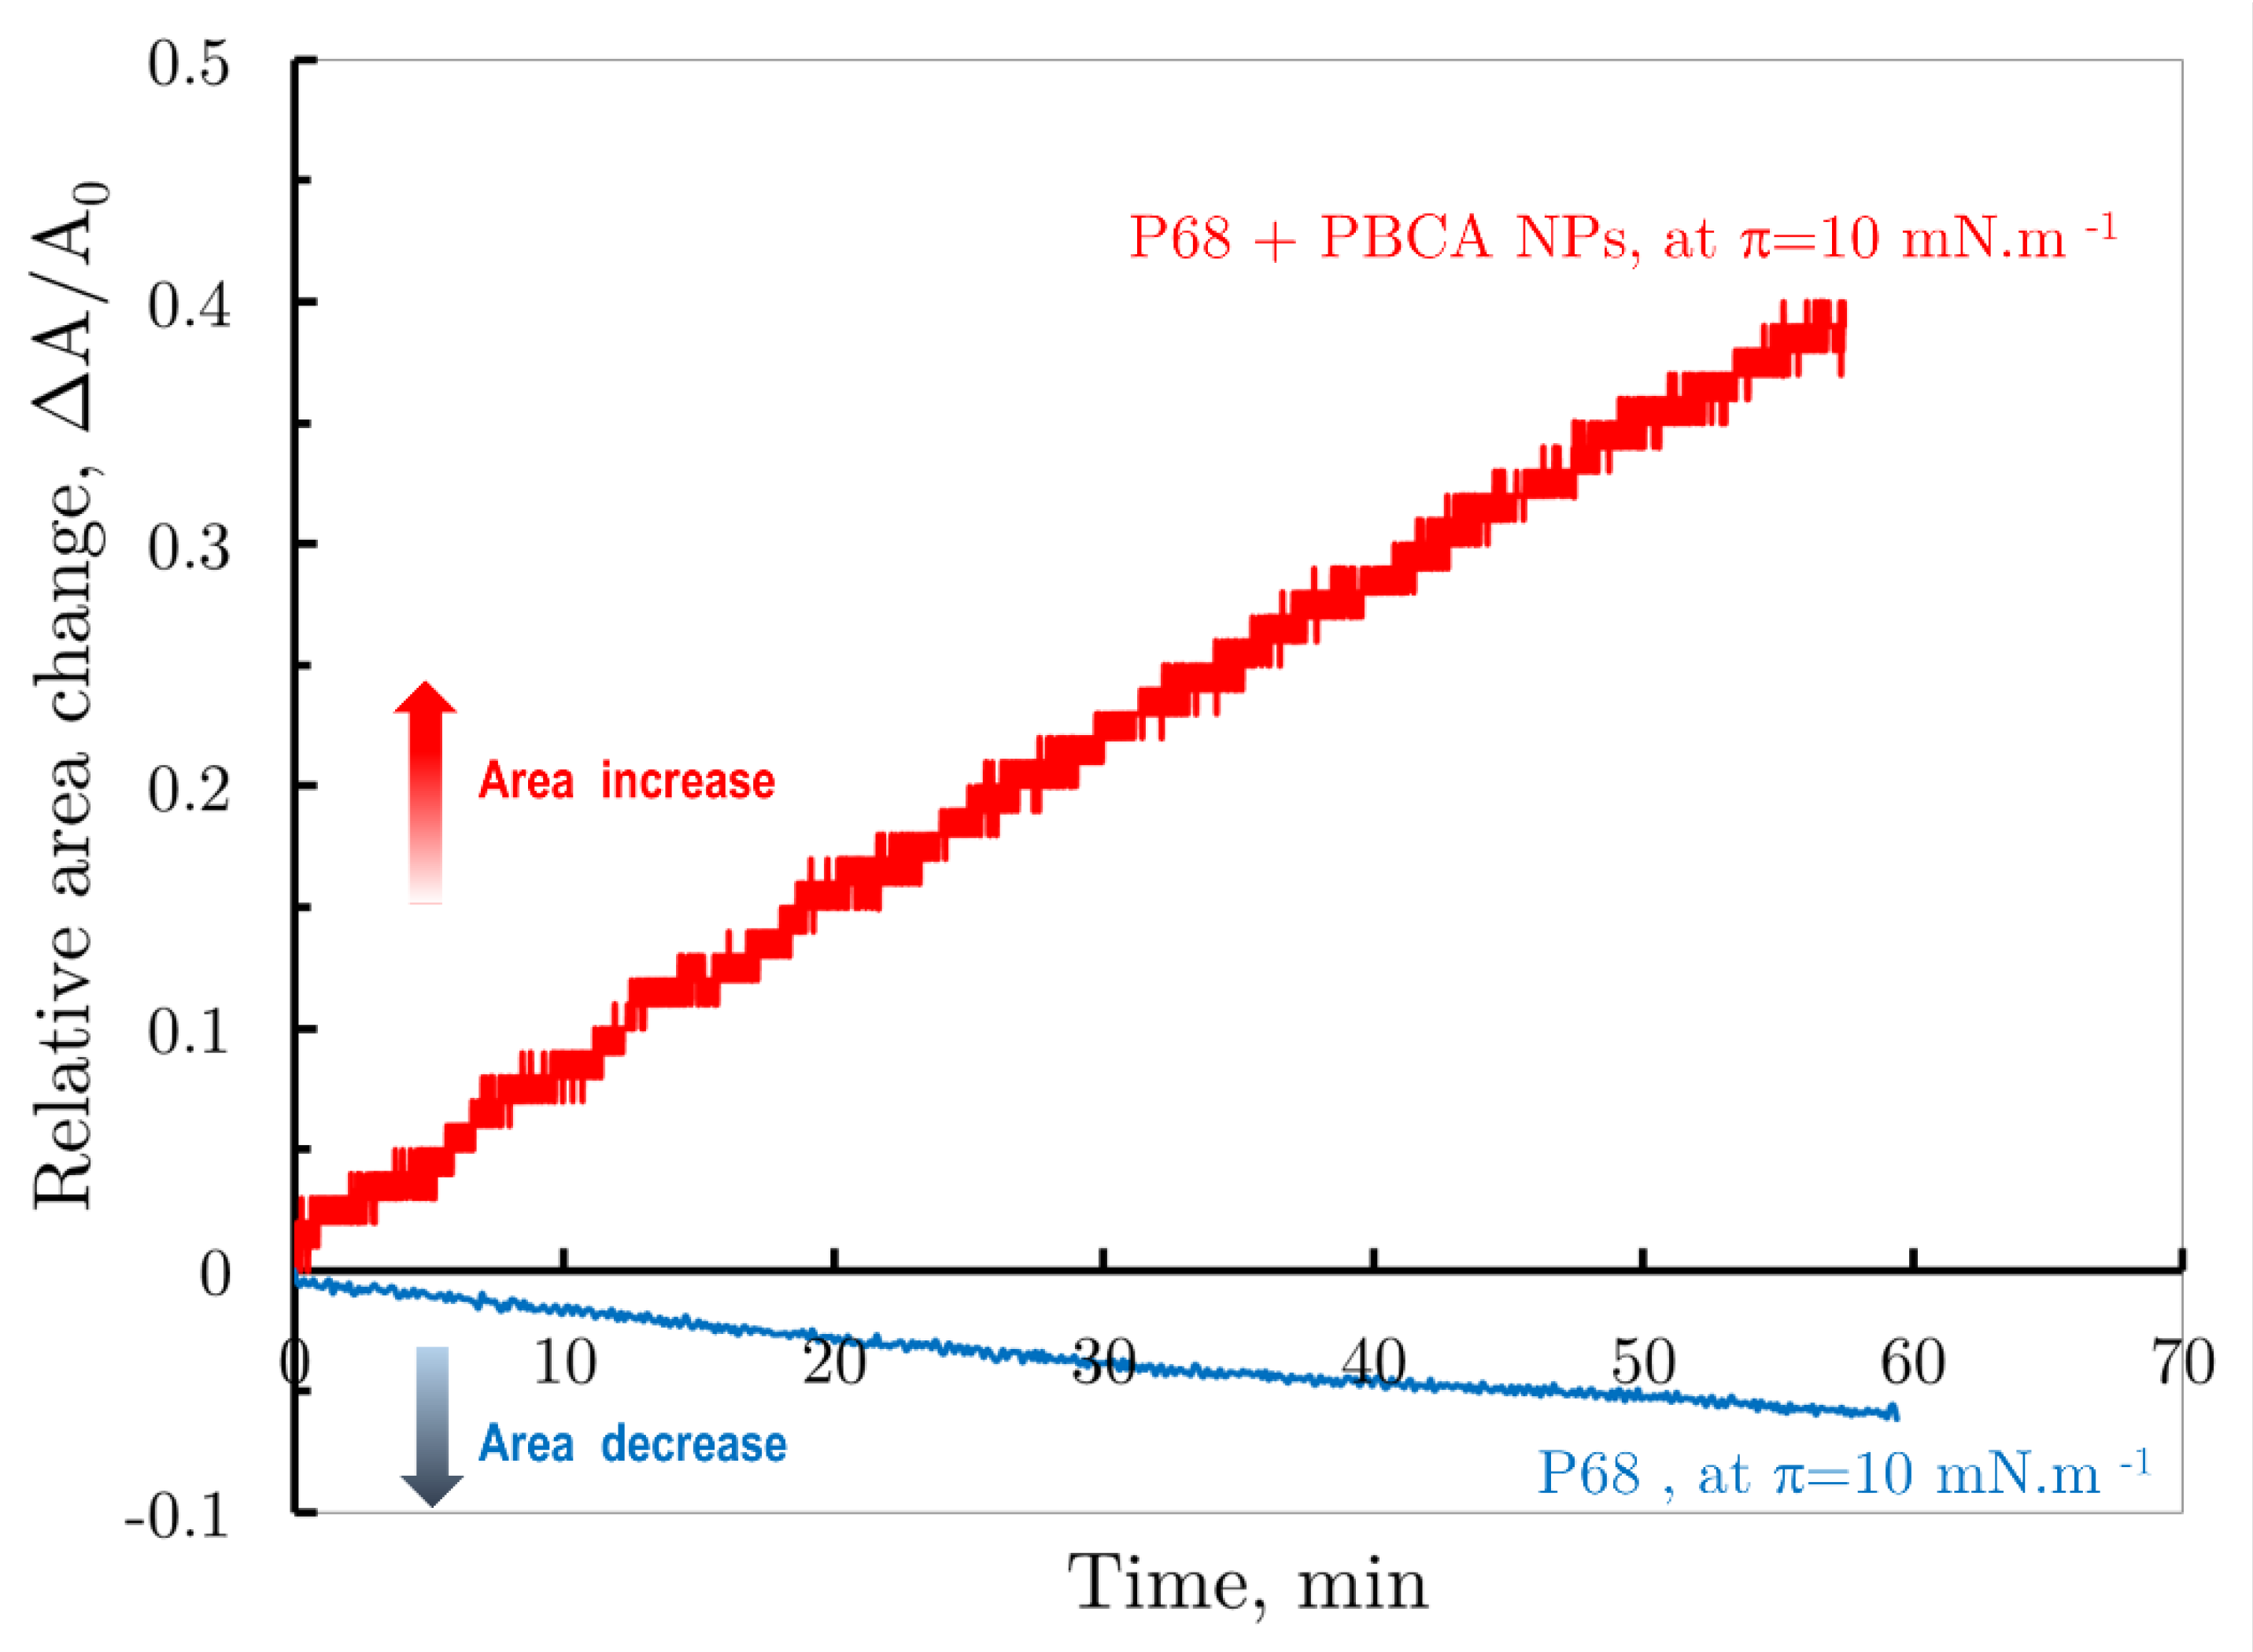
Figure 7.
(a) The relative area changes and (b) the change of Surface potential vs. tame of DPPC monolayers after injection of a PBCA nanoparticles suspension stabilized with Pluronic 68, in barostatic mode, at pressures π = 5 mNm-1, π = 10 mNm-1, π = 15 mNm-1 and π = 20 mNm-1, respectively.
Figure 7.
(a) The relative area changes and (b) the change of Surface potential vs. tame of DPPC monolayers after injection of a PBCA nanoparticles suspension stabilized with Pluronic 68, in barostatic mode, at pressures π = 5 mNm-1, π = 10 mNm-1, π = 15 mNm-1 and π = 20 mNm-1, respectively.
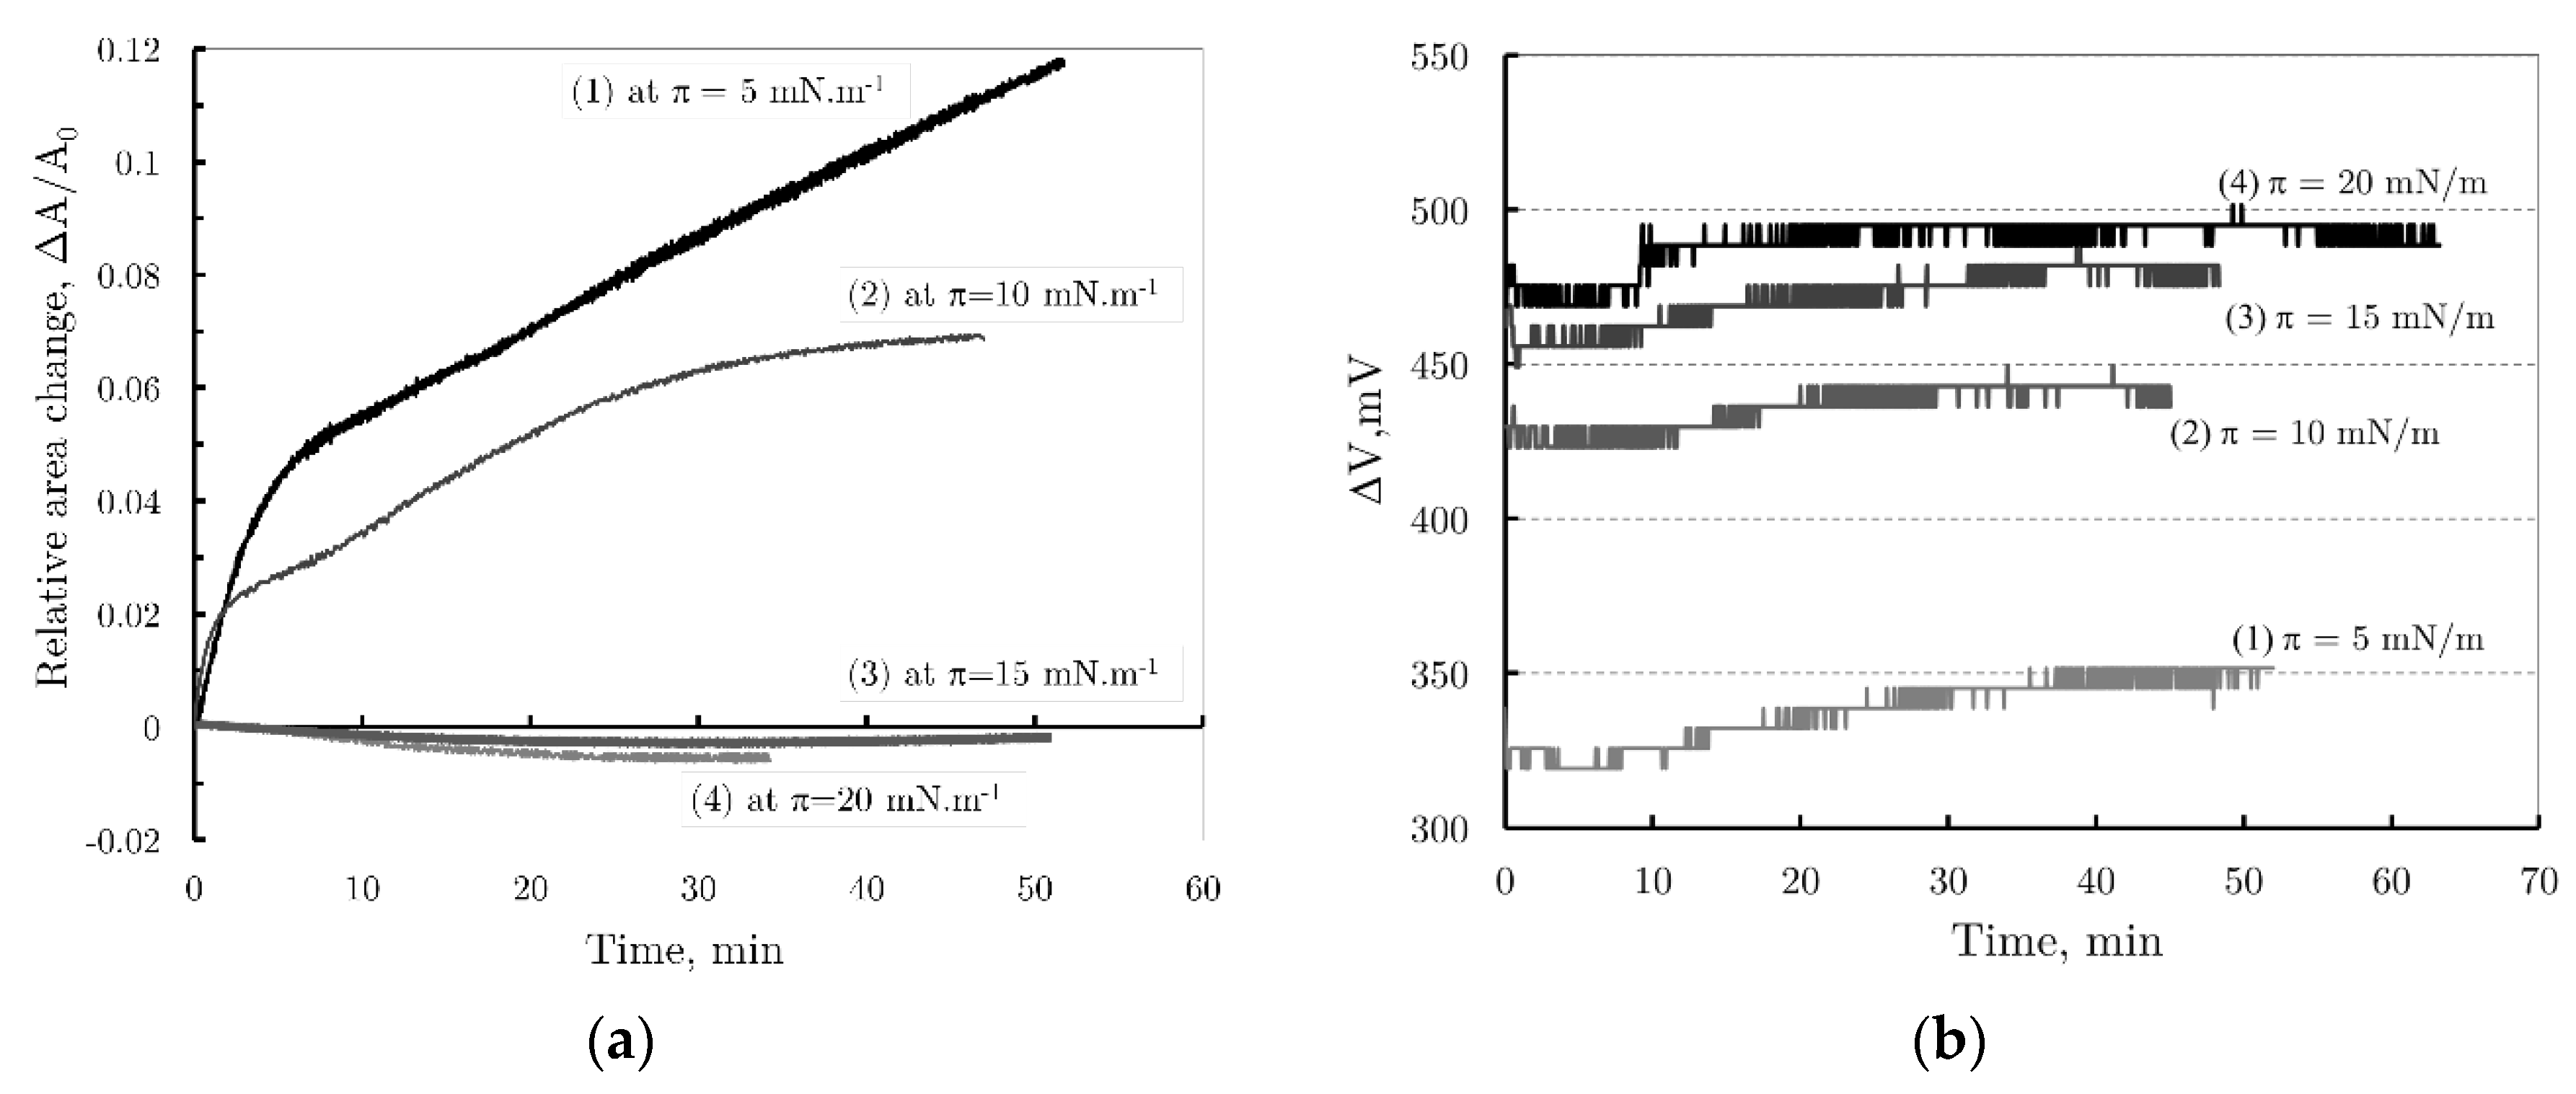
Figure 8.
AFM images in 2D format of the topography of LB films transferred at the end of the kinetic and processes of molecular reorganization that occurred after injection beneath the DPPC monolayer of suspension of PBCA nanoparticle at the initial surface pressures: (a) 5 mNm-1; (b) 10 mNm-1; (c) 15 mNm-1; (d) 20 mNm-1. All the scanned areas of the images are 3.3×3.3 μm2 and the z-range is 15 nm.

Disclaimer/Publisher’s Note: The statements, opinions and data contained in all publications are solely those of the individual author(s) and contributor(s) and not of MDPI and/or the editor(s). MDPI and/or the editor(s) disclaim responsibility for any injury to people or property resulting from any ideas, methods, instructions or products referred to in the content. |
© 2024 by the authors. Licensee MDPI, Basel, Switzerland. This article is an open access article distributed under the terms and conditions of the Creative Commons Attribution (CC BY) license (http://creativecommons.org/licenses/by/4.0/).
Copyright: This open access article is published under a Creative Commons CC BY 4.0 license, which permit the free download, distribution, and reuse, provided that the author and preprint are cited in any reuse.


