Submitted:
30 October 2024
Posted:
31 October 2024
You are already at the latest version
Abstract
Keywords:
1. Introduction
2. Materials and Methods
3. Data Audit and Preparation
3.1. Data Availability
- Compressional velocity (DTCO)
- Gamma ray log, bulk density, and neutron porosity
- Formation evaluation logs (PHIE, PHIT, and VCL)
- Formation pressure data (DST)
- Leak-off test data (LOT)
- Top formation
- Daily drilling reports (DDR)
- Caliper
3.2. Well Data
3.2.1. Logs Data
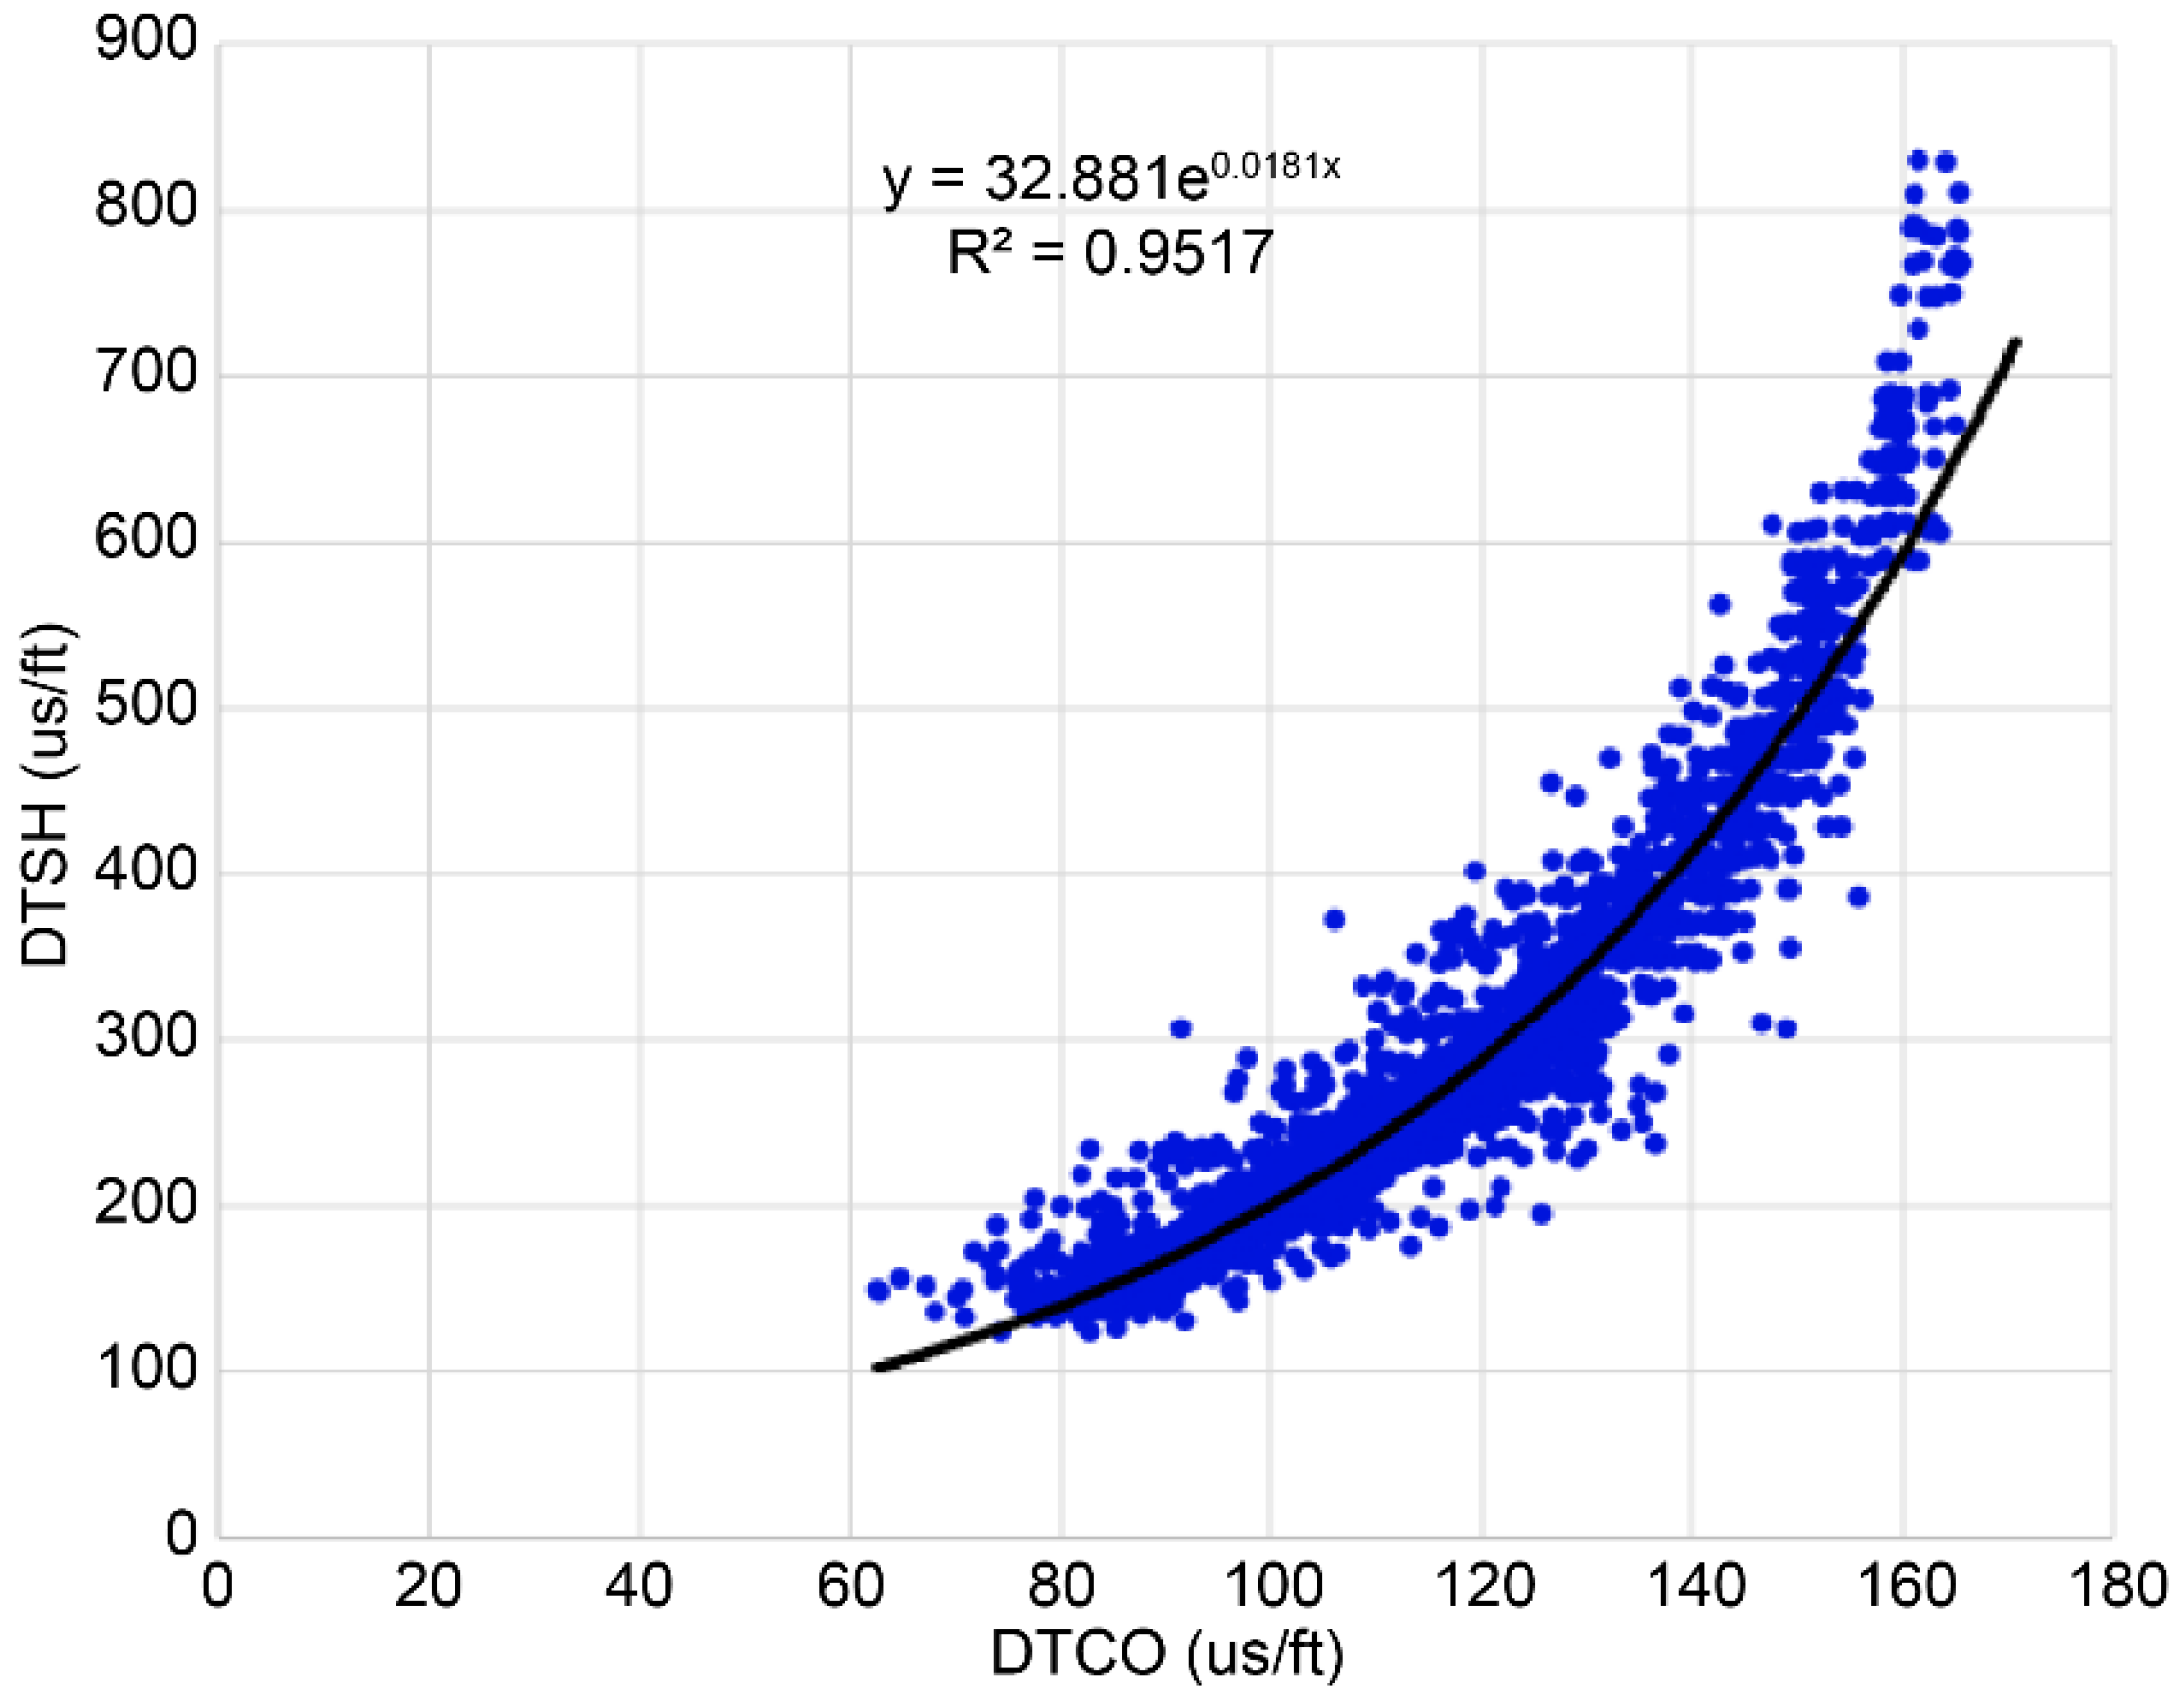
- Linear Relationship: There is a strong linear relationship between shear velocity and compressional velocity, as indicated by the trend line on the graph.
- Equation: The equation of the trend line is with a coefficient of determination . This indicates that 95.17% of the variation in shear velocity can be explained by the variation in compressional velocity.
- Synthetic Data: Shear velocity is not directly measured but synthesized using the correlation between shear velocity and compressional velocity.
- Limitations: No direct measurements of sonic shear velocity are available for comparison with synthetic data.
3.2.2. Drilling Events Review
4. Conclusions
Author Contributions
Funding
Data Availability Statement
Conflicts of Interest
References
- Darvishpour, A.; Seifabad, M. cheraghi, Wood, D. A., and Ghorbani, H. Wellbore stability analysis to determine the safe mud weight window for sandstone layers. J Petrol Explor Prod Technol 2019, 46. [CrossRef]
- Permana, B.R.; Darmadi, Y.; Hamid, F.; Faisal, A.; Tejo, B.; Tupamahu, L.E. Development well drilling with sacrificial drill pipe completion in fracture basement reservoir: Case study from a field in corridor block, South Sumatra Basin Indonesia/IATMI Asia Pacific Oil and Gas Conference and Exhibition, APOG 2019; Society of Petroleum Engineers (SPE), 2019. [CrossRef]
- Breitfeld, H.T.; Hall, R. The eastern Sundaland margin in the latest Cretaceous to Late Eocene: Sediment provenance and depositional setting of the Kuching and Sibu Zones of Borneo. Gondwana Res 2018, 63, 34–64. [Google Scholar] [CrossRef]
- Haris, A. Time reverse modeling of hydrocarbon detection for passive seismic source localization: A case study of synthetics and real data from the South Sumatra Basin, Indonesia. Int J GEOMATE 2017, 13, 185–190. [Google Scholar] [CrossRef]
- Lunt, P. The origin of the east Java Sea basins deduced from sequence stratigraphy. Mar Petrol Geol 2019, 105, 17–31. [Google Scholar] [CrossRef]
- Granado, P.; Ruh, J.B.; Santolaria, P.; Strauss, P.; Muñoz, J.A. Stretching and contraction of extensional basins with pre-rift salt: A numerical modeling approach. Front Earth Sci 2021, 9. [Google Scholar] [CrossRef]
- Bartha, A.; Balázs, A.; Szalay, Á. New insights into the Tectono-stratigraphic evolution and hydrocarbon systems of the Pannonian Basin: A 2D basin modeling study. Acta Geod Geophys 2021, 11349. [Google Scholar] [CrossRef]
- Liu, Z.; Li, S.; Suo, Y.; Bukhari, S.W.H.; Ding, X.; Zhou, J.; Wang, P.; Cheng, H.; Somerville, I. Evolution of pull-apart basins with overlapping NE-trending strike-slip fault systems in the northern South China Sea margin: Insight from numerical modeling. Tectonophysics 2023, 846, 229679. [Google Scholar] [CrossRef]
- Liu, H.; Cui, S.; Meng, Y.; Li, Z.; Yu, X.; Sun, H.; Zhou, Y.; Luo, Y. Rock mechanics and wellbore stability of deep shale during drilling and completion processes. J Petrol Sci Eng 2021, 205, 1–13. [Google Scholar] [CrossRef]
- Tappi, N.; Cherdasa, J.R. 1D geomechanical model for wellbore stability in Z Field, Y Well Sanga Sanga working area, Kutai Basin. J Geoscience Eng Environ Technol 2023, 8, 72–84. [Google Scholar] [CrossRef]
- Mohamadi, H.J.; Mosaddegh, H.; Azizzadeh, M.; Sarkheil, H. Determination of safe mud weight window and optimal drilling path in the Gadwan formation using rock failure criteria to minimize drilling challenges in one of the hydrocarbon fields in southwest Iran. J Petrol Geomech (JPG) 2023, 6. [Google Scholar] [CrossRef]
- Guerra, C.; Fischer, K.; Henk, A. Stress prediction using 1D and 3D geomechanical models of a tight gas reservoir—A case study from the Lower Magdalena valley Basin, Colombia. Geomech Energy Environ 2019, 19. Available online: http://www.elsevier.com/locate/gete. [CrossRef]
- Noohnejad, A.; Ahangari, K.; Goshtasbi, K. Integrated mechanical earth model and quantitative risk assessment to successful drilling. J Petrol Explor Prod Technol 2021, 11, 219–231. [Google Scholar] [CrossRef]
- Brata, R.A.; Mahardi, M.Y.; Anis, A.S.L.; Bahesti, F. Geomechanics wellbore stability analysis in successful drilling of A challenging HPHT exploration well in north Sumatra. Indonesia Petrolum Assciation; Vol. 18, 2022. Available online: https://www.scribd.com/document/592461723/04-Geomechanics-Wellbore-Stability-Analysis-In-Successful-Drilling-Of-A-Challenging-Hpht-Exploration-Well-In-North-Sumatra. [CrossRef]
- Abbas, A.K.; Flori, R.E.; Alsaba, M. Geomechanical modeling and wellbore stability analysis approach to plan deep horizontal wells across problematic shale formation geomechanical modeling and wellbore stability analysis approach to plan deep horizontal wells across problematic formations. Unconventional Resources Technology Conference, 2018. [CrossRef]
- Bashir, M.N.; Naseer, M.N.; Quazi, M.M.; Wakeel, M.S.; Ali, I.; Soudagar, M.E.M.; Bhatti, J. Systematic review of drilling problems and their solutions in petroleum engineering. Journal of ICT, Design. J Eng Technol Sci (JITDETS) 2021, 5, 1–16. [Google Scholar] [CrossRef]
- Kianoush, P.; Mohammadi, G.; Hosseini, S.A.; Keshavarz Faraj Khah, N.; Afzal, P. Determining the drilling mud window by integration of geostatistics, intelligent, and conditional programming models in an oil field of SW Iran. J Petrol Explor Prod Technol 2023, 13, 1391–1418. [Google Scholar] [CrossRef]
- Aird, P. Deepwater Drilling Well Planning, Design, Engineering, Operations, and Technology Application; Gulf Professional Publishing, 2019.
- Oloruntobi, O.S. The pore pressure, bulk density and lithology prediction Doctor of Philosophy Faculty of Engineering and Applied Science (Memorial University of Newfoundland), 2019. Available online: https://www.minsal.cl/wp-content/uploads/2019/01/2019.01.23.
- Radwan, A.E. Drilling in complex pore pressure regimes: Analysis of wellbore stability applying the depth of failure approach. Energies 2022, 15. [Google Scholar] [CrossRef]
- Prankada, M.; Yadav, K.; Sircar, A. Analysis of wellbore stability by pore pressure prediction using seismic velocity. Energy Geosci 2021, 2, 219–228. [Google Scholar] [CrossRef]
- Bukowska, M.; Kasza, P.; Moska, R.; Jureczka, J. The Young’s modulus and Poisson’s ratio of hard coals in laboratory tests. Energies 2022, 15. [Google Scholar] [CrossRef]
- Javani, D.; Aadnoy, B.; Rastegarnia, M.; Nadimi, S.; Aghighi, M.A.; Maleki, B. Failure criterion effect on solid production prediction and selection of completion solution. J Rock Mech Geotech Eng 2017, 9, 1123–1130. [Google Scholar] [CrossRef]
- Cerón, K.L.P.; Surjono, S.S.; Indrawan, I.G.B. Estimation of rock mechanical parameters using well log data in the well Poseidon 1, Lower Cretaceous, Browse Basin, northwest shelf, estimation of rock mechanical parameters using well log data in the well Poseidon 1, Lower Cretaceous, Browse Basin. IOP Conf S Earth Environ Sci 2023, 1233. [Google Scholar] [CrossRef]
- Al-Zubaidy, W.; Al-Jawad, M. Prediction unconfined compressive strength for different lithology using various wireline type and core data for Southern Iraqi field Worood. J Eng 2023, 29. [Google Scholar] [CrossRef]
- Stephan, T.; Enkelmann, E.; Kroner, U. Analyzing the horizontal orientation of the crustal stress adjacent to plate boundaries. Sci Rep 2023, 13, 1–22. [Google Scholar] [CrossRef] [PubMed]
- Marelis, A.; Beekman, F.; Wees van, J.D. 3D mechanical analysis of geothermal reservoir operations in faulted sedimentary aquifers using MACRIS. Geotherm Energy 2024, 12. [Google Scholar] [CrossRef]
- Alam, J.; Chatterjee, R.; Dasgupta, S.; Das, B. Stress state in parts of NE India: Borehole collapse modelling with sensitivity analysis. Petrol Geosci 2022, 28. [Google Scholar] [CrossRef]
- Al-Zubaidi, N.S.; Al-Neeamy, A.K. 3D mechanical earth model for Zubair Oilfield in southern Iraq. J Petrol Explor Prod Technol 2020, 10, 1729–1741. [Google Scholar] [CrossRef]
- Zoughy, P.; Molladavoodi, H.; Nikoosokhan, S.; Fatahi Mehraban, L. Numerical modeling of logged wellbore breakouts using cohesion-weakening frictional-strengthening models. J Petrol Sci Eng 2021, 198, 108206. [Google Scholar] [CrossRef]
- Abdelghany, W.K.; Radwan, A.E.; Elkhawaga, M.A.; Wood, D.A.; Sen, S.; Kassem, A.A. Geomechanical modeling using the depth-of-damage approach to achieve successful underbalanced drilling in the Gulf of Suez rift basin. J Petrol Sci Eng 2021, 202, 108311. [Google Scholar] [CrossRef]
- Cai, W.; Deng, J.; Feng, Y.; Lin, H.; Yuan, Y.; Liu, D. 3D geomechanics modeling of Indonesia B oilfield and its application in wellbore stability. Arab J Geosci 2022, 15. [Google Scholar] [CrossRef]
- Aslannezhar, M.; Kaeshavarz, A.; Kalantariasl, A. Evaluation of mechanical, chemical, and thermal effects on wellbore stability using different rock failure criteria. J Nat Gas Sci Eng 2020, 78, 103276. [Google Scholar] [CrossRef]
- Zhao, C.; Zhang, Z.; Lei, Q. Role of hydro-mechanical coupling in excavation-induced damage propagation, fracture deformation and microseismicity evolution in naturally fractured rocks. Eng Geol 2021, 289, 106169. [Google Scholar] [CrossRef]
- Haghi, A.H.; Chalaturnyk, R.; Ghobadi, H. The state of stress in SW Iran and implications for hydraulic fracturing of a naturally fractured carbonate reservoir. Int J Rock Mech Min Sci 2018, 105, 28–43. [Google Scholar] [CrossRef]
- Buntoro, A.; Rahmad, B.; Lukmana, A.H.; Asmorowati, D. Evaluation of mud weight using safe mud window concept based on well log data: A case study of well OP-002 in the North Sumatra Basin area, Indonesia. RSF Conference Series. Eng Technol 2021, 1, 248–266. [Google Scholar] [CrossRef]
- Khyrie, W.; Alrazzaq, A.A.A.A. Determination of safe mud weight window in Rumaila Oilfield, Southern Iraq. Iraqi Geol J 2021, 54, 48–61. [Google Scholar] [CrossRef]

Disclaimer/Publisher’s Note: The statements, opinions and data contained in all publications are solely those of the individual author(s) and contributor(s) and not of MDPI and/or the editor(s). MDPI and/or the editor(s) disclaim responsibility for any injury to people or property resulting from any ideas, methods, instructions or products referred to in the content. |
© 2024 by the authors. Licensee MDPI, Basel, Switzerland. This article is an open access article distributed under the terms and conditions of the Creative Commons Attribution (CC BY) license (http://creativecommons.org/licenses/by/4.0/).


