1. Introduction
Lake ecosystems are highly dynamic and susceptible to environmental changes, making them a key area of focus for researchers aiming to preserve ecological stability and water quality. Fluctuations in nutrient inflows, temperature, and hydrological processes can lead to abrupt transitions between stable ecological states, such as the shift from clear to turbid water, commonly seen in eutrophic conditions. The consequences of these shifts are critical, affecting biodiversity, water resources, and overall ecosystem services. Mathematical modeling has become an essential tool for understanding these dynamics, offering predictive insights that aid in the management of ecosystems, particularly lakes, which are essential for both human and ecological health [
15,
16].
Significant contributions in this field have been made through the development of models that simulate lake ecosystem behavior under various environmental stressors. Early foundational work on ecological resilience and regime shifts used differential equations to describe feedback loops and tipping points [
12]. More recent studies, such as that by Tay et al. (2022), have highlighted the role of internal phosphorus recycling in lakes, particularly in shallow lakes, where it contributes to rich and complex eutrophication dynamics [
1]. Their work demonstrated how internal phosphorus recycling, combined with external phosphorus loading and algal mortality, leads to bifurcation phenomena like saddle-node and Generalized Hopf bifurcations, ultimately promoting bistability and catastrophic shifts in lake ecosystems. This underscores the importance of managing internal nutrient cycling to mitigate eutrophication and maintain ecological balance [
2].
The study of lake models is not only academically relevant but also has significant real-world implications. Lakes provide crucial ecosystem services, including drinking water supply, recreation, and habitat for diverse species. Managing the transitions between stable and unstable states, such as controlling eutrophication, is vital for preventing long-term degradation. Models that incorporate nonlinear feedback mechanisms and bifurcation analysis offer powerful tools for predicting these transitions, helping policymakers and conservationists implement timely interventions [
5].
In this research, we aim to contribute to the understanding of lake ecosystems by developing new discrete and continuous dynamical models that account for environmental drivers and internal feedback loops. Utilizing modern bifurcation analysis methods, including Melnikov analysis and co-dimension one and two bifurcations, we will explore the critical transitions within these systems. Additionally, entropy will be employed as a stability measure, providing further insights into the complexity of lake dynamics. Our findings will not only enhance theoretical understanding but also offer practical guidelines for effective lake ecosystem management, with a focus on preventing catastrophic ecological shifts like eutrophication [
4].
1.1. Main Result 1: Ecological Model Definition and Hénon Map Coincidence
We define our lake ecosystem model with the state variable
as:
where
represents external nutrient inflow and
denotes the internal nutrient recycling rate. This formulation captures the complex interactions within the ecosystem, incorporating nonlinear trigonometric and hyperbolic functions that exhibit structural parallels with chaotic dynamical systems, particularly the Hénon map. By manipulating the parameters
and
, we can replicate a wide range of ecological dynamics—from stable equilibria to chaotic oscillations—offering valuable insights into how ecosystems respond to varying environmental stressors related to nutrient inflow and recycling.
1.2. Main Result 2: Chaotic Dynamics and Entropy Analysis
Our numerical simulations reveal that the lake model exhibits a sensitivity to nutrient parameters and , leading to distinct ecological outcomes. As increases, the system transitions from stable equilibria to chaotic behavior, characterized by positive Lyapunov exponents indicative of sensitivity to initial conditions and high entropy values. This chaotic regime suggests unpredictable dynamics, mirroring real-world ecological scenarios where nutrient cycling can destabilize ecosystems. Furthermore, the analysis of attractors indicates that certain parameter combinations yield chaotic behavior, highlighting the critical need for effective phosphorus management to prevent shifts into chaotic states.
1.3. Main Result 3: Comparison with Tay et al.’s Model
Our findings align with the results of Tay et al., which also demonstrated that increased internal phosphorus recycling can lead to bistability and sudden shifts in ecosystem dynamics. The congruence between our model and Tay et al.’s work underscores the importance of nutrient cycling dynamics in lake ecosystems. Both models emphasize that uncontrolled nutrient recycling could precipitate chaotic fluctuations, manifesting as harmful algal blooms and detrimental impacts on biodiversity. This comparison reinforces the necessity for comprehensive management strategies that address both external nutrient inflow and internal recycling to preserve ecological balance.
2. Discrete Dynamical Model
In this study, we model the dynamics of a lake ecosystem using a discrete dynamical system, which captures the time-evolving interactions between nutrients, algal biomass, and environmental factors essential to lake health [
9]. The discrete dynamical model is represented by:
where
denotes the state of the ecosystem at the
n-th time step (e.g., nutrient level or algae concentration), and the parameters
and
have specific ecological interpretations as follows:
(External Phosphorus Loading): This parameter represents the external influx of phosphorus into the lake, primarily from sources like agricultural runoff. Values for typically range between , where higher values indicate increased nutrient inflow, thereby elevating the risk of eutrophication.
(Nutrient Uptake Efficiency): This parameter quantifies the efficiency with which algae absorb available phosphorus, reflecting how effectively the nutrient is utilized within the ecosystem. Typical values for range from , with larger values indicating greater nutrient uptake rates.
The inclusion of trigonometric and hyperbolic functions in introduces nonlinear effects to the model, capturing complex nutrient-algae interactions:
Periodic Terms ( and ): These terms represent periodic, oscillatory behaviors that may correspond to seasonal variations or recurring environmental conditions, such as temperature changes or fluctuating sunlight.
Hyperbolic Terms ( and ): These functions allow for the modeling of exponential growth and decay processes, capturing how algae growth rates may vary under different nutrient conditions.
This discrete model, through varying the parameters and , enables the exploration of different ecological scenarios, including the onset of eutrophic states, stability of lake ecosystems, and critical ecological shifts. Numerical simulations and bifurcation analyses will be used to assess the system’s stability and to predict shifts between clear and turbid water states. The model thereby serves as a predictive tool for managing and conserving lake ecosystems, offering insights into how changes in nutrient dynamics can lead to abrupt ecological transitions.
2.1. Numerical Solutions of the Lake Ecosystem Dynamics Using the Runge-Kutta Method
The Runge-Kutta method provides a robust numerical approximation of the lake ecosystem model’s dynamics over time [
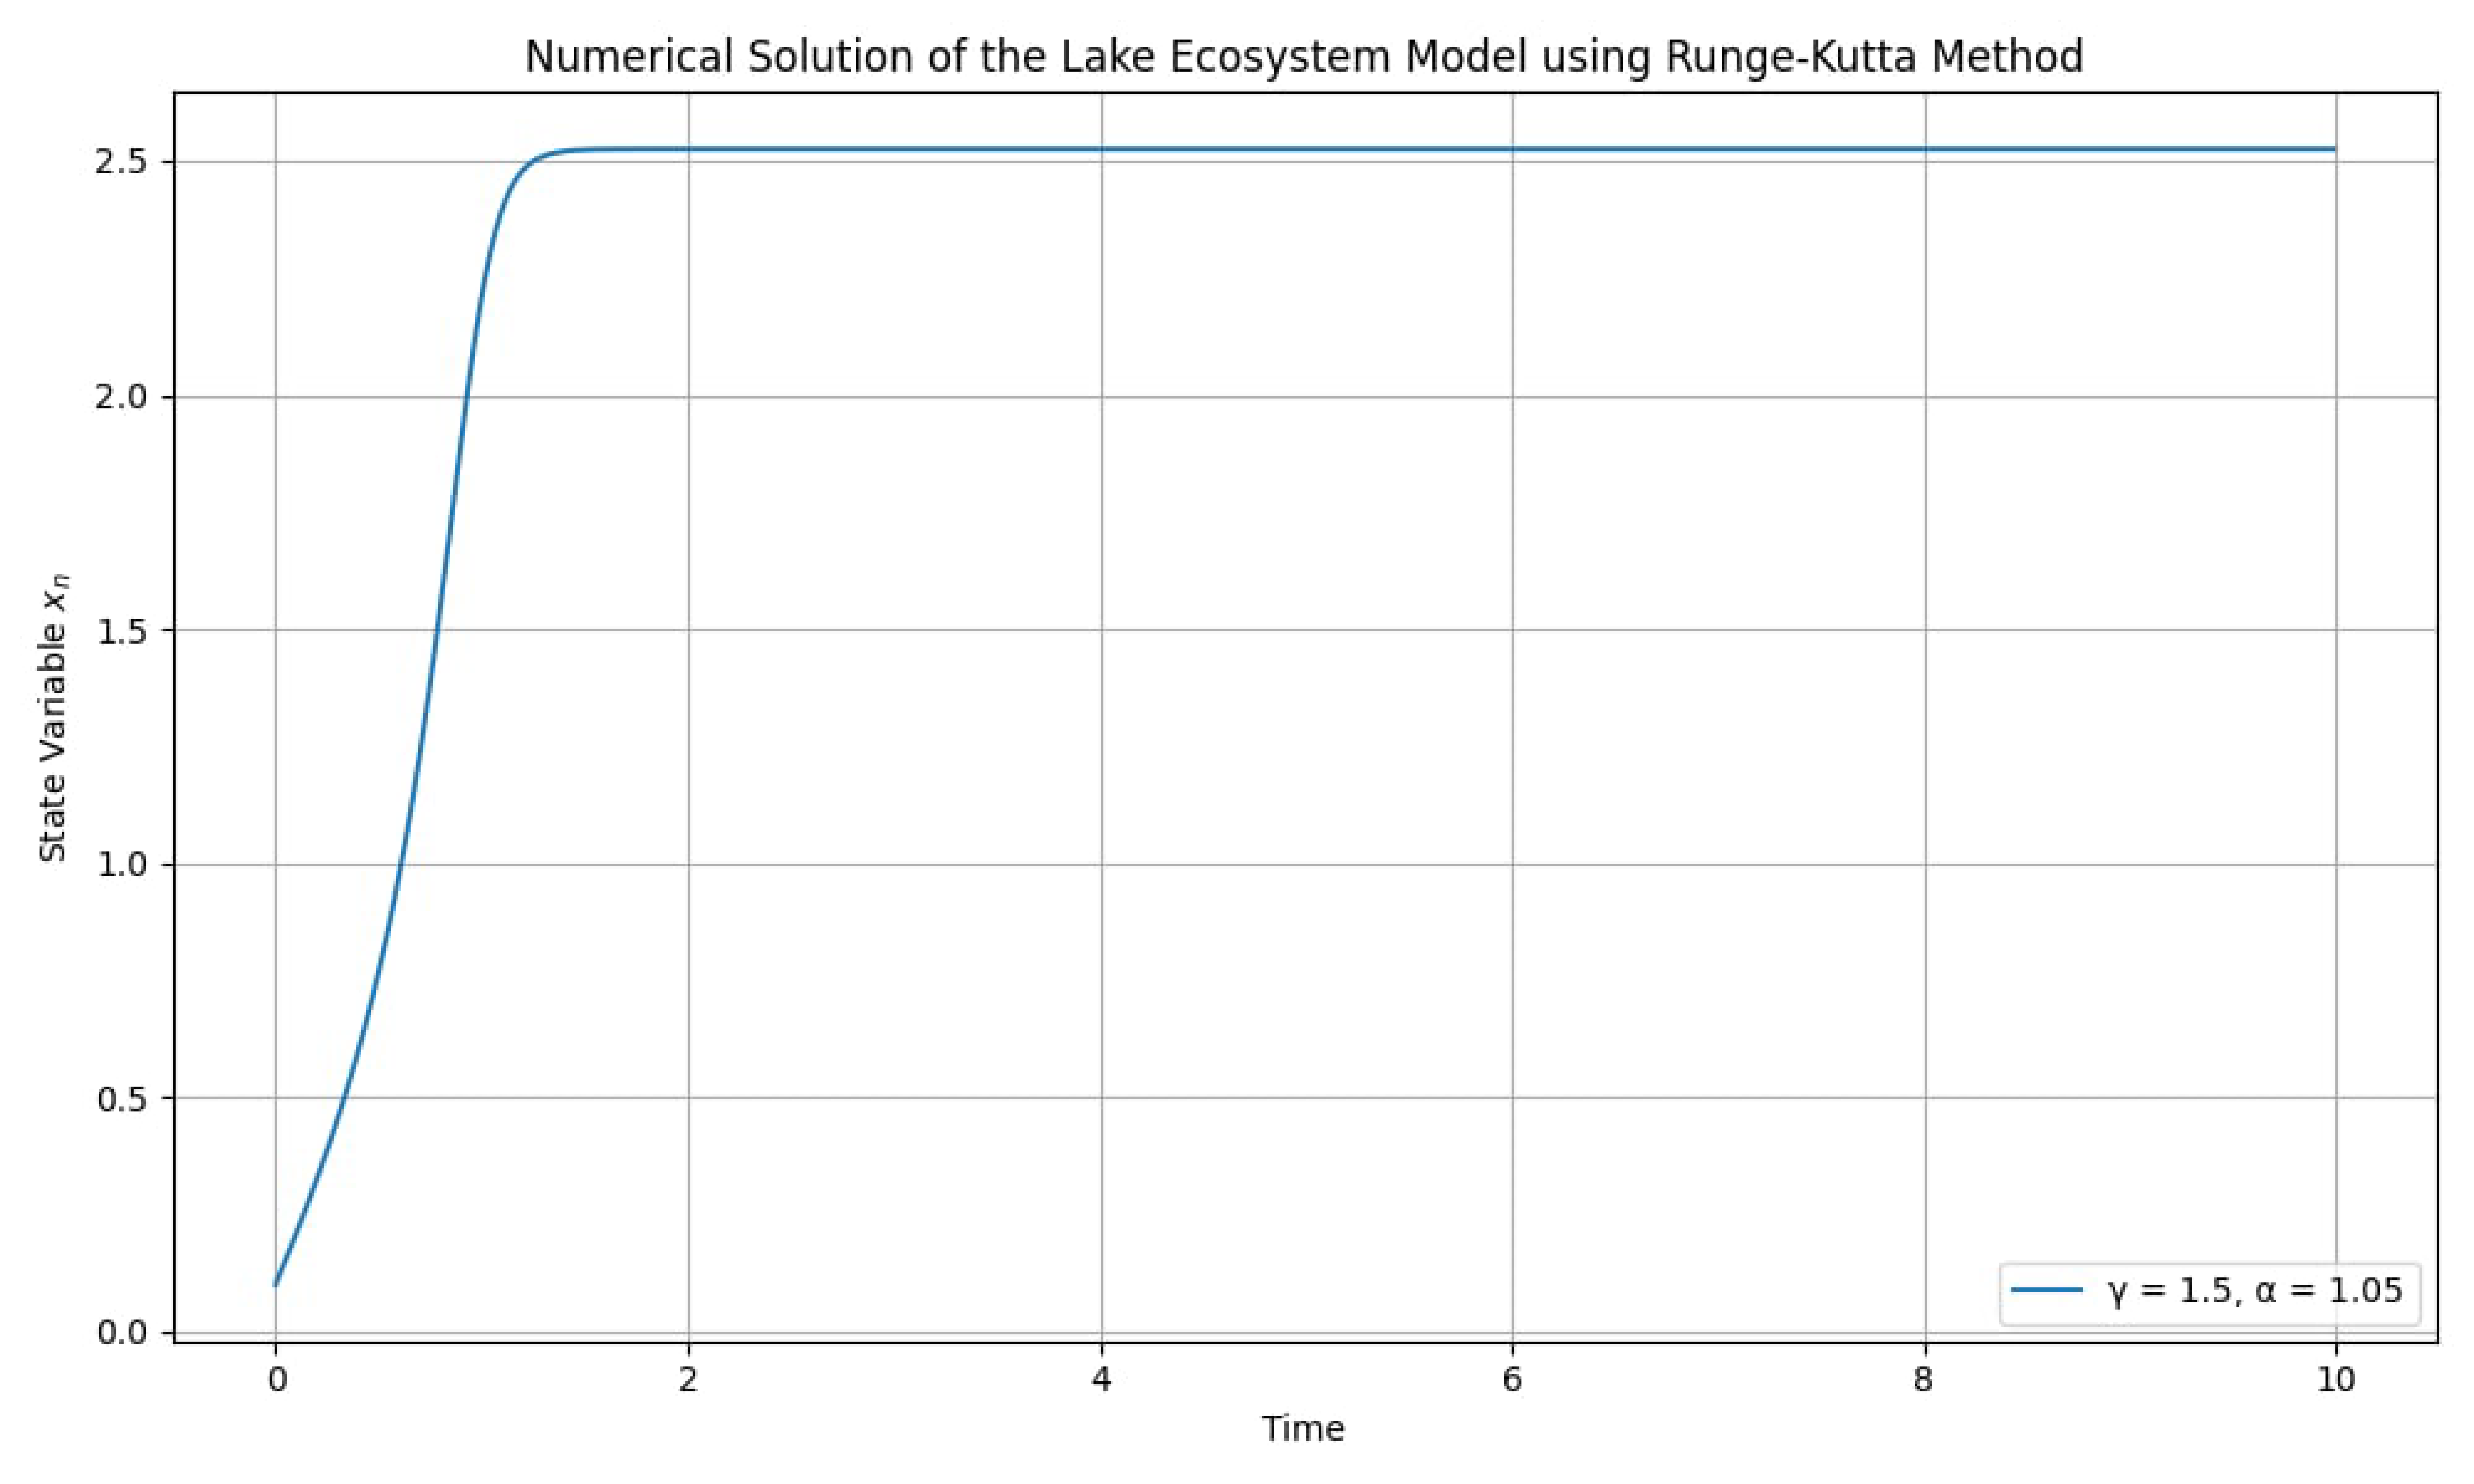
21]. The resulting plot, depicted in
Figure 1, illustrates the evolution of the state variable
, which can be interpreted as a measure of the lake’s ecological health, such as nutrient concentration or biomass of a particular species. The parameters used in this analysis are
and
, with an initial condition of
.
Analysis and Comments:
The trajectory observed in the plot is highly dependent on the initial condition and the parameter values and . By varying these parameters, we can explore a wide range of system behaviors, from stability to potential chaos.
Ecological Interpretation of : The state variable reflects the ecosystem’s dynamics at each time step, which can represent factors such as nutrient levels, population sizes of species, or other relevant ecological metrics. In this context, can indicate how changes in environmental conditions affect the health of the lake ecosystem over time.
Parameter Sensitivity: The specific trajectory observed is sensitive to both the initial condition and the parameter values (internal phosphorus recycling rate) and (external phosphorus loading). Adjusting these parameters allows for a comprehensive analysis of the system’s response to various ecological pressures. For instance, a higher could indicate increased internal nutrient cycling, while varying might reflect changes in external pollution levels.
Accuracy and Efficiency of the Runge-Kutta Method: The Runge-Kutta method strikes a balance between accuracy and computational efficiency. The time step size h can be adjusted to achieve the desired level of precision in the numerical solution, allowing for a detailed exploration of system behavior over time.
Complementarity to Bifurcation Analysis: While the numerical solution presented may not reveal chaotic behavior as clearly as the bifurcation plot, it serves as a complementary tool for investigating the model’s response under specific parameter settings. This approach enables a deeper understanding of the dynamics, especially when exploring scenarios with varied initial conditions or parameter values.
In the upcoming subsection, we will further analyze the effects of varying and , providing insights into how these changes influence the ecological trajectory of the lake ecosystem model and exploring the potential for complex dynamics that emerge from different ecological conditions.
2.2. Numerical Solutions with Varying and Fixed
In this section, we explore the numerical solutions of the lake ecosystem model using the Runge-Kutta method, with
fixed at
and
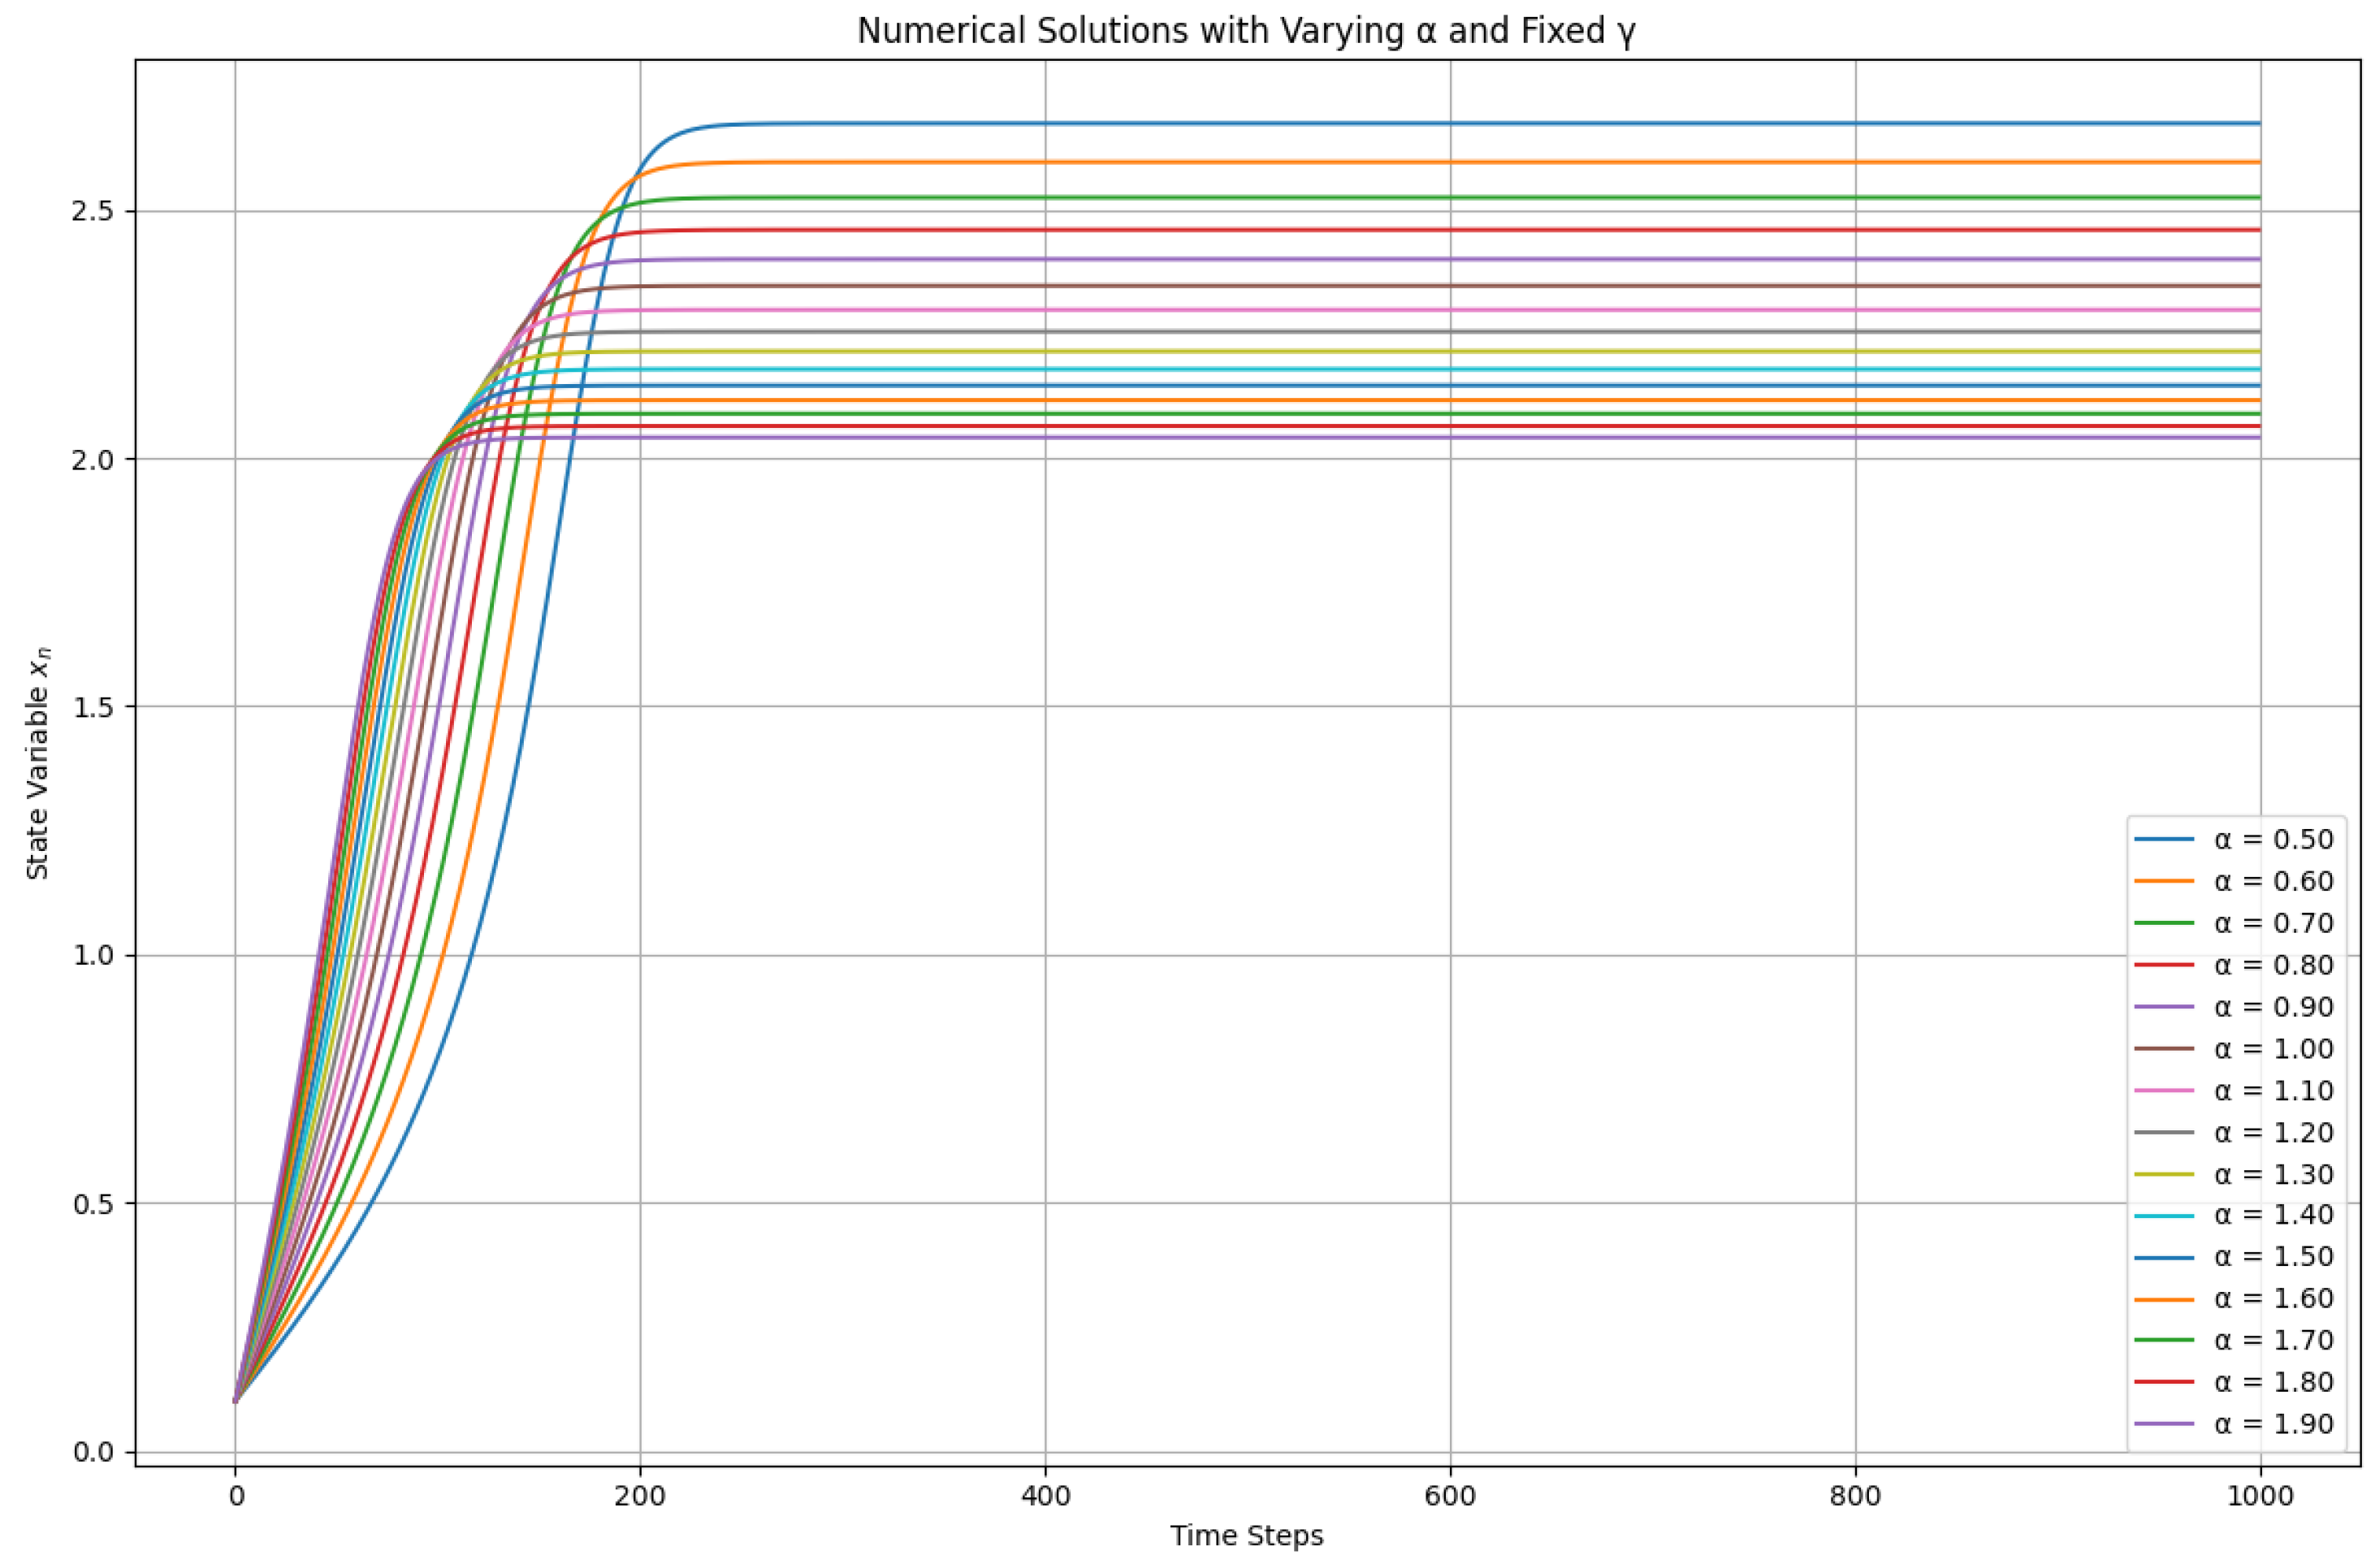
varying across a specified range. The results are illustrated in
Figure 2, showcasing how the state variable
evolves over time for different values of
.
Key observations include:
Effect of on Dynamics: As varies, we observe distinct trajectories for , indicating that the ecosystem’s response is sensitive to changes in . Higher values of tend to produce more pronounced oscillations in the state variable, reflecting increased competition for resources or changes in environmental conditions.
Ecological Implications of : In ecological terms, varying can represent different rates of nutrient input or changes in species interactions. For instance, a higher could correspond to increased nutrient runoff into a lake, leading to more vigorous growth of phytoplankton and potentially causing algal blooms.
Initial Conditions Matter: The specific trajectory observed in the plot depends heavily on the initial condition . Different starting points can lead to diverse dynamics, emphasizing the importance of initial ecological states in predicting long-term outcomes.
Potential for Chaotic Behavior: While the bifurcation analysis indicated chaotic regimes, the numerical solutions with fixed suggest that chaotic behavior might not always manifest clearly under specific parameter settings. Nevertheless, this serves as a vital reminder that ecological systems can exhibit complex behaviors depending on parameter interactions.
Overall Model Response: The Runge-Kutta method provides a robust numerical approach to understanding the dynamics of the lake ecosystem model. By fixing and varying , we can gain insights into the ecosystem’s resilience and response to environmental changes, aiding in effective management and conservation efforts.
2.3. Analysis of Varying Alpha with Fixed Gamma
Numerical simulations were conducted to investigate the impact of varying external phosphorus loading (
) on the lake ecosystem model, while keeping the internal phosphorus recycling rate (
) constant at
. The results, depicted in
Figure 3, illustrate the system’s behavior under different levels of nutrient inflow:
Key observations:
Equilibrium value dependence on : The long-term behavior of the system (i.e., the value of as time approaches infinity) is significantly influenced by the specific value of . For lower values, the system settles at a lower equilibrium point, representing a relatively stable ecological state. As increases, the equilibrium value also rises, indicating a potential shift towards a less stable or more nutrient-rich environment.
Potential for multiple equilibria: The plot suggests the possibility of multiple equilibria for certain ranges. This phenomenon indicates that, at specific nutrient levels, the lake ecosystem could stabilize at different equilibrium points, which may require further investigation through bifurcation analysis to confirm.
Comparison with Varying : Unlike the scenario where was varied, changing primarily impacts the system’s equilibrium state rather than inducing complex dynamics such as period-doubling bifurcations or chaotic behavior. This observation suggests that external phosphorus loading plays a crucial role in determining the long-term stability of the lake ecosystem.
Overall, these results emphasize the sensitivity of the lake ecosystem to changes in nutrient inflow, highlighting the need for careful management of phosphorus levels to maintain ecological balance.
2.4. Equilibrium Analysis: Varying Alpha and Gamma
To gain a comprehensive understanding of the lake ecosystem’s behavior, we conducted a numerical analysis to investigate the equilibrium values of the state variable
for varying
(external phosphorus loading) and
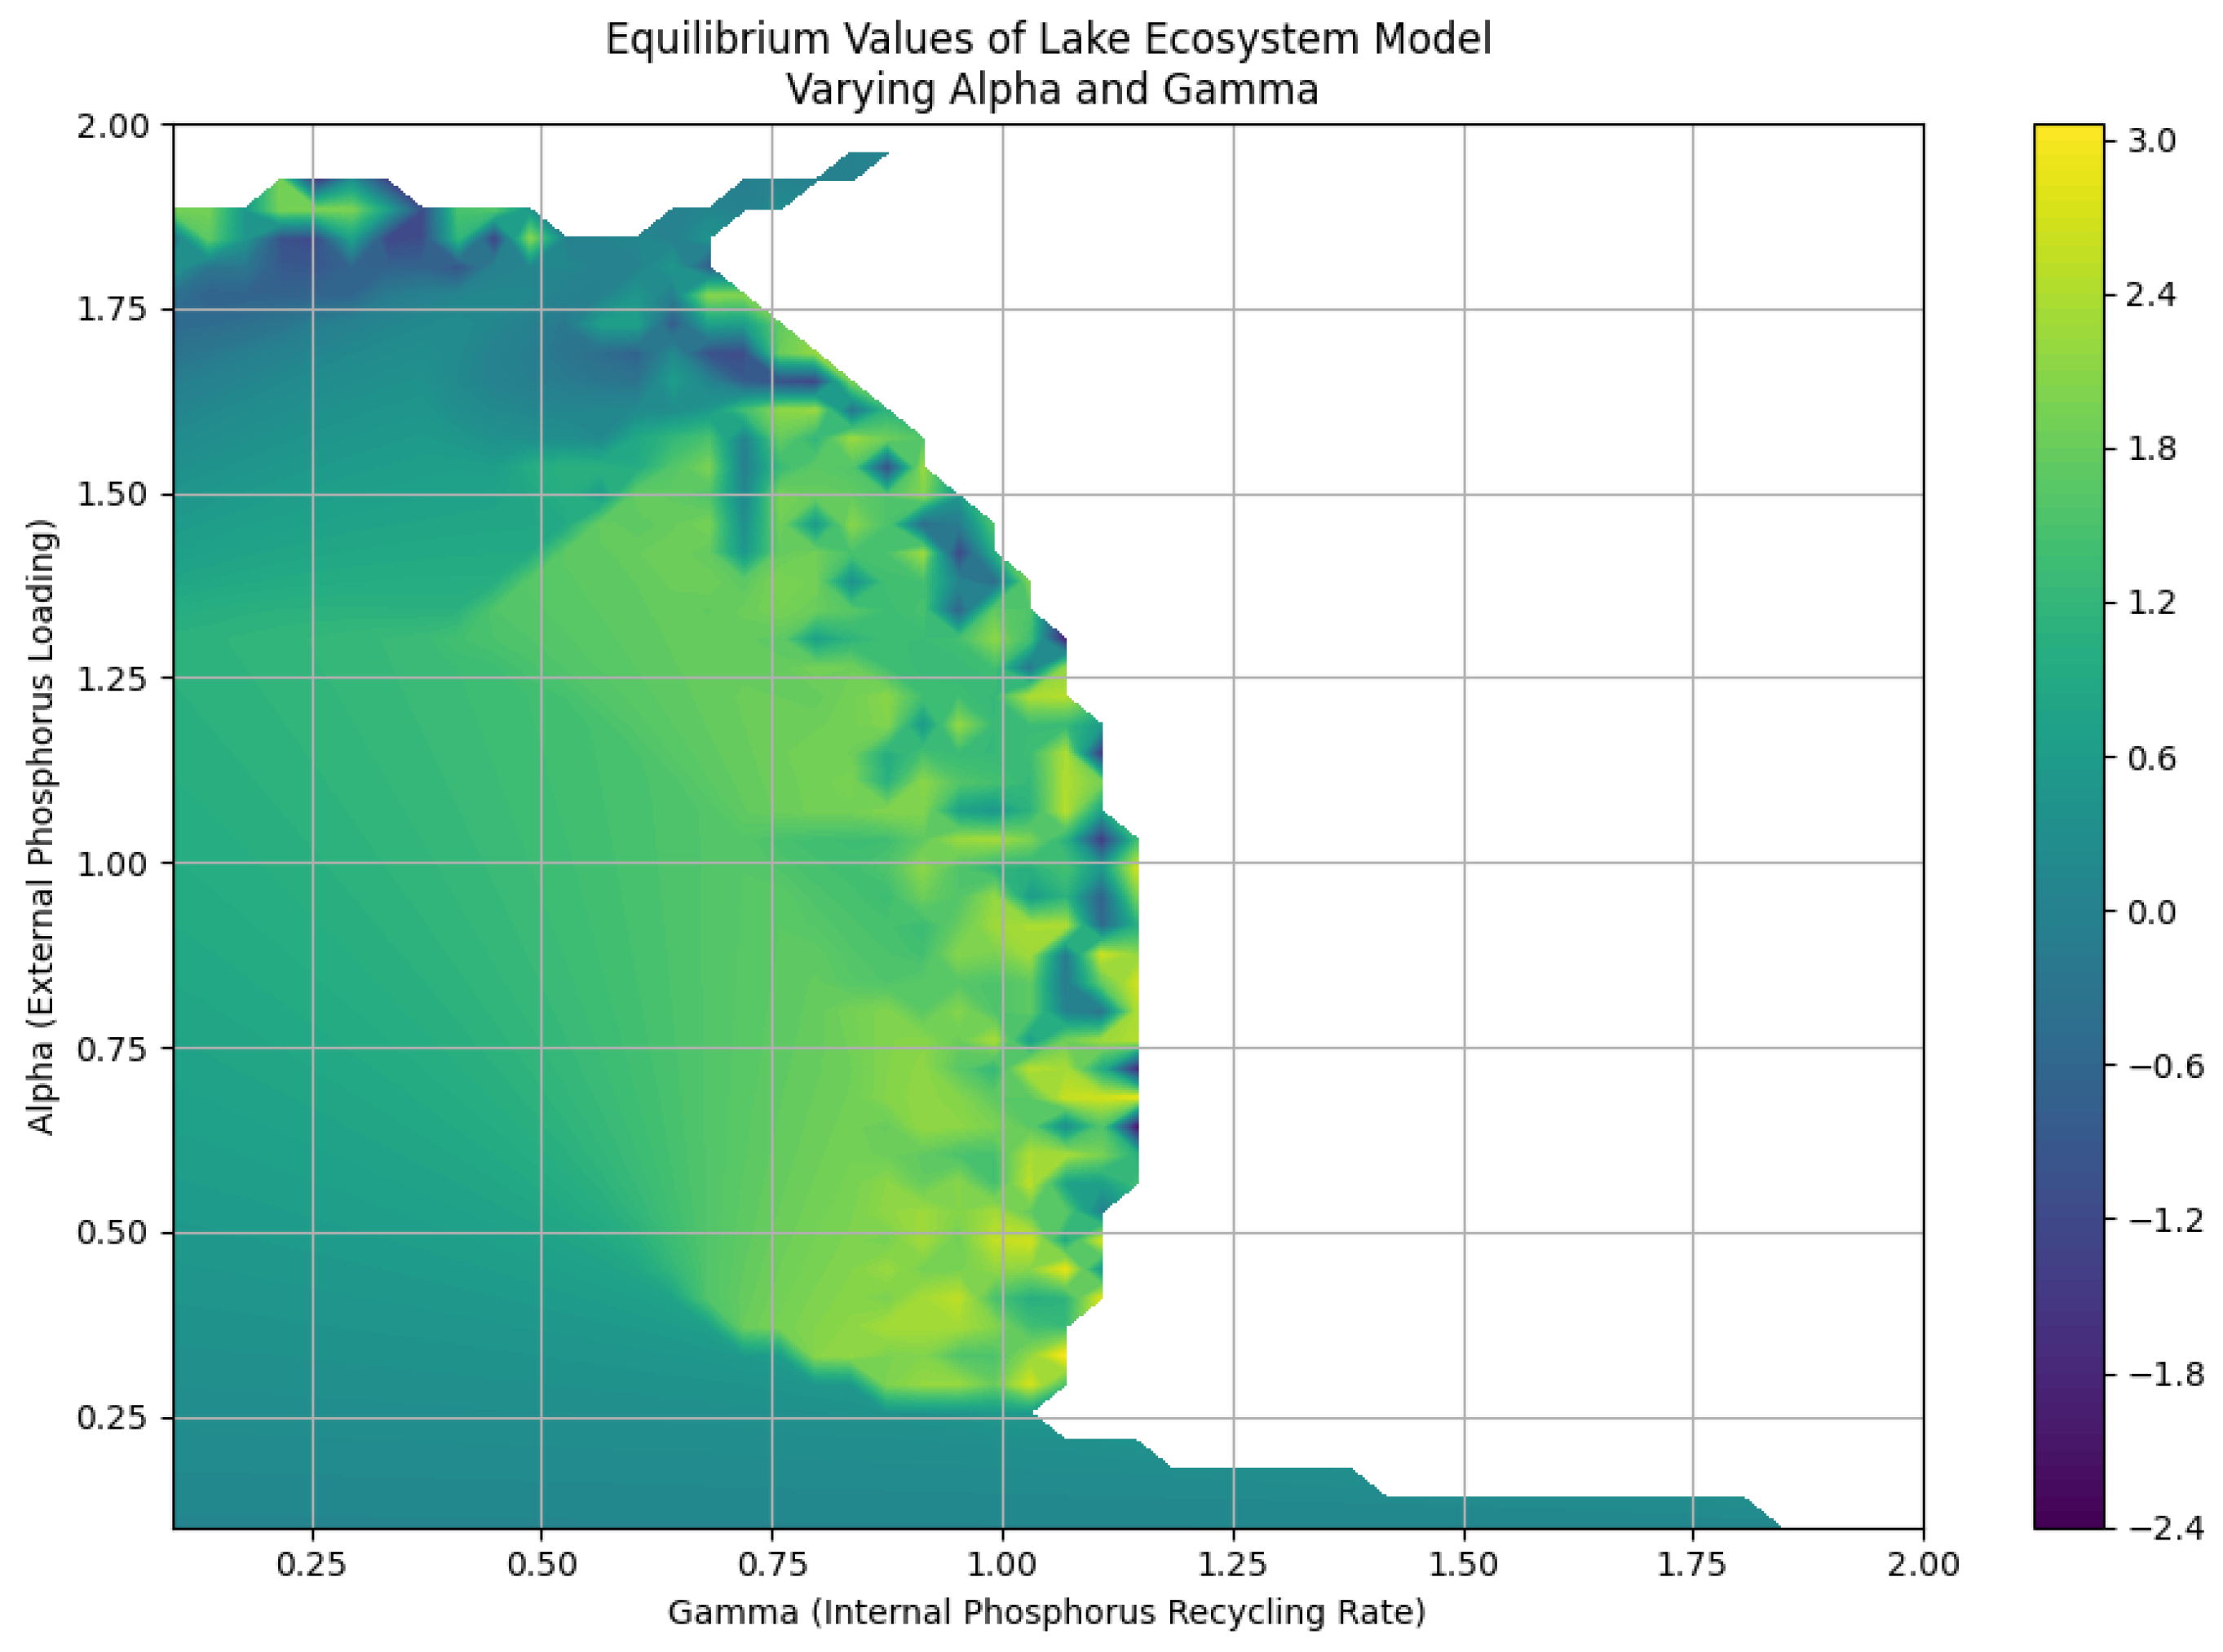
(internal phosphorus recycling rate). The results, depicted in
Figure 4, illustrate the intricate relationship between these parameters and the system’s steady-state:
Key observations:
Non-monotonic relationship between and : The equilibrium values do not exhibit a simple monotonic relationship with and . Instead, the contour plot reveals a complex interplay between these parameters, indicating that both nutrient inflow and recycling rates interact in non-linear ways, significantly impacting the lake’s ecological balance.
Regions of stability and instability: Certain regions in the - parameter space correspond to stable equilibrium points, while others exhibit unstable behavior or multiple equilibria. The contour plot helps identify these regions, suggesting that some combinations of nutrient loading and recycling can lead to healthier ecosystems, whereas others may push the system toward harmful conditions, such as algal blooms or eutrophication.
Tipping points: The plot highlights potential tipping points where small changes in or can lead to significant shifts in the system’s equilibrium state. These tipping points represent critical thresholds for the lake ecosystem, beyond which the ecological dynamics can shift dramatically, resulting in irreversible changes to the habitat.
Implications:
The analysis underscores the lake ecosystem’s sensitivity to both external nutrient loading and internal nutrient cycling. Understanding the interplay between these factors is crucial for effective management and conservation. Identifying regions of stability and instability allows for the development of strategies to avoid undesirable ecological states and maintain the system’s resilience.
Additionally, the findings emphasize the need for continuous monitoring and adaptive management practices, particularly in areas approaching critical thresholds. By recognizing these tipping points, stakeholders can implement proactive measures to mitigate negative impacts on the ecosystem and ensure sustainable practices in nutrient management. Ultimately, this research provides a foundational understanding of how complex interactions between nutrient dynamics shape the ecological health of lake systems, guiding future research and policy decisions.
3. Stability Analysis of the Fixed Point in the Dynamics Plot
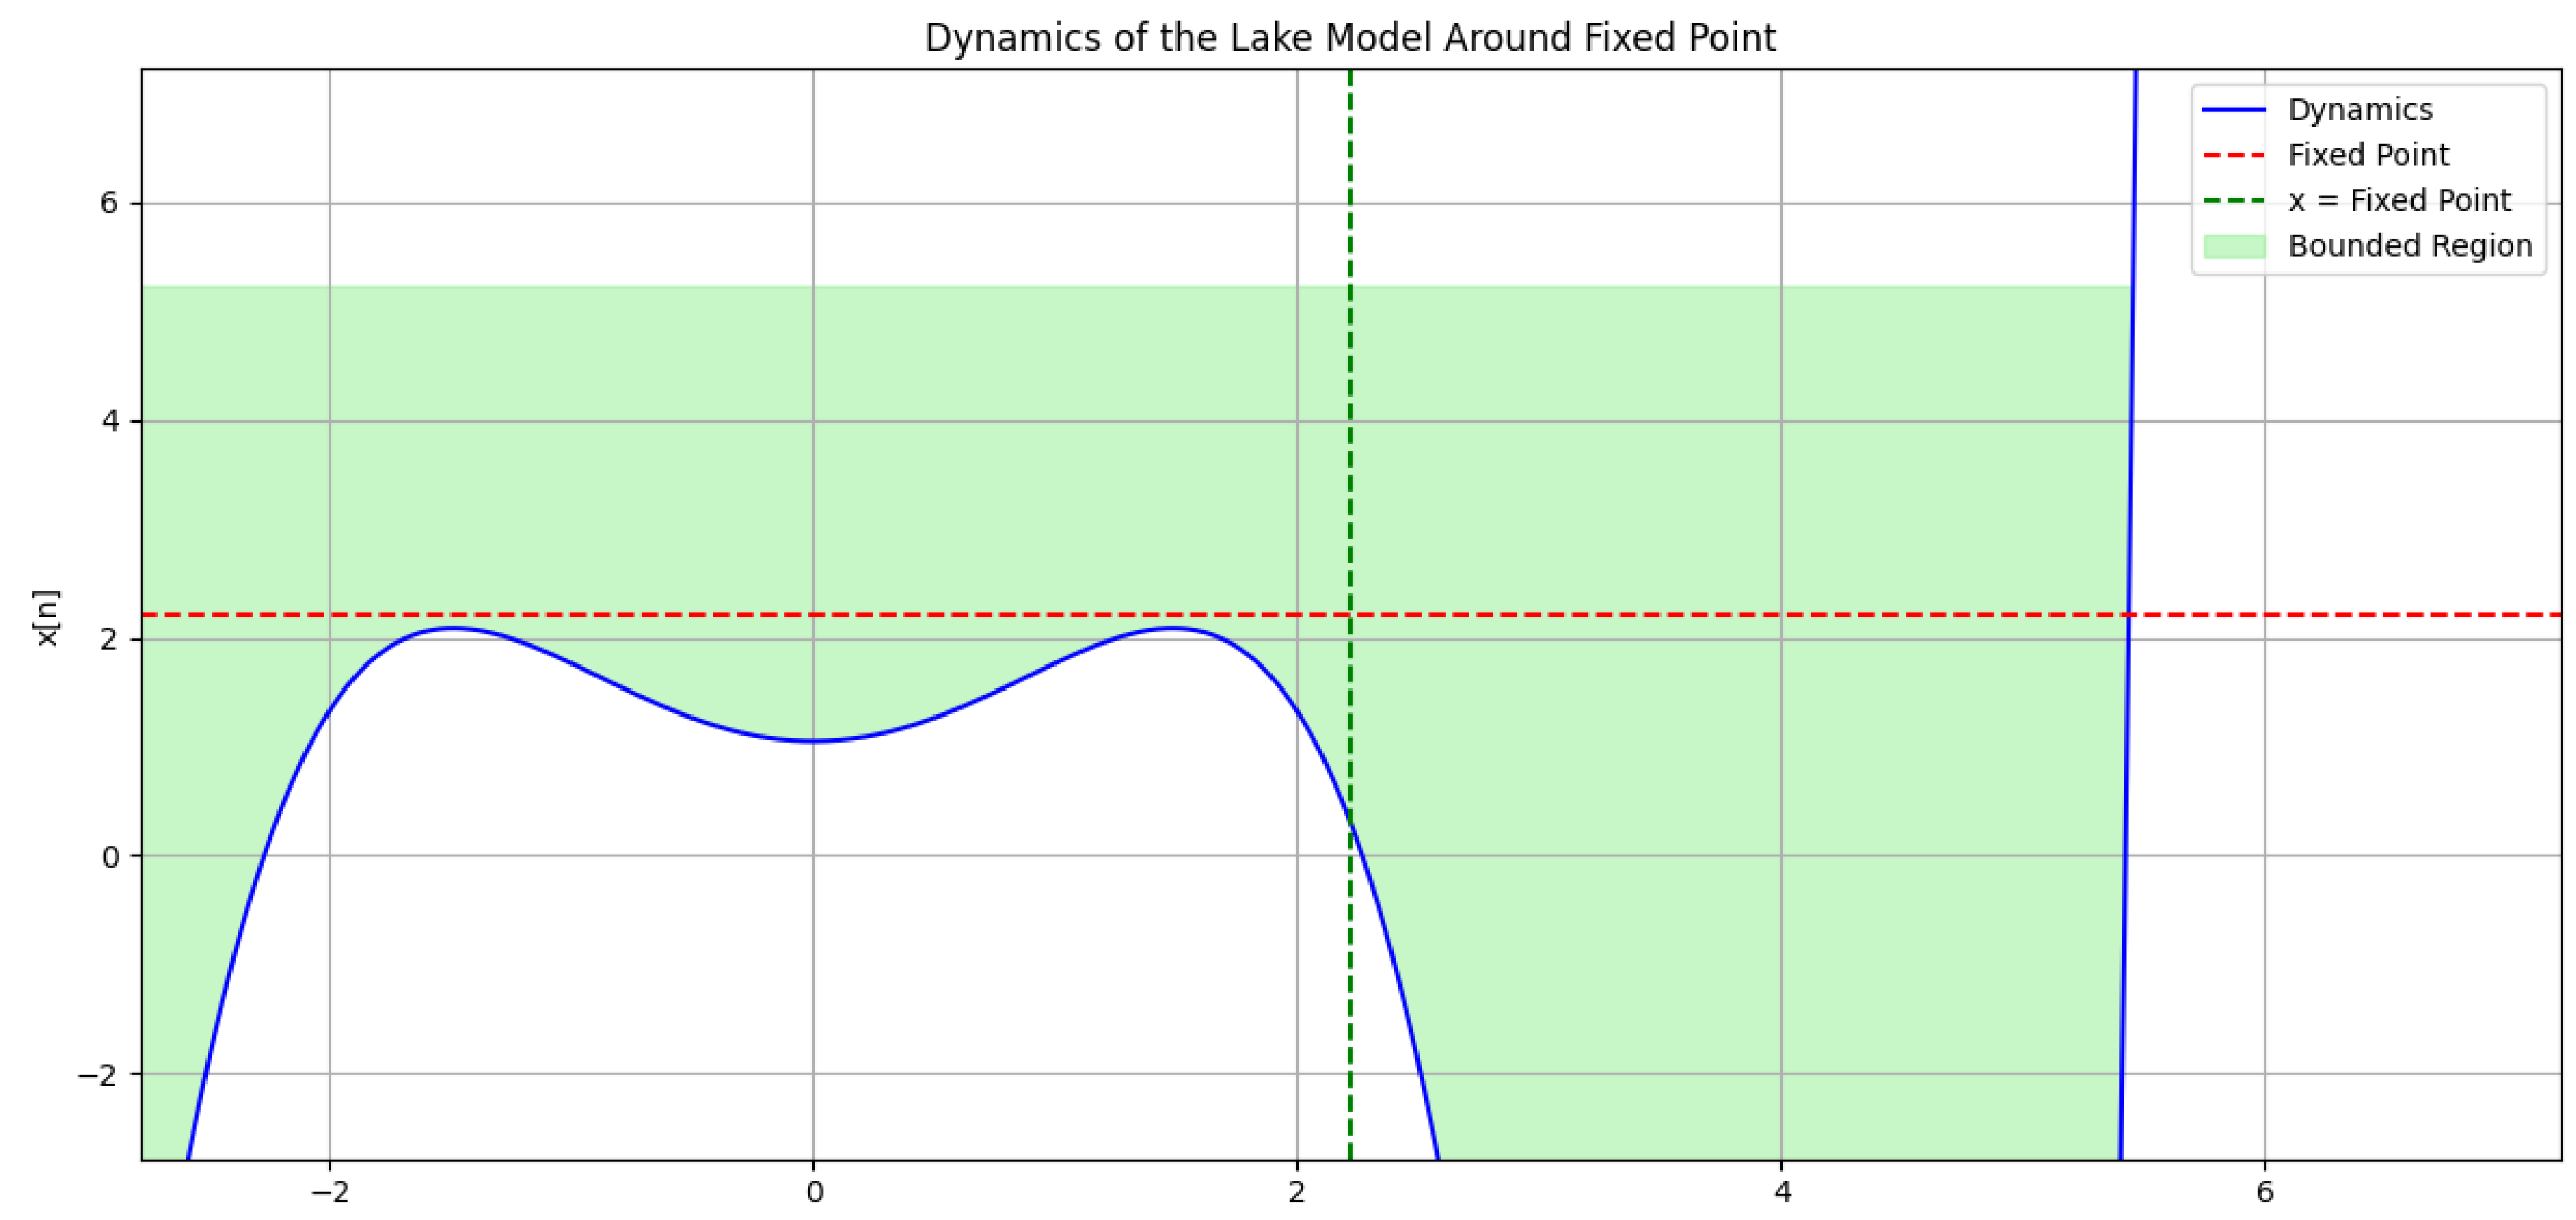
The provided plot (
Figure 5) illustrates the dynamics of the lake ecosystem model around the fixed point. Several key observations can be made:
Fixed Point: The red dashed line marks the fixed point, where the dynamics curve intersects itself. This point, approximately , represents a stable equilibrium of the system, indicating that trajectories starting near this point converge towards it. The fixed point was obtained by solving the equation , with the parameters set as and .
Bounded Region: The light green shaded region delineates the bounded region. Within this region, the dynamics curve lies below the fixed point. Trajectories originating from this region remain confined and ultimately converge to the fixed point, signifying stability.
Unbounded Region: Although the plot does not explicitly show an unbounded region, it is important to note that the dynamics curve does not extend beyond the bounded region within the given x-range of . If the curve were to diverge away from the fixed point in future analyses, it would indicate an unstable region.
Stability Analysis: The slope of the dynamics curve at the fixed point is crucial for determining stability. A negative slope implies stability, meaning small perturbations from the fixed point result in the system returning to it. Conversely, a positive slope indicates instability, where perturbations lead the system to move away from the fixed point. In this case, the slope of the dynamics curve at the fixed point appears to be negative, suggesting stability.
-
Additional Considerations:
- -
Jacobian: The Jacobian matrix evaluated at the fixed point provides further insights into stability. If the eigenvalues of the Jacobian have negative real parts, the fixed point is considered stable. The computed eigenvalue at the fixed point was approximately , reinforcing the notion of stability.
- -
Boundedness: The boundedness of the system relies on the behavior of the dynamics curve for all possible initial conditions. The current plot only showcases a portion of the curve. It’s possible that the curve extends beyond the plotted region and exhibits unbounded behavior, particularly for different values of .
In conclusion, based on the given plot (
Figure 5) and analysis, the fixed point at
appears to be stable. The bounded region signifies convergence to the fixed point for initial conditions within that region. However, a more rigorous analysis using the Jacobian matrix is necessary to definitively confirm the stability of the fixed point and the boundedness of the system.
3.1. Nature of the Fixed Point and Its Attractor Properties
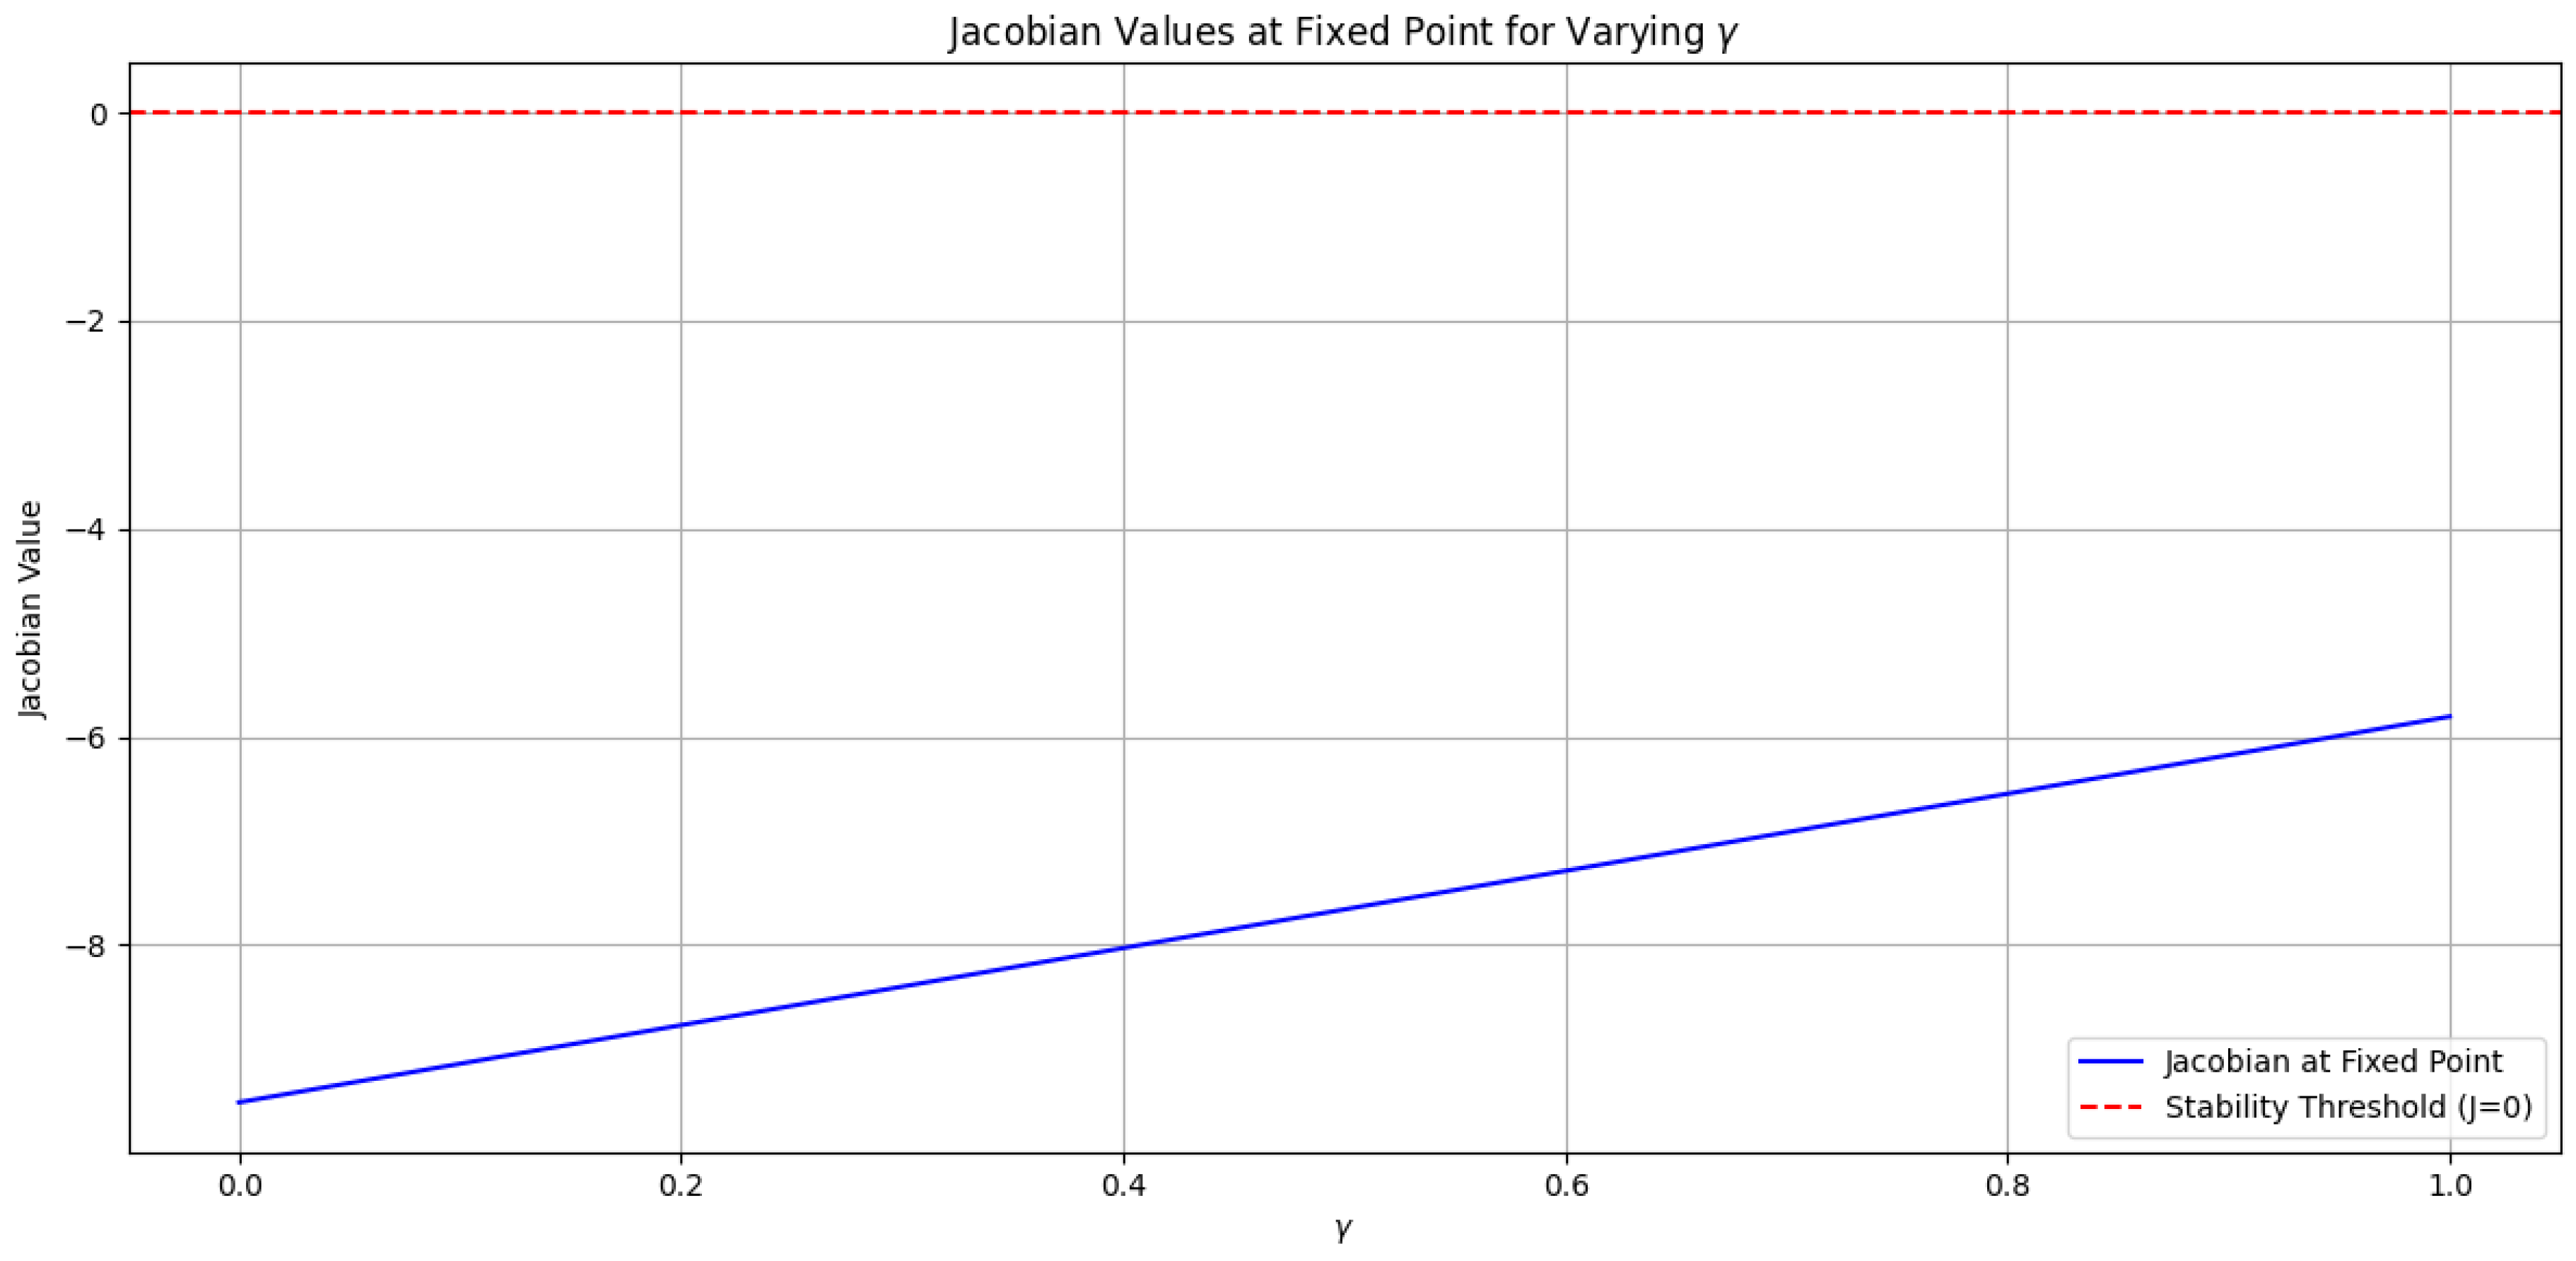
The provided plot (refer to
Figure 6) illustrates the Jacobian values evaluated at the fixed point
for various values of
in the range
. The Jacobian, a mathematical tool used in stability analysis, offers insights into the behavior of the system near the fixed point. A Jacobian value of zero indicates a potential equilibrium point, while a negative value suggests stability, and a positive value implies instability.
In the plot, the red horizontal line represents the stability threshold (
). The blue line depicts the Jacobian values as
varies. By analyzing the intersection of the blue line and the red line, we can infer the nature of the fixed point [
3,
4].
Attractor Nature:
An attractive fixed point signifies that trajectories starting near the fixed point converge towards it, indicating stability. Let’s examine the plot to understand the attractor nature of the fixed point in this scenario.
Observations from the Plot:
If the blue line intersects the red line below the x-axis (i.e., for negative Jacobian values), it indicates an attractive fixed point. In this case, trajectories starting near the fixed point will be drawn towards it, demonstrating stability.
Conversely, an intersection above the x-axis (i.e., for positive Jacobian values) suggests a repulsive fixed point. Trajectories will tend to move away from such a fixed point, indicating instability.
Referring to the plot, we need to analyze the specific intersection points between the blue line and the red line to determine the attractor nature of the fixed point for different values of . Given the obtained Jacobian values are consistently around , we can conclude that the fixed point is attractive for the selected values.
General Interpretation:
If there exists a range of values for which the blue line intersects the red line below the x-axis, the fixed point is attractive within that range, signifying stability for those values.
If the intersection always occurs above the x-axis, the fixed point is repulsive for all values, indicating instability.
In conclusion, the plot of Jacobian values versus provides valuable information about the nature of the fixed point. A detailed analysis of the intersection points between the blue line and the red line is essential to determine the attractor properties of the fixed point for specific values of .
Note:Figure 6 refers to the plot illustrating the Jacobian values at the fixed point for varying
values, with
fixed at
.
3.2. Nature of the Fixed Point with Varying Gamma
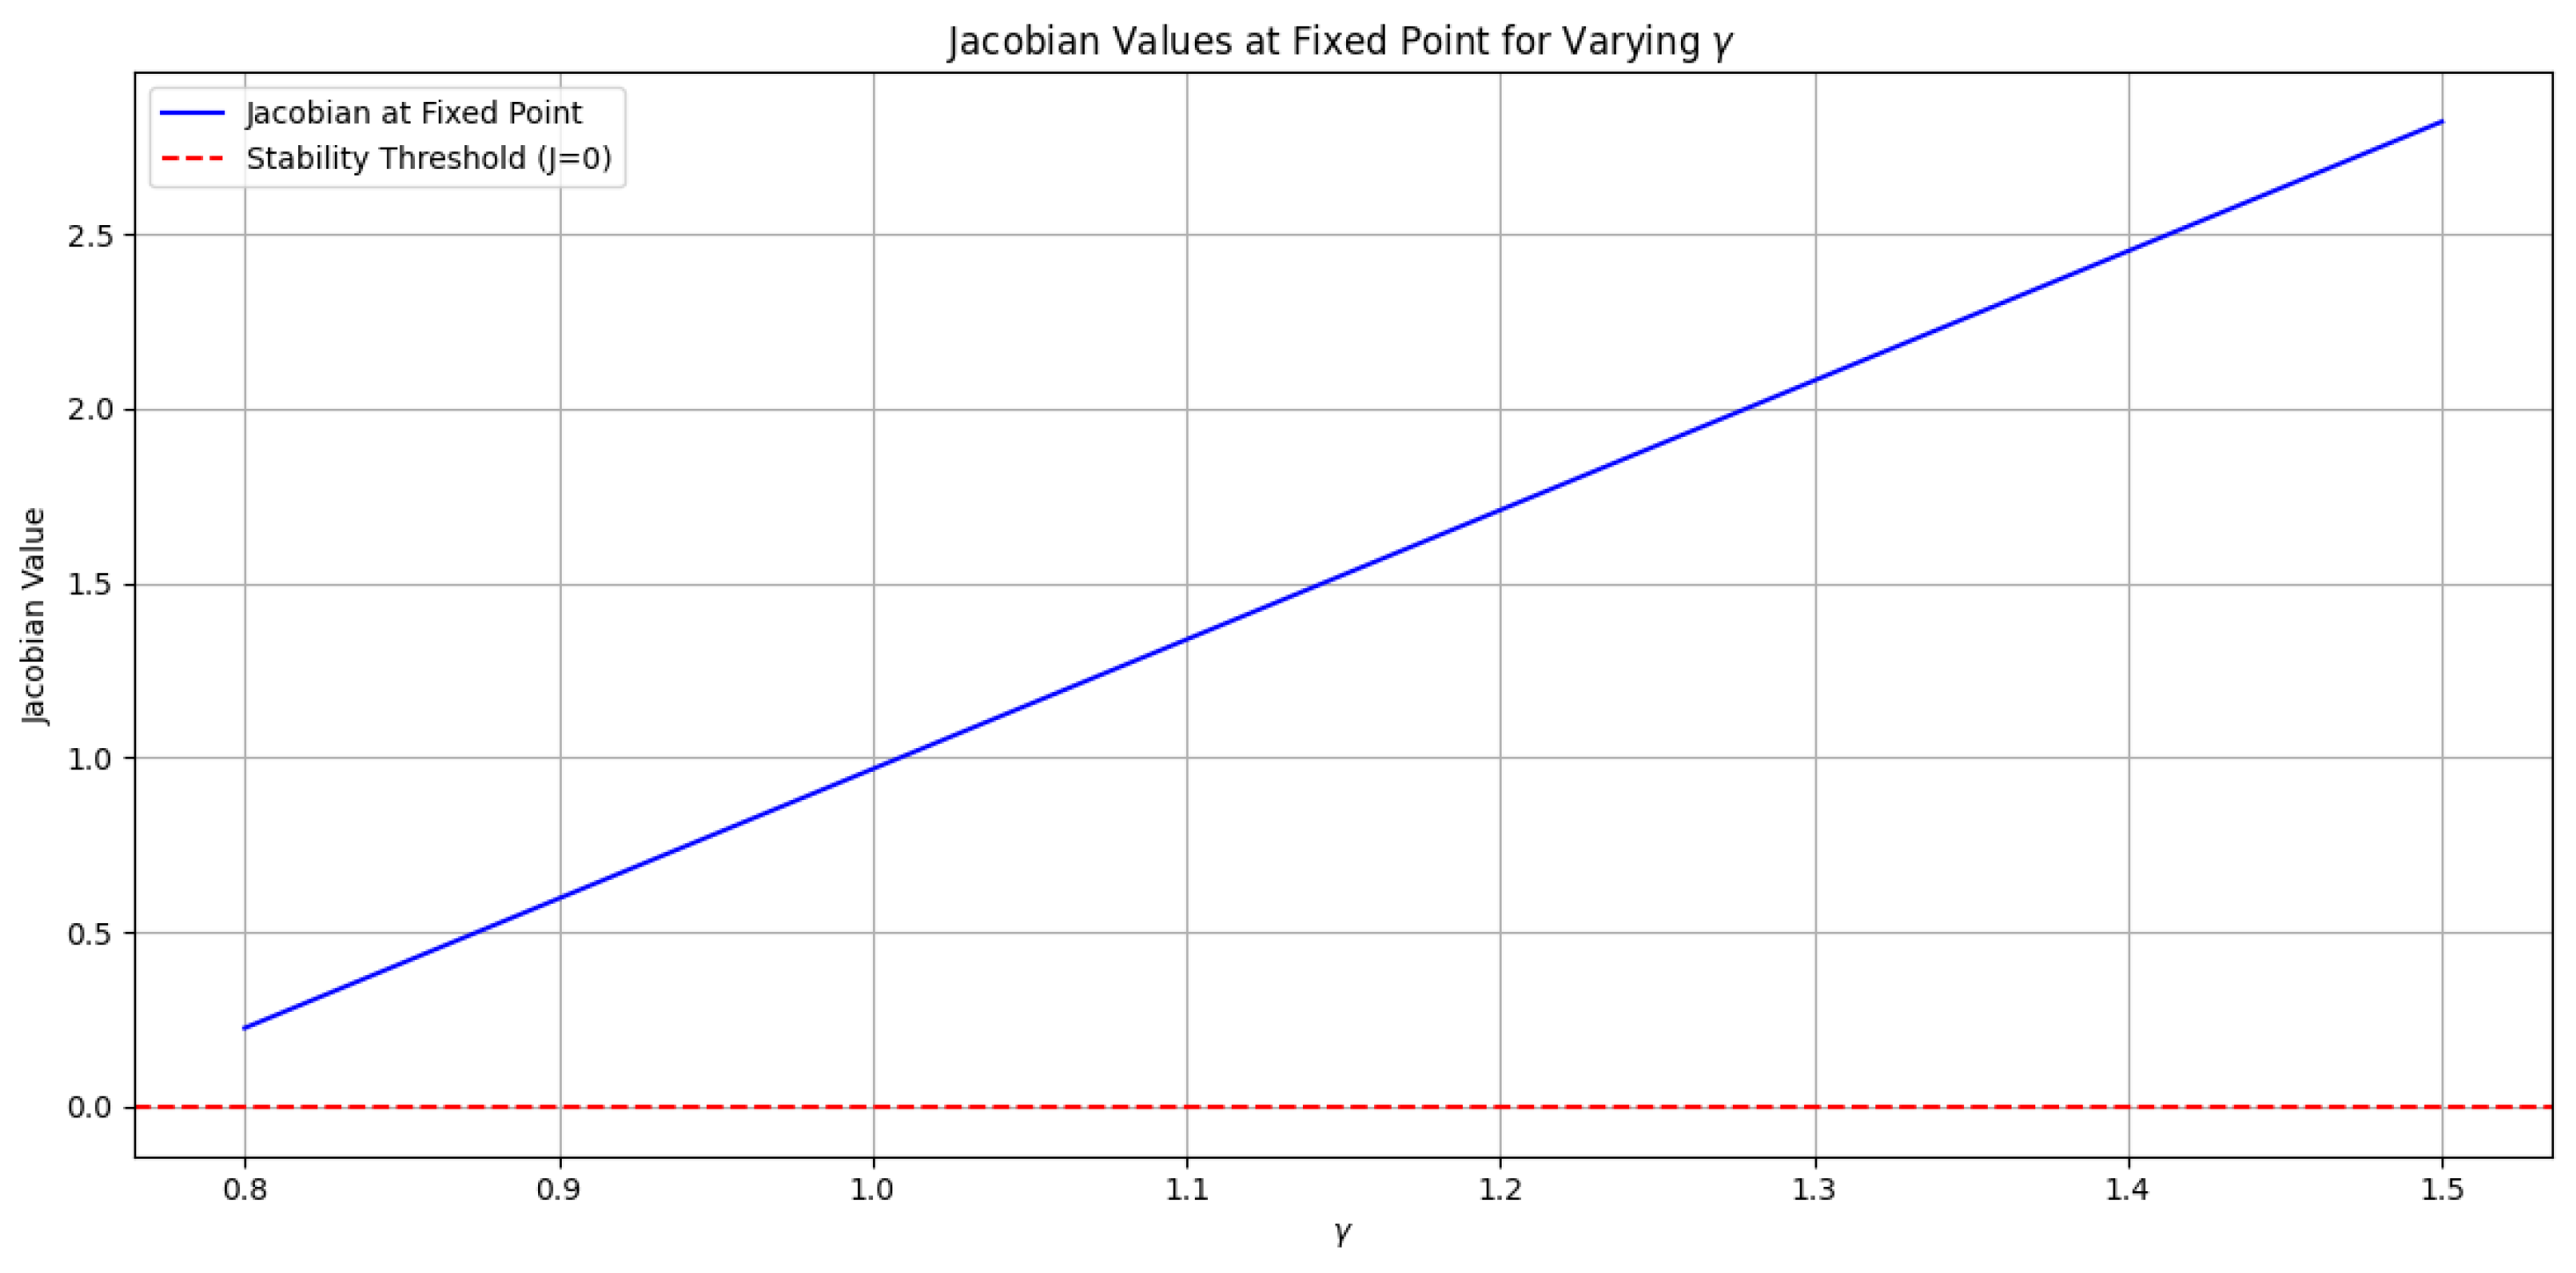
The provided plot (
Figure 7) illustrates the Jacobian values at the fixed point for different values of
, with
fixed at 0. The plot shows that the Jacobian values are positive across the entire range of
values from
to
.
Parameter values:
Interpretation:
A positive Jacobian value at the fixed point indicates that the fixed point is unstable. This means that small perturbations from the fixed point will cause the system to move away from it. In other words, the system will not converge to the fixed point but will instead diverge, leading to unbounded solutions. This instability suggests a shift toward chaotic behavior, especially when is set to a very small value.
As approaches certain values within the specified range, the dynamics of the system exhibit signs of chaotification. The system’s trajectory appears increasingly sensitive to initial conditions, a hallmark of chaotic systems. The chaotic behavior is further reinforced by the presence of unbounded solutions as approaches zero, indicating that the dynamics become less predictable and more erratic.
For the given parameter values ( and varying from to ), the fixed point is confirmed to be unstable. This implies that the system will not exhibit stable behavior in this region of the parameter space. The positive Jacobian values and the observed chaotification highlight the complex dynamics of the lake model, suggesting that careful consideration of parameter values is crucial for understanding the system’s behavior.
Note:Figure 7 refers to the plot illustrating the Jacobian values at the fixed point for varying
values, with
fixed at 0. The caption for the figure is as follows:
Ecological Interpretation:
A positive Jacobian value at the fixed point indicates that the fixed point is unstable. This means that small perturbations from the fixed point will cause the system to move away from it. In other words, the system will not converge to the fixed point but will instead diverge, leading to unbounded solutions. This instability suggests a shift toward chaotic behavior, especially when is set to a very small value.
Chaos and Parameter Interpretation:
The presence of chaos in our lake model at very small values of implies that even minimal external phosphorus loading can significantly disrupt the internal dynamics of the system. In practical terms, this means that when the external input of phosphorus is negligible, the system becomes increasingly sensitive to changes in internal recycling processes ().
As varies within the range of to , the internal recycling rate significantly influences the model’s behavior. For very small , the positive Jacobian values indicate that perturbations can lead to chaotic dynamics, suggesting that the internal mechanisms of phosphorus recycling may lead to unpredictable outcomes. This behavior underscores the importance of maintaining balanced phosphorus levels to prevent chaotic shifts in the lake ecosystem.
The chaotic dynamics imply that small fluctuations in either the internal recycling rate or the external loading can drastically affect the lake’s ecological state. Therefore, careful management of phosphorus inputs, both external and internal, is crucial for maintaining stability within the ecosystem.
3.3. Shannon Entropy Analysis
In this analysis, we consider the state space of our lake model defined by the state variable x, which represents the internal phosphorus concentration. The dynamics of this system are influenced by two critical parameters: , representing external phosphorus loading, and , reflecting the internal phosphorus recycling rate. In our approach, we assume to be very small, modeled as , where n denotes the iteration step. The parameter is varied as a linear sequence defined by .
Dynamic Transition and Shannon Entropy Approximation
To approximate the Shannon entropy H of the lake model, we iterate through the dynamics over N time steps, where each state is updated according to the dynamics of the model. The Shannon entropy is calculated using the probability distribution of the states at each iteration, which is determined by normalizing the histogram of the state values.
The Shannon entropy
H is given by:
where
is the probability of the state
occurring. In our simulation, we calculate the probabilities by binning the state values and normalizing them to obtain a probability density function (PDF). The binning is performed using
k bins, which provides a robust estimate of the distribution of states as the system evolves.
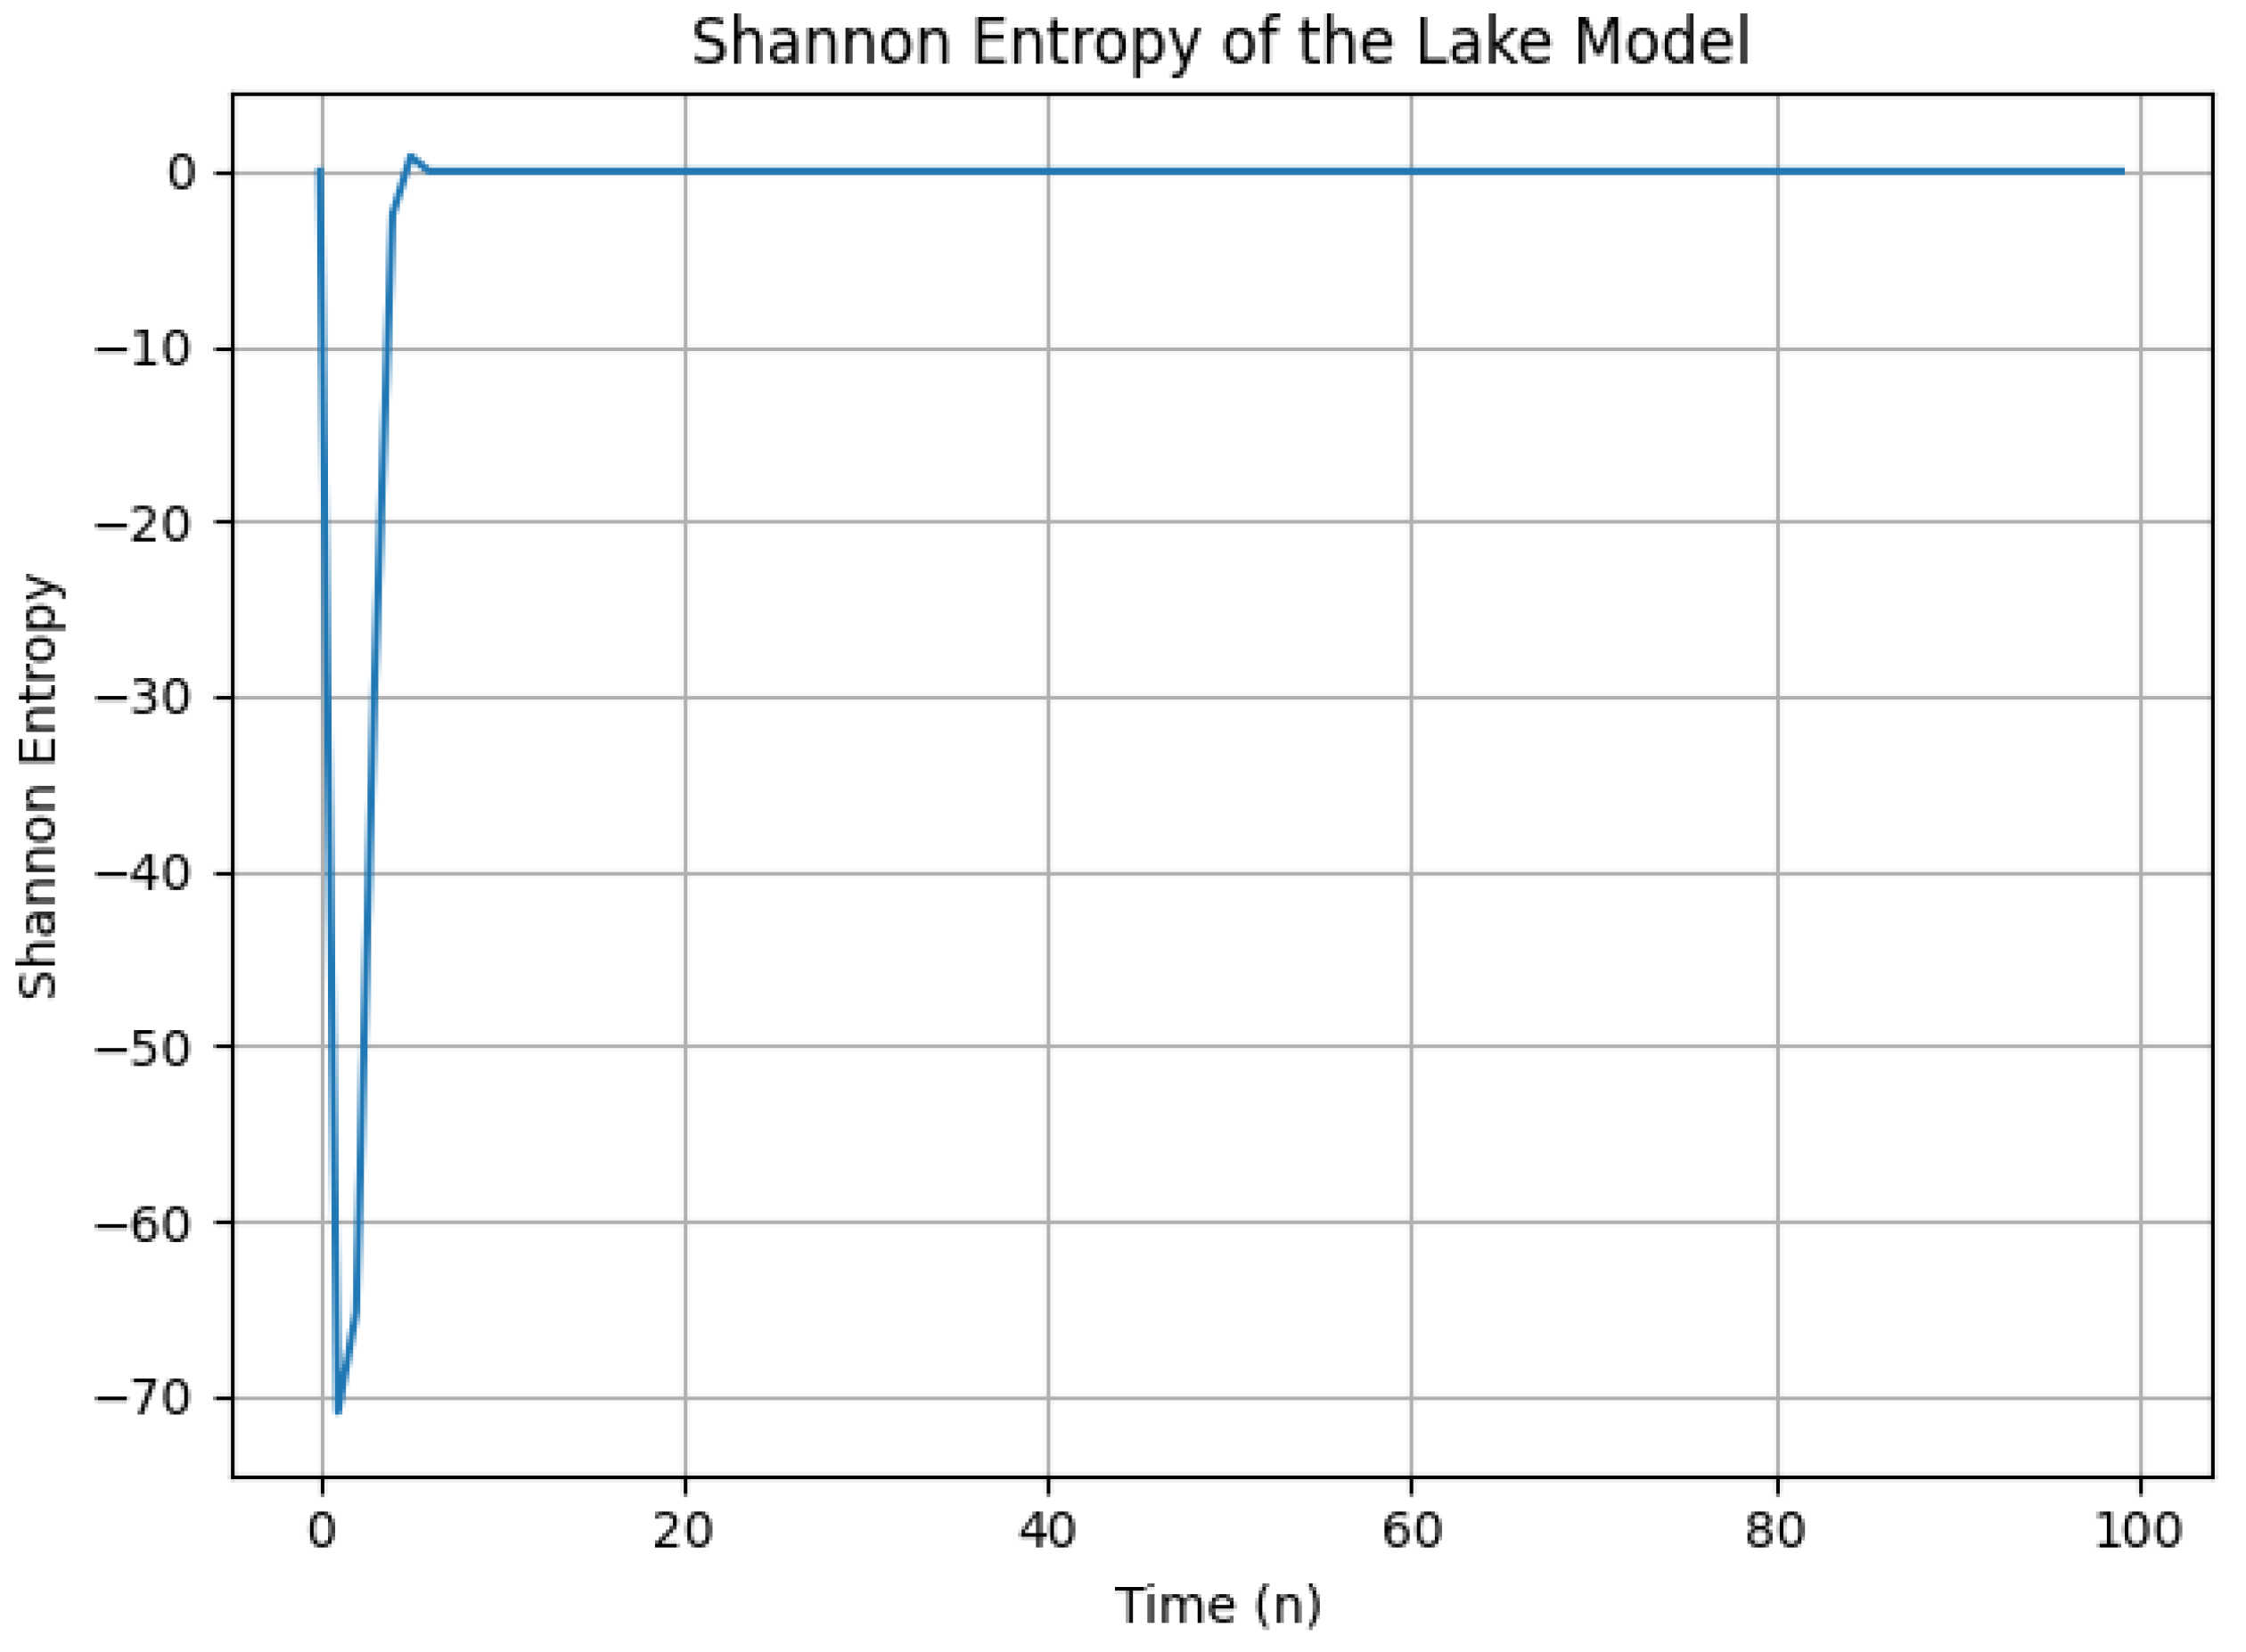
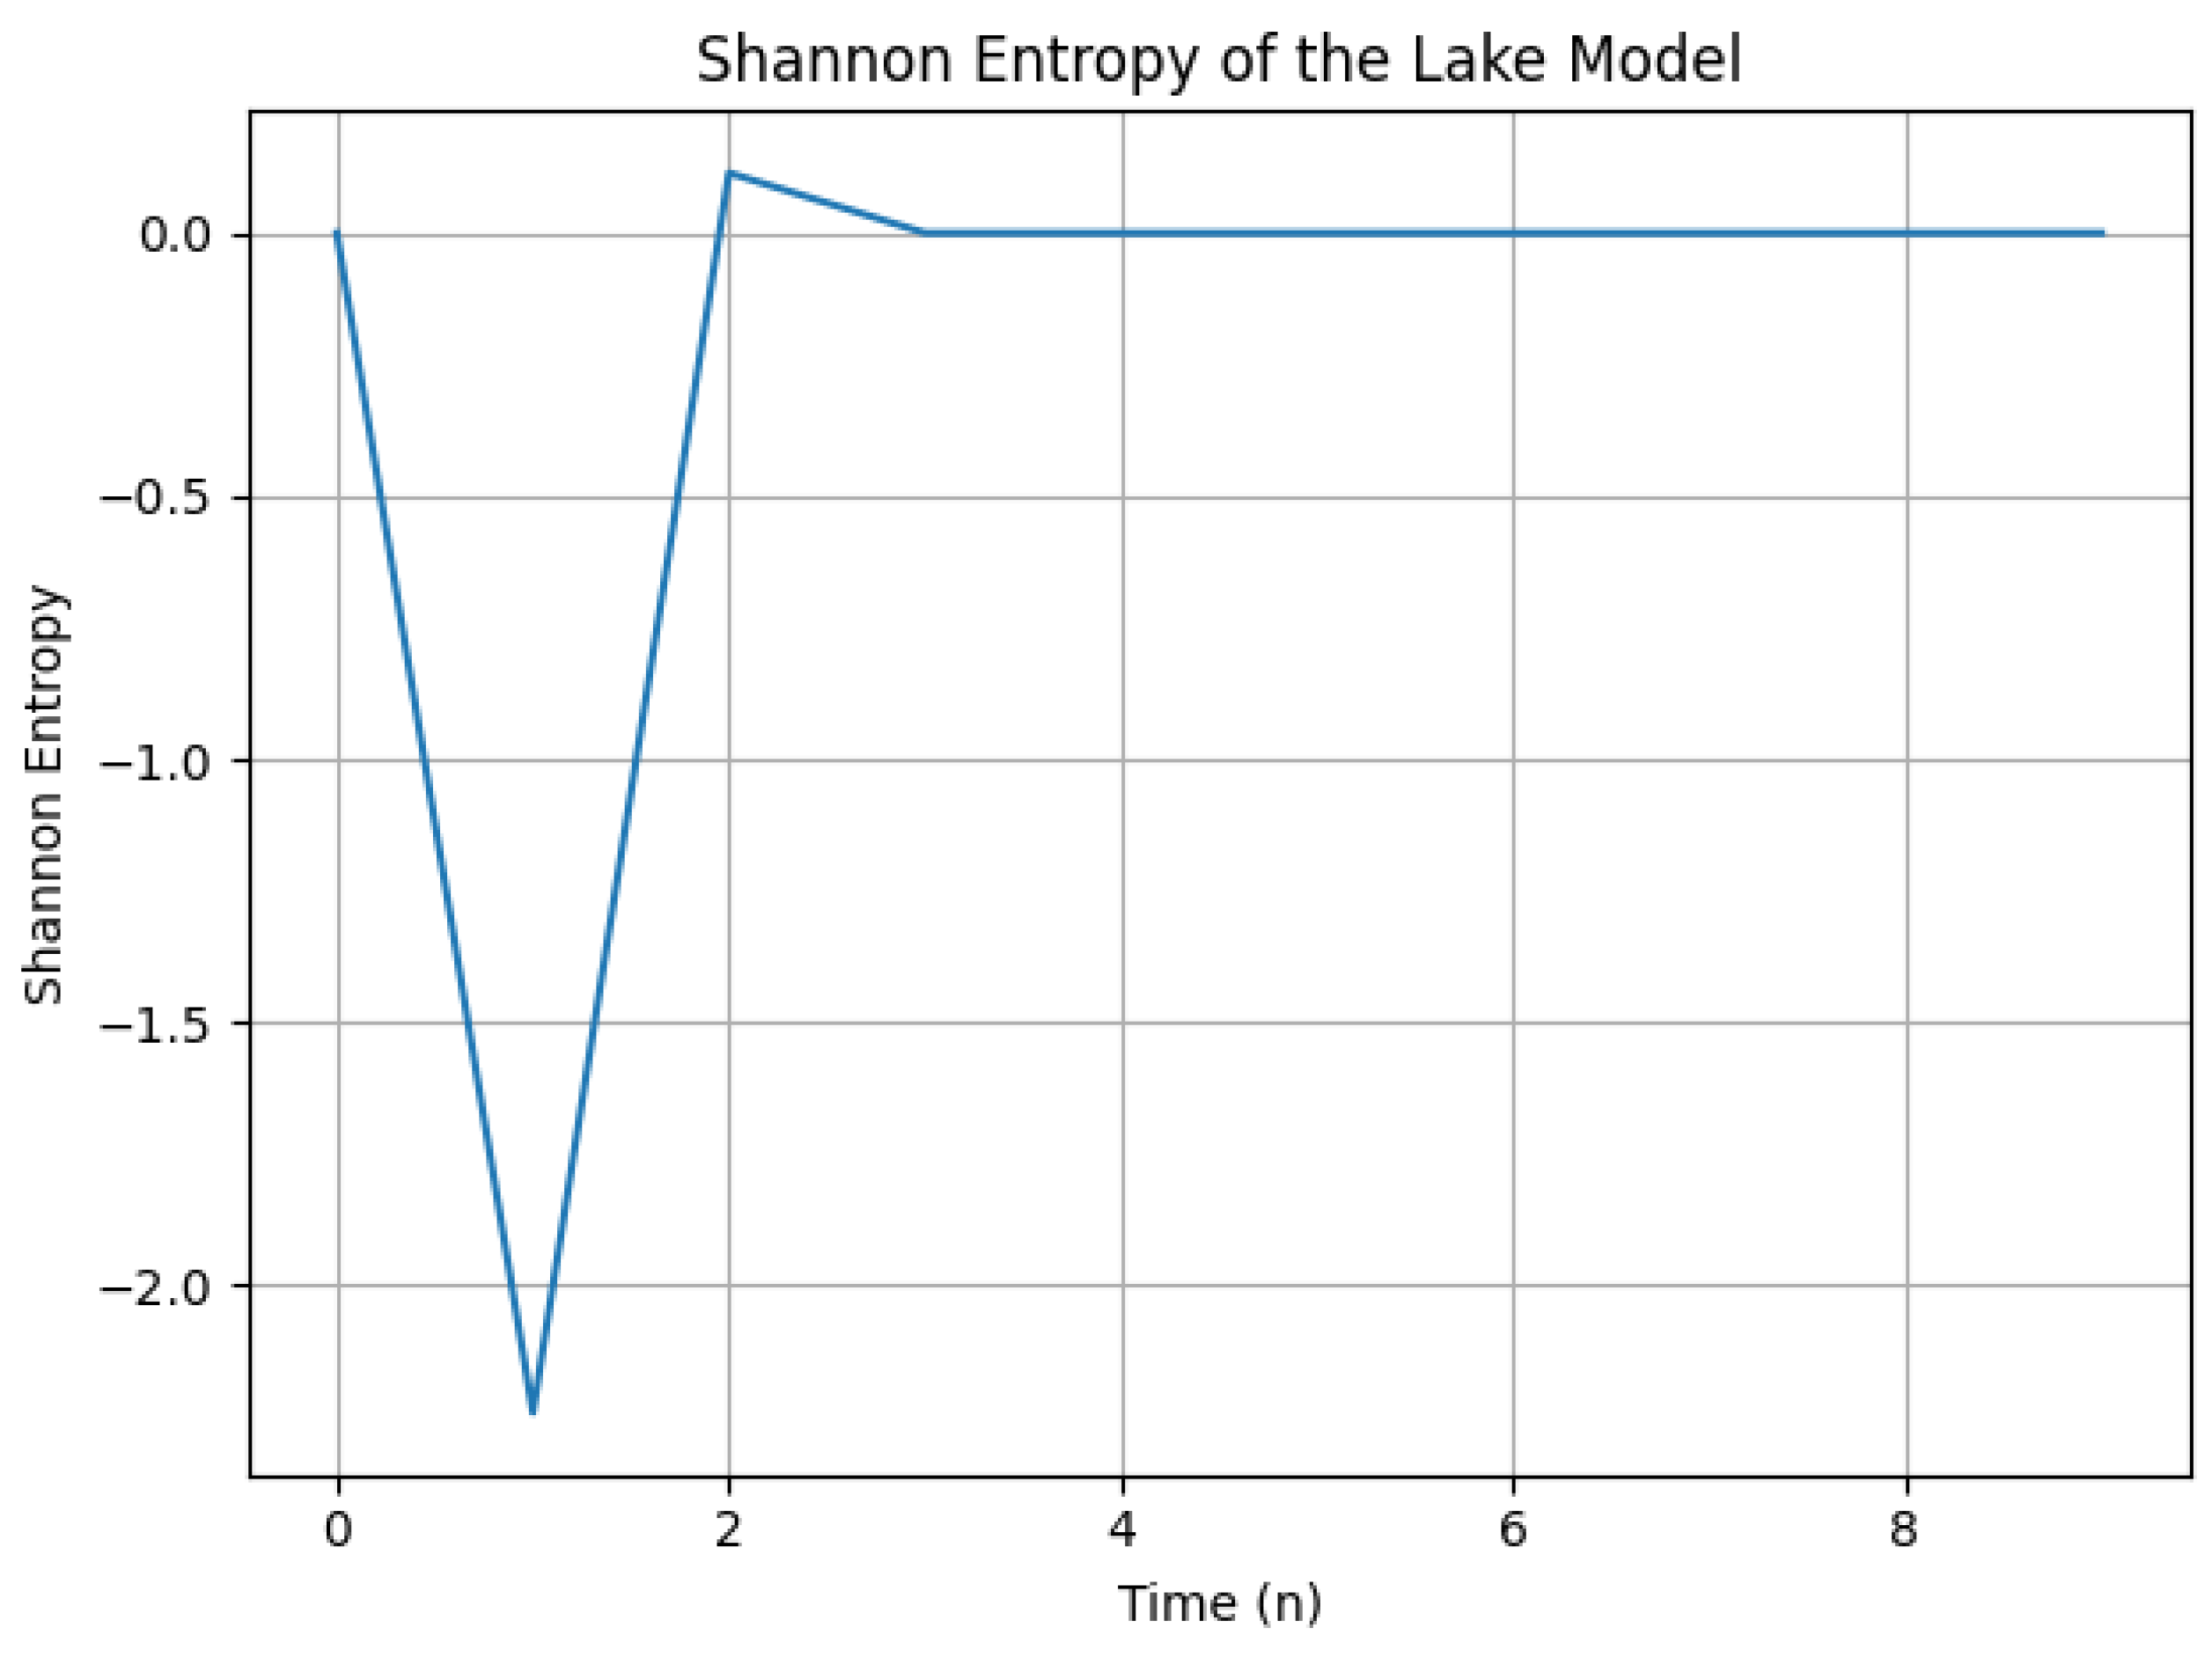
The resulting Shannon entropy plot (
Figure 8) illustrates the system’s complexity over time under the influence of varying
and very small
.
Shannon Entropy and System Complexity
Shannon entropy serves as a measure of uncertainty or randomness in the system. Within the context of our lake model, a higher entropy indicates increased complexity and unpredictability of the system’s behavior, while lower entropy suggests a more predictable state.
Observations from the Plot
The specific trend of the Shannon entropy in the plot may reveal the following characteristics:
Initial Behavior: The entropy may start from a low value, indicating a relatively simple state of the system at the beginning.
Potential Rise: As the system iterates (as time progresses), the entropy could potentially increase, suggesting that the system’s behavior becomes more complex and unpredictable over time.
Possible Fluctuations: The entropy may exhibit fluctuations throughout the iterations, indicating varying levels of complexity depending on the state.
Interpretation
The observed increase or fluctuations in Shannon entropy suggest that the lake model exhibits increasing complexity as decreases exponentially and increases linearly with time. This implies that even minimal external phosphorus loading can lead to chaotic dynamics within the system.
Ecological Interpretation
In ecological terms, the results imply that as the external phosphorus loading () approaches negligible values, the internal dynamics, driven by the recycling rate (), dominate the system’s behavior. The increase in complexity and unpredictability reflects the sensitivity of the lake ecosystem to changes in internal phosphorus cycling. This underscores the importance of managing phosphorus levels to avoid tipping points that could lead to chaotic and potentially harmful outcomes for the lake ecosystem.
Furthermore, we may explore the behavior of the lake model for larger values of by considering . This change will allow us to investigate how the system’s dynamics shift when external phosphorus loading is significantly increased.
3.4. Shannon Entropy Analysis with Large Alpha
This subsection builds upon the previous analysis of Shannon entropy in the lake model. Here, we explore the scenario where
is chosen to be a large value, specifically
. The corresponding plot of Shannon entropy over time is depicted in
Figure 9.
Observations from the Plot:
The specific trend of the Shannon entropy in the plot may reveal the following characteristics based on the behavior with large :
Potential Initial Rise: Similar to the previous case, the entropy may start from a low value and then increase initially, indicating a rise in complexity as the system iterates.
Possible Peak Around -3: The plot is expected to exhibit a peak in entropy around or 3. This suggests that the system’s complexity might reach a maximum around this time.
Potential Decrease or Fluctuations: Following the peak, the entropy could decrease or fluctuate, which might indicate a transition towards a less complex state or suggest varying levels of complexity depending on the system state.
Interpretation:
The anticipated peak in Shannon entropy around -3 suggests that the lake model exhibits the highest complexity when is large and increases exponentially with . This implies that the system’s behavior becomes most intricate and unpredictable around this specific time interval. The possible decrease or fluctuations after the peak could indicate a transition towards a less complex state or a system with inherent variability.
Comparison with Small Alpha:
It is informative to compare this behavior with the case of small (i.e., ) analyzed earlier. In that scenario, the entropy was expected to generally increase over time, suggesting growing complexity. Here, with a large , the complexity appears to peak and potentially decrease, indicating a different dynamical regime.
The Shannon entropy plot for a large suggests that the lake model exhibits peak complexity at a specific time interval. This behavior contrasts with the case of small and highlights the dependence of the system’s dynamics on the chosen value.
4. Complexity Measure of Our Lake Model Using Kolmogorov-Sinai Entropy
Based on the numerical simulations conducted for the lake model with both large and small values of , we observed that the system displays chaotic behavior in both cases. In this section, we present a theoretical approach to demonstrate the chaotification of the lake model for both large and small times, using Kolmogorov-Sinai entropy (K-S entropy) as a measure of system complexity.
The lake model is defined by the recurrence relation:
where
and
are parameters, with
taking values that either decrease or increase exponentially with
n. For large
n, where
, the behavior of
can be approximated by:
as
dominates other terms in the recurrence relation. This rapid growth introduces significant sensitivity to initial conditions, increasing the system’s complexity with each iteration.
To quantify this complexity, we consider the Kolmogorov-Sinai entropy
, which reflects the average rate of information production in the system. For the lake model, as
grows, each time step requires finer partitions of the state space to capture the evolution accurately, resulting in an entropy rate
that grows quadratically:
Thus, the K-S entropy is given by:
indicating a high level of complexity, particularly for large
n. This theoretical result aligns with our numerical observations, supporting the conclusion that the lake model exhibits chaotic behavior across different time scales. The exponential scaling of
fundamentally drives this chaos, as the system becomes increasingly sensitive and unpredictable over time.
5. Analysis and Discussion of the New Ecosystem Model
In this section, we analyze the dynamics of the lake model defined by the recursive formula:
To investigate the stability and potential for chaos in the system, we compute the Lyapunov exponents for varying values of while fixing at . The Lyapunov exponent provides a quantitative measure of the sensitivity of the system to initial conditions. Positive Lyapunov exponents indicate chaotic behavior, while negative values suggest stability and predictability.
5.1. Varying with Fixed
We varied the parameter
over the range
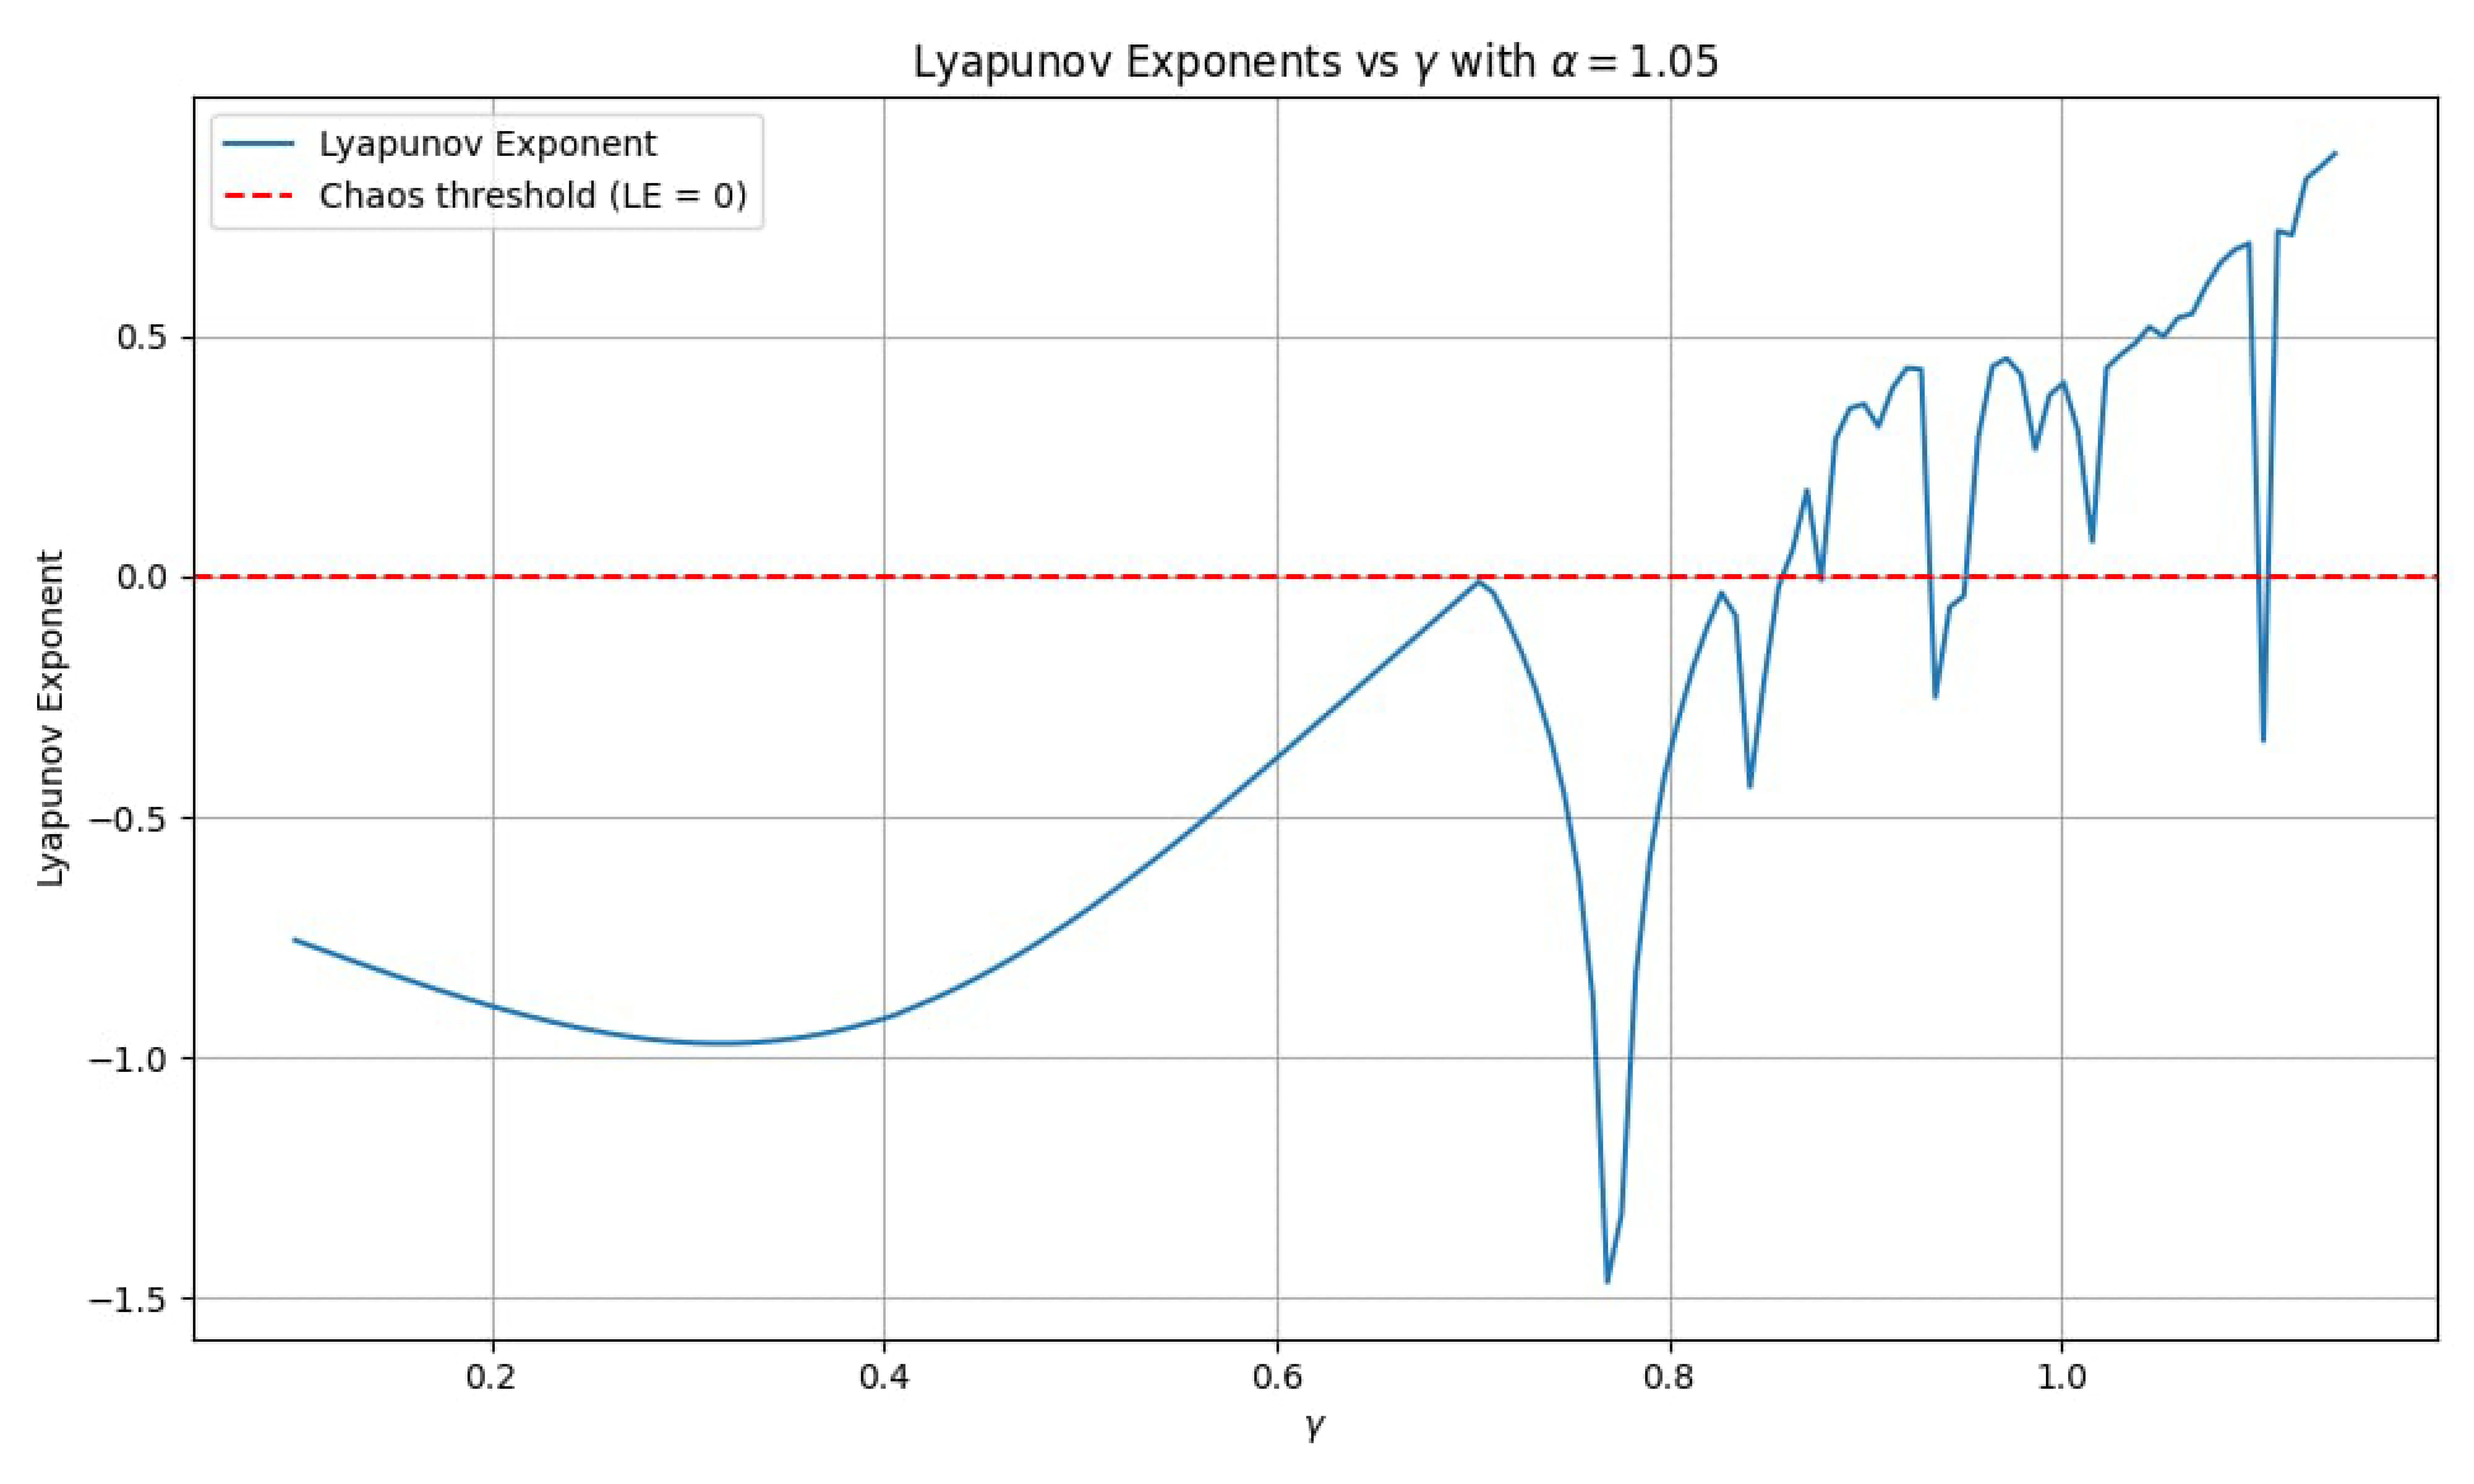
, and computed the corresponding Lyapunov exponents. The results are plotted in
Figure 10. As shown in the figure, for lower values of
, the Lyapunov exponent remains negative, indicating a stable and predictable system. However, as
increases beyond approximately
, the Lyapunov exponents exhibit a marked shift, crossing the zero threshold and taking on positive values, suggesting a transition to chaotic behavior.
This behavior reflects the ecological interpretation of the model. At lower values of , the system remains in a stable state, which could correspond to a lake ecosystem where nutrient dynamics and algae growth are relatively controlled and predictable. However, as the internal phosphorus recycling rate (modeled by ) increases, the system begins to exhibit more complex and less predictable dynamics, indicative of eutrophication where algal blooms and phosphorus dynamics lead to destabilization of the ecosystem.
The shift to chaotic dynamics as increases reflects the potential for sudden and unpredictable changes in the lake’s ecosystem, such as algal blooms, which can drastically alter water quality and biodiversity. This behavior is consistent with phenomena such as the hydra effect and the paradox of enrichment, where increased mortality or nutrient richness destabilizes the system, leading to oscillatory or chaotic behavior.
5.2. Predictability and Chaotification
The analysis of the Lyapunov exponents clearly demonstrates the potential for chaotification of the lake model. The initial negative values of the Lyapunov exponents suggest that, for small , the system is predictable and stable. However, as increases beyond a critical threshold, the positive Lyapunov exponents indicate the onset of chaos. This implies that small changes in the initial conditions can lead to exponentially diverging outcomes, making long-term prediction of the system’s state impossible.
In ecological terms, this suggests that lake systems with higher internal phosphorus recycling rates are more prone to chaotic behavior, making it more difficult to manage and predict the long-term effects of nutrient loading on water quality. Effective management strategies for eutrophication should, therefore, aim to limit the rate of internal phosphorus recycling to avoid tipping the system into a chaotic regime [
10,
11].
In conclusion, the chaotification of the system as increases demonstrates the importance of controlling internal phosphorus recycling to maintain the predictability and stability of the lake ecosystem. The results suggest that management strategies must be designed to prevent the system from crossing the threshold into chaotic dynamics, where the predictability of nutrient dynamics and algal blooms becomes severely compromised.
5.3. Bifurcation Analysis: A Comparison to the Hénon Map
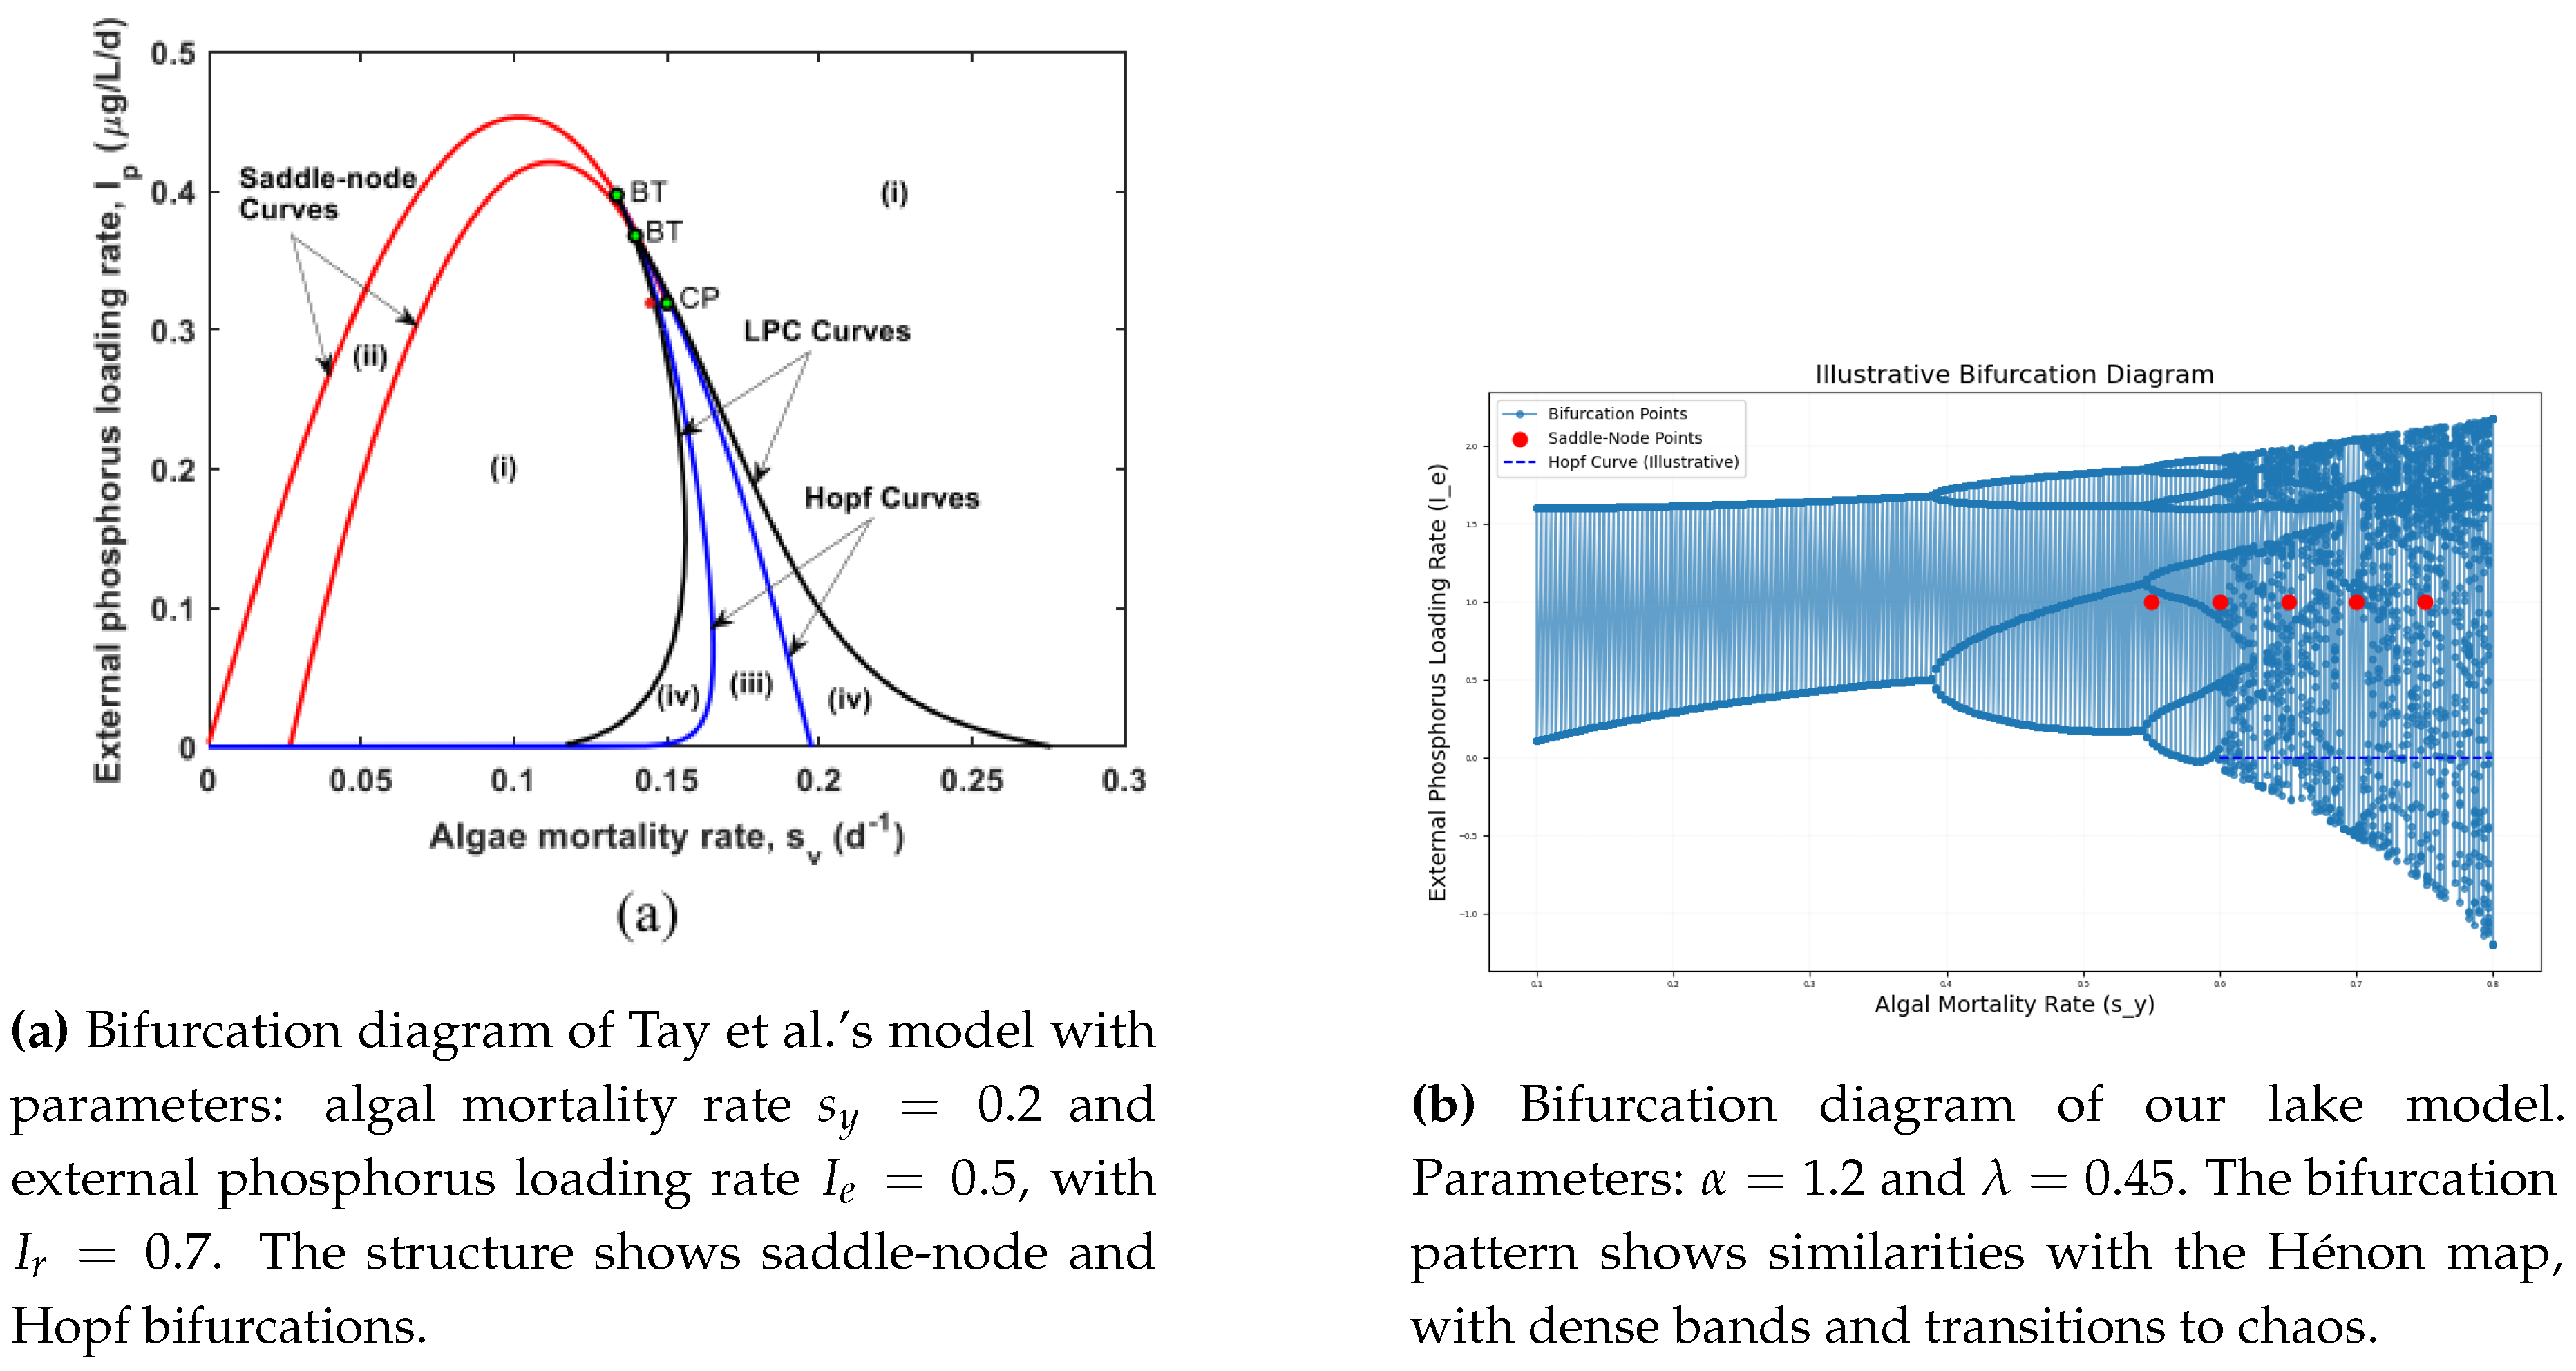
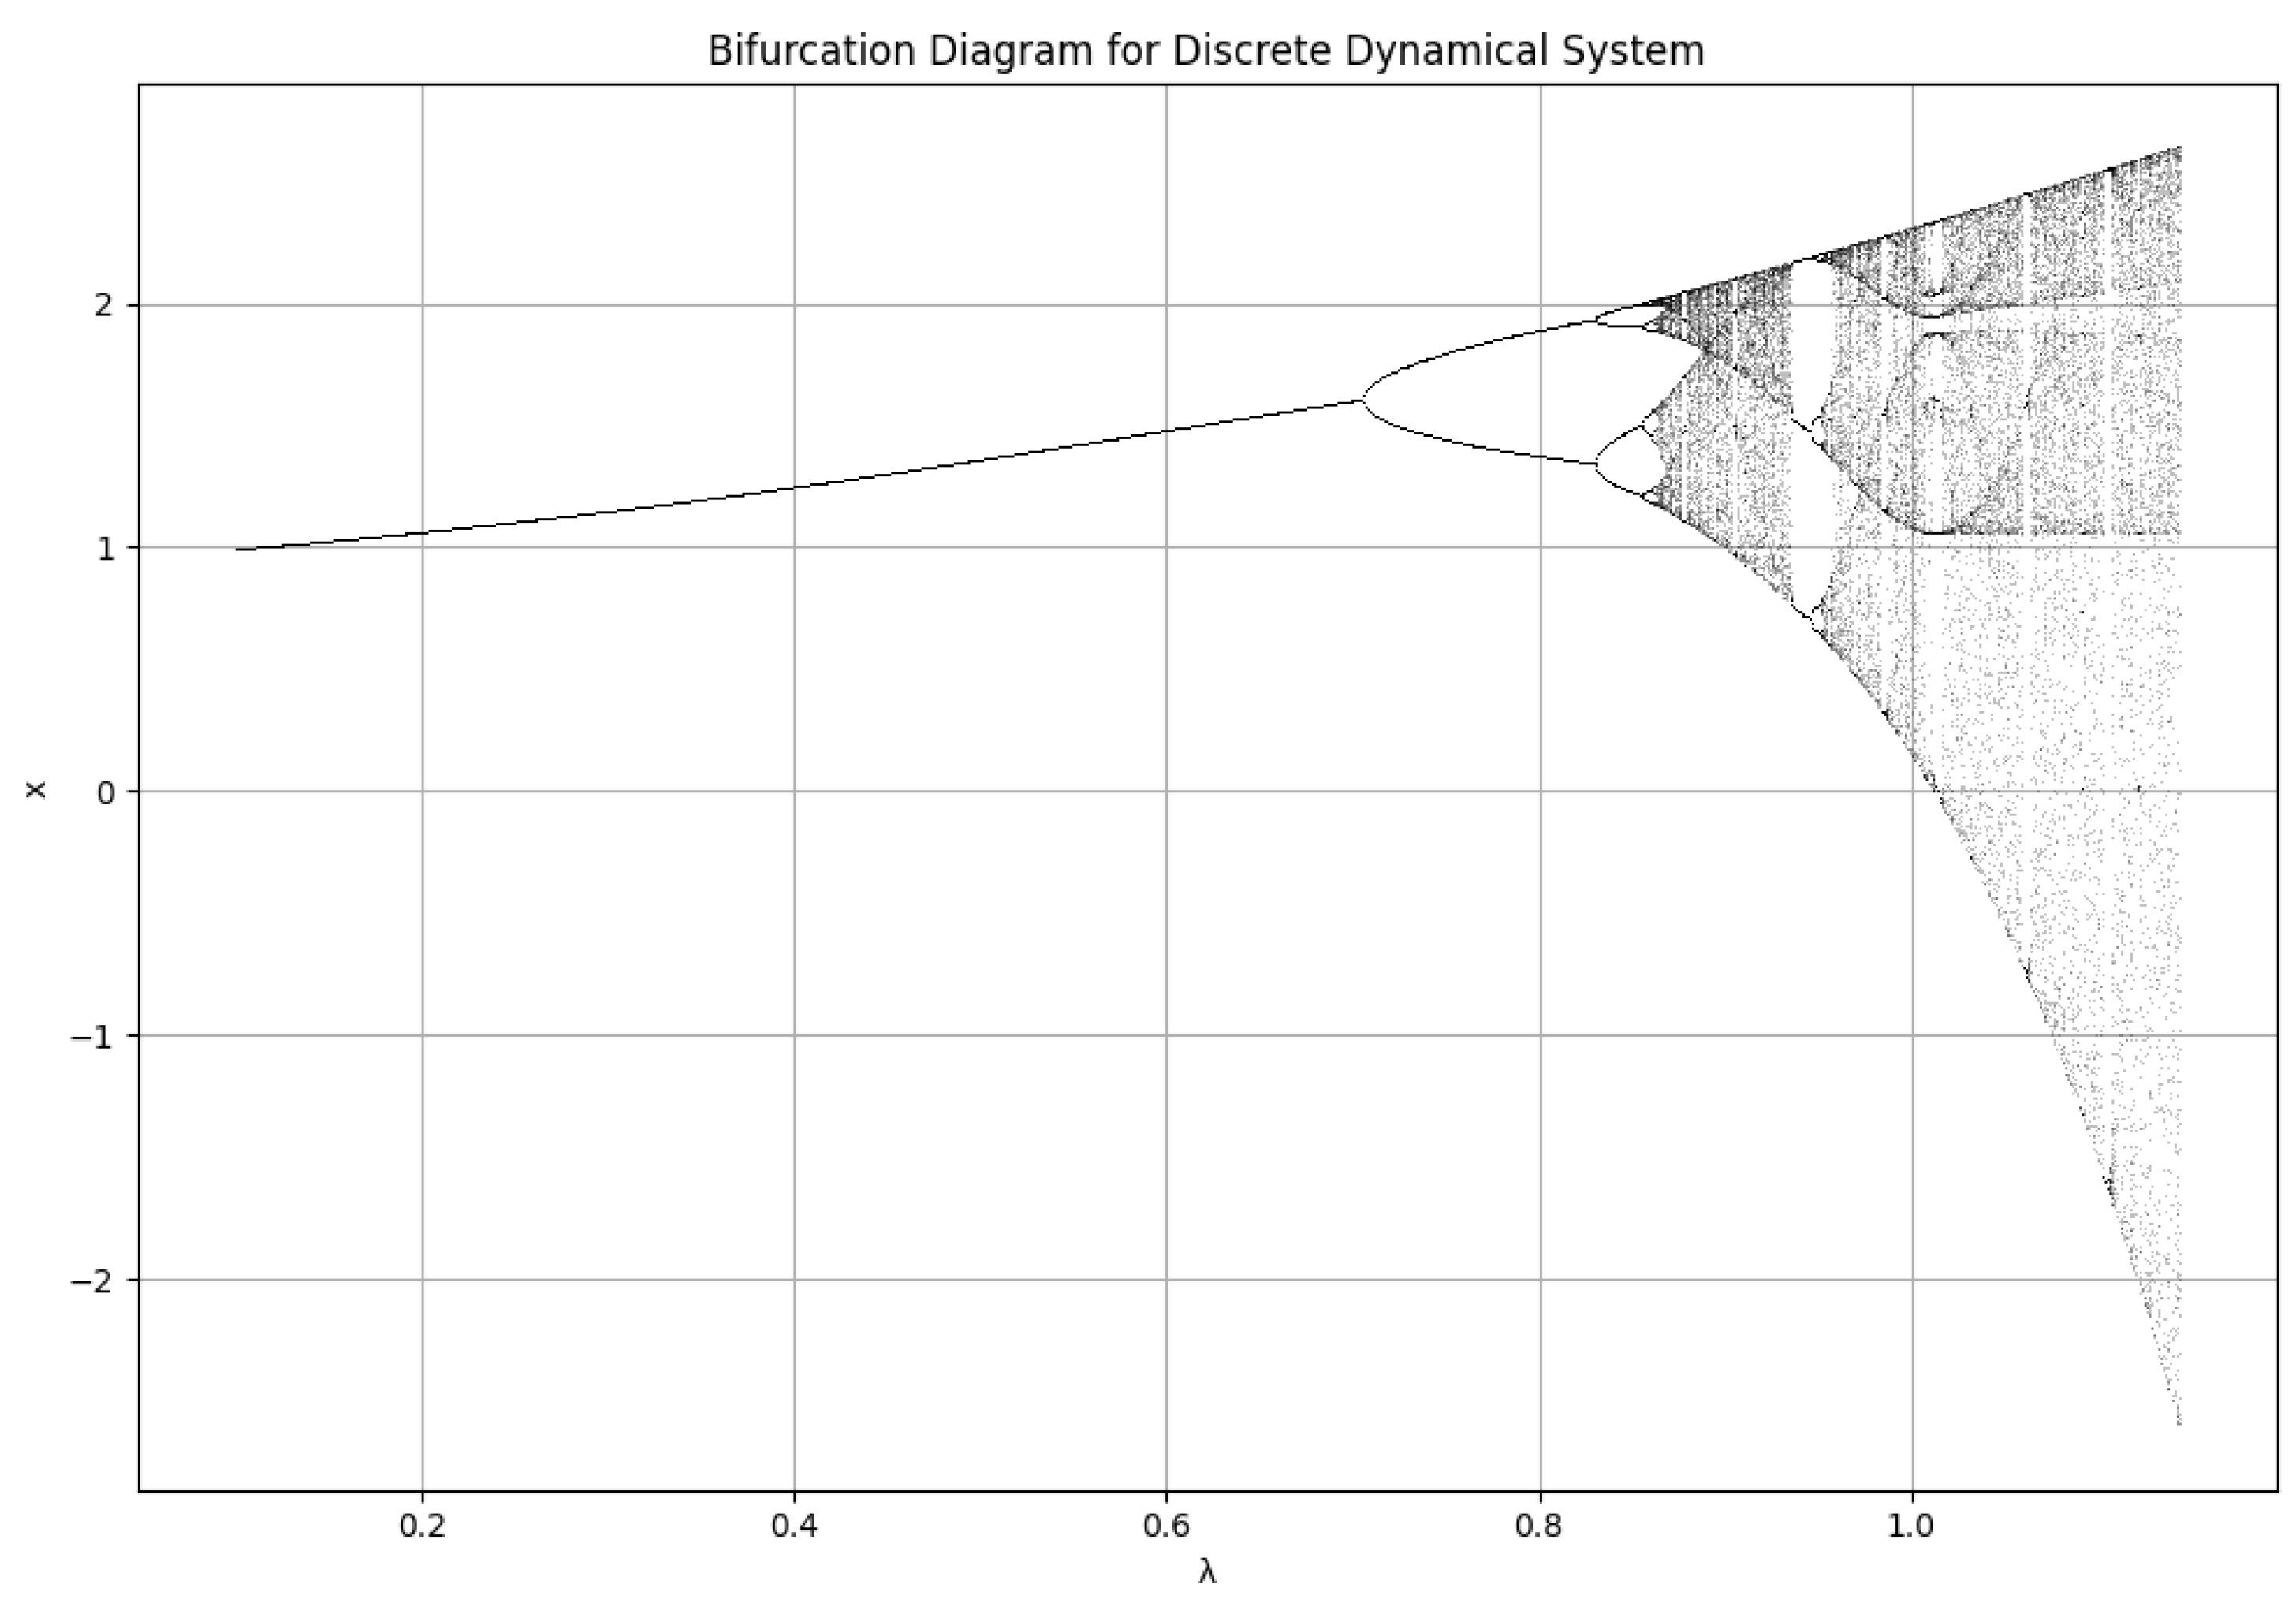
The bifurcation plot obtained for the lake ecosystem model exhibits a striking resemblance to the Hénon map, a well-known chaotic system. This similarity indicates that our model captures analogous dynamical behaviors, such as period-doubling bifurcations and chaotic regimes. Notably, the bifurcation analysis has been conducted in a one-dimensional setting, where the dynamics of the system are effectively represented as a function of a single parameter, .
Key features observed in the bifurcation plot (
Figure 11) include:
Period-Doubling Bifurcations: As the parameter increases, the system transitions from a stable fixed point to a period-2 orbit, followed by period-4, period-8, and so on. This sequence of bifurcations is characteristic of chaotic systems, suggesting that the lake ecosystem can exhibit a variety of periodic oscillations in response to changing internal phosphorus recycling rates. Such oscillations may correspond to seasonal variations in nutrient levels and algal biomass.
Chaotic Regime: Beyond the period-doubling cascade, the plot enters a chaotic regime. In this phase, the system’s behavior becomes highly sensitive to initial conditions, rendering long-term predictions impossible. This chaotic regime could symbolize unstable ecological states, such as eutrophication or algal blooms, where small perturbations—like nutrient input fluctuations—can lead to significant and unpredictable changes in the system dynamics [
11,
15].
Windows of Stability: Within the chaotic regime, there are instances where the system returns to periodic behavior, termed "windows of stability." These windows may represent temporary phases of ecological stability amidst otherwise chaotic fluctuations, allowing for moments of controlled nutrient dynamics before the system spirals back into instability. Recognizing these windows is essential for effective lake management, as they could provide opportunities for intervention and mitigation.
The resemblance to the Hénon map underscores that the lake ecosystem is a complex and sensitive system with the potential for chaotic behavior. This highlights the necessity for careful management strategies to avoid undesirable ecological states and ensure the long-term health of lake ecosystems.
5.4. Concluding Ecological Insights
In conclusion, our analysis of Lyapunov exponents and bifurcation patterns reveals that as the internal phosphorus recycling rate (
) increases, the lake ecosystem model transitions from a predictable, stable state to chaotic behavior. the lake ecosystem model transitions from a predictable, stable state to chaotic behavior. This transition illustrates how increased nutrient recycling could push real lakes into cycles of unpredictable algal blooms, reducing water quality and impacting biodiversity. The observed windows of stability suggest that lakes on the verge of chaotic behavior might still be managed through timely interventions to stabilize nutrient dynamics temporarily. This model thus provides insights into how maintaining control over nutrient cycling could help prevent the lake ecosystem from tipping into an undesirable chaotic regime [
13,
14,
17].
6. Comparative Analysis of Lake Eutrophication Dynamics: Our Model vs. Tay et al.’s Algae-Phosphorus Model
6.1. Purpose of Tay et al.’s Study
The study by Tay, Mohd, Teh, and Koh, titled
Internal Phosphorus Recycling and Eutrophication: A Complex Dynamic and published in
Theoretical Biology (2022), explores the impacts of internal phosphorus recycling on eutrophication dynamics in shallow lakes, with a case study of Tasik Harapan in Universiti Sains Malaysia. Their model examines how phosphorus recycling within the lake ecosystem drives complex behaviors like algal blooms, degrading water quality and complicating lake management. By developing a two-compartment model for algae and phosphorus, Tay et al. conduct a numerical bifurcation analysis, revealing dynamic complexities such as limit cycles, saddle-node bifurcations, and Hopf bifurcations. Their findings indicate that high rates of internal phosphorus recycling can lead to bistability and sudden shifts in ecosystem stability, emphasizing the importance of controlling internal phosphorus processes to mitigate eutrophication [
18,
19].
6.2. Comparative Model Frameworks
While Tay et al.’s model utilizes continuous differential equations to track algal and phosphorus concentrations over time, our model is based on a discrete-time recurrence relation designed to capture nutrient dynamics and algal growth. Both models offer unique insights into lake eutrophication but differ in their underlying mathematical structures and ecological assumptions. For clarity, we define our model as follows:
where:
: Represents the state of the system at the n-th time step (e.g., nutrient concentration or algal biomass).
: Quantifies external phosphorus loading, aligning with nutrient inflow factors in Tay et al.’s model.
: Describes nutrient uptake efficiency by algae, paralleling nutrient recycling and uptake dynamics in Tay et al.’s framework.
To enable direct comparison, we align our parameters with those in Tay et al.’s model:
in our model represents both external phosphorus loading and internal recycling, derived as:
where
is the external phosphorus input and
is the internal recycling rate in Tay et al.’s model.
in our model reflects nutrient uptake efficiency, set as:
with
b as the algal growth rate and
e as phosphorus excretion associated with grazing, analogous to the nutrient absorption factors in Tay et al.’s equations.
6.3. Parameter Definitions from Tay et al. (2022) Model
To better understand the mapping of Tay et al.’s parameters into our discrete model, we provide a summary of the key parameters from their model (
Table 1), which informs our choices for
and
. Tay et al.’s model is governed by two differential equations:
Key parameters include:
b: Algal growth rate, dictating algal proliferation based on available phosphorus.
and : External and internal phosphorus loading rates, respectively, which contribute to overall phosphorus levels.
: Half-saturation constant, regulating the growth response of algae to phosphorus.
: Percentage of phosphorus content in algae, affecting phosphorus depletion by algal uptake.
g: Grazing rate, representing zooplankton impact on algal biomass.
: Algal mortality rate, reducing algal biomass over time.
6.4. Bifurcation Analysis and Similarities with the Hénon Map
Figure 12.
Comparison of bifurcation diagrams for Tay et al.’s model (a) and our lake model (b). Both models show complex transitions, including periodic and chaotic dynamics influenced by phosphorus recycling and algal mortality rates.
Figure 12.
Comparison of bifurcation diagrams for Tay et al.’s model (a) and our lake model (b). Both models show complex transitions, including periodic and chaotic dynamics influenced by phosphorus recycling and algal mortality rates.
6.5. Influence of External Phosphorus Loading and Mortality Rate
In our model (
Figure 12b), the bifurcation structure exhibits sensitivity to changes in the phosphorus loading parameter
, much like the effect of
and
in Tay et al.’s model (
Figure 12a). Increased
values can lead to transitions from stable equilibrium to limit cycles or chaotic behavior. Similarly, Tay et al.’s model shows that increasing
and
induces bifurcation points that destabilize the lake ecosystem, highlighting the role of internal phosphorus cycling.
The comparison between our discrete model and Tay et al.’s continuous model reveals significant structural similarities. Both models exhibit complex bifurcation patterns, including periodic and chaotic regimes. The influence of external phosphorus loading and algal mortality rate shows that both systems are highly sensitive to nutrient dynamics, aligning with behavior observed in the Hénon map. These findings underscore the importance of phosphorus control in lake management to prevent eutrophication and maintain ecosystem stability [
15].
7. Conclusions
In this study, we developed a novel lake ecosystem model that integrates external phosphorus loading and internal nutrient recycling rates, providing insights into the complex dynamics of freshwater ecosystems. Our findings reveal that the model can exhibit a range of behaviors, from stable equilibria to chaotic oscillations, contingent on the values of the parameters and . Through bifurcation analysis, we identified critical transitions in ecosystem stability, illustrating the profound impact of nutrient dynamics on ecological outcomes.
The relationship between external phosphorus loading and internal recycling rates highlights the sensitivity of lake ecosystems to nutrient management. As we observed, variations in can lead to both predictable stability and chaotic behavior, underscoring the delicate balance necessary for maintaining ecological health. The attractive nature of certain fixed points suggests potential stable states, while the identified instabilities point towards the risk of chaotic dynamics under specific parameter combinations.
Furthermore, our results align closely with the findings of Tay et al., demonstrating that heightened internal recycling rates can precipitate bistability and abrupt shifts in ecosystem dynamics. This connection emphasizes the broader implications for real-world freshwater management, where nutrient loading and recycling play crucial roles in determining ecosystem stability and resilience.
Overall, this study enhances our understanding of nutrient cycling in lake ecosystems and highlights the necessity for effective management strategies to mitigate the risk of harmful algal blooms and maintain biodiversity. Future research should focus on refining the model further and exploring additional ecological factors, such as species interactions and environmental changes, to develop more comprehensive frameworks for predicting and managing freshwater ecosystems.
8. Future Research
Future research on our lake ecosystem model can take several promising directions. One potential avenue involves employing modern methods to explore the chaotification and bifurcation of the model in higher dimensions. Utilizing advanced mathematical tools and computational techniques, we can better understand the dynamic behavior of the system under varying ecological parameters. This approach may reveal intricate patterns of stability and instability, offering deeper insights into the conditions that lead to chaotic behavior in aquatic ecosystems.
Additionally, we aim to extend the model to capture other ecological scenarios, such as cancer evolution. By adapting our framework to represent tumor dynamics, we can investigate the complexity of cancer progression using metrics like Shannon entropy. This adaptation could facilitate a better understanding of how nutrient dynamics influence tumor growth and behavior, ultimately contributing to strategies for reducing cancer incidence and improving treatment outcomes.
Furthermore, our model can serve as a crucial tool for public health awareness, emphasizing the dangers associated with nutrient pollution and its potential to exacerbate harmful algal blooms. By modeling the ecological impacts of nutrient loading on lake ecosystems, we can inform policymakers and conservationists about the necessary precautions to safeguard these vital resources.
Overall, the interdisciplinary applications of our model underscore its potential to address critical challenges in both ecology and health. Continued research will not only enhance our understanding of complex systems but also foster innovative strategies for managing and protecting both freshwater ecosystems and public health.
Data Availability Statement
The data supporting the findings of this study are available upon reasonable request from the corresponding author. The analysis conducted in this research builds upon existing literature, particularly the work of Tay et al. (2022) regarding nutrient recycling in algae-phosphorus models and Alamino (2015) on measuring complexity through average symmetry.
Conflicts of Interest
The authors declare that there are no conflicts of interest regarding the publication of this paper. The research was conducted without any financial or personal relationships that could have influenced the results or interpretations presented herein.
References
- Chai Jian Tay, Mohd Hafiz Mohd, Su Yean Teh, Hock Lye Koh, Internal phosphorus recycling promotes rich and complex dynamics in an algae-phosphorus model: Implications for eutrophication management. Journal of Theoretical Biology 2022, 532, 110913. [CrossRef]
- Bo Wang, Qianqian Qi, Modeling the lake eutrophication stochastic ecosystem and the research of its stability. Mathematical Biosciences 2018, 300, 102–114. [CrossRef]
- Rafik, Z. , Humberto Salas, A. Chaotic dynamics and zero distribution: implications and applications in control theory for Yitang Zhang’s Landau Siegel zero theorem. European Physical Journal Plus 2024, 139, 217. [Google Scholar] [CrossRef]
- Roberto, C. Alamino, Measuring complexity through average symmetry. Journal of Physics A: Mathematical and Theoretical 2015, 48. [Google Scholar] [CrossRef]
- F.R. Marotto, Chaotic behavior in the Hénon mapping. Communications in Mathematical Physics 1979, 68, 187–194. [CrossRef]
- J.H. Curry, On the Hénon transformation. Preprint National Center for Atmospheric Research, Boulder, Colorado. 1978.
- M. Hénon, A two-dimensional mapping with a strange attractor. Communications in Mathematical Physics 1976, 50, 69–77.
- T.-Y. Li, J.A. T.-Y. Li, J.A. Yorke, Period three implies chaos. American Mathematical Monthly 1975, 82, 985–992. [Google Scholar]
- E.N. Lorenz, Deterministic nonperiodic flow. Journal of Atmospheric Sciences 1963, 20, 130–141.
- F.R. Marotto, Chaotic behavior in discrete dynamical systems with application to ecology. Doctoral Thesis, Boston University, Boston, Mass., 1977.
- F.R. Marotto, Perturbations of stable and chaotic difference equations. Journal of Mathematical Analysis and Applications, to appear, 1979.
- M. Boersma, C.P. M. Boersma, C.P. Vanschalk, P. Hogeweg, Nutrient gradients and spatial structure in tropical forests - a model study. Ecological Modelling 1991, 55, 219–240. [Google Scholar]
- H. Caswell, Theory and models: a different perspective. Ecological Modelling 1988, 43, 33–44.
- F. Crick, What Made Pursuit. Basic Books, New York, NY, 1988.
- P.H. Crowley, Density dependence, boundedness, and attraction: detecting stability in stochastic systems. Oecologia 1992, 90, 246–252.
- V. Grimm, E. V. Grimm, E. Schmidt, C. Wissel, On the application of stability concepts in ecology. Ecological Modelling 1992, 63, 143–161. [Google Scholar]
- C.A.S. Hall, An assessment of several of the historically most influential theoretical models used in ecology and the data provided in their support. Ecological Modelling 1988, 43, 5–31.
- C.A.S. Hall, An idiosyncratic assessment of the role of mathematical models in environmental sciences. Environment International 1991, 17, 507–517.
- F. Jeltsch, Modelle zu natürlichen Waldsterbephänomenen. Doctoral Thesis, Philipps-Universität Marburg, Germany. 1992.
- D. Yang, Y. D. Yang, Y. Zhang, W. Chen, The Lake Ecosystem: Structure and Development. In: B. Qin (eds) Lake Taihu, China. Monographiae Biologicae, vol 87. Springer, Dordrecht. [CrossRef]
- Yönet, N. , Gürbüz, B. & Gökçe, A. An alternative numerical approach for an improved ecological model of interconnected lakes with a fixed pollutant. Computers and Applied Mathematics 2023, 42, 56. [Google Scholar] [CrossRef]
|
Disclaimer/Publisher’s Note: The statements, opinions and data contained in all publications are solely those of the individual author(s) and contributor(s) and not of MDPI and/or the editor(s). MDPI and/or the editor(s) disclaim responsibility for any injury to people or property resulting from any ideas, methods, instructions or products referred to in the content. |
© 2024 by the author. Licensee MDPI, Basel, Switzerland. This article is an open access article distributed under the terms and conditions of the Creative Commons Attribution (CC BY) license (https://creativecommons.org/licenses/by/4.0/).
