Submitted:
31 October 2024
Posted:
31 October 2024
You are already at the latest version
Abstract
This study explores the classification of seven registered dry bean species using a dataset of 13,611 grain samples characterized by 16 features, including both dimensional and shape measurements. The primary objective was to develop robust Machine Learning models to accurately identify species while addressing challenges related to class imbalance and feature redundancy. A series of classification algorithms, including Decision Trees (DT), Random Forests (RF), k-Nearest Neighbors (KNN), Support Vector Machines (SVM), and Multi-Layer Perceptrons (MLP), were applied to evaluate their performance under various data conditions. Notably, the MLP model exhibited superior performance due to its capacity to capture complex patterns in high-dimensional data, achieving the highest classification accuracy. Random Forest models showed resilience to class imbalance, though misclassifications between similar species highlighted the need for improved feature selection. The results indicate that effective feature engineering and careful model tuning are crucial for enhancing classification accuracy in agricultural applications. The study concludes that future work should aim to expand the dataset and explore advanced data augmentation techniques to further improve model robustness and applicability in food security contexts. All code to recapitulate the analysis is available along with documentation of pipeline usage at https://github.com/jesusch10/beans_classification.
Keywords:
Dry beans
; Machine Learning (ML)
; feature selection
; class imbalance
; Multi-Layer Perceptron
; Random Forest
; agricultural applications
; food security
1. Introduction
The classification of dry beans is a significant area of study within food science and agricultural biotechnology, with implications for food security and crop improvement. Recent advancements in Machine Learning (ML) algorithms have enabled more accurate and efficient classification of agricultural products, leveraging high-dimensional datasets that encompass various morphological and physical features (Mavani et al., 2022; Rehman et al., 2019; Salauddin et al., 2023). In the context of dry beans, these features include dimensions, shape characteristics, and surface properties, which can be quantitatively analyzed to distinguish between different species (Koklu et al., 2020; Mavani et al., 2022; Salauddin et al., 2023).
Research has shown that effective feature selection and data preprocessing are crucial for optimizing ML model performance, especially when dealing with imbalanced datasets common in agricultural classifications (Salauddin et al., 2023). Techniques such as oversampling can be employed to mitigate the impact of class imbalance; however, they may also lead to overfitting if not applied judiciously (Koeshardianto et al., 2023; Zhang et al., 2017). In this project, we explore the classification of seven registered dry bean species, focusing on the extraction of 16 relevant features, including area, perimeter, and various shape descriptors. The aim is to assess the performance of several ML algorithms, including Decision Trees (DT), Random Forests (RF), K-Nearest Neighbors (KNN), Support Vector Machines (SVM), and Multi-Layer Perceptrons (MLP), under both imbalanced and balanced conditions.
The use of ensemble methods like Random Forest has been highlighted for their robustness to class imbalance, enabling them to effectively capture the complexity of the data (Barbon et al., 2016; Breiman, 2001; Zhang et al., 2017). However, it is critical to evaluate whether certain features carry redundant information, particularly when high correlations are observed among shape descriptors (Hastie et al., 2009; Koeshardianto et al., 2023; Meenu et al., 2021). Our analysis reveals six features with strong correlations, raising concerns about potential overfitting. Therefore, we focus on optimizing the selection of informative features while evaluating model performance across various algorithms.
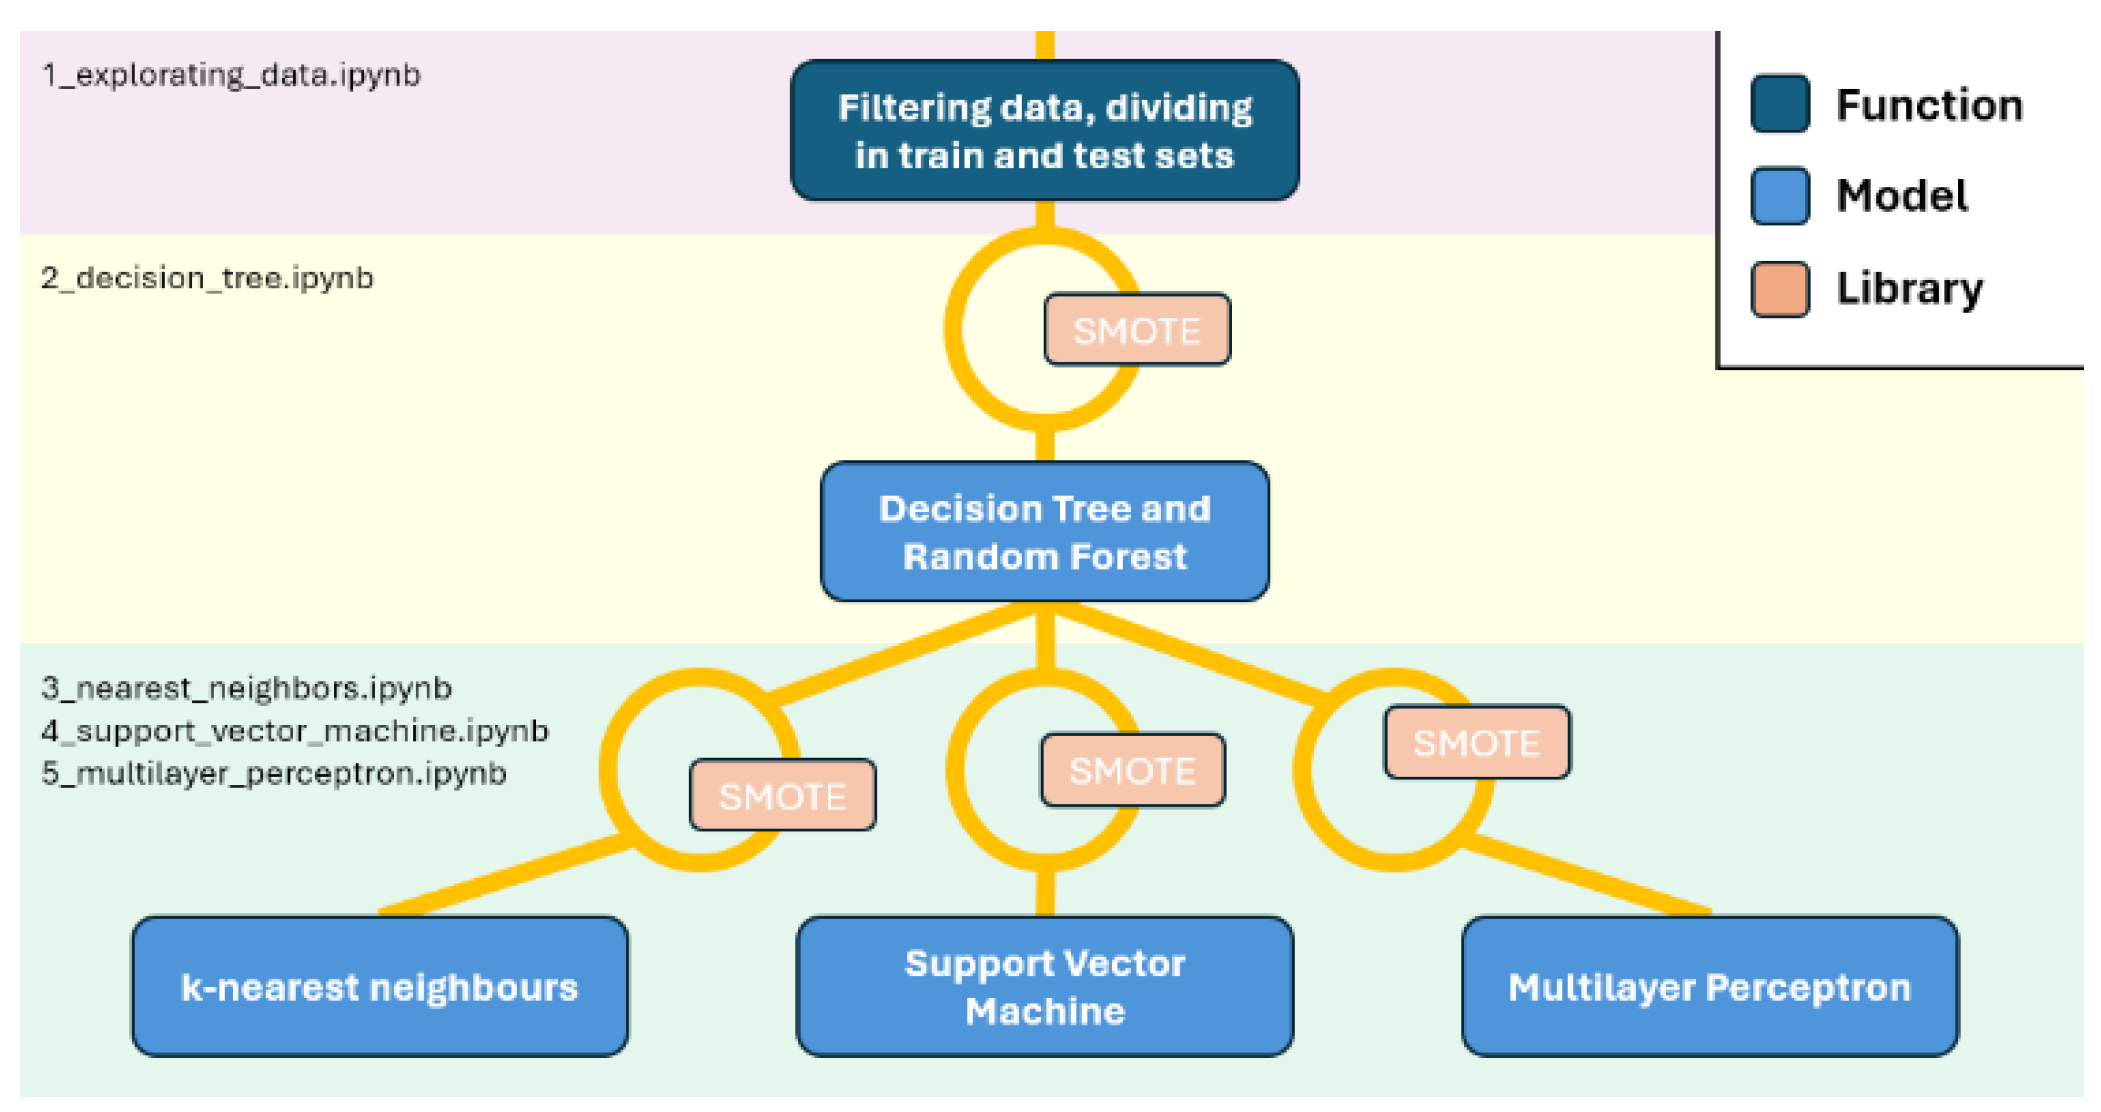
Furthermore, the integration of advanced feature engineering and hyperparameter tuning is essential for enhancing classification accuracy and generalization (Cortés et al., 2019). Through this project, we aim to contribute valuable insights into the application of ML techniques for agricultural product classification, providing a framework (Figure 1) that can be adapted to other food industry contexts (Mavani et al., 2022). All code to recapitulate the analysis is available along with documentation of pipeline usage at https://github.com/jesusch10/beans_classification.
2. Materials and Methods
2.1. Dataset Collection and Preprocessing
The dataset for this study was obtained from high-resolution images of 13,611 grains of seven different registered dry bean species (Koklu et al., 2020). Each grain was analyzed to extract a total of 16 features, including 12 dimensional attributes (e.g., area, perimeter, major axis length, minor axis length, convex area, and equivalent diameter) and 4 shape descriptors (ShapeFactor1, ShapeFactor2, ShapeFactor3, and ShapeFactor4). Notably, most features were continuous variables (float), while two features were integers, and one label was categorical (object). The dataset contained no missing values and was characterized by class imbalances across the various species.
Prior to model training, the dataset underwent several preprocessing steps. Duplicate entries (68 identical instances) were identified and removed to enhance the integrity of the dataset. To address class imbalance, the F1 score, a harmonic mean of precision and recall, was utilized as the primary evaluation metric for hyperparameter tuning (Zhang et al., 2017). Additionally, an oversampling technique was applied to augment the minority classes while being cautious of the potential for overfitting.
Figure 1.
Overview of the pipeline.
2.2. Feature Selection and Correlation Analysis
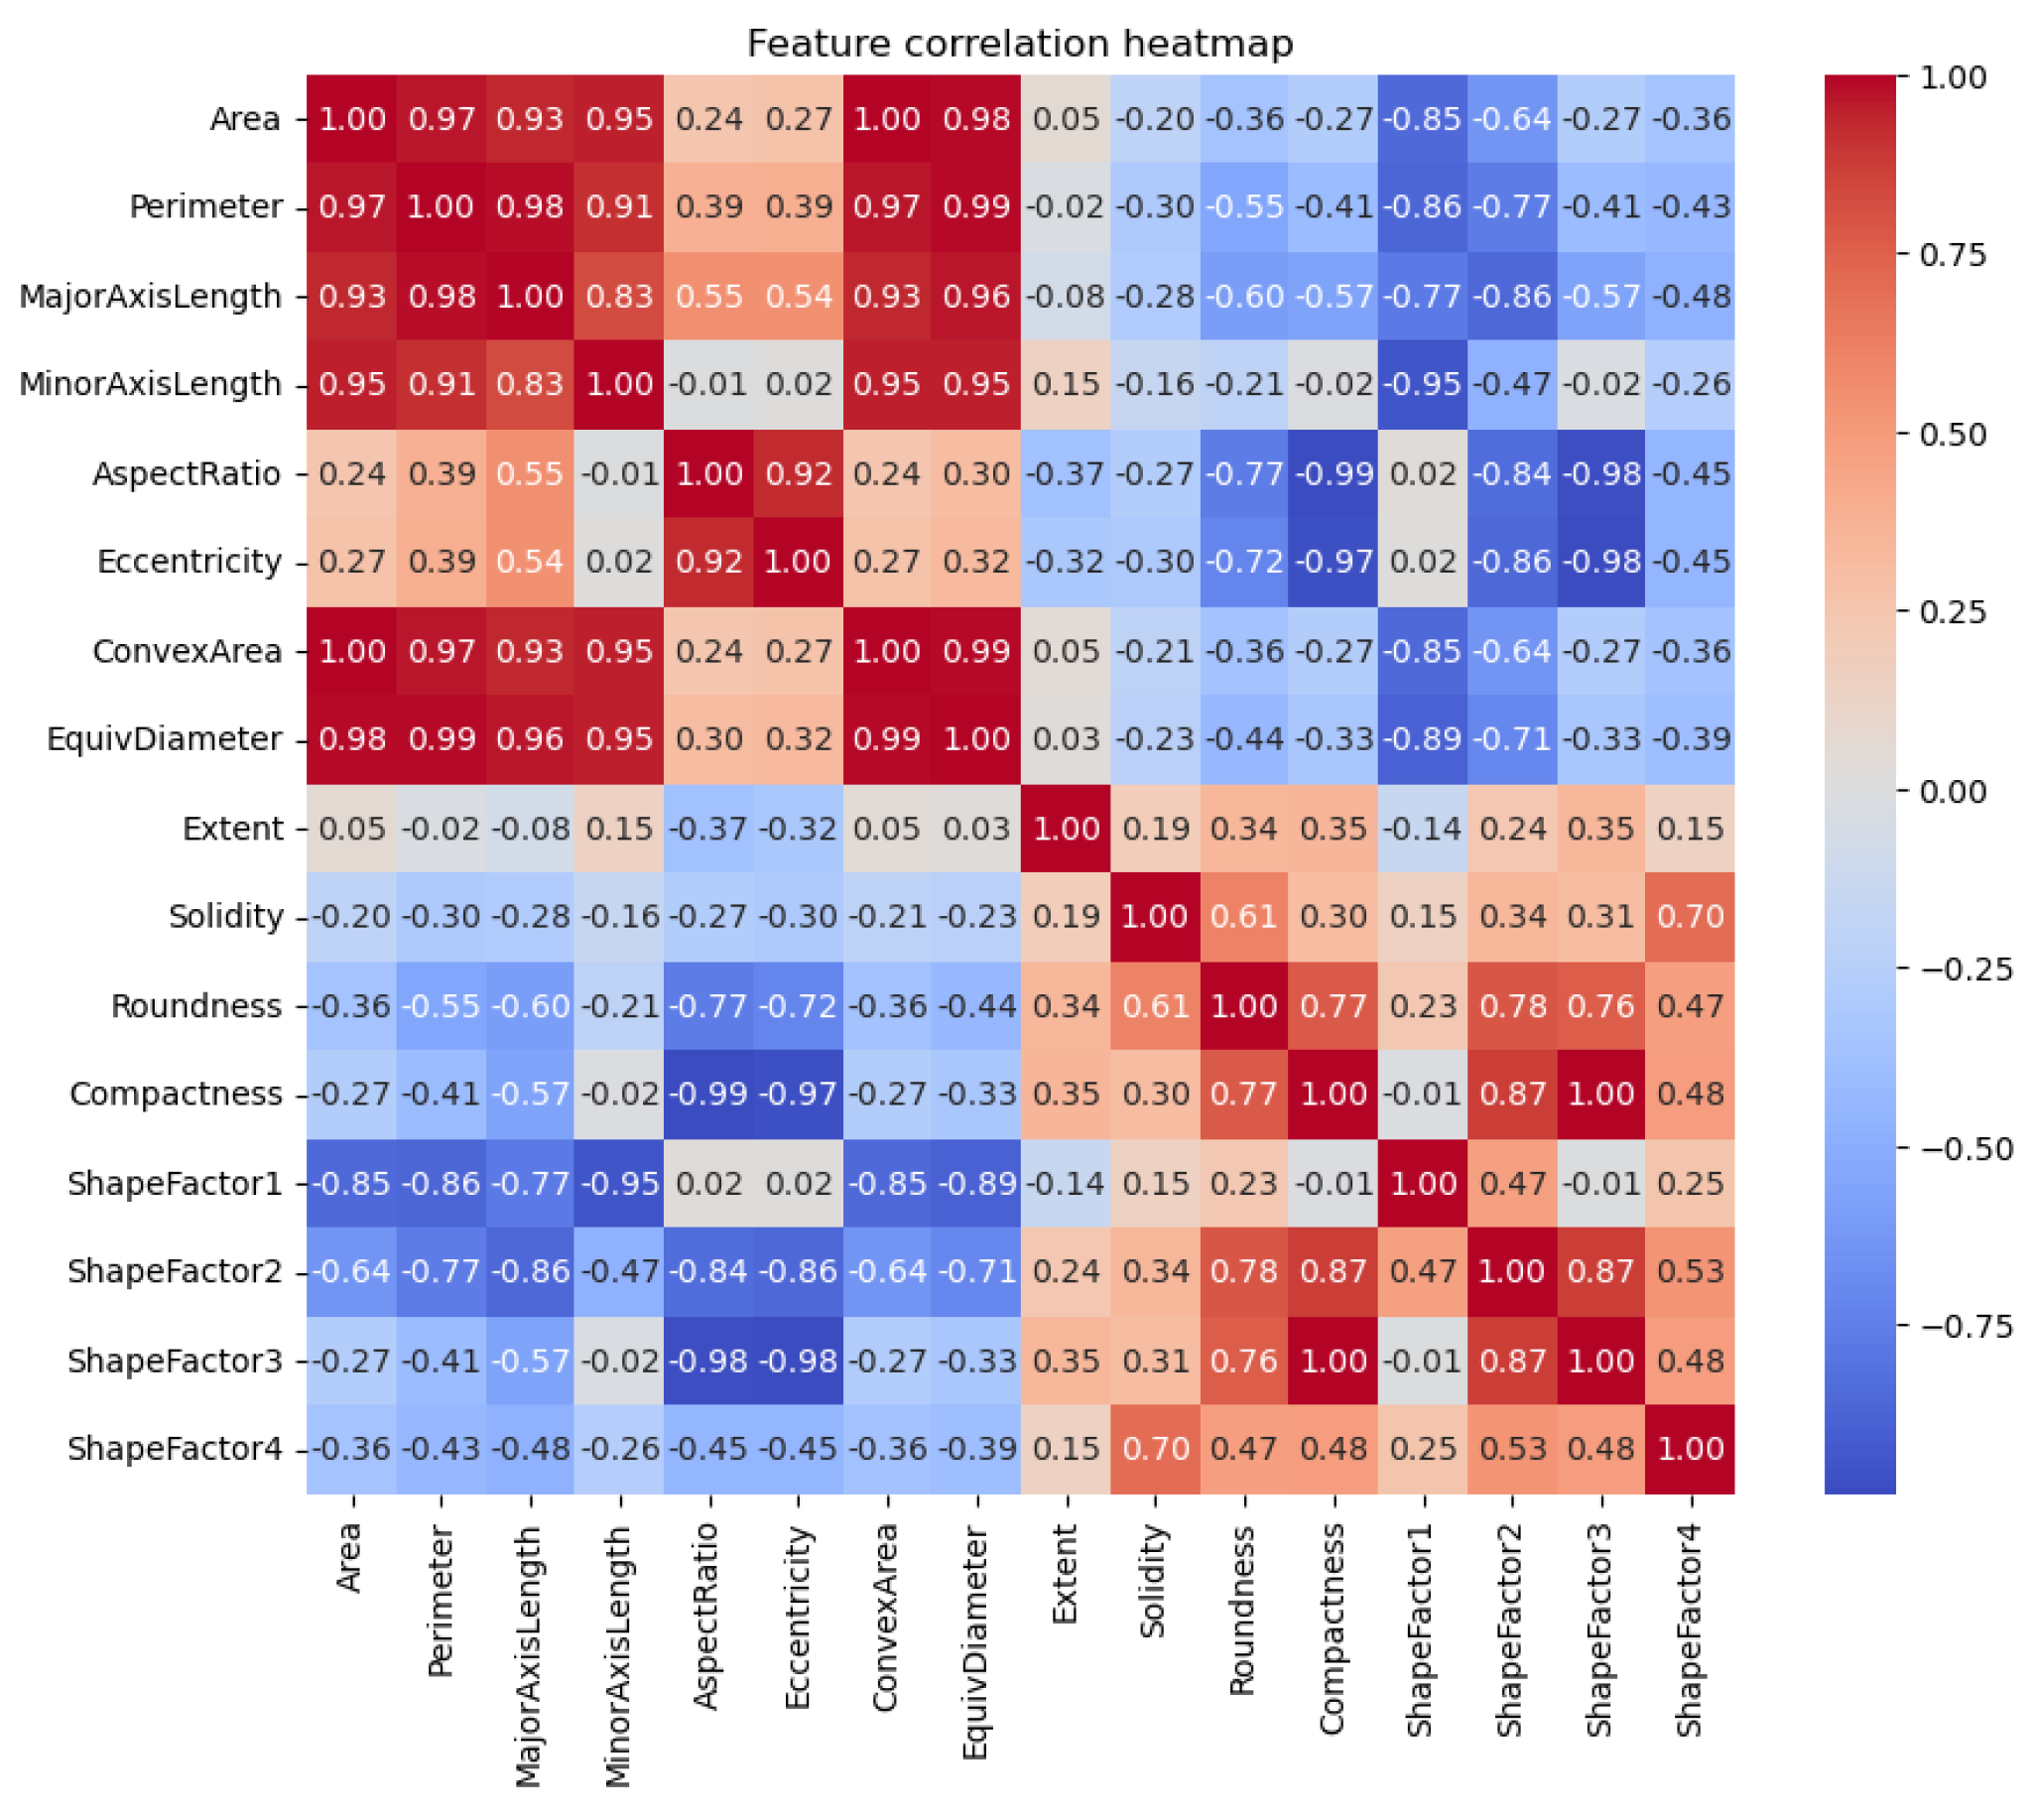
Correlation analysis was conducted to identify highly correlated features within the dataset. Six features demonstrated strong correlations, ranging from 0.83 to 1.00, indicating potential redundancy (Hastie et al., 2009, Meenu et al., 2021). The selected features were analysed for their contribution to model performance, with a focus on eliminating non-informative attributes to improve computational efficiency and reduce the risk of overfitting.
2.3. ML Models
Multiple ML algorithms were employed for the classification of dry beans, including:
- DT: Based on the divide and conquer principle, the DT classifier is one of the most basic and uncomplicated ML algorithms (Igual et al., 2017). By filtering the pattern through the tree tests, a DT with internal nodes representing tests (on input patterns) and leaf nodes representing categories (of patterns) gives the pattern a class number (or output). Results from each test are definitive and incompatible with one another. A simple yet interpretable model was initially used to classify the data. The model's ability to separate the minority class (Bombay) was analyzed, particularly in the context of potential sampling bias.
- RF: The number of trees and their maximum depth, or the assessment of interactions, are hyper-parameters in the RF technique. The RF is a classification method that yields a lot of de-correlated DTs (Awad et al., 2015). We have used a few DT and Gini values as impurity indexes to construct the RF technique in Python. This ensemble method was tested under both imbalanced and balanced conditions. Hyperparameters were optimized through grid search, focusing on parameters such as the number of trees and maximum depth.
- KNN: Using training data, KNN is a distance-based supervised ML method that classifies fresh data points. Regression and classification issues are resolved with its help (Mukherjee et al., 2021). It yields an integer value that indicates the output of a classification algorithm's productivity (labels). KNN is a memory-based classifier that compares each input sample to each training instance, recalling all training data points to predict test data. It takes into account k training neighbors where that are the closest to . According to a majority vote among the neighbors, the algorithm assigns a label to a particular new data point (Hastie et al., 2009, Mukherjee et al., 2021). Using the KNN approach, it runs the appropriate times with different values of. The KNN algorithm was evaluated using various distances and weights. Hyperparameters were optimized based on the number of neighbors and the selected features.
- SVM: The most popular classification method for determining the class label of an unknown sample based on optimal decision boundary is SVM. Finding the best decision boundary that divides the n-dimensional feature vectors into two classes using a hyper-plane is the goal of the SVM algorithm. To train the SVM model and move the feature vectors into a higher-dimensional space, a kernel function is used (Madhu et al., 2021; Müller et al., 2018). A convex optimization problem is then used to solve the ML problem (Awad et al., 2015; Burges, 1998). Depending on the maximum marginal hyperplane, it is expected that each new observation will fall neatly into one of the two categories. The data points nearest to the hyperplane that divides are called support vectors (Awad et al., 2015; Awal et al., 2021). The SVM model employed a radial basis function kernel, with hyperparameter tuning focused on the regularization parameter (C) and kernel parameters (gamma).
Figure 6.
Confusion matrix of imbalanced RF model per bean class.
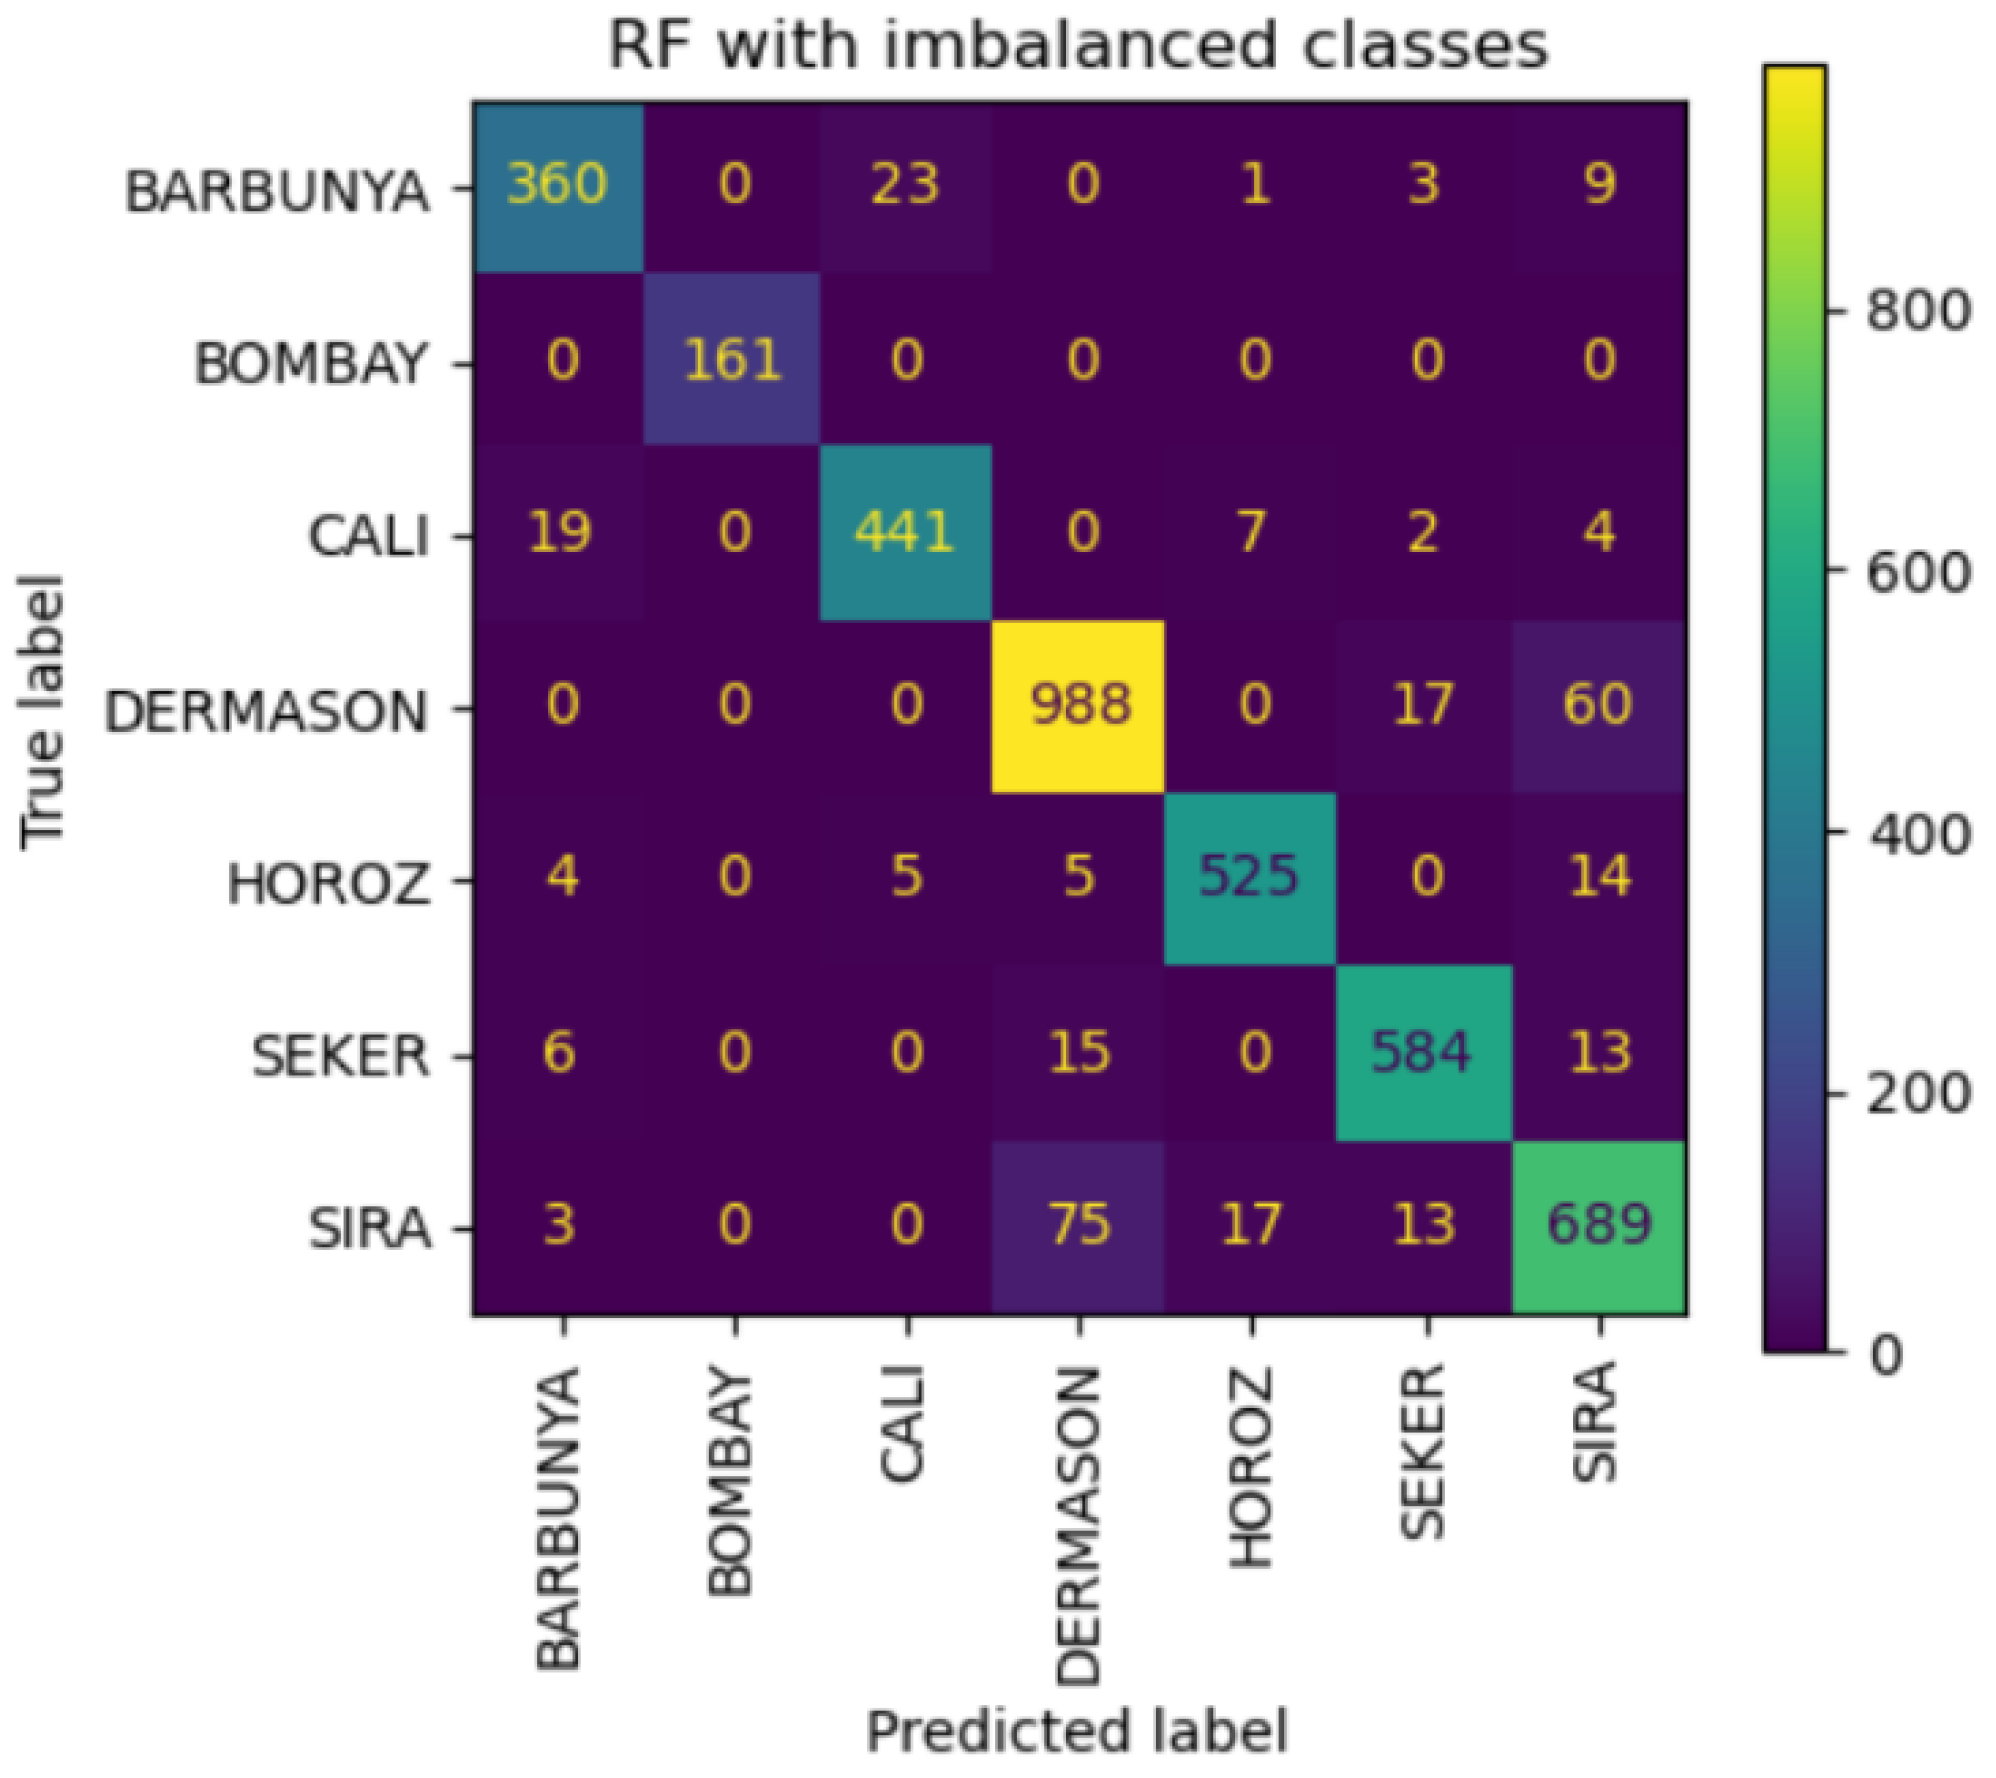
Figure 7.
Metric scores for imbalanced KNN model per bean class.
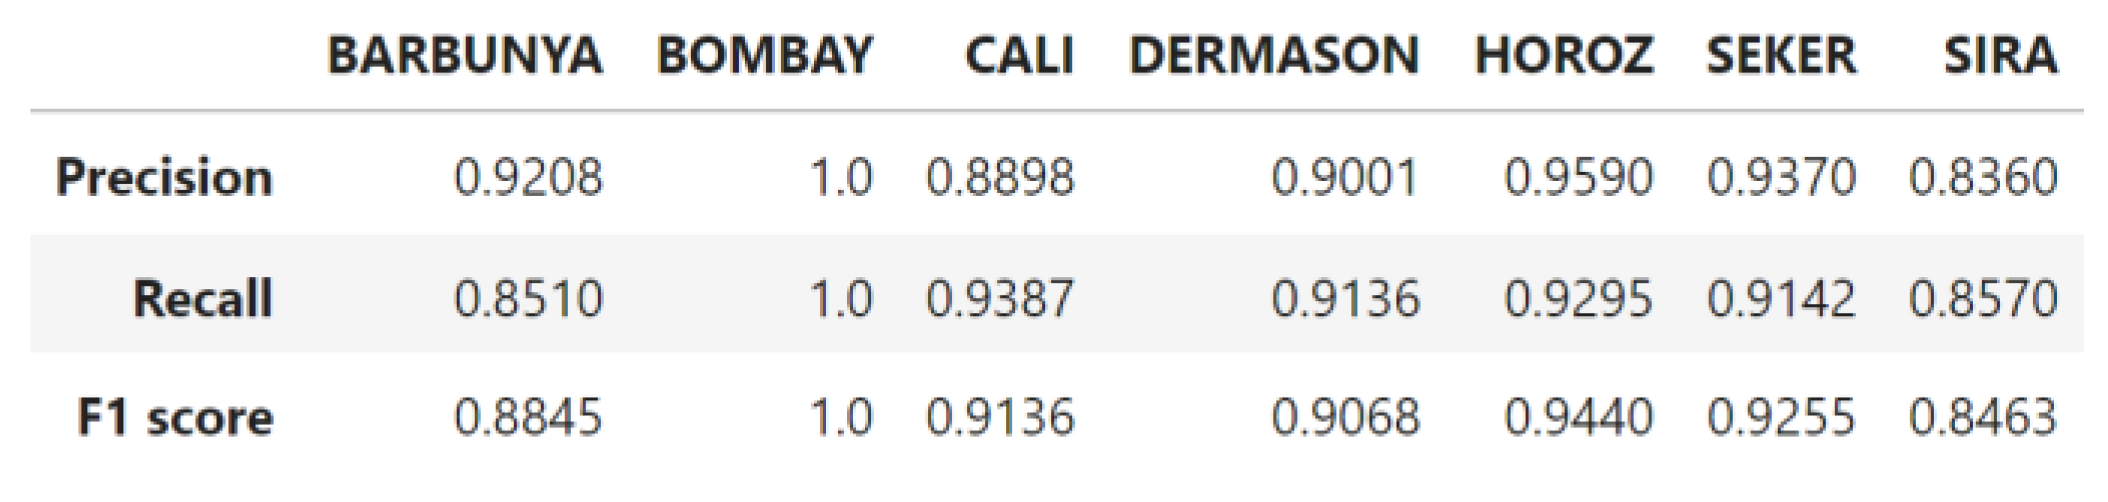
Figure 8.
Confusion matrix of imbalanced KNN model per bean class
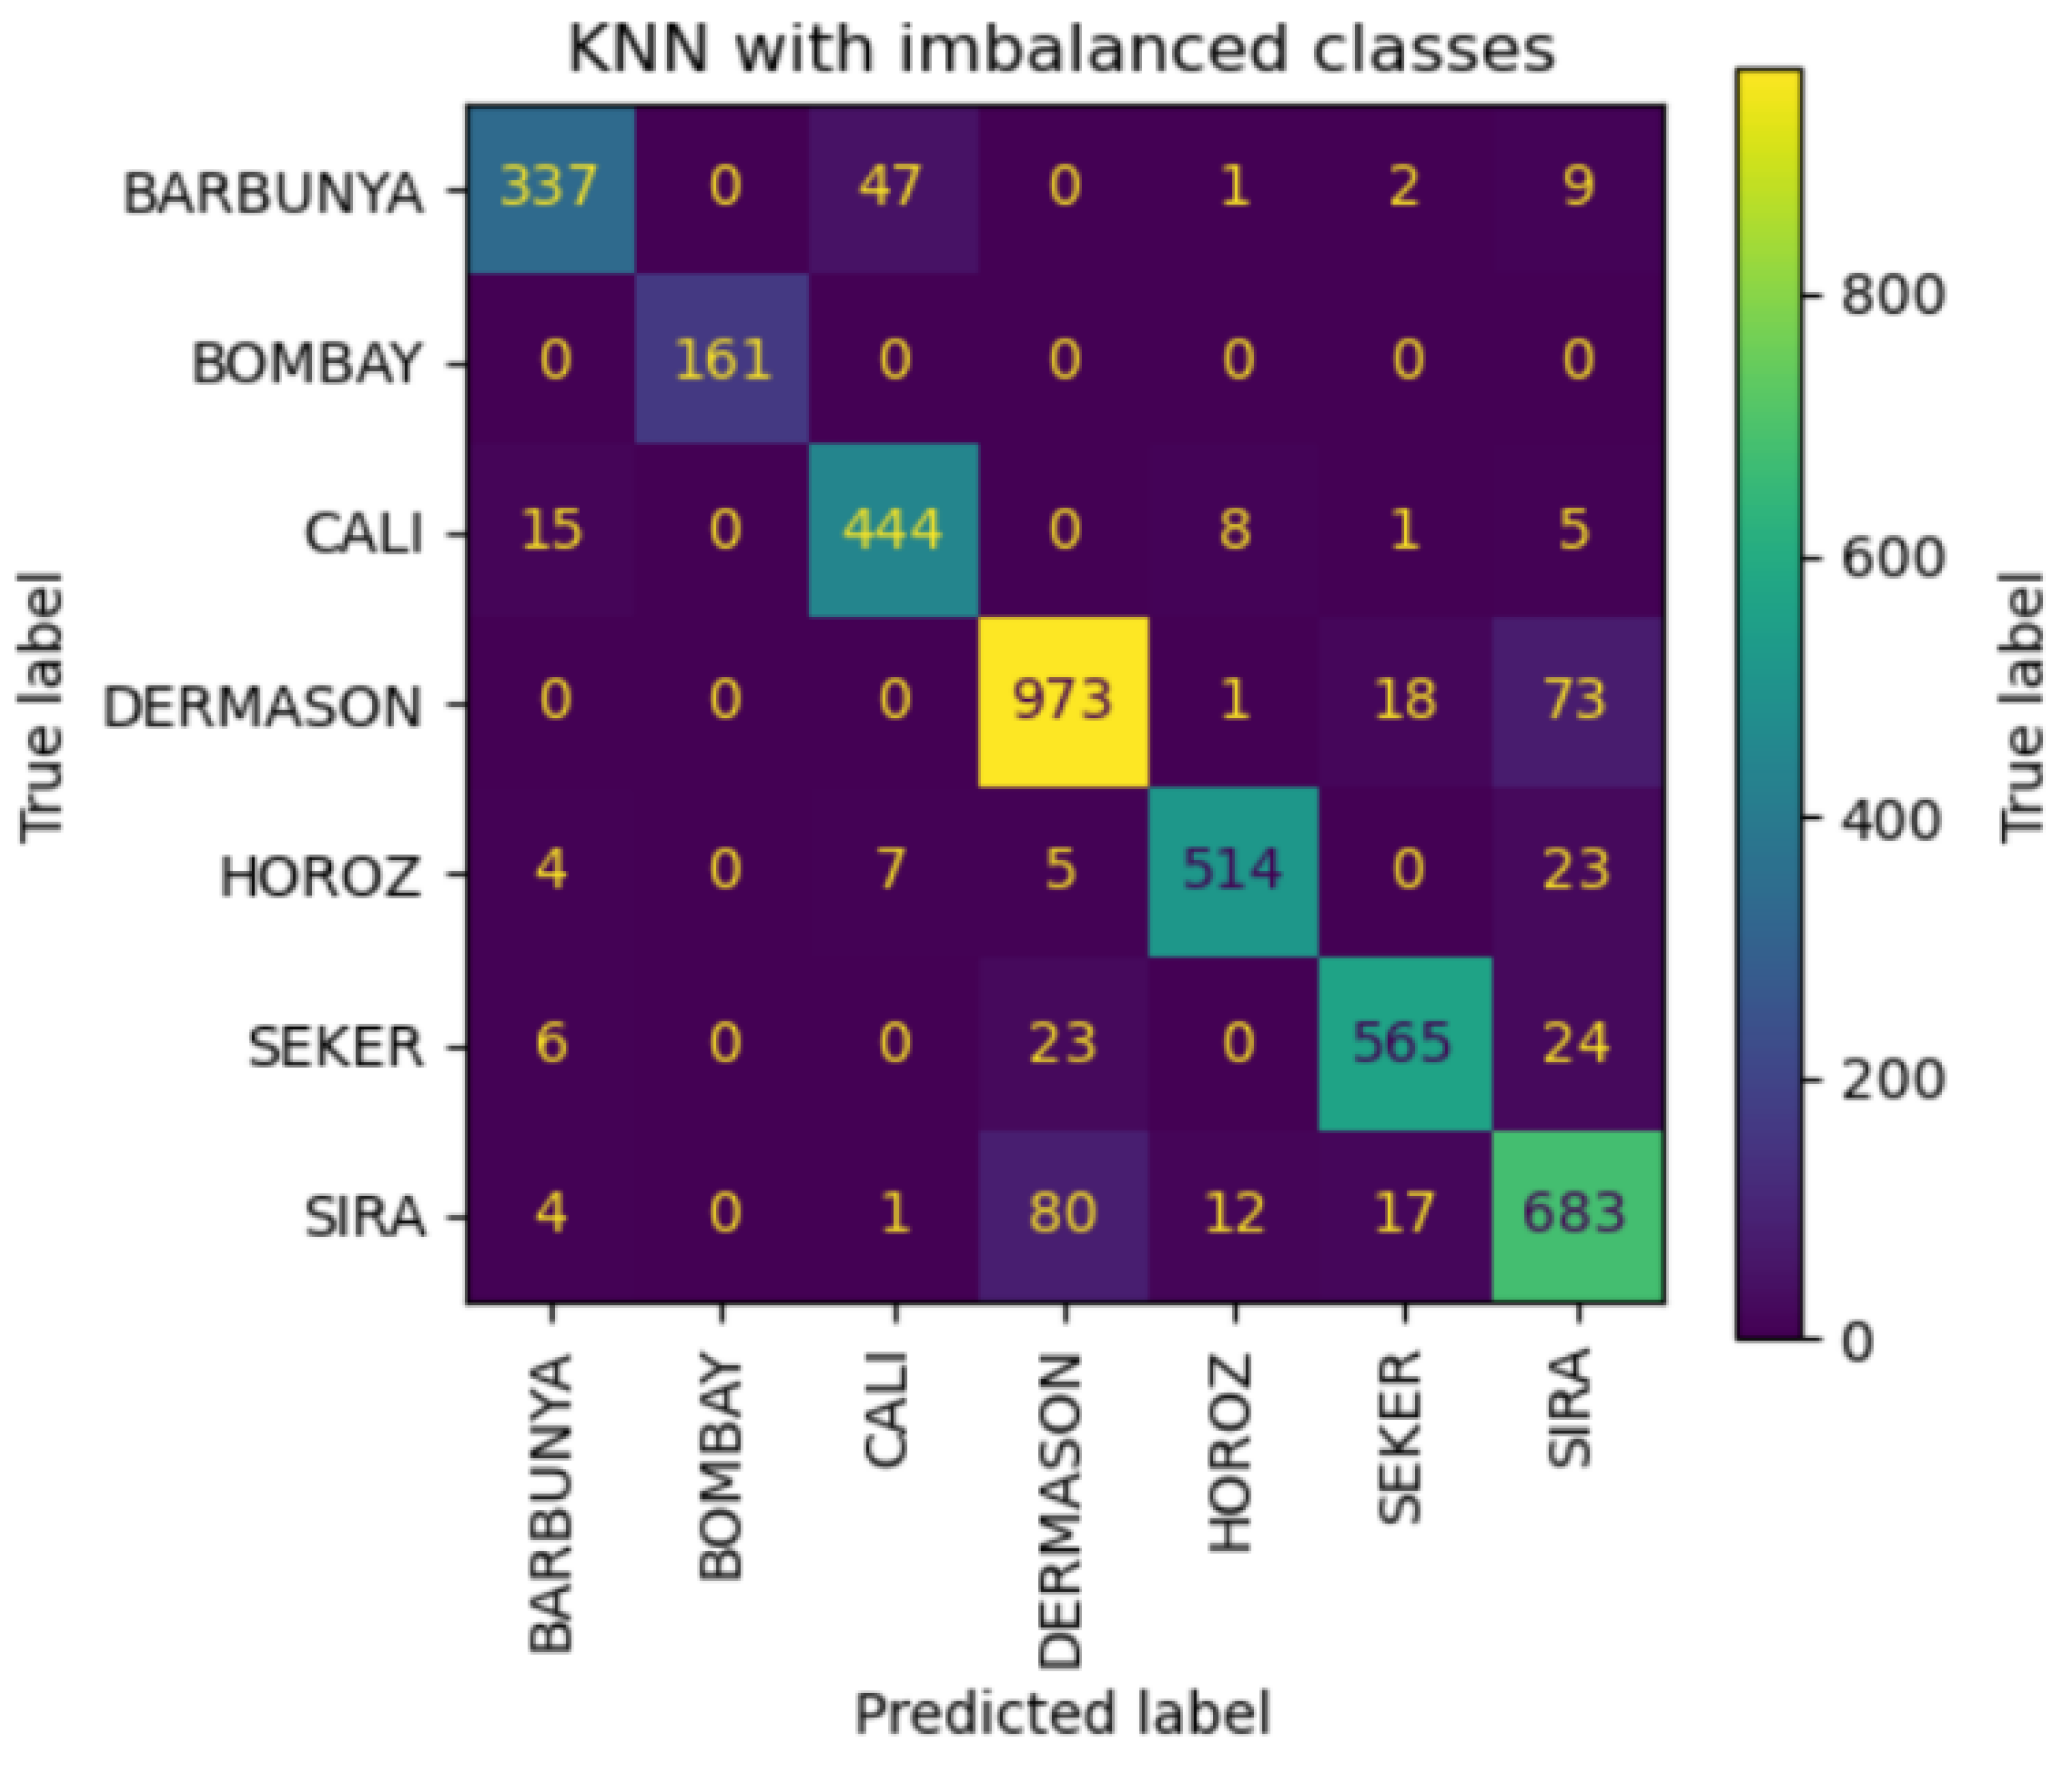
Figure 9.
Metric scores for imbalanced SVM model per bean class.
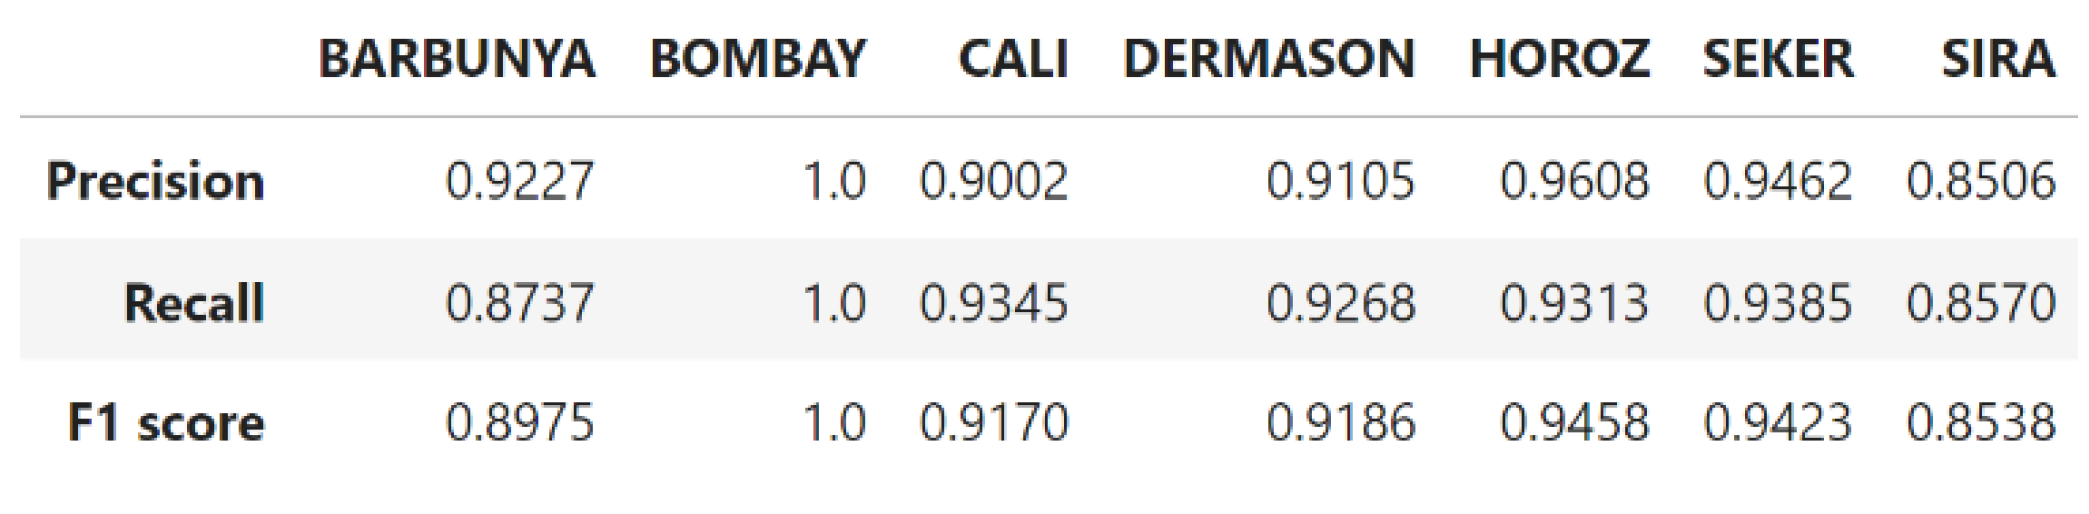
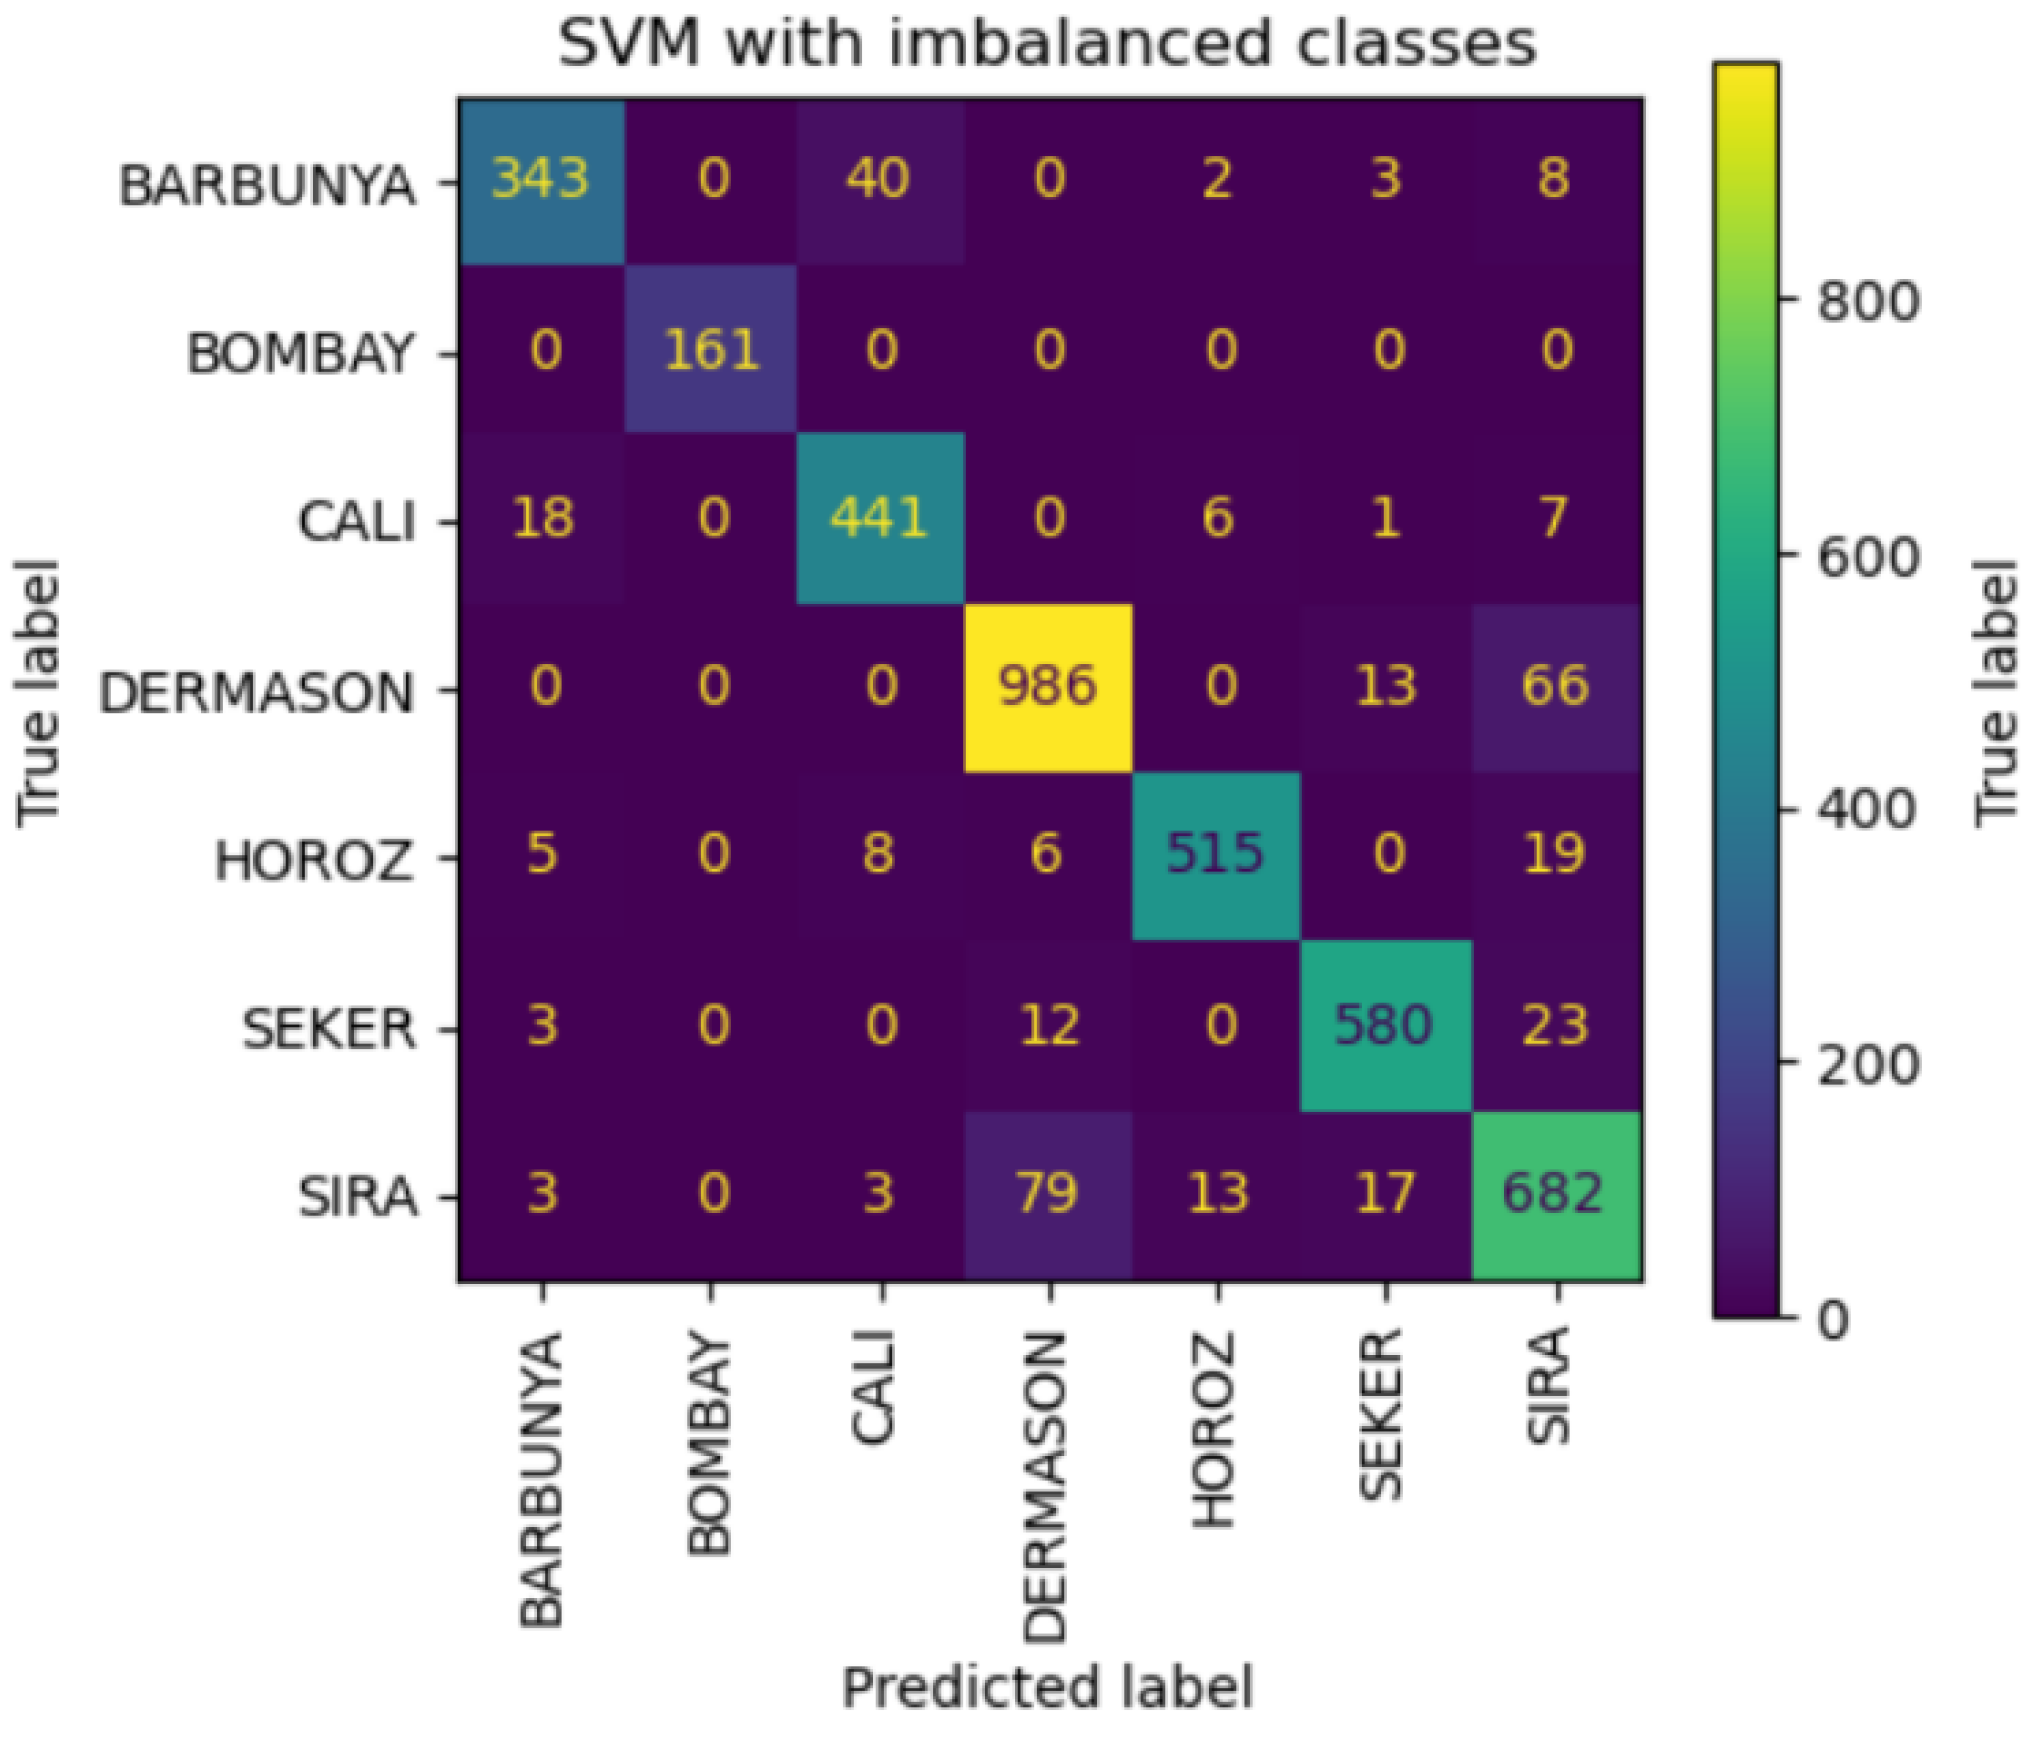
Figure 10.
Confusion matrix of imbalanced SVM model per bean class.
- MLP: MLP is a fully connected feed forward Artificial Neural Network (ANN) that determines how to respond to a new query by learning from the previously trained model. Because it is trained using the back propagation technique, the deep learning classifier performs well in both over-fitting and under-fitting scenarios. It can handle stochastically the issues that arise with unbalanced data, which frequently enables approximations for more complex issues such as fitness approximation. MLP uses three interconnected node layers to draw comparable findings on related issues. MLP is composed of hierarchically coupled artificial neurons that cooperate (Koklu et al., 2020; Przybył et al., 2018). The MLP model was built using Keras to capture complex patterns in the data. The architecture included multiple hidden layers with activation functions optimized during training.
2.4. Evaluation Metrics
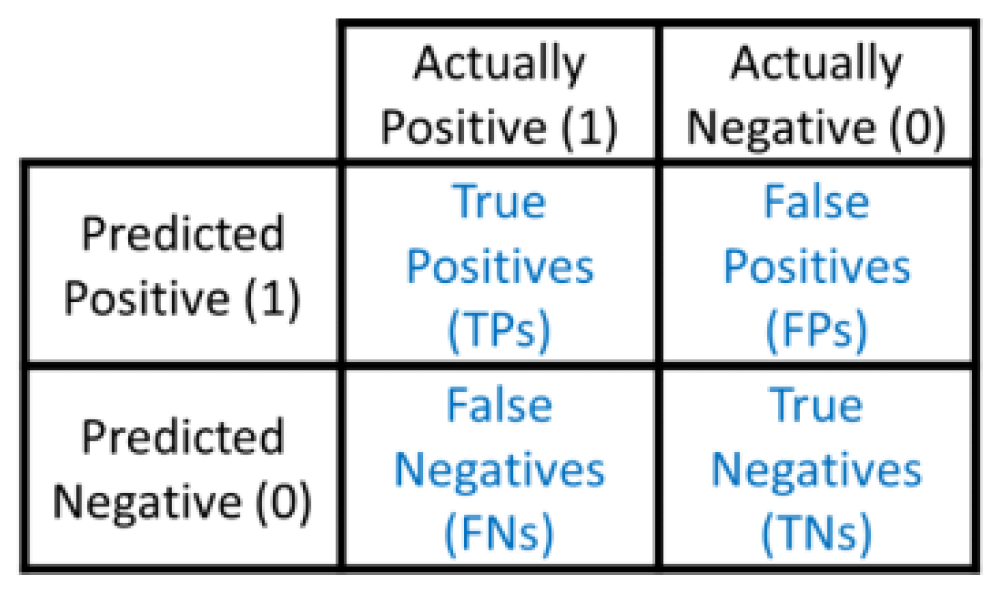
The models' performance was assessed using multiple metrics, including accuracy (ACC), recall (Rec), precision (Prec) and F1 score, based on True Positive (TP) and True Negative (TN) counts (Figure 2). These metrics provided insights into the classification performance across different species of dry beans and helped identify potential areas for improvement:
2.5. Model Optimization
For each model, hyperparameters were optimized using grid search or random search, depending on the algorithm's complexity. Feature selection techniques were applied iteratively to determine the optimal set of features that maximized classification performance while minimizing overfitting risks.
3. Results
3.1. Dataset Overview
The analysis was conducted on a dataset comprising 13,611 grains of seven registered dry bean species. Each grain was characterized by 16 features, including 12 dimensions and 4 shape descriptors. The absence of missing values and the removal of 68 identical entries contributed to the integrity of the dataset. However, the dataset exhibited imbalanced class distributions, necessitating careful consideration in model selection and evaluation.
3.2. Feature Correlation and Selection
Correlation analysis revealed six highly correlated features (area, perimeter, major axis length, minor axis length, convex area, and equivalent diameter) with correlation coefficients ranging from 0.83 to 1.00 (Figure 2). This redundancy could potentially lead to overfitting, as these features may provide similar information to the models (Hastie et al., 2009, Meenu et al., 2021). Consequently, features such as ShapeFactor1 and ShapeFactor3, which were identified as non-informative, were eliminated from further analysis to enhance computational efficiency and mitigate overfitting risks.
3.3. Model Performance
- DT: The DT model demonstrated excellent separation of the Bombay class, indicating that the features were highly discriminative for this minority class. However, this could also imply potential sampling bias, suggesting that additional data from the Bombay class would be beneficial for more generalized model performance (Zhang et al., 2017).
Figure 3.
Features’ correlation heatmap.
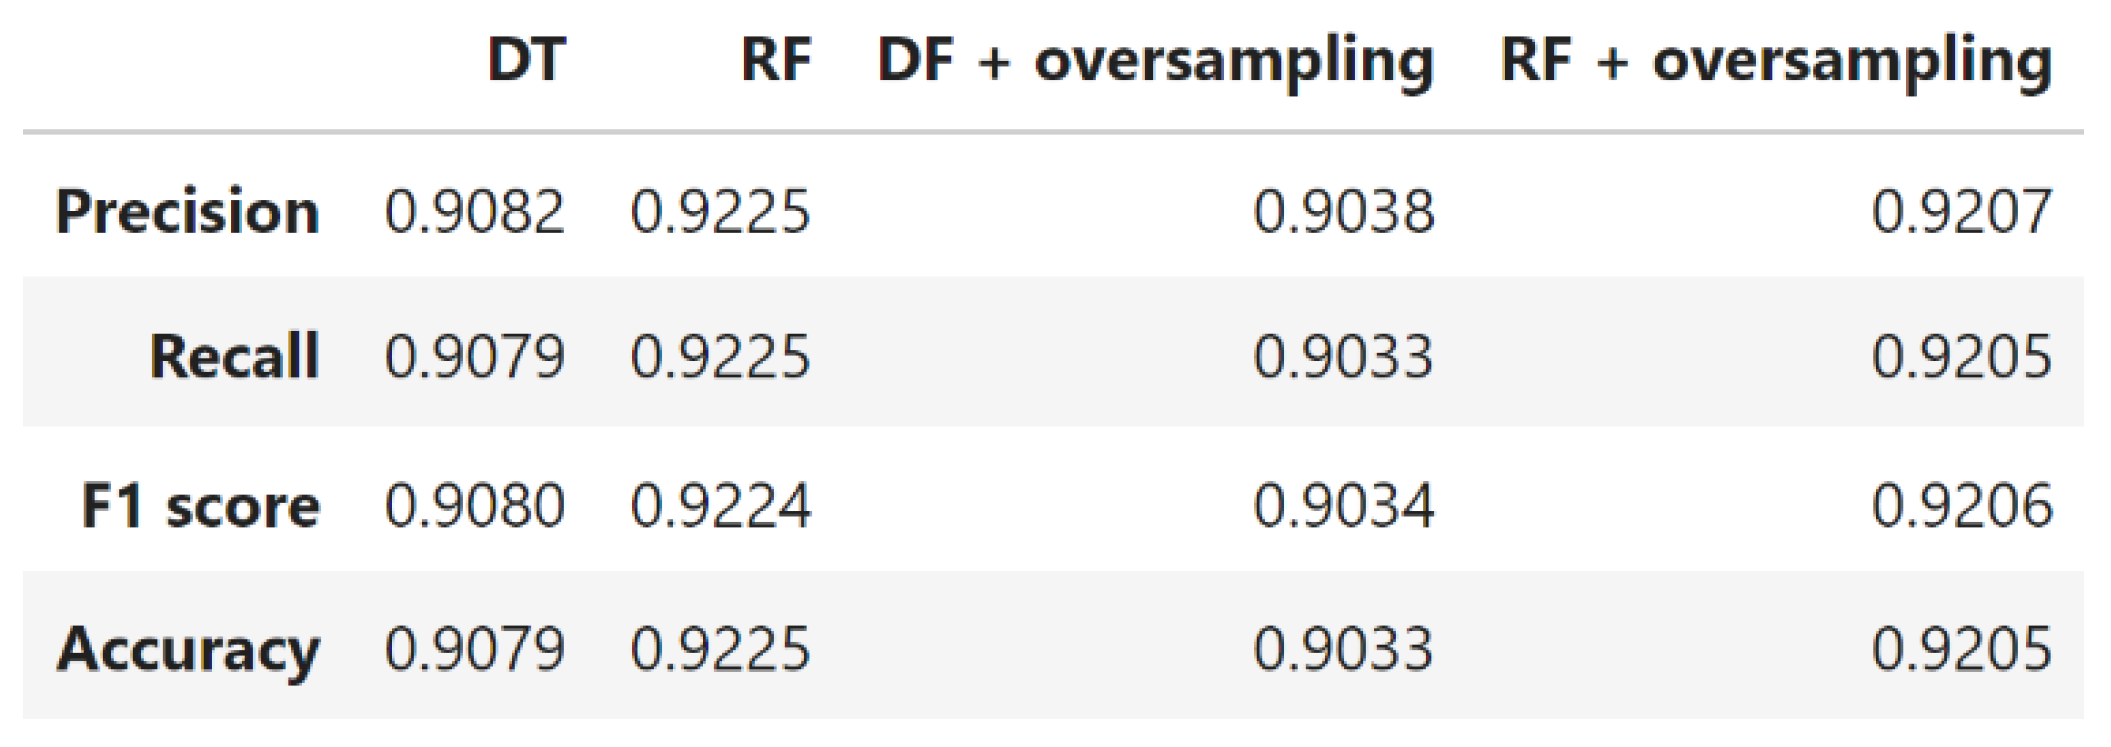
trained on imbalanced data, it was found that Dermanson beans were frequently misclassified as Sira beans. This misclassification might stem from the complexity of the data and the need for more informative features to effectively distinguish these two classes. Notably, the RF model trained on imbalanced data outperformed the one trained on balanced data, highlighting its robustness to class imbalance (Barbon et al., 2016; Breiman, 2001; Zhang et al., 2017).
Figure 4.
Metric scores for imbalanced and balanced DT and RF models.
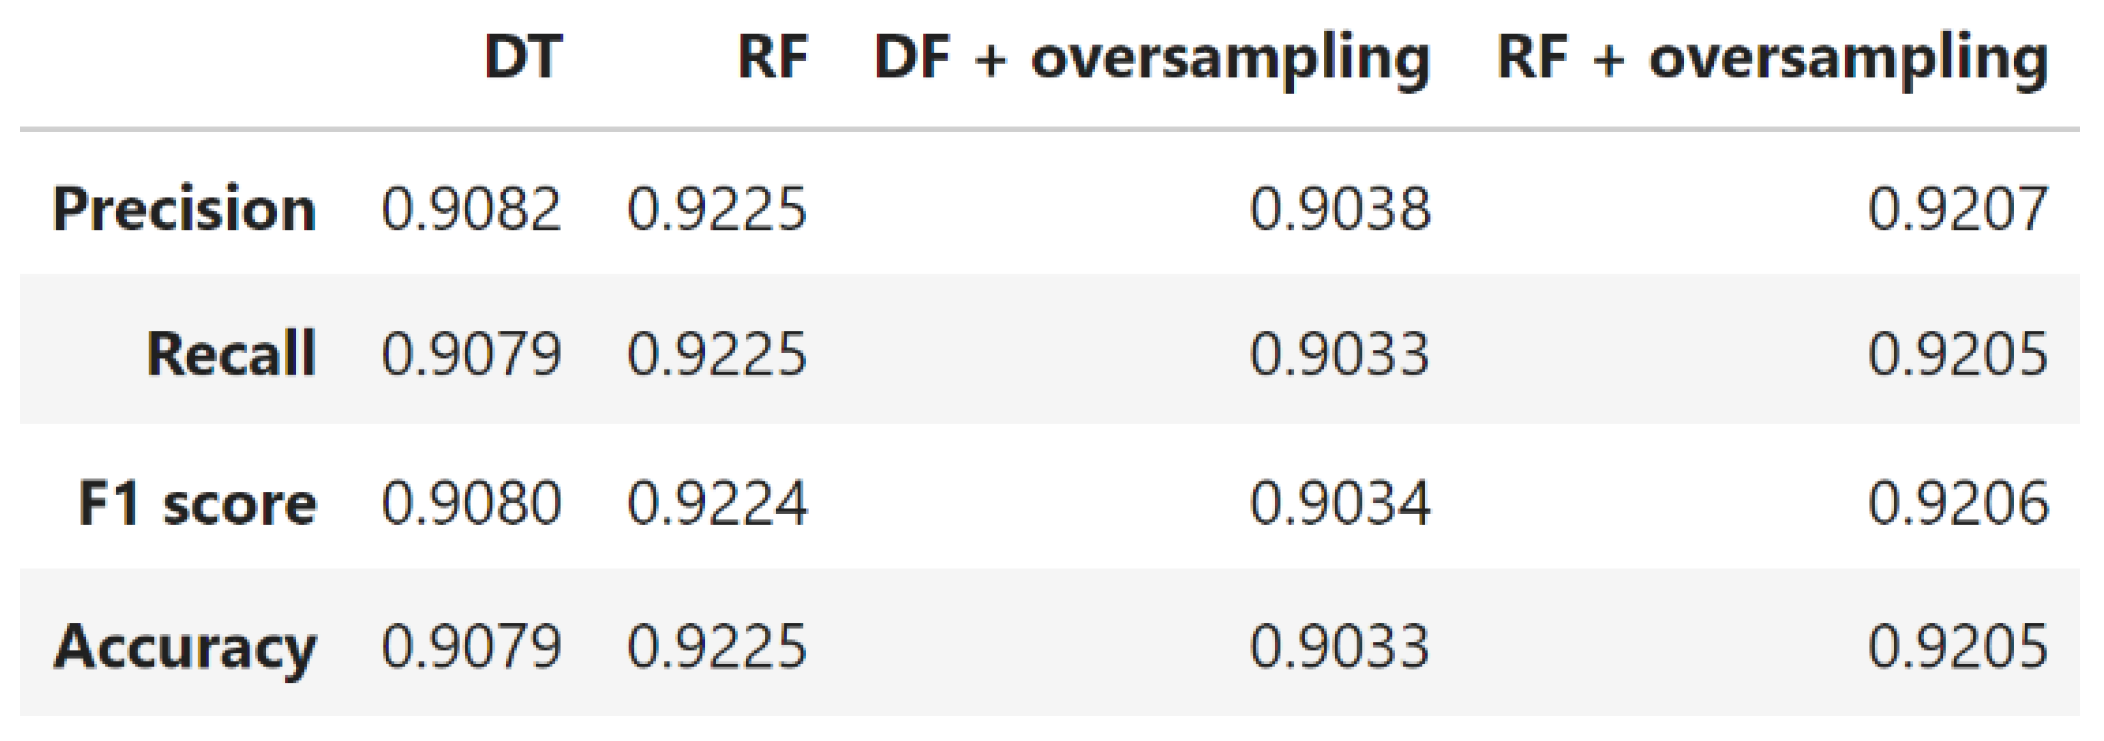
Figure 5.
Metric scores for imbalanced RF model per bean class.
- KNN: The KNN algorithm, optimized with hyperparameters {'n_neighbors': 9, 'weights': 'distance', 'metric': 'minkowski'}, achieved maximum metric scores using the first six most important features. However, it exhibited sensitivity to high-dimensional data, as overfitting was observed when too many features were included. The model maintained robust performance when limited to three key features (Figure 7 and Figure 8): MajorAxisLength, MinorAxisLength, and Perimeter.
- SVM: The SVM model yielded optimal performance with hyperparameters {'C': 250, 'gamma': 'scale', 'kernel': 'rbf'}. Similar to KNN, SVM's performance was influenced by the inclusion of non-informative features. The introduction of non-correlated features improved model performance, underscoring the importance of feature selection in SVM-based classifications (Figure 9 and Figure 10) (Cortés et al., 2019).
- MLP: The MLP model, leveraging its capacity to capture complex patterns, provided the highest overall classification performance. Despite some features appearing non-informative, the MLP effectively utilized the entire feature set, demonstrating its ability to model non-linear relationships within the data (Figure 11 and Figure 12). When trained on balanced data, the performance did not significantly improve, indicating that oversampling did not enhance the model's ability to generalize (Koklu et al., 2020; Przybył et al., 2018).
Figure 11.
Metric scores for imbalanced MLP model per bean class.
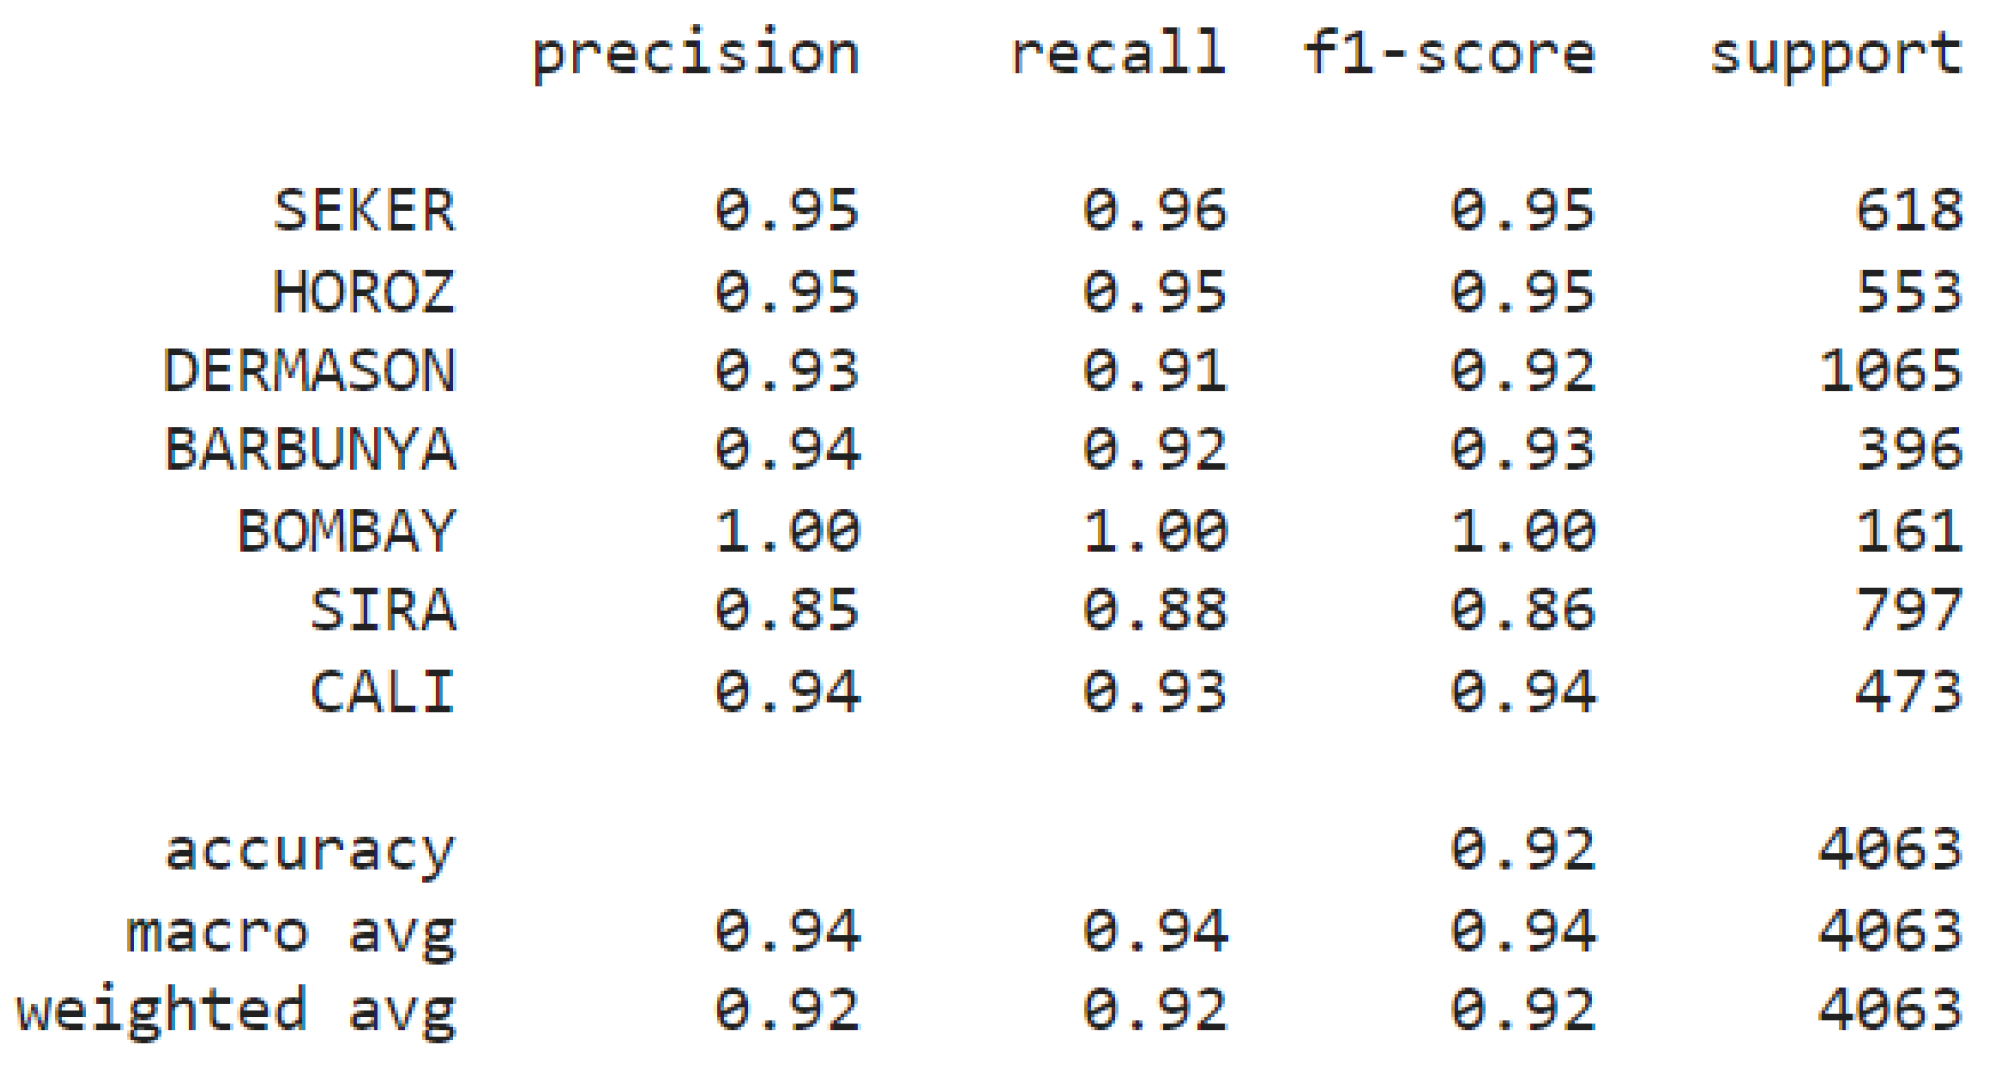
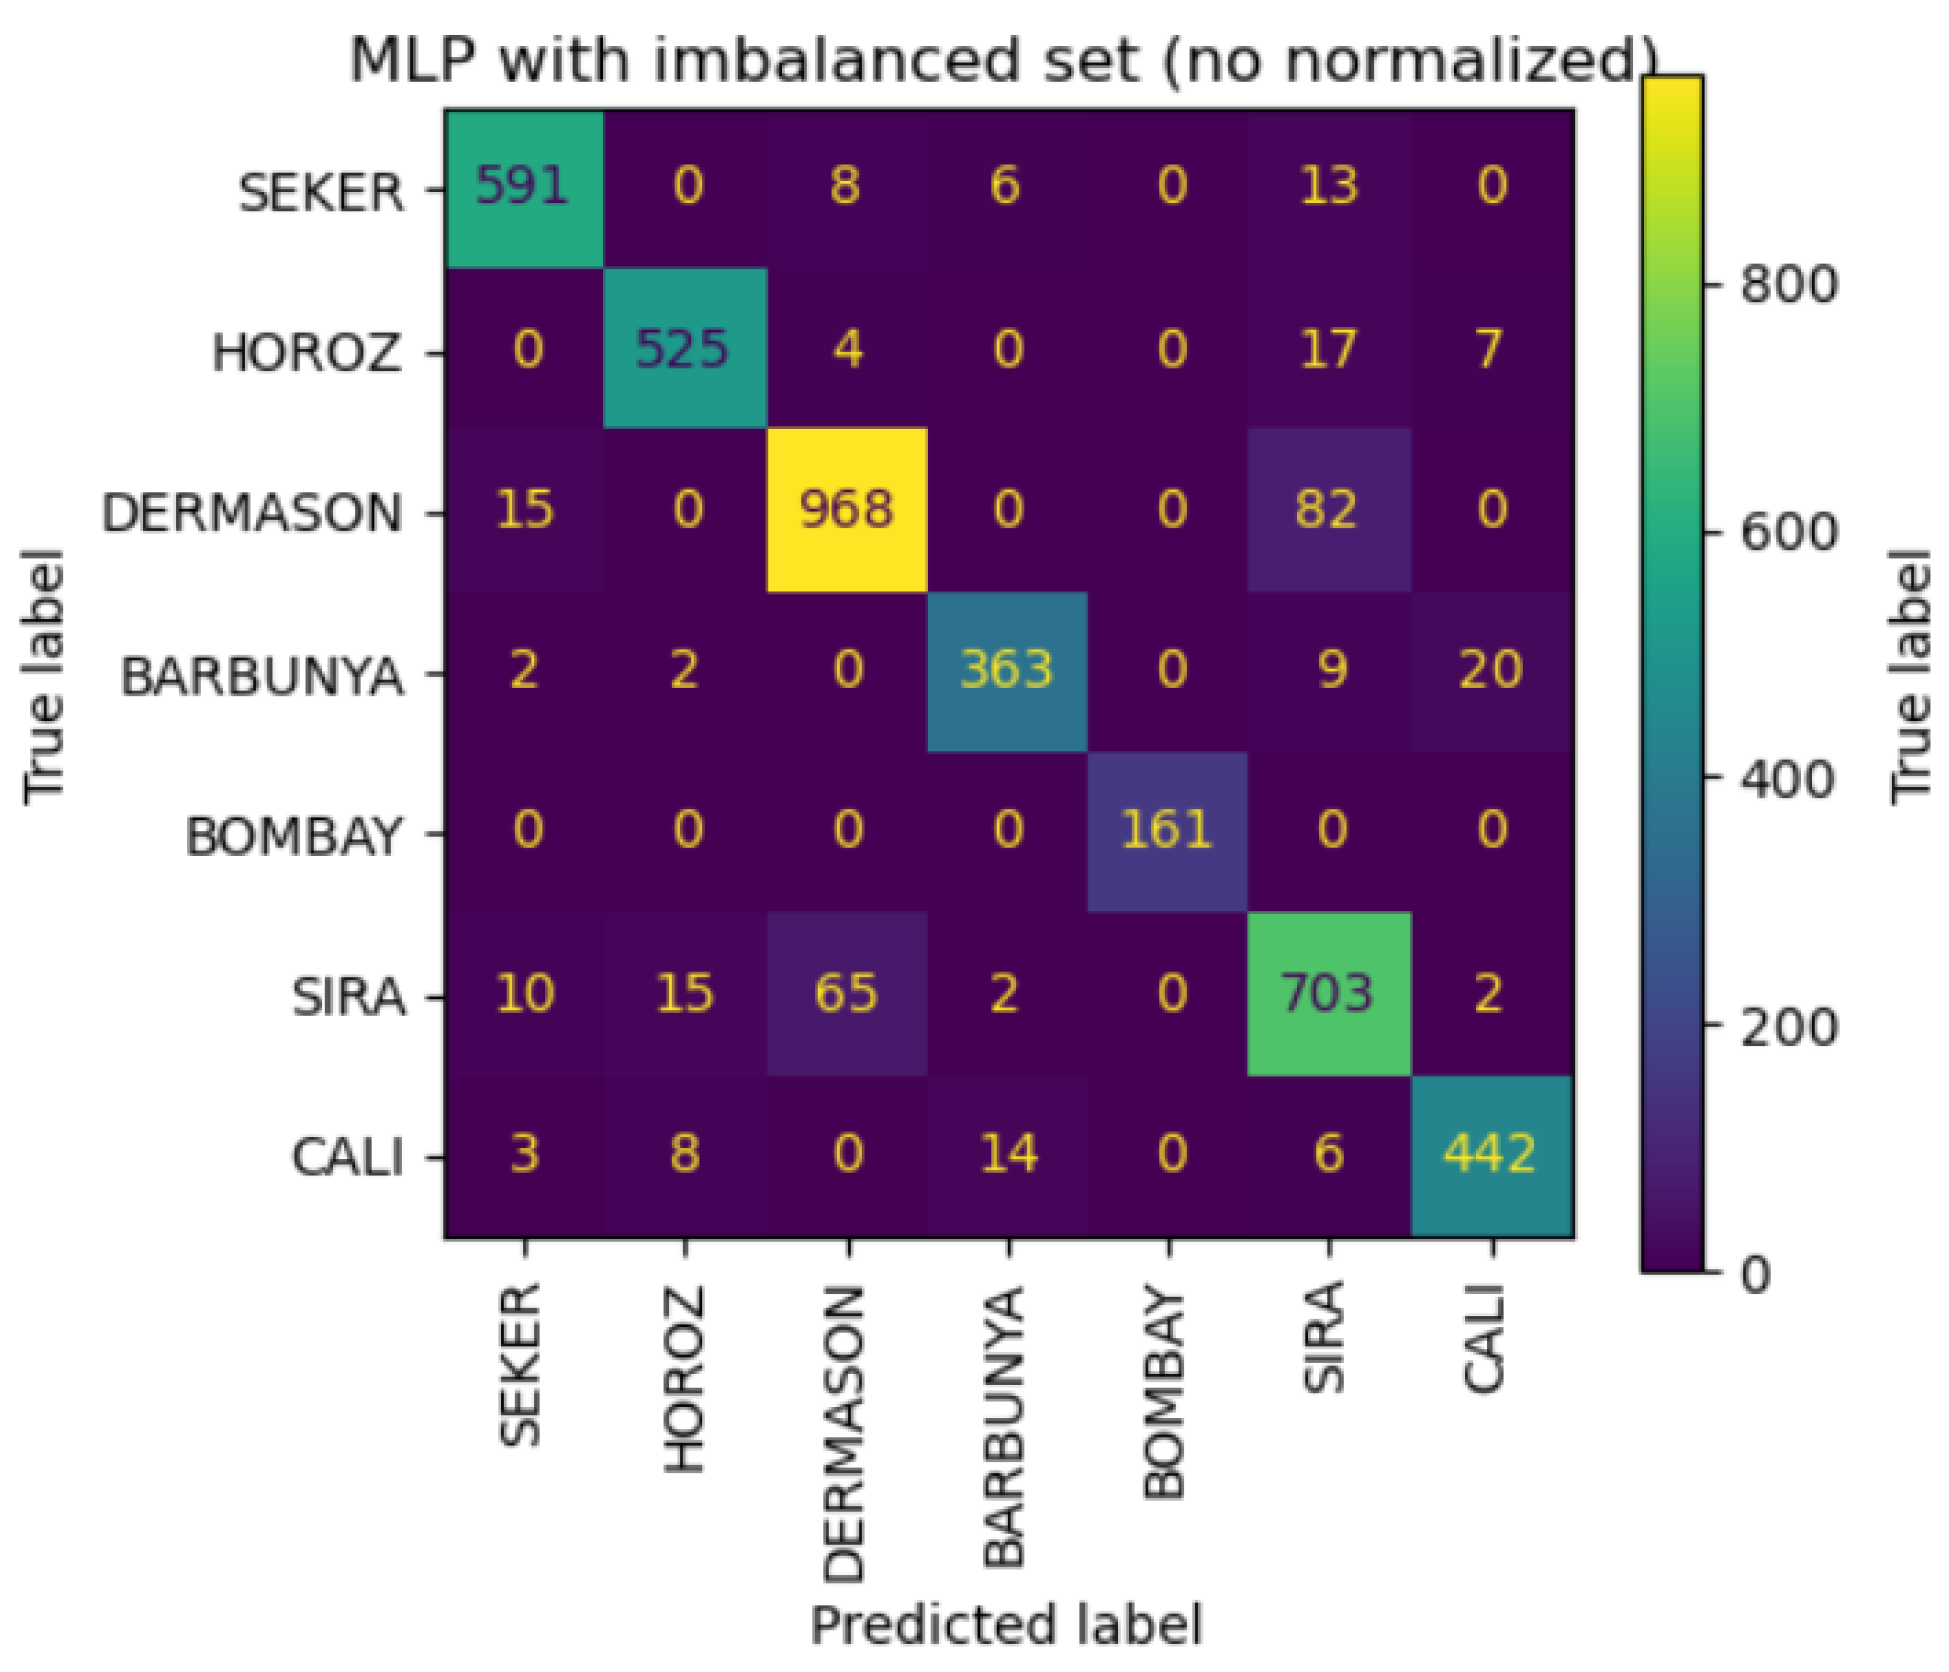
Figure 12.
Confusion matrix of imbalanced MLP model per bean class.
4. Conclusions
This project successfully classified seven registered dry bean species using a ML approach, highlighting the significance of feature selection and the challenges posed by class imbalance. The dataset, comprising 13,611 grains and characterized by 16 features, demonstrated a notable degree of redundancy among key measurements. Through rigorous analysis, it was established that the removal of non-informative and highly correlated features, such as ShapeFactor1 and ShapeFactor3, was essential for enhancing model performance and computational efficiency.
Among the various ML algorithms employed, the MLP model emerged as the most effective, showcasing its capacity to capture complex, non-linear relationships within the data (Figure 13). Meanwhile, the RF model displayed robustness to class imbalance, particularly when trained on imbalanced datasets, further emphasizing the importance of model choice in such contexts. The DT model offered valuable insights into the discriminative power of specific features, particularly for minority classes like Bombay beans, while misclassifications in RF underscored the necessity for more comprehensive data sampling. All code to recapitulate the analysis is available along with documentation of pipeline usage at https://github.com/jesusch10/beans_classification.
Figure 13.
Normalized confusion matrix of imbalanced MLP model per bean class.
The results from this study highlight the importance of careful feature selection and the impact of class imbalance on model performance. The DT and RF models provided valuable insights into the discriminatory power of specific features, particularly for the minority Bombay class. However, the frequent misclassification between Dermanson and Sira beans in RF indicates the need for additional features or more data to improve classification accuracy.
The sensitivity of KNN and SVM to feature dimensionality emphasizes the need for robust feature selection techniques. While MLP demonstrated superior performance, the findings suggest that simple models like RF and DT can still provide meaningful insights, especially when data is imbalanced. Future work should focus on expanding the dataset to include more diverse samples, particularly for minority classes, and exploring advanced feature engineering techniques to enhance model performance.
Overall, this study underscores the critical role of effective feature selection and model tuning in achieving accurate classifications in agricultural applications, and highlight potential avenues for improving classification accuracy in imbalanced datasets (Mavani et al., 2022). Future research should focus on expanding the dataset to include a more representative sample of each species and exploring advanced techniques for feature engineering and data augmentation. These steps could further enhance classification accuracy and contribute to the broader application of ML in agricultural research and food security
References
- Awad, M., Khanna, R. (2015). Support Vector Regression. In: Efficient Learning Machines. Apress, Berkeley, CA. [CrossRef]
- Awal, M. A., Masud, M., Hossain, M. S., Bulbul, A. A.-M., Mahmud, S. M. H., & Bairagi, A. K. (2021). A novel Bayesian optimization-based machine learning framework for COVID-19 detection from inpatient facility data. IEEE access: Practical innovations, open solutions, 9, 10263–10281. [CrossRef]
- Barbon, A. P. A. C., Barbon, S., Jr, Mantovani, R. G., Fuzyi, E. M., Peres, L. M., & Bridi, A. M. (2016). Storage time prediction of pork by Computational Intelligence. Computers and Electronics in Agriculture, 127, 368–375. [CrossRef]
- Breiman, L. Random Forests. Machine Learning 45, 5–32 (2001). [CrossRef]
- Burges, C.J. A Tutorial on Support Vector Machines for Pattern Recognition. Data Mining and Knowledge Discovery 2, 121–167 (1998). [CrossRef]
- Cortés V, Blasco J, Aleixos N, Cubero S, Talens P (2019) Monitoring strategies for quality control of agricultural products using visible and near-infrared spectroscopy: A review. Trends Food Sci Technol 85(October 2018):138–148. [CrossRef]
- Hastie, T. (2009). The elements of statistical learning: Data mining, inference, and prediction.
- Igual, L., Seguí, S. (2017). Introduction to Data Science. In: Introduction to Data Science. Undergraduate Topics in Computer Science. Springer, Cham. [CrossRef]
- Koeshardianto, M., Permana, K. E., Kartika, D. S. Y., & Setiawan, W. (2023). Beans classification using decision tree and random forest with randomized search hyperparameter tuning. Communications in mathematical biology and neuroscience, 2023(0), Article ID 118. [CrossRef]
- Koklu, M., & Ozkan, I. A. (2020). Multiclass classification of dry beans using computer vision and machine learning techniques. Computers and Electronics in Agriculture, 174(105507), 105507. [CrossRef]
- Madhu, B., Mukherjee, A., Islam, M. Z., Mamun-Al-Imran, G. M., Roy, R., & Ali, L. E. (2021). Depth motion map based human action recognition using adaptive threshold technique. 2021 5th International Conference on Electrical Information and Communication Technology (EICT), 1–6.
- Mavani, N.R., Ali, J.M., Othman, S. et al. Application of Artificial Intelligence in Food Industry—A Guideline. Food Eng Rev 14, 134–175 (2022). [CrossRef]
- Meenu, M., Kurade, C., Neelapu, B. C., Kalra, S., Ramaswamy, H. S., & Yu, Y. (2021). A concise review on food quality assessment using digital image processing. Trends in Food Science & Technology, 118, 106–124. [CrossRef]
- Mukherjee, A., Islam, M. Z., Mamun-Al-Imran, G. M., & Ali, L. E. (2021). Iris recognition using wavelet features and various distance based classification. 2021 International Conference on Electronics, Communications and Information Technology (ICECIT), 1–4.
- Müller, K. R., Mika, S., Tsuda, K., & Schölkopf, K. (2018). An introduction to kernel-based learning algorithms. In Handbook of neural network signal processing (pp. 4-1). CRC Press.
- Przybył, K., Gawałek, J., Koszela, K., Wawrzyniak, J., & Gierz, L. (2018). Artificial neural networks and electron microscopy to evaluate the quality of fruit and vegetable spray-dried powders. Case study: Strawberry powder. Computers and Electronics in Agriculture, 155, 314–323. [CrossRef]
- Rehman, T. U., Mahmud, M. S., Chang, Y. K., Jin, J., & Shin, J. (2019). Current and future applications of statistical machine learning algorithms for agricultural machine vision systems. Computers and Electronics in Agriculture, 156, 585–605. [CrossRef]
- Salauddin Khan, M., Nath, T. D., Murad Hossain, M., Mukherjee, A., Bin Hasnath, H., Manhaz Meem, T., & Khan, U. (2023). Comparison of multiclass classification techniques using dry bean dataset. International Journal of Cognitive Computing in Engineering, 4, 6–20. [CrossRef]
- Zhang, C., Liu, C., Zhang, X., & Almpanidis, G. (2017). An up-to-date comparison of state-of-the-art classification algorithms. Expert Systems with Applications, 82, 128–150. [CrossRef]
Figure 2.
Binary confusion matrix.
Disclaimer/Publisher’s Note: The statements, opinions and data contained in all publications are solely those of the individual author(s) and contributor(s) and not of MDPI and/or the editor(s). MDPI and/or the editor(s) disclaim responsibility for any injury to people or property resulting from any ideas, methods, instructions or products referred to in the content. |
© 2024 by the authors. Licensee MDPI, Basel, Switzerland. This article is an open access article distributed under the terms and conditions of the Creative Commons Attribution (CC BY) license (http://creativecommons.org/licenses/by/4.0/).
Copyright: This open access article is published under a Creative Commons CC BY 4.0 license, which permit the free download, distribution, and reuse, provided that the author and preprint are cited in any reuse.


