1. Introduction
Asperger Syndrome (AS) is a developmental disorder, often referred to as autism level 1. Difficulties in social and communication skills characterise it despite individuals typically possessing average intelligence and language development [
1]. Rather than being considered a separate disorder, AS is regarded as a variant within the broader category of autism spectrum disorders (ASD).
Currently, the overall prevalence of ASD is approximately 27.6 per 1,000 children, equating to around one in 36 children aged 8 years. Notably, ASD is 3.8 times more prevalent in boys than in girls, with rates of 43.0 per 1,000 for boys compared to 11.4 for girls [
2].
Research has shown that AS is associated with variations in cognitive abilities and several coexisting conditions [
3,
4]. For example, children with ASD often experience difficulty with visuospatial skills, which are essential for interpreting their surroundings, unlike typically developing children [
5]. Additionally, children with non-verbal learning disabilities may excel in reading but struggle with mathematical concepts [
6].
Natural interactions with peers play a significant role in the spontaneous development of social skills in individuals with AS, including reinforcing effective strategies, contextual learning, emotional understanding, and recognition of personal strengths [
7].
The Vineland Adaptive Behavior Scales II (Vineland-ABS) are standardised tools used to assess adaptive behaviour across an individual’s lifespan [
8,
9]. The primary aims of the Vineland scales are to evaluate how well individuals can function in their daily lives and to identify any deficits in their adaptive behaviour [
9]. The scales comprise five main areas, each with subdomains: communication, daily living skills, and socialisation [
10].
To improve socialisation skills in individuals with ASD, various techniques tailored to their specific needs are employed, which can be grouped into distinct approaches [
11,
12]. It is essential to provide personalised educational services that address the social needs of individuals with AS. A review of thirteen studies indicated that group-based social skills training generally helps enhance the social skills of adolescents and adults with ASD. However, the review also emphasised the need for further research to compare different training methods and their impact on overall psychological well-being [
13].
Aim of the study
The present study examines the effectiveness of a structured social skills training programme for adolescents and young adults with AS.
2. Materials and Methods
Subjects
Patients diagnosed with autism level 1, irrespective of gender, were consecutively recruited from the outpatient clinic.
This study was conducted following the Declaration of Helsinki and was approved by the Institutional Review Board (or Ethics Committee) of the University Hospital of Verona (CESC 2243 (Paediatric Clinic, University Hospital of Verona) and CESC 2242 (Child and Adolescent Neuropsychiatry Outpatient Clinics, University Hospital of Verona)) on 10 December 2019. Informed consent was obtained from all participants and their legal guardians before the commencement of the study.
Behavioural Intervention:
The proposed activities included the following:
Social Skills, Autonomy, and Awareness Module for the Adolescent Group: From May 2021 to February 2022, practical sessions were held fortnightly. These sessions included visits to the local area, cooking workshops, and role-playing exercises, each lasting 1.5 to 3 hours.
Social Skills, Autonomy, and Awareness Module for the Young Adult Group: This group participated in structured discussions on various topics relevant to their needs, alongside role-playing activities and outings to practise daily living skills, such as shopping, cooking, and tidying up. The young adults also set up a WhatsApp group to coordinate schedules and send reminders before sessions, promoting increased participant interaction. In total, 13 sessions were conducted from May 2021 to February 2022, each lasting approximately 1.5 hours, with some practical sessions extending to 3 hours when additional time was required.
Vineland test
The Vineland Adaptive Behaviour Scales (VABS) were employed as a diagnostic tool to assess adaptive behaviour and various developmental disabilities. These scales evaluate how well an individual functions daily and identify deficits in adaptive behaviour across four main areas: communication, daily living skills, and socialisation. The Vineland-ABS has proven instrumental in supporting ASD diagnoses alongside other diagnostic methods [
8,
9]. The assessment was conducted at baseline and repeated at follow-up to evaluate the effectiveness of the Social Skills, Autonomy, and Awareness Module.
Statistical analysis
Data was exported from the online questionnaire created with Google Forms and saved in XLS file format, then entered a Microsoft® Excel® database for Windows 11 (access date: 30 September 2021). We used SPSS version 22.0 for Windows (SPSS Inc., Chicago, IL) for statistical analysis.
The analysis included automatic clustering, which uses the Bayesian Information Criterion (BIC) to determine the optimal number of clusters within the dataset. We applied the Pearson Chi-square and Fisher’s exact tests to assess whether cluster variables differed significantly.
We set the threshold for statistical significance at p < 0.05 for all tests; however, we acknowledge that p-values may be influenced by factors such as small sample size, potential bias, and random error. Therefore, we will also consider statistical significance for p-values between 0.05 and 0.1, explaining these values and any additional evidence supporting the observed relationships [
14].
3. Results
The two-cluster model (
Table 2) is the most efficient, having the lowest BIC score and a satisfactory distance measure ratio of 1.913. This suggests a good separation between clusters without overcomplicating the model.
Table 2.
The statistical analysis presents the results of automatic clustering, which utilised the Bayesian Information Criterion (BIC) to determine the optimal number of clusters within the dataset. The variables considered are detailed in Table 1 for both enrolment and follow-up. The change ratios correspond to the solution that identified two clusters, providing insight into how participants responded to the intervention.
| Number of Clusters |
Criterio Bayesian criteria of Schwarz (BIC) criteria |
Change in BIC |
Change Ratio |
Distance Measures |
| 1 |
315.066 |
|
|
|
| 2 |
298.592 |
-16.475 |
1.000 |
1.913 |
| 3 |
324.390 |
25.798 |
-1.566 |
1.621 |
| 4 |
367.935 |
43.545 |
-2.643 |
2.733 |
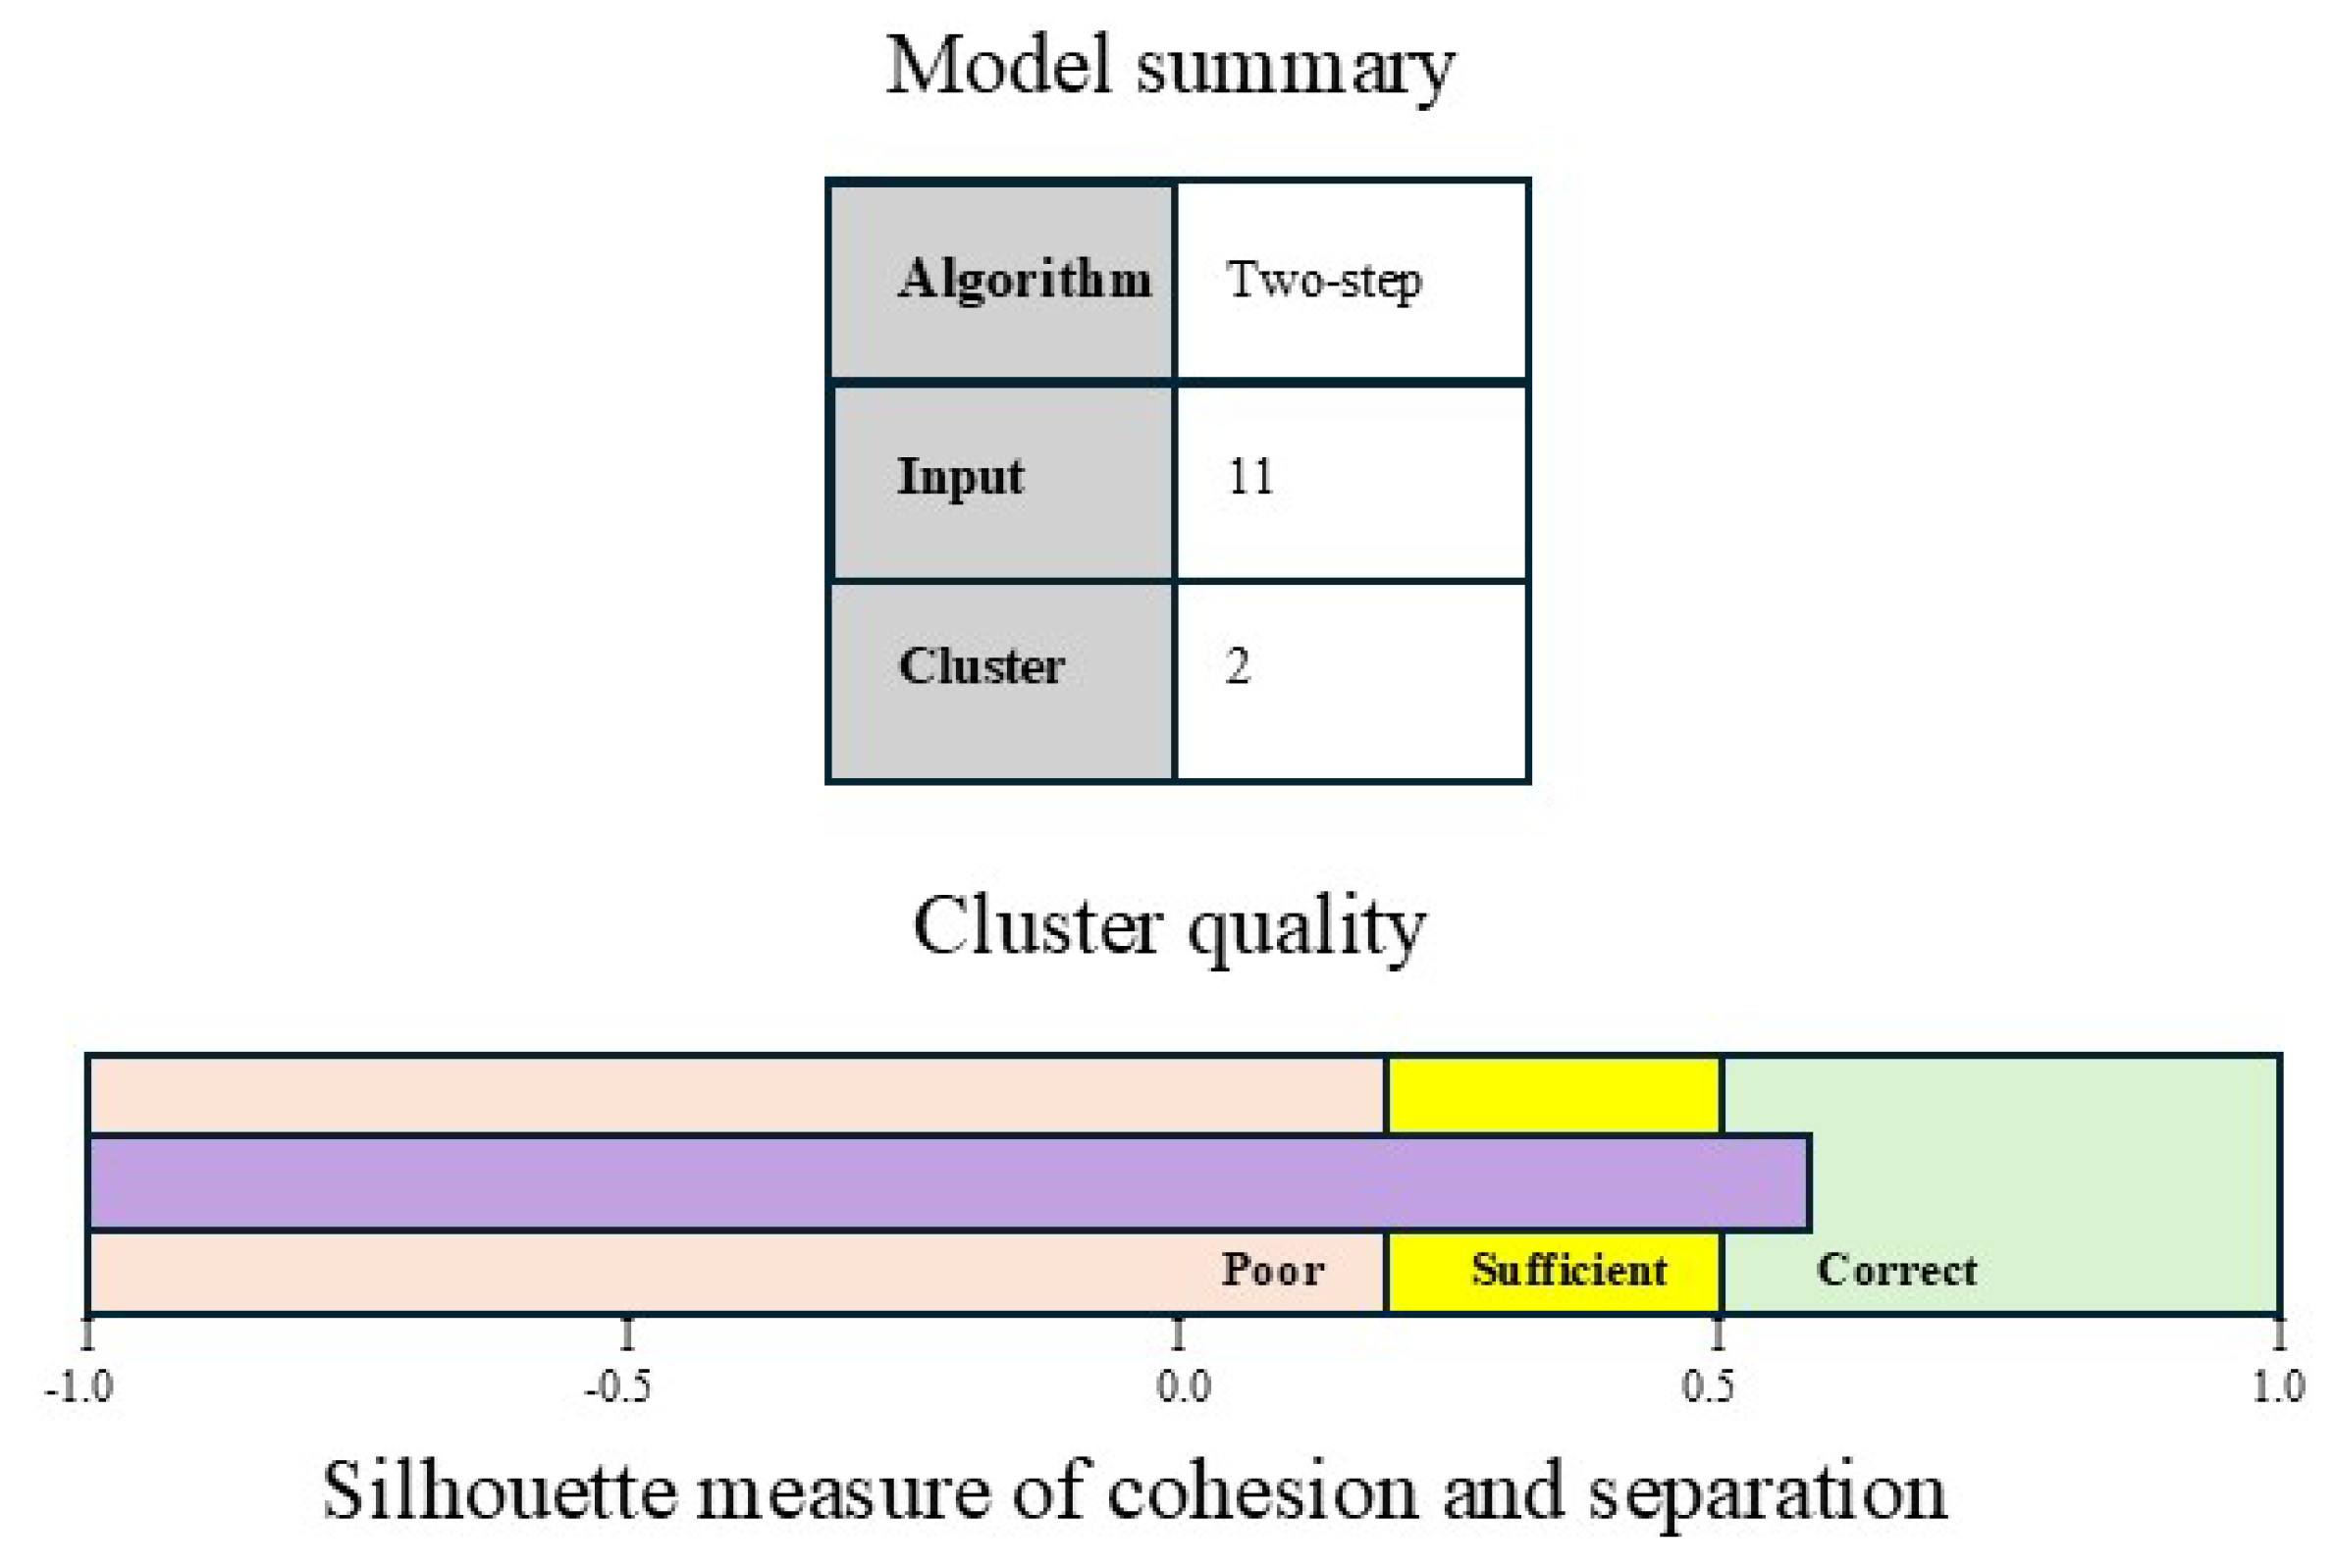
Figure 1.
The figure summarises a clustering model generated using the TwoStep algorithm based on data from 11 variables that identified two distinct clusters. A bar chart at the bottom of the figure displays the clustering quality, assessed using the silhouette measure. Positive values close to +1 indicate strong cohesion and separation between the clusters, suggesting that the clustering is accurate.
The bar chart indicates that the silhouette measure for this model is over 0.5, which falls within the range that suggests a good quality of clustering.
Table 3.
Table 3 displays the statistical results for two groups of autistic individuals assessed at different time points (enrolment and follow-up). It includes their ages and scores from the Vineland scale in socialisation, communication, and daily living skills. The table also compares the two groups and highlights the P-value figures, which help to determine whether the results are statistically significant.
| Variable |
Cluster 1 (n.8) |
|
|
Cluster 2 (n.23) |
|
Pearson’s Chi-squared |
|
| Gender (females) |
6 |
|
|
18 |
|
0.600 |
|
| |
Mean (SD) |
95% C.I. |
P-value
(no correlated sample) |
Mean (SD) |
95% C.I. |
P-value
(no correlated sample) |
U Mann-Whitney test |
| Age (years), enrolment |
26.0 (4.3) |
22.4 – 29.6 |
- |
18.1 (6.6) |
15.2 – 21.0 |
|
0.005 |
| Age (years), follow-up |
27.4 (4.3) |
23.8 – 31.0 |
- |
19.5 (6.7) |
16.6 – 22.4 |
|
0.005 |
| |
|
|
|
|
|
|
|
| Vineland score, enrolment |
105.4 (13.4) |
94.1 – 116.6 |
- |
64.8 (14.1) |
58.7 – 70.9 |
|
< 0.001 |
| Vineland score, follow-up |
110.9 (14.8) |
98.5 – 123.2 |
0.021 |
66.6 (15.5) |
59.9 – 73.3 |
0.258 |
< 0.001 |
| |
|
|
|
|
|
|
|
| Vineland communication score, enrolment |
96.1 (13.4) |
84.9 – 107.3 |
- |
60.1 (20.9) |
51.1 – 69.2 |
|
< 0.001 |
| Vineland communication score, follow-up |
92.8 (11.5) |
83.1 – 102.4 |
0.078 |
60.5 (19.6) |
52.0 – 69.0 |
0.862 |
< 0.001 |
| |
|
|
|
|
|
|
|
| Vineland’s daily living skills score, enrolment |
109.1 (8.9) |
101.7 – 116.5 |
- |
66.3 (29.3) |
46.6 – 75.9 |
|
< 0.001 |
| Viveland daily living skills score, follow-up |
114.9 (13.9) |
103.3 – 126.5 |
0.068 |
63.8 (20.6) |
66.1 – 87.8 |
0.276 |
< 0.001 |
| |
|
|
|
|
|
|
|
| Vineland’s socialisation score, enrolment |
93.9 (5.7) |
89.1 – 98.7 |
- |
49.0 (18.2) |
41.2 – 56.9 |
|
< 0.001 |
| Vineland’s socialisation score, follow-up |
104.6 (13.3) |
93.5 – 115.7 |
0.011 |
57.8 (18.0) |
50.0 – 79.7 |
0.012 |
< 0.001 |
The analysis in
Table 3 compares two groups (Cluster 1, with 8 participants, and Cluster 2, with 23 participants). We used Pearson’s Chi-square test to investigate gender differences and the Mann-Whitney U test for age and Vineland scores. There was no significant difference in the distribution of genders between the two groups (p = 0.600).
Initially, the average age in Cluster 1 was significantly greater than that in Cluster 2 (p = 0.005). This pattern continued at follow-up, where the mean age of Cluster 1 remained significantly higher than that of Cluster 2 (p = 0.005).
Regarding the Vineland scores, Cluster 1 had a significantly higher mean score at enrolment than Cluster 2 (p < 0.001). At follow-up, Cluster 1 still had a significantly higher mean score than Cluster 2 (p < 0.001). The change in scores from enrolment to follow-up in Cluster 1 was significant (p = 0.021), whereas Cluster 2 did not show a significant difference (p = 0.258).
Regarding the Vineland communication scores, the difference between the two groups at enrolment was highly significant (p < 0.001), indicating that Cluster 1 initially had much better communication skills than Cluster 2. This significant difference persisted at follow-up (p < 0.001). However, there was no significant change within Cluster 1 from enrolment to follow-up (p = 0.078), nor within Cluster 2 (p = 0.862).
For daily living skills, the difference between the groups was highly significant at both enrolment (p < 0.001) and follow-up (p < 0.001). The mean score for daily living skills in Cluster 1 increased at follow-up, but no significant internal changes were found in either Cluster 1 (p = 0.068) or Cluster 2 (p = 0.276).
Lastly, the Vineland socialisation scores at both enrolment and follow-up established a highly significant difference between the two groups (p < 0.001). At follow-up, the mean scores for both groups increased, demonstrating significant improvements over time (Cluster 1, p = 0.011; Cluster 2, p = 0.012).
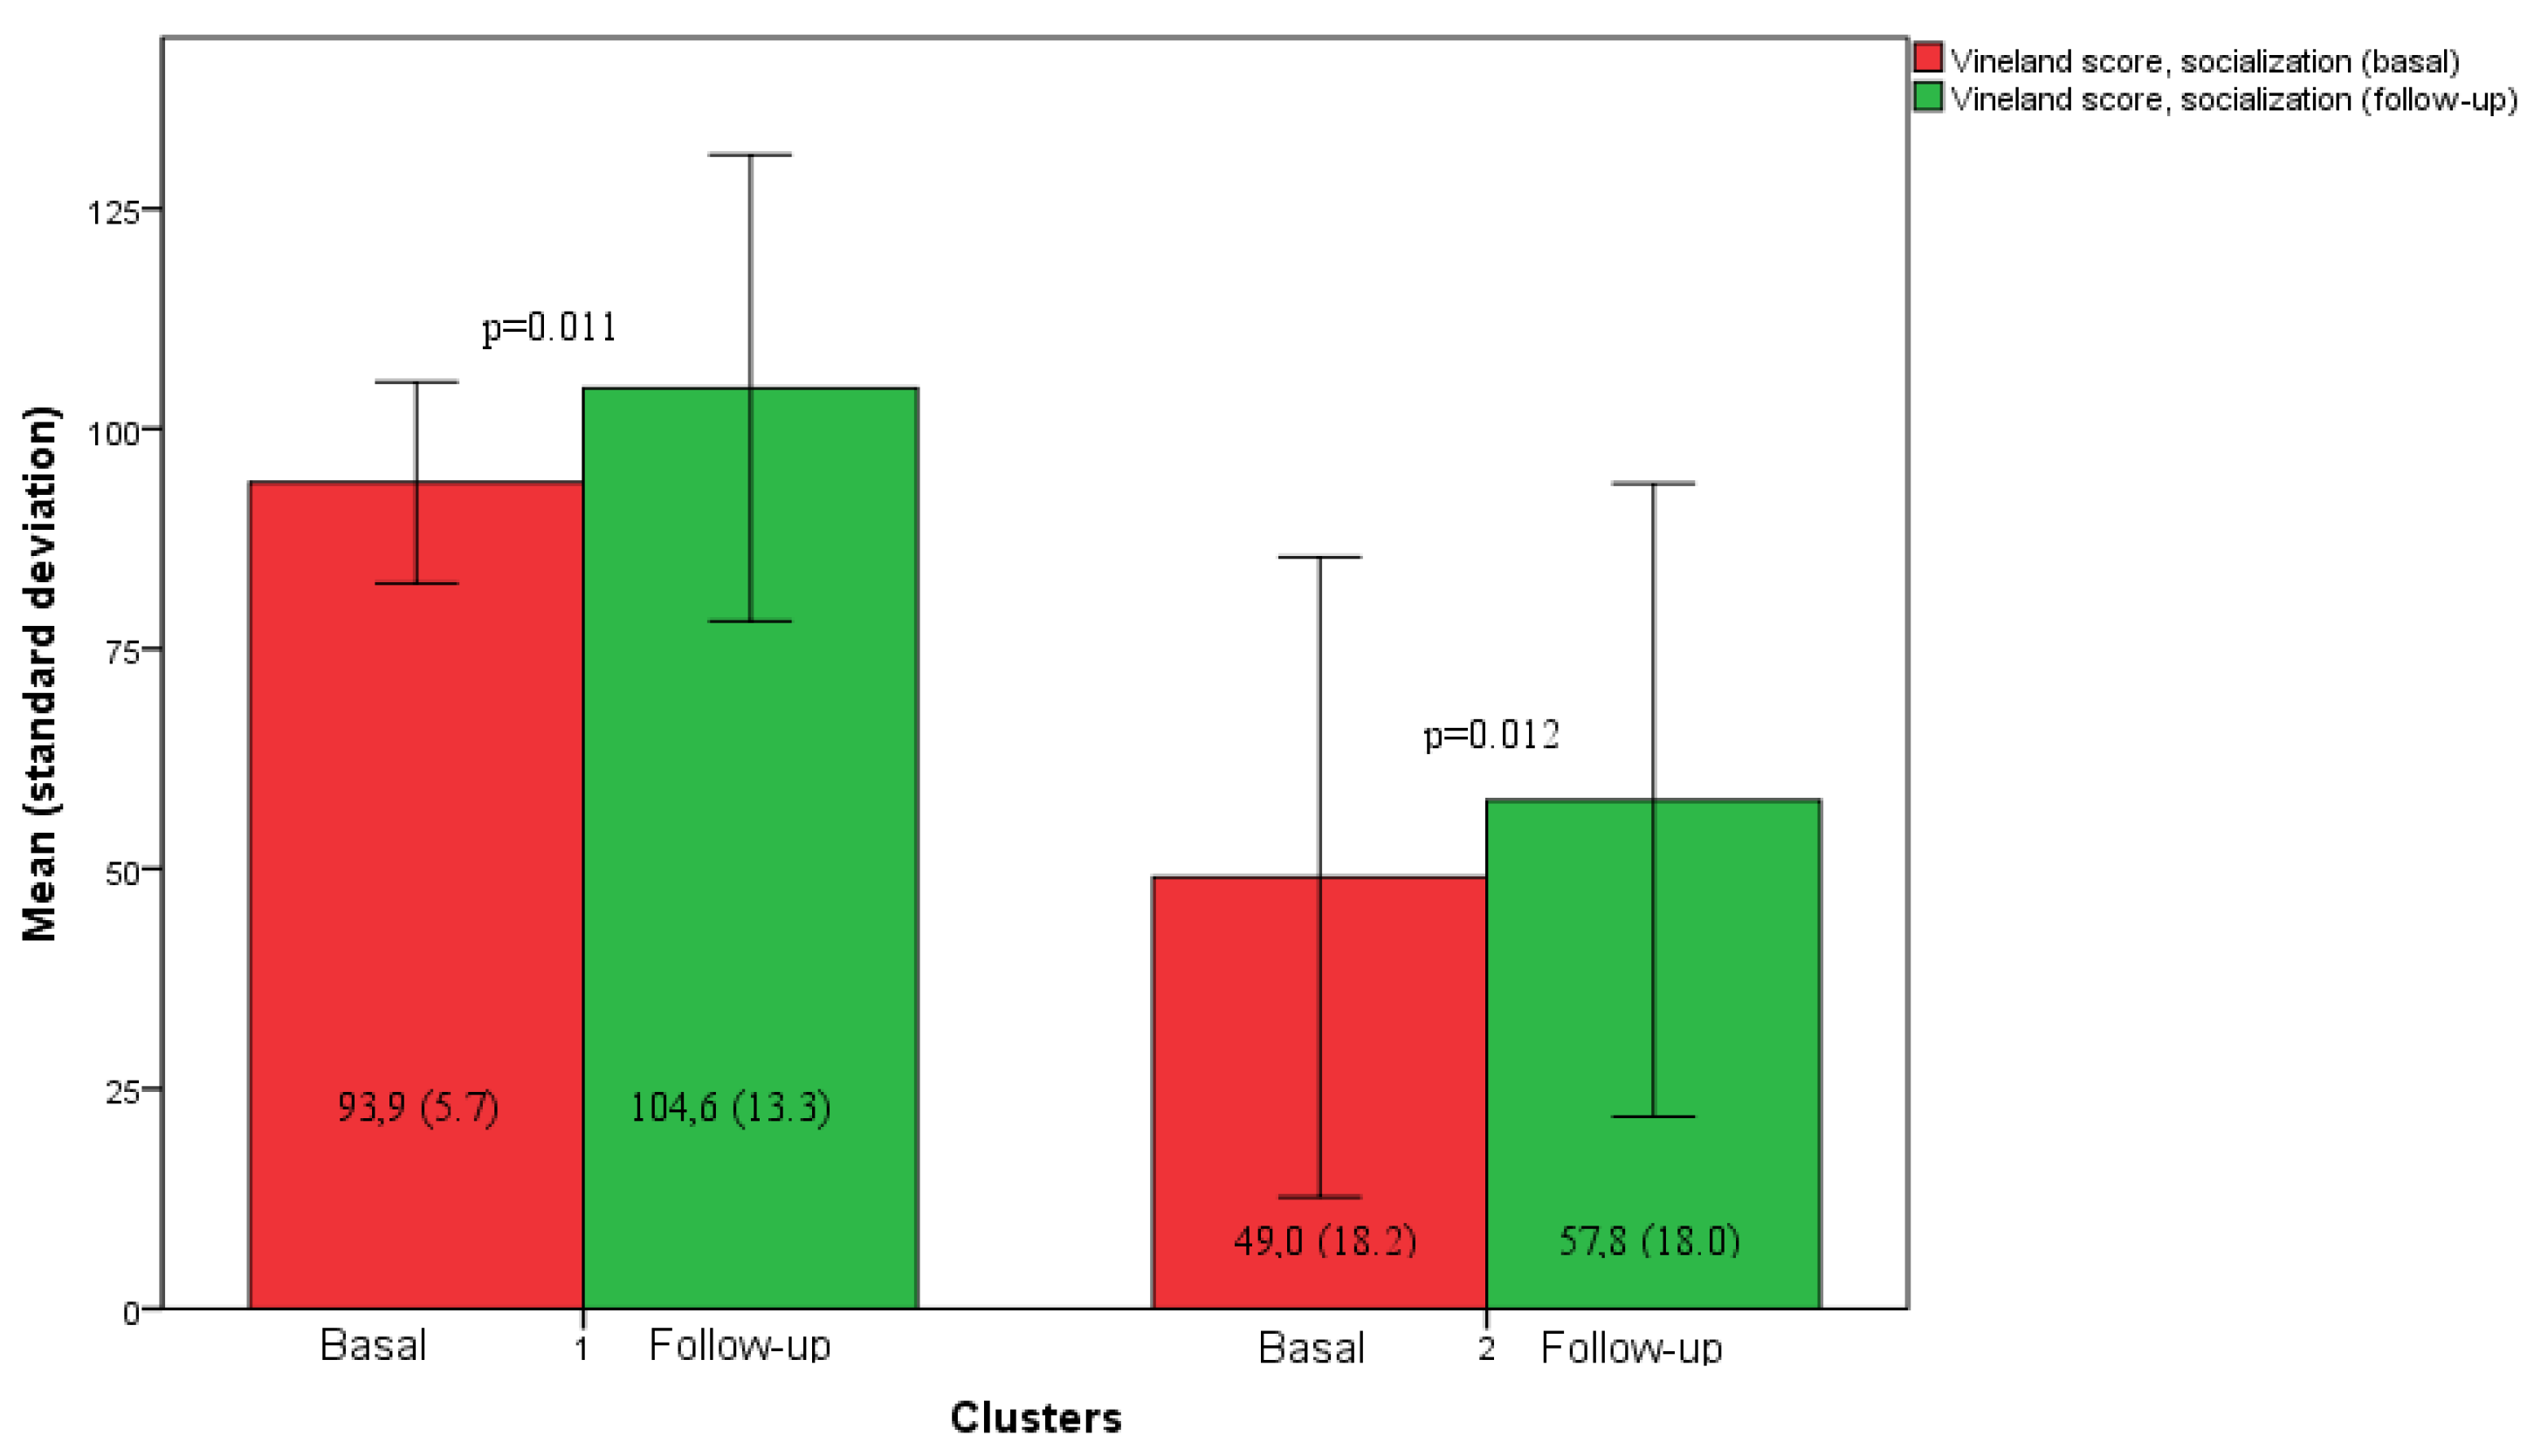
Figure 2.
The bar chart displays the mean (± S.D.) Vineland scale scores for socialisation in Clusters 1 and 2, measured at enrolment and follow-up.
Figure 2.
The bar chart displays the mean (± S.D.) Vineland scale scores for socialisation in Clusters 1 and 2, measured at enrolment and follow-up.
Figure 2 illustrates that at follow-up (indicated by the green bar), the mean score showed a statistically significant increase compared to enrolment (represented by the red bar; p = 0.011) in Cluster 1. This indicates a notable improvement in socialisation skills for Cluster 1. Similarly, at follow-up, Cluster 2 also shows an increase in its mean score compared to enrolment (p = 0.012), reflecting enhanced socialisation abilities, although its scores remained lower than those of Cluster 1.
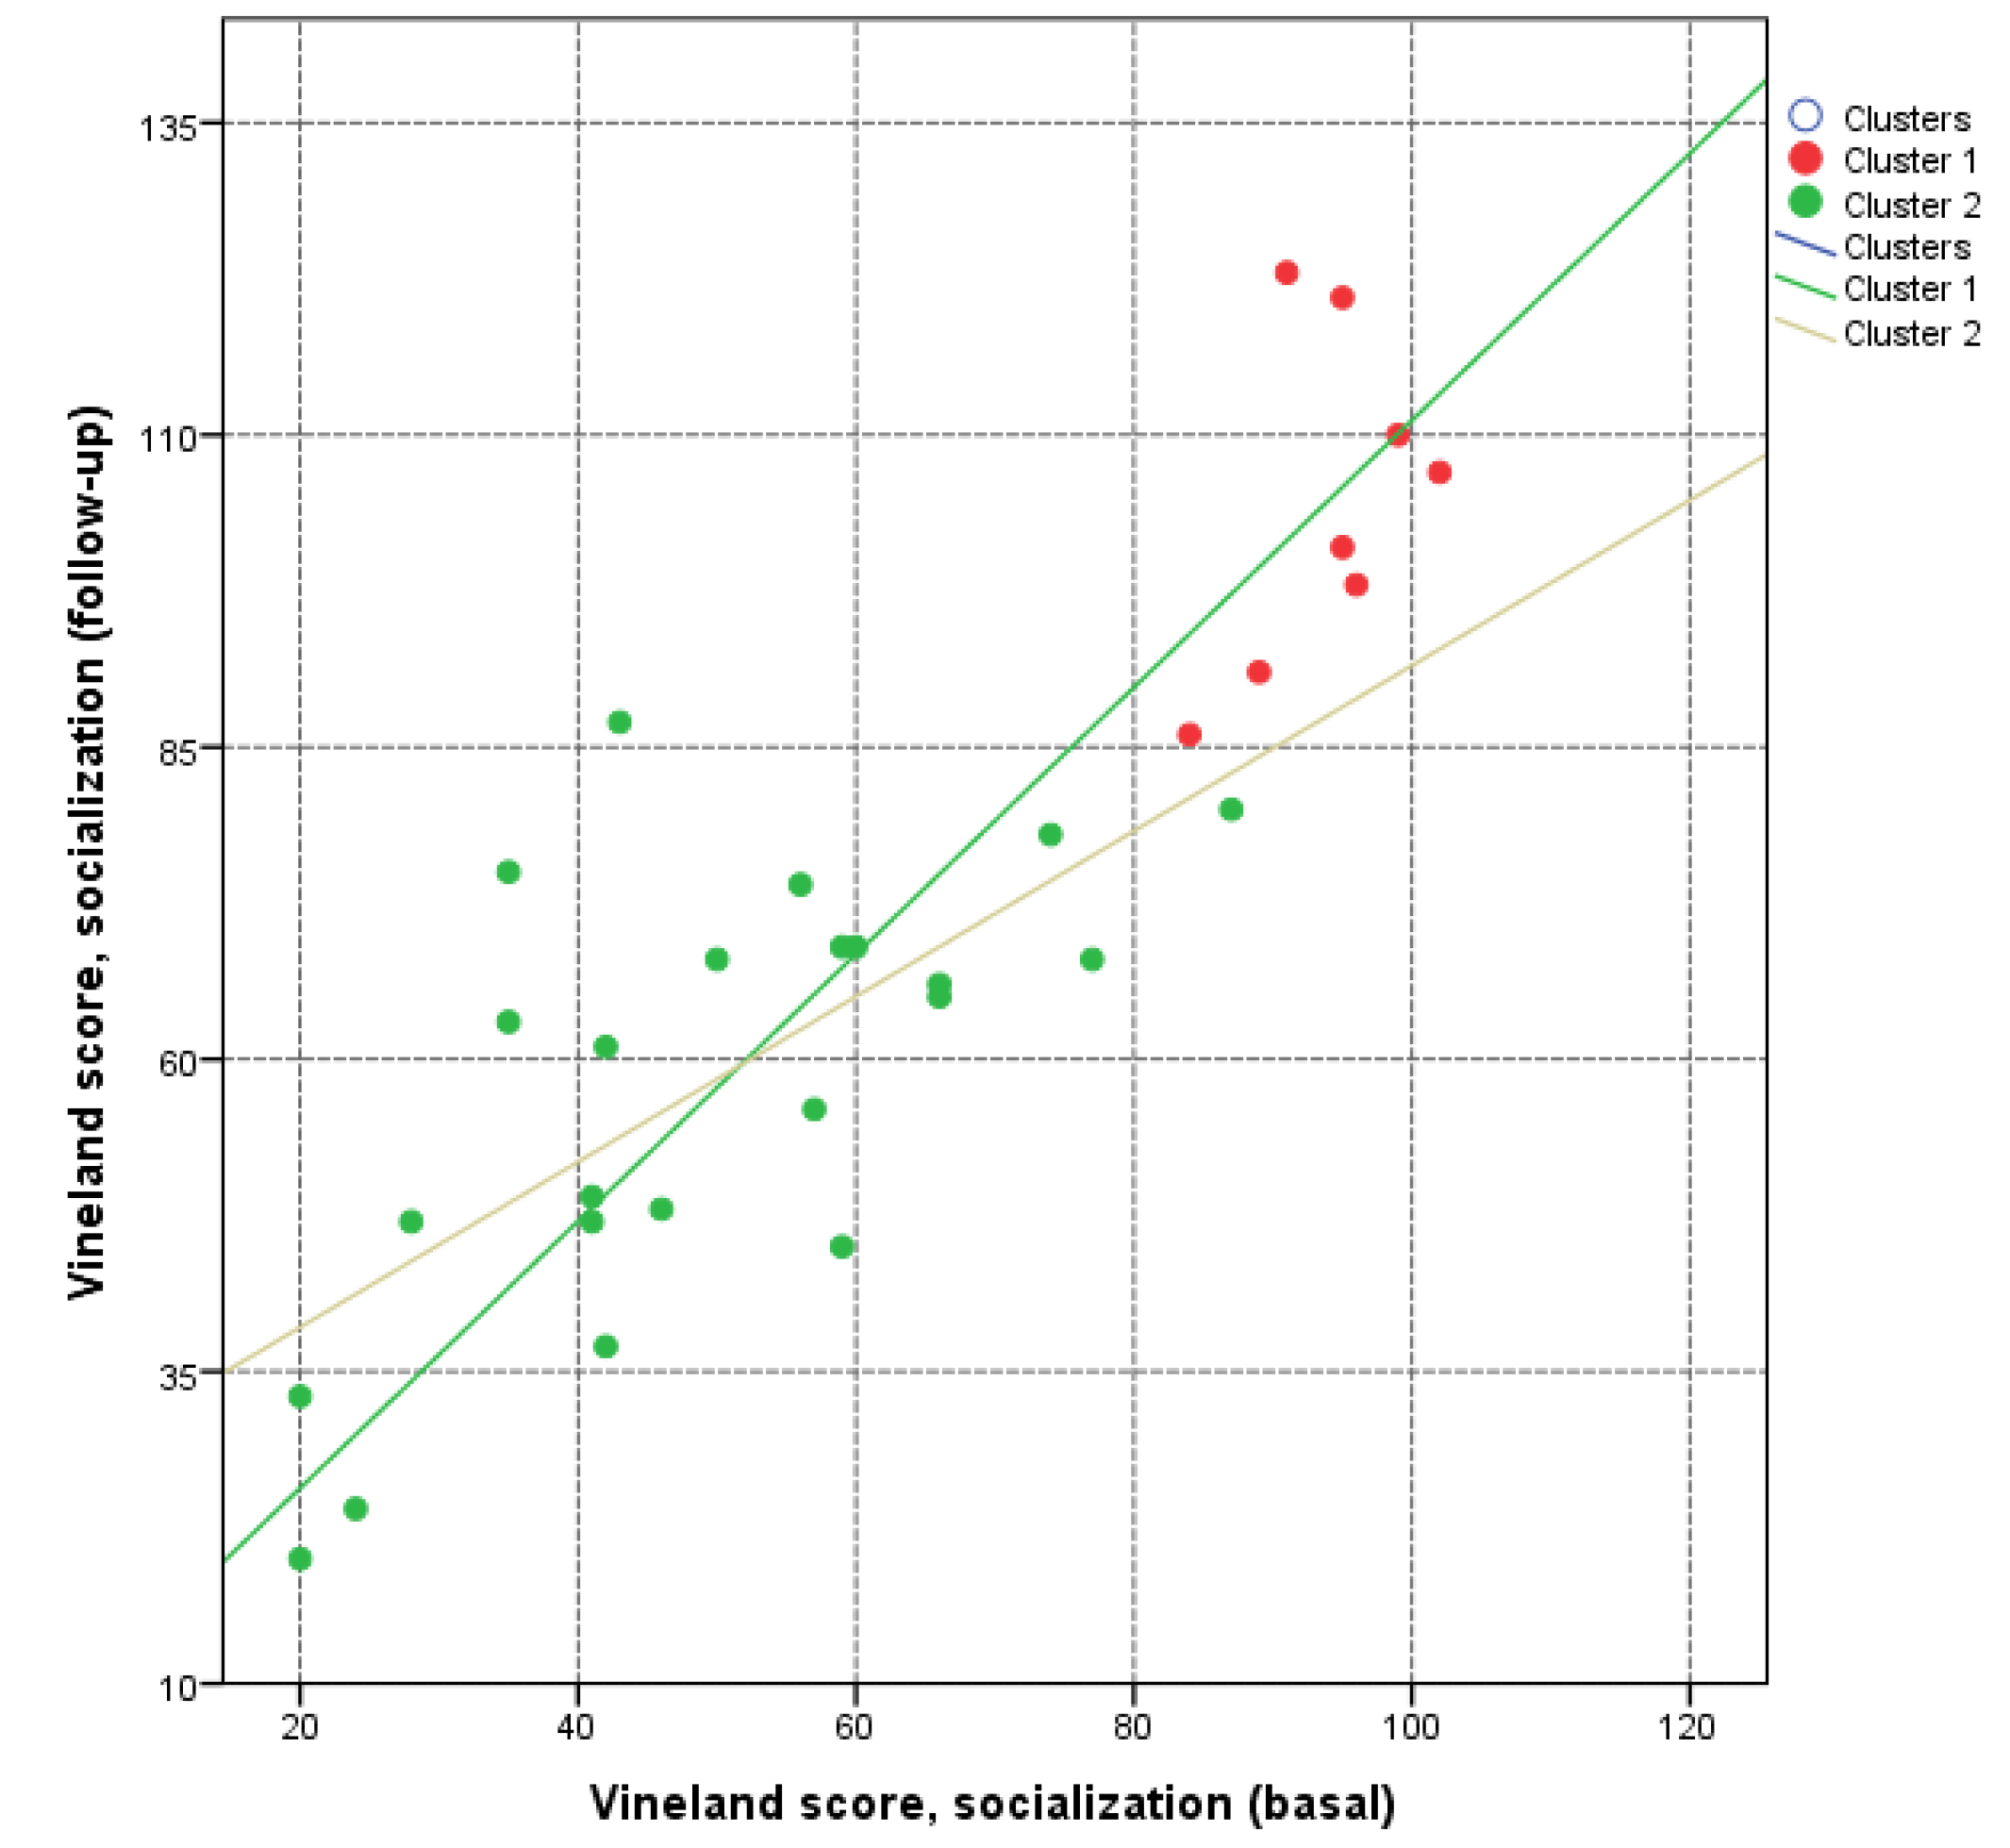
Figure 3.
The graph illustrates the relationship between Vineland’s socialisation scores at two different time points: the enrolment assessment (horizontal axis) and the follow-up assessment (vertical axis). Each point represents a participant, with different colours indicating their cluster membership.
In
Figure 3, most participants in Cluster 1 (in red) are located within the higher range of enrolment and follow-up scores, indicating that their scores remained relatively stable at a higher level. In contrast, Cluster 2 (in green) shows a more significant distribution, with their enrolment and follow-up scores covering a broader range. Both clusters exhibit a positive relationship between their enrolment and follow-up socialisation scores, but the regression line of Cluster 2 has a steeper angle than that of Cluster 1.
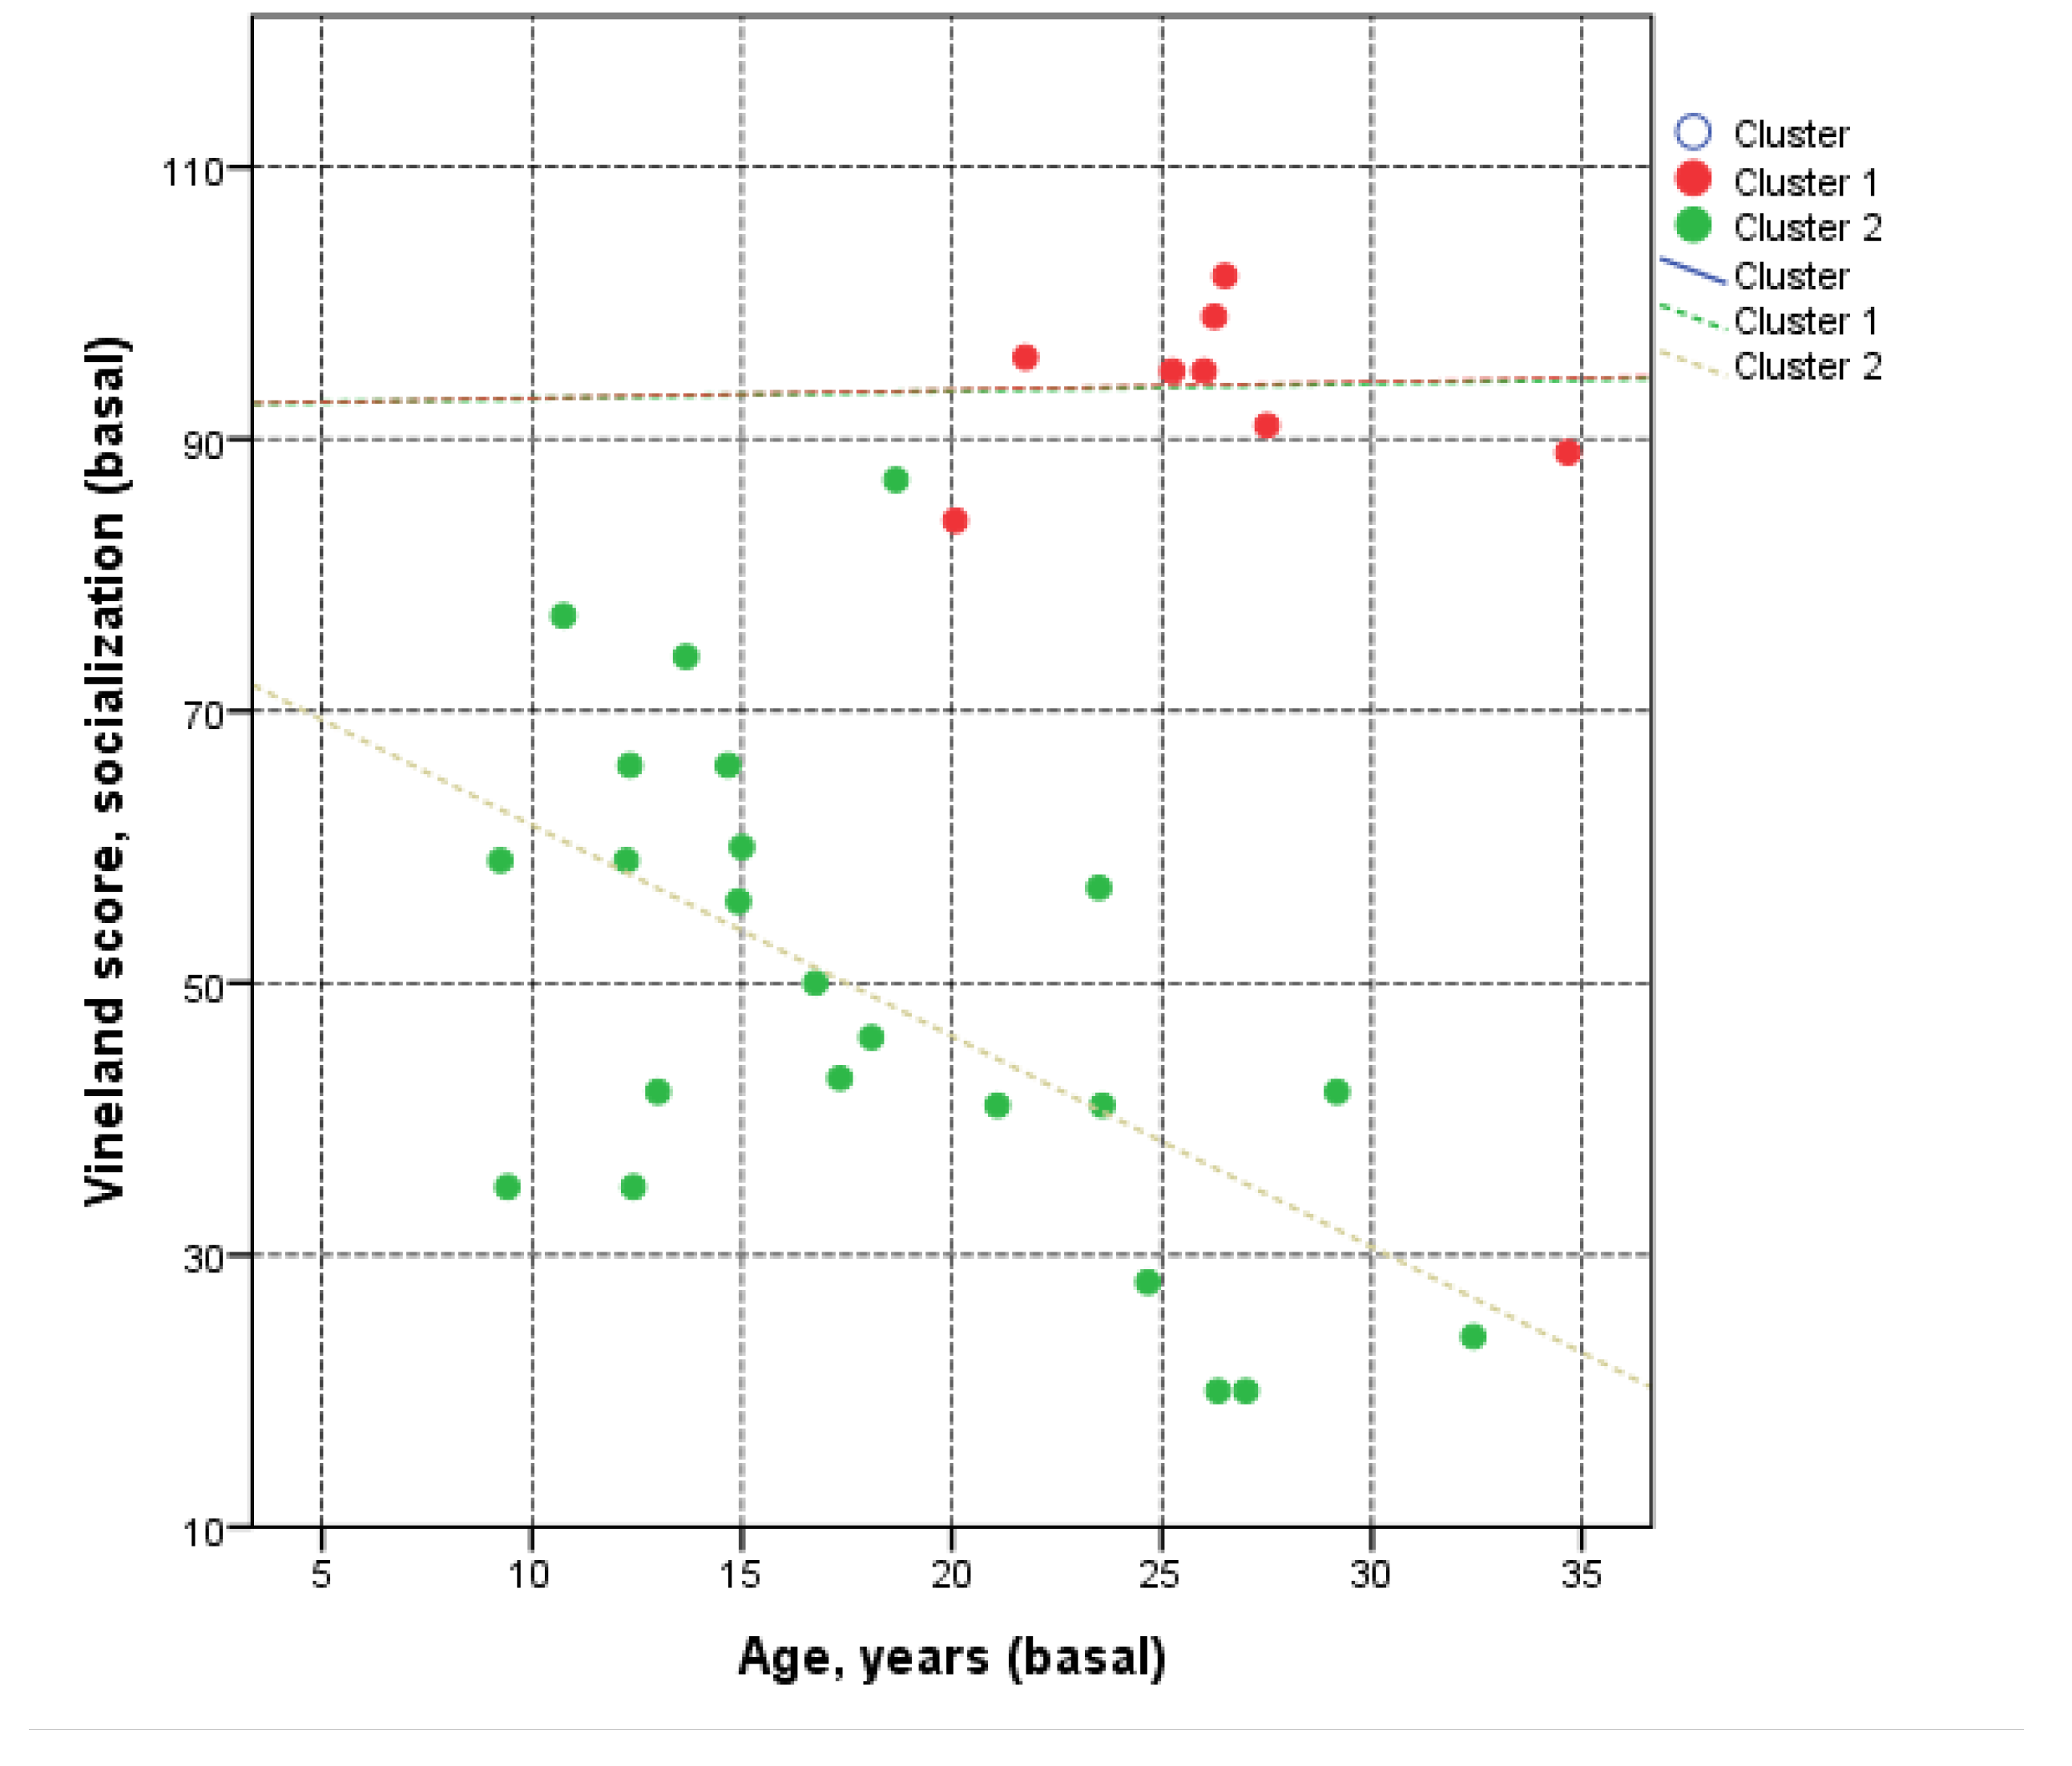
Figure 4.
The scatter plot shows the relationship between enrolment age (horizontal axis) and the Vineland socialisation score at enrolment (vertical axis) for the two groups, Cluster 1 and Cluster 2.
Figure 4.
The scatter plot shows the relationship between enrolment age (horizontal axis) and the Vineland socialisation score at enrolment (vertical axis) for the two groups, Cluster 1 and Cluster 2.
In
Figure 4, the participants in Cluster 1 (shown by the red points) are between approximately 20 and 35 years old, with socialisation scores ranging from 80 to 110. The trend line for Cluster 1 (the red dashed line) is nearly horizontal, suggesting that their scores are relatively consistent across ages. In contrast, participants in Cluster 2 range from about 7 to 35 years old, and their enrolment socialisation scores are much more varied, spanning from around 20 to 90. The trend line for Cluster 2 (the green dashed line) exhibits a noticeable descending slope. Overall, the plot reveals that in Cluster 1, enrolment socialisation scores do not change significantly with age, whereas in Cluster 2, socialisation scores tend to decrease as age increases.
Figure 5.
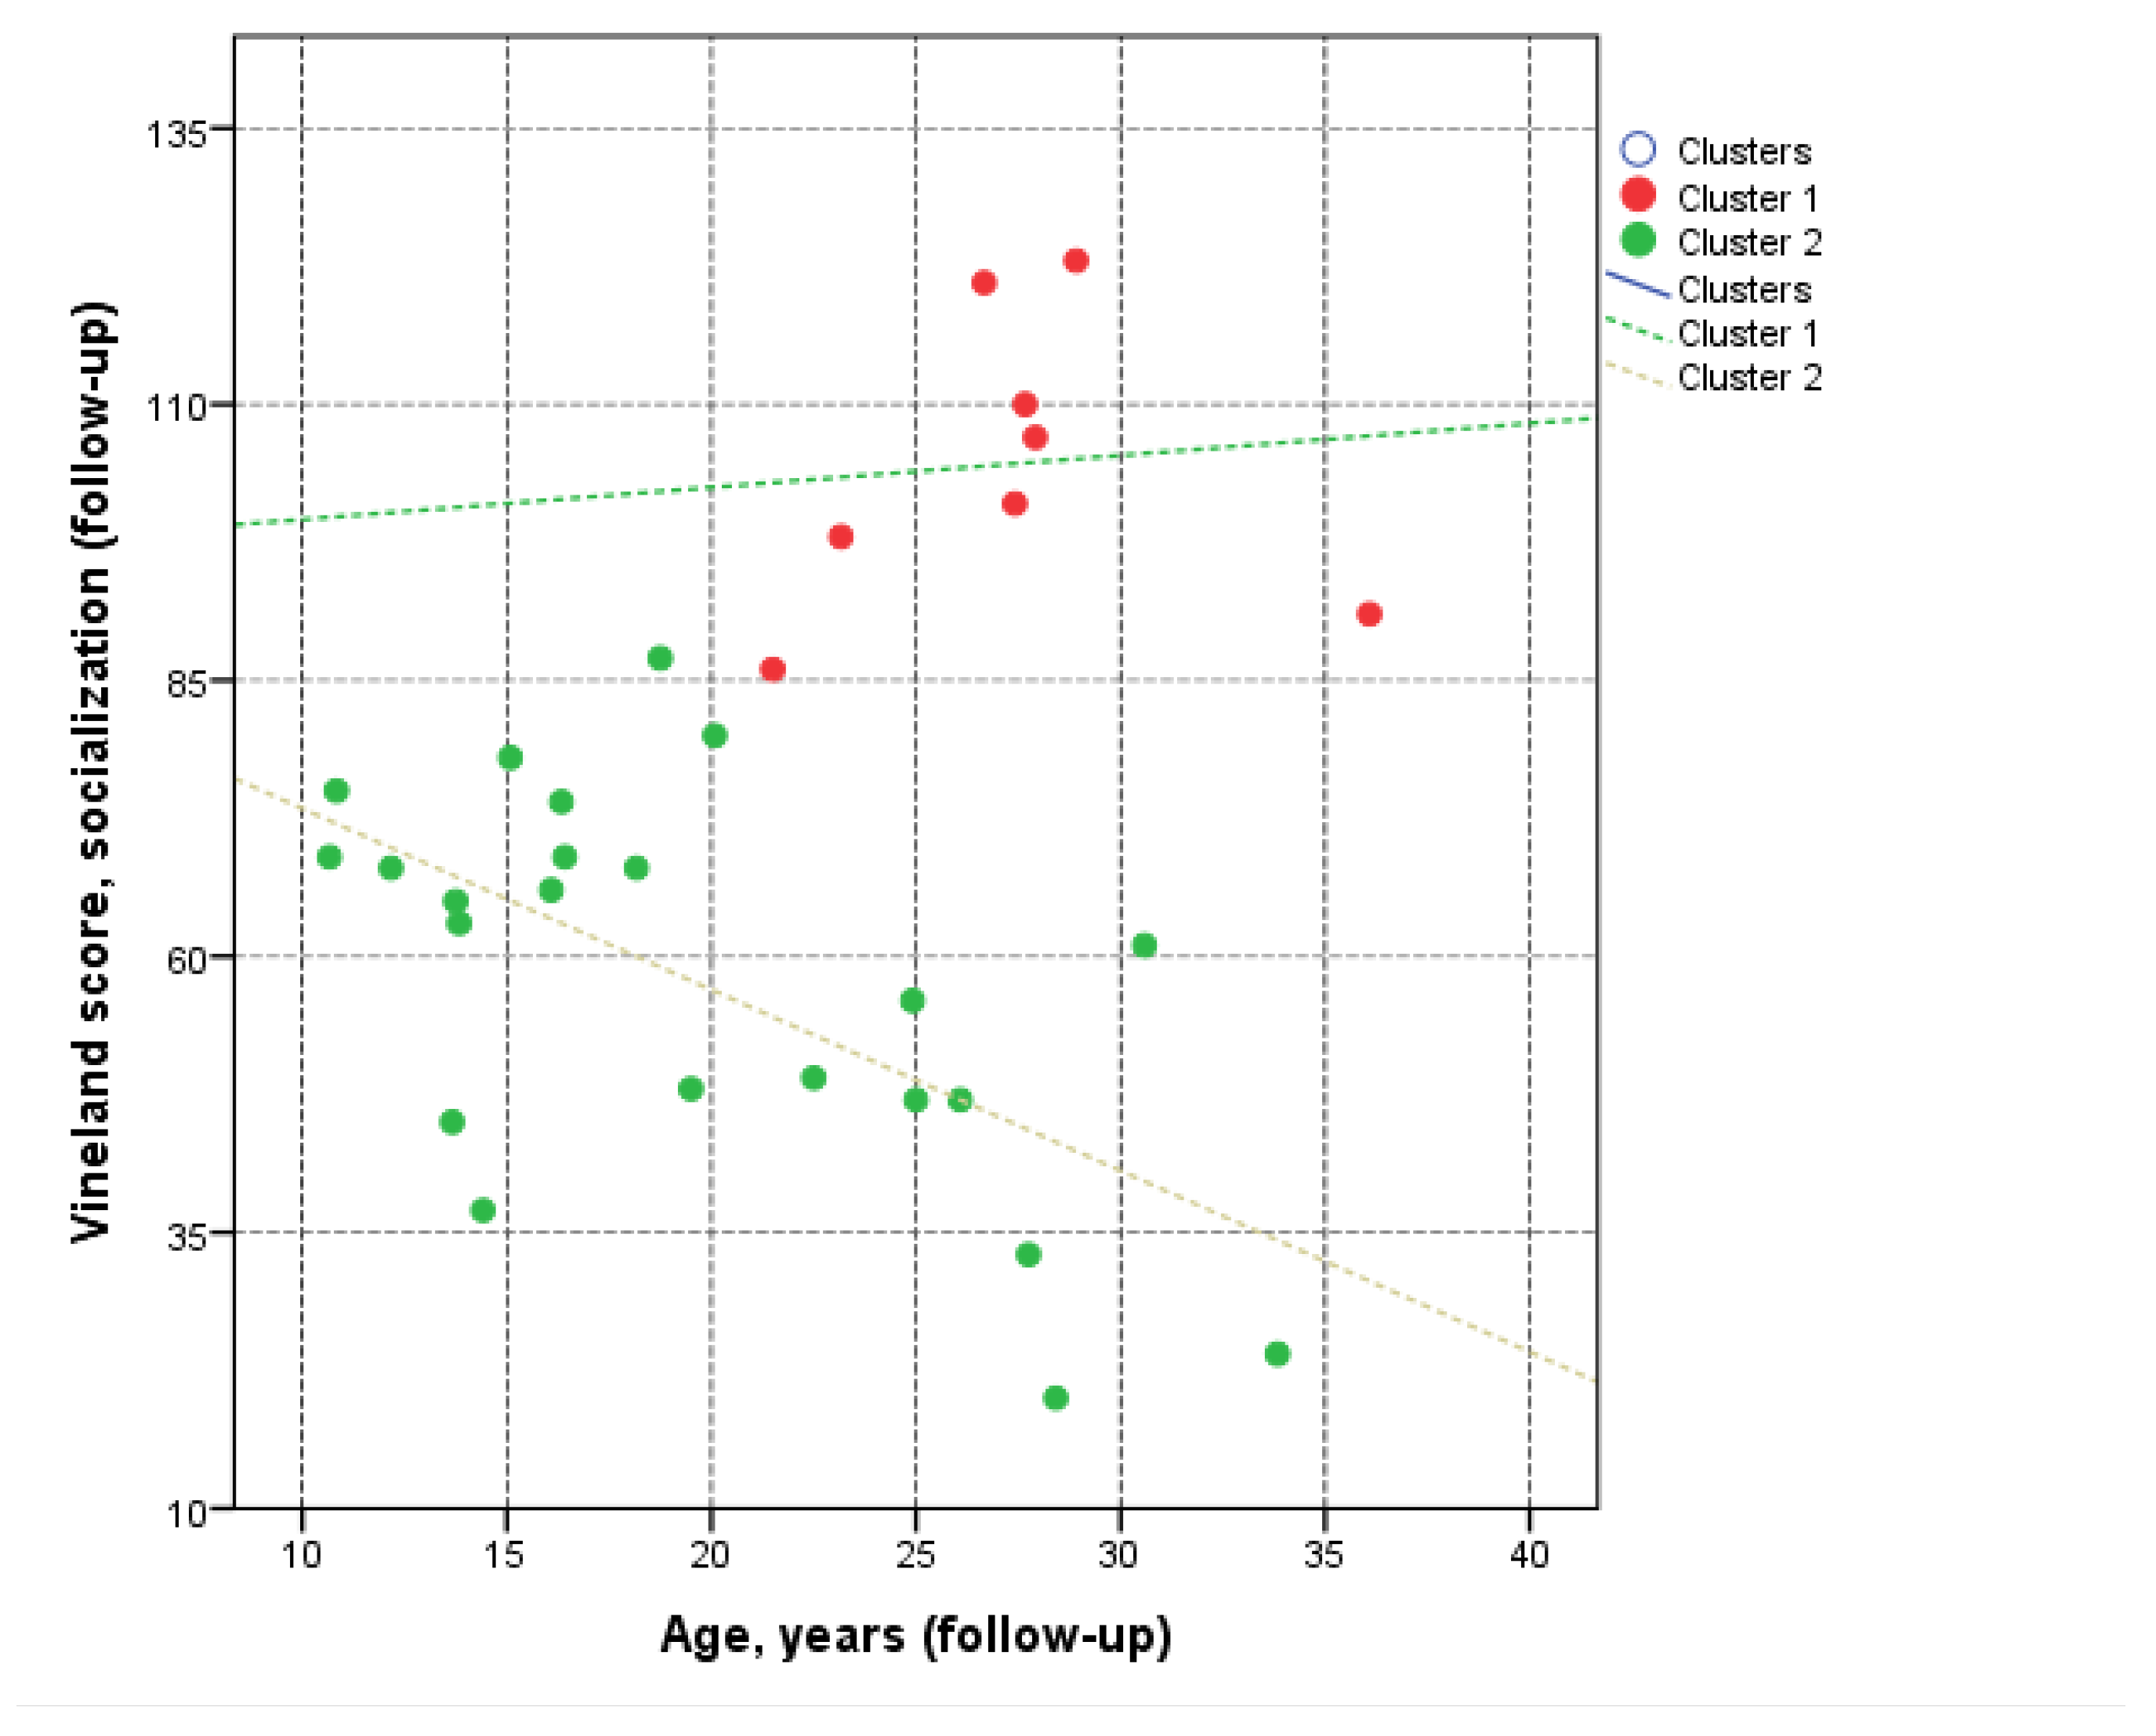
The scatter plot illustrates the relationship between age at follow-up (horizontal axis) and the Vineland socialisation score at follow-up (vertical axis) for the two groups, Cluster 1 and Cluster 2.
Figure 5.
The scatter plot illustrates the relationship between age at follow-up (horizontal axis) and the Vineland socialisation score at follow-up (vertical axis) for the two groups, Cluster 1 and Cluster 2.
In
Figure 5, the participants in Cluster 1 (shown by the red points) are aged between 20 and 37 years, with follow-up socialisation scores ranging from 85 to 120. The trend line for Cluster 1 (the red dashed line) is almost horizontal. In contrast, participants in Cluster 2 are aged approximately 10 to 35 years, and their follow-up socialisation scores vary widely, falling between 20 and 90. The trend line for Cluster 2 (the green dashed line) shows a clear downward slope. Overall, the plot suggests that in Cluster 1, follow-up socialisation scores remain relatively stable across different ages, whereas in Cluster 2, these scores tend to decline as participants get older.
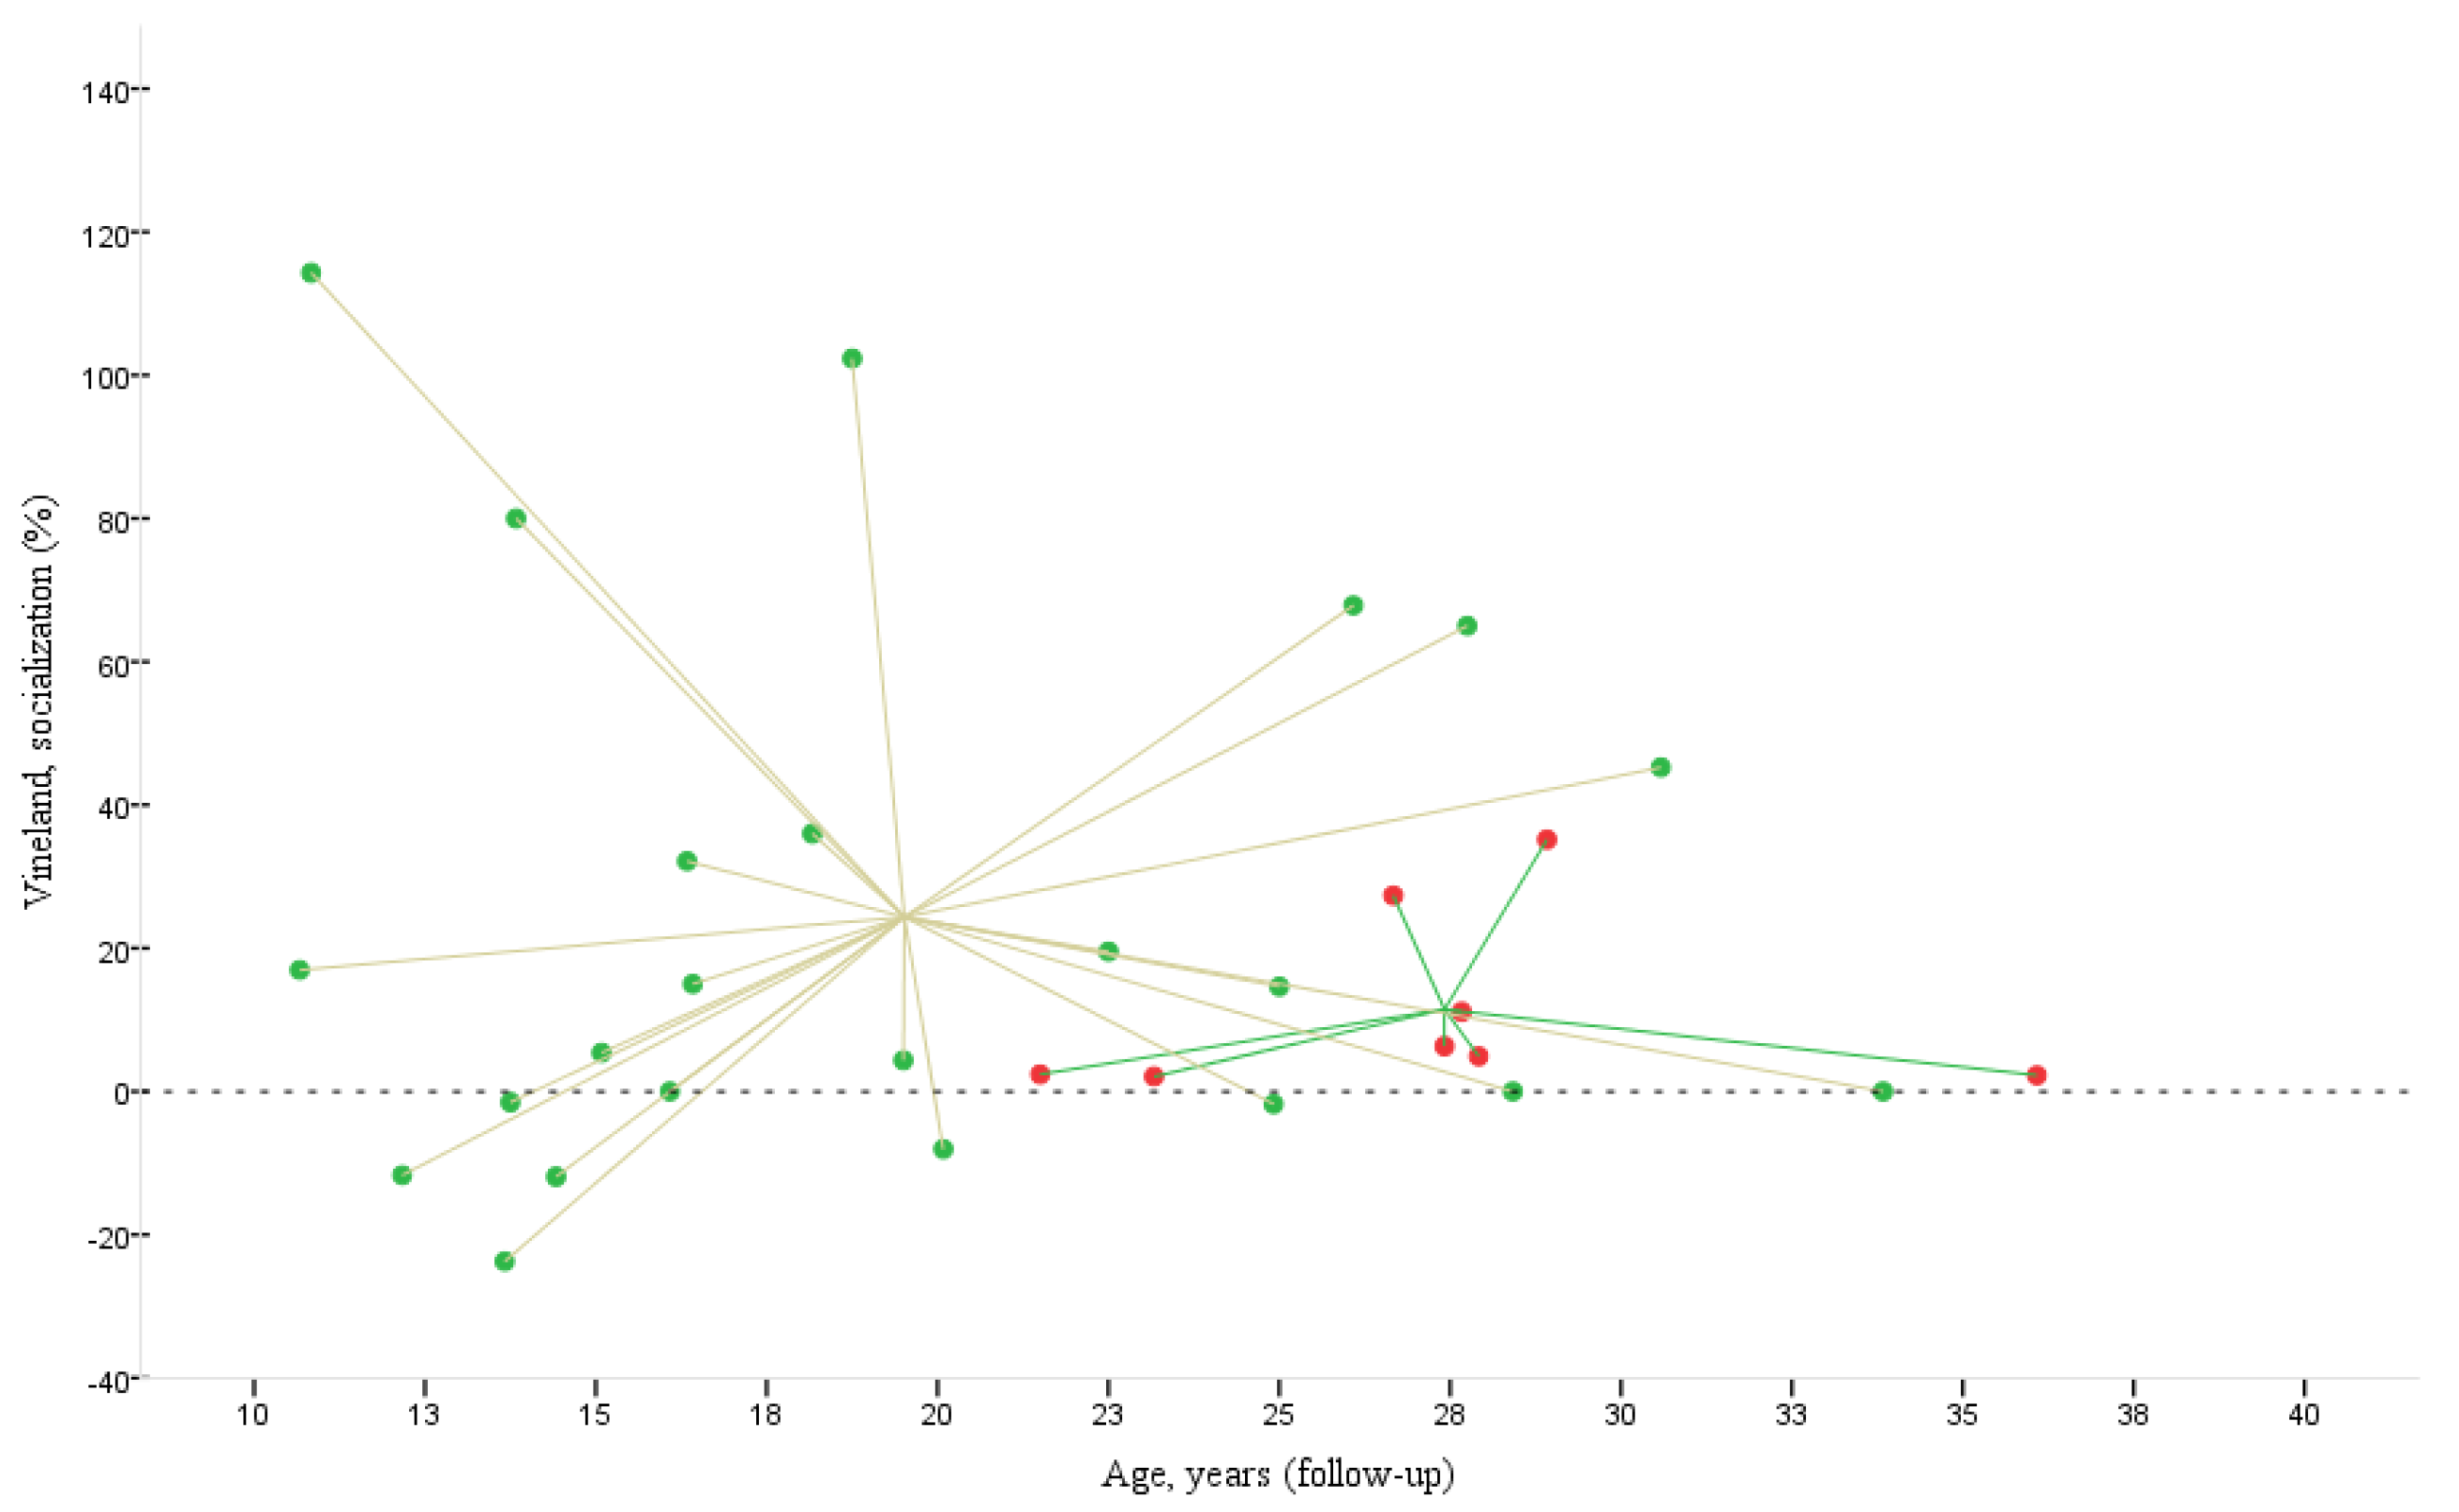
Figure 6.
The figure illustrates the percentage change in Vineland socialisation scores (%) about age (in years) at follow-up for two groups: Cluster 1 and Cluster 2. Age is plotted along the horizontal axis, while the Vineland socialisation scores are displayed vertically. Each point on the graph represents a participant, with Cluster 1 marked in red and Cluster 2 in green. The lines connecting the points converge at a point representing each cluster’s centroid.
In
Figure 6, Cluster 1 (marked by red points) consists of older individuals whose socialisation scores, representing percentage change, remain slightly above zero, indicating only a marginal increase in their socialisation levels. In contrast, Cluster 2 (represented by green points) includes individuals with much greater variability in their Vineland socialisation change (%). Some individuals in this cluster achieve very high scores, while others show markedly negative scores (e.g., -4; -12.9%), indicating a consistent decline in social skills.
4. Discussion
This study assessed the efficacy of the Social Skills, Autonomy, and Awareness Module for individuals of various ages with AS. The analysis revealed two groups (clusters) with distinct clinical characteristics. The first group (n. 8) achieved higher Vineland socialisation scores at enrolment (93.9 ± 5.7) and follow-up (104.6 ± 13.3; p = 0.011), while the second group (n. 23) exhibited a broader range of scores at enrolment (49.0 ± 18.2) and follow-up (57.8 ± 18.0; p = 0.012), with some individuals (12.9%), particularly younger ones (< 20 years), experiencing an unexpected decline in their scores.
The first group of subjects, who were older than those in the second group, showed a generally lower increase in average socialisation scores compared to the second group, with no individuals in the first group experiencing a decline. Despite having a broader age range and a lower mean age than the first group, the second group displayed more significant variability in score changes from enrolment to follow-up, with some individuals showing an unexpected decline in socialisation skills (12.9%).
This observation supports the notion that age and social experience are essential in developing social skills among individuals with AS. Our findings indicate that distinct profiles exist among AS subjects, potentially influenced by differing life experiences, therapies undergone, and individual factors related to neuropsychiatric comorbidities. Nonetheless, by grouping individuals into two clusters based on their enrolment socialisation skills, we observed improvements in both clusters, with exceptions among some younger individuals (≤ 20 years old).
A literature review compared different social skills training groups (traditional, cognitive-behavioural, and parent-inclusive) for young people with AS and high-functioning autism [
15]. In children with AS, training has been shown to improve social skills, particularly in social participation and reciprocity [
16,
17]. Social skills training can significantly assist individuals in developing communication and problem-solving abilities [
18]. Research indicates that interventions can lead to positive changes in social interactions, underscoring the need for strategies to enhance these skills [
19].
In our study, adolescents and young adults participated in a structured exploratory training programme that met biweekly, with sessions ranging from 1.5 to 3 hours. These sessions incorporated various practical activities. Furthermore, the young adults established a social media group to enhance communication and interactions. The utilisation of social networks can indeed assist individuals with ASD in overcoming communication barriers. Despite the challenges they encounter, adolescents with ASD are eager to forge social connections [
20]. While there is limited high-quality evidence on the role of social media for individuals with ASD, existing reports are promising, suggesting that social media-based approaches could effectively facilitate behavioural changes in this population [
21]. Nonetheless, they must receive practical guidance on navigating social networks [
20]. Our group of young adults may have experienced further enhancements in social skills through their spontaneous engagement with social media, aligning with insights reported in the literature.
The first group of individuals with AS is, on average, older than the second group and achieves significantly higher scores across the various Vineland subscales at both enrolment and follow-up. This suggests they may possess better adaptive skills and greater daily functioning abilities at enrolment, as supported by existing literature [
9,
22]. At the follow-up evaluation, the Vineland score for this first group continued to improve, maintaining statistical significance. This trend may indicate that older individuals exhibit ongoing progress and a greater capacity for learning than younger individuals. Accordingly, the difficulties observed in younger individuals are consistent and tend to decrease with age [
23].
The second group is generally younger and starts with lower initial scores than the first group. Their enrolment Vineland score, which is lower than the first group’s, may indicate that they have had less time to develop these skills. Moreover, they show no significant improvement in Vineland scores from enrolment to follow-up, except for the socialisation score. This could suggest that the interventions used for this group have not yet been sufficiently effective in yielding significant improvements in communication and daily living skills, apart from the socialisation score.
Research indicates that individuals with ASD often experience a slower development of daily living skills compared to those with non-spectrum diagnoses, likely due to more significant impairments in non-verbal cognition [
24]. Furthermore, authors have found correlations between age, cognitive level, and adaptive functioning in communication and daily living skills. Regression analyses suggest that the severity of ASD contributes a significant amount of unique variance in socialisation and daily living skills [
25]. Individuals with ASD display a broad range of cognitive deficits throughout childhood and into adulthood. While some symptoms of autism may decrease with age, older adults with the condition often do not reach typical levels of social functioning [
23].
In the first group, there is a slight average decline in communication scores and, conversely, an increase in daily living skills scores from enrolment to follow-up. It is important to note that while this drop in communication skills and the increase in daily living skills scores are observable, they are only marginally significant. Conversely, the second group shows that the scores for communication and daily living skills fail to improve significantly.
Both groups have demonstrated a notable enhancement in socialisation, indicating that this domain may be exceptionally responsive to therapeutic interventions. Group training could be advantageous when available, as it offers structured opportunities for social interaction. Therapists might encourage individuals with AS to utilise their unique strengths to create more opportunities for socialisation [
26]. Although the first group began with higher scores, they continued to show significant improvements, thereby maintaining an advantage over the second group. The positive correlation between enrolment and follow-up socialisation scores for both groups suggests that those who start with higher scores are likely to sustain or improve their performance over time.
This study has several limitations, particularly the sample size, which did not allow for a balanced distribution of participants across the two clusters. While this imbalance was not anticipated, it nevertheless provided valuable insights into the heterogeneity among the individuals with AS who were enrolled.
A significant strength of the study lies in the broad age range of the participants, which allowed for an evaluation of the interventions’ effectiveness irrespective of age or existing social skills at enrolment. Notably, the intervention successfully enhanced social skills in more than half of the individuals with AS, regardless of when treatment began. However, the study also revealed that some participants did not respond to the intervention or experienced a decline in their social skills.
5. Conclusions
This study has revealed distinct profiles among individuals with AS, highlighting a clear correlation between age and social skills. The results indicate that older individuals tend to achieve higher socialisation scores, likely due to the skills acquired through social experiences in developing these abilities. The analysis demonstrated that, despite initial differences, both groups experienced significant benefits from interventions focused on socialisation, autonomy, and awareness, with the first group maintaining an advantage over the second. These findings underline the significance of considering individual characteristics and life experiences when creating effective treatments to enhance social competencies in individuals with AS. Further clinical studies are warranted to extend our understanding and refine intervention strategies.
Author Contributions
Conceptualization, L.Z.; methodology, S.S., and S.M.B.; software, M.Z.; validation, L.Z., and M.Z.; formal analysis, M.Z.; investigation, C.L.; resources, S.S.; data curation, S.S., E.R., S.M.B., and C.L.; writing—original draft preparation, M.Z.; writing—review and editing, L.Z., E.R., and S.M.B.; visualization, C.L., and E.R.; supervision, L.Z. All authors have read and agreed to the published version of the manuscript.
Funding
This research received no external funding.
Institutional Review Board Statement
This study was conducted following the Declaration of Helsinki and was approved by the Institutional Review Board (or Ethics Committee) of the University Hospital of Verona (CESC 2243 (Paediatric Clinic, University Hospital of Verona) and CESC 2242 (Child and Adolescent Neuropsychiatry Outpatient Clinics, University Hospital of Verona) on 10 December 2019.
Informed Consent Statement
Informed consent was obtained from all participants and their legal guardians before the commencement of the study.
Data Availability Statement
Data are unavailable due to privacy and ethical restrictions.
Conflicts of Interest
The authors declare no conflicts of interest.
References
- Czech, H. Hans Asperger, National Socialism, and “race hygiene” in Nazi-era Vienna. Mol. Autism 2018, 9, 29. [Google Scholar] [CrossRef] [PubMed]
- Maenner, M.J.; Warren, Z.; Williams, A.R.; Amoakohene, E.; Bakian, A.V.; Bilder, D.A.; Durkin, M.S.; Fitzgerald, R.T.; Furnier, S.M.; Hughes, M.M.; et al. Prevalence and Characteristics of Autism Spectrum Disorder Among Children Aged 8 Years—Autism and Developmental Disabilities Monitoring Network, 11 Sites, United States, 2020. MMWR Surveill. Summ. 2023, 72, 1–14. [Google Scholar] [CrossRef] [PubMed]
- Zoccante, L.; Ciceri, M.L.; Gozzi, L.A.; Gennaro, G.D.; Zerman, N. The “Connectivome Theory”: A New Model to Understand Autism Spectrum Disorders. Front. Psychiatry 2021, 12, 794516. [Google Scholar] [CrossRef] [PubMed]
- Zoccante, L.; Zaffanello, M.; Di Gennaro, G. Editorial: The “Connectivome Theory”: Psyche, soma and the systemic involvement of connective tissue in neurodivergence. Front. Psychiatry 2024, 15, 1436796. [Google Scholar] [CrossRef] [PubMed]
- Cardillo, R.; Lievore, R.; Mammarella, I.C. Do children with and without autism spectrum disorder use different visuospatial processing skills to perform the Rey-Osterrieth complex figure test? Autism Res. 2022, 15, 1311–1323. [Google Scholar] [CrossRef]
- Semrud-Clikeman, M.; Glass, K. Comprehension of humor in children with nonverbal learning disabilities, reading disabilities, and without learning disabilities. Ann. Dyslexia 2008, 58, 163–180. [Google Scholar] [CrossRef]
- Soares, E.E.; Bausback, K.; Beard, C.L.; Higinbotham, M.; Bunge, E.L.; Gengoux, G.W. Social Skills Training for Autism Spectrum Disorder: A Meta-analysis of In-person and Technological Interventions. J. Technol. Behav. Sci. 2021, 6, 166–180. [Google Scholar] [CrossRef]
- de Bildt, A.; Kraijer, D.; Sytema, S.; Minderaa, R. The psychometric properties of the Vineland Adaptive Behavior Scales in children and adolescents with mental retardation. J. Autism Dev. Disord. 2005, 35, 53–62. [Google Scholar] [CrossRef]
- Farmer, C.; Adedipe, D.; Bal, V.H.; Chlebowski, C.; Thurm, A. Concordance of the Vineland Adaptive Behavior Scales, second and third editions. J. Intellect. Disabil. Res. 2020, 64, 18–26. [Google Scholar] [CrossRef]
- Dang Do, A.N.; Thurm, A.E.; Farmer, C.A.; Soldatos, A.G.; Chlebowski, C.E.; O’Reilly, J.K.; Porter, F.D. Use of the Vineland-3, a measure of adaptive functioning, in CLN3. Am. J. Med. Genet. A 2022, 188, 1056–1064. [Google Scholar] [CrossRef]
- Mason, R.A.; Rispoli, M.; Ganz, J.B.; Boles, M.B.; Orr, K. Effects of video modeling on communicative social skills of college students with Asperger syndrome. Dev. Neurorehabil 2012, 15, 425–434. [Google Scholar] [CrossRef] [PubMed]
- Beaumont, R.; Sofronoff, K. A multi-component social skills intervention for children with Asperger syndrome: The Junior Detective Training Program. J. Child. Psychol. Psychiatry 2008, 49, 743–753. [Google Scholar] [CrossRef] [PubMed]
- Hotton, M.; Coles, S. The Effectiveness of Social Skills Training Groups for Individuals with Autism Spectrum Disorder. Rev. J. Autism Dev. Disord. 2016, 3, 68–81. [Google Scholar] [CrossRef]
- Thiese, M.S.; Ronna, B.; Ott, U. P value interpretations and considerations. J. Thorac. Dis. 2016, 8, E928–e931. [Google Scholar] [CrossRef]
- Cappadocia, M.C.; Weiss, J.A. Review of social skills training groups for youth with Asperger Syndrome and High Functioning Autism. Res. Autism Spectr. Disord. 2011, 5, 70–78. [Google Scholar] [CrossRef]
- Rao, P.A.; Beidel, D.C.; Murray, M.J. Social skills interventions for children with Asperger’s syndrome or high-functioning autism: A review and recommendations. J. Autism Dev. Disord. 2008, 38, 353–361. [Google Scholar] [CrossRef]
- Andanson, J.; Pourre, F.; Maffre, T.; Raynaud, J.P. [Social skills training groups for children and adolescents with Asperger syndrome: A review]. Arch. Pediatr. 2011, 18, 589–596. [Google Scholar] [CrossRef]
- Motlani, V.; Motlani, G.; Thool, A. Asperger Syndrome (AS): A Review Article. Cureus 2022, 14, e31395. [Google Scholar] [CrossRef]
- Yizengaw, S.S. Effect of social skills training on interpersonal interactions of children with autism: An interventional research. Int. J. Dev. Disabil. 2022, 68, 858–866. [Google Scholar] [CrossRef]
- Alon-Tirosh, M.; Meir, N. Use of social network sites among adolescents with autism spectrum disorder: A qualitative study. Front. Psychol. 2023, 14, 1192475. [Google Scholar] [CrossRef]
- Gabarron, E.; Skafle, I.; Nordahl-Hansen, A.; Wynn, R. Social media interventions for autistic individuals: Systematic review. Front. Psychiatry 2023, 14, 1089452. [Google Scholar] [CrossRef] [PubMed]
- Scattone, D.; Raggio, D.J.; May, W. Comparison of the Vineland Adaptive Behavior Scales, Second Edition, and the Bayley Scales of Infant and Toddler Development, Third Edition. Psychol. Rep. 2011, 109, 626–634. [Google Scholar] [CrossRef] [PubMed]
- Geurts, H.M.; Vissers, M.E. Elderly with autism: Executive functions and memory. J. Autism Dev. Disord. 2012, 42, 665–675. [Google Scholar] [CrossRef] [PubMed]
- Bal, V.H.; Kim, S.H.; Cheong, D.; Lord, C. Daily living skills in individuals with autism spectrum disorder from 2 to 21 years of age. Autism 2015, 19, 774–784. [Google Scholar] [CrossRef] [PubMed]
- Perry, A.; Flanagan, H.E.; Dunn Geier, J.; Freeman, N.L. Brief report: The Vineland Adaptive Behavior Scales in young children with autism spectrum disorders at different cognitive levels. J. Autism Dev. Disord. 2009, 39, 1066–1078. [Google Scholar] [CrossRef]
- Woods, A.G.; Mahdavi, E.; Ryan, J.P. Treating clients with Asperger’s syndrome and autism. Child. Adolesc. Psychiatry Ment. Health 2013, 7, 32. [Google Scholar] [CrossRef]
|
Disclaimer/Publisher’s Note: The statements, opinions and data contained in all publications are solely those of the individual author(s) and contributor(s) and not of MDPI and/or the editor(s). MDPI and/or the editor(s) disclaim responsibility for any injury to people or property resulting from any ideas, methods, instructions or products referred to in the content. |
© 2024 by the authors. Licensee MDPI, Basel, Switzerland. This article is an open access article distributed under the terms and conditions of the Creative Commons Attribution (CC BY) license (https://creativecommons.org/licenses/by/4.0/).
