
Submitted:
01 November 2024
Posted:
01 November 2024
You are already at the latest version
Abstract
Amyloid PET imaging plays a crucial role in the diagnosis and research of Alzheimer's disease (AD), allowing non-invasive detection of amyloid-β plaques in the brain. However, the low spatial resolution of PET scans limits accurate quantification of amyloid deposition due to partial volume effects (PVE). In this study, we propose a novel approach to addressing PVE using a latent diffusion model for resolution recovery (LDM-RR) of PET imaging. We leverage a synthetic data generation pipeline to create high-resolution PET digital phantoms for model training. The proposed LDM-RR model incorporates a weighted combination of L1, L2, and MS-SSIM losses at both noise and image scales to enhance MRI-guided reconstruction. We evaluated the model's performance in improving statistical power for detecting longitudinal changes and enhancing agreement between amyloid PET measurements from different tracers. Results demonstrate that the LDM-RR approach significantly improves PET quantification accuracy, reduces inter-tracer variability, and enhances the detection of subtle changes in amyloid deposition over time. We show that deep learning has the potential to improve PET quantification in AD, effectively contributing to early detection and monitoring of disease progression.
Keywords:
partial volume correction (PVC)
; positron emission tomography
; amyloid
; deep learning
; diffusion models
; medical image super-resolution
1. Introduction
Amyloid imaging is a crucial tool in the diagnosis and research of Alzheimer's disease (AD). It allows for the non-invasive detection of amyloid-β (Aβ) plaques in the brain, which is a core neuropathological feature of AD [1]. Detecting Aβ pathology at the earliest stages of AD, before the onset of clinical symptoms, is critical for understanding disease progression, developing intervention techniques, and potentially improving patient outcomes. However, accurate quantification of amyloid using positron emission tomography (PET) imaging is limited due to the low spatial resolution of PET scans [2], which is typically around 5 mm and varies across scanner models and reconstruction algorithms. This causes the partial volume effect (PVE) [3], resulting in a spill-out of signal from target gray matter regions and spill-in from surrounding areas. The magnitude of the PVE depends on the size of the target region relative to the spatial resolution of the scans. In the context of amyloid PET imaging, the size of the target regions varies across subjects and often decreases as the subject ages or with disease progression. Therefore, PVE reduces the accuracy, precision, and statistical power of quantitative amyloid PET measurements. Another well-recognized issue of amyloid PET imaging is harmonizing data acquired using different scanners, tracers, and analytical pipelines. To minimize the inter-scanner variabilities, a scanner-specific harmonization filter is often applied at the cost of further reduced spatial resolution [4]. To minimize the variability of amyloid PET measurements from different analytical pipelines, acquisition protocols, and tracers, a Centiloid scale was defined to linearly transform a particular measurement to this scale [5]. However, this Centiloid approach is designed for standardizing global measures and does not improve the between-measure agreements in terms of their shared variance [6,7,8]. We hypothesize that effective methods for spatial resolution recovery will improve PET quantification and reduce inter-tracer variabilities in amyloid PET measurements, and in this research, we propose a deep learning approach to achieve the goal.
Several partial volume correction (PVC) methods have been proposed in the literature to mitigate PVE issue using anatomical information from MRI and CT [2,9,10,11,12,13,14,15]. Different from that, Tohka and Reilhac [16] showed that Richardson–Lucy, an iterative deconvolution-based method to recover spatial resolution in PET imaging and an alternative to MR-based approaches, offered comparable accuracy with reduced sensitivity to registration and segmentation errors. However, deconvolution-based correction methods are shown to amplify the image noise [17]. Different correction methods can also produce varying results, making standardization and comparison across studies challenging. Deep learning-based techniques [18,19] have recently been explored to tackle some of these challenges. Deep models can better learn complex patterns of tissue heterogeneity and can perform image denoising, potentially addressing noise amplification issues [19]. Deep models trained on diverse datasets may generalize better to different scanners and acquisition protocols [18], potentially improving the standardization and consensus among multi-center studies.
Instead of focusing on partial volume correction directly, as the PVC methods reviewed above do, an alternative is image super-resolution (SR), which refers to the task of rendering a high-resolution image from its low-resolution counterpart. We contend that during the process of rendering high resolution PET from low resolution PET, PVE may be tackled. SR is a well-studied research problem in computer vision and image processing [20,21]. Use cases of SR span a broad spectrum, improving existing computer vision tasks [22,23,24] by improving image spatial resolution and perceptual quality, improving surveillance [25] and enhancing diagnostic accuracy in medical research using different imaging modalities [26,27,28]. Traditional methods for image SR heavily rely on image statistics [29,30,31] , which has been shown to generate blurry and noisy artifacts in their high-resolution outputs [20]. With the advent of deep learning algorithms, several end-to-end architectures have been proposed where the models learn the mapping of low-resolution to high-resolution images through regression-based learning [32]. However, these methods fail to recover high-frequency details mainly because they learn an average mapping from the training dataset (due to L1/L2 loss functions), resulting in overly smooth model outputs and lacking spatial details [21].
To address these limitations, generative models have been explored for SR in recent years. Generative models learn to transform a latent variable z with a tractable prior distribution to a learned data space. Generative adversarial networks (GANs), flow-based methods, and diffusion models are three common generative models used to generate synthetic data. They differ in their core approach: GANs [33] are trained in an adversarial setting with generator and discriminator networks, flow-based methods [34] rely on invertible transformations to manipulate data distributions, while diffusion models [35] iteratively add and then learn to remove noise to generate data. GANs are known to suffer from mode collapse [36] , resulting in unstable training and limiting the diversity of generated samples. Flow-based methods can impose topological constraints on the mapping between latent and data spaces, limiting their flexibility in modeling complex data distributions [37]. Except for longer sampling times, diffusion models have shown superior performance in generating high-fidelity medical imaging datasets [38,39,40]. Unlike GAN priors, diffusion model priors can preserve more information to generate realistic data. Motivated by this, we propose an SR solution based on the diffusion model to improve PET quantification.
The success of any SR methods (e.g., GAN, diffusion) heavily relies on the quantity and quality of the training data. Synthetic data has been substantially useful in medical AI research to alleviate issues such as a lack of datasets, annotations, privacy concerns, and high acquisition costs [41,42,43]. Data samples are typically artificially generated using domain knowledge or modeling techniques to mimic the characteristics and structure of real data without being directly derived from actual observations. It can be used to train AI models where target data is unavailable or scarce and provides a promising alternative to making AI models generalized to real-world datasets [44,45,46]. These studies mainly focus on improving detection and segmentation from high-resolution imaging. However, its applicability enhancing PET quantification remains unexplored.
In this study, 1) we develop a new latent diffusion model for resolution recovery (LDM-RR) in PET imaging. Instead of training the diffusion model to minimize loss on the noise scale, we introduce a composite loss function with three terms: L1, L2, and MS-SSIM at the noise and image scale to improve MRI-guided reconstruction. 2) We developed a synthetic data generation pipeline to generate PET digital phantoms mimicking high-resolution PET scans for model training. 3) We evaluate the performance of our LDM-RR model in improving the statistical power of detecting longitudinal changes. 4) We evaluate the ability of the LDM-RR model in improving the agreement of amyloid PET measurements acquired using different tracers.
2. Materials and Methods
2.1. Datasets and Simulation Procedure
Imaging data from three different cohorts were used in this study to enable our experiments: 1) the Alzheimer's Disease Neuroimaging Initiative (ADNI) cohort (adni.loni.usc.edu) [47], 2) the Open Access Series of Imaging Studies-3 (OASIS-3) [48], and 3) the Centiloid Project florbetapir calibration dataset [49] (http://www.gaain.org/centiloid-project). The ADNI was launched in 2003 as a public-private partnership, led by Principal Investigator Michael W. Weiner, MD. The original goal of ADNI was to test whether serial magnetic resonance imaging (MRI), positron emission tomography (PET), other biological markers, and clinical and neuropsychological assessment can be combined to measure the progression of mild cognitive impairment (MCI) and early Alzheimer's disease (AD). The current goals include validating biomarkers for clinical trials, improving the generalizability of ADNI data by increasing diversity in the participant cohort, and to provide data concerning the diagnosis and progression of Alzheimer’s disease to the scientific community.
2.1.1. Data to Train the Diffusion Model
We utilized 3,376 MRI scans from the ADNI database to generate simulated high-resolution digital phantoms (simDP) and simulated florbetapir (simFBP) using an MR-based procedure as previously described [50] that mimics the distribution of florbetapir (FBP) uptake in participants across a wide range of amyloid burden and clinical status and the noise and spatial resolution characteristics of typical PET images. From this simulated dataset, 3,038 samples were used to train, and 338 samples were used to validate our LDM-RR model’s performance.
2.1.2. Data for Evaluating Longitudinal Power
To evaluate LDM-RR’s ability to improve statistical power to detect longitudinal changes in amyloid, we selected 167 ADNI participants with a mean age of 74.1 years (SD=6.8), who are amyloid positive at baseline using a Centiloid cutoff of 20 for positivity and have two-year follow-up (2.0 ±0.06 years interval) FBP scans. The choice of these participants is to ensure they are on a trajectory to accumulate amyloid during the study period, i.e. having a positive expected rate of amyloid accumulation. Additional demographic information of this cohort is summarized in Table 1.
2.1.3. Data to Evaluating Harmonization Performance
From the OASIS-3 database [48], we identified 113 pairs of FBP-PiB scans with a mean age of 68.1 years (SD=8.7), and similarly, 46 pairs from the Centiloid project (http://www.gaain.org/centiloid-project) with a mean age of 58.4 years (SD=21.0). Refer to Table 1 for demographic information of these two cohorts. Studies for the cohorts included here were approved by their corresponding institutional review boards and written informed consent was obtained for each participant.
2.2. Image Analysis and Simulation
FreeSurfer v7.3 [51] (Martinos Center for Biomedical Imaging, Charlestown, Massachusetts, USA) (https://surfer.nmr.mgh.harvard.edu/ fswiki) was used to automatically segment T1-weighted MRIs to define the anatomical regions of interests (as defined in the wmparc.mgz file). PET images were processed using a FreeSurfer dependent pipeline that included resolution harmonization filtering, inter-frame motion correction, target frame summation, PET-to-MR registration, and regional and voxel-wise SUVR calculation [50,52]. A mean cortical SUVR (MCSUVR) was calculated as the summary measure of amyloid burden and used to evaluate longitudinal and harmonization performance [52]. For comparison purposes, a Richardson-Lucy algorithm was adopted for resolution recovery (RL-RR) through iterative deconvolution [53,54]. In our experiment, the MATLAB (The Mathworks, Inc., v2021a) function: deconvlucy was called with 20 iterations and an 8mm full-width-half-max (FWHM) Gaussian kernel to generate the deconvolved high-resolution PET images and the corresponding MCSUVR estimation.
As described in [50], the simulation of high-resolution digital phantom (DP) and PET images (simFBP) was performed using segmented MRI as the input. For DP generation, each voxel was assigned a specific intensity value according to tissue type-specific distributions observed from actual FBP SUVR images across the aging and AD spectrum. For non-brain voxels, i.e., those not defined in the wmparc.mgz file, the voxel intensity was assigned by randomly scaling the normalized T1-MRI images to simulate moderate non-brain uptake. To generate simFBP images, the DP was smoothed and projected to the sinogram space, adding Poisson noise, and reconstructed back to the image space. The target resolution of the simFBP data is 8 mm in FWHM, approximating the resolution of standardized PET data from ADNI [4]. Figure 1 shows a visual example of a simulated digital phantom (B) and PET image (C) matching a T1-MRI image (A).
2.3. LDM-RR: PET Resolution Recovery Framework
We use a latent diffusion model to generate synthetic high-resolution FBP scans given standard low-resolution FBP and matching MRI scans. Figure 2 and Figure 3 give an overview of the training process. Diffusion models have shown impressive results in generating 2D images [55]. However, they are computationally demanding at the training and inference stages. Medical imaging modalities, such as MRI and PET, are more complex as they capture spatial information in 3D. Latent diffusion models operate at a lower-dimensional latent space by compressing useful information from these high-dimensional imaging data.
Our proposed LDM-RR is built upon a state-of-the-art LDM originally proposed to generate 3D brain MRIs [40]. Specifically, it has a 2-stage training process and three different components: an encoder, a diffusion U-Net [56] , and a decoder model. The encoder compresses high-dimensional data into a low-dimensional latent representation, diffusion U-Net converts simFBP to simDP in the latent space through a denoising process, and the decoder upsamples the low-dimensional simDP to its original image space. Trained models and implementation code will be made available for reproducibility and further research.1
2.3.1. Compression Models
In the first stage, we train three modality-specific 3D autoencoder models separately for simSP, simDP, and MRI (see Figure 2), each with a combination of L1 loss, perceptual loss, a patch-based adversarial objective, and a KL regularization of the latent space [40]. The input to the encoder is a 3D image with dimensions 256x256x256, and we extract smaller sub-volumes of size 64x64x64 to fit in GPU memory. The encoder maps these sub-volumes to a latent representation of size 16x16x16. Once trained, latent representations from these encoders are used as inputs to the diffusion U-Net.
2.3.2. Diffusion Model
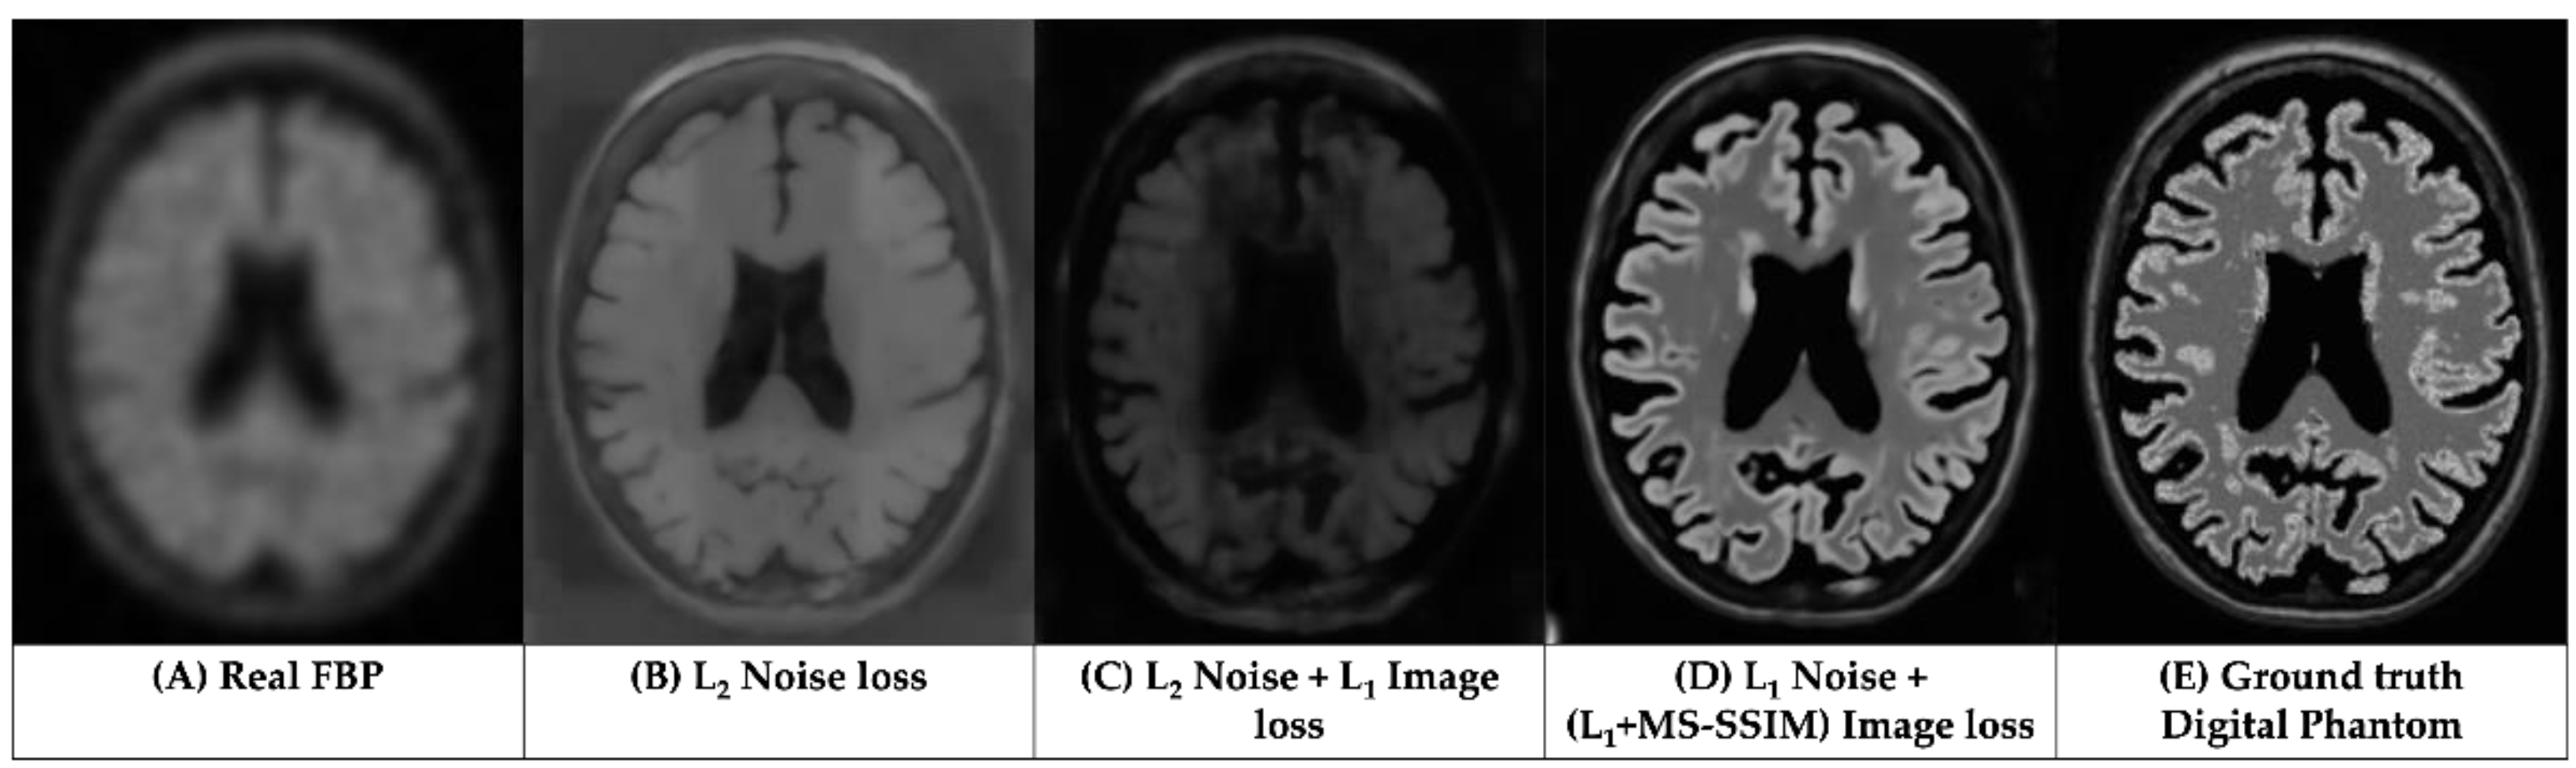
Diffusion U-Net in LDMs perform denoising by iteratively predicting and removing noise in latent space. Typically, they are trained to minimize the L2 loss between predicted and actual noise [40,56]. However, for super-resolution, we found that minimizing L2 loss does not consistently guarantee recovery of brain structure information in generated outputs (refer to Figure 6B). Prior studies have shown that using a mix of image restoration loss can produce high-fidelity images compared to single loss functions [57]. L2 regularization is sensitive to outliers and can introduce visual artifacts since it penalizes high errors. L1, on the other hand, is robust to outliers but suffers from non-differentiability at zero and slow training [58]. Moreover, Zhao et al. [57] showed for image restoration and SR, L1 and L2 penalties fail to capture structure information, and proposed multi-scale structural similarity index (MS-SSIM) metric. Voxel-level intensity has a high impact on PET quantification [59]. Here, we hypothesize and show through results that existing L2 loss-based diffusion models do not provide a clinically accurate reconstruction of PET scans. A weighted combination of L1, L2, and MS-SSIM losses, on the image and noise scales can accurately generate a high-resolution using MRI and simFBP.
To train diffusion models, a small amount of Gaussian noise is progressively added to the data in T steps through a forward noise addition process, forming a Markov Chain [35]:
Here, is the fixed variance schedule and follows a pure Gaussian noise distribution after many forward diffusion steps T (T=1000 in our experiments). The diffusion U-Net learns the reverse diffusion process, i.e., denoising to which can be formulated as [35]:
where represents the denoising neural network (diffusion Unet) and . Traditionally, the diffusion models are trained to predict the added noise in forward diffusion process by minimizing L2 loss between predicted () and added noise () formulated as [56]:
Further, we can estimate the noise-free latent vector using the predicted noise () from the diffusion model using equation 1 from Ho et al. [35] as:
Zhao et al. [57] observed that image reconstruction performance can be improved by adding perceptual image metrics such as MS-SSIM in a network’s loss function. It allows capturing structural details at multiple scales while maintaining voxel-level accuracy. While this holds true for current encoder-decoder architectures, to the best of our knowledge, it has not yet been investigated for denoising diffusion networks in latent space. Since our goal is to fuse structure information from T1-MRI to guide the reconstruction, we modify LDM’s vanilla loss function () on noise scale to a weighted combination of L2 and MS-SSIM loss on image scale as:
Here [57] is an empirically set hyper-parameter. While L2 allows easier optimization in diffusion training due to its convergence properties, it is known to produce an averaging effect, which forces the model to predict values closer to mean of training data [57]. We argue that using only L2 loss can help preserve whole image-level properties but may also produce inaccurate estimates at voxel-level. To this end, we propose L1 loss at the noise scale to ensure voxel-level details are preserved in the denoising process.
A combined loss function using these two loss terms,
was used to train the LDM-RR model. The combined loss is indeed equivalent to (see Appendix A):
By minimizing loss on image () and noise () scales, LDM-RR model learns to reduce the disparity between the reconstructed high-resolution PET image and the target digital phantom, while preserving image-level and voxel-level structure details, and later (voxel-level details) may play an important role for correcting the partial volume effects.
Figure 3 illustrates the second stage of training where only the diffusion U-Net is trained whereas encoder and decoder model parameters are kept frozen. Input to the U-Net is a concatenation of noisy latent representation of simDP and conditioning of matching MRI and simFBP latent representations. The model’s predicted noise () can be used to estimate and calculate the combined-loss (Equation 3), which is used to update diffusion U-Net parameters in each training epoch. See Appendix B for more details on model architectures, training and computational resources.
2.4. Statistical Analysis
2.4.1. Simulated Data Analysis
To evaluate our LDM-RR’s actual performance at generating a high-resolution FBP scan, we compare the mean recovery co-efficient (RC) - measured as ratio of synthetic high-resolution PET MCSUVR to that of ground-truth from simulated DP, and variance measured by standard error (SE). A value closer to 1 indicates higher reconstruction performance. We compare our method to Richardson Lucy-based resolution recovery (RL-RR), traditional LDM with L2 noise loss, LDM with L2 noise and L1 image loss and to simulated FBP scans without any correction.
2.4.2. Longitudinal Analysis
To evaluate the longitudinal performance of the LDM-RR, for each of the 167 participants, the annualized rate of amyloid accumulation was calculated by dividing the MCSUVR change from baseline to the follow-up visit by the follow-up interval. A higher rate of change indicates higher statistical power to detect longitudinal changes in amyloid accumulation. The mean and standard deviation of the annualized rate of change were evaluated for each analysis method, i.e. raw measurement, with RL-RR, and with the LDM-RR. One sample t-test (one tail) was used to determine whether the annualized rate was significantly greater than zero. A smaller p-value is interpreted as having greater power to detect the longitudinal accumulation of amyloid burden. To further compare the statistical power of different techniques in a longitudinal setting, we estimated the number of participants per arm needed to detect a 25% reduction in amyloid accumulation rate due to treatment with 80% power and a two-tailed type-I error of p=0.05 in hypothetical anti-amyloid treatment trials. A smaller estimated sample size (SS) indicates greater statistical power.
2.4.3. Cross-Tracer Analysis
In the cross-tracer analysis, we evaluated the impact of RL-RR vs. LDM-RR on the agreement of PET-derived global amyloid burden, i.e. MCSUVR, using paired FBP-PIB data from OASIS-3 and the Centiloid project. In our experiment, the raw PIB MCSUVR was used as the reference amyloid burden measurement, and we evaluated whether the corrected FBP MCSUVR is more strongly correlated with PIB MCSUVR using Steiger’s test. We also test whether the LDM-RR corrected FBP MCSUVR is more strongly associated with PIB MCSUVR than the RL method.
3. Results
3.1. Qualitative Assessments
Figure 4 showcases corrected FBP scans using RL (Figure 4C) and LDM-RR (Figure 4D) methods. The proposed LDM-RR model-generated synthetic FBP image has an improved spatial resolution, with a similar level of anatomical details matching T1-MRI (Figure 4B). A similar example of LDM-RR applied to simulated data was shown in Figure 1D. Although RL-RR does not require an MRI, it generated noisier images and was not able to fully recover the high-resolution details (Figure 4C).
3.2. Evaluation on Simulated Data
A visual example of model generated synthetic FBP from test set of simulated data is shown in Figure 1D. The mean RC from different diffusion models compared to RL-RR method and without any correction is shown in Figure 5. Our proposed LDM-RR model was able to better reconstruct target simDP (0.96, SE=0.004) compared to RL-based correction (0.82, SE=0.005) and without any corrections (0.76, SE=0.008). It also performs significantly better compared to a typical LDM architecture [40] for super-resolution (1.32, SE=0.08) and other combinations of noise and image scale loss (1.58, SE=0.09).
3.2. Evaluation on Real Longitudial Amyloid PET Data
Table 2 shows a comparison of statistical power to detect amyloid accumulation in longitudinal studies using the LDM and RL methods for resolution recovery in comparison to measurememts from raw FBPs without any correction. The annualized rate of amyloid accumulation were significantly greater than zero for all three methods (p<0.0001). Numerically the p-value was smallest using the LDM-RR and largest without any correction, suggesting it improved the statistical power in detecting longitudinal changes. Additionally the LDM-RR required a much smaller sample size estimate to detecting 25% reduction in the amyloid accumulation rate due to treatment.
3.3. Evaluation on Real Cross-Tracer Amyloid PET Data
The performance of LDM-RR and RL-RR methods at harmonizing cross-tracer global amyloid burden measurements is shown in Table 3. Agreement of MCSUVR measurements between tracers significantly improved (p<0.001), as shown by a higher correlation for both LDM and RL based corrections. The improvements in LDM-RR based partial volume corrections compared to RL were also statistically significant (p=0.042).
4. Discussion
PET imaging has inherently low spatial resolution which leads to PVE, resulting in loss of sensitivity to focal changes and compromised accuracy due to signal contamination. Many different techniques have been developed to account for PVE and improve quantitative accuracy. In the context of PET neuroimaging, commonly adopted techniques are often region based and do not provide high-resolution images. Voxel-wise approaches do exist; however, they are known to amplify noise while having limited ability to recover the full spatial resolution or have gone through limited evaluation for targeted applications. This study presents a new approach to improving PET quantification leveraging latent diffusion models trained using controlled simulated data. We show that diffusion models have a strong potential to enhance PET quantification through super-resolution. Our LDM-RR model’s performance on longitudinal amyloid and cross-tracer PET data demonstrates that diffusion-based super resolution (SR) approaches can outperform traditional approaches in tackling the issue of PVE in PET imaging.
We propose an alternative to L2 loss, which has been a de facto standard in training diffusion models. L2 penalty pushes the model to reduce large errors potentially sacrificing high-frequency details (Figure 6B). Moreover, L2 loss is sensitive to the scale of voxel intensities. In super-resolution tasks, where the goal is to reconstruct fine details (voxel-level), L2 loss may not be ideal for capturing subtle differences in high-frequency information. A L1 may help capture the voxel-level details which are considered to be crucial to address PVE. In additional, it is interesting to observe the added contribution from multi-scale structural similarity index (MS-SSIM) metric which confirmed the research findings in Zhao et al. [57]. Visual comparison in Figure 6 shows that using a combined loss at image and noise scales (Figure 6D), the generated high-resolution FBP images have a more accurate representation of brain structure from MRI and voxel-level uptake measurements.
Figure 6.
Comparisons of the results from LDM trained using different loss functions.
Simulation data was generated to approximate the PET imaging formation process and the distribution of tracer uptake as observed in real amyloid PET images. The simulated data were used to training the LDM-RR model and evaluate its performance against the ground truth which is otherwise not possible. It should be recognized that simulated data cannot fully replicate the overall distribution and characteristics of real amyloid PET data which may introduce bias to the trained model. More sophisticated simulations can potentially be adopted to minimize this potential bias and improve model performance. Nevertheless, evaluation of model performance in real-world setting is important which we discuss further below.
We selected two commonly encountered scenarios in the investigation of Alzheimer’s disease to evaluate the real-world utility and benefits of diffusion-based SR techniques for PET. In the longitudinal analysis, we leveraged data from the ADNI cohort in participants with a baseline visit and a 2-year follow up to examine the sensitivity and statistical power of different correction methods. The participants were intentionally selected to have moderate to medium high level of pathological amyloid burden at baseline to maximize the probability of these participants to accumulate amyloid plaques during the follow up period, and therefore we expect a positive increase in the MCSUVR measure and deviation from that reflects measurement noise. It is worth noting that both resolution recovery methods (RL-RR and LDM-RR) led to increased numerical value of the rate of amyloid accumulation which reflects the improved recovery coefficient as expected. In the meantime, the standard deviation of the estimated rate also increased numerically which can be a combined effect of the improved recovery coefficient and possible amplification of noise. The net effect of the correction methods is reflected by the p-values of the one-sample t-test applied to the rate data where a smaller p-value indicated a greater statistical power demonstrating a beneficial effect of correcting for PVE. The sample size estimation in hypothetical anti-amyloid treatment trials further confirmed the notion that correcting for PVE improves the longitudinal power. This improvement can lead to reduced experimental costs in longitudinal observational studies and clinical trials which will facilitate treatment development. In a clinical setting this improved power can lead to better patient management by providing more sensitive and accurate monitoring of disease progression once treatment becomes routinely available to patients.
The second real-world application we tested in this study is the ability of PVE correction to improve agreement between PET derived measurements from different tracers. Using amyloid PET imaging as an example, currently there are at least five different PET tracers that are widely used in research studies, clinical trials, and in patient management to measure amyloid burden. It is well recognized that the different tracers behave differently and leads to discrepancies in PET derived amyloid burden measurements. At least part of this discrepancy is related to the contamination of the target measurement from nuance signals spill-in to our measurements. We demonstrated that both correction method improved the agreement, and the LDM-RR outperformed the RL method statistically. In the meantime, we recognize the improvement has not reached the level where two tracers can be used interchangeably and may not outperform some of the other techniques we have developed [6,7]. On the other hand, this experiment demonstrated at least, PVE correction can be one of the strategies we can employ to improve harmonization, and a combination of multiple techniques may be the ultimate solution to fully solve the harmonization problem.
One potential limitation of our diffusion model-based framework is the computational complexity to train and validate model on 3D imaging data. Even with a faster sampling method [60], the inference time is considerably high compared to other generative models (see Appendix B). Due to the sequential nature of the denoising process, this is a known limitation of diffusion models and remains an active area of research.
5. Conclusions
We introduced a latent diffusion model-based resolution recovery (LDM-RR) method to enhance PET image resolution and mitigate the impact of PVE. Results demonstrate that the LDM-RR method improves spatial resolution while preserving critical amyloid and anatomical information, outperforming traditional methods like Richardson–Lucy (RL) correction. LDM-RR model showed superior performance at reconstructing high-resolution PET images, an improved statistical power for detecting longitudinal amyloid accumulation and a strong potential to improve the agreement between measurements obtained from different PET tracers, contributing to better data harmonization across multi-center studies. These findings suggest that diffusion-based super-resolution (SR) techniques offer a promising alternative to conventional PVC methods by overcoming noise amplification issues and achieving better image fidelity.
Author Contributions
Conceptualization, J.S. (Jay Shah), T.W. and Y.S.; methodology, J.S. (Jay Shah), T.W. and Y.S.; software, J.S. (Jay Shah); validation, J.S. (Jay Shah) and Y.S.; formal analysis, J.S. (Jay Shah) and Y.S.; investigation, J.S. (Jay Shah) and Y.S.; data curation, J.S. (Javad Sohankar), J.L. and Y.S.; writing—original draft preparation, J.S. (Jay Shah), T.W. and Y.S.; writing—review and editing, J.S. (Jay Shah), Y.C., T.W. and Y.S.; visualization, J.S. (Jay Shah); supervision, T.W., B.L. and Y.S.; project administration, Y.S.; funding acquisition, Y.S. All authors have read and agreed to the published version of the manuscript.
Funding
This work is supported by National Institute on Aging (NIA) grant RF1AG073424, P30AG072980, the Arizona Department of Health Services (ADHS) and the state of Arizona (ADHS Grant No. CTR057001).
Acknowledgments
Data used in preparation of this article were obtained from the Alzheimer's Disease Neuroimaging Initiative (ADNI) database (adni.loni.usc.edu). As such, the investigators within the ADNI contributed to the design and implementation of ADNI and/or provided data but did not participate in the analysis or writing of this report. A complete listing of ADNI investigators can be found at: http://adni.loni.usc.edu/wp-content/uploads/how_to_apply/ADNI_Acknowledgement_List.pdf. Data collection and sharing for the ADNI is funded by the National Institute on Aging (National Institutes of Health Grant U19AG024904). The grantee organization is the Northern California Institute for Research and Education. In the past, ADNI has also received funding from the National Institute of Biomedical Imaging and Bioengineering, the Canadian Institutes of Health Research, and private sector contributions through the Foundation for the National Institutes of Health (FNIH) including generous contributions from the following: AbbVie, Alzheimer’s Association; Alzheimer’s Drug Discovery Foundation; Araclon Biotech; BioClinica, Inc.; Biogen; BristolMyers Squibb Company; CereSpir, Inc.; Cogstate; Eisai Inc.; Elan Pharmaceuticals, Inc.; Eli Lilly and Company; EuroImmun; F. Hoffmann-La Roche Ltd and its affiliated company Genentech, Inc.; Fujirebio; GE Healthcare; IXICO Ltd.; Janssen Alzheimer Immunotherapy Research & Development, LLC.; Johnson & Johnson Pharmaceutical Research & Development LLC.; Lumosity; Lundbeck; Merck & Co., Inc.; Meso Scale Diagnostics, LLC.; NeuroRx Research; Neurotrack Technologies; Novartis Pharmaceuticals Corporation; Pfizer Inc.; Piramal Imaging; Servier; Takeda Pharmaceutical Company; and Transition Therapeutics. Data were provided in part by OASIS-3: Longitudinal Multimodal Neuroimaging: Principal Investigators: T. Benzinger, D. Marcus, J. Morris; NIH P30 AG066444, P50 AG00561, P30 NS09857781, P01 AG026276, P01 AG003991, R01 AG043434, UL1 TR000448, R01 EB009352. AV-45 doses were provided by Avid Radiopharmaceuticals, a wholly owned subsidiary of Eli Lilly. We would like to thank the study participants for their time and effort in participating in the OASIS and Centiloid projects. We also thank Arizona State University Research Computing [61] for hosting and maintaining our computing resources.
Appendix A
Substituting and from equation (1) and (2), can be simplified as:
And substituting , where in the combined loss equation we get:
Appendix B
Compression Models: Our compression models had a 3-layer 3D AutoencoderKL architecture inspired from Pinaya et al. [40]. We removed all attention layers except at model’s last level. The models had 32 base channels, with a channel multiplier of [1,2,2] and only one residual block per level. Our latent space had a dimensionality of 16 × 16 × 16 with 3 latent channels. We trained our model over 80 epochs with minibatch of 60, with an Adam optimizer and a base learning rate of 0.0001. We used a patch-based discriminator in our adversarial loss with 32 base channels and a learning rate of 0.0001.
Diffusion Model: Our diffusion model uses the U-net architecture from [1], with 32 base channels, a channel multiplier of [1,2,2] and 1 residual block per level. The input channels are 9 (3 channels each for simFBP, simDP and MRI latents). We used Adam optimizer with a base learning rate of 0.0001. In training, we used a DDPM scheduler with 1000 timesteps, with a linear variance schedule, from 0.0015 to 0.0195. At inference, we use a DDIM scheduler [60] with 250 timesteps, which is faster sampling method compared to DDPM while maintaining output quality.
Computational resources: All models were trained on a single NVIDIA A100 80 GB GPU. The inference time to generate a synthetic SR FBP was ~10 minutes on GPU.
| 1 |
References
- Chapleau, M.; Iaccarino, L.; Soleimani-Meigooni, D.; Rabinovici, G.D. The Role of Amyloid PET in Imaging Neurodegenerative Disorders: A Review. J Nucl Med 2022, 63, 13S–19S. [Google Scholar] [CrossRef] [PubMed]
- Thomas, B.A.; Erlandsson, K.; Modat, M.; Thurfjell, L.; Vandenberghe, R.; Ourselin, S.; Hutton, B.F. The Importance of Appropriate Partial Volume Correction for PET Quantification in Alzheimer’s Disease. Eur J Nucl Med Mol Imaging 2011, 38, 1104–1119. [Google Scholar] [CrossRef] [PubMed]
- Hoffman, E.J.; Huang, S.-C.; Phelps, M.E. Quantitation in Positron Emission Computed Tomography: 1. Effect of Object Size. Journal of Computer Assisted Tomography 1979, 3, 299. [Google Scholar] [CrossRef]
- Joshi, A.; Koeppe, R.A.; Fessler, J.A. Reducing between Scanner Differences in Multi-Center PET Studies. Neuroimage 2009, 46, 154–159. [Google Scholar] [CrossRef]
- Klunk, W.E.; Koeppe, R.A.; Price, J.C.; Benzinger, T.; Devous, M.D.; Jagust, W.; Johnson, K.; Mathis, C.A.; Minhas, D.; Pontecorvo, M.J.; et al. The Centiloid Project: Standardizing Quantitative Amyloid Plaque Estimation by PET. Alzheimers Dement 2015, 11, 1–15. [Google Scholar] [CrossRef]
- Chen, K.; Ghisays, V.; Luo, J.; Chen, Y.; Lee, W.; Wu, T.; Reiman, E.M.; Su, Y. Harmonizing Florbetapir and PiB PET Measurements of Cortical Aβ Plaque Burden Using Multiple Regions-of-Interest and Machine Learning Techniques: An Alternative to the Centiloid Approach. Alzheimer’s & Dementia 2024, 20, 2165–2172. [Google Scholar] [CrossRef]
- Shah, J.; Gao, F.; Li, B.; Ghisays, V.; Luo, J.; Chen, Y.; Lee, W.; Zhou, Y.; Benzinger, T.L.S.; Reiman, E.M.; et al. Deep Residual Inception Encoder-Decoder Network for Amyloid PET Harmonization. Alzheimer’s & Dementia 2022, 18, 2448–2457. [Google Scholar] [CrossRef]
- Shah, J.; Chen, K.; Reiman, E.M.; Li, B.; Wu, T.; Su, Y. Transfer Learning Based Deep Encoder Decoder Network for Amyloid PET Harmonization with Small Datasets. Alzheimer’s & Dementia 2023, 19, e062947. [Google Scholar] [CrossRef]
- Alessio, A.M.; Kinahan, P.E. Improved Quantitation for PET/CT Image Reconstruction with System Modeling and Anatomical Priors. Medical Physics 2006, 33, 4095–4103. [Google Scholar] [CrossRef]
- Baete, K.; Nuyts, J.; Laere, K.V.; Van Paesschen, W.; Ceyssens, S.; De Ceuninck, L.; Gheysens, O.; Kelles, A.; Van den Eynden, J.; Suetens, P.; et al. Evaluation of Anatomy Based Reconstruction for Partial Volume Correction in Brain FDG-PET. NeuroImage 2004, 23, 305–317. [Google Scholar] [CrossRef]
- Erlandsson, K.; Dickson, J.; Arridge, S.; Atkinson, D.; Ourselin, S.; Hutton, B.F. MR Imaging–Guided Partial Volume Correction of PET Data in PET/MR Imaging. PET Clinics 2016, 11, 161–177. [Google Scholar] [CrossRef] [PubMed]
- Meltzer, C.C.; Leal, J.P.; Mayberg, H.S.; Wagner, H.N.J.; Frost, J.J. Correction of PET Data for Partial Volume Effects in Human Cerebral Cortex by MR Imaging. Journal of Computer Assisted Tomography 1990, 14, 561. [Google Scholar] [CrossRef] [PubMed]
- Müller-Gärtner, H.W.; Links, J.M.; Prince, J.L.; Bryan, R.N.; McVeigh, E.; Leal, J.P.; Davatzikos, C.; Frost, J.J. Measurement of Radiotracer Concentration in Brain Gray Matter Using Positron Emission Tomography: MRI-Based Correction for Partial Volume Effects. J Cereb Blood Flow Metab 1992, 12, 571–583. [Google Scholar] [CrossRef]
- Roussel, O.G.; Ma, Y.; Evans, A.C. Correction for Partial Volume Effects in PET: Principle and Validation.
- Shidahara, M.; Tsoumpas, C.; Hammers, A.; Boussion, N.; Visvikis, D.; Suhara, T.; Kanno, I.; Turkheimer, F.E. Functional and Structural Synergy for Resolution Recovery and Partial Volume Correction in Brain PET. NeuroImage 2009, 44, 340–348. [Google Scholar] [CrossRef]
- Tohka, J.; Reilhac, A. Deconvolution-Based Partial Volume Correction in Raclopride-PET and Monte Carlo Comparison to MR-Based Method. NeuroImage 2008, 39, 1570–1584. [Google Scholar] [CrossRef]
- Golla, S.S.V.; Lubberink, M.; van Berckel, B.N.M.; Lammertsma, A.A.; Boellaard, R. Partial Volume Correction of Brain PET Studies Using Iterative Deconvolution in Combination with HYPR Denoising. EJNMMI Research 2017, 7, 36. [Google Scholar] [CrossRef]
- Matsubara, K.; Ibaraki, M.; Kinoshita, T. ; for the Alzheimer’s Disease Neuroimaging Initiative DeepPVC: Prediction of a Partial Volume-Corrected Map for Brain Positron Emission Tomography Studies via a Deep Convolutional Neural Network. EJNMMI Physics 2022, 9, 50. [Google Scholar] [CrossRef]
- Azimi, M.-S.; Kamali-Asl, A.; Ay, M.-R.; Zeraatkar, N.; Hosseini, M.-S.; Sanaat, A.; Dadgar, H.; Arabi, H. Deep Learning-Based Partial Volume Correction in Standard and Low-Dose Positron Emission Tomography-Computed Tomography Imaging. Quant Imaging Med Surg 2024, 14, 2146–2164. [Google Scholar] [CrossRef]
- Moser, B.B.; Raue, F.; Frolov, S.; Palacio, S.; Hees, J.; Dengel, A. Hitchhiker’s Guide to Super-Resolution: Introduction and Recent Advances. IEEE Transactions on Pattern Analysis and Machine Intelligence 2023, 45, 9862–9882. [Google Scholar] [CrossRef]
- Ahmad, W.; Ali, H.; Shah, Z.; Azmat, S. A New Generative Adversarial Network for Medical Images Super Resolution. Sci Rep 2022, 12, 9533. [Google Scholar] [CrossRef]
- Dai, D.; Wang, Y.; Chen, Y.; Van Gool, L. Is Image Super-Resolution Helpful for Other Vision Tasks? In Proceedings of the 2016 IEEE Winter Conference on Applications of Computer Vision (WACV); March 2016; pp. 1–9.
- Li, H.; Yang, Y.; Chang, M.; Chen, S.; Feng, H.; Xu, Z.; Li, Q.; Chen, Y. SRDiff: Single Image Super-Resolution with Diffusion Probabilistic Models. Neurocomputing 2022, 479, 47–59. [Google Scholar] [CrossRef]
- Haris, M.; Shakhnarovich, G.; Ukita, N. Task-Driven Super Resolution: Object Detection in Low-Resolution Images. In Proceedings of the Neural Information Processing; Mantoro, T., Lee, M., Ayu, M.A., Wong, K.W., Hidayanto, A.N., Eds.; Springer International Publishing: Cham, 2021; pp. 387–395. [Google Scholar]
- Rasti, P.; Uiboupin, T.; Escalera, S.; Anbarjafari, G. Convolutional Neural Network Super Resolution for Face Recognition in Surveillance Monitoring. In Proceedings of the Articulated Motion and Deformable Objects; Perales, F.J., Kittler, J., Eds.; Springer International Publishing: Cham, 2016; pp. 175–184. [Google Scholar]
- Li, Y.; Sixou, B.; Peyrin, F. A Review of the Deep Learning Methods for Medical Images Super Resolution Problems. IRBM 2021, 42, 120–133. [Google Scholar] [CrossRef]
- Greenspan, H. Super-Resolution in Medical Imaging. The Computer Journal 2009, 52, 43–63. [Google Scholar] [CrossRef]
- Isaac, J.S.; Kulkarni, R. Super Resolution Techniques for Medical Image Processing. In Proceedings of the 2015 International Conference on Technologies for Sustainable Development (ICTSD); February 2015; pp. 1–6.
- Sun, J.; Xu, Z.; Shum, H.-Y. Image Super-Resolution Using Gradient Profile Prior. In Proceedings of the 2008 IEEE Conference on Computer Vision and Pattern Recognition; June 2008; pp. 1–8.
- Chang, H.; Yeung, D.-Y.; Xiong, Y. Super-Resolution through Neighbor Embedding. In Proceedings of the Proceedings of the 2004 IEEE Computer Society Conference on Computer Vision and Pattern Recognition, 2004. CVPR 2004.; June 2004; Vol. 1, p. I–I.
- Image Super-Resolution Via Sparse Representation | IEEE Journals & Magazine | IEEE Xplore. Available online: https://ieeexplore-ieee-org.ezproxy1.lib.asu.edu/abstract/document/5466111 (accessed on 11 September 2024). [CrossRef]
- Wang, Z.; Chen, J.; Hoi, S.C.H. Deep Learning for Image Super-Resolution: A Survey 2020. [CrossRef]
- Goodfellow, I.J.; Pouget-Abadie, J.; Mirza, M.; Xu, B.; Warde-Farley, D.; Ozair, S.; Courville, A.; Bengio, Y. Generative Adversarial Networks. Available online: https://arxiv.org/abs/1406.2661v1 (accessed on 11 September 2024). [CrossRef]
- Rezende, D.; Mohamed, S. Variational Inference with Normalizing Flows. In Proceedings of the Proceedings of the 32nd International Conference on Machine Learning; PMLR, June 1 2015; pp. 1530–1538.
- Ho, J.; Jain, A.; Abbeel, P. Denoising Diffusion Probabilistic Models. Available online: https://arxiv.org/abs/2006.11239v2 (accessed on 11 September 2024). [CrossRef]
- Li, X.; Jiang, Y.; Rodriguez-Andina, J.J.; Luo, H.; Yin, S.; Kaynak, O. When Medical Images Meet Generative Adversarial Network: Recent Development and Research Opportunities. Discov Artif Intell 2021, 1, 5. [Google Scholar] [CrossRef]
- Zhang, Q.; Chen, Y. Diffusion Normalizing Flow. In Proceedings of the Advances in Neural Information Processing Systems; Curran Associates, Inc., 2021; Vol. 34, pp. 16280–16291. [Google Scholar]
- Khader, F.; Müller-Franzes, G.; Tayebi Arasteh, S.; Han, T.; Haarburger, C.; Schulze-Hagen, M.; Schad, P.; Engelhardt, S.; Baeßler, B.; Foersch, S.; et al. Denoising Diffusion Probabilistic Models for 3D Medical Image Generation. Sci Rep 2023, 13, 7303. [Google Scholar] [CrossRef]
- Müller-Franzes, G.; Niehues, J.M.; Khader, F.; Arasteh, S.T.; Haarburger, C.; Kuhl, C.; Wang, T.; Han, T.; Nolte, T.; Nebelung, S.; et al. A Multimodal Comparison of Latent Denoising Diffusion Probabilistic Models and Generative Adversarial Networks for Medical Image Synthesis. Sci Rep 2023, 13, 12098. [Google Scholar] [CrossRef]
- Pinaya, W.H.L.; Tudosiu, P.-D.; Dafflon, J.; Da Costa, P.F.; Fernandez, V.; Nachev, P.; Ourselin, S.; Cardoso, M.J. Brain Imaging Generation with Latent Diffusion Models. In Proceedings of the Deep Generative Models; Mukhopadhyay, A., Oksuz, I., Engelhardt, S., Zhu, D., Yuan, Y., Eds.; Springer Nature Switzerland: Cham, 2022; pp. 117–126. [Google Scholar]
- D’Amico, S.; Dall’Olio, D.; Sala, C.; Dall’Olio, L.; Sauta, E.; Zampini, M.; Asti, G.; Lanino, L.; Maggioni, G.; Campagna, A.; et al. Synthetic Data Generation by Artificial Intelligence to Accelerate Research and Precision Medicine in Hematology. JCO Clinical Cancer Informatics 2023. [Google Scholar] [CrossRef]
- Rajotte, J.-F.; Bergen, R.; Buckeridge, D.L.; Emam, K.E.; Ng, R.; Strome, E. Synthetic Data as an Enabler for Machine Learning Applications in Medicine. iScience 2022, 25. [Google Scholar] [CrossRef]
- Thambawita, V.; Salehi, P.; Sheshkal, S.A.; Hicks, S.A.; Hammer, H.L.; Parasa, S.; Lange, T. de; Halvorsen, P.; Riegler, M.A. SinGAN-Seg: Synthetic Training Data Generation for Medical Image Segmentation. PLOS ONE 2022, 17, e0267976. [Google Scholar] [CrossRef]
- Gao, C.; Killeen, B.D.; Hu, Y.; Grupp, R.B.; Taylor, R.H.; Armand, M.; Unberath, M. Synthetic Data Accelerates the Development of Generalizable Learning-Based Algorithms for X-Ray Image Analysis. Nat Mach Intell 2023, 5, 294–308. [Google Scholar] [CrossRef]
- Wang, H.; Zhou, Y.; Zhang, J.; Lei, J.; Sun, D.; Xu, F.; Xu, X. Anomaly Segmentation in Retinal Images with Poisson-Blending Data Augmentation. Medical Image Analysis 2022, 81, 102534. [Google Scholar] [CrossRef] [PubMed]
- Lyu, F.; Ye, M.; Carlsen, J.F.; Erleben, K.; Darkner, S.; Yuen, P.C. Pseudo-Label Guided Image Synthesis for Semi-Supervised COVID-19 Pneumonia Infection Segmentation. IEEE Transactions on Medical Imaging 2023, 42, 797–809. [Google Scholar] [CrossRef] [PubMed]
- Weber, C.J.; Carrillo, M.C.; Jagust, W.; Jack, C.R.; Shaw, L.M.; Trojanowski, J.Q.; Saykin, A.J.; Beckett, L.A.; Sur, C.; Rao, N.P.; et al. The Worldwide Alzheimer’s Disease Neuroimaging Initiative: ADNI-3 Updates and Global Perspectives. Alzheimers Dement (N Y) 2021, 7, e12226. [Google Scholar] [CrossRef] [PubMed]
- OASIS-3: Longitudinal Neuroimaging, Clinical, and Cognitive Dataset for Normal Aging and Alzheimer Disease | medRxiv. Available online: https://www.medrxiv.org/content/10.1101/2019.12.13.19014902v1 (accessed on 19 September 2024). [CrossRef]
- Standardization of Amyloid Quantitation with Florbetapir Standardized Uptake Value Ratios to the Centiloid Scale - Navitsky - 2018 - Alzheimer’s & Dementia - Wiley Online Library. Available online: https://alz-journals-onlinelibrary-wiley-com.ezproxy1.lib.asu.edu/doi/10.1016/j.jalz.2018.06.1353 (accessed on 24 September 2024). [CrossRef]
- Su, Y.; Blazey, T.M.; Snyder, A.Z.; Raichle, M.E.; Marcus, D.S.; Ances, B.M.; Bateman, R.J.; Cairns, N.J.; Aldea, P.; Cash, L.; et al. Partial Volume Correction in Quantitative Amyloid Imaging. NeuroImage 2015, 107, 55–64. [Google Scholar] [CrossRef] [PubMed]
- Fischl, B. FreeSurfer. NeuroImage 2012, 62, 774–781. [Google Scholar] [CrossRef]
- Su, Y.; D’Angelo, G.M.; Vlassenko, A.G.; Zhou, G.; Snyder, A.Z.; Marcus, D.S.; Blazey, T.M.; Christensen, J.J.; Vora, S.; Morris, J.C.; et al. Quantitative Analysis of PiB-PET with FreeSurfer ROIs. PLOS ONE 2013, 8, e73377. [Google Scholar] [CrossRef]
- Lucy, L.B. An Iterative Technique for the Rectification of Observed Distributions. The Astronomical Journal 1974, 79, 745. [Google Scholar] [CrossRef]
- Biggs, D.S.C.; Andrews, M. Acceleration of Iterative Image Restoration Algorithms. Appl. Opt., AO 1997, 36, 1766–1775. [Google Scholar] [CrossRef]
- Saharia, C.; Chan, W.; Saxena, S.; Li, L.; Whang, J.; Denton, E.; Ghasemipour, S.K.S.; Ayan, B.K.; Mahdavi, S.S.; Gontijo-Lopes, R.; et al. Photorealistic Text-to-Image Diffusion Models with Deep Language Understanding.
- Rombach, R.; Blattmann, A.; Lorenz, D.; Esser, P.; Ommer, B. High-Resolution Image Synthesis With Latent Diffusion Models.; 2022; pp. 10684–10695.
- Loss Functions for Image Restoration With Neural Networks | IEEE Journals & Magazine | IEEE Xplore. Available online: https://ieeexplore-ieee-org.ezproxy1.lib.asu.edu/document/7797130 (accessed on 14 September 2024). [CrossRef]
- Zou, H.; Hastie, T. Regularization and Variable Selection Via the Elastic Net. [CrossRef]
- López-González, F.J.; Silva-Rodríguez, J.; Paredes-Pacheco, J.; Niñerola-Baizán, A.; Efthimiou, N.; Martín-Martín, C.; Moscoso, A.; Ruibal, Á.; Roé-Vellvé, N.; Aguiar, P. Intensity Normalization Methods in Brain FDG-PET Quantification. NeuroImage 2020, 222, 117229. [Google Scholar] [CrossRef]
- Song, J.; Meng, C.; Ermon, S. DENOISING DIFFUSION IMPLICIT MODELS. 2021.
- Jennewein, D.M.; Lee, J.; Kurtz, C.; Dizon, W.; Shaeffer, I.; Chapman, A.; Chiquete, A.; Burks, J.; Carlson, A.; Mason, N.; et al. The Sol Supercomputer at Arizona State University. In Proceedings of the Practice and Experience in Advanced Research Computing 2023: Computing for the Common Good; Association for Computing Machinery: New York, NY, USA, September 10 2023; pp. 296–301.
Figure 1.
Visualization of a simulated digital phantom (simDP) and simulated FBP (simFBP) from the data simulation pipeline using T1-MRI and the LDM-RR generated synthetic super-resolution FBP.
Figure 1.
Visualization of a simulated digital phantom (simDP) and simulated FBP (simFBP) from the data simulation pipeline using T1-MRI and the LDM-RR generated synthetic super-resolution FBP.
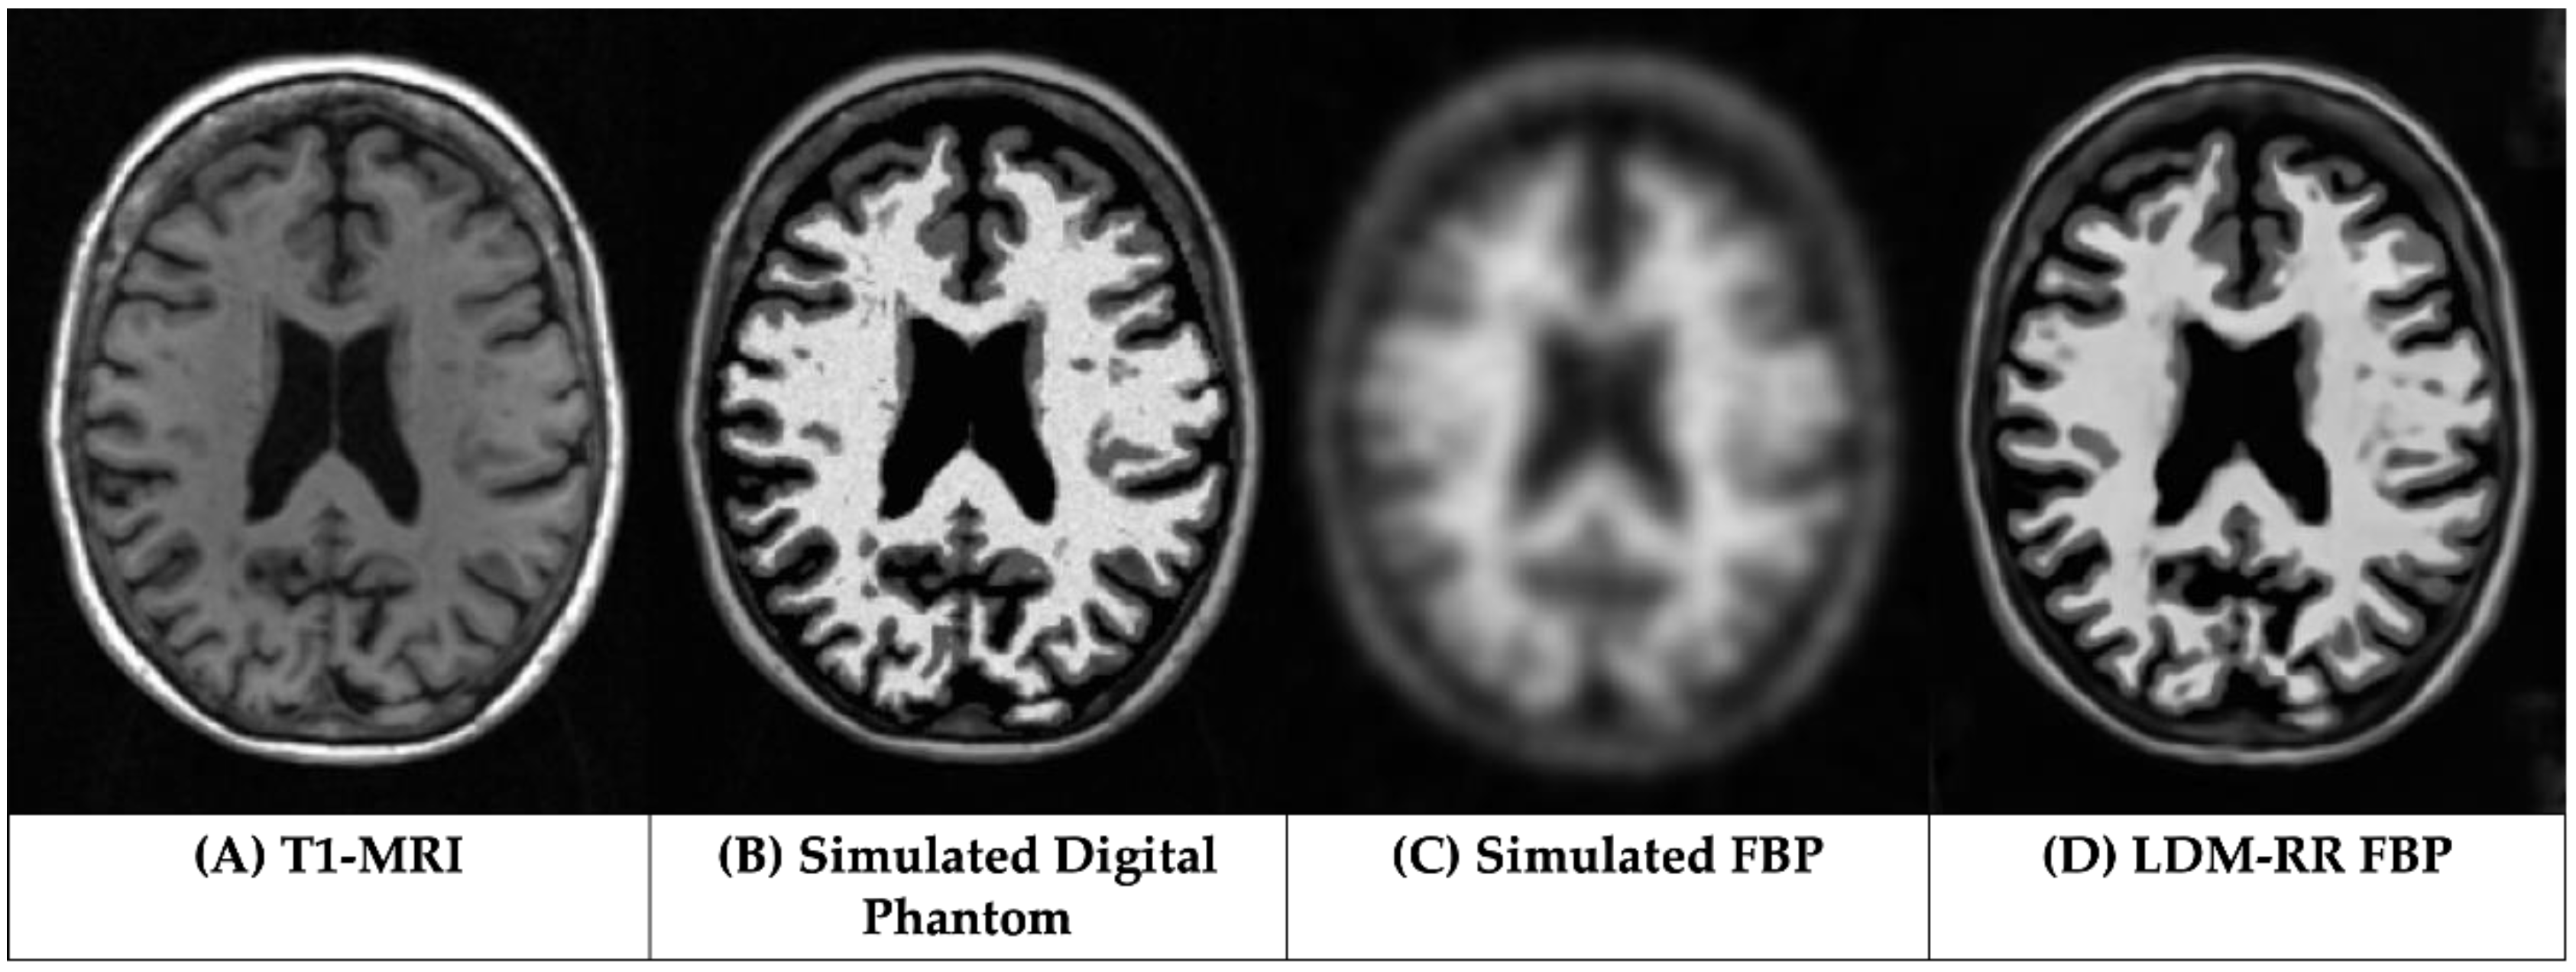
Figure 2.
Training three modality-specific autoencoder models to compress high-dimensional simulated DP, simulated FBP and MRI data into a lower-dimensional latent representation.
Figure 2.
Training three modality-specific autoencoder models to compress high-dimensional simulated DP, simulated FBP and MRI data into a lower-dimensional latent representation.
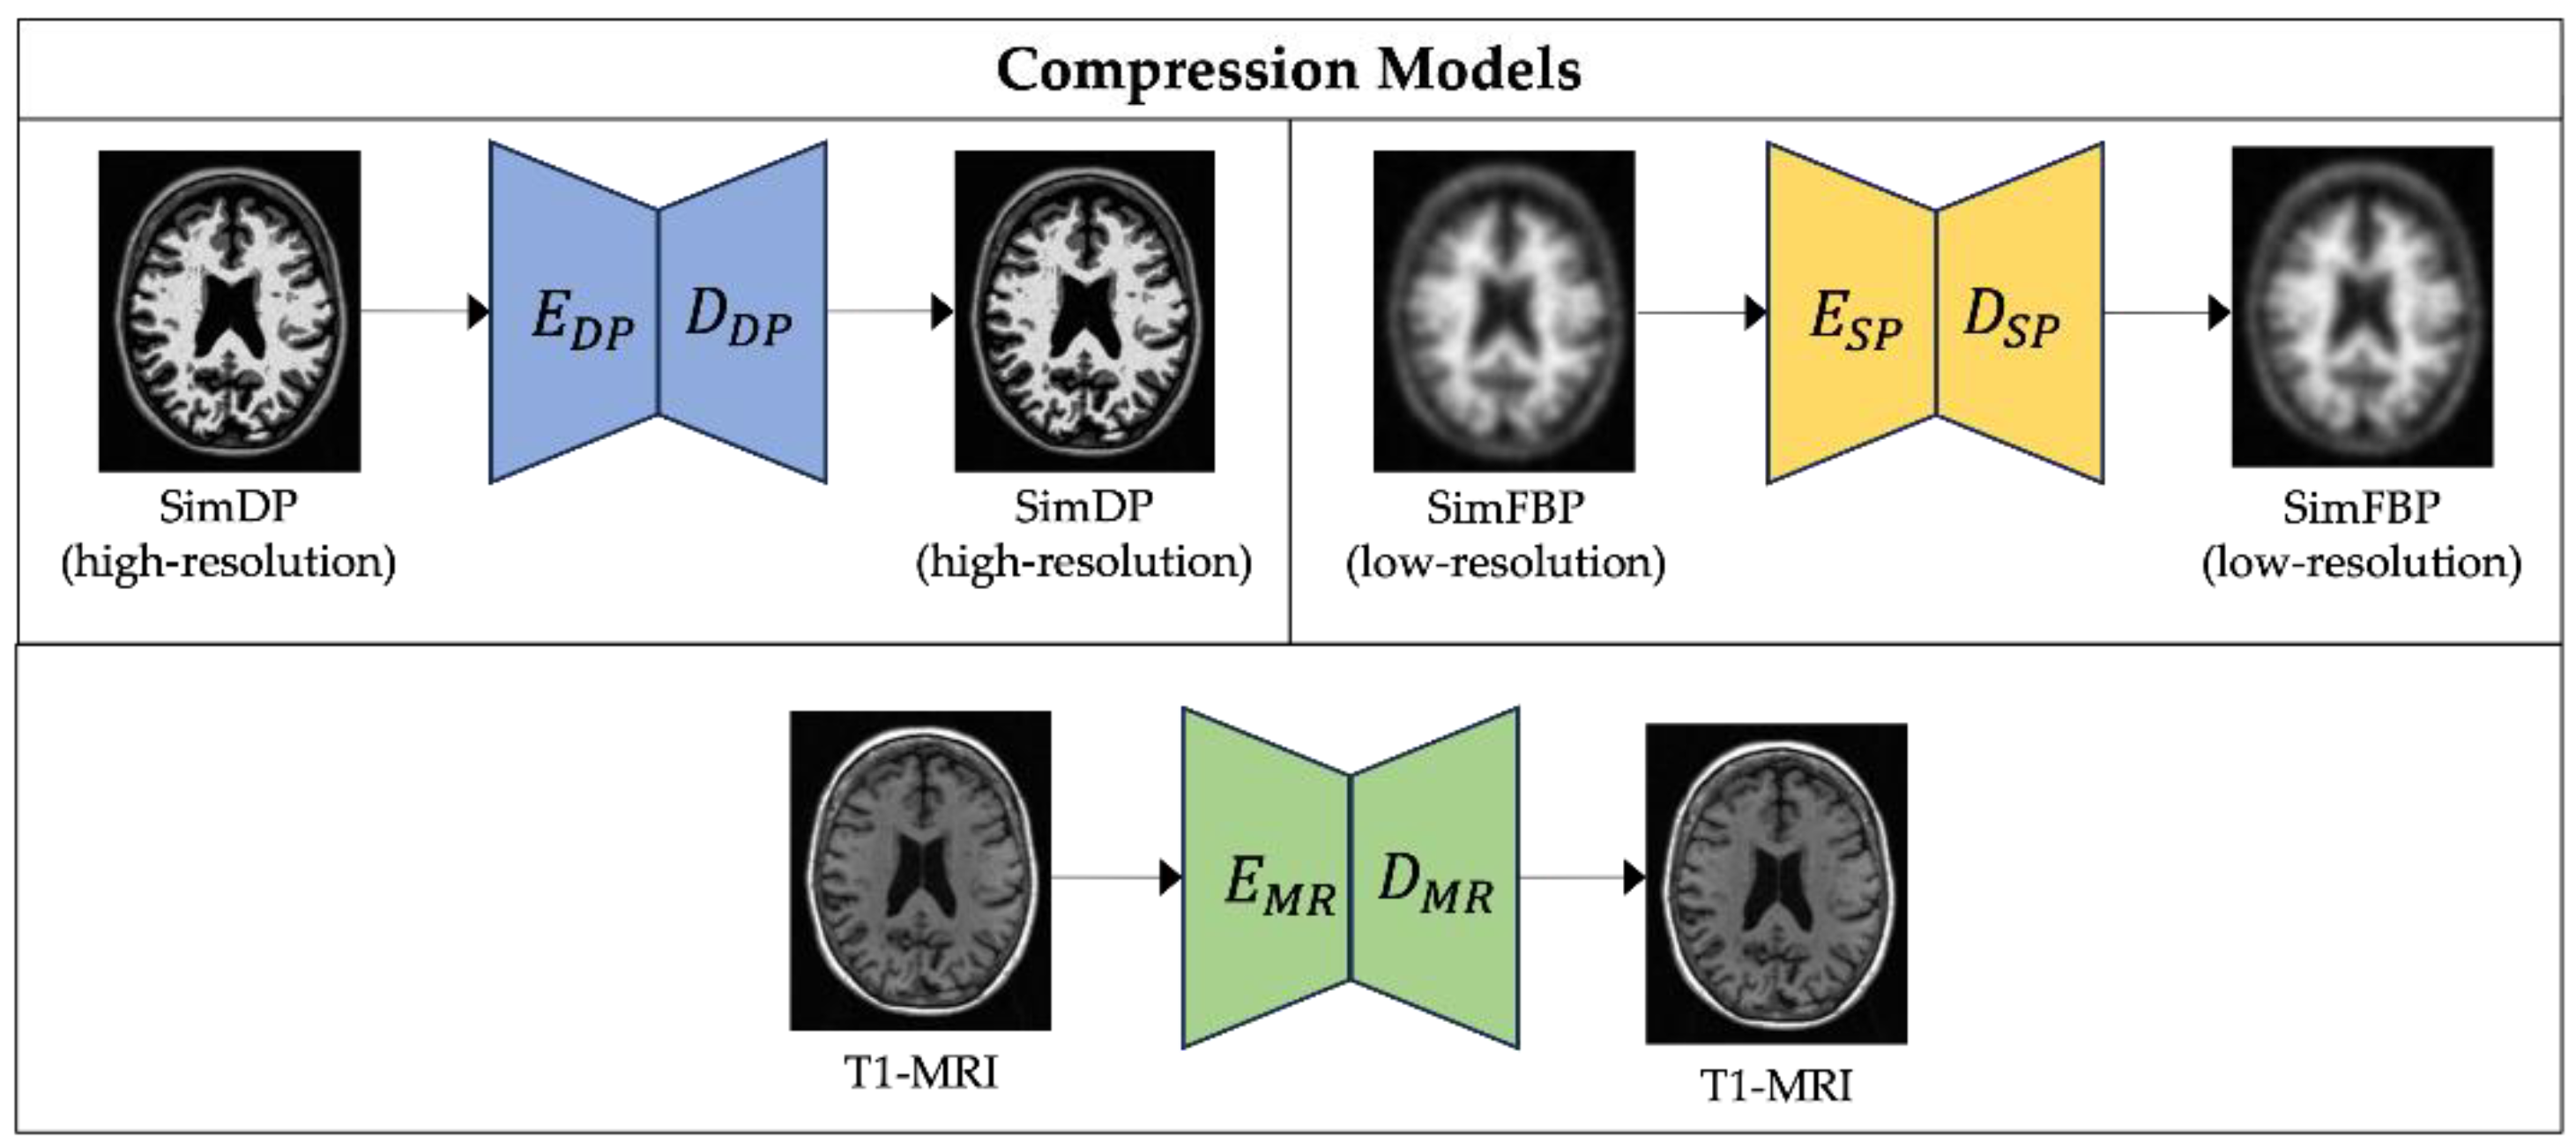
Figure 3.
Proposed LDM-RR framework’s training process for PET super-resolution. LDM is conditioned on latent representations of T1-MRI and simFBP and uses a combination of image and noise scale losses to generate corresponding high-resolution simDP.
Figure 3.
Proposed LDM-RR framework’s training process for PET super-resolution. LDM is conditioned on latent representations of T1-MRI and simFBP and uses a combination of image and noise scale losses to generate corresponding high-resolution simDP.
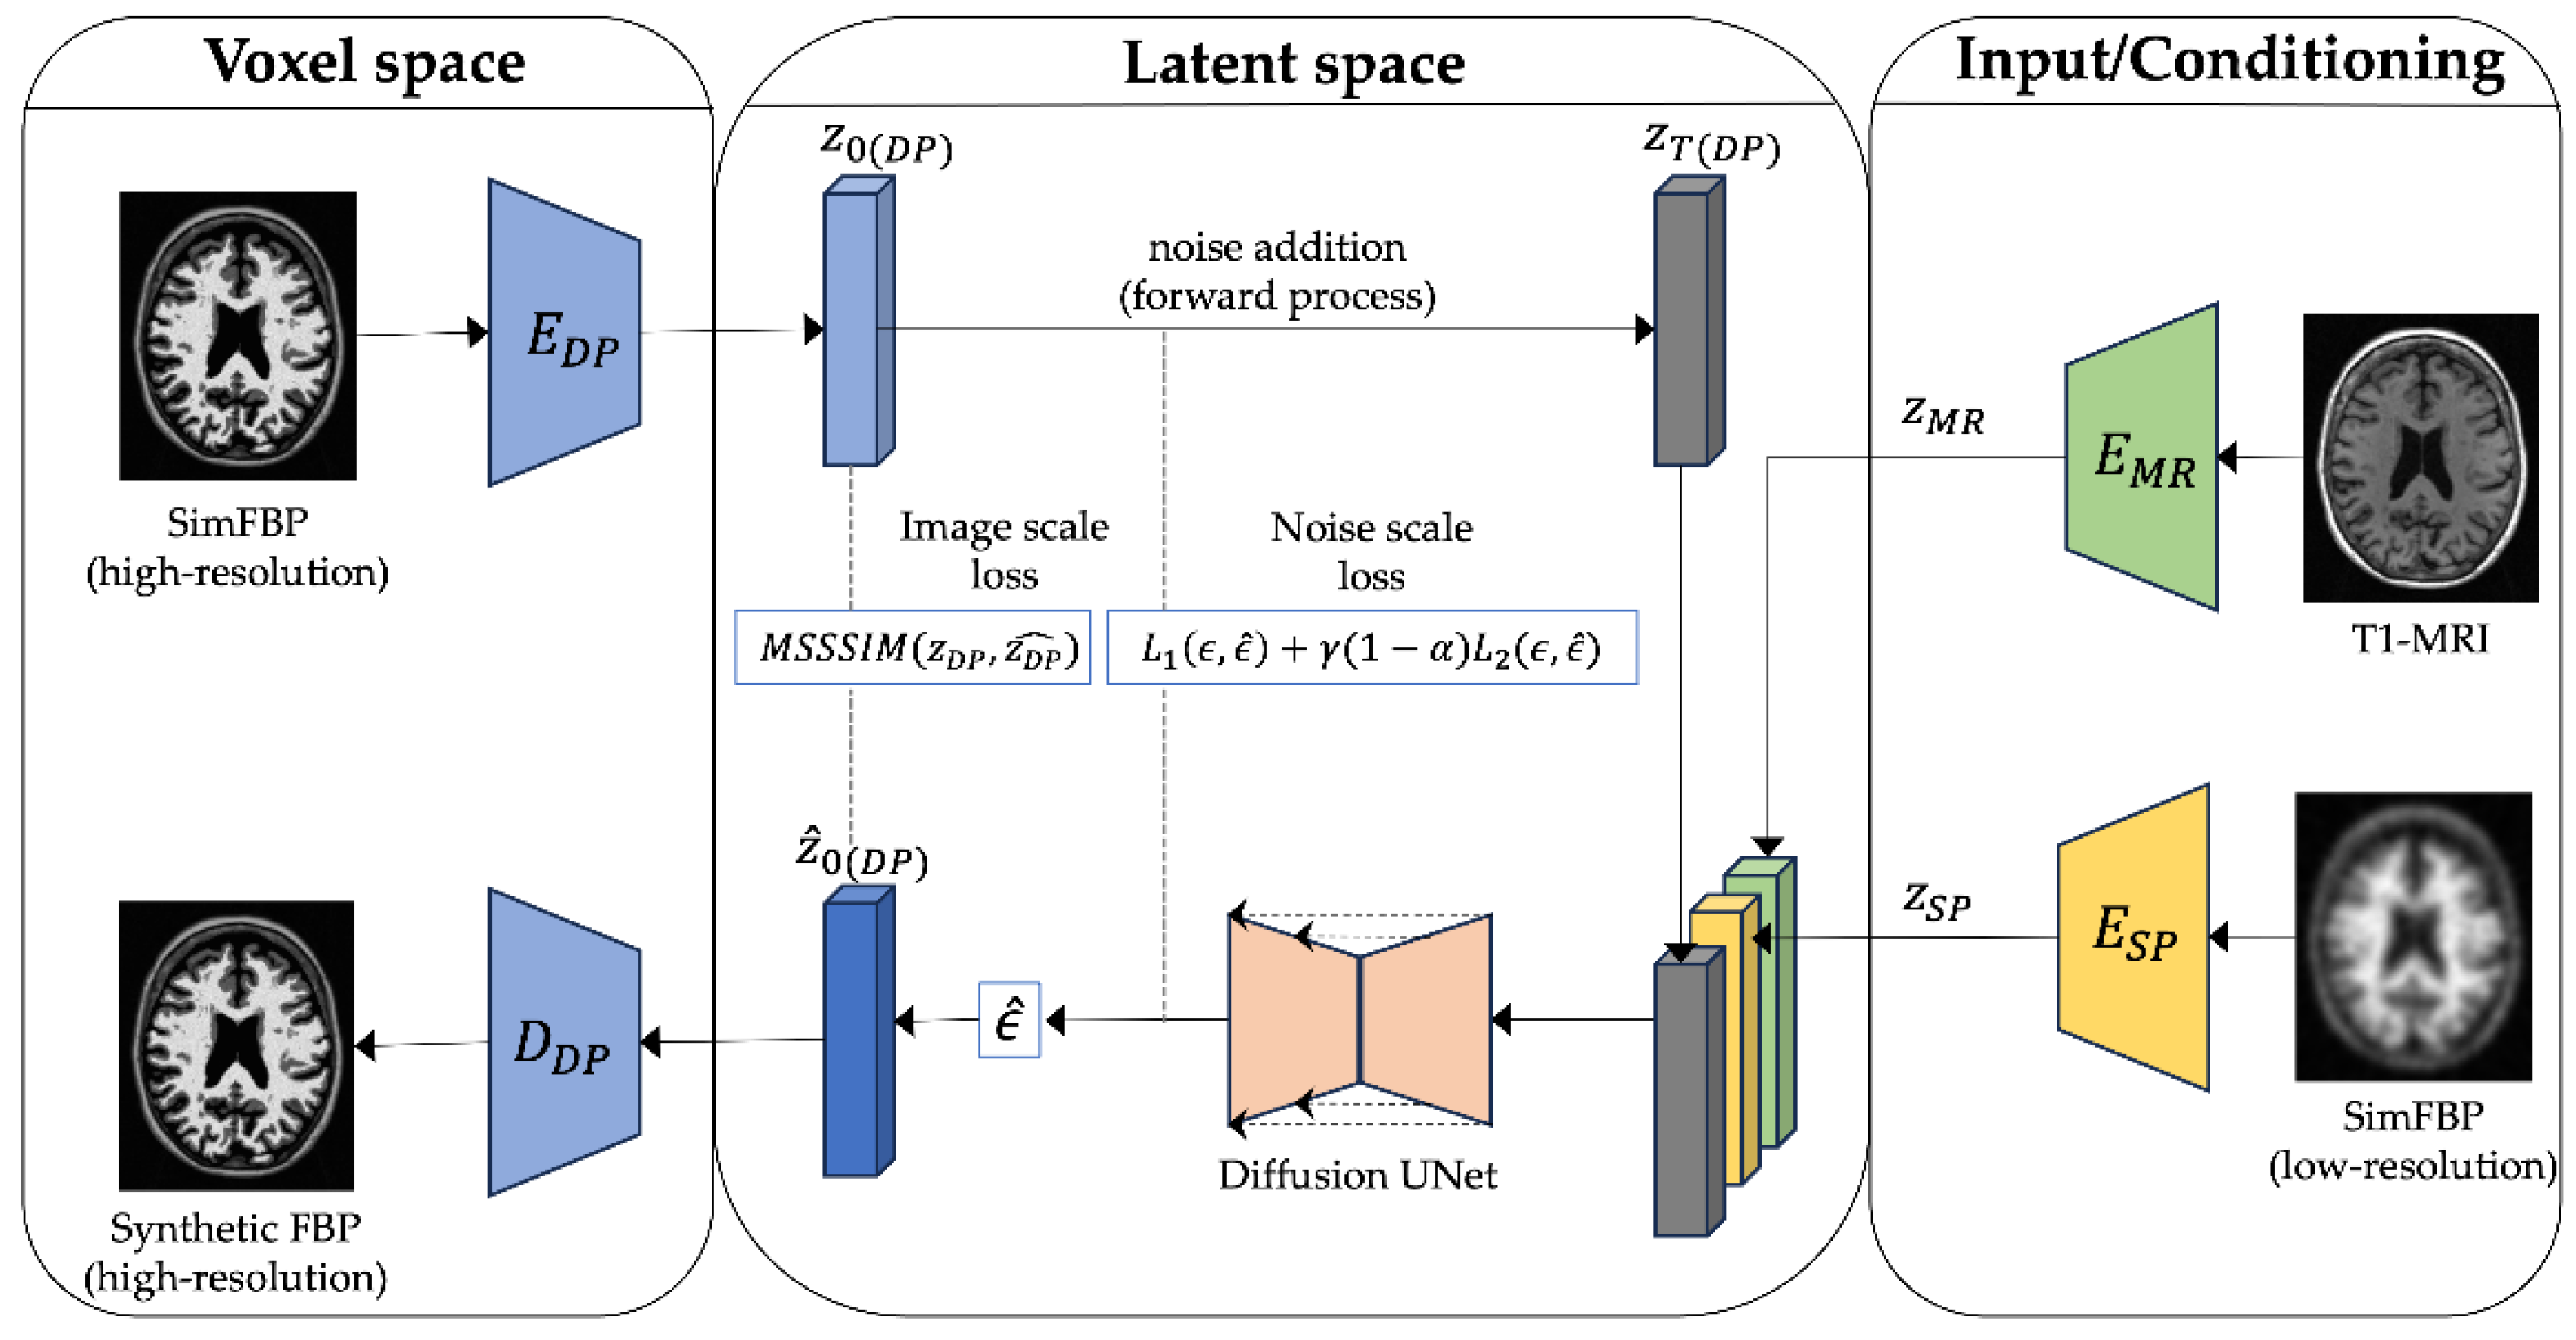
Figure 4.
Visual comparison of generated FBP scans using RL-RR and our LDM-RR to real FBP and T1- MRI for a sample from OASIS-3 cohort.
Figure 4.
Visual comparison of generated FBP scans using RL-RR and our LDM-RR to real FBP and T1- MRI for a sample from OASIS-3 cohort.
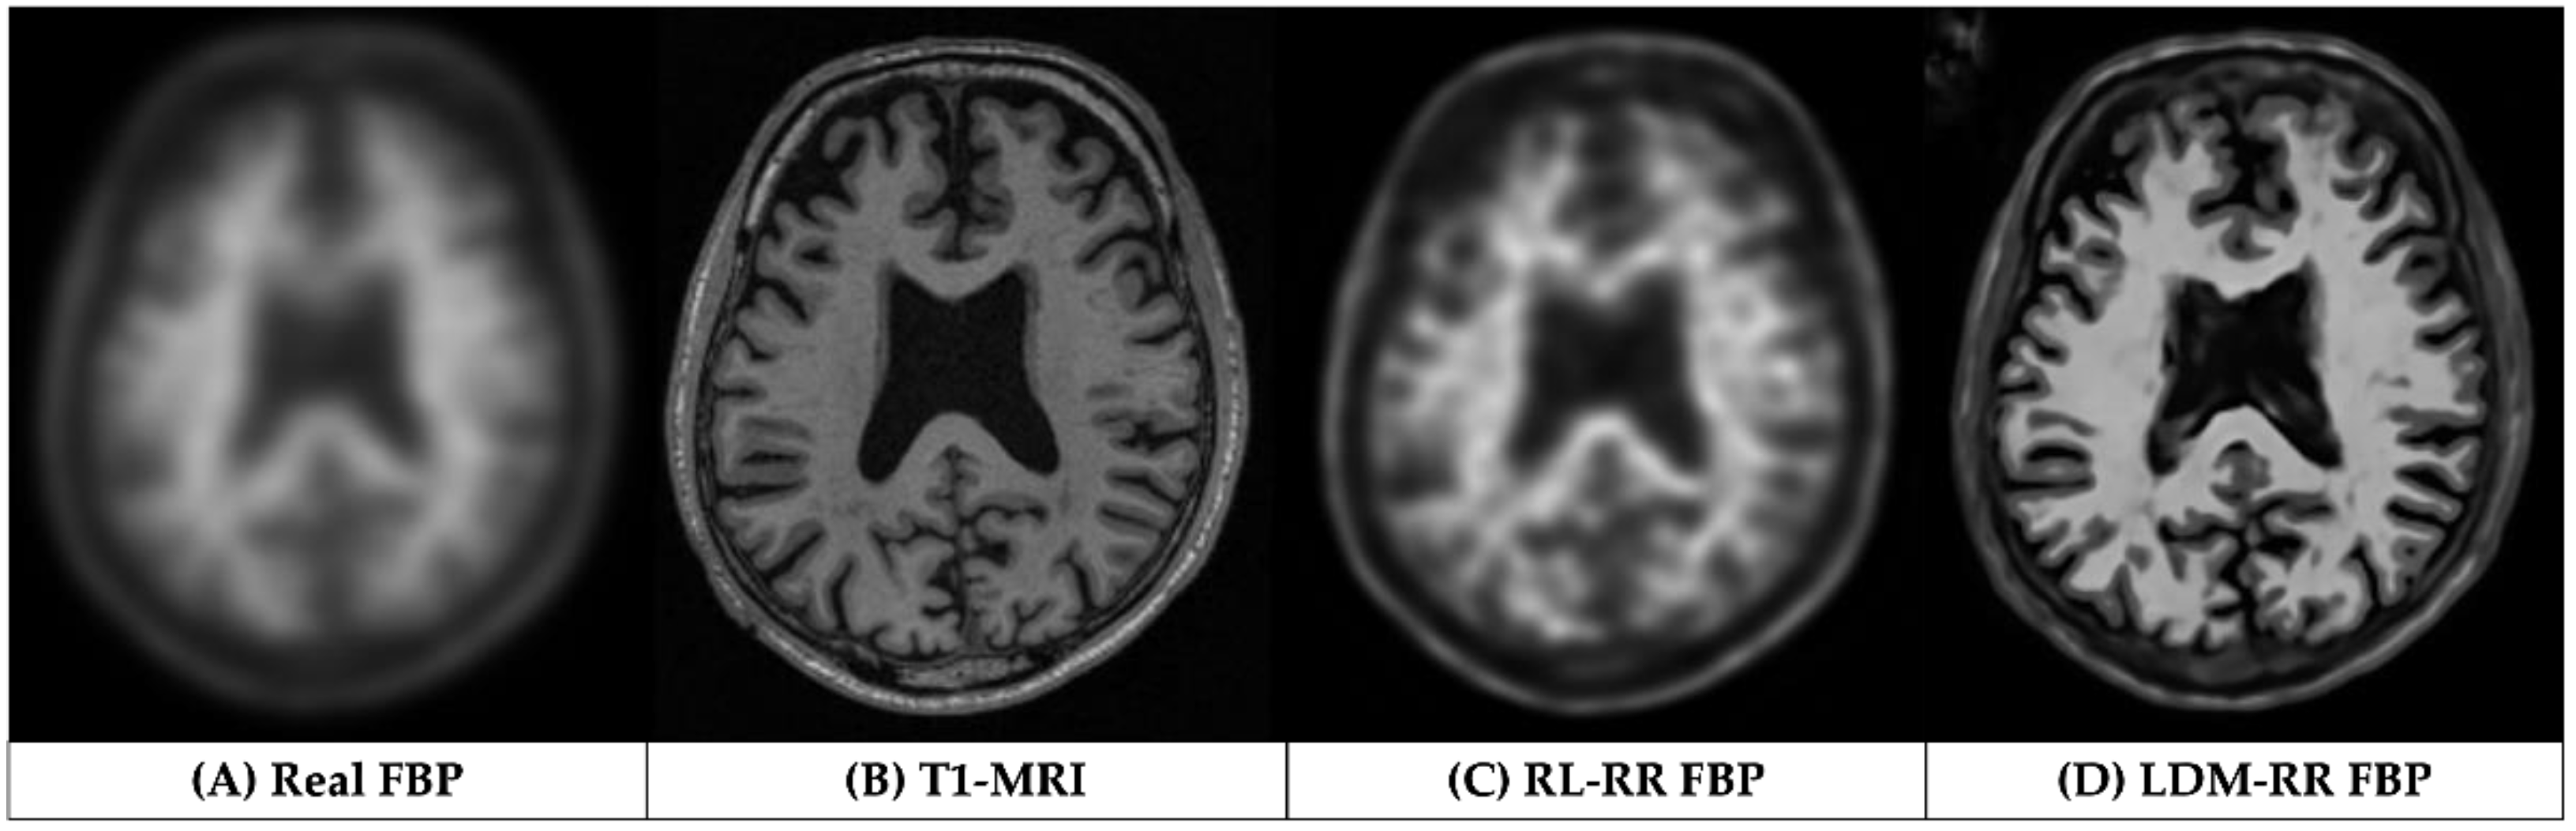
Figure 5.
Comparison of mean recovery coefficient (RC) using different methods on a held-out test of 338 samples randomly selected from the simulated dataset. A value closer to 1 indicates high performance.
Figure 5.
Comparison of mean recovery coefficient (RC) using different methods on a held-out test of 338 samples randomly selected from the simulated dataset. A value closer to 1 indicates high performance.
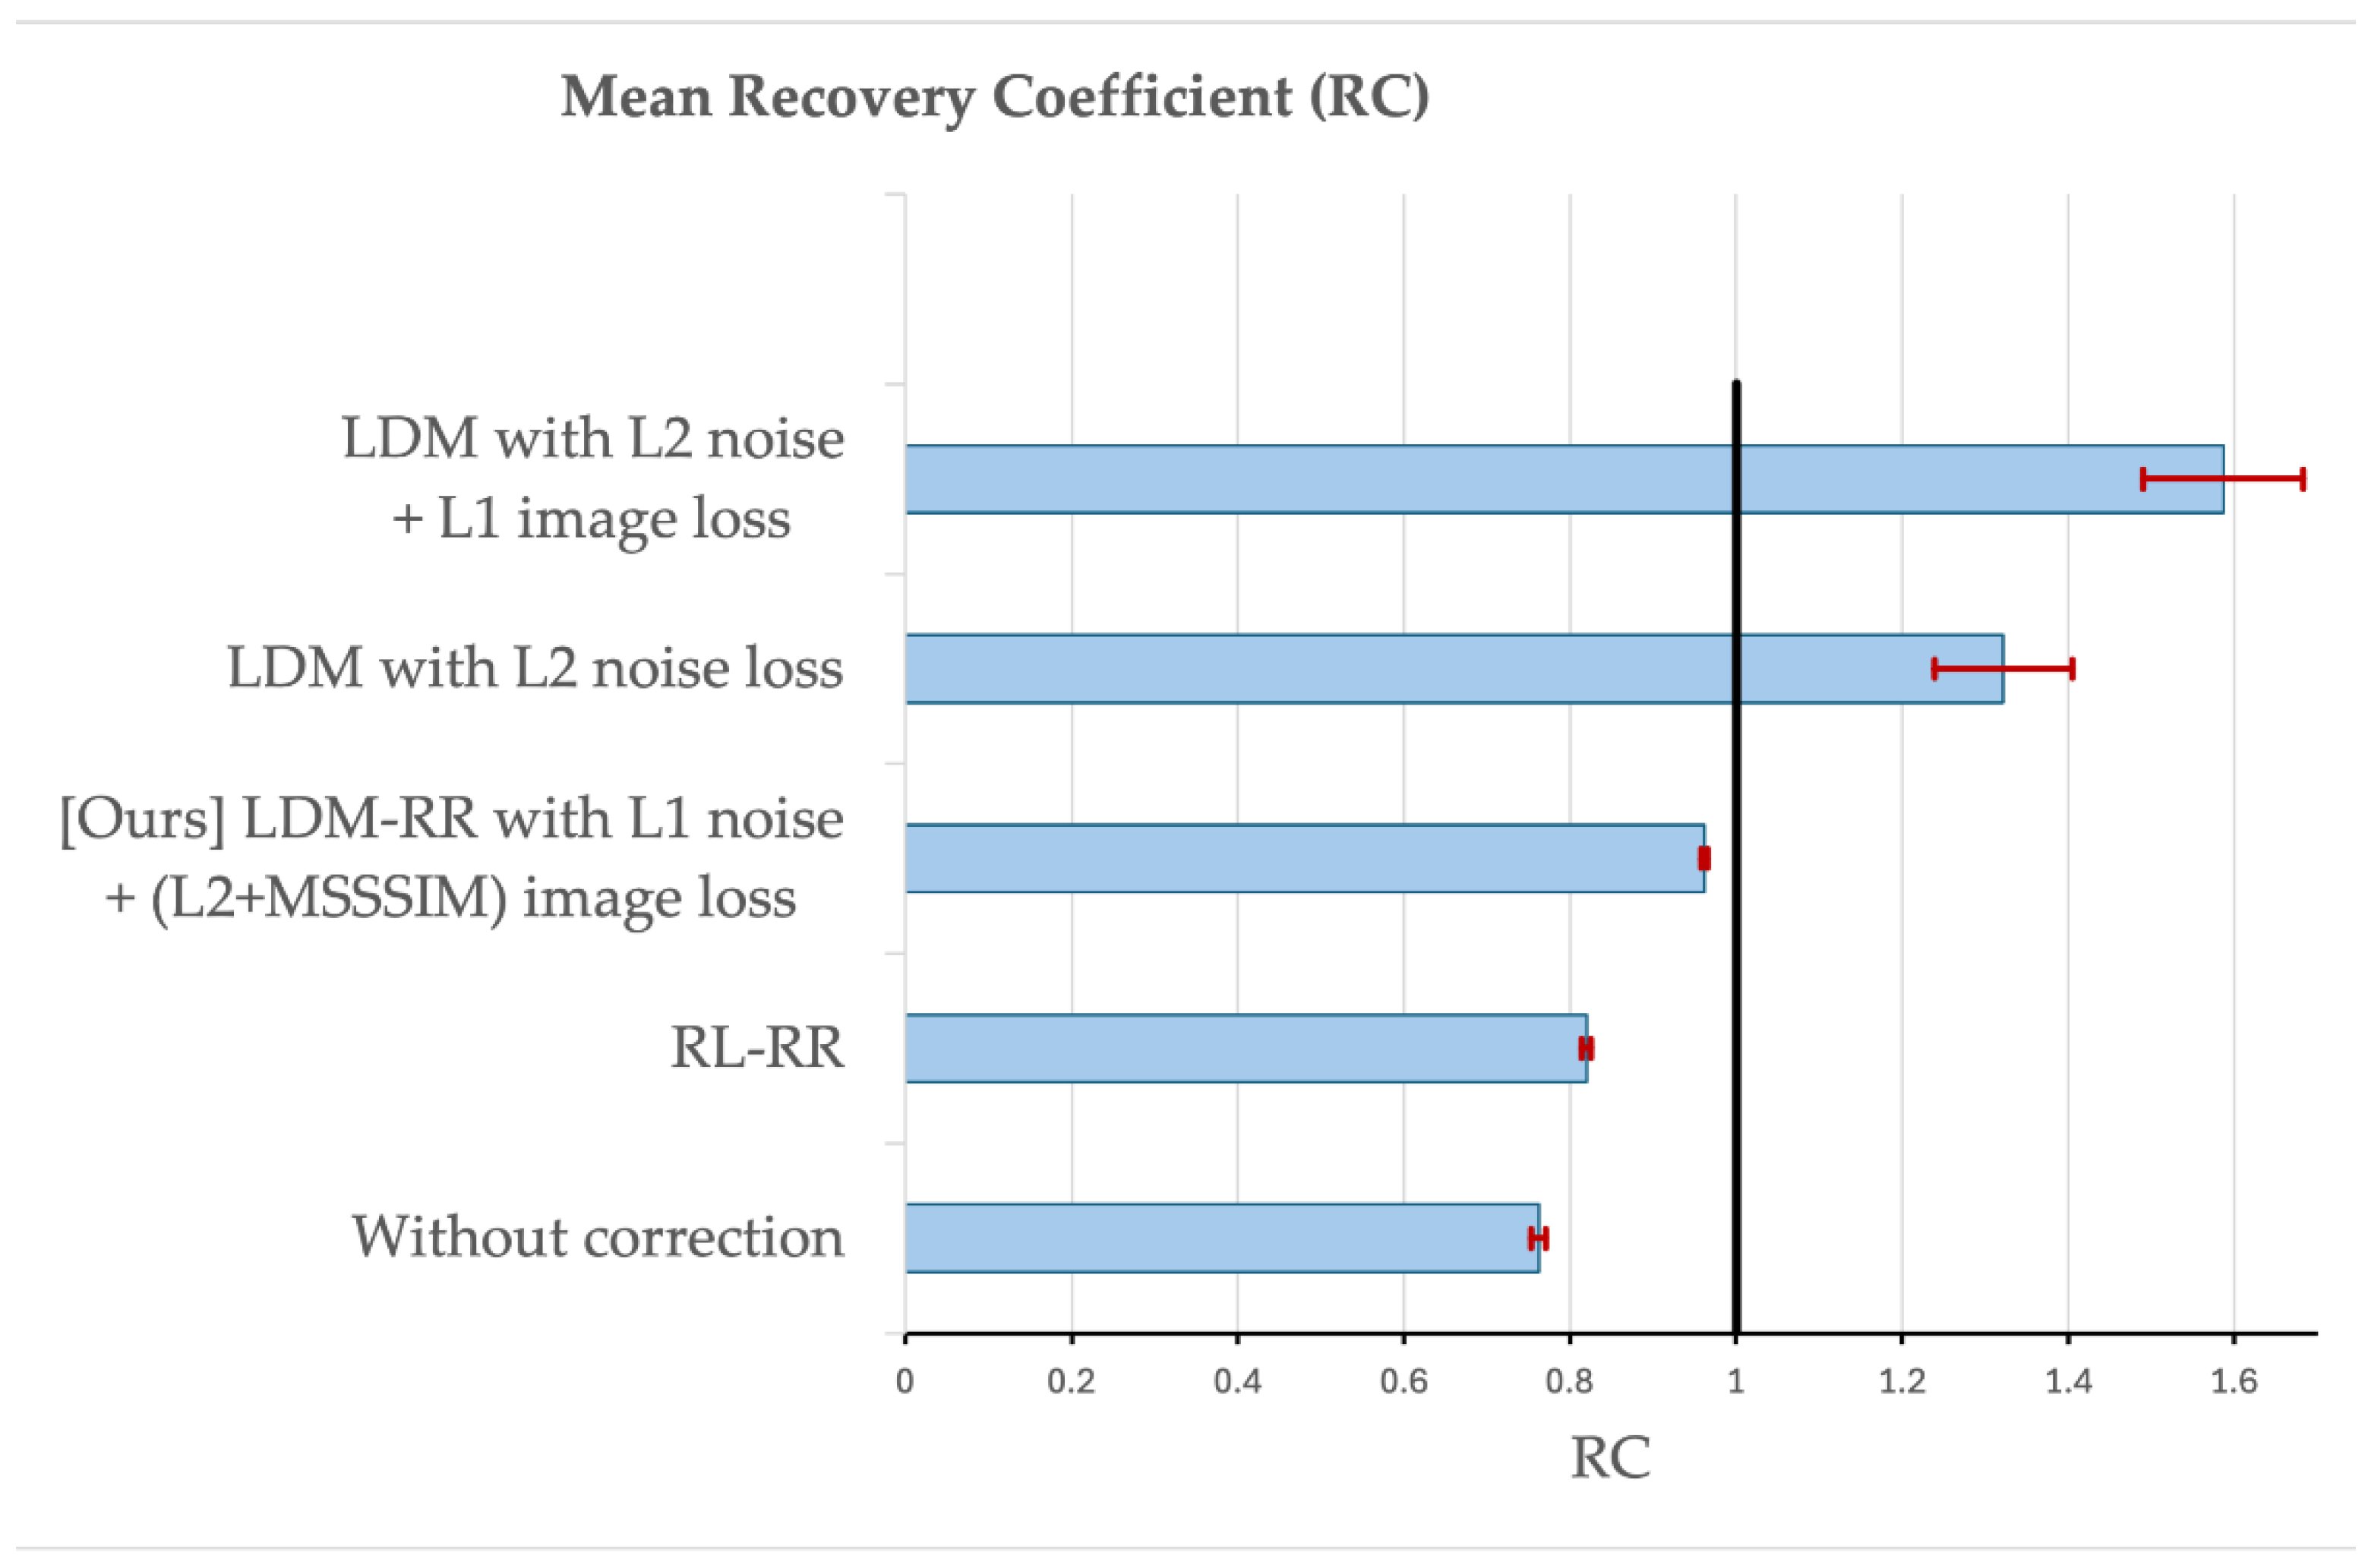

Table 1.
Summary of demographic information of the three cohorts included in this study.
| Cohort | ADNI | OASIS-3 | Centiloid |
|---|---|---|---|
| Sample count | 334 (167 baseline-followup FBPs) |
113 (FBP-PIB pairs) |
46 (FBP-PIB pairs) |
|
Age (SD) years |
75.1 (6.9) | 68.1 (8.7) | 58.4 (21.0) |
|
Education (SD) years |
16.1 (2.7) | 15.8 (2.6) | NA |
| Male (%) | 182 (54.5%) | 48 (42.5%) | 27 (58.7%) |
|
Cognitive impairment (%) |
236 (70.6%) | 5 (4.4%) | 24 (52.2%) |
| APOE4+ (%) | 218 (65.3%) | 38 (33.6%) | 15 (46.9*%) [*14 out of 46 unknown] |
|
PET interval (SD) years |
2.0 (0.06) | NA | NA |
Table 2.
Statistical power in detecting longitudinal changes measured by mean, standard deviation and p-value of annualized rate of amyloid accumulation and sample size (SS) estimates to detect a 25% reduction in amyloid accumulation rate due to treatment (80% power and a two-tailed type-I error of p=0.05).
| Annualized rate | Raw | RL-RR | LDM-RR |
|---|---|---|---|
| Mean | 0.0278 | 0.0377 | 0.0459 |
| SD | 0.0664 | 0.0807 | 0.0881 |
| p-value | 1.0E-07 | 5.0E-09 | 1.3E-10 |
| SS | 1431 | 1154 | 926 |
Table 3.
Comparison of RL and LDM-RR methods in improving the MCSUVR agreement between FBP and PIB tracers shown by Pearson correlation and Steiger’s test.
Table 3.
Comparison of RL and LDM-RR methods in improving the MCSUVR agreement between FBP and PIB tracers shown by Pearson correlation and Steiger’s test.
| Method | Pearson Correlation |
Steiger’s p-value |
|---|---|---|
| Without correction | 0.9163 | N/A |
| RL-RR | 0.9308 | <0.0001 (RL-RR vs. without correction) |
| LDM-RR | 0.9411 | 0.0001 (LDM-RR vs. without correction) |
| 0.0421 (LDM-RR vs. RL-RR) |
Disclaimer/Publisher’s Note: The statements, opinions and data contained in all publications are solely those of the individual author(s) and contributor(s) and not of MDPI and/or the editor(s). MDPI and/or the editor(s) disclaim responsibility for any injury to people or property resulting from any ideas, methods, instructions or products referred to in the content. |
© 2024 by the authors. Licensee MDPI, Basel, Switzerland. This article is an open access article distributed under the terms and conditions of the Creative Commons Attribution (CC BY) license (http://creativecommons.org/licenses/by/4.0/).
Copyright: This open access article is published under a Creative Commons CC BY 4.0 license, which permit the free download, distribution, and reuse, provided that the author and preprint are cited in any reuse.


