Submitted:
01 November 2024
Posted:
01 November 2024
You are already at the latest version
Abstract
The Western Junggar Orogen (Xinjiang) is featured by widespread granite intrusions and vast Au-Cu-Mo resource, making it an ideal site to study granitoids and their metallogenic link. Here, we utilized spectral information, remote sensing imaging and statistics, and textural features to select band combinations from ASTER VNIR-SWIR data. These combinations serve as the input layers for convolutional neural networks (AlexNet, VGG16 and GoogLeNet), which are used for remote sensing identification of granitoid lithology, and the results were compared with the Landsat 8 data. We suggest that the AlexNet model can best identify granitoid subtypes in the Western Junggar, with the 9B+T1 band combination being the most accurate (best weighted F1 score: 91.98%; kappa coefficient: 0.84). Landsat 8 images performed poorly, possibly because they have only two SWIR bands. The best lithological mapping results have identified Cu-Au ore-related diorite in the Karamay III intrusion, I-type granite in the Hongshan intrusion related to quartz vein-type and magmatic-hydrothermal gold ores, as well as A-type granite in the Akbasito and Karamay I and II intrusions. Our findings offer detailed spatial distribution characteristics of granite subtypes and provide remote sensing exploration methods for studying polymetallic ore belts in the Central Asian Orogenic Belt.
Keywords:
Lithological mapping
; Granitoids
; Convolutional Neural Network (CNN)
; ASTER VNIR-SWIR data
; the Western Junggar Orogen
1. Introduction
In the Western Junggar Orogen (Xinjiang, NW China), intermediate-felsic plutons of various sizes are widely distributed, with the major ones including the Miaoergou, Akebasito, Hatu, Tiechanggou, Karamay, and Hongshan batholiths. These batholiths extend along the NE-trending Darbut strike-slip fault zone [1-3]. Additionally, small plutons and dikes (e.g., at Baogutu and Karamay) intruded along secondary normal or thrust faults. The intrusive rock types include high-Mg diorite, (quartz-) diorite, granodiorite, monzogranite, and alkali granite [2-4]. Previous studies have shown a genetic link between the regional polymetallic mineralization and these granitoids, esp. the calc-alkaline I-type granite, adakitic granite, and high-Mg diorite [3, 5-6]. Moreover, it is difficult for lithological mapping in the field under typical arid to semi-arid climate and with sparse vegetation. Therefore, the Western Junggar Orogen is an ideal area for studying remote sensing identification of granitoid lithology and metallogenic processes.
Currently, there are two major classes of methods for extracting lithological information from remote sensing images [7]: (1) spectral angle mapping (SAM), band ratio (BR), and principal component analysis (PCA) [8-9]. They are mainly based on the spectral absorption and reflection characteristics of rocks and their major minerals, thereby enhancing differences the of lithological classification. They identify the lithologies directly based on the remote sensing imagery difference, and enhance the lithological information with false-color composite technology; (2) machine learning (ML) methods such as random forest (RF) and support vector machine (SVM) [9-11]. Deep Learning (DL) has been widely applied in lithological identification using remote sensing data. Representative image classification DL algorithms include convolutional neural network (CNN), SegNet, and Unet [12-15]. For instance, Grebby et al. used artificial neural networks to identify lithology in the Troodos ophiolite (Cyprus) by employing the slope, curvature, and surface roughness information obtained from radar data, which improve significantly the classification accuracy [12]. Latifovic adopted an improved CNN for geological mapping in the South Slave region (NW Canada) and compared the results with the RF method. The results show the better ability of CNN to predict surficial geology classes. [13]. Alzubaidi et al. used the ResNet model in CNN to identify sandstone, limestone, and shale lithologies, providing a crucial basis for oil and gas reservoir assessment [14].
Although there is extensive research in classifying and mapping rock and mineral information based on multisource optical remote sensing data, researches are still rare in the identification and extraction of sub-lithological remote sensing information for granitoids [16-20]. Earlier studies used mainly the convention methods such as BR, SVM, and PCA [9, 21-22]. By employing methods such as image fusion, ML, and RF, an identification accuracy achieved 85.75% for granitic lithology in the Himalayan orogeny belt [23]. Zhou et al. used RF to identify granitoids in the Western Junggar Orogen, achieving a weighted F1 score of 87.32% [24]. However, there are still challenges in identifying some subclasses of granitoids, primarily due to the weak mineral compositional difference and spectral features. In this study, we attempt to use ASTER VNIR-SWIR data as inputs and apply three CNN algorithms (VGG, ResNet, and AlexNet) to extract granitoid information regardless of their spectral features. Through training across multiple bands, object identification, accuracy validation, and comparison with the Landsat8 data, we aim to find the optimal model for mapping granitoid lithology in the Western Junggar Orogen, which can provide support for new remote sensing technology in identifying lithological mapping of granitoids in arid and semi-arid areas.
2. Geological Setting
The Central Asian Orogenic Belt (CAOB) was formed is the world’s largest Phanerozoic orogenic belt (Figure 1a) [25]. The Paleozoic regional tectono-magmatic activities were highly complex, which formed many mafic-ultramafic intrusions, granitoids, and volcanic units [26-27]. The Western Junggar in central-southern CAOB is situated at a crucial position of the Siberian, Tarim and Kazakhstan plates [28-29] (Figure 1a). The regional sedimentary and volcanic rocks were intruded by many Carboniferous-Permian (340-275 Ma) magmatic pluton [1, 30-33]. Lithological compositions include adakites, A-type granites, and tholeiitic and calc-alkaline assemblages belonging to the Xibeikulas, Baogutu, and Tailegula Formations, some of which argued to have formed during the opening of slab window [34-36]. The Darbut Fault is a major regional NE-trending, sinistral strike-slip fault, and has many secondary faults such as the Hatu and Anqi faults. These faults collectively controlled the regional granitoid emplacement, including the Miaoergou, Akebasito, Tiechanggou, Hatu, Karamay (separated into KI, KII and KIII), and Hongshan plutons and other smaller intrusive bodies (e.g., Baogutu) (Figure 1b).
The CAOB is an important polymetallic (incl. Cu, Au, Mo, Fe, W, Ni) mineral province, in which the Western Junggar Orogen is adjacent to the Kazakhstan metallogenic belt (Figure 1b) [37-40]. The Western Junggar Orogen contains the Bagutu Cu-Mo-Au deposit, some ophiolite-related podiform Cr deposits, and the Hatu gold deposits, with the mineralization spanning from the Late Devonian to Early Permian (290-390 Ma) [41-44]. The researches show that the polymetallic deposits in this area are related to these intermediate-acid granitic intrusions, such as calc-alkaline granite, mixed magmatic granite, Adakic granite and perillite granite [3, 38-39, 45]. Therefore, the Western Junggar Orogen is a good area to conduct remote sensing for lithological identification of granitoids and explore the relation with polymetallic mineralization.
3. Data and Methods
3.1. Remote Sensing Data
ASTER is a multispectral remote sensing sensor known for its good spatial and spectral resolution[8,46]. It includes visible and near-infrared (VNIR: 0.52-0.86 μm), shortwave infrared (SWIR: 1.6-2.43 μm), and thermal infrared (TIR: 8.125-11.65 μm) bands, totaling 14 spectral bands with spatial resolutions of 15m, 30m, and 90m. ASTER multispectral data, due to their diagnostic absorption characteristics of minerals and assemblages, have been used in mineral exploration and lithological classification for over two decades [47-49]. They were also used here to classify granitoids in the Western Junggar region.
3.2. Image Processing
In this study, two ASTER 3A level scenes were acquired on June 15, 2006. Cloud coverage is less than 1% and does not cover the granitoids. Pre-processing of ASTER VNIR-SWIR data includes radiation correction, FLAASH atmospheric correction, mosaicking, cropping, and spatial resampling (15m in the SWIR domain). Vegetation and buildings in the image were masked to prevent interference on subsequent analysis prior to the FLAASH atmospheric correction.
3.3. Textural Analysis
In addition to spectral reflectance characteristics of rocks and minerals, textural properties are crucial in classification studies including variations in spatial scale and visual smoothness and roughness [50]. The gray level cooccurrence matrix (GLCM) is widely used to calculate second-order textural properties. Haralick et al. described 14 textures Derived from the GLCM matrix [51]. ASTER band 6 was selected for textural extraction due to its highest standard deviation. We obtained eight textural features: mean (T1), variance (T2), homogeneity (T3), contrast (T4), heterogeneity (T5), entropy (T6), second-order matrix (T7), and correlation (T8), which were used in various combinations with bands as inputs for the RF. In field conditions where the plutons exhibit regular textures and similar strikes, T1 can serve as a more effective texture index for quantifying the lithology units in remote sensing images.
3.4. CNN Models
CNN algorithms have been developed into frameworks for image classification, demonstrating good performance in handling data with local correlations. These algorithms can directly train multi-dimensional remote sensing images, which minimize the loss of original data during information extraction, and thereby enhance the learning and generalization capacity of the models [10, 13-15]. In this study, we used three models of AlexNet, VGGNet, and GoogLeNet.
3.4.1. Training Sample Collection
To mitigate overfitting, the sampling points were randomly selected, encompassing all granite (n = 3044), alkali granite (n = 16680), monzogranite (n = 3657), granite-granodiorite (n = 4545), plagiogranite (n = 3135), biotite granite (n = 20239), and wallrocks (n = 4242). The dataset was randomly split into a training set (90%) and a testing set (10%). Because of the uneven spatial distribution of granitoid intrusions in the Western Junggar region and the substantial difference in sample numbers among the different subclasses, we employed the Synthetic Minority Over-sampling Technique (SMOTE) to oversample the data, thereby mitigating the data bias in the analysis. This method uses the K-nearest neighbor interpolation based on the original feature spatial information to augment points within the same category, ensuring a balanced number of samples across all the categories.
3.4.2. Parameter Setting
The AlexNet model features a relatively simple structure [52]. It consists of five convolutional and three fully-connected layers (Figure 2), which effectively mitigate the gradient vanishing problem and enable easy training. Here, several improvements were made to the original AlexNet model, such as using 3×3 kernels and stride 1 for all convolutional layers, employing ReLU activation functions in the convolutional layers and the first of the two fully connected layers, and applying a Softmax function in the last fully connected layer for direct statistical classification. The original input layer image size is 5×5×7, and the 1st, 3rd, 5th, 6th and 7th layers consist of 96, 256, 384, 384, and 256 convolutional kernels. Dropout layers were added after the convolutional layers, and data augmentation methods (incl. maxpooling) were used to improve the network training efficiency and reduce the model generalization errors. As smaller sliding windows would impact the lithological feature extraction and larger windows would increase the computational costs and reduce the generalization ability of the model, a 5×5 window size was chosen as the patch size for the study.
Meanwhile, the VGG16 and GoogLeNet models were compared with the AlexNet model. The GoogLeNet model introduces the inception module, which captures information at different scales using convolutional kernels and pooling operations of various sizes, and integrates these feature maps at the same level [53]. The VGG16 model contains 16 convolutional layers and three fully connected layers, and uses 3×3 convolutional kernels like the AlexNet model [54]. The basic unit of the network comprises a sequence of successive convolutional layers followed by pooling layers. The final classification is achieved through fully connected layers following the convolutional layers. In this study, the input layer selection first involved choosing the band combination B13678+T1 based on the spectral, statistical, and textural information from ASTER images. After that, a band combination representing the SWIR bands with the reflection characteristics of granitoid subclasses and texture was chosen as the input layers. Lastly, a band combination representing the VNIR-SWIR bands and texture from the ASTER images were selected as the input layers (for the CNN models) for lithological extraction.
4. Lithological Identification of Rock Samples
To determine the granitoid lithology in the Western Junggar region, rock samples were selected from the Akebasito, Karamay, and Hongshan plutons (Figure 1b) and analyzed through spectral measurement, polarized light microscopy (PLM), and X-ray diffraction (XRD) to classify the granitoid subclass.
4.1. ASD Spectral Measurements
Rock samples were cut into 6cm×6cm×1cm slabs, and the spectral reflectance of both fresh and weathered surface was measured with a FieldSpec3 Analytical Spectral Device (ASD) spectrometer, which captures data across 2151 bands from 0.35 to 2.5 μm. At least three spots were measured on each sample, with five spectral readings collected per spot. All spectral measurements were conducted under dry condition. After each spectral measurement was completed, black and white board corrections were performed again to avoid interference from the subsequent samples. The spectral data (from weathered and fresh surface) were averaged for further processing, and the spectra of selected granitoid samples and their resampled versions in the ASTER VNIR-SWIR bands are shown in Figure 3a-b. Additionally, spectra of related minerals (quartz, albite, orthoclase, perthite, microcline, hornblende, biotite, muscovite, oligoclase) from the USGS spectral library (Figure 3c-d) were compared with those of the granitoid samples.
Although granitoids are primarily composed of quartz and feldspars, different subclasses can result in prominent VNIR-SWIR absorption peaks due to the presence of micas and hornblende (Figure 3a). In the VNIR spectrum, granite, granodiorite, and monzogranite exhibit absorption peaks at 0.65 μm and 0.9 μm due to the energy transition involving ferrous/ferric ions in biotite (Figure 3c). After resampling to ASTER VNIR-SWIR (Figure 3b), the spectral reflectance of granitoid samples increases from B1 to B3, whereas diabase as the wallrock (A-05) shows an opposite trend. This information is important to distinguish between the granitoids and wallrocks. In the SWIR spectrum, all granitoid samples exhibit a strong absorption band at 1.9 μm, attributed to water molecule and hydroxyl ion vibrations (e.g., Al-OH, Mg-OH) in biotite and hornblende [55-56]. Additionally, certain granitoid subclasses show a prominent absorption peak at 2.2 μm (Al-OH) and a weaker peak at 2.25 μm (Mg-OH).
4.2. Optical Microscopy
To enhance the remote sensing lithological classification, the granitoid samples collected were prepared into petrographic thin sections and observed under an OLYMPUS BX53 optical microscope (Figure 4). In the Akebasito intrusion, sample A-02 is a coarse-grained alkali granite, consisting primarily of quartz (~30 vol%), highly-altered K-feldspar (~40 vol%), and plagioclase (<15 vol%; Figure 4a). Sample A-03, a coarse-grained monzogranite, consists of quartz (~25 vol%), plagioclase (~30 vol%), and K-feldspar (~40 vol%; Figure 4b). Sample A-04 is granite, which has coarse-grained quartz (~40 vol%), K-feldspar (~35 vol%), plagioclase (15 vol%), and minor biotite (<5 vol%; Figure 4c). In the Hongshan intrusion, sample HS-02, an alkali granite, is mainly composed of coarse-grained K-feldspar (~55 vol%), quartz (~30 vol%), and minor hypersthene (<10 vol%; Figure 4d).
For the samples from the Karamay intrusion: KII-02 is a plagiogranite, consisting of quartz (~30 vol%), plagioclase (~40 vol%), K-feldspar (~15 vol%), and hornblende (<5 vol%; Figure 4e). Sample KⅢ-01 is biotite granite, composed mainly of quartz (~20 vol%), plagioclase (~20 vol%), K-feldspar (~30 vol%), biotite (~15 vol%), and minor hornblende (<5 vol%; Figure 4f).
4.3. X-ray Diffraction (XRD) Analysis
The granitoid samples were milled and analyzed with a Rigaku SmartLab X-ray powder diffractometer (XRD). As shown in Figure 5, alkali granite sample A-02 shows prominent diffraction peaks at 26.7° for quartz, 27.9° for albite, and 27.5° for microcline, alongside a weaker peak at 20.9° for orthoclase. Different from A-02, monzogranite sample A-03 shows a weaker albite (27.9) but stronger quartz (26.7) peak, and a distinct peak of microcline (27.5). Sample A-04, characterized by significant fracturing and weathering, shows strong albite peak at 27.9° and weaker quartz peak at 26.7°, accompanied by weak orthoclase and microcline peaks. Plagiogranite sample KⅡ-01 shows prominent peaks at 26.7° (quartz), 27.9° (albite), and 28.5° (anorthite), with weaker peaks for orthoclase and hornblende at 10.6°. Biotite granite sample KⅢ-01 exhibits strong peaks at 26.7° (quartz) and 27.9° (albite), with weaker peaks at 20.9° (orthoclase) and 26.4° (biotite). Coarse-grained alkali granite sample HS-02 shows strong peaks at 27.5° (microcline) and 28.5° (anorthite), and a weaker peak for hornblende.
Based on the ASD, PLM, and XRD analysis results, the lithology of the granitoid samples was determined and listed in Table 1.
5. Results from ASTER Data
5.1. Spectral Feature Bands+ Texture Images
Lithological identification results of ASTER images (with B13678+T1 as input) for the GoogLeNet, VGG16, and AlexNet models are shown in Figure 6. In the Akebasito intrusion, the boundaries between the granitoid subclasses are clearer in the AlexNet model. Results of the VGG16 model are no better than those of the AlexNet model, because some alkali granite pixels were misclassified as granite on the southern margin of the intrusion. Meanwhile, the GoogLeNet model performs badly with many misclassifications (except for monzogranite). In the KI intrusion, the few misclassifications (as granite and granodiorite) are located on the southern margin of the intrusion in the AlexNet and VGG16 models. The identification results of plagiogranite and biotite granite in the KⅡ intrusion show clear boundaries between each subclass in the AlexNet and VGG16 models. In the KⅢ intrusion, the monzogranite-biotite granite boundary is unclear in the western margin, with more mixed/misclassified pixels in the GoogLeNet model. In the Hongshan intrusion, the results of the AlexNet and VGG16 models are similar, with only a few pixels misclassified as monzogranite in the southwestern area. Only 8.5% of the wallrock is wrongly divided into granitoids by using AlexNet in the study area (9.0% of GoogLeNet and 9.9% of VGG16). The results of AlexNet are significantly better than those of GoogLeNet and VGG16 with fewer misclassified pixels.
Comparing the overall classification accuracy (Table 2), the weighted F1 score and kappa coefficient for B13678+T1 (using the GoogLeNet model) is 76.65% and 0.79, respectively. Comparatively, the weighted F1 score of B13678+T1 (using the VGG16 model) is significantly higher (90.46%), but the kappa coefficient is largely the same (0.79). The weighted F1 score and kappa coefficient for B13678+T1 (using the AlexNet model) are 91.21% and 0.81, respectively, both higher than those using the GoogLeNet and VGG16 models.
5.2. SWIR Bands + Texture Images
The lithological mapping results (with SWIR+T1 as input) for the AlexNet model are better than those of VGG16 and GoogLeNet, with considerably fewer misclassified pixels (Figure 7). The misclassification rate of wallrock in the study area is 13.6% of AlexNet, 17.3% of VGG16 and 43.8% of GoogLeNet, respectively. However, none of the three models can clearly define the granite-alkali granite boundary. All the models perform well in distinguishing monzogranite from the other granitoid subclasses. For the KⅠ intrusion, the VGG16 and AlexNet models perform better than the GoogLeNet model, with fewer misclassified pixels as granite-granodiorite on the northern margin. For the KⅡ intrusion, results of the VGG16 and AlexNet models also show clear plagiogranite-biotite granite boundary. For the KⅢ intrusion, the AlexNet model performs the best, with clear boundaries between granitoids, monzogranite, and biotite granite. For the Hongshan and Akebasito intrusions, the AlexNet model performs better in identifying granitoid subclasses, with only a few alkali granite pixels misclassified as plagiogranite. Compared with the GoogLeNet model, the VGG16 and AlexNet models also show a significant reduction in misclassified wallrocks (more gray coverage), primarily in the southern part of the Akebasito intrusion.
Comparing the overall classification accuracy (Table 3), the AlexNet model achieves the highest weighted F1 score (88.65%) and kappa coefficient (0.77), followed by the VGG16 model (83.36% and 0.74, respectively) and then by the GoogLeNet model.
5.3. VNIR-SWIR Bands + Texture Images
Lithological mapping results of the GoogLeNet, VGG16, and AlexNet models (with VNIR-SWIR + T1 as input layers) are shown in Figure 8. All models perform well in identifying granite-granodiorite, monzogranite, and granite in the Akebasito intrusion, but they also include a considerable number of misclassified pixels as granite-granodiorite. In the KⅠ intrusion, misclassified (as granite-granodiorite) pixels are also located along the northern boundary of the intrusion and in the wallrocks. For the identification of biotite granite, monzogranite, and plagiogranite in the KⅡ and KⅢ intrusions, all the three models perform well with clear boundaries between the various granitoid subclass. In the Hongshan intrusion, the AlexNet model performs the best, with only a few pixels misclassified as monzogranite on the intrusion margin, whereas the GoogLeNet and VGG16 models yielded more misclassifications as monzogranite and granite-granodiorite. Generally, the misclassification rate of wallrock in the study area is 7.9% of AlexNet, 8.0% of GoogLeNet and 8.1% of VGG16, respectively.
Comparing the overall classification accuracy (Table 4), the AlexNet model achieves the highest weighted F1 score (91.98%) and kappa coefficient (0.84), followed closely by the GoogLeNet model and then by the VGG16 model.
6. Discussion
6.1. Comparison with Landsat8 Data
The AlexNet model consistently demonstrates the best lithological classification. Thus, only the AlexNet model was used to process the Landsat8 data, with SWIR+T1 and VNIR-SWIR+T1 as the input layers. This is done in order to compare the data source and identify any difference in the CNN models. The results with SWIR+T1 input are poor with blurred boundaries between the various granitoid subclasses, possibly caused by the limited information provided by the rare Landsat8 SWIR bands. In contrast, using VNIR-SWIR+T1 input generally yielded good results (clear monzogranite-granite boundary) for the Akebasito intrusion. Only a few pixels in the KI intrusion are misclassified as granite and monzogranite when VNIR-SWIR+T1 were used as the input. Most of the pixels are misclassified as biotite granite (with SWIR+T1 input) in the Hongshan intrusion, whereas performance with VNIR-SWIR+T1 input is good. Meanwhile, the AlexNet model (with Landsat8 VNIR-SWIR+T1) input achieves the highest overall weighted F1 score of 76.06% and a kappa coefficient of 0.71, which are much lower than those of the ASTER data.
The weighted F1 score accuracy results of granitoid subclasses based on the AlexNet model (using both ASTER and Landsat8 images) are given in Table 5. The comparison reveals that ASTER images (with VNIR-SWIR+T1 input) for the AlexNet model perform the best, with the highest weighted F1 score for alkali granite, biotite granite, granite, granite-granodiorite, and plagiogranite. Meanwhile, the model using SWIR+T1 (from ASTER image) as input achieves the highest classification accuracy only for monzogranite (80.42%). For the model with SWIR+T1 and VNIR-SWIR+T1 (from Landsat8 image) input, the classification accuracy of each granitoid subclass is lower than that of ASTER image. The classification results using SWIR+T1 are the worst, with all F1 scores below 32%. This may be attributed to the limited information provided by only two Landsat8 SWIR bands. The AlexNet model (with VNIR-SWIR + T1 input) yielded the best (except for monzogranite) lithological identification for the Western Junggar granitoids, regardless of using ASTER or Landsat8 data.
6.2. Granitoid Mapping and Mineralization Relation
Paleozoic mineralization in the Western Junggar Orogen occurred mainly in the Late Devonian-Early Permian (290-390 Ma). In the Late Devonian, the mineralization was associated with mafic-ultramafic rocks, intermediate-felsic plutons [43-44, 57]. The NE-trending Darbut Fault is the boundary fault along the northwestern margin of the Junggar Basin. The formed complex transpressional tectonic pattern controlled the emplacement of regional granitoids and ophiolites in the Western Junggar Orogen [28, 38, 58]. Our remote sensing identification results (Figure 10) show that the local distribution of granitoid subclasses is uneven: alkali granite is concentrated in the Hongshan and KI intrusions in the northwest, while multi-phase magmatic differentiation (monzogranite, plagiogranite, and biotite granite) occurred mainly in the Akebasito and KII and KIII intrusions. Existing geochronological and geochemical research suggests that the mineralization in the Western Junggar region is directly related to the emplacement of these granitoids. At ~318 Ma, the intrusion of subduction-related I-type granites was interpreted to be closely gold ore related [40], such as the Hongshan pluton and its related quartz vein and magmatic-hydrothermal gold mineralization. Alkali granite in the Hongshan pluton can be clearly identified in the lithological mapping based on the AlexNet model, providing good spatial reference information for gold deposits. At ~313 Ma, adakitic/adakite-like plutons (which had undergone the mixing of mantle-derived and crust-derived magmas) are associated with Porphyry Cu-Au mineralization [44, 59]. The adakitic/adakite-like monzogranite in the KIII intrusion is clearly identified in our lithological mapping, and is spatially associated with the local gold occurrence. At ~296 Ma, A-type granites in the Western Junggar Orogen are essentially ore barren, although they may have modified the existing Cu-Au orebodies due to provide essential heat for the alteration [27, 32]. Among the granitoid subclasses identified by our AlexNet model, including those in the Akebasito and KI and KII intrusions, all correspond spatially to A-type granites. This indicates that the AlexNet model with different band combinations can create more detailed spatial distinction for the various granitoid subclasses, which provides important spatial information reference for exploring large-scale polymetallic mineralization in the Western Junggar Orogen.
Furthermore, influenced by the India-Asia collision, the reactivated Darbut strike-slip fault structure has predominantly controlled partial melting of the upper crust in the Western Junggar area since the Carboniferous, generating magma sources and leading to widespread intrusions of granitoids and ophiolite [34, 58, 60]. As shown in Figure 10, the Darbut strike-slip fault and its secondary thrust faults have controlled the local granitoid emplacement. The Akebasito and Hongshan intrusions are essentially ore barren, except for a small Mo deposit on the eastern side of the Hongshan intrusion. In contrast, substantial Cu-Au-Mo mineralization anomalies are observed in the northwestern part of Hongshan intrusion, the monzogranite in the KIII intrusion, and the eastern margin of the KI intrusion. These areas are adjacent to the secondary faults with local granitoid stock exposure. This suggests that ore fluids in the Western Junggar region likely migrate through faults during or shortly after the magma emplacement, and reacted with wallrocks to deposit the ores. For the Cu-Au prospecting application of remote sensing lithological mapping in the Western Junggar Orogen, future research should further integrate detailed spatial mapping of lithological subclasses (esp. younger, more fractionated granitoids) with secondary fault structures.
7. Conclusions
(1) Among the CNN models evaluated (GoogLeNet, VGG16, and AlexNet), AlexNet performs the best in identifying granite subtypes in the Western Junggar region. The highest classification accuracy is achieved using a combination of VNIR-SWIR spectral domains and texture feature bands (9B+T1) as input data, with the weighted F1 score and kappa coefficient reaching 91.98% and 0.84, respectively.
(2) CNN models using Landsat 8 images perform poorly across various input layers. This may be attributed to the fact that granite spectral features are primarily concentrated in the SWIR spectral domain, whereas Landsat 8 imagery includes only two SWIR bands.
(3) The results have distinguished the Cu-Au-mineralized, subduction-related I-type granodiorite of the KIII intrusion. The results suggest that the AlexNet model (using different band combinations) can provide detailed spatial distribution characteristics of granite subtypes. Our study offers remote sensing exploration methods and spatial information for exploring large-scale polymetallic mineralization in the Western Junggar Orogen.
Funding
This work was supported by the Natural Science Foundation of China (Grant No. 41802244).
References
- Chen J. F., Han B. F., Ji J. Q., Zhang L., Xu Z., He G. Q., Wang T. Zircon U-Pb ages and tectonic implications of Paleozoic plutons in northern West Junggar, North Xinjiang, China. Lithos, 2010, 115(1-4): 137-152 . [CrossRef]
- Jin C. W., Zhang X. Q. Age and genesis of granitoids in Western Junggar, Xinjiang. Scientia Geol. Sin., 1993, 28(1): 28-36.
- Wei S. N., Zhu Y. F. Petrology, geochronology and geochemistry of intermediate-acidic intrusins in Baogutu are, West Junggar, Xinjiang. Acta Petrol. Sin., 2015, 31(1): 143-160.
- Yin J. Y., Yuan C., Sun M., Xiao W. J., Zhao G. C., Long X. P., Gen H. Y., Wang B.Y. Sanukitic dykes in West Junggar, Xinjiang: Geochemical features, petrogenesis and links to Cu-Au mineralization. Geochimica, 2009, 38: 413-423.
- Huang P. H., Wang X. Y., Chen X. H., Wag Z. H. Late Paleozoic Granitic Magmatism in West Junggar Metallogenic Belt (Xinjiang), Central Asia, and its Tectonic Implication. Geotecton. Metallog., 2016, 40(1): 145-160.
- Liu H. T., Zhang Q., Liu J. M., Ye J., Zeng Q. D., Yu C. M. Adakite versus porphyry copper and epithermal gold deposits: a possible metallogenetic specialization of magmatism required in-deep assessment. Acta Petrol. Sin., 2004, 20(2): 205-218.
- Chauhan, D. S., Shankar, B., Chauhan R., and Kesari G. K. Petrogenesis and mineralization potential of Bhilangana granitoid, Bhilangana Valley, Garhwal Himalaya, India. J. Earth Syst. Sci., 2024, 133:65. [CrossRef]
- Rowan L. C., Mars J. C. Lithologic mapping in the Mountain Pass, California area using Advanced Spaceborne Spaceborne Thermal Emission and Reflection Radiometer. (ASTER) multispectral thermal infrared “radiance-at-sensor” data. Remote Sens. Environ., 2003, 84: 350-366.
- Zheng S., Fu B. H. Lithological mapping of granitiods in the western Junggar from ASTER SWIR-TIR multispectral data: Case study in Karamay pluton, Xinjiang. Acta Petrol. Sin., 2013, 29(8): 2936-2948.
- Breiman L. Random Forests. Mach. Learn., 2001, 45: 5-32.
- Cheng K. Y., Rong L., Jiang S. L., Zhan Y. Z. Overview of Methods for Remote Sensing Image Super-resolution Reconstruction Based on Deep Learning. J. Zhengzhou Univ. (Eng. Sci.), 2022, 05-0008-09.
- Grebby S., Cunningham D., Naden J., Tansey K. Lithological mapping of the Troodos ophiolite, Cyprus, using airborne LiDAR topographic data. Remote Sens. Environ., 2010, 114(4): 713-724.
- Latifovic R., Pouliot D., Campbell J. Assessment of Convolution Neural Networks for Surficial Geology Mapping in the South Rae Geological Region, Northwest Territories, Canada. Remote Sens., 2018, 10: 307.
- Alzubaidi F., Mostaghimi P., Swietojanski P., Clark S. R., Armstrong R. T. Automated lithology classification from drill core images using convolutional neural networks. J. Pet. Sci. Eng., 2021, 197:107933.
- Shirmard H., Farahbakhsh E., Heidari E., Pour A. B., Pradhan B., Muller D., Chandra R. A Comparative Study of Convolutional Neural Networks and Conventional Machine Learning Models for Lithological Mapping Using Remote Sensing Data. Remote Sens., 2022, 14(4): 819.
- Bertoldi L., Massironi M., Visonà D., Carosi R., Montomoli C., Gubert F., Naletto G., Pelizzo M. G. Mapping the Buraburi granite in the Himalaya of Western Nepal: Remote sensing analysis in a collisional belt with vegetation cover and extreme variation of topography. Remote Sens. Environ., 2011, 115(5): 1129-1144.
- Watts D. R., Harris N. B. W. Mapping granite and gneiss in domes along the North Himalayan antiform with ASTER SWIR band ratios. Geol. Soc. Am. Bull., 2005, 117(7-8):879-886.
- Ye B., Tian S., Cheng Q., Ge Y. Application of Lithological Mapping Based on Advanced Hyperspectral Imager (AHSI) Imagery Onboard Gaofen-5 (GF-5) Satellite. Remote Sens., 2020, 12, 3990.
- Ge W., Cheng Q., Jing L., Armenakis C., Ding H. Lithological discrimination using ASTER and Sentinel-2A in the Shibanjing ophiolite complex of Beishan orogenic in Inner Mongolia, China. Adv. Space Res., 2018, 62: 1702-1716.
- Jiang M., Lin Y., Huang Z. Q. Lithological mapping in the Eastern Section of Gangdise, Tibet using ASTER and field spectroscopy data. 2013 IEEE IGARSS., 2013, 2935-2938.
- Zheng S. Lithological identification and extraction of granitiods from ASTER multispectral data-Case study in granitiod intrusions, the Western Junggar, Xinjiang, (Master’s thsis). Anhui Norm. Univ., 2012.
- Zheng S., An Y. F., Shi P. L., Zhao T. Mapping the Lithological Features and Ore-Controlling Structures Related to Ni-Cu Mineralization in the Eastern Tian Shan, NW China from ASTER Data. Remote Sens., 2021, 13, 206.
- Wang Z. Y., Zuo R. G., Dong Y. Mapping of Himalaya Leucogranites Based on ASTER and Sentinel-2A Datasets Using a Hybrid Method of Metric Learning and Random Forest. IEEE J-STARS, 2020, 13: 1925-1936.
- Zhou Y. R., Zheng S., An Y. F., Chunkit L. ASTER VNIR-SWIR Based Lithological Mapping of Granitoids in the Western Junggar Orogen (NW Xinjiang): Improved Inputs to Random Forest Method. Earth Space Sci., 2023,10:1029.
- Yakubchuk A. Architecture and mineral deposit settings of the Altaid orogenic collage: a revised model. J. Asian Earth Sci., 2004, 23:761-779.
- Yakubchuk A. Re-deciphering the tectonic jigsaw puzzle of northern Eurasia. J. Asian Earth Sci., 2008, 32: 82-101.
- Shen P., Shen Y., Wang J., Zhu H., Wang L., Meng L. Methane-rich fluid evolution of the Baogutu porphyry Cu-Mo-Au deposit, Xinjiang, NW China. Chem. Geol., 2010, 275: 78-98.
- Xiao W. J. Santosh M. The western Central Asian Orogenic Belt: A window to accretionary orogenesis and continental growth. Gondwana Res., 2014, 25(4): 1429-1444.
- Xiao W. J., Han C. M., Yuan C., Sun M., Lin S. F., Chen H. L., Li Z. L., Li J. L., Sun S. Middle Cambrian to Permian subduction-related accretionary orogenesis of Northern Xinjiang, NW China: Implications for the tectonic evolution of central Asia. J. Asian Earth Sci., 2006, 32(2-4): 102-117.
- Tang G. J., Wang Q., Wyman D. A., Li Z. X., Xu Y. G., Zhao Z. H. Recycling oceanic crust for continental crustal growth: Sr–Nd–Hf isotope evidence from granitoids in the western Junggar region, NW China. Lithos, 2012, 128-131: 73-83.
- Geng H.Y., Sun M., Yuan C., Xiao W.J., Zhao G.C., Zhang L.F., Wong K., Wu F.Y. Geochemical, Sr-Nd and zircon U-Pb-Hf isotopic studies of Late Carboniferous magmatism in the West Junggar, Xinjiang: Implications for ridge subduction? Chem. Geol., 2009, 266: 364-389.
- Shen P., Shen Y. C., Pan H. D., Li X. H., Dong L. H., Wang J. B., Zhu H. P., Dai H. W., Guan W. N. Geochronology and isotope geochemistry of the Baogutu porphyry copper deposit in the West Junggar region, Xinjiang, China. J. Asian Earth Sci., 2012, 49: 99-115.
- Yang G. X., Li Y. J., Gu P. Y., Yang B. K., Tong, L. L., Zhang H. W. Geochronological and geochemical study of the Darbut Ophiolitic Complex in the West Junggar (NW China): Implications for petrogenesis and tectonic evolution. Gondwana Res., 2012, 21(4): 1037-1049.
- Zhang P., Wang G., Polat A., Zhu C., Shen T., Chen Y., Chen C., Guo J., Wu G., Liu Y. Emplacement of the ophiolitic mélanges in the west Karamay area: Implications for the Late Paleozoic tectonic evolution of West Junggar, north Western China. Tectonophysics, 2018, 747-748: 259-280.
- Xu S., Chen X., Li T., Shi J., Ding W., Li B., Huang P., Zhang Y., Zhang Y., Ma F. The Late Carboniferous–Early Permian Ocean-Continent Transition in the West Junggar, Central Asian Orogenic Belt: Constraints from Columnar Jointed Rhyolite. Acta Geologica Sinica (English Edition), 2019, 93(2): 265-282.
- Zhang J., Xiao W., Luo J., Chen Y., Windley B. F., Song D., Han C., Safonova I. Collision of the Tacheng block with the Mayile-Barleik-Tangbale accretionary complex in Western Junggar, NW China: Implication for Early-Middle Paleozoic architecture of the western Altaids. J. Asian Earth Sci., 2018, 159: 259-278.
- Chen S. D., Wang G. R., Yang, S. D., Jin, J. S., Zhu, J. S. The ancient plate tectonics in Xinjiang. Xinjiang Geol., 1986, 4(2): 1-26.
- Duan F., Li Y., Zhi Q., Yang G., Lai C. K., Xiao H., Lindagato P., Wan Y., Ren Y. Magmatism and Cu-Au-Mo mineralization of the Darbut tectono-magmatic zone in West Junggar (Xinjiang), NW China: An updated review. Geol. J., 2018, 53(S2): 293-302.
- Shen P., Pan H. D., Hattori K., Cooke D. R., Seitmuratova E. Large Paleozoic and Mesozoic porphyry deposits in the Central Asian Orogenic Belt: Geodynamic settings, magmatic sources, and genetic models. Gondwana Res., 2018, 58: 161-194.
- Shen P., Zhai M. G., Li G. M., Zhao J. X., Zeng Q. D., Gao J., Xiao W. J., Li J. L., Sun S. Au-cu-mo mineralization in Western Junggar, Xinjiang. Beijing Sci. Press, 2015, 6: 175-190.
- Shen Y. C., and Jin, C. W. Magmatic activity and gold mineralization in Western Junggar area. Beijing: Sci. Press, 1993.
- Xiao F., Xu C. Y., Zhang F. J., Lin C. X. Major breakthrough in the Hatu gold deposit, Western Junggar, Xinjiang. Xinjiang Geol., 2010, 28(4): 409-412.
- Gu P. Y., Li Y. J., Zhang B., Tong L. L., Wang J. N. LA-ICP-MS zircon U-Pb dating of gabbro in the Darbut ophiolite, western Junggar, China. Acta Petrol. Sin., 2009, 25: 1364-1372.
- Shen P., Shen Y. C., Pan H. D., Li X. H., Dong L. H., Wang J. B., Zhu H. P., Dai H. W., Guan W. N. Geochronology and isotope geochemistry of the Baogutu porphyry copper deposit in the West Junggar region, Xinjiang, China. J. Asian Earth Sci., 2012, 49: 99-115.
- Huang, P. H., Chen, X. H., Wang, Z. H., Ye, B. Y., Li, X. X., Yang, Y. Late Paleozoic granitic magmatism in West Junggar metal logenic belt (Xinjiang), central Asia, and its tectonic implication. Geotecton. Metallog., 2016, 40(1):145-160.
- Ninomiya Y., Fu B., Cudahy T. J. Detecting lithology with Advanced Spaceborne Thermal Emission and Reflection Radiometer(ASTER)multispectral thermal infrared “radiance-at-sensor” data. Remote Sens. Environ., 2005, 99: 127-139.
- Abrams, M., Yamaguchi, Y. Twenty Years of ASTER Contributions to Lithologic Mapping and Mineral Exploration. Remote Sens., 2019, 1394.
- Amer R., El Mezayen A. A., Hasanein M. ASTER spectral analysis for alteration minerals associated with gold mineralization. Ore Geol. Rev., 2016, 75: 239-251.
- Ninomiya Y., Fu B. H. Thermal infrared multispectral remote sensing of lithology and mineralogy based on spectral properties of materials. Ore Geol. Rev., 2019, 108: 54-72.
- Chica-Olmo M., Abarca-Hernandez F. Computing geostatistical image texture for remotely sensed data classication. Comput. Geosci., 2000, 26: 373-383.
- Haralick R. M., Shanmugam K., Dinstein, I. H. Textural Features for Image Classification. IEEE Trans. Syst. Man. Cyber., 1973, SMC-3(6): 610-621.
- Krizhevsky A., Sutskever I., Hinton G. E. ImageNet Classification with Deep Convolutional Neural Networks. Int. Conf. Neural Inf. Proc. Syst., 2017, 60(6): 84-90.
- Szegedy C., Liu W., Jia Y. Q. Going Deeper with Convolutions. Proc. IEEE Conf. Comput. vision and pattern recognition, 2015, 1-9.
- Simonyan K., Zisserman A. Very deep convolutional networks for large-scale image recognition. Int. Conf. Learning Representations, 2014, 1-9.
- Hunt, G. R. Spectral signatures of particulate minerals in the visible and near infrared. Geophysics, 1977, 42: 501-513.
- Hunt, G. R. Spectra of altered rocks in the visible and near infrared. Econ. Geol., 1979, 74:1613-1629.
- Li W. C., Li J. W., Xie G. Q., Zhang X. F., Liu H. Critical minerals in China: Current status, research focus and resource strategic analysis. Earth Sci. Front., 2022, 29(1): 001-013.
- Lin W.,Sun P.,Xue Z. H., Zhang Z. P. Structural analysis of Late Paleozoic deformation of central Dalabutefault zone, West Junggar, China. Acta Petrol. Sin.,2017, 33(10) : 2987-3001.
- Chen X., Yang N., Ye B., Wang Z., Chen Z., Tectonic System and its Control on Metallogenesis in Western Junggar as Part of the Central Asia Multi-Core Metallogenic System. Geotecton. Metallog., 2011, 35(3): 325-338.
- Chen, S.; Liang, X.; Zhang, Y.; Guo, Z.; Qi, J. Cenozoic Crustally-derived Carbonate-rich Magmatic Rocks in West Junggar, North Xinjiang, Western China: Geochronology, Geochemistry and Tectonic Implications. Acta Geol. Sin. (Engl. Ed.), 2021, 95(4): 1112-1127.
Figure 1.
(a) Schematic tectonic map of the Central Asian Orogenic Belt [27, 39, 40], showing the distributions of major porphyry Cu-Mo deposits; (b) ASTER true color composite map of the Western Junggar Orogen.
Figure 1.
(a) Schematic tectonic map of the Central Asian Orogenic Belt [27, 39, 40], showing the distributions of major porphyry Cu-Mo deposits; (b) ASTER true color composite map of the Western Junggar Orogen.
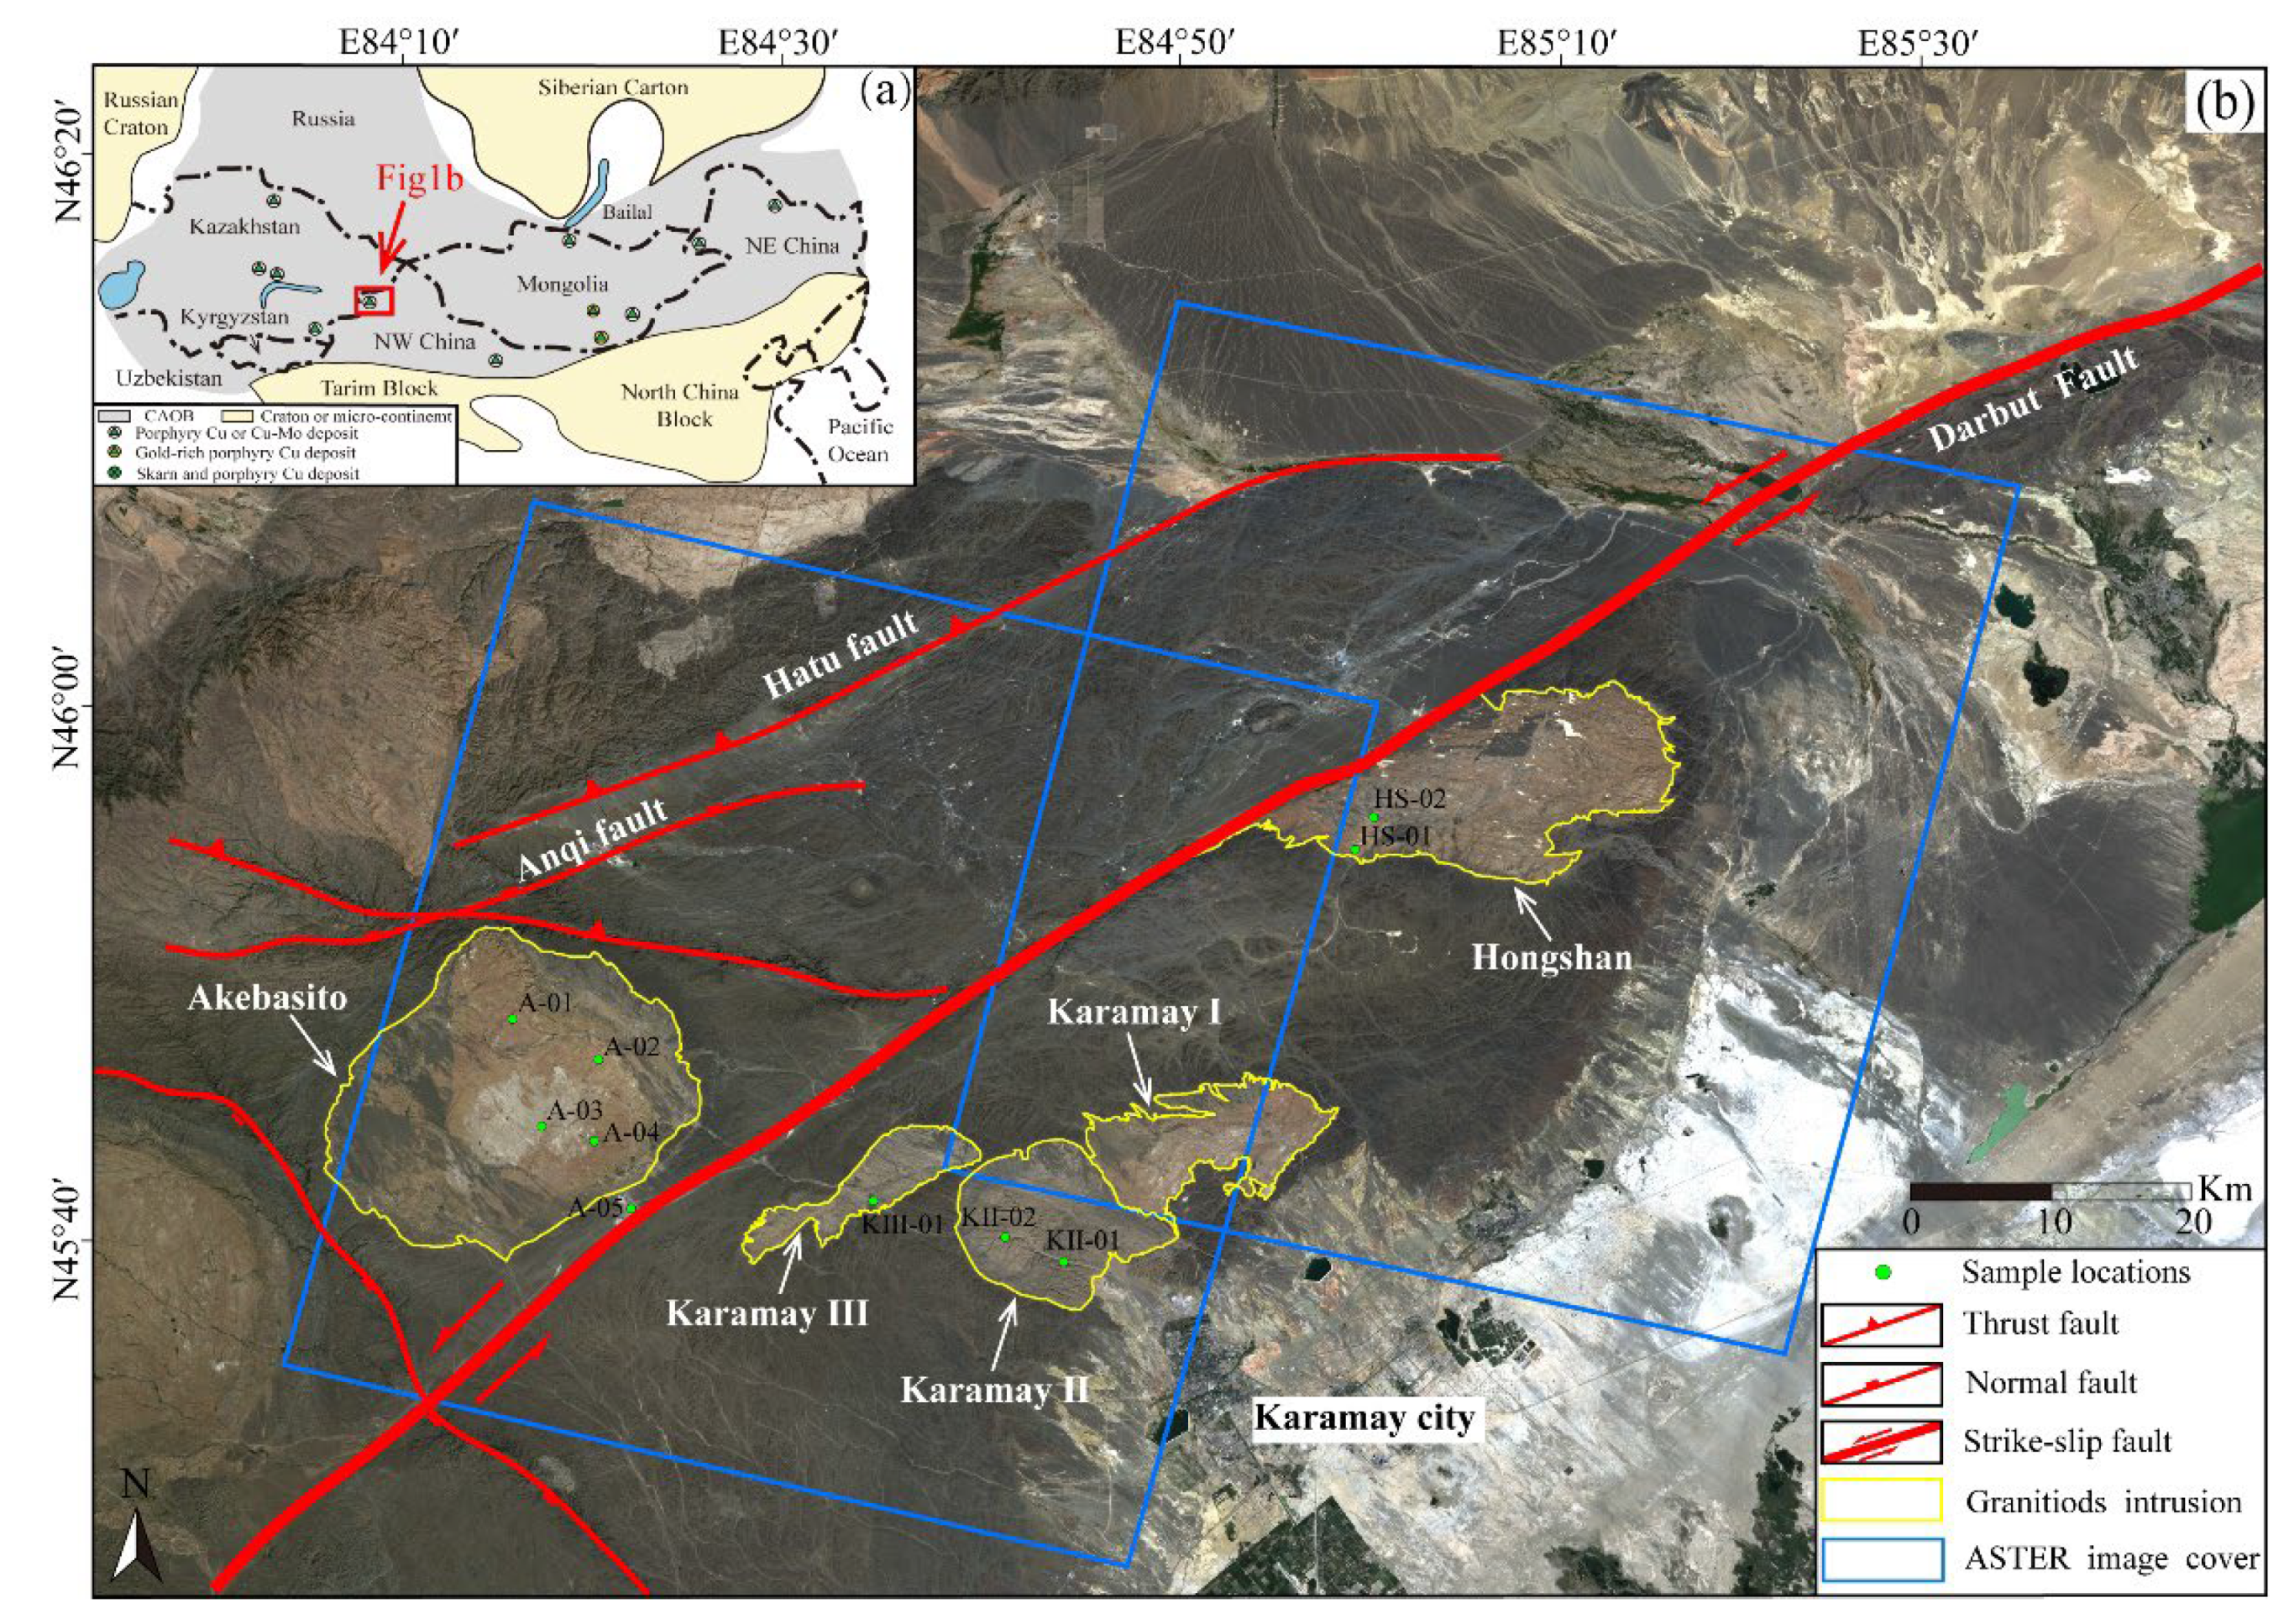
Figure 2.
Flowchart of the AlexNet model.
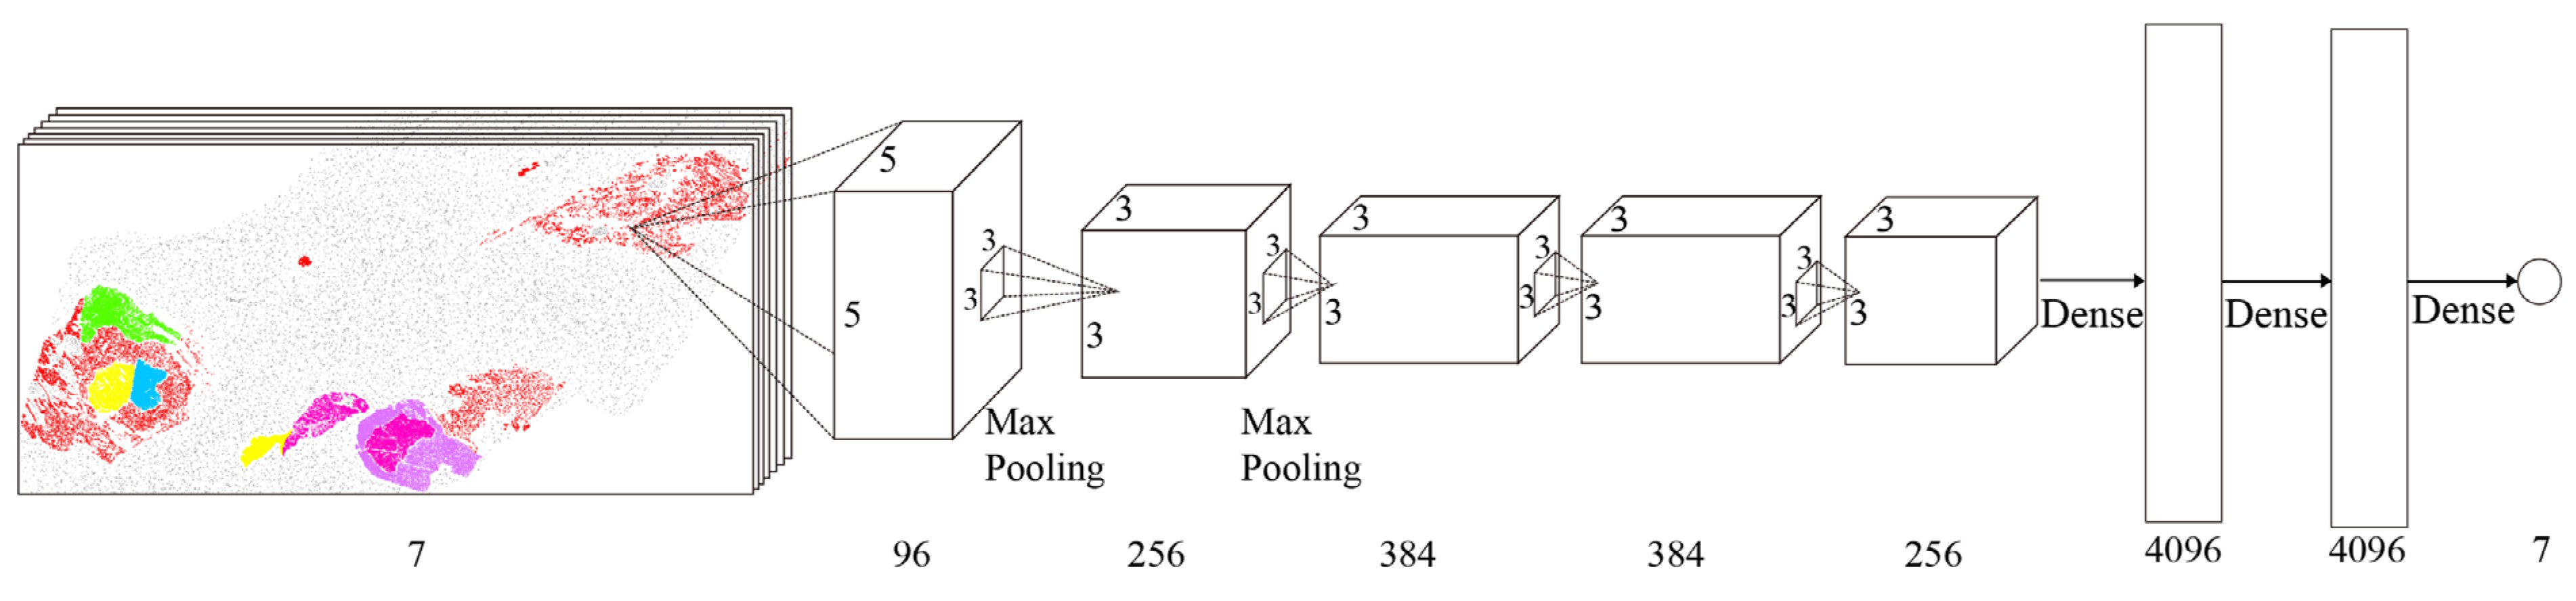
Figure 3.
Reflectance spectra of rock samples from the Western Junggar region (a); Resampled spectra of rock samples to ASTER VNIR-SWIR bands (b); Reflectance spectra of related minerals (from the USGS spectral library) (c); Resampled mineral spectra to ASTER VNIR-SWIR bands (d).
Figure 3.
Reflectance spectra of rock samples from the Western Junggar region (a); Resampled spectra of rock samples to ASTER VNIR-SWIR bands (b); Reflectance spectra of related minerals (from the USGS spectral library) (c); Resampled mineral spectra to ASTER VNIR-SWIR bands (d).
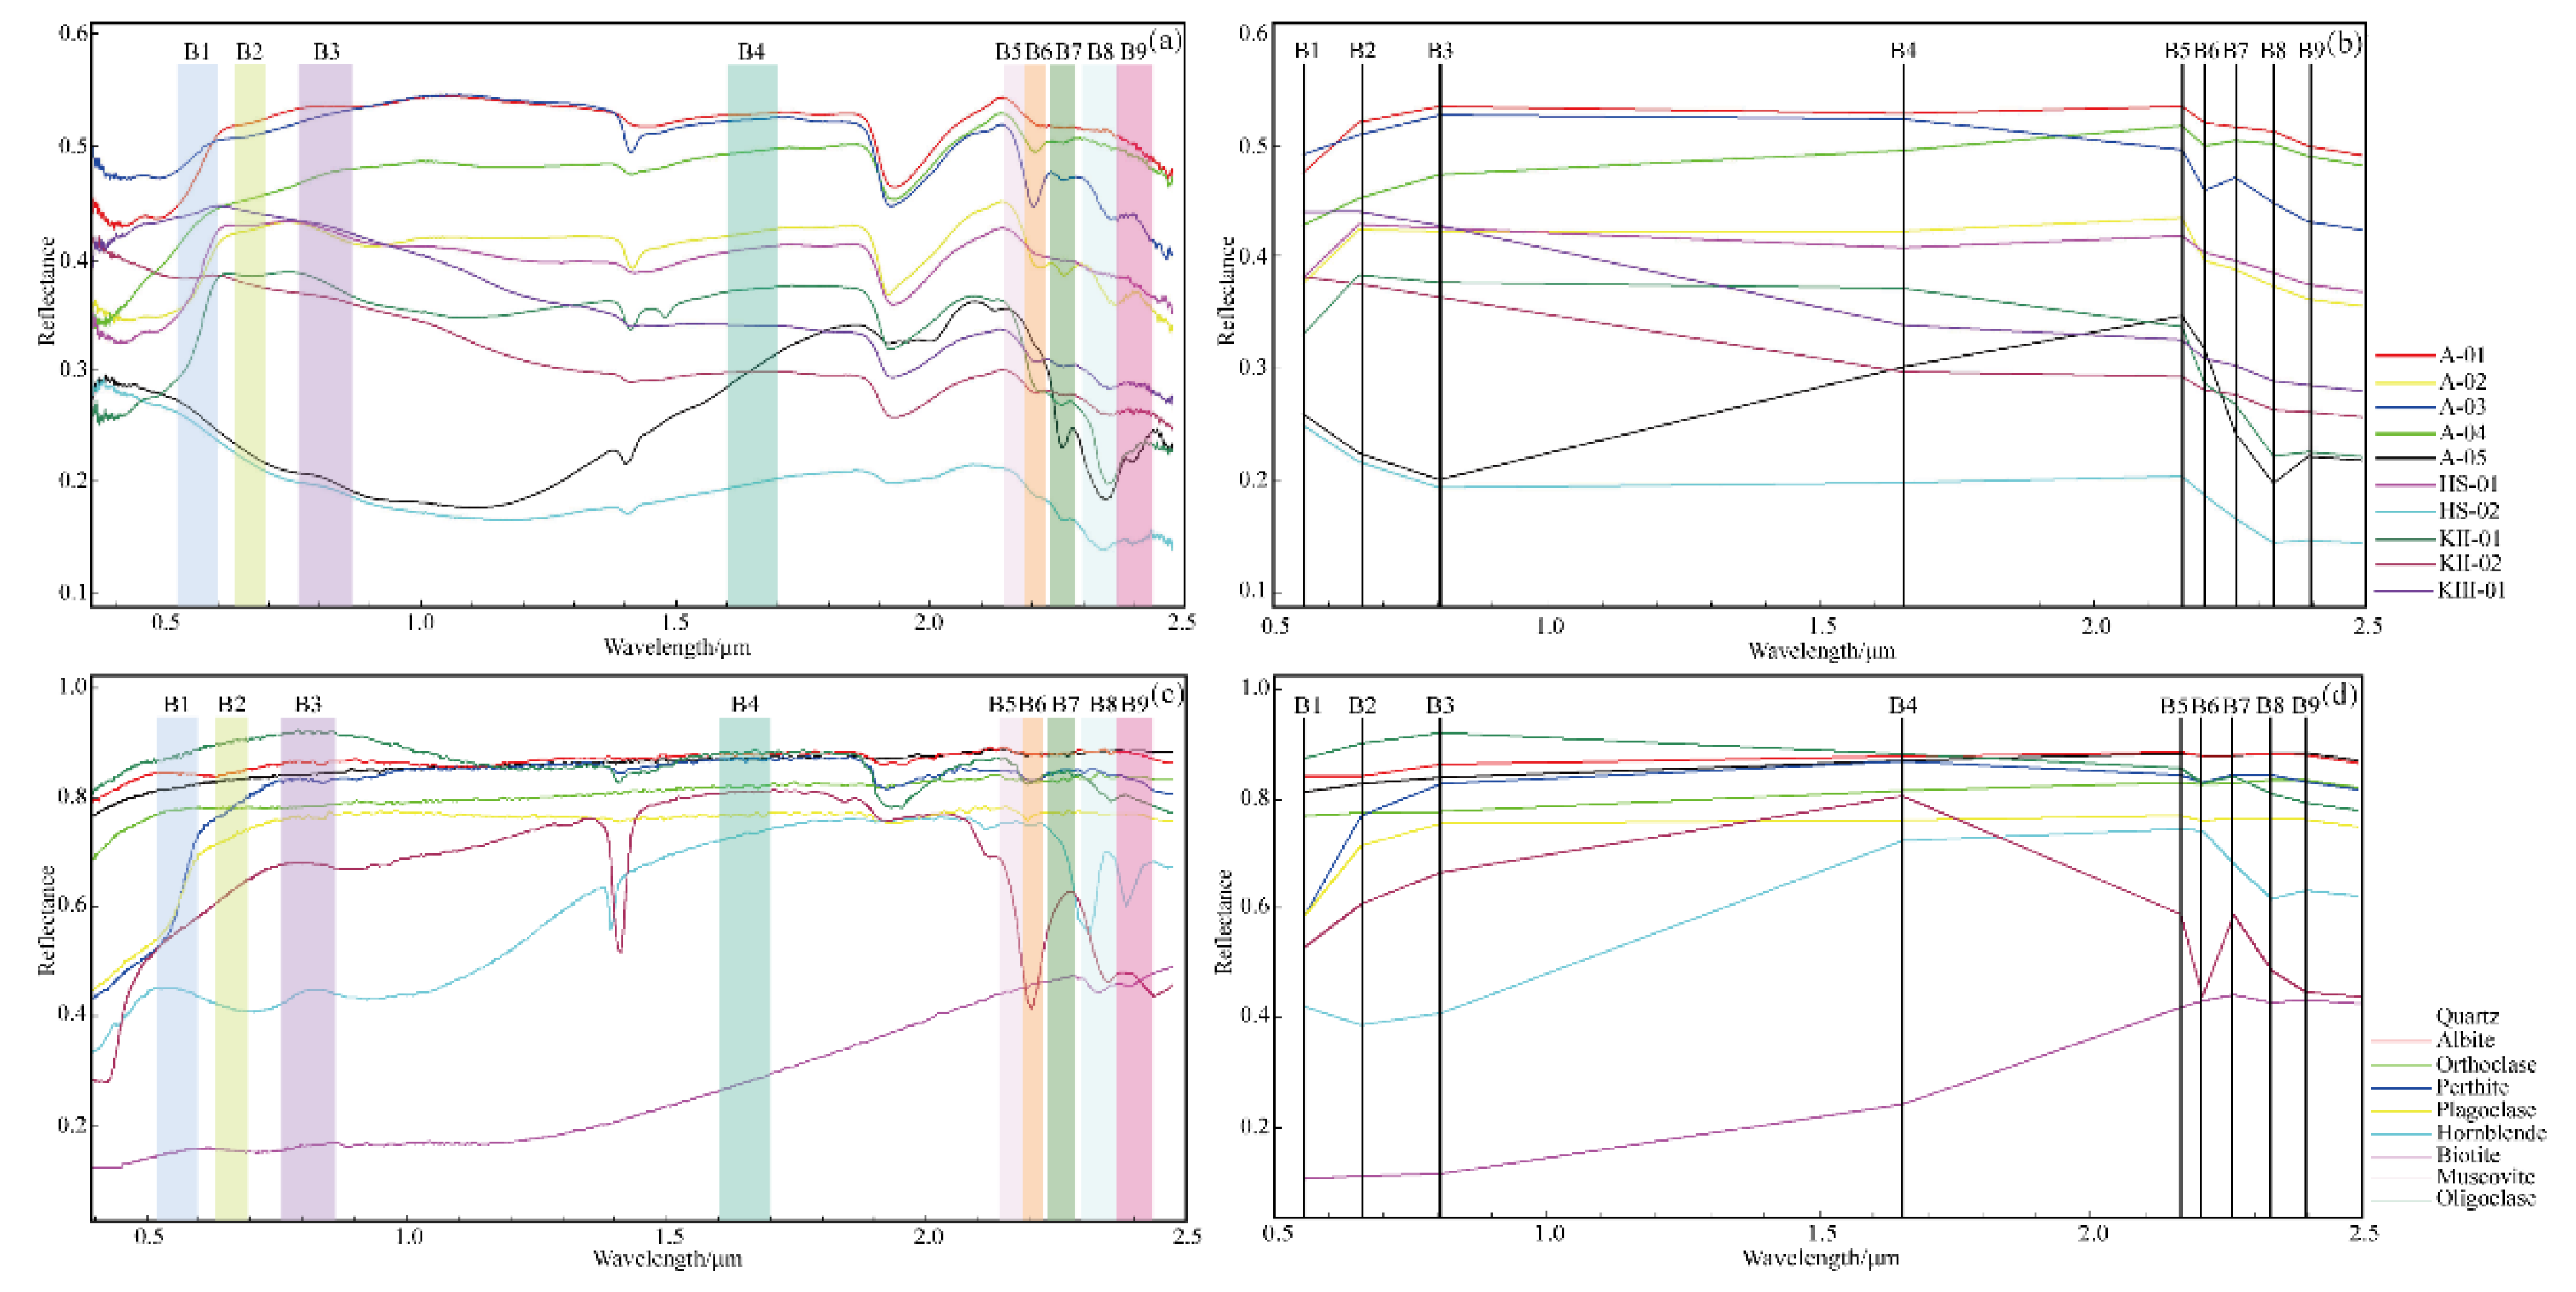
Figure 4.
Microphotographs of granite rock samples from the Western Junggar region: A-02 (a); A-03 (b); A-04 (c); HS-02 (d); KII-01 (e); KIII-01 (f). Abbreviations: Qtz: Quartz; Kfs: K-feldspar; Pl: Plagioclase; Bt: Biotite; Hbl: Hornblende.
Figure 4.
Microphotographs of granite rock samples from the Western Junggar region: A-02 (a); A-03 (b); A-04 (c); HS-02 (d); KII-01 (e); KIII-01 (f). Abbreviations: Qtz: Quartz; Kfs: K-feldspar; Pl: Plagioclase; Bt: Biotite; Hbl: Hornblende.
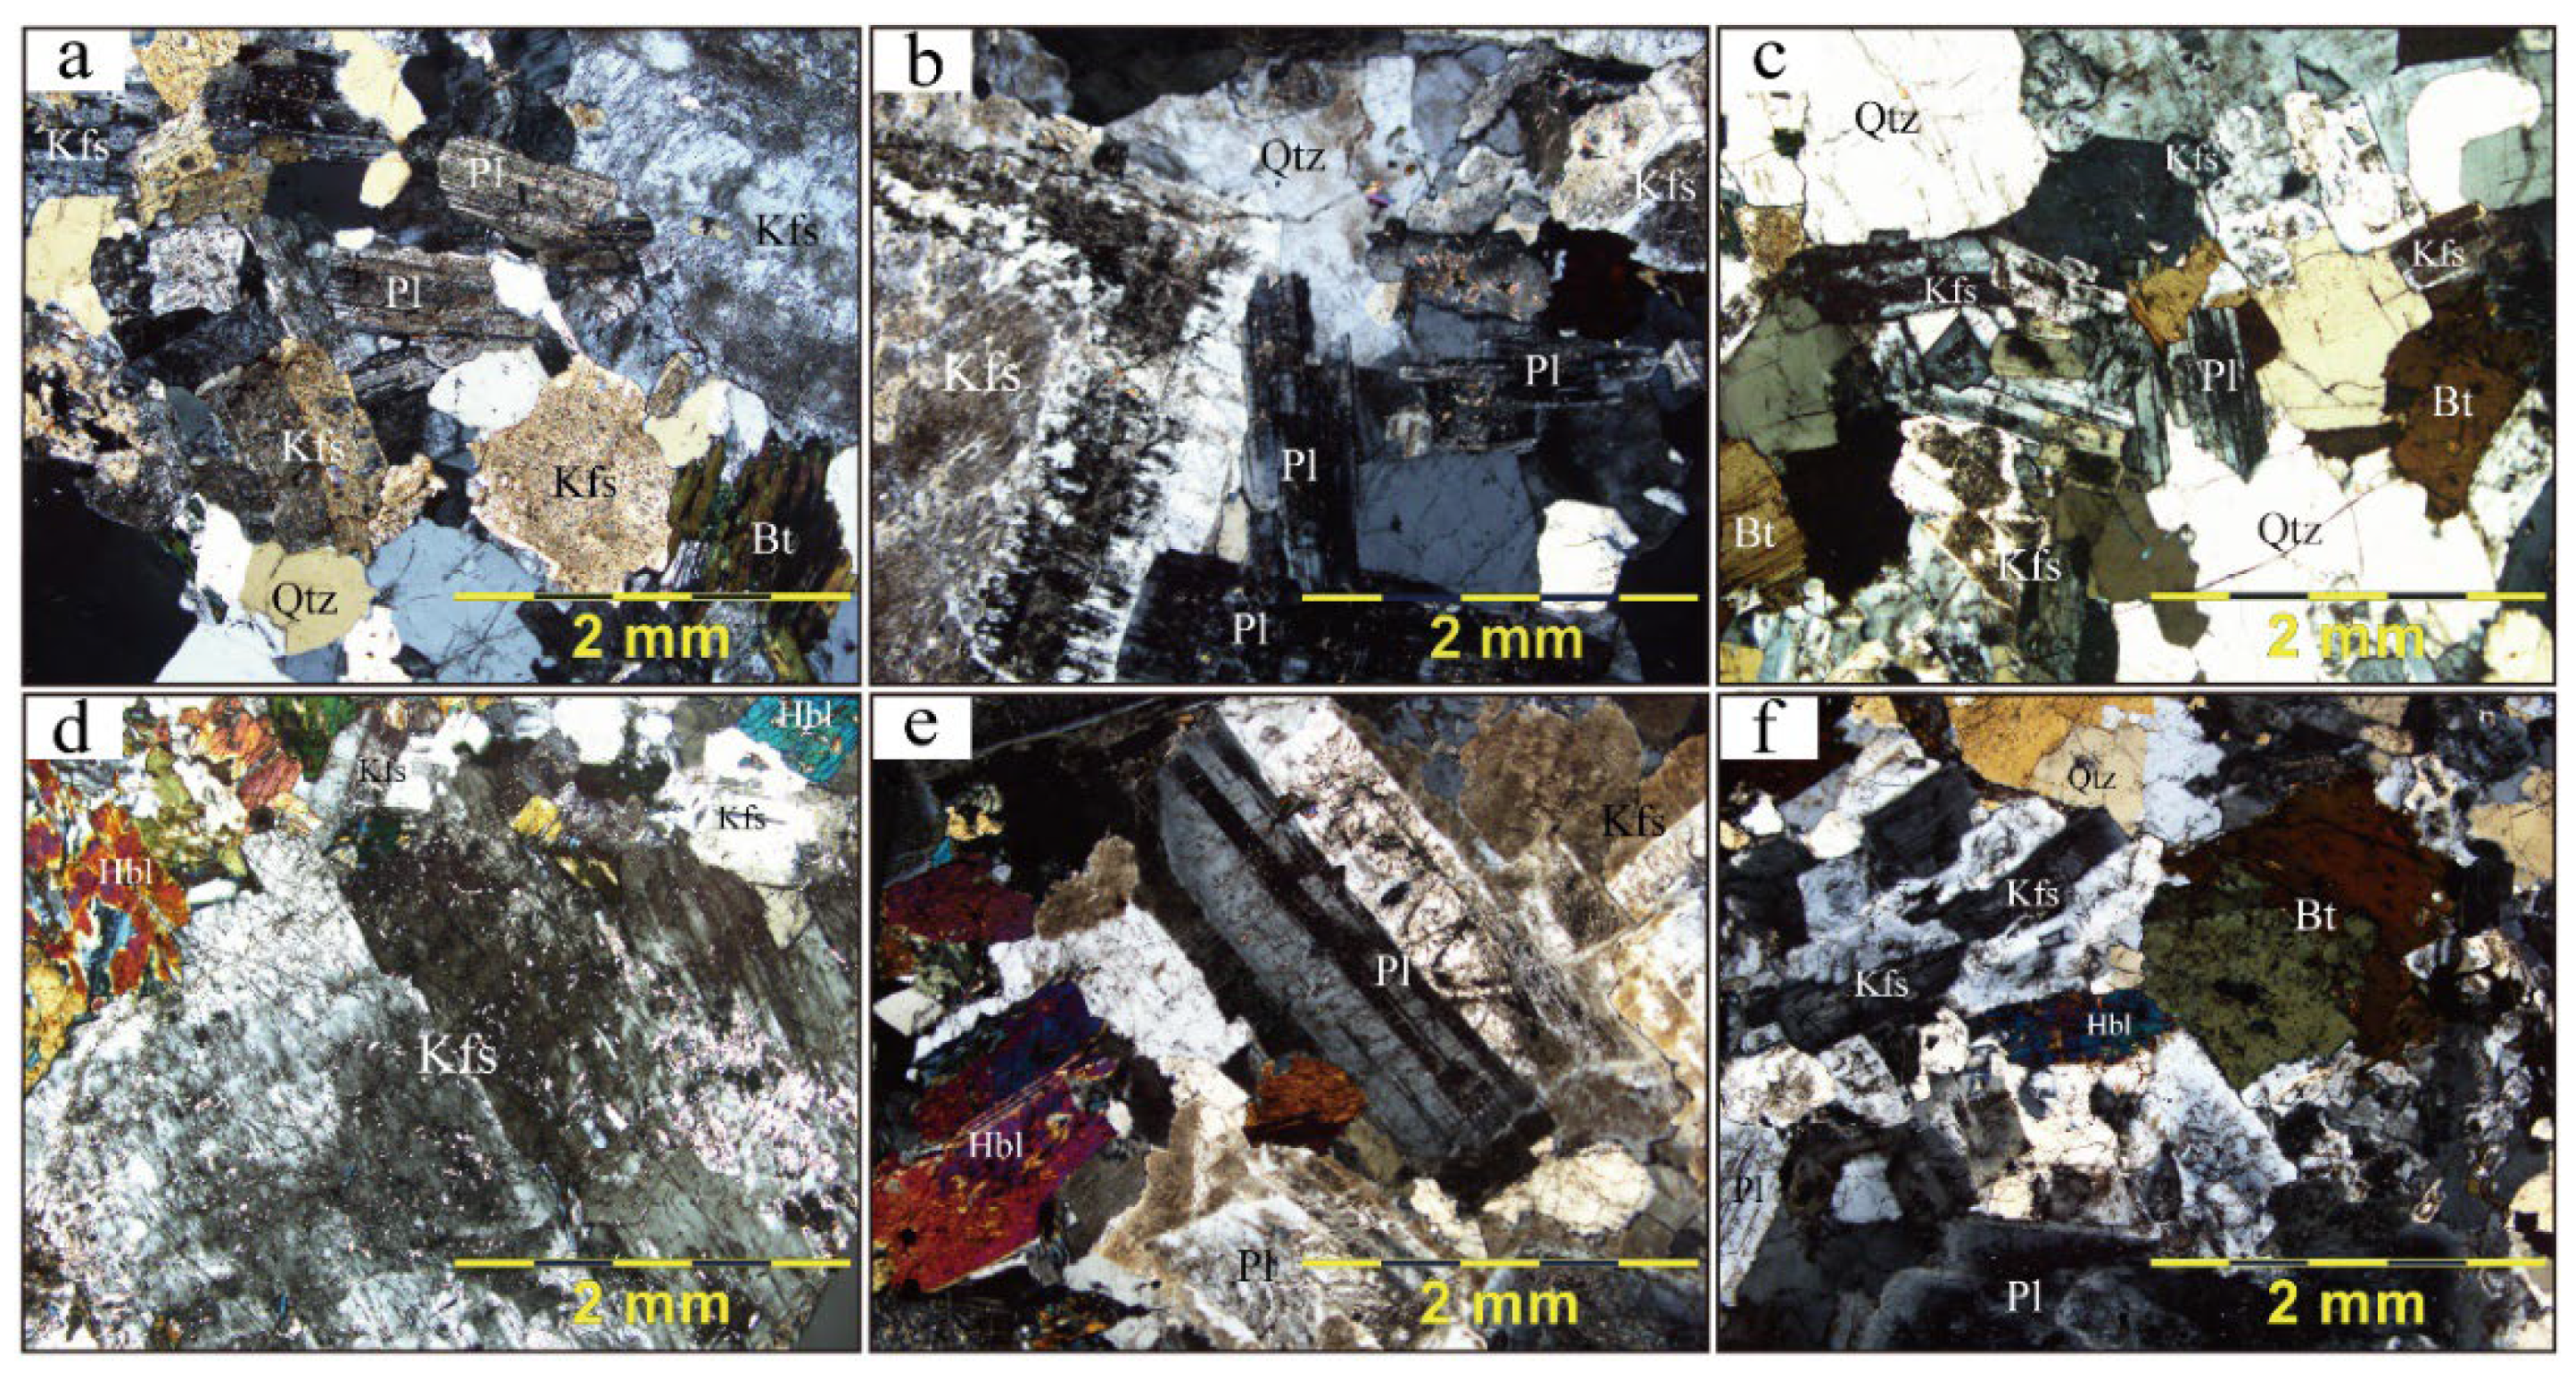
Figure 5.
X-ray diffraction (XRD) patterns of typical granitoid rock samples from the Western Junggar region: A-02 (a); A-03 (b); A-05 (c); HS-01 (d); KII-02 (e); KIII-01 (f); Qtz: Quartz; Kfs: K-Feldspar; Pl: Plagioclase; Bt: Biotite; Px: Pyroxene; Or: Orthoclase; Hbl: Hornblende.
Figure 5.
X-ray diffraction (XRD) patterns of typical granitoid rock samples from the Western Junggar region: A-02 (a); A-03 (b); A-05 (c); HS-01 (d); KII-02 (e); KIII-01 (f); Qtz: Quartz; Kfs: K-Feldspar; Pl: Plagioclase; Bt: Biotite; Px: Pyroxene; Or: Orthoclase; Hbl: Hornblende.
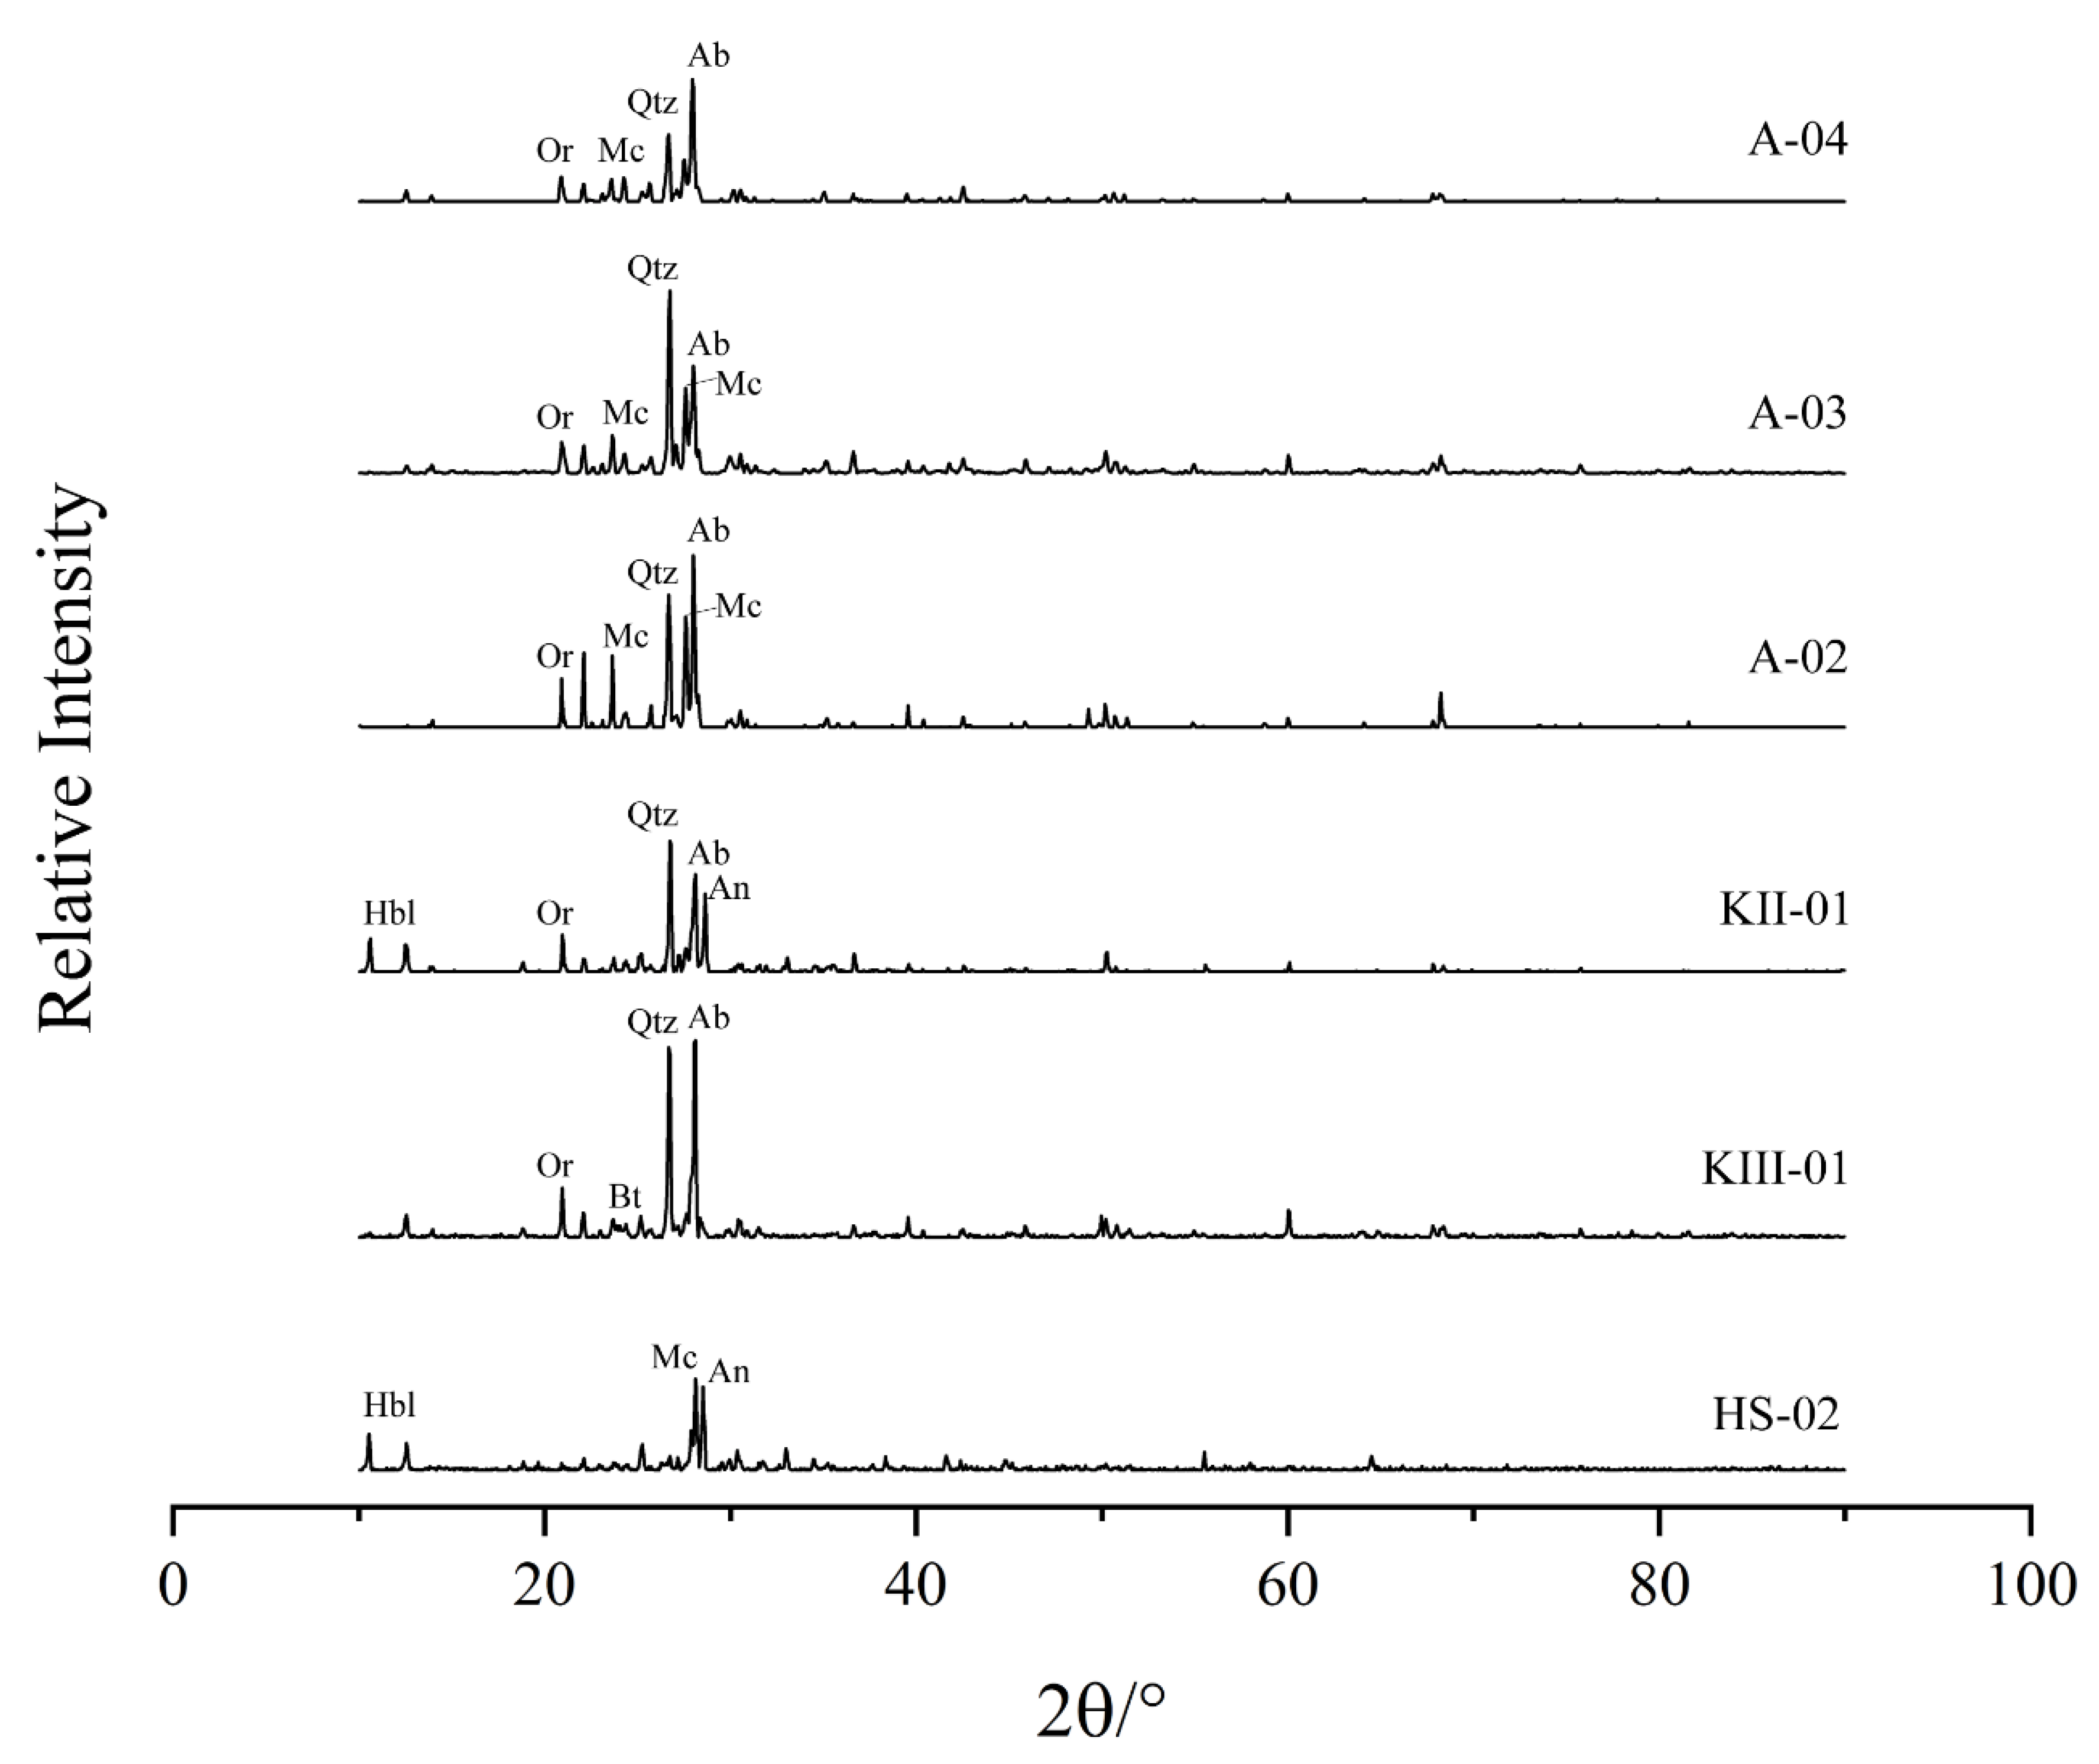
Figure 6.
Lithological mapping using the band combination ASTER image B13567+T1 as input: GoogLeNet (a), VGG16 (b) and AlexNet (c).
Figure 6.
Lithological mapping using the band combination ASTER image B13567+T1 as input: GoogLeNet (a), VGG16 (b) and AlexNet (c).
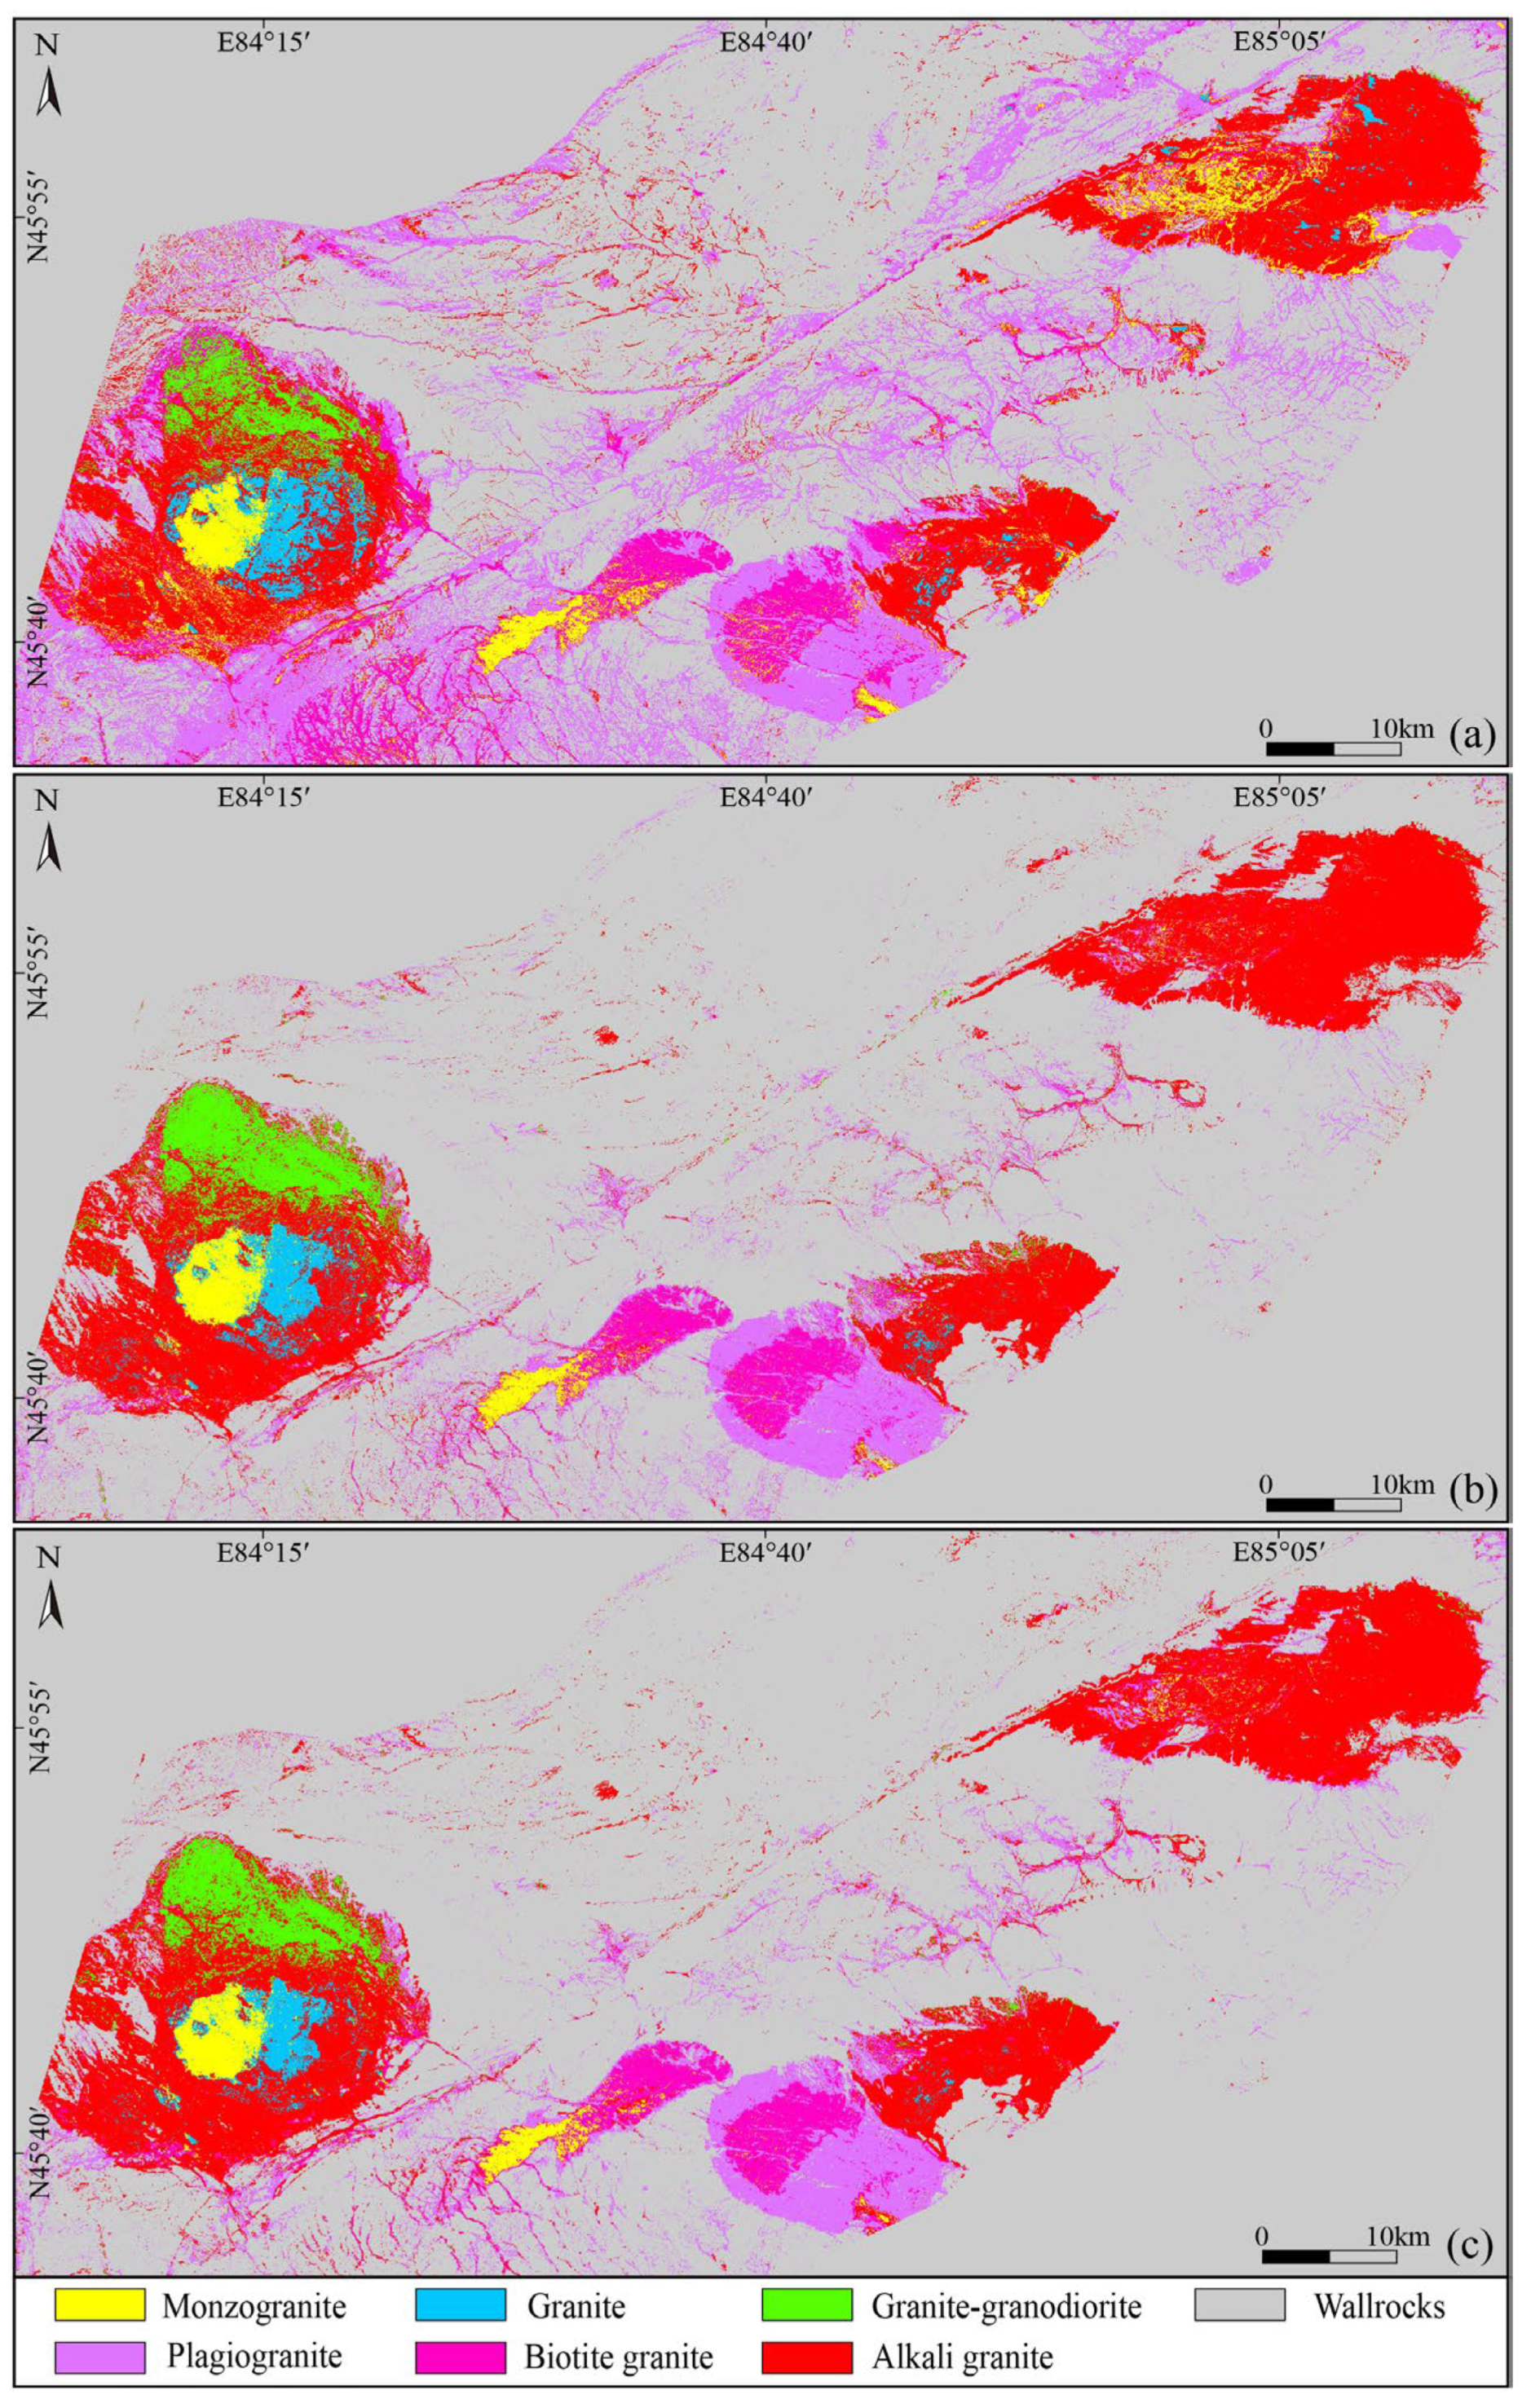
Figure 7.
Lithological mapping with the ASTER image band combination SWIR+T1 as input: (a) GoogLeNet, (b) VGG16, and (c) AlexNet.
Figure 7.
Lithological mapping with the ASTER image band combination SWIR+T1 as input: (a) GoogLeNet, (b) VGG16, and (c) AlexNet.
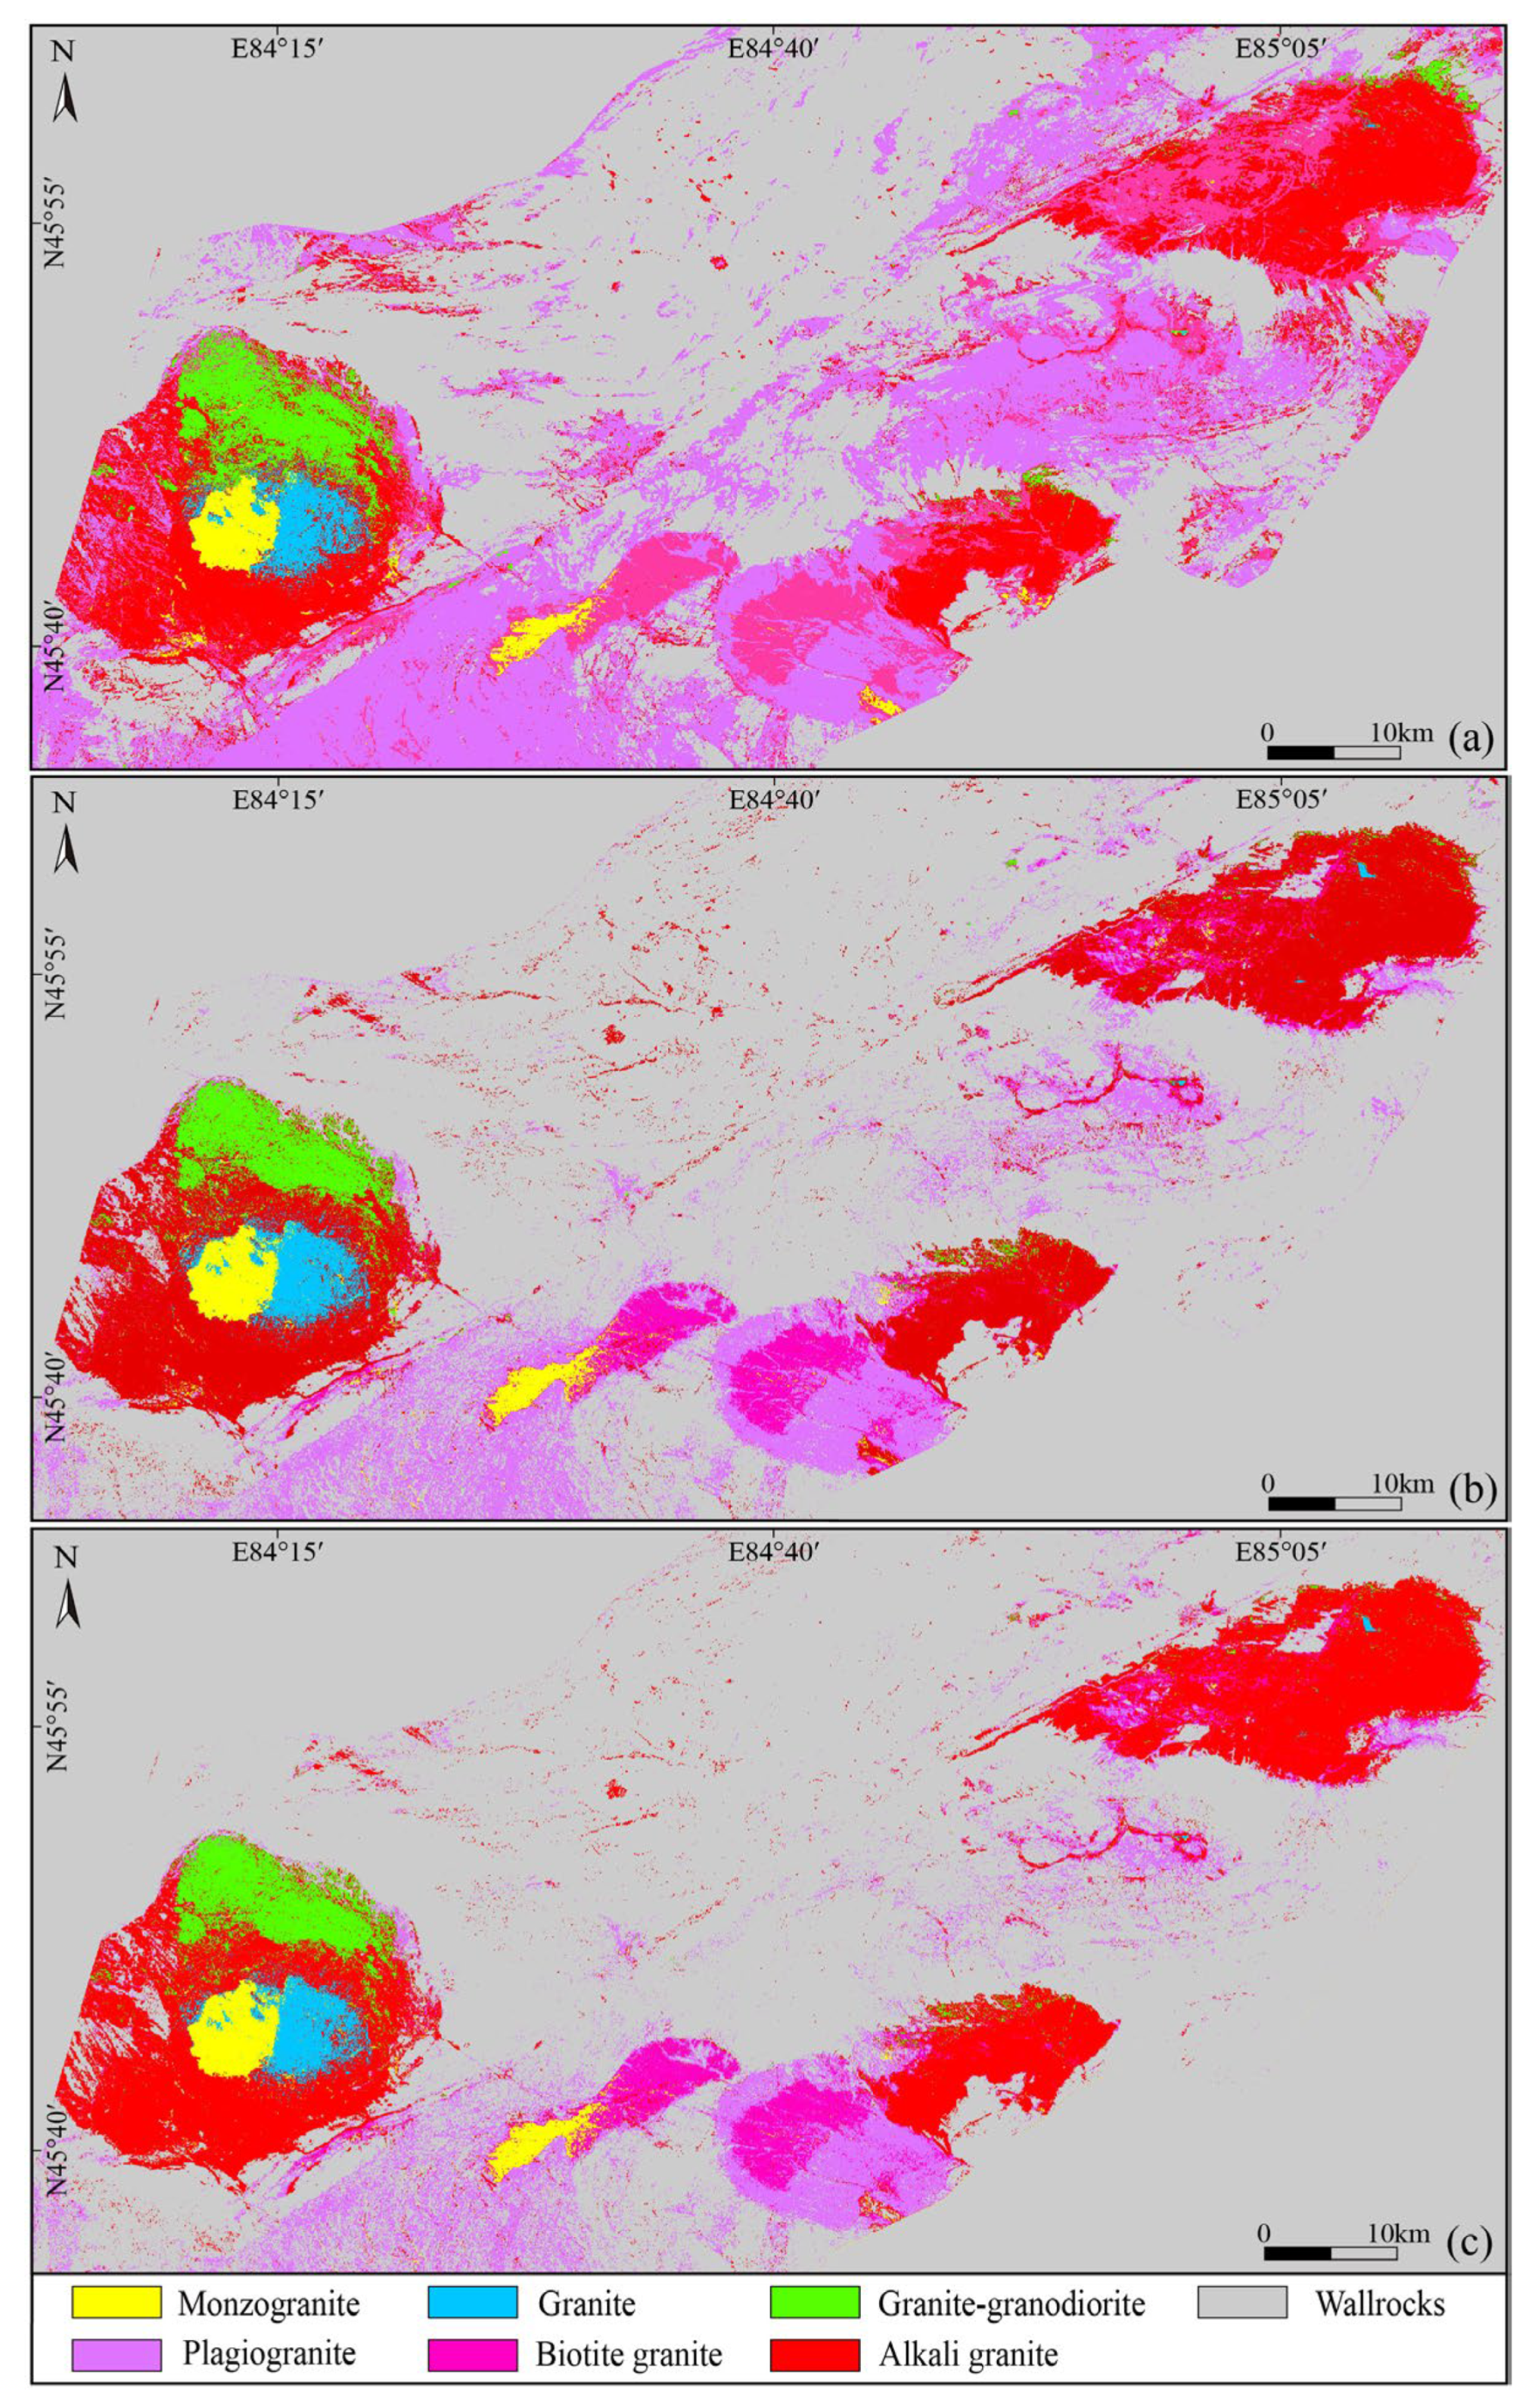
Figure 8.
Lithological mapping using the ASTER image band combination VNIR-SWIR+T1 as input data: (a) GoogLeNet, (b) VGG16, and (c) AlexNet.
Figure 8.
Lithological mapping using the ASTER image band combination VNIR-SWIR+T1 as input data: (a) GoogLeNet, (b) VGG16, and (c) AlexNet.
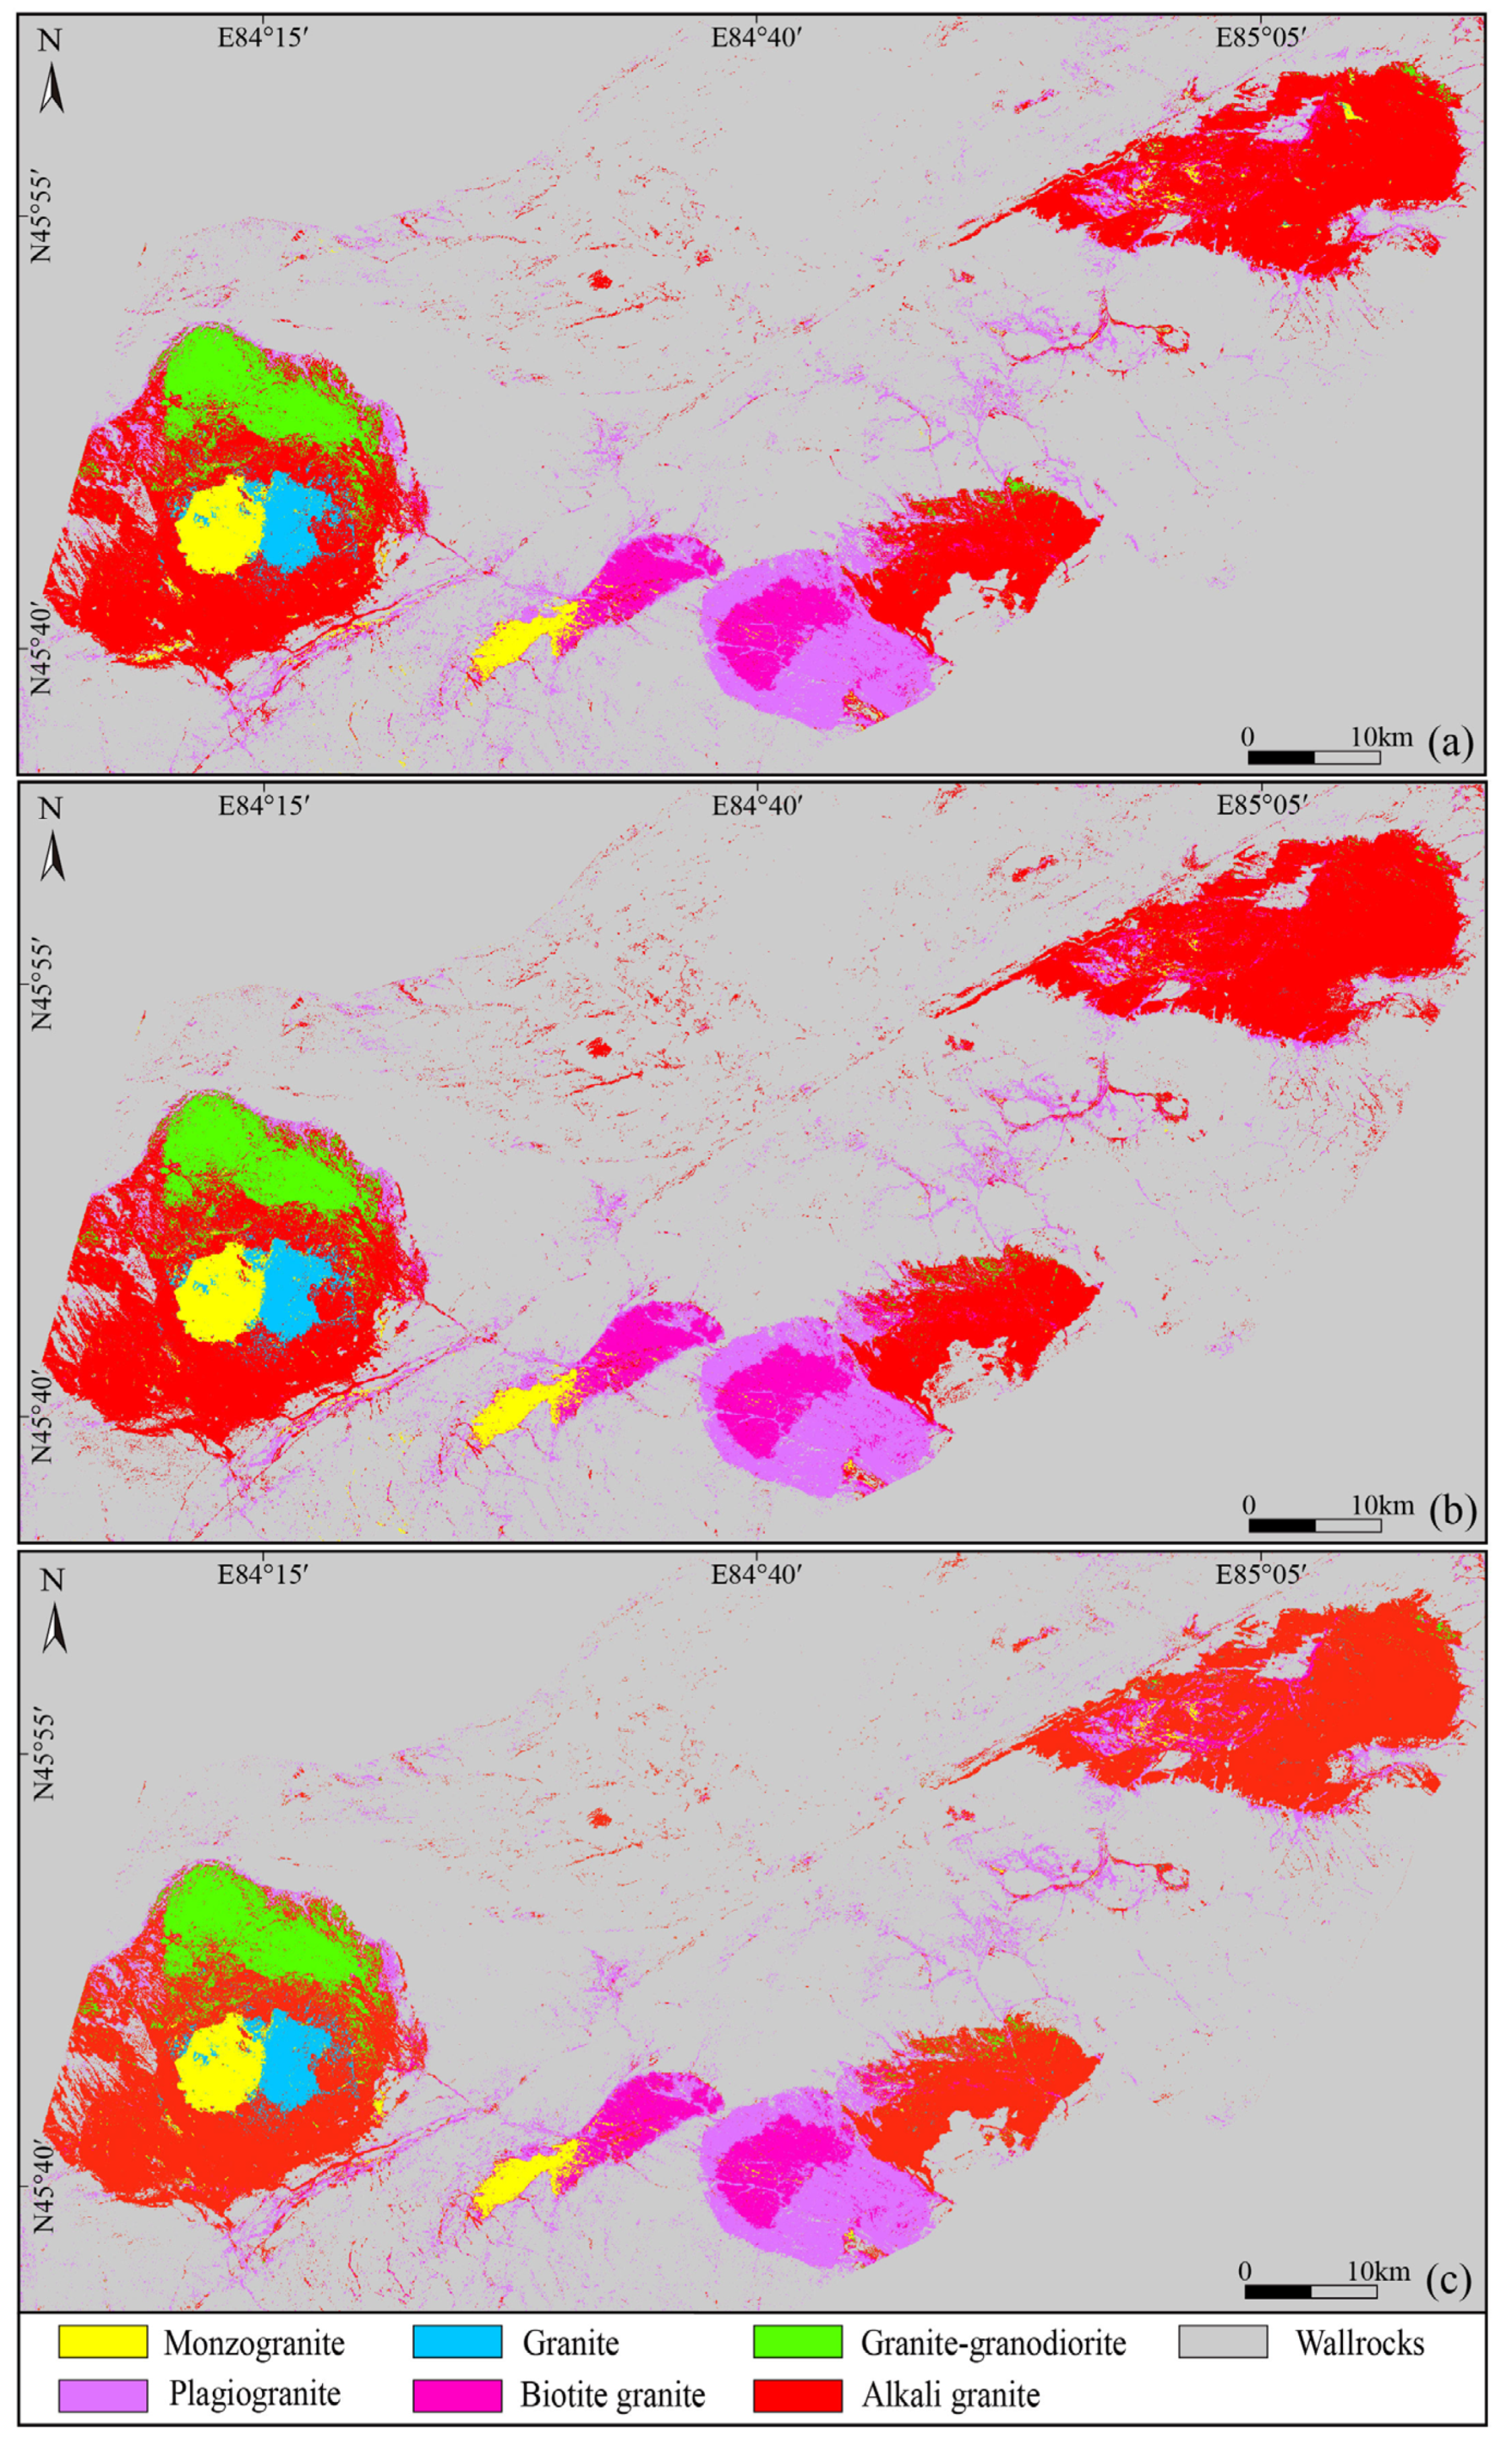
Figure 9.
Lithological mapping of the AlexNet model, with the band combination SWIR+T1 (a) and VNIR-SWIR+T1 (b) of Landsat8 image as input.
Figure 9.
Lithological mapping of the AlexNet model, with the band combination SWIR+T1 (a) and VNIR-SWIR+T1 (b) of Landsat8 image as input.

Figure 10.
Lithological mapping of granitoids overlain by faults and ore deposits in the Western Junggar Orogen.
Figure 10.
Lithological mapping of granitoids overlain by faults and ore deposits in the Western Junggar Orogen.
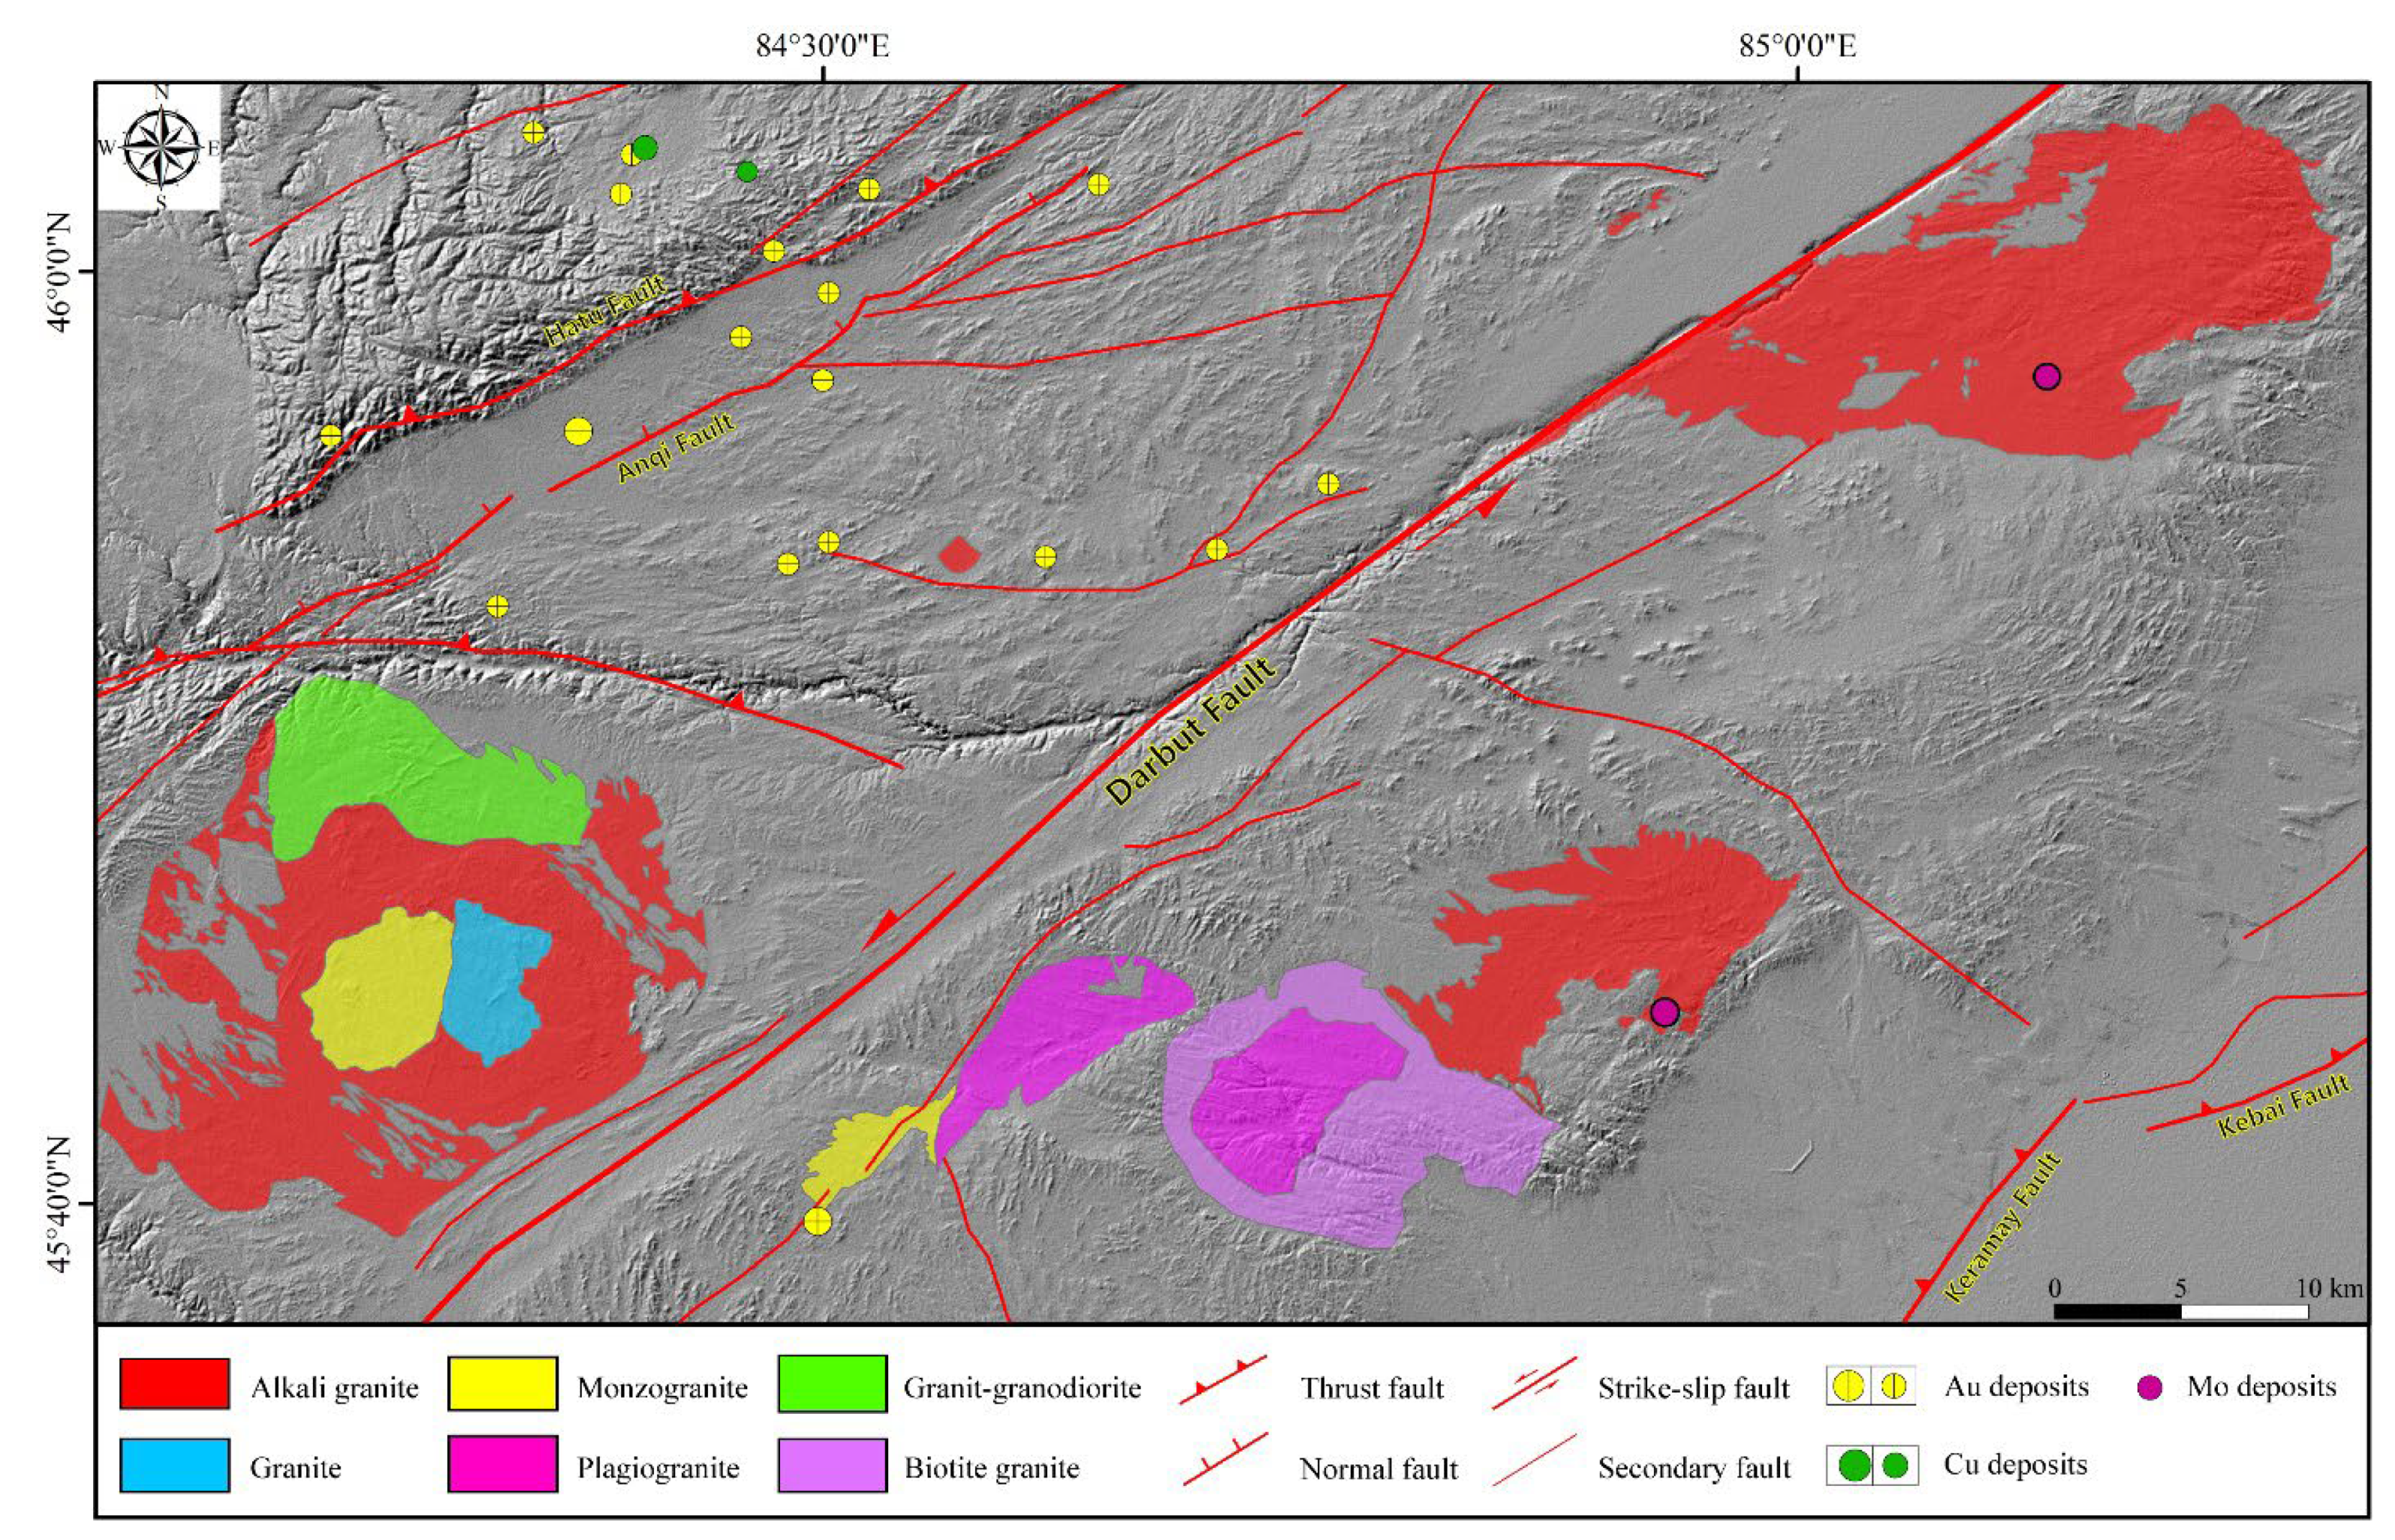

Table 1.
Sample site and lithology from the West Junggar region.
| Intrusion | Sampling site | Lithology |
| Akebasito | A-02 | Alkali granite |
| A-03 | Monzogranite | |
| A-04 | Granite | |
| Karamay II | KII-01 | Plagiogranite |
| Karamay III | KIII-01 | Biotite granite |
| Hongshan | HS-02 | Alkali granite |
Table 2.
Weighted F1 score and kappa coefficient of CNNs with B13678+T1.
| Model | Weighted F1 | Kappa |
| GoogLeNet | 76.65 | 0.79 |
| VGG16 | 90.46 | 0.79 |
| AlexNet | 91.21 | 0.81 |
Table 3.
Weighted F1 scores and kappa coefficients of CNNs overall classification from SWIR+T1.
| Model | Weighted F1 | Kappa |
| GoogLeNet | 69.08 | 0.51 |
| VGG16 | 83.36 | 0.74 |
| AlexNet | 88.65 | 0.77 |
Table 4.
Weighted F1 score and kappa coefficients of CNNs overall classification from VNIR-SWIR+T1.
| Model | Weighted F1 | Kappa |
| GoogLeNet | 91.85 | 0.83 |
| VGG16 | 90.71 | 0.83 |
| AlexNet | 91.98 | 0.84 |
Table 5.
AlexNet model F1 score for the various Western Junggar granitoid subclasses, with different ASTER and Landsat8 band combinations as input.
Table 5.
AlexNet model F1 score for the various Western Junggar granitoid subclasses, with different ASTER and Landsat8 band combinations as input.
| Type | ASTER | Landsat8 | ||
| SWIR+T1(%) | VNIR-SWIR +T1(%) | SWIR+T1(%) | VNIR-SWIR +T1(%) | |
| Alkali granite | 80.05 | 81.75 | 31.54 | 60.06 |
| Biotite granite | 62.56 | 71.91 | 23.17 | 52.03 |
| Plagiogranite | 26.19 | 43.79 | 5.49 | 23.65 |
| Granite | 67.59 | 77.06 | 22.62 | 41.75 |
| Monzogranite | 80.42 | 75.98 | 30.82 | 25.96 |
| Granite-granodiorite | 76.54 | 77.06 | 21.94 | 40.18 |
Disclaimer/Publisher’s Note: The statements, opinions and data contained in all publications are solely those of the individual author(s) and contributor(s) and not of MDPI and/or the editor(s). MDPI and/or the editor(s) disclaim responsibility for any injury to people or property resulting from any ideas, methods, instructions or products referred to in the content. |
© 2024 by the authors. Licensee MDPI, Basel, Switzerland. This article is an open access article distributed under the terms and conditions of the Creative Commons Attribution (CC BY) license (http://creativecommons.org/licenses/by/4.0/).
Copyright: This open access article is published under a Creative Commons CC BY 4.0 license, which permit the free download, distribution, and reuse, provided that the author and preprint are cited in any reuse.


