
Submitted:
01 November 2024
Posted:
01 November 2024
You are already at the latest version
Abstract
This study introduces a fresh approach to boost the security and accuracy of predicting photovoltaic (PV) power generation using secure aggregation techniques. The author will focus on several key stages in the PV data lifecycle, such as collecting, transmitting, storing, and analyzing data. To protect against potential attacks and prevent information leaks during these four crucial processes, we use Paillier and BVG homomorphic encryption methods. By combining TLS protocol with edge computing during data transmission, we not only improve data security but also reduce latency while tackling threats from attackers. There are two different types of attackers: honest but curious adversaries and active adversaries. Additionally, we make strategies for key management, access control, and auditing to ensure that access to information is monitored to help enhance overall system security. In the final phase of analyzing and predicting PV power output, we utilize advanced models like LSTM networks and CEEMDAN to achieve precise time-series predictions. The results indicate that these methods can effectively manage large PV datasets while keeping high prediction accuracy alongside strong security measures. The research establishes a foundation for improving homomorphic encryption, enhancing key management, and creating a big data security framework specific to photovoltaic energy production.
Keywords:
Photovoltaic Power Generation
; Secure Aggregation
; Homomorphic Encryption
; Paillier And BVG Algorithm
1. Introduction
As the material and spiritual civilizations of human beings around the world have developed rapidly in the early 21st century, the demand for energy in all countries has increased, which has also led to the excessive use of primary energy sources such as oil, coal, and natural gas. As a solar photovoltaic power generation system for sustainable power generation, related technical solutions can convert solar energy into clean electricity suitable for long-distance transportation, helping to reduce greenhouse gas emissions and alleviate a series of climate problems such as global warming.
However, the environmental factors around the system are constantly fluctuating, which can cause unstable power generation of the photovoltaic system and make it difficult to integrate it into the urban grid and the main grid on a large scale. To solve these problems, researchers need to accurately predict the power generation of photovoltaic systems, so as to better integrate solar power generation systems into the grid and realize the networked operation of new energy. Based on this, engineers are increasingly using big data and machine learning methods to improve the accuracy and reliability of predictions. Big data-driven, it is conducive to collecting and analyzing a large amount of information related to weather conditions in photovoltaic power generation systems (such as real-time solar radiation intensity, wind speed, rainfall, and cloud cover, etc.).
On the other hand, big data-based machine learning technologies also raise new security issues. A large amount of private user information is obtained in the PV system. Users' private data is either destroyed by an accident that is permanently destroyed by the data that has been transmitted, stored, and analyzed in an orderly manner that is both safe and secure, which is why the PV systems are unable to obtain the data and are exposed.
In order to solve the problems of these kinds, the study plans to use the method of secure aggregation and take the related protective actions of the four life cycles of the data to guarantee the security and reliability of user data in the real world and to do precise power prediction in real time. The author of the parts that are listed below will go into additional detail about these subjects, with an emphasis on the critical function of associated technologies in data security protection as well as increased prediction accuracy; this is a key component of this process.
1.1. Research Background
Growth in Photovoltaic Power Generation and Big Data Demand
Since 2011, in addition to traditional photovoltaic markets represented by the United States and Germany, emerging photovoltaic have also risen, and the global photovoltaic power generation industry as a whole has maintained a rapid growth trend. The cumulative installed capacity of each year from 2013 to 2023 has a compound annual growth rate of 28.30%, and the development of photovoltaic power generation systems has been rapid.
Global solar power plants can be divided into centralized photovoltaic power plants, distributed photovoltaic power plants, and off-grid photovoltaic power plants according to the connection mode. Compared with centralized photovoltaic power plants, distributed photovoltaic power plants have the advantages of low land occupation rate, low transmission and distribution loss, low construction and installation cost, good peak shaving performance, and flexible output power. Therefore, this paper takes distributed photovoltaic power plants as the main research object.
The Potential of Secure Aggregation in Photovoltaic Power Generation
Using a data-driven approach for photovoltaic power systems will bring related security issues in protecting user privacy. Especially in the data life cycle, the two stages of collection and storage. Secure aggregation technologies such as homomorphic encryption and key sharing can encrypt the original data and store it in an encrypted form, allowing for secure integration of encrypted information without violating user privacy. At the same time, the use of the above secure aggregation technologies will not affect the subsequent data analysis and accurate power prediction, ensuring the real-time prediction.
Distributed photovoltaic power stations generally have smaller scales and use short-distance power transmission for grid connection. At the same time, they have the characteristics of geographical distribution. This characteristic is exactly the same as the operational feasibility of encrypted data under homomorphic encryption, so the secure aggregation technology has extensive application potential in this scenario.
1.2. Research Significance
Significance of Big Data and Secure Aggregation in PV Power Generation
The application of big data-driven techniques in photovoltaic power output forecasting can significantly improve prediction accuracy, which is beneficial for optimizing grid macro-control and energy dispatch, and improving grid stability. Based on this, the secure aggregation method is used to process the original user data, allowing the data to be transmitted and stored in encrypted form, greatly reducing the risk of sensitive information leaks and ensuring the security of big data. Both of these aspects are the research value and significance of combining secure aggregation methods with the Photovoltaic Power Generation System, aimed at ensuring the safe and reliable operation of the power system.
2. Related Work
2.1. Data Processing and Power Forecasting in Photovoltaic Power Generation
Before we predict real-time power generation, we need to do some data preprocessing. This helps us get rid of any data points that have errors or are missing, and it prevents extreme values from skewing our predictions. This step is crucial for improving the overall accuracy of our model's predictions. During the data collection process, we gather real-time information from photovoltaic modules, inverters, weather stations, and various monitoring devices—like solar radiation intensity, temperature readings, and historical power generation data. The preprocessing stage ensures that we have a high-quality dataset by identifying and filling in or removing any missing values, outliers, and inconsistencies. We extract features from this data set to pinpoint the key factors affecting power generation and use established algorithms like regression models and neural networks to analyze the output patterns and trends within the photovoltaic system. Data-driven prediction methods such as time series analysis, supervised learning techniques, and deep learning have shown great advantages in predictive accuracy by incorporating real-time data into these models. By adjusting these models with real-time information, we can enhance both the accuracy and reliability of our power predictions.
2.2. Data Privacy Protection Techniques
To prevent unauthorized access and potential data leaks, researchers must ensure that users' sensitive information remains secure during collection, transmission, storage, and analysis processes. Traditional encryption methods usually require decrypting data for processing; this can lead to leaks or increase risks of exposure. So there’s an urgent need for privacy protection methods that fit well with the dynamic nature of distributed systems which are widely spread out. Secure aggregation technology keeps data confidential throughout the entire analysis process by encrypting it all along the way. Homomorphic encryption allows us to perform calculations on encrypted information within a distributed framework—this means faster processing compared to other encryption strategies while still enabling real-time power prediction without compromising user privacy at all!
3. Data Collection Phase of Photovoltaic Power Generation Systems Based on Homomorphic Encryption
In the distributed mode and the transmission of electricity, there's huge energy generation capability of PV systems which allow the small to medium-sized customers to directly connect the PV to the grid, thus combining PV system with energy storage solution, and the data of these kinds of PV system are very huge, which is of real-time power generation environment, so that the energy production capacity of PV systems is very large, which means that PV system will be very big and the energy storage system can be combined with energy storage solution.
Traditional methods of protecting data usually involve encrypting the original information; however, this can result in encrypted data that isn’t suitable for regular analysis and computation. In this paper, we use a homomorphic encryption method that allows us to perform simple operations on encrypted data, tackling these issues while keeping the collected data secure during the PV system collection phase. Homomorphic encryption—especially partial homomorphic encryption like the Paillier algorithm or fully homomorphic encryption such as the BVG algorithm—lets us do calculations on encrypted data without compromising user privacy. The Paillier algorithm is particularly good at addition, making it perfect for aggregating multi-source generation data, which aligns well with how distributed PV systems operate. Meanwhile, the BVG scheme provides more flexibility by supporting various calculations like multiplication and comparison. By effectively using these homomorphic encryption techniques within our PV framework, we can keep our data safe while also enabling accurate analysis and predictions.
3.1. The Structure of a Photovoltaic Power Generation System
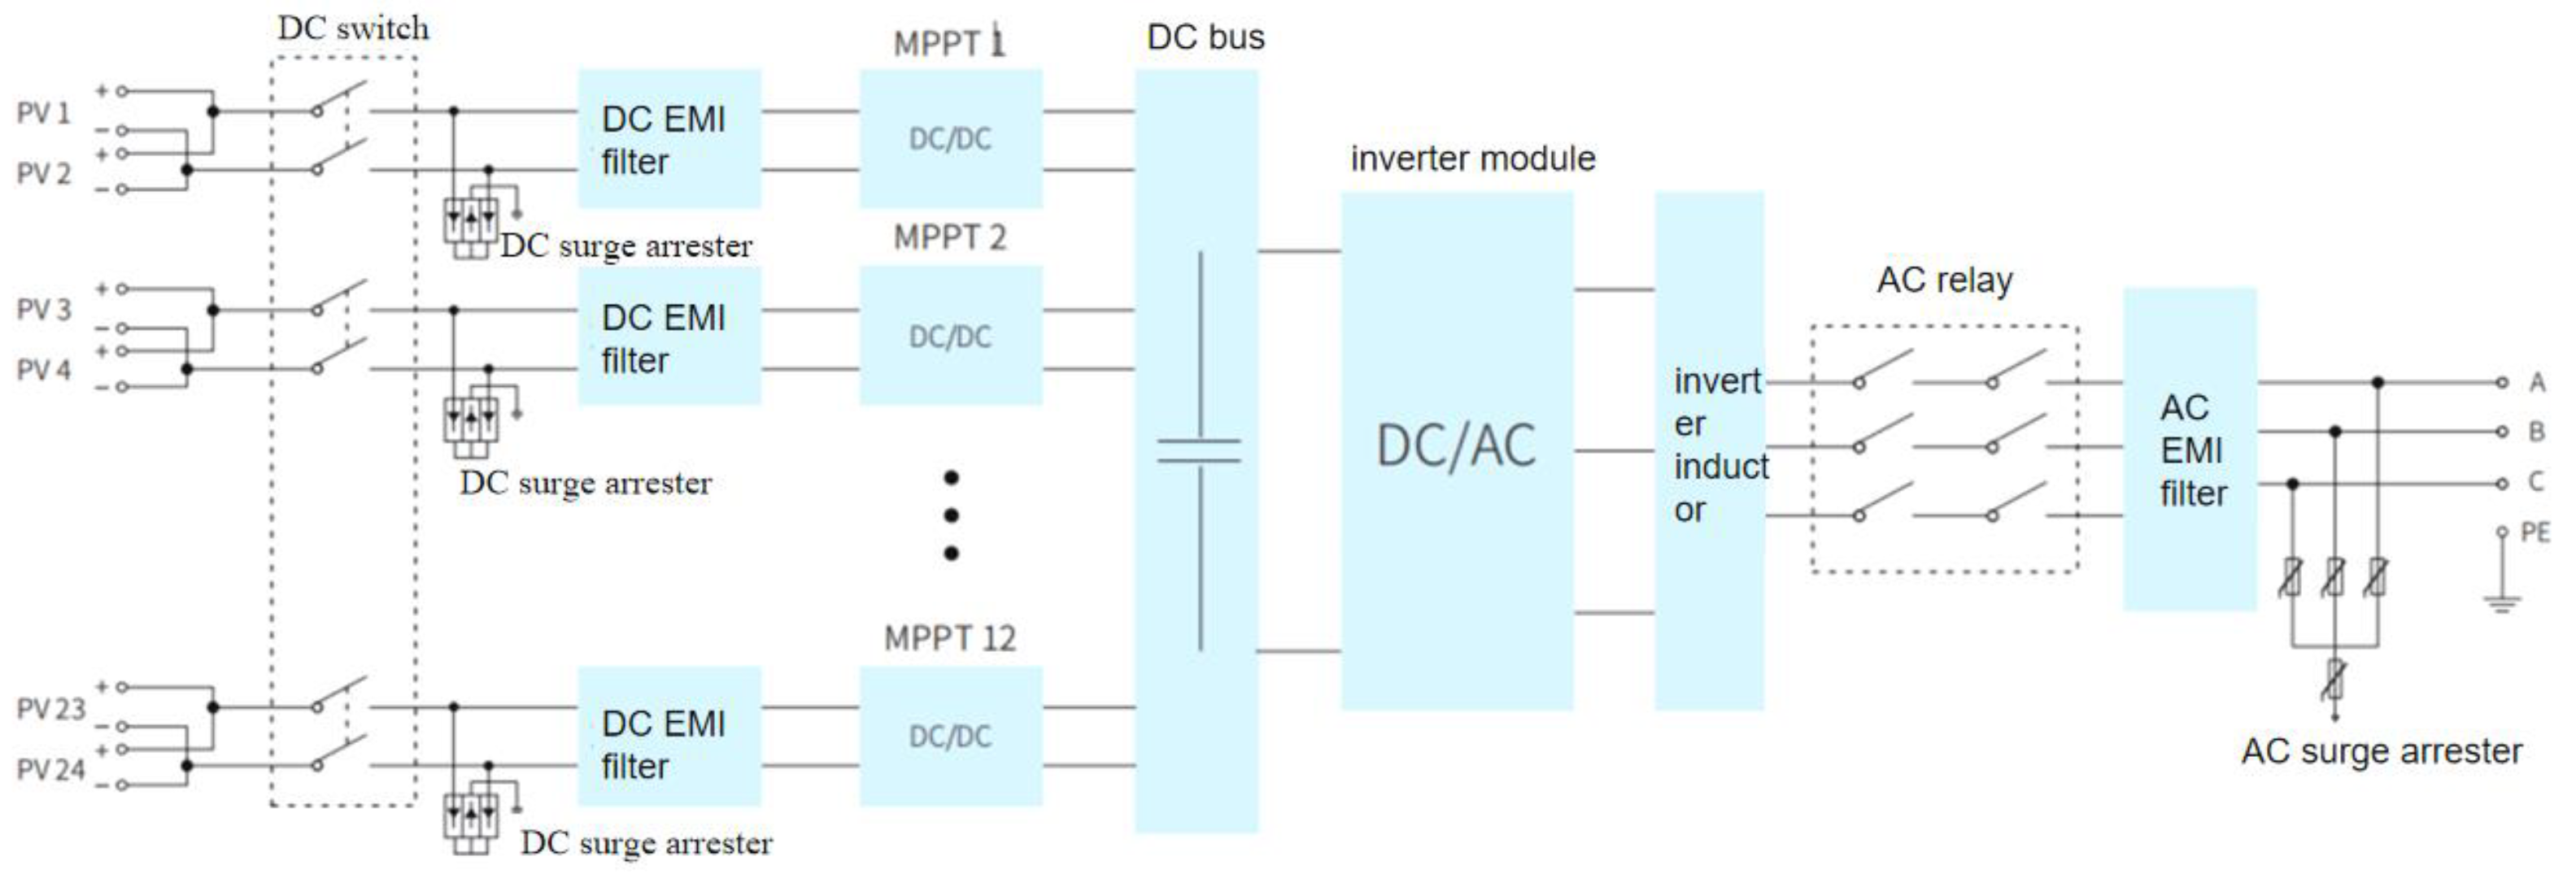
A photovoltaic power generation system is designed to utilize the photovoltaic effect for converting solar energy into electrical power.This system comprises several essential components, including solar panels, a maximum power point tracker(MPPT), an inverter, a controller, a mounting bracket, and a grid connection interface.The solar panels serve as the heart of the PV system;they convert sunlight into direct current(DC)and harness solar energy to produce clean electricity.The MPPT continuously assesses the performance of the solar panels in real time and adjusts their voltage and current settings to optimize output power.Subsequently, the inverter changes DC into alternating current(AC), making it suitable for household use or allowing it to be fed back into the grid.The controller manages all operations to ensure everything runs smoothly and takes necessary actions when required.Meanwhile, the mounting bracket secures the solar panels in position for optimal exposure to sunlight, while the grid interface links what is generated by the PV system with the grid for effective energy transmission and distribution.
Figure 1.
a photovoltaic (PV) system architecture.
3.2. Data Collection Objects and Content in a Photovoltaic Power Generation System
Performance data of solar panels, which contains critical information such as: the voltage , current , power , and temperature of the solar panels and we are using this to evaluate the performance of the solar panel and to ensure that the solar panel is operating normally and we use this information to evaluate how well the solar panels are operating and also to ensure they are running normally.
- MPPT (maximum power point tracker): It is used to monitor the operation of the MPPT and guarantee that it efficiently optimizes the output power from the solar panel.
- Inverter: This keeps track of the inverter working and makes sure that DC electricity is converted to AC electricity in an efficient way.
- Controller: In order to guarantee that the controller is in good condition to manage everything in the system, it keeps track of its own operating status.
- Grid Interface: This is used to verify the grid interface performance and to ensure that the interface is correctly connected to the grid.
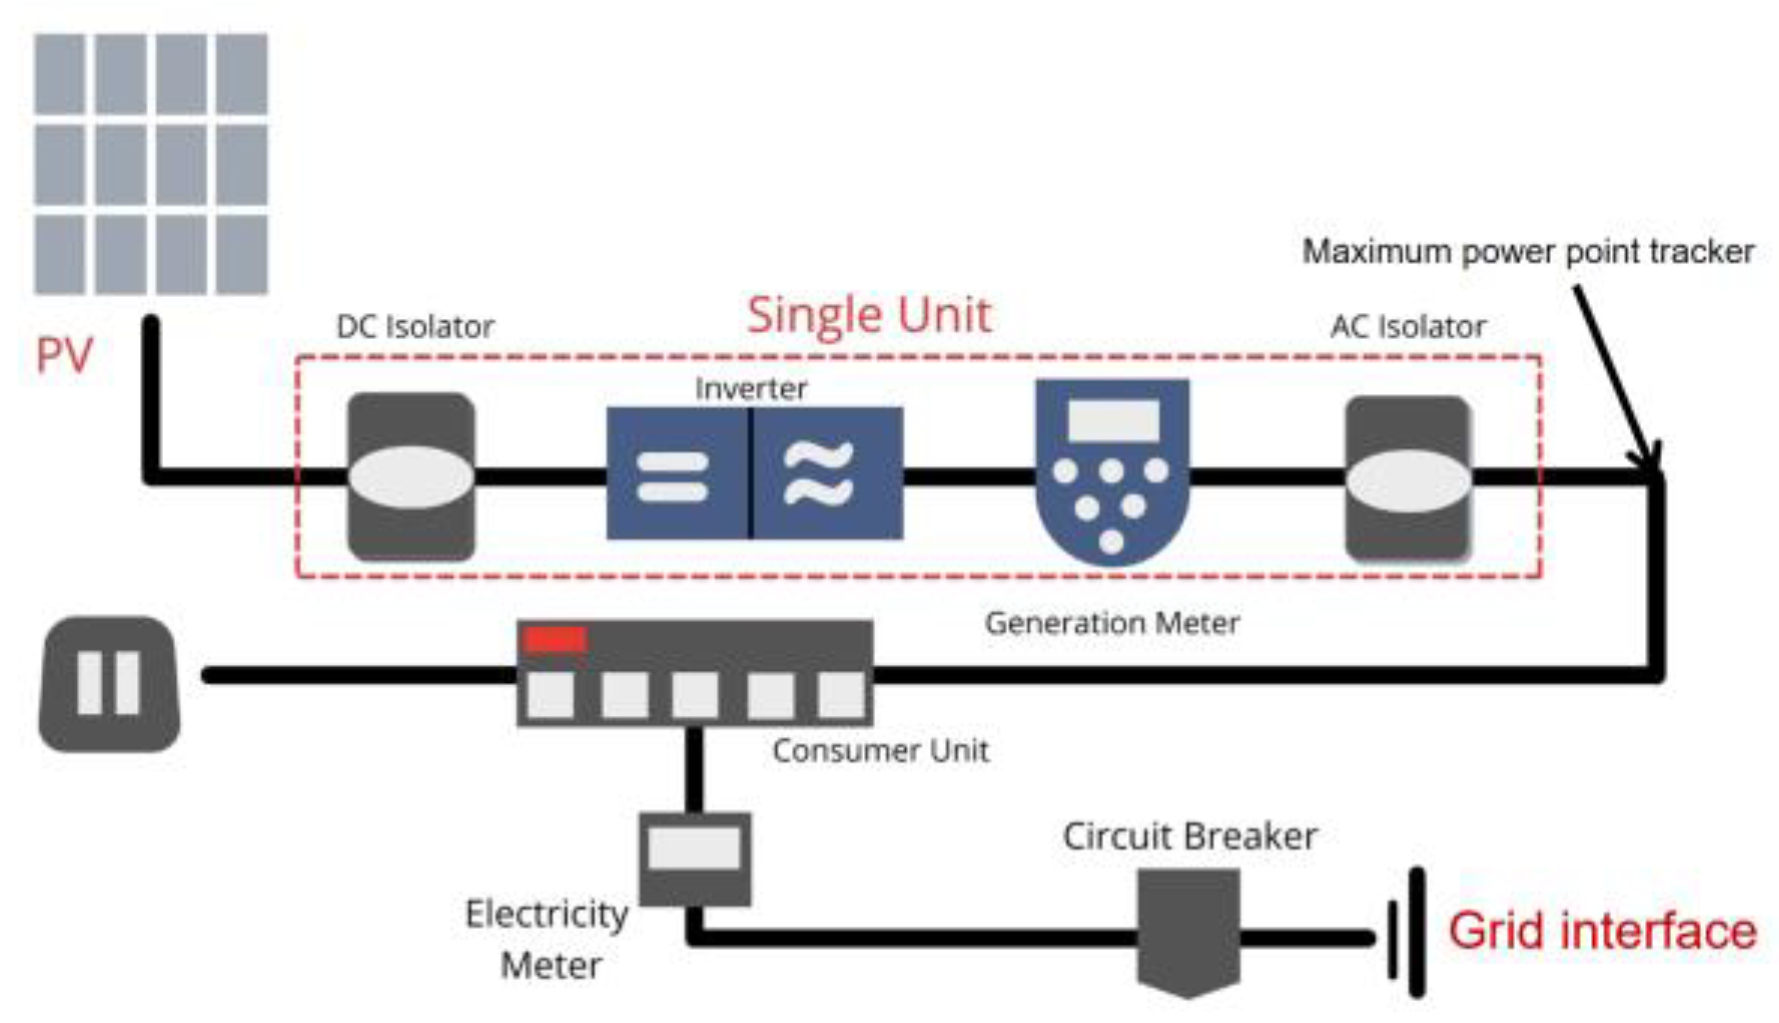
Figure 2.
a PV system that is connected to the grid without a battery.
For the photovoltaic power generation equipment and data characteristics in this paper, the original photovoltaic electricity generation data is semi-homomorphically encrypted using the Paillier algorithm, and the data of solar radiation, temperature, and humidity are homomorphically encrypted using the BVG algorithm.
The original photovoltaic power generation data is voluminous, and the encryption and decryption processes of the Paillier algorithm are relatively simple and efficient, making it highly suitable for real-time data processing and analysis. This provides data support for subsequent ultra-short-term photovoltaic power generation forecasting and can minimize the time required for pre-processing data collection. The Paillier algorithm supports additive homomorphism, allowing for the execution of addition operations directly on encrypted data without the need for decryption. For each node of a small photovoltaic power station and residential photovoltaic equipment, this study does not concern itself with the specific data of these small systems but only with the total power generation of each node. This operation only requires support for addition, which perfectly aligns with the capabilities of the Paillier algorithm. Additionally, thanks to the complexity of the integer factorization problem, the Paillier algorithm offers a high level of security.
3.3. Operation Process of the Paillier Algorithm and BVG Algorithm
Key Generation
1. Selection of Prime Numbers: Choose two large prime
numbers, p and q, ensuring that their lengths are as close to each other as
possible to maximize security.
2. Computation of Modulus and Lambda :
Compute N as the product of p and q
Calculate as the least common multiple (LCM) of () and ():
3.Selection of Generator g : Randomly select g from the set , the set of integers modulo that are coprime to , such that:
where L(x) = . It is noted that choosing g = N + 1 satisfies this condition, thus it can be used directly.
4. Calculation of :
Compute μ as the modular inverse of L() modulo :
5. Key Pair Generation:
Public Key: The public key consists of (N, g).
Private Key: The private key consists of .
Encryption Process
For any plaintext message , and for any randomly chosen number r , the ciphertext C is computed as follows:
Here, g is the public generator, r is the random number, and N is the modulus from the public key. The expression represents the message m raised to the power of g, and is r raised to the power of N . This ensures that the encryption process incorporates both the message and the random number, providing semantic security.
Homomorphic Property
For any plaintexts , and any random values ,, let the corresponding ciphertexts be and . The following homomorphic property holds:
It is seen that when ciphertext is multiplied, the amount of plaintexts added is the same as that of the plaintext, which means that the process of multiplying two ciphertexts is done so that they are decrypted to the total of the corresponding plaintexts; that is, the homomorphic property of this encryption scheme is that the multiplication of two ciphertexts: the ciphertext is guaranteed by the homomorphomorphic property ofthe encryption scheme, which is to the sum of the corresponding plaintexts.
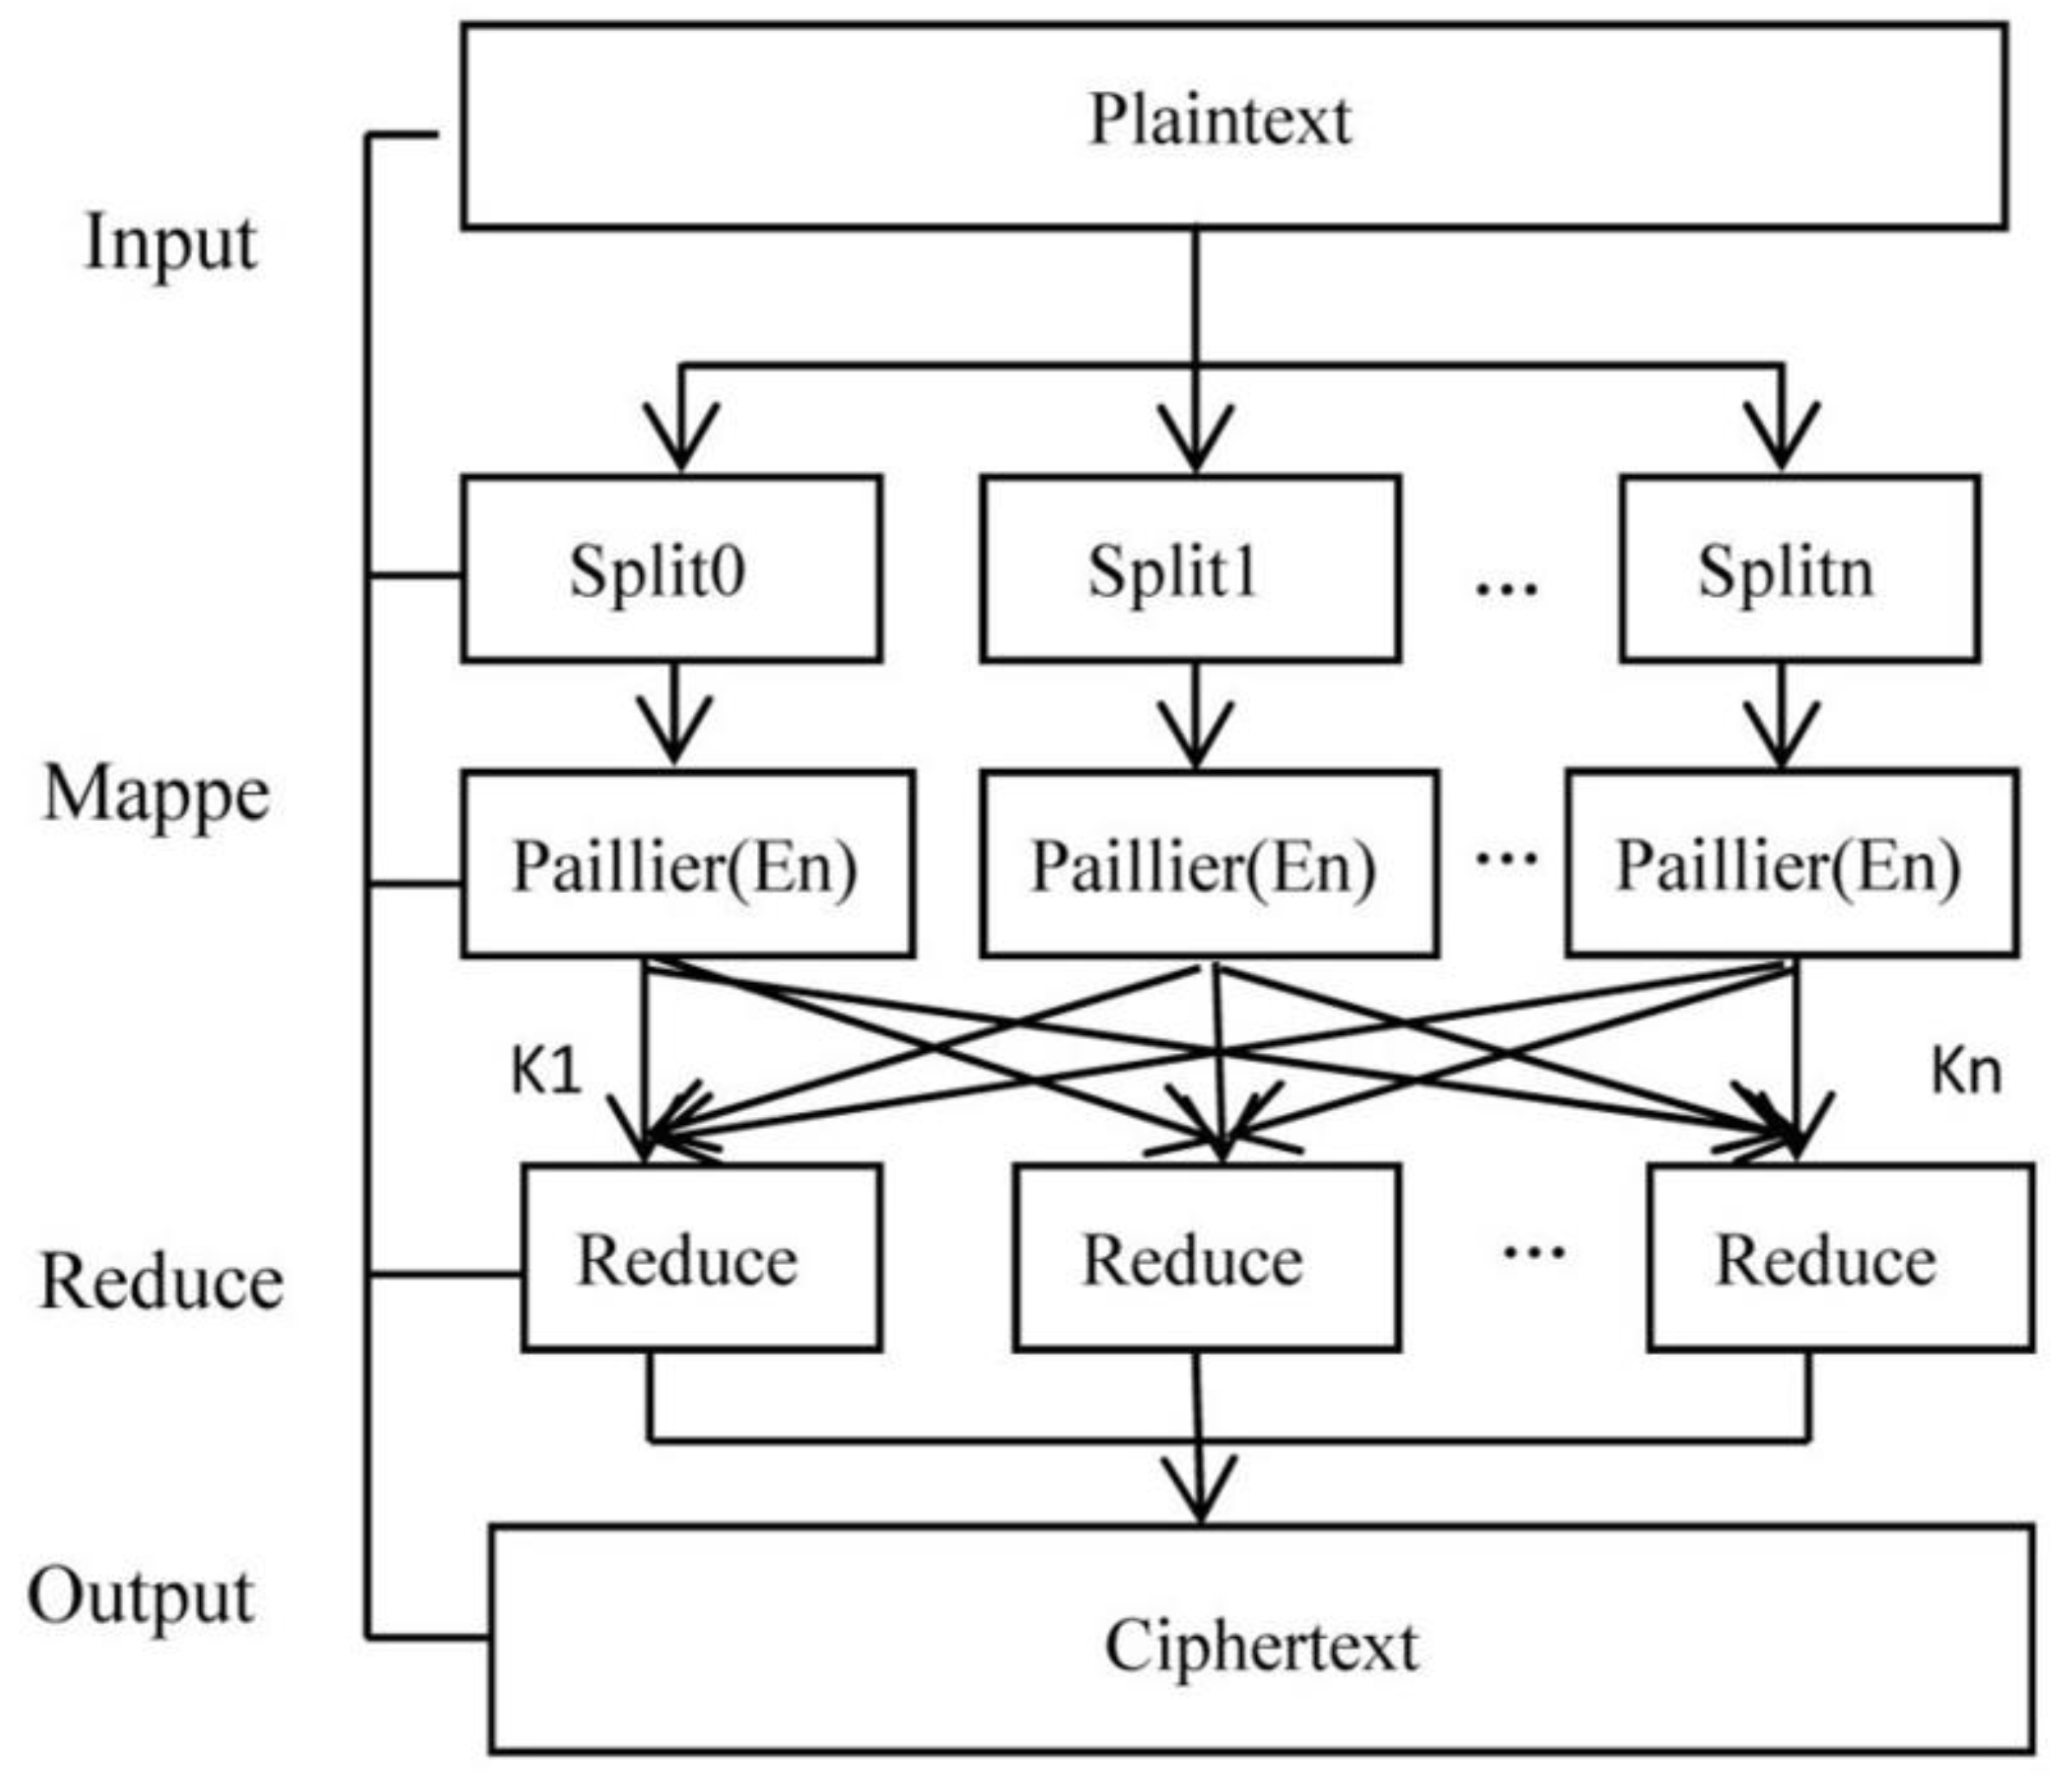
For each device at given time a PV power generation system, the Paillier algorithm from homomorphic encryption and basic addition operations makes use of the method to get the values in terms of statistics at any given node which in turn is very much needed to calculate the value of the values for each device at any given time which is used in PV power generation system by using the algorithm from this method which helps in analysis of the current PV situation and also to make the prediction of power in the process and to get the value of the values of these devices at any given moment which is used in PV power generation system .
Figure 3.
Parallel encryption process of Paillier.
It can be seen that there are obvious differences between the distributed characteristics of the equipment in the above power generation system and that for the real-time environmental data of photovoltaic power generation, such as solar irradiance intensity, ambient temperature and humidity, wind speed, and a series of other parameters. Moreover, the BVG algorithm from homomorphic encryption is used because the subsequent operations cannot be carried out only by addition.
In the case of the BVG algorithm, which is very appropriate for the following operations, such as wavelet decomposition and data analysis, the algorithm is able to perform arbitrary function operations on encrypted data. This algorithm also has a higher level of security, which can be obtained by solving the problems of perfect lattices. So, it is a good fit and feasible to process the real-time environmental data in photovoltaic power generation.
Here is the specific operation process of the BVG algorithm:
Key Generation
Primary Key Generation:
P: A large prime number used in the construction of the modulus N.
Q: Another large prime number used in the construction of the modulus N.
g: A generator that satisfies gN ≡ 1 mod N2.
Public Key: (N, g) Private Key : (p, q)
Ciphertext Key Generation:
H: A random number coprime to N.
μ: The modular inverse of h modulo N2.
Ciphertext Key: μ
Encryption Process
m: The plaintext value to be encrypted.
r: A random number coprime to N.
c: The ciphertext, computed as C = gm · rN mod N2
Arbitrary Function Computation
C1 and C2: Two ciphertexts
C1 ⊗ C2: The result of the outer product of C1 and C2
f(m1, m2): The function applied to the plaintext values m1 and m2
m1 ⊗ m2 mod N: The result of the function applied to m1 and m2, encrypted and decrypted
4. Data Transmission Phase of Photovoltaic Power Generation Systems Based on Homomorphic Encryption
The protection of the information being transferred and the protection of both the security and privacy of the data being transmitted in photovoltaic power generation system is very important in the process of data transmission. We adopt the dual-layer protection scheme which includes encryption at both the transport layer and the application layer to deal with these needs. For encryption the application layer uses the advanced encryption schemes which are Paillier or BVG algorithms. Moreover, in the framework of Paillier algorithm the edge computing is used on the periphery of the devices which are installed in the system to further minimize the possible threats of the raw data being exposed to the same. Also, the encryption of the transport layer is used which uses the protocols such as TLS which provides extra security for the encrypted information in its transit over the network which ensures the confidentiality and also the integrity.
4.1. Edge Computing in the Context of the Paillier Algorithm
Using the Paillier algorithm, which is the main advantage of data transmission, the property of additive homomorphism allows for the addition of operations to encrypted datasets, which makes it especially appropriate for real-time processing and aggregation tasks because it can efficiently handle large datasets. Homomorphic encryption algorithms protect privacy from unwanted access by allowing for complicated computations with the ability to keep data confidential. The BVG algorithm's robust computing characteristics and flexibility also make it useful for detailed environmental data analysis, which also strengthens both privacy and security.
Building upon our previous evaluation regarding characteristics of raw photovoltaic power generation data and their compatibility with the Paillier algorithm, this paper advocates for incorporating edge computing into photovoltaic systems. Specifically, we propose aggregating and analyzing information locally from various photovoltaic modules directly at their sites before transmitting any results back to a central system; only aggregated outcomes that have been encrypted using the Paillier algorithm need to be sent instead of all unprocessed input data. This approach minimizes network traffic—which reduces bandwidth consumption—alleviates latency concerns—and ensures prompt results during processing and analytical stages.
Edge devices first encrypt their local datasets prior to employing secure communication protocols like TLS (as previously mentioned) when sending this encrypted information back up to either a central system or cloud storage solutions. Consequently, even if someone intercepts our transmissions along their route through networks they will not be able to decrypt or manipulate any sensitive content! Moreover, by minimizing how much unprocessed information traverses those channels we significantly mitigate risks related to potential exposures throughout these processes.
4.2. Application of the TLS Protocol in the Data Collection Phase
In photovoltaic power generation systems, the TLS (Transport Layer Security) protocol plays a key role in keeping data transmission secure through several steps. First off, during the TLS handshake process, each component like photovoltaic panels, inverters, or environmental sensors (acting as TLS clients) sends a "Client Hello" message to the central control system or cloud server. This message includes details about which TLS versions and cipher suites they support. The server then replies with a "Server Hello" message where it picks an appropriate TLS version and cipher suite and sends its digital certificate to prove its identity. After that, both the devices and the server negotiate a symmetric key using a key exchange method (like Diffie-Hellman), which will be used for encrypting and decrypting future communication.
After they were able to successfully exchange keys, the client and server send "completed"messages to confirm that everything else up correctly before switching over to encrypted communication mode, starting to use that symmetric key for data encryption.
It is used in the data encryption phase by devices in the photovoltaic power generation system(like inverter, solar panels)to encrypt data using symmetric encryption algorithms such as AES, which is used to protect the data while it is being transmitted over the network, so even if an individual intercepts this data, they will not be able to decrypt it easily. Furthermore, TLS uses Message Authentication Code (MAC) technology to guarantee data integrity; in transmission, devices add a MAC tag on top of their data, so any tampering can be detected later by verifying this MAC at the central control system or cloud server.
Numerous encrypted suites are supported by the TLS procedure, which uses hash functions such SHA-256 and key exchange methods including Diffie-Hellman and ECDH, as well as symmetric encryption methods.
In terms of the hash algorithm, we use the method that uses the SHA-256 as the example of hash algorithms, mainly based on the operation of the compression function of the SHA- 256, which basically works on the 512-bit message block and the value of the intermediate hash, which is of the 256-bit, which mainly uses the message block as the key, basically this paper introduces the following two parts of the algorithm, namely SHA-256, which encrypt the intermediate hash value by means of the message block; to describe the algorithm of SHA- 256, which includes the following:
(1) the message processing flow of the SHA-256 algorithm
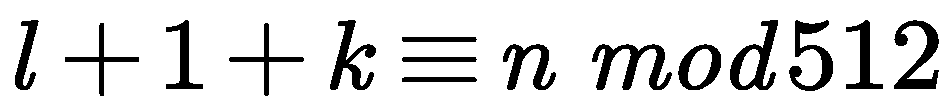
Padding the message: Suppose the binary encoding length of the message is L bits. First, append a "1" at the end of the message, followed by "0"s, where K is the smallest non-negative integer that satisfies the following equation:
After padding, the message is divided into 512-bit blocks as follows:, where the first 32 bits of the -th message block are represented as , the next 32 bits as and so on, with the last 32 bits of the message block represented as . We use the Big-endian convention to encode the data, meaning that the first byte is the most significant byte. Therefore, for each 32-bit word, the leftmost bit is the most significant bit.
(2) the compression function of the SHA-256 algorithm

We can use the -th intermediate hash value to initialize a,b,c,d,e,f,g,h. When , the initial hash value is used as follow:
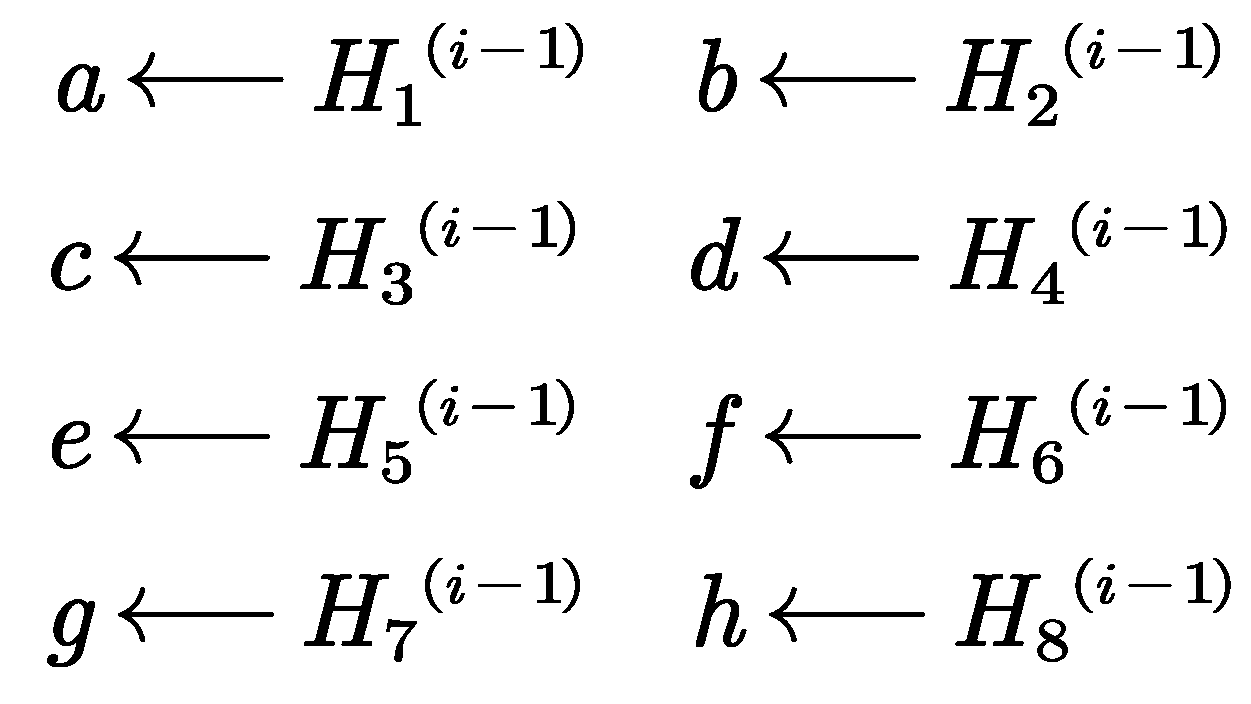
The SHA-256 algorithm uses six logical functions, each of which operates on 32-bit words and outputs a 32-bit word:
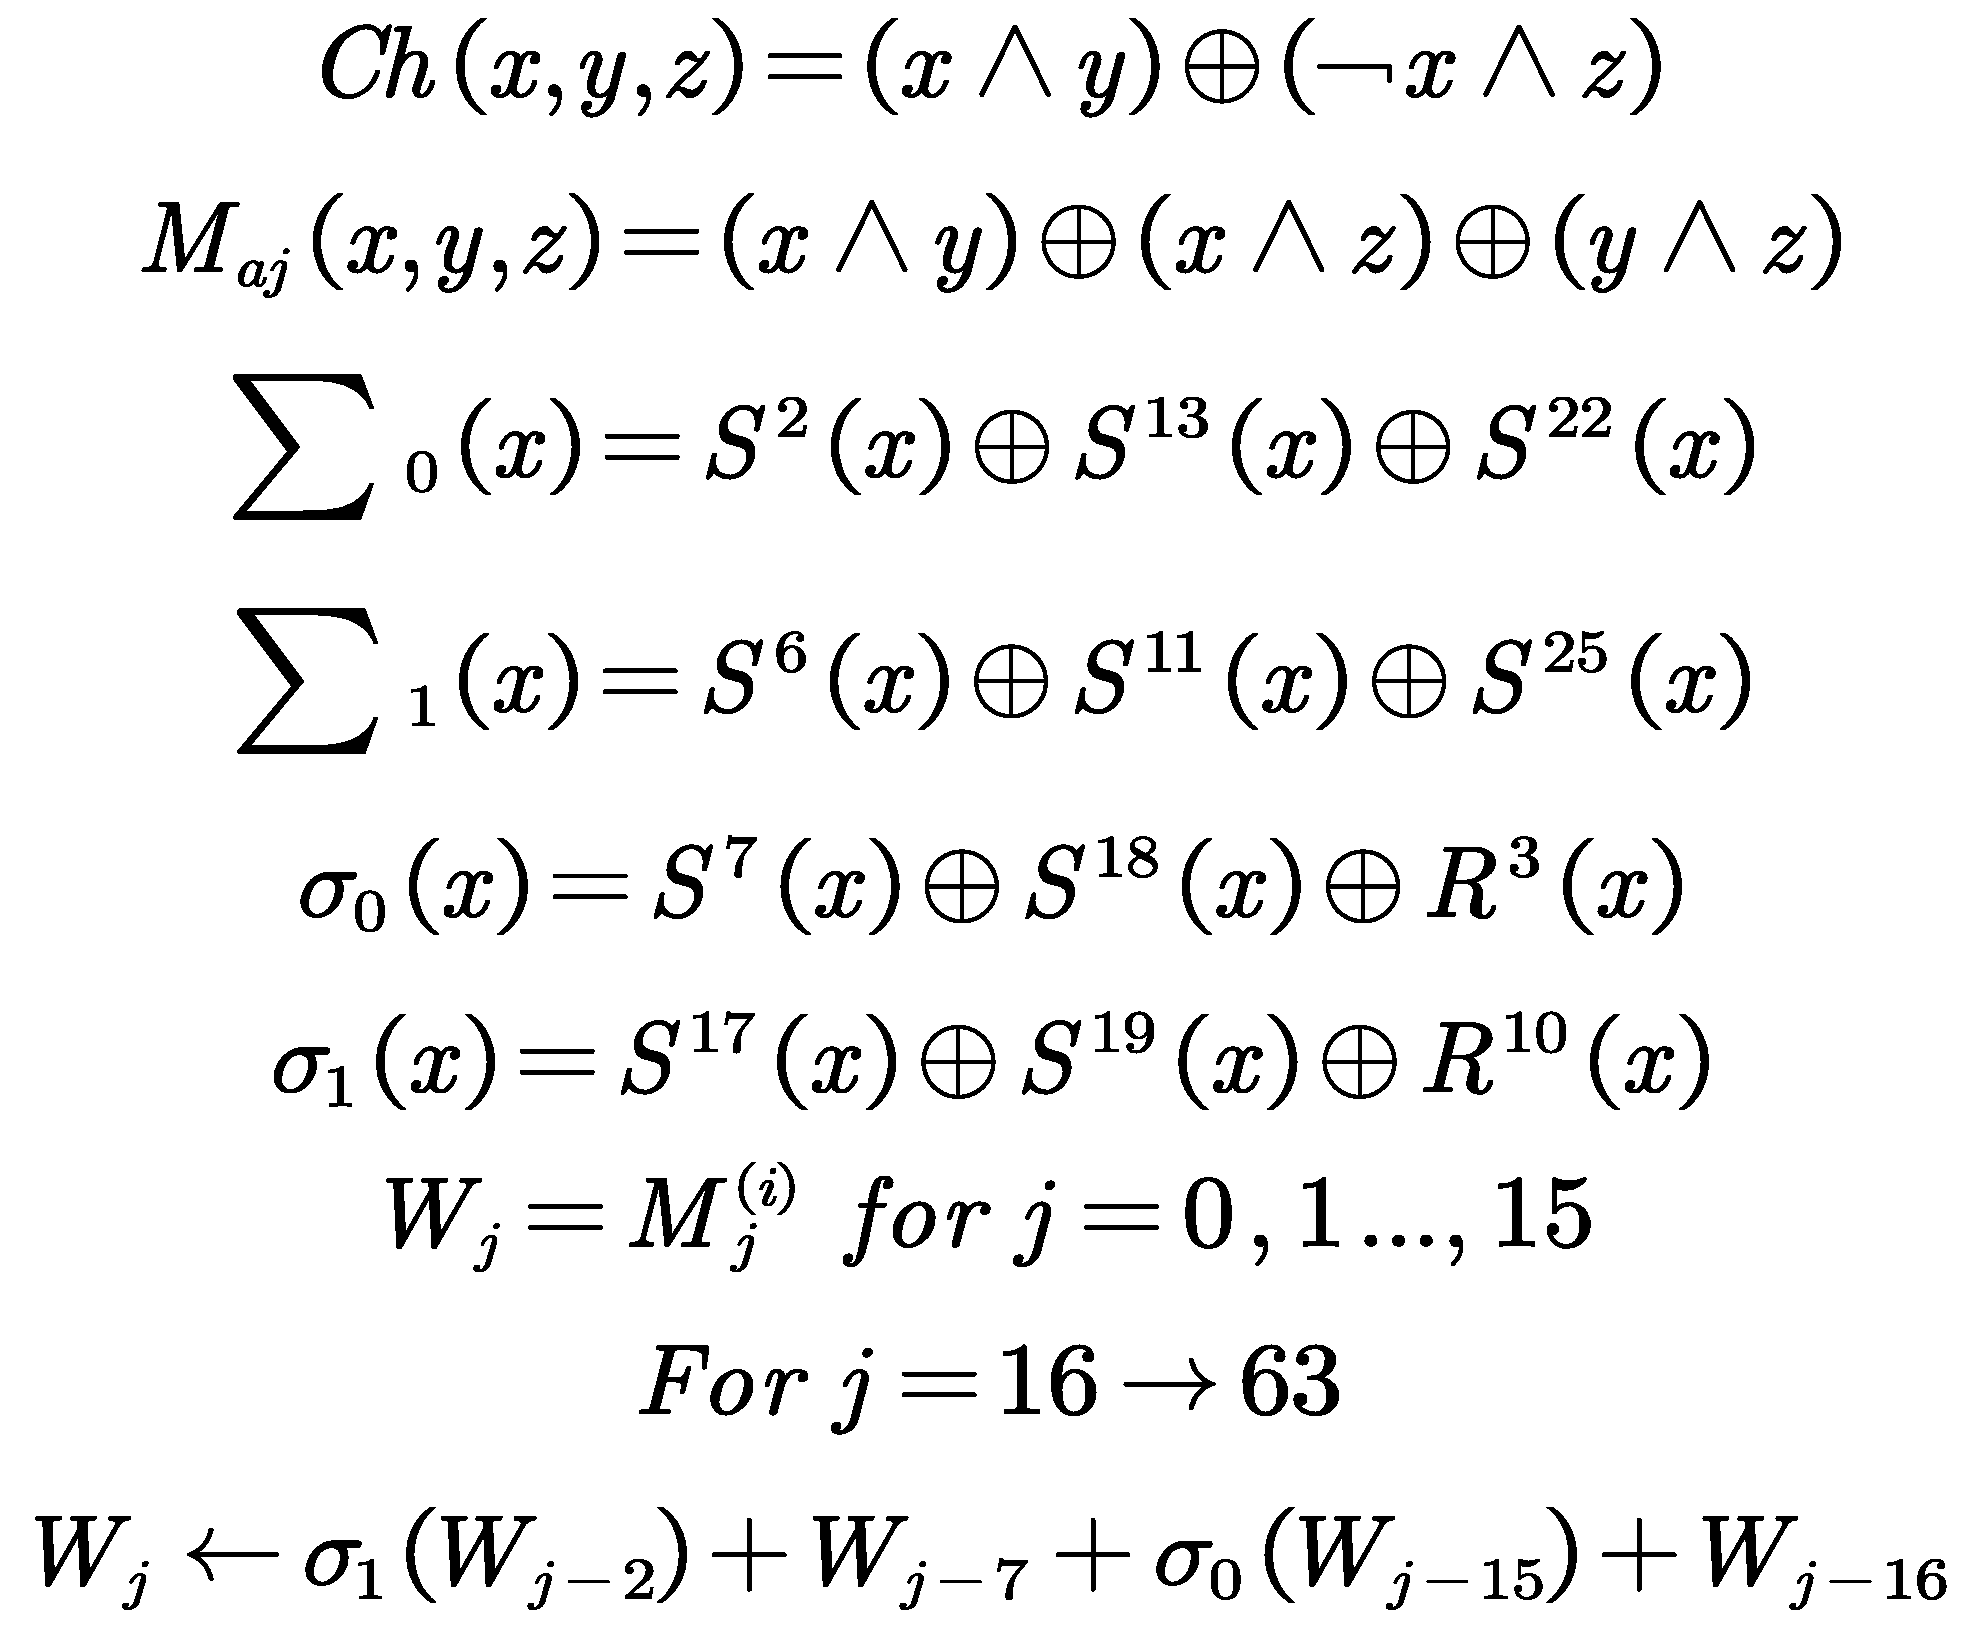
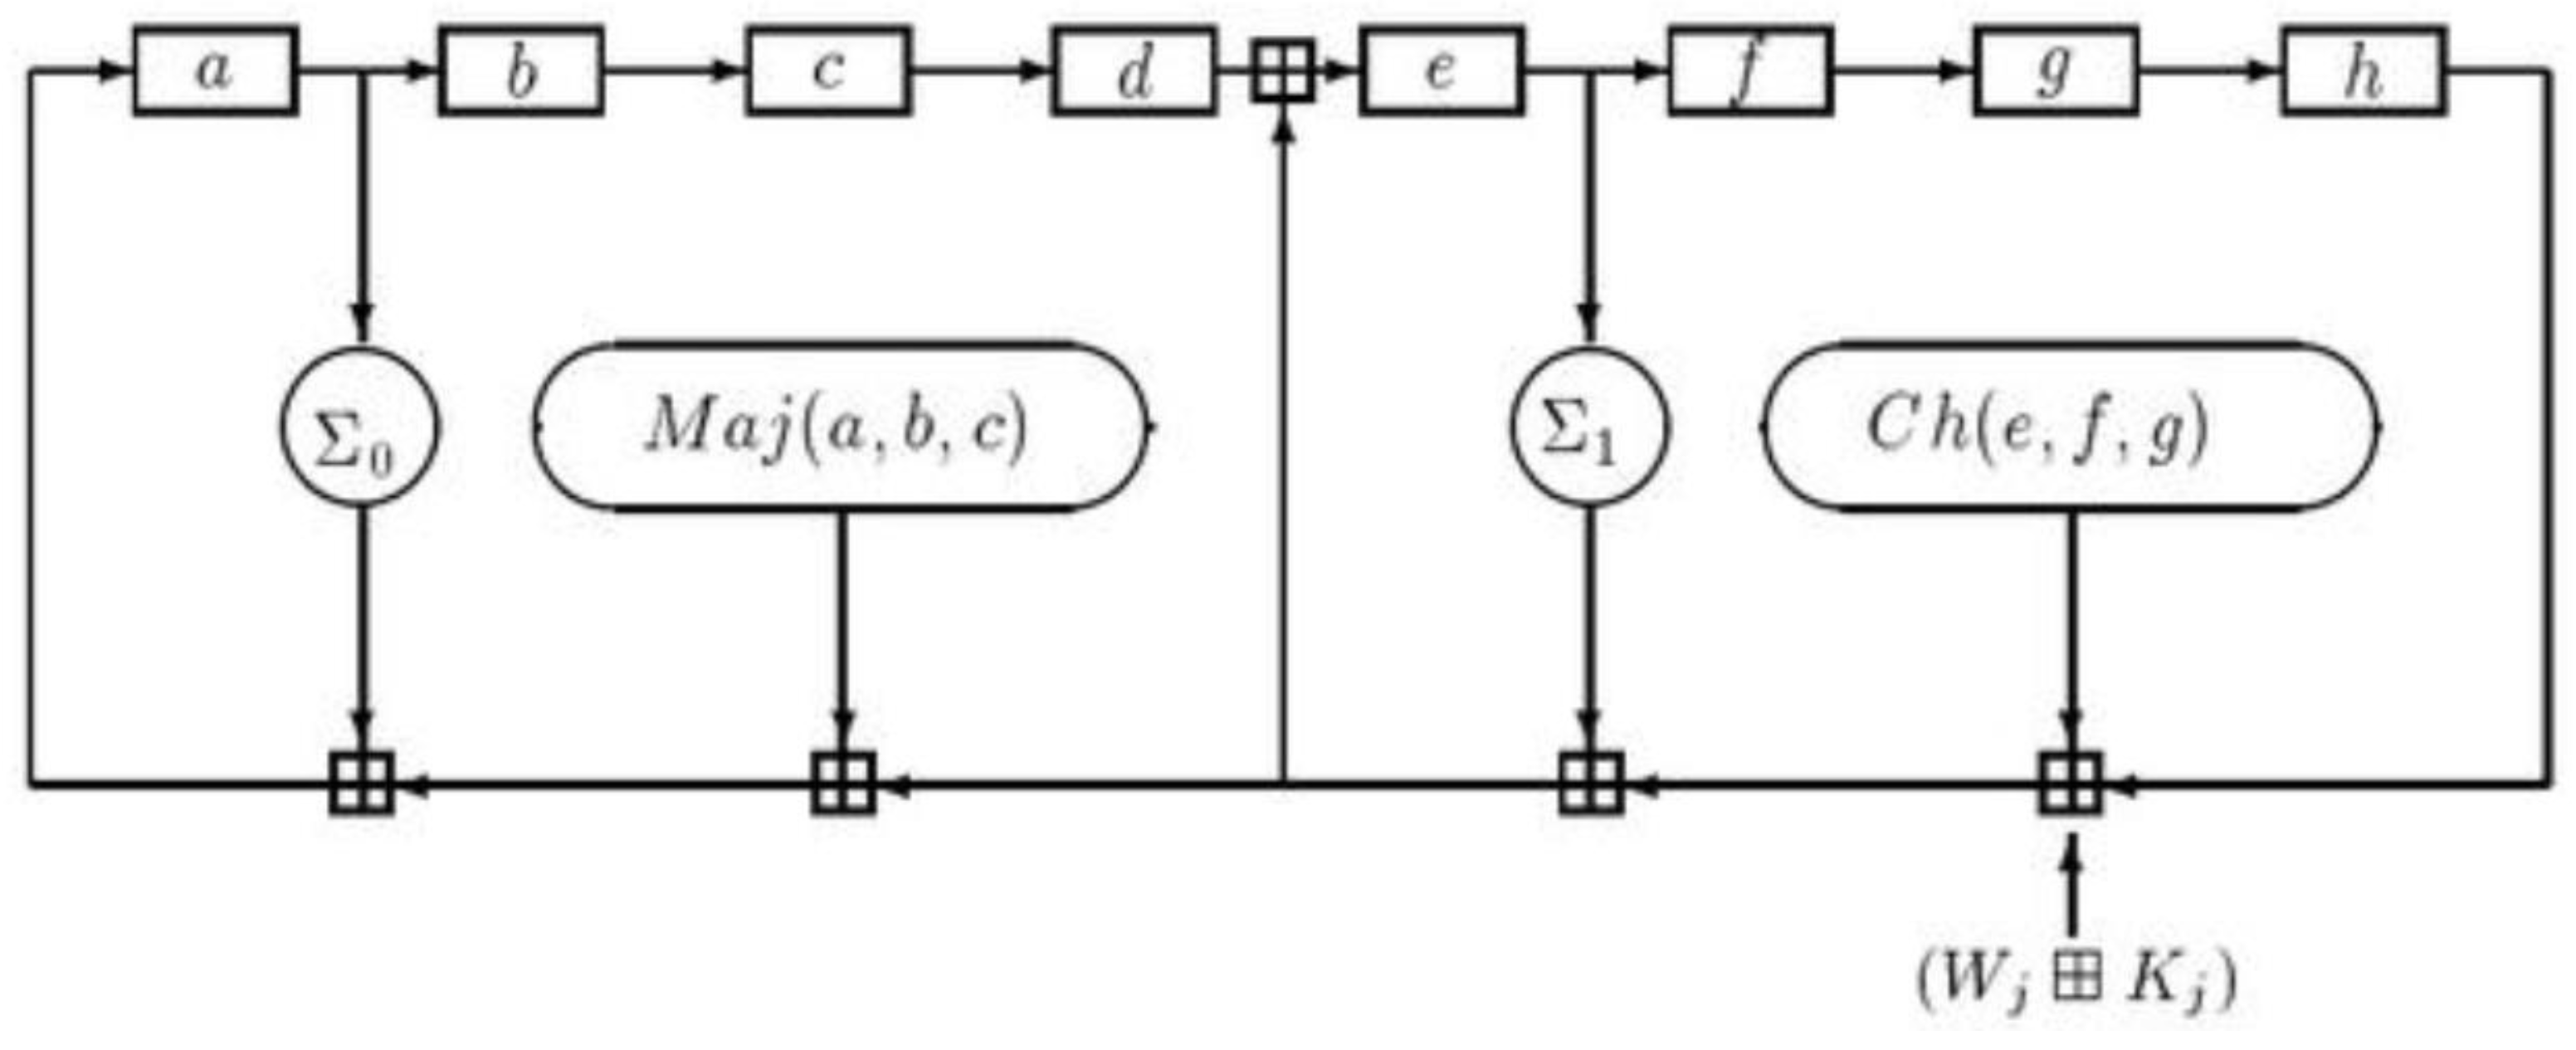
We can apply the SHA-256 compression function to update a,b,c,d,e,f,g,h. Then calculate the -th intermediate hash value as follow:
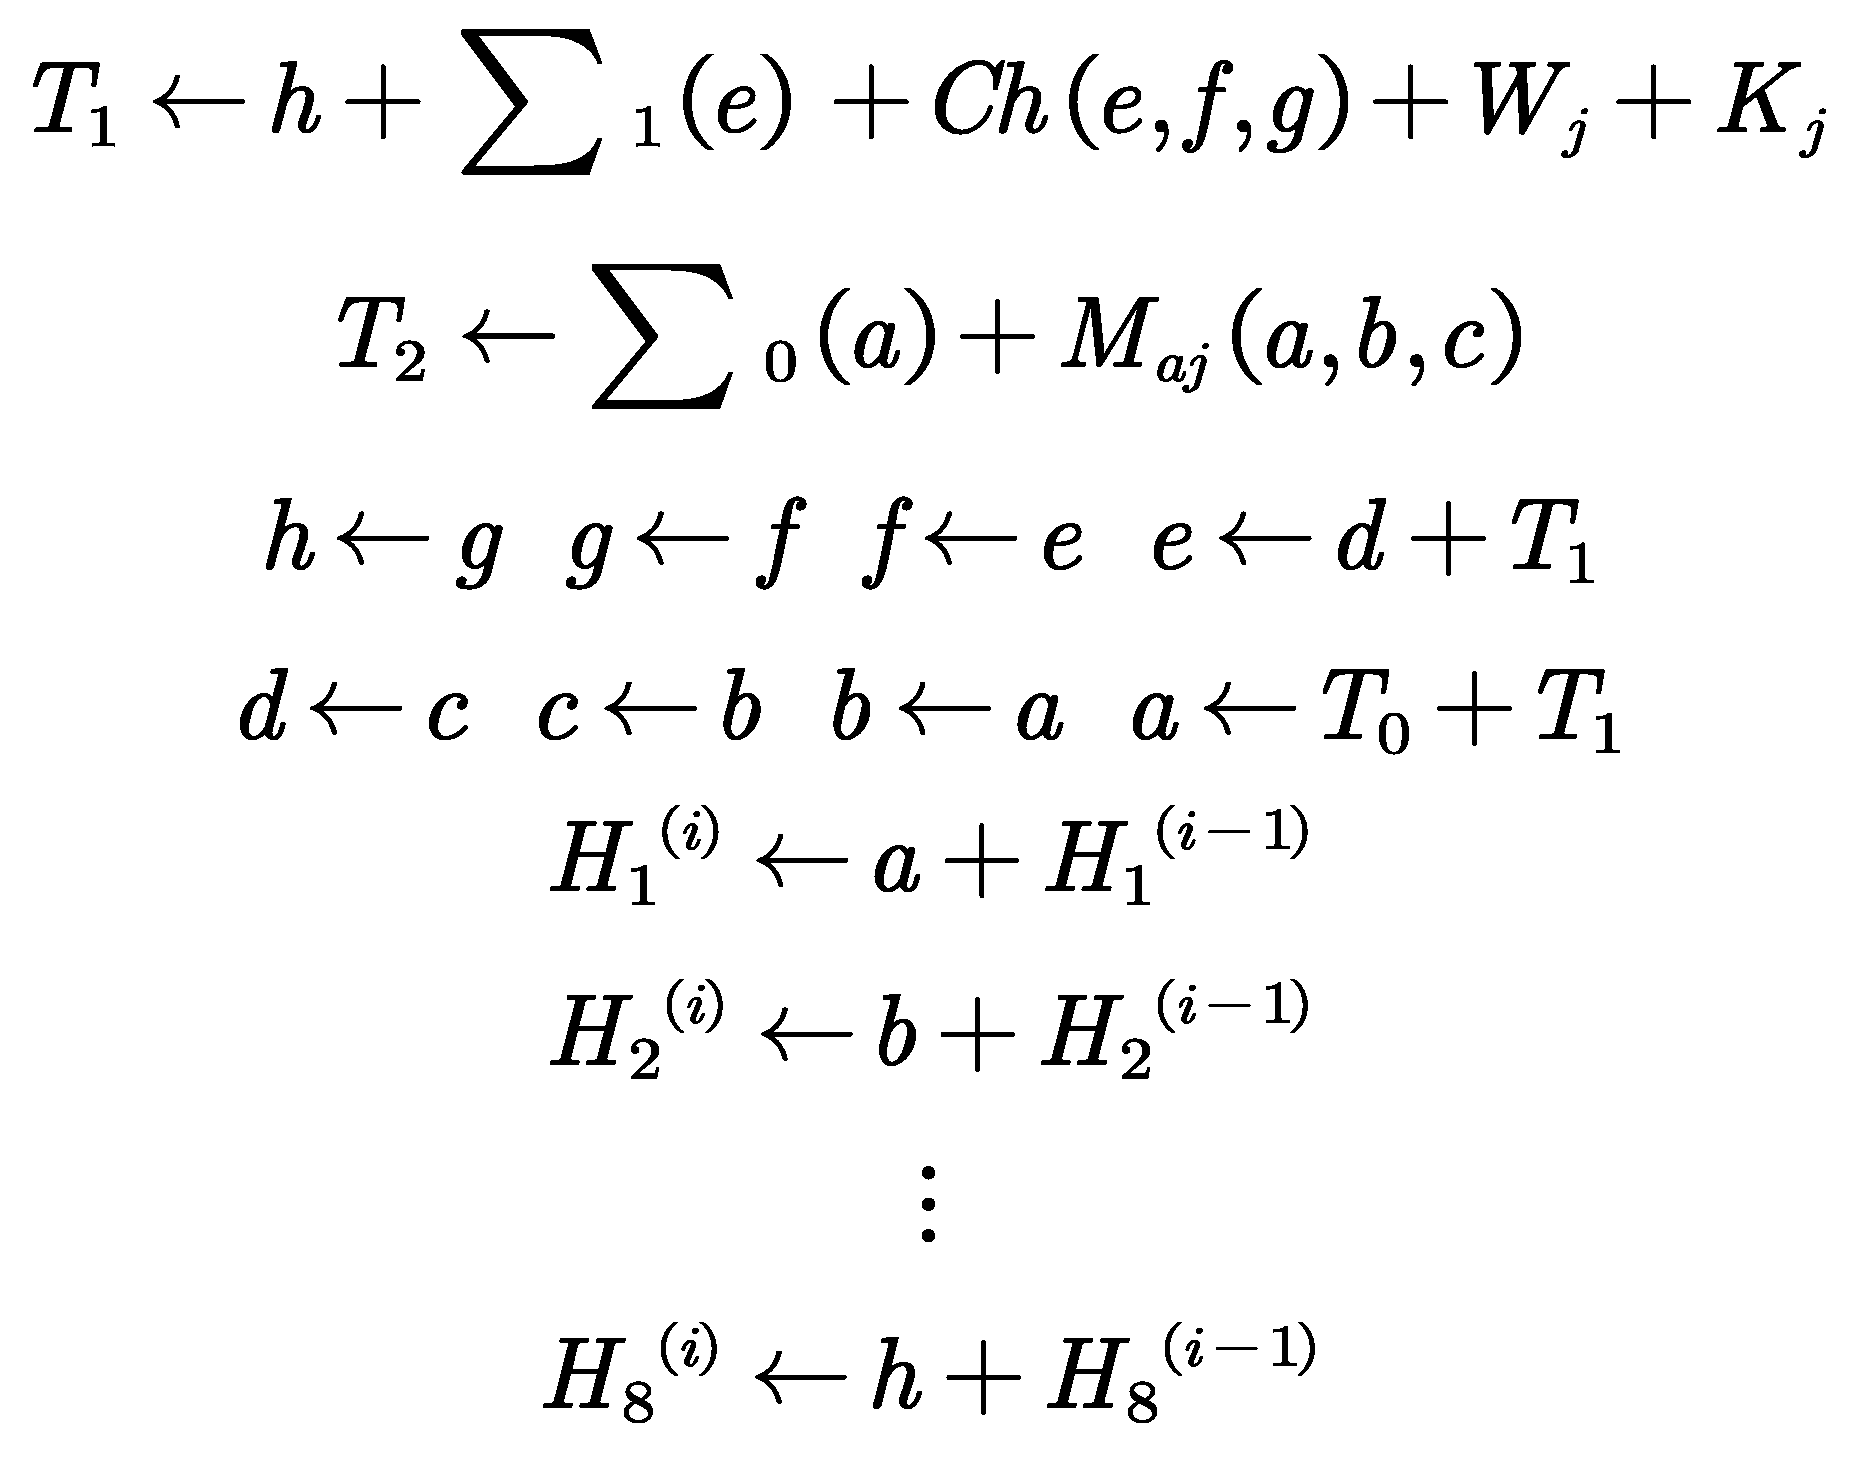
Figure 4.
j-th internal step of the SHA-256 compression function.
In the photovoltaic power generation system, AES encryption ensures the confidentiality of real-time power generation data and environmental sensor data; the SHA-256 hash algorithm generates authentication codes that ensure data integrity; key exchange algorithms securely generate symmetric keys used for encryption. These cipher suites work together to protect data transmission in photovoltaic power generation systems, preventing data leakage and tampering.
TLS protocols are used to solve problems in the fields of data encryption, data integrity, and identity verification in PV power generation systems, which is practically used in the field of data encryption and data integrity and identity authentication. Data encryption guarantees the confidentiality of transmitted data, which makes it impossible to access even if the data is intercepted, the integrity of the data can be protected by using the MAC function, which prevents malicious changes, and identity verification via digital certificates prevents man-in-the-middle attacks, which ensures that devices can trust the server they are connected to, thus lowering network security risks.
4.3. Two Different Kinds of Attrition in the Data Collection Stage Countermeasures
Active Adversaries
Active adversaries try to mess with and tamper with the transmission of photovoltaic power generation data, using tactics like data tampering, man-in-the-middle attacks, or replay attacks. To tackle these threats, we can use data encryption and integrity checking techniques. The TLS protocol offers encryption protection at the transport layer, making sure that data isn’t intercepted or changed while it’s being sent over the network. At the application layer, methods like the Paillier algorithm allow for secure aggregation and computation on encrypted data, stopping any malicious modifications in their tracks. Plus, adding message authentication codes (MACs) and timestamps helps further safeguard data integrity and prevents those pesky replay attacks.
Honest but Curious Adversaries
Honest but curious adversaries might follow the protocol, but they may also try to dig deeper for extra information from encrypted data. In these situations, homomorphic encryption technologies like the Paillier algorithm and BVG algorithm do a great job of protecting data privacy. The Paillier algorithm’s additive homomorphism lets us perform calculations on encrypted data while keeping everything private during processing. Meanwhile, the BVG algorithm can handle complex operations on encrypted data, making it perfect for analyzing intricate environmental data. These encryption methods ensure that even if adversaries attempt to analyze the encrypted information, they won’t be able to pull out any useful sensitive details.
5. Data Storage Phase of Photovoltaic Power Generation Systems Based on Homomorphic Encryption
5.1. Limitations of Traditional Photovoltaic Power Generation Data Storage
Insufficient Data Privacy Protection
Traditional data storage methods often keep data in plaintext within databases, which makes them vulnerable to attacks from outside threats and doesn’t implement effective encryption measures. Even if encryption is used during data transmission, this still poses significant privacy risks. If someone gains unauthorized access to a database or if data gets leaked, sensitive information related to photovoltaic power generation—like power output and environmental conditions—could fall into the hands of malicious actors. These shortcomings in privacy protection can lead to user data breaches and theft of commercial secrets, putting the overall security of the power system at risk. So, improving privacy protection during the data storage phase through encrypted storage technologies is crucial for enhancing data security.
Inadequate Support for Big Data Processing
The amount of data generated by photovoltaic power generation systems is massive, covering everything from real-time power generation figures to environmental monitoring details. Traditional storage solutions might struggle with such large-scale datasets, leading to performance issues and delays in processing and forecasting power needs. This can seriously affect how efficiently we access data as well as the timeliness and accuracy of our analyses. For example, traditional systems may run into problems when dealing with high-frequency read-and-write operations, causing delays that impact real-time monitoring and forecasting capabilities. Therefore, there’s an urgent need for improvements in traditional storage solutions so they can better support efficient big data processing. We recommend looking into distributed storage systems or optimizing how we manage our data to boost overall performance and processing capabilities.
5.2. Two Feasible Technological Approaches Analysis Based on Homomorphic Encryption
This paper totally employs homomorphic encryption technologies, such as the Paillier and BVG algorithms, which allow operations on encrypted data without the requirement of decryption. In photovoltaic power generation systems, this means that data can be securely stored and processed in its encrypted state, so guaranteeing user privacy during the analysis phase and avoiding unauthorized access. Based on this, two feasible operational approaches are proposed to further increase the security of raw data during the data storage phase, as explained below:
Key Management
Important administration for the purpose of ensuring the protection of system information, which is the security of encryption keys; in PV power generation systems; the main function of this is to control the system's data by means of key management. A photovoltaic structure maybe of devices distributed in different places, the data of which are aggregated and studied by central control .
Key Management is used to keep the system's environmental sensor in a hardware security module (DSM) in which the parameters were each used by every component of the PV module and that the sensor in the system was used in a Hardware Security Module (HSM). A key management system is used by the data storage phase which can be used to make the keys more secure at any point of time; a key management can be rotated by the key in the data to get the information of the key, for example the key exchange process of encrypted data by the following formula is calculated as follows:
where is the new key, is the old key, and is a random number generated by a random number generator. This ensures that even if the old key is compromised, the new key will still effectively protect the data.
Access Control and Auditing
The only people who can access encrypted data in PV electricity generation systems; the only users who cannot access the system are those who know it, which is the ability to use access control and auditing systems. The functions (such as the administrator, operator, and maintenance personnel) of the system might be used to define the access control policy of that system.
Suppose the central control system of the photovoltaic power generation system implements fine-grained access control policies. Administrators can use Role-Based Access Control (RBAC) to grant different permissions. For example, operators may access real-time power generation data, while only administrators can access all encrypted environmental data and system configurations. The system keeps track of all access attempts in its logs and uses hash functions (like SHA-256) to create Message Authentication Codes (MACs) for the audit logs, making sure they’re both authentic and intact. The audit logs might include records such as:
This makes sure that any unauthorized access attempts are logged, and it protects the integrity of all records. With this approach, we can effectively keep an eye on and secure the data in the photovoltaic power generation system.
6. Data Processing and Analysis Phase of Photovoltaic Power Generation Systems Based on Homomorphic Encryption
6.1. Data Preprocessing
Information from different sensor installed in PV installations is used to collect the data in the phase of collection of data which includes the temperature of PV panel , the panel's performance , environmental condition, etc., the sensors which are used to measure the parameters such as solar irradiance, temperature, and the panel performance. The data obtained is very much important for the real-time monitoring of, the performance appraisal as well as the predictive maintenance of the data collected. The network infrastructure which can deal with the huge amount of data which are continuously generated by these sensors is very necessary for the effective collection of the data.
This passage makes full use of the open-source solar energy data available on the NREL Transforming ENERGY website for integrated research and data analysis. The open-source dataset encompasses solar energy data from both western and eastern states of the United States, covering a two-year period from January 1, 2022, to December 31, 2023. It includes solar power generation data from approximately 6,000 photovoltaic (PV) stations recorded every 15 minutes, along with daily forecast results on an hourly basis, amounting to a total of about 420,000 historical data points. The dataset is extensive, incorporating various influencing factors such as real-time atmospheric pressure, relative humidity, wind speed and direction at 10 meters, cloud cover, temperature, and irradiance intensity. With data sourced from a wide range of regions across the U.S. and spanning a significant period, this dataset offers broad geographic coverage and temporal scope, ensuring that the analysis is not limited by the specific study area or time frame.
Handling Missing Values with Mean Imputation : Considering the numerous missing data points in the original dataset, this study employs a basic imputation method using the mean value for a given time period. Specifically, missing values are addressed by calculating the mean of each influencing factor over a one-day period, which consists of 96 data points. This approach provides a straightforward method for filling in gaps in the data, ensuring continuity and usability for subsequent analysis.The following is a graph showing the trend of the processed data :
Figure 5.
(a) Mean Imputation Diagram (b) Graph Showing the Trend of Photovoltaic Power Generation.
After that the data after mean imputation are separated into many smaller datasets according to the spatial location and time intervals of the fixed length. Different influencing variables are analysed for each dataset such as, the real-time atmospheric pressure, relative humidity, wind speed and the direction at a distance of 10 m, cloud cover, temperature and irradiance intensity are extracted for each of the datasets. The number of times the slope of the curve changes are extracted and the variance, range and statistical parameters are used for the extraction of statistical parameters, such as the number of times it changes the slope of the curve.
To simplify the difficulty of providing the data preprocessing results in empirical findings, the photovoltaic power generation data from January 1 to January 4, 2022;is selected as an example to illustrate the empirical conclusions. The following graph shows the trend of photovoltaic power generation over 4 days, with 96 data points per day, representing the changes in power generation from 00:00 to 24:00 each day:
Figure 6.
Trend Chart of Photovoltaic Power Generation from 00:00 to 24:00 Over 4 Days.
In the data collection phase, key generation and encryption processes are completed, maintaining encrypted form through the first three stages. In the data processing and analysis phase, data needs to be processed and analyzed. Total power generation data for any given moment at each photovoltaic power generation node can be obtained without decryption (simply by summing the values). For the remaining various environmental data, weighted multiplication operations are required, followed by the following decryption operations:
Decryption Process
m : The plaintext value that corresponds to the ciphertext c.
: The modular inverse of modulo N.
6.2. Clustering: Model Constructed with Improved K-means++ Algorithm
Prior to the start of the actual clustering operation, the traditional K-means clustering procedure needs the initialization of k cluster centroids, which is very important as the K-means algorithm convergence is strongly related to the starting position of the centroids; if the k (or most) centroid is initialized in the same cluster, then the K- means clustering algorithm is unlikely to reach the global minimum in the worst case; when the initial position of the centroids is poor, the clustering results of this algorithm are very seriously defected; when the starting position of the centroid is poor, the results of the clustering are very seriously faulty.
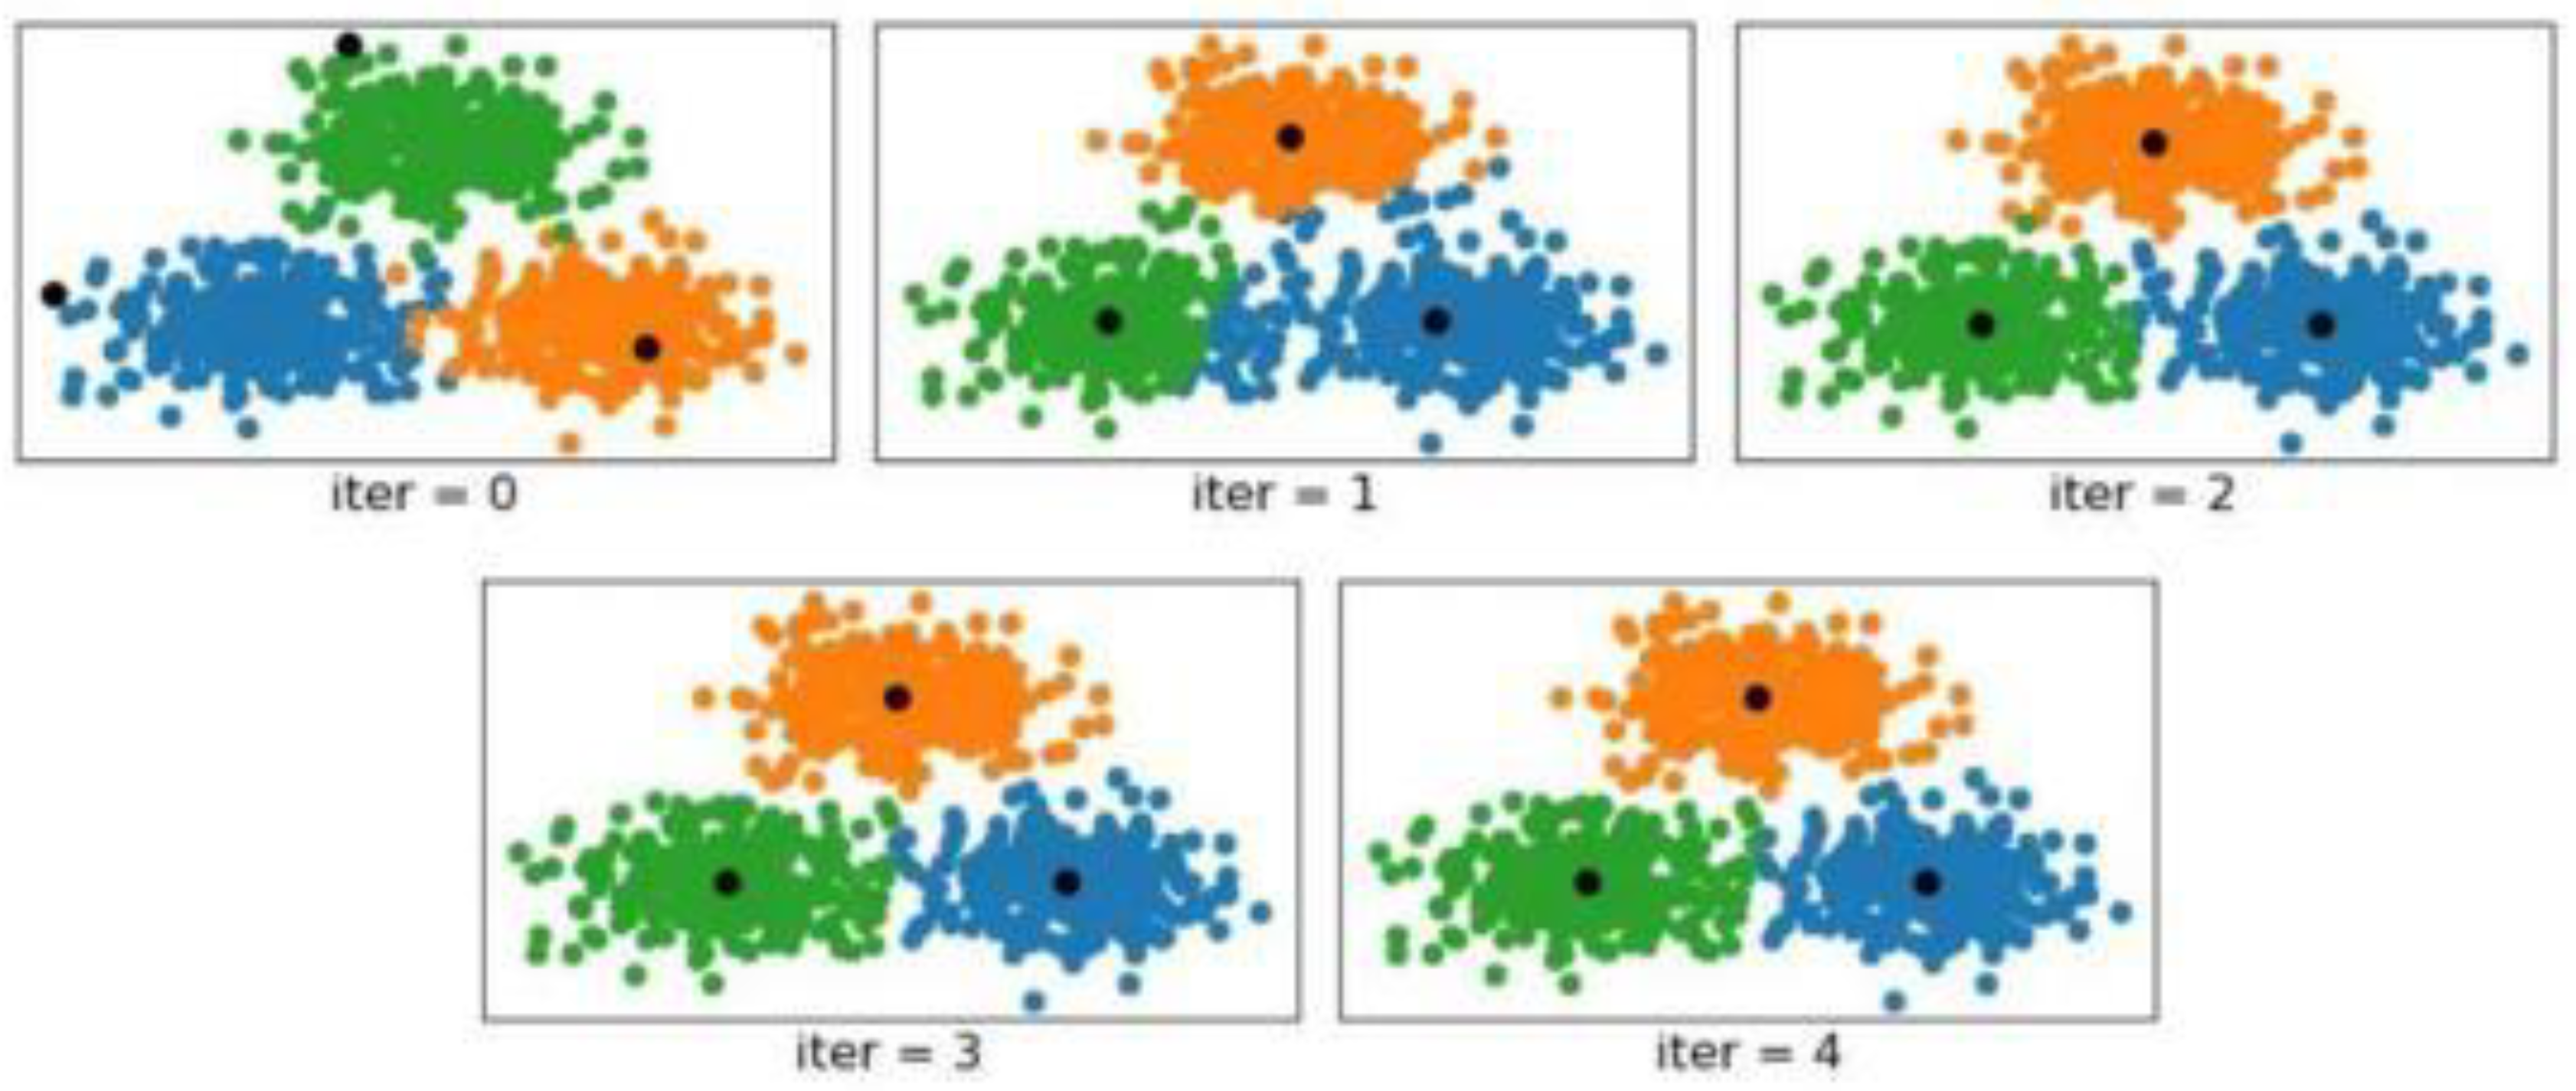
Figure 7.
Diagram of K-means Clustering in Extreme Data Scenarios.
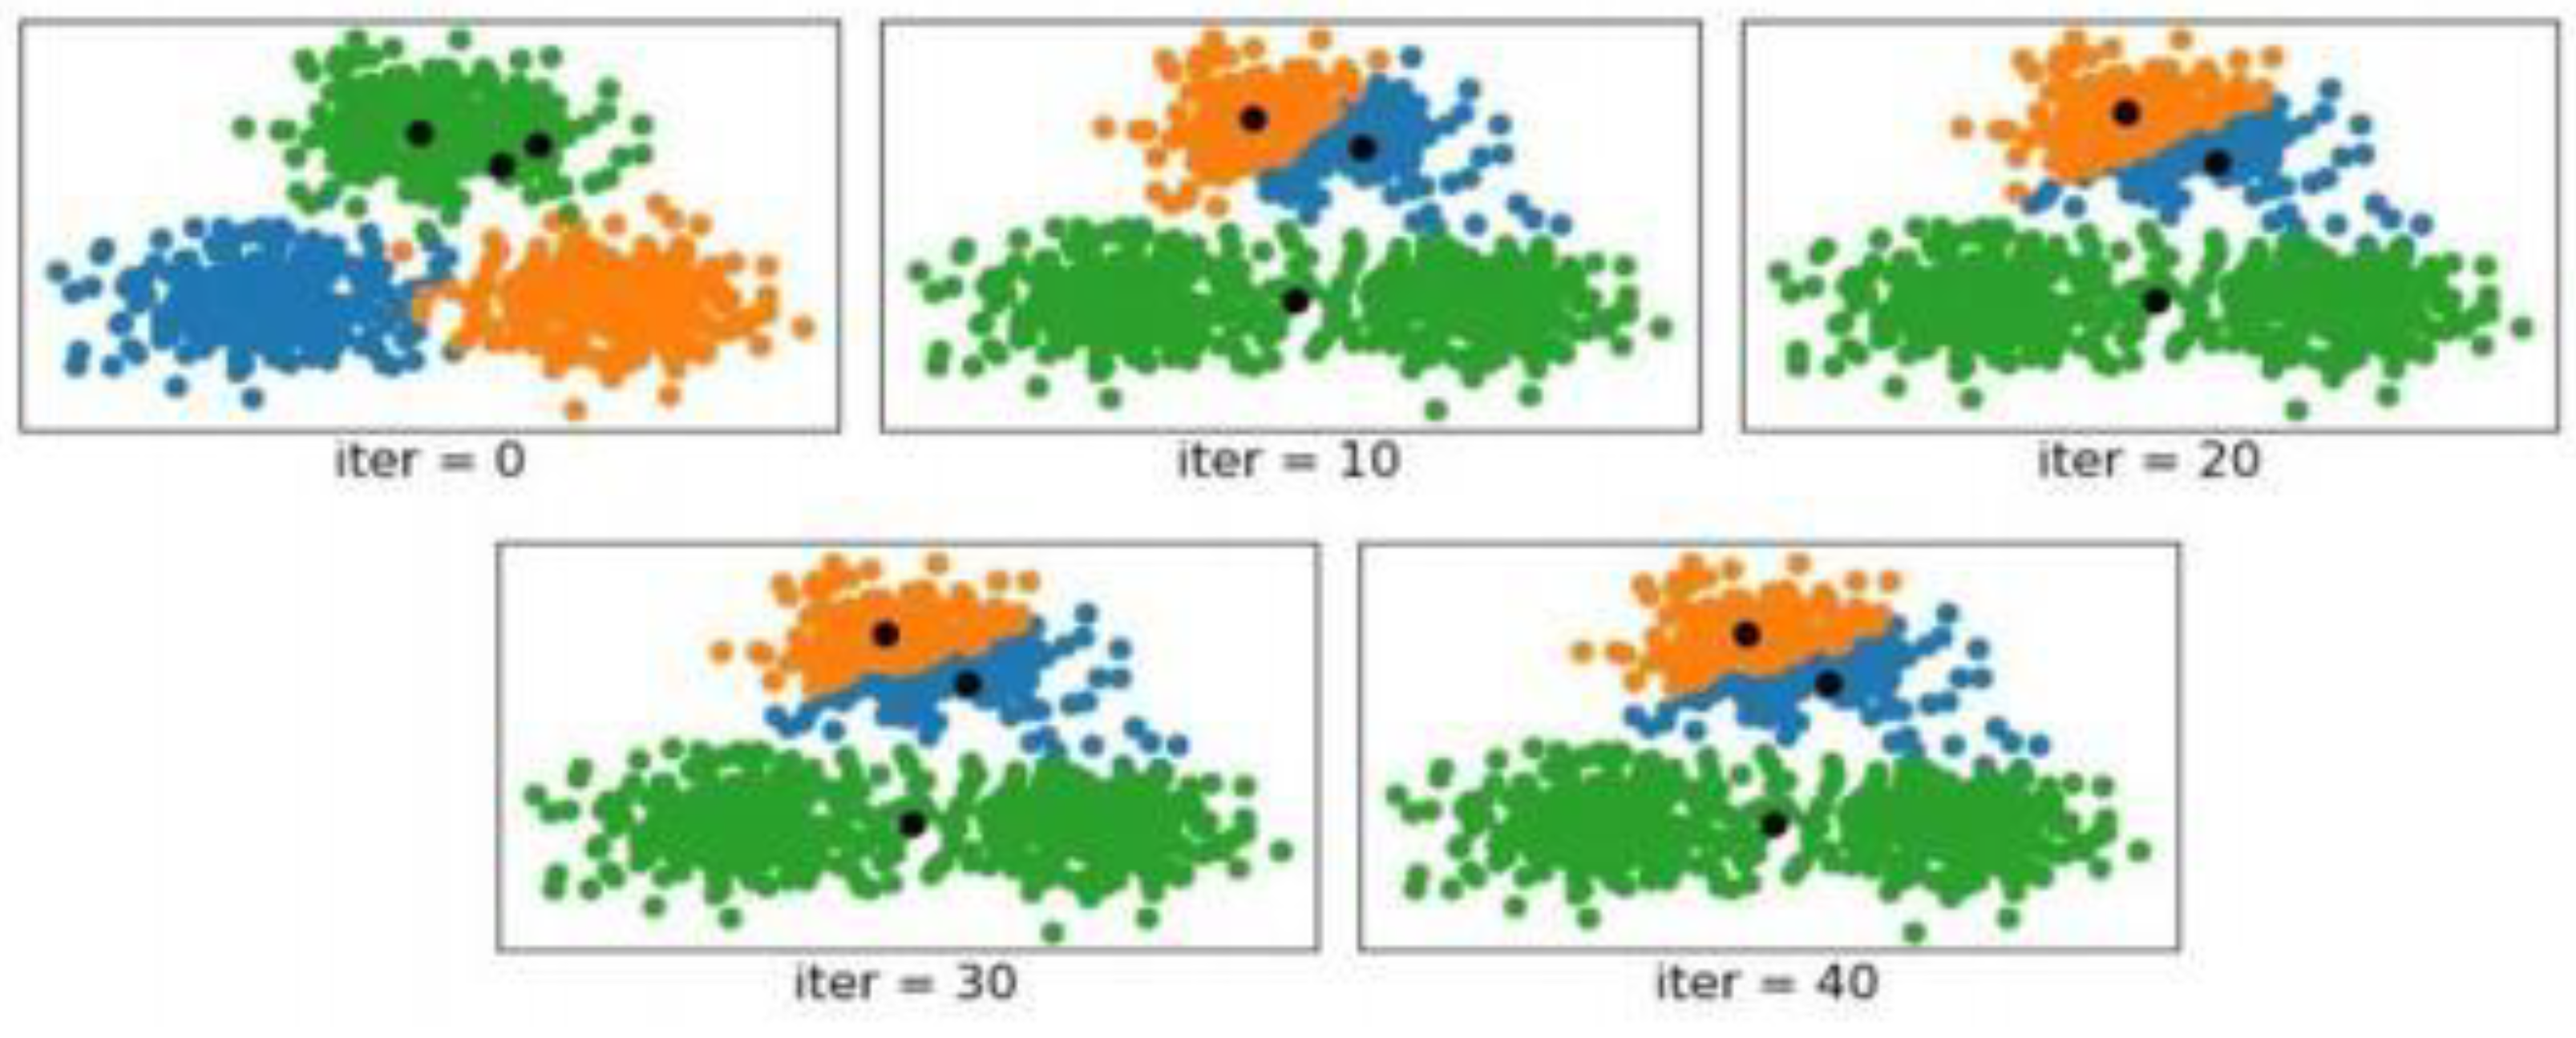
In the scenario where iter=0, the diagram shows the situation before clustering begins, based on the true cluster labels of each sample. The blue, green, and orange colors represent the distribution of the three clusters, with the three black dots indicating the initial centroids. As observed from the diagram, after 10 iterations, K-means has divided the top cluster into two clusters and merged the bottom two clusters into one. By the 30th iteration, the algorithm has started to converge, and subsequent centroids remain unchanged. The final result still shows the top cluster divided into two and the bottom two clusters merged into one. The position of the initialized centroids significantly impacts the final outcome of the K-means clustering method.
Therefore, this study chooses to improve upon the traditional K-means clustering algorithm by using the K-means++ algorithm. The specific steps for this approach can be divided into the following three steps:
Step 1: Randomly (uniformly distributed) select one sample point from each small dataset as the first initial cluster centroid Ci
Step 2: Calculate the shortest distance from each sample to the existing cluster centroids, denoted as D(x). Then, compute the probability P(x) of each sample point being selected as the next cluster centroid based on these distances. Finally, select the sample point corresponding to the maximum probability value (or the probability distribution) as the next cluster centroid.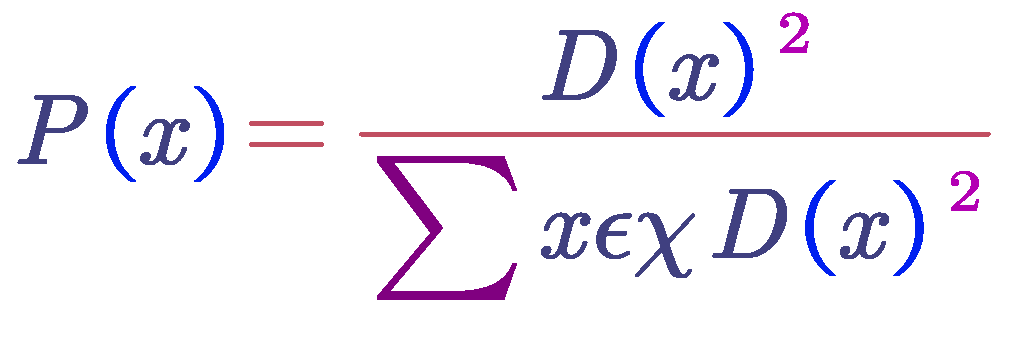
Step 3: The next cluster centroid is the one that was chosen from the previous cluster Centroid until the repeat of Step 2; the procedure of calculating the probability of being a cluster centroid of the individual samples can be interpreted: the selection of samples that are farther from the existing centroids; the higher the probability that the selected cluster centroid will be the following. Figure below shows the results of clustering with the improved K-means++algorithm to the extreme data; the higher the probability of being selected as the following cluster centroid:
Figure 8.
shows the histogram of the K-means++ clustering in typical data situations.
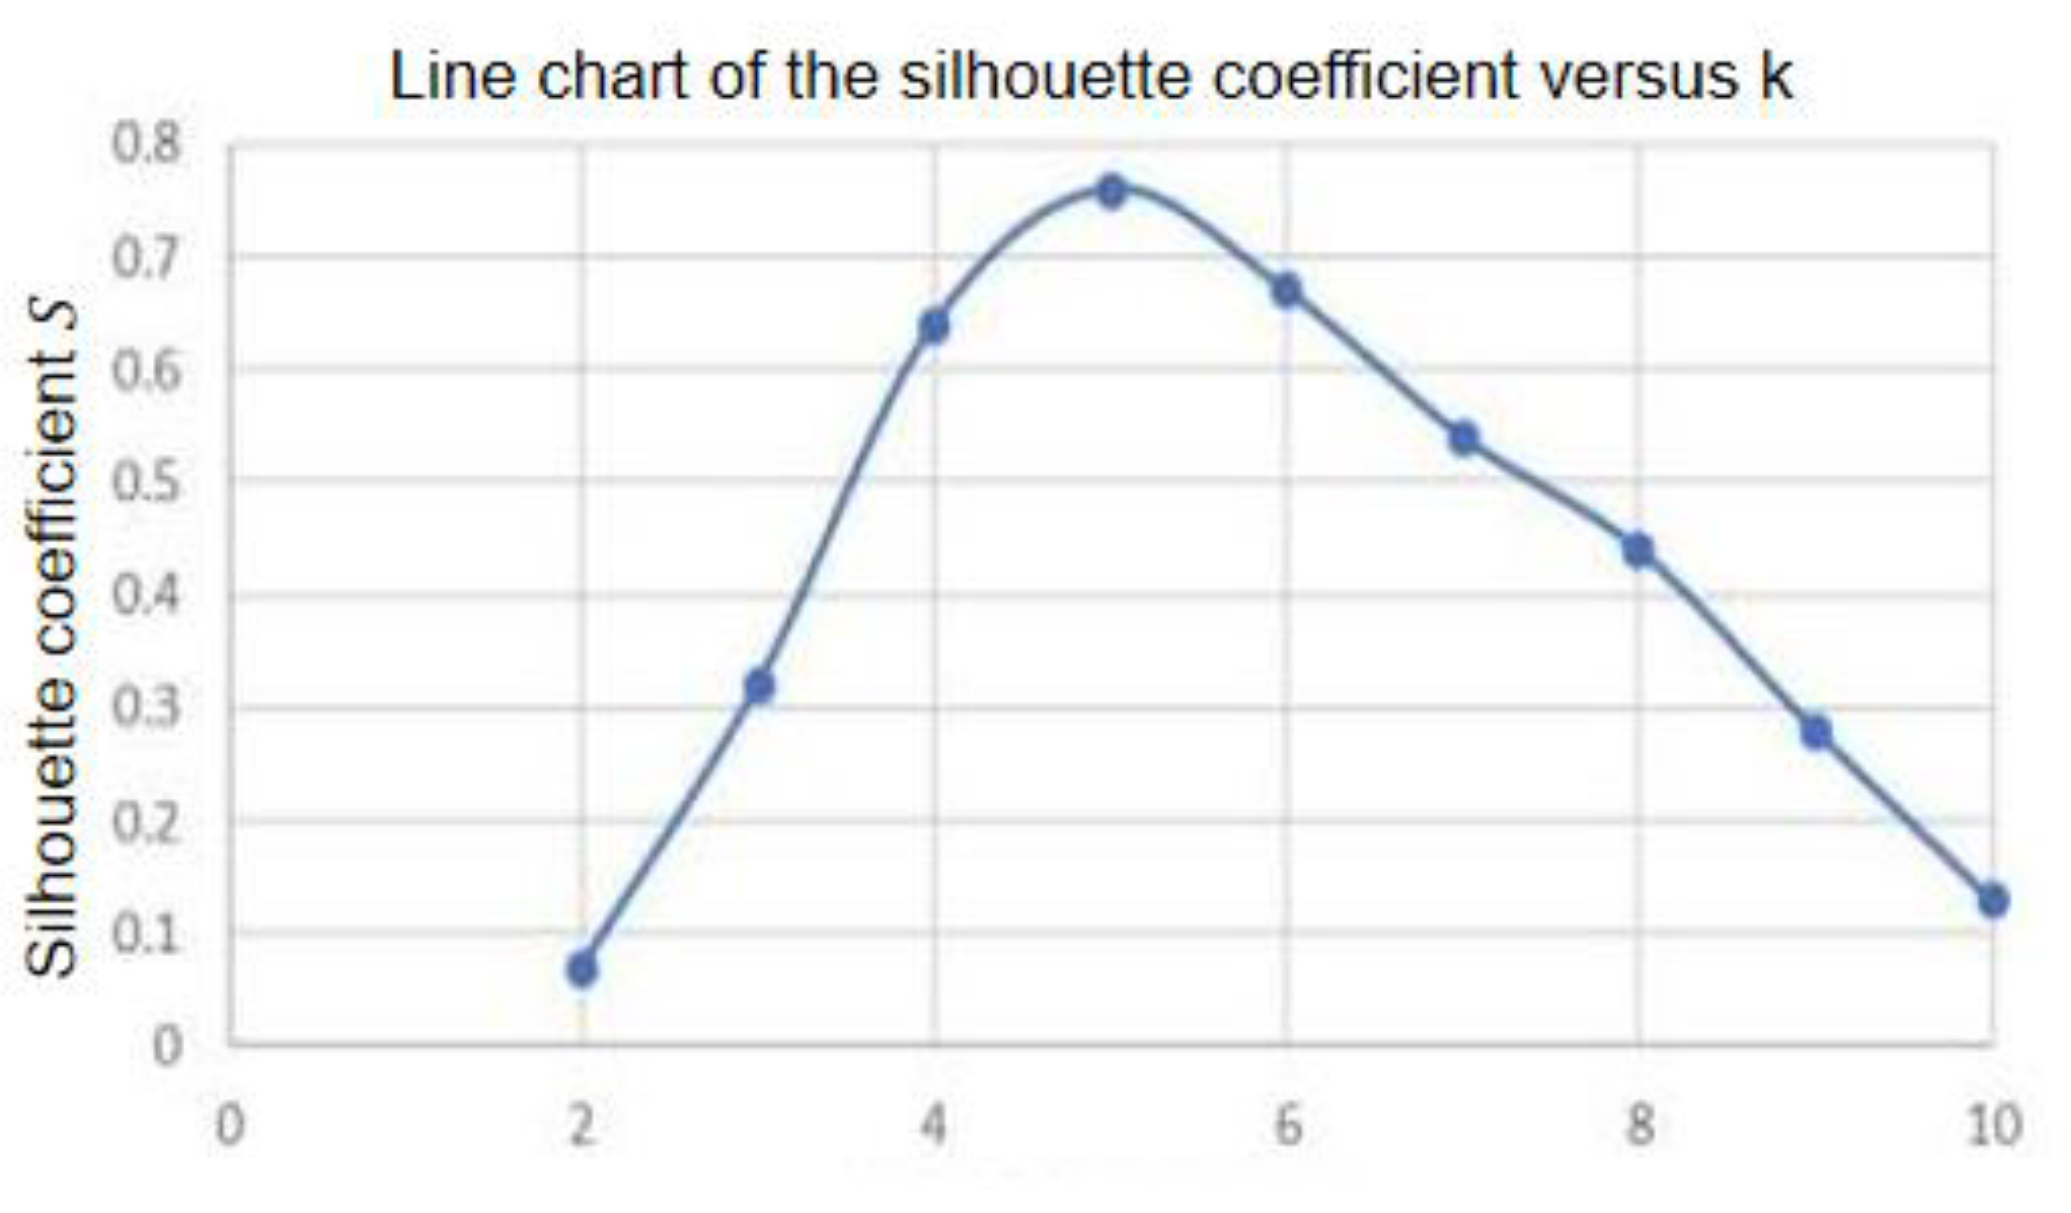
This method divides the analysis for each of the k values by using the values of k in the range of 2 to 10 to determine which values are included in the analysis. After that, the silhouette coefficient for every clustering result is calculated. The silhouette value for the maximum of k is plotted against k, and the k value that corresponds to the greatest of the silhouette coefficient is used to get the final k value. According to the diagram that follows, the silhouette coefficient for k = 5, which is the maximum of S = 0.76, indicates that clustering performance is at its best when k = 5; this indicates that the silhouettes coefficient is at this value.
Figure 9.
Diffierent K values for clustering.
Next, the five cluster models corresponding to the five cluster centers are identified, and the influence weight of each factor within each cluster model is determined. The results are visually presented in the form of a heatmap. The top four factors in terms of influence within each model are highlighted in the following table, and the K-means++ clustering results are visualized in the diagram below:
Figure 10.
Visualization of K-means++ Cluster Results.
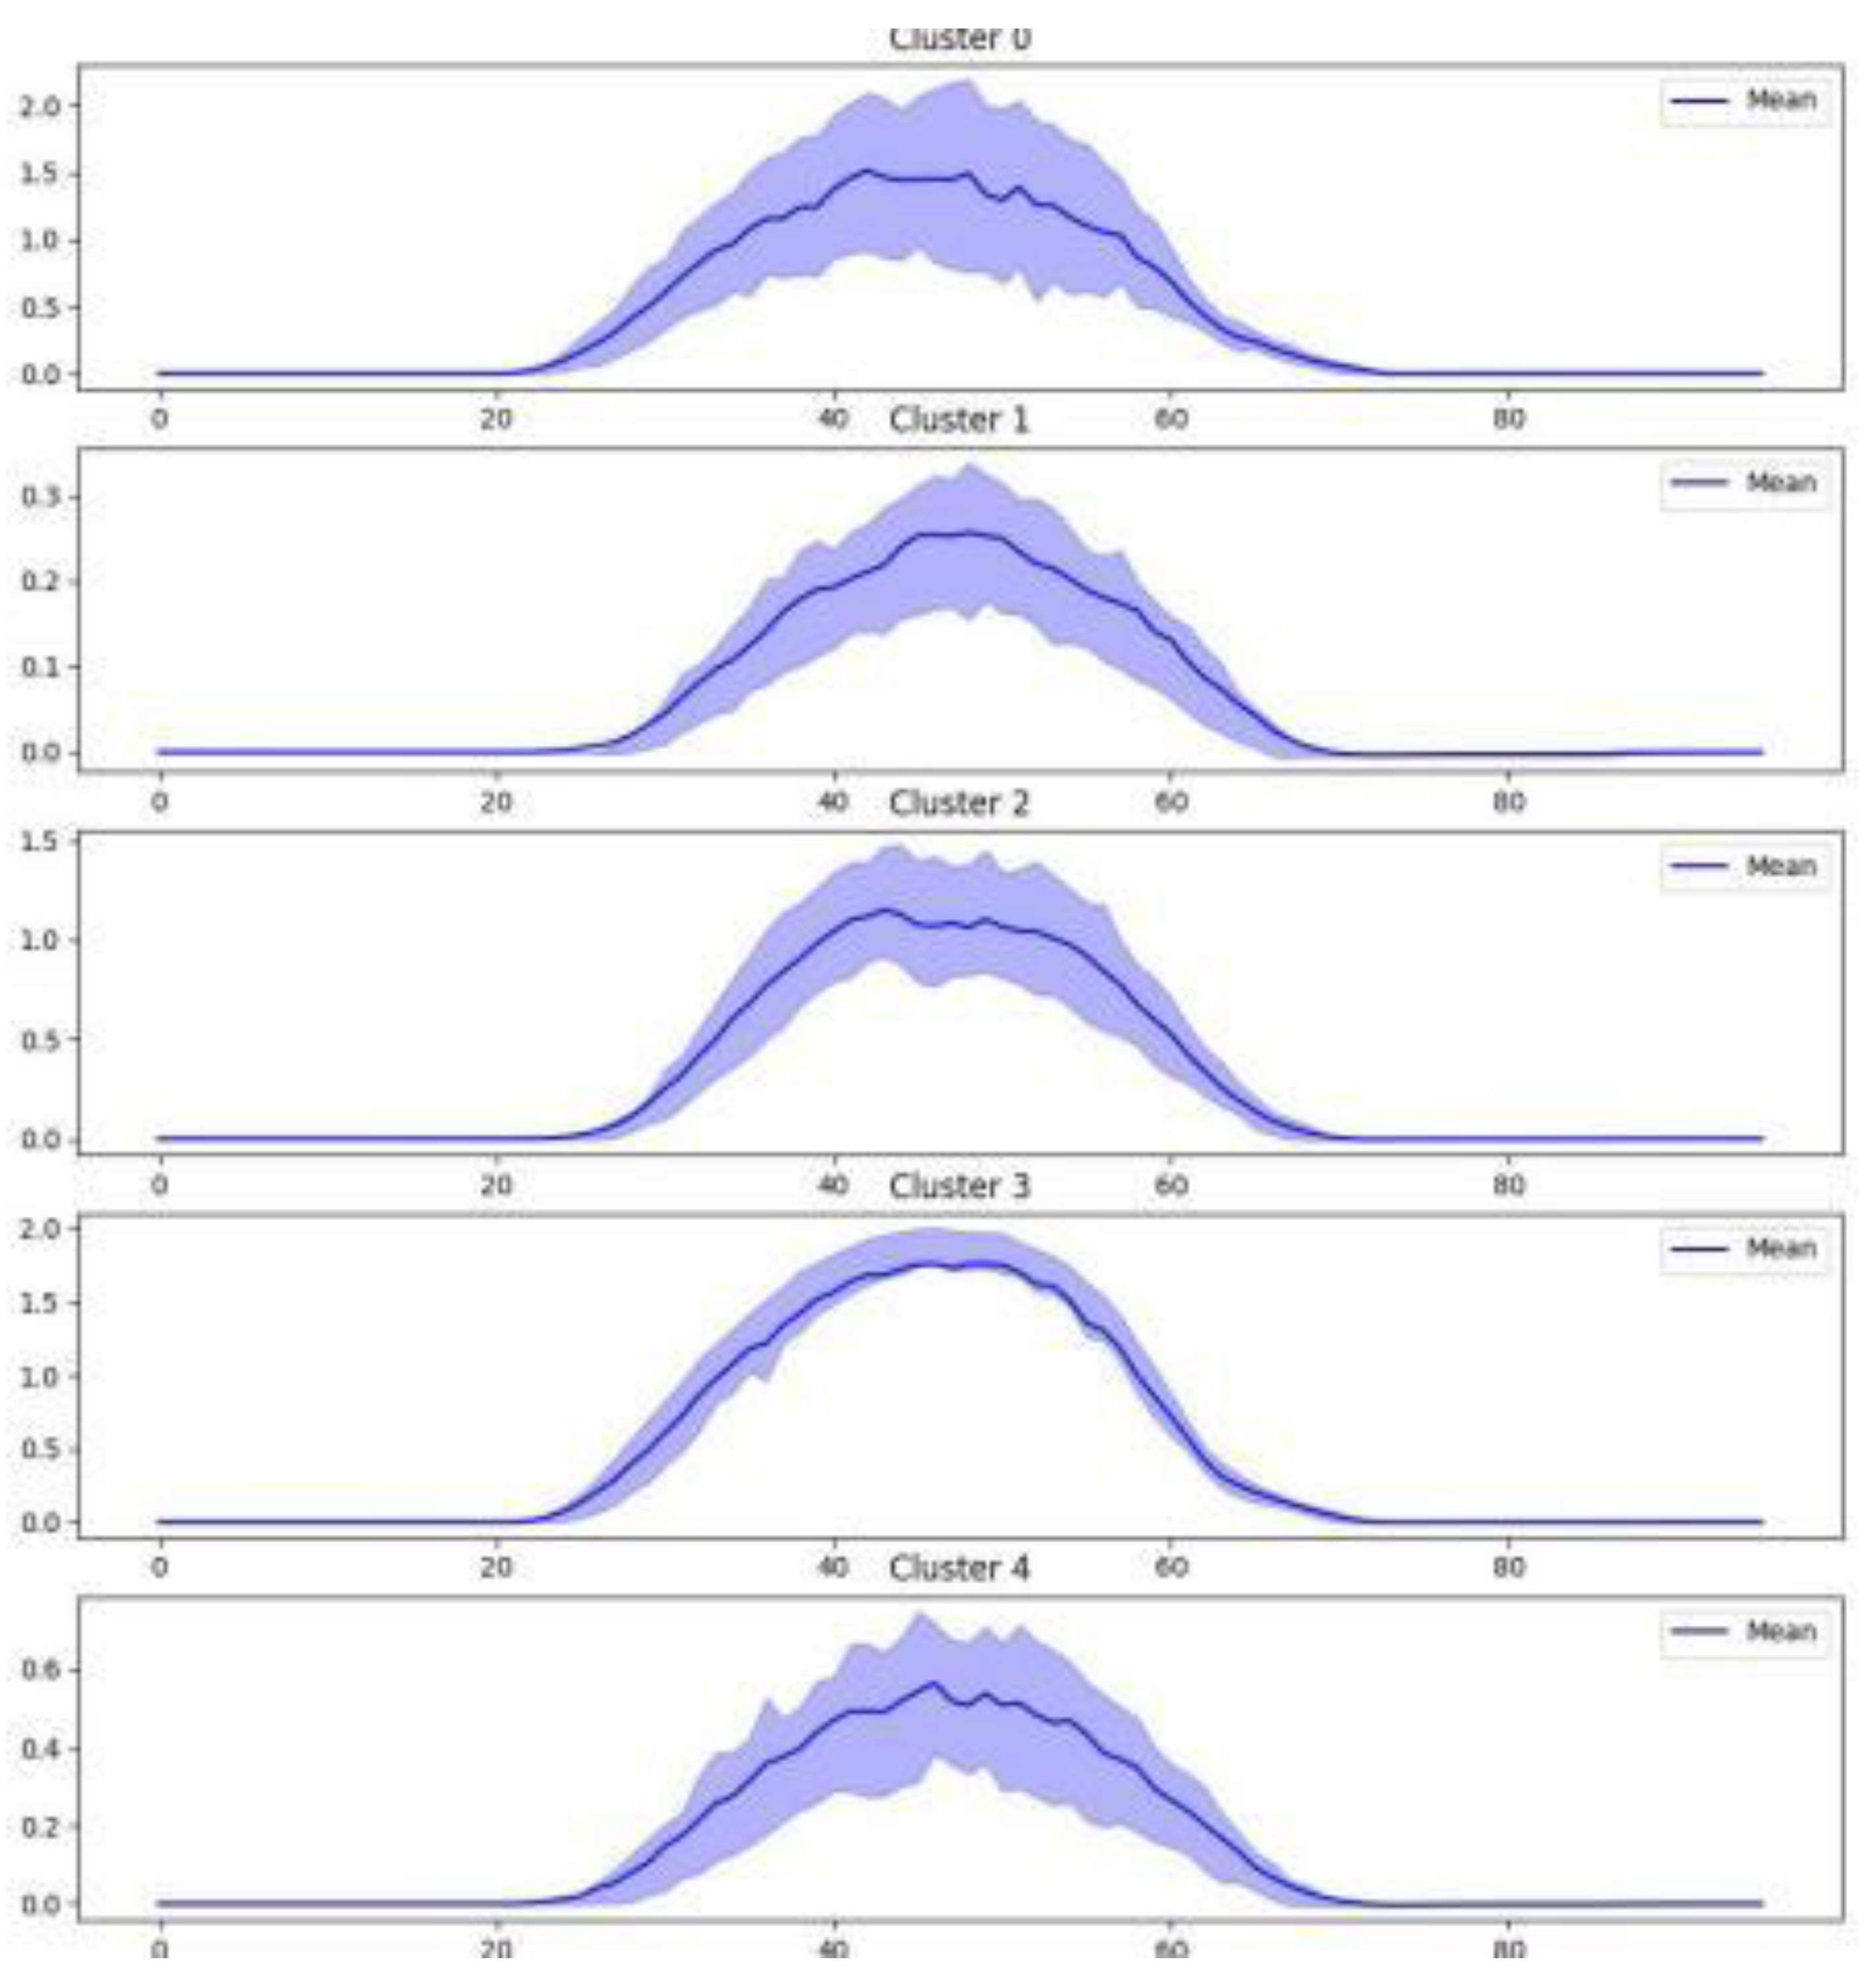
Figure 11.
The heatmap of influencing factors in each clustering model.
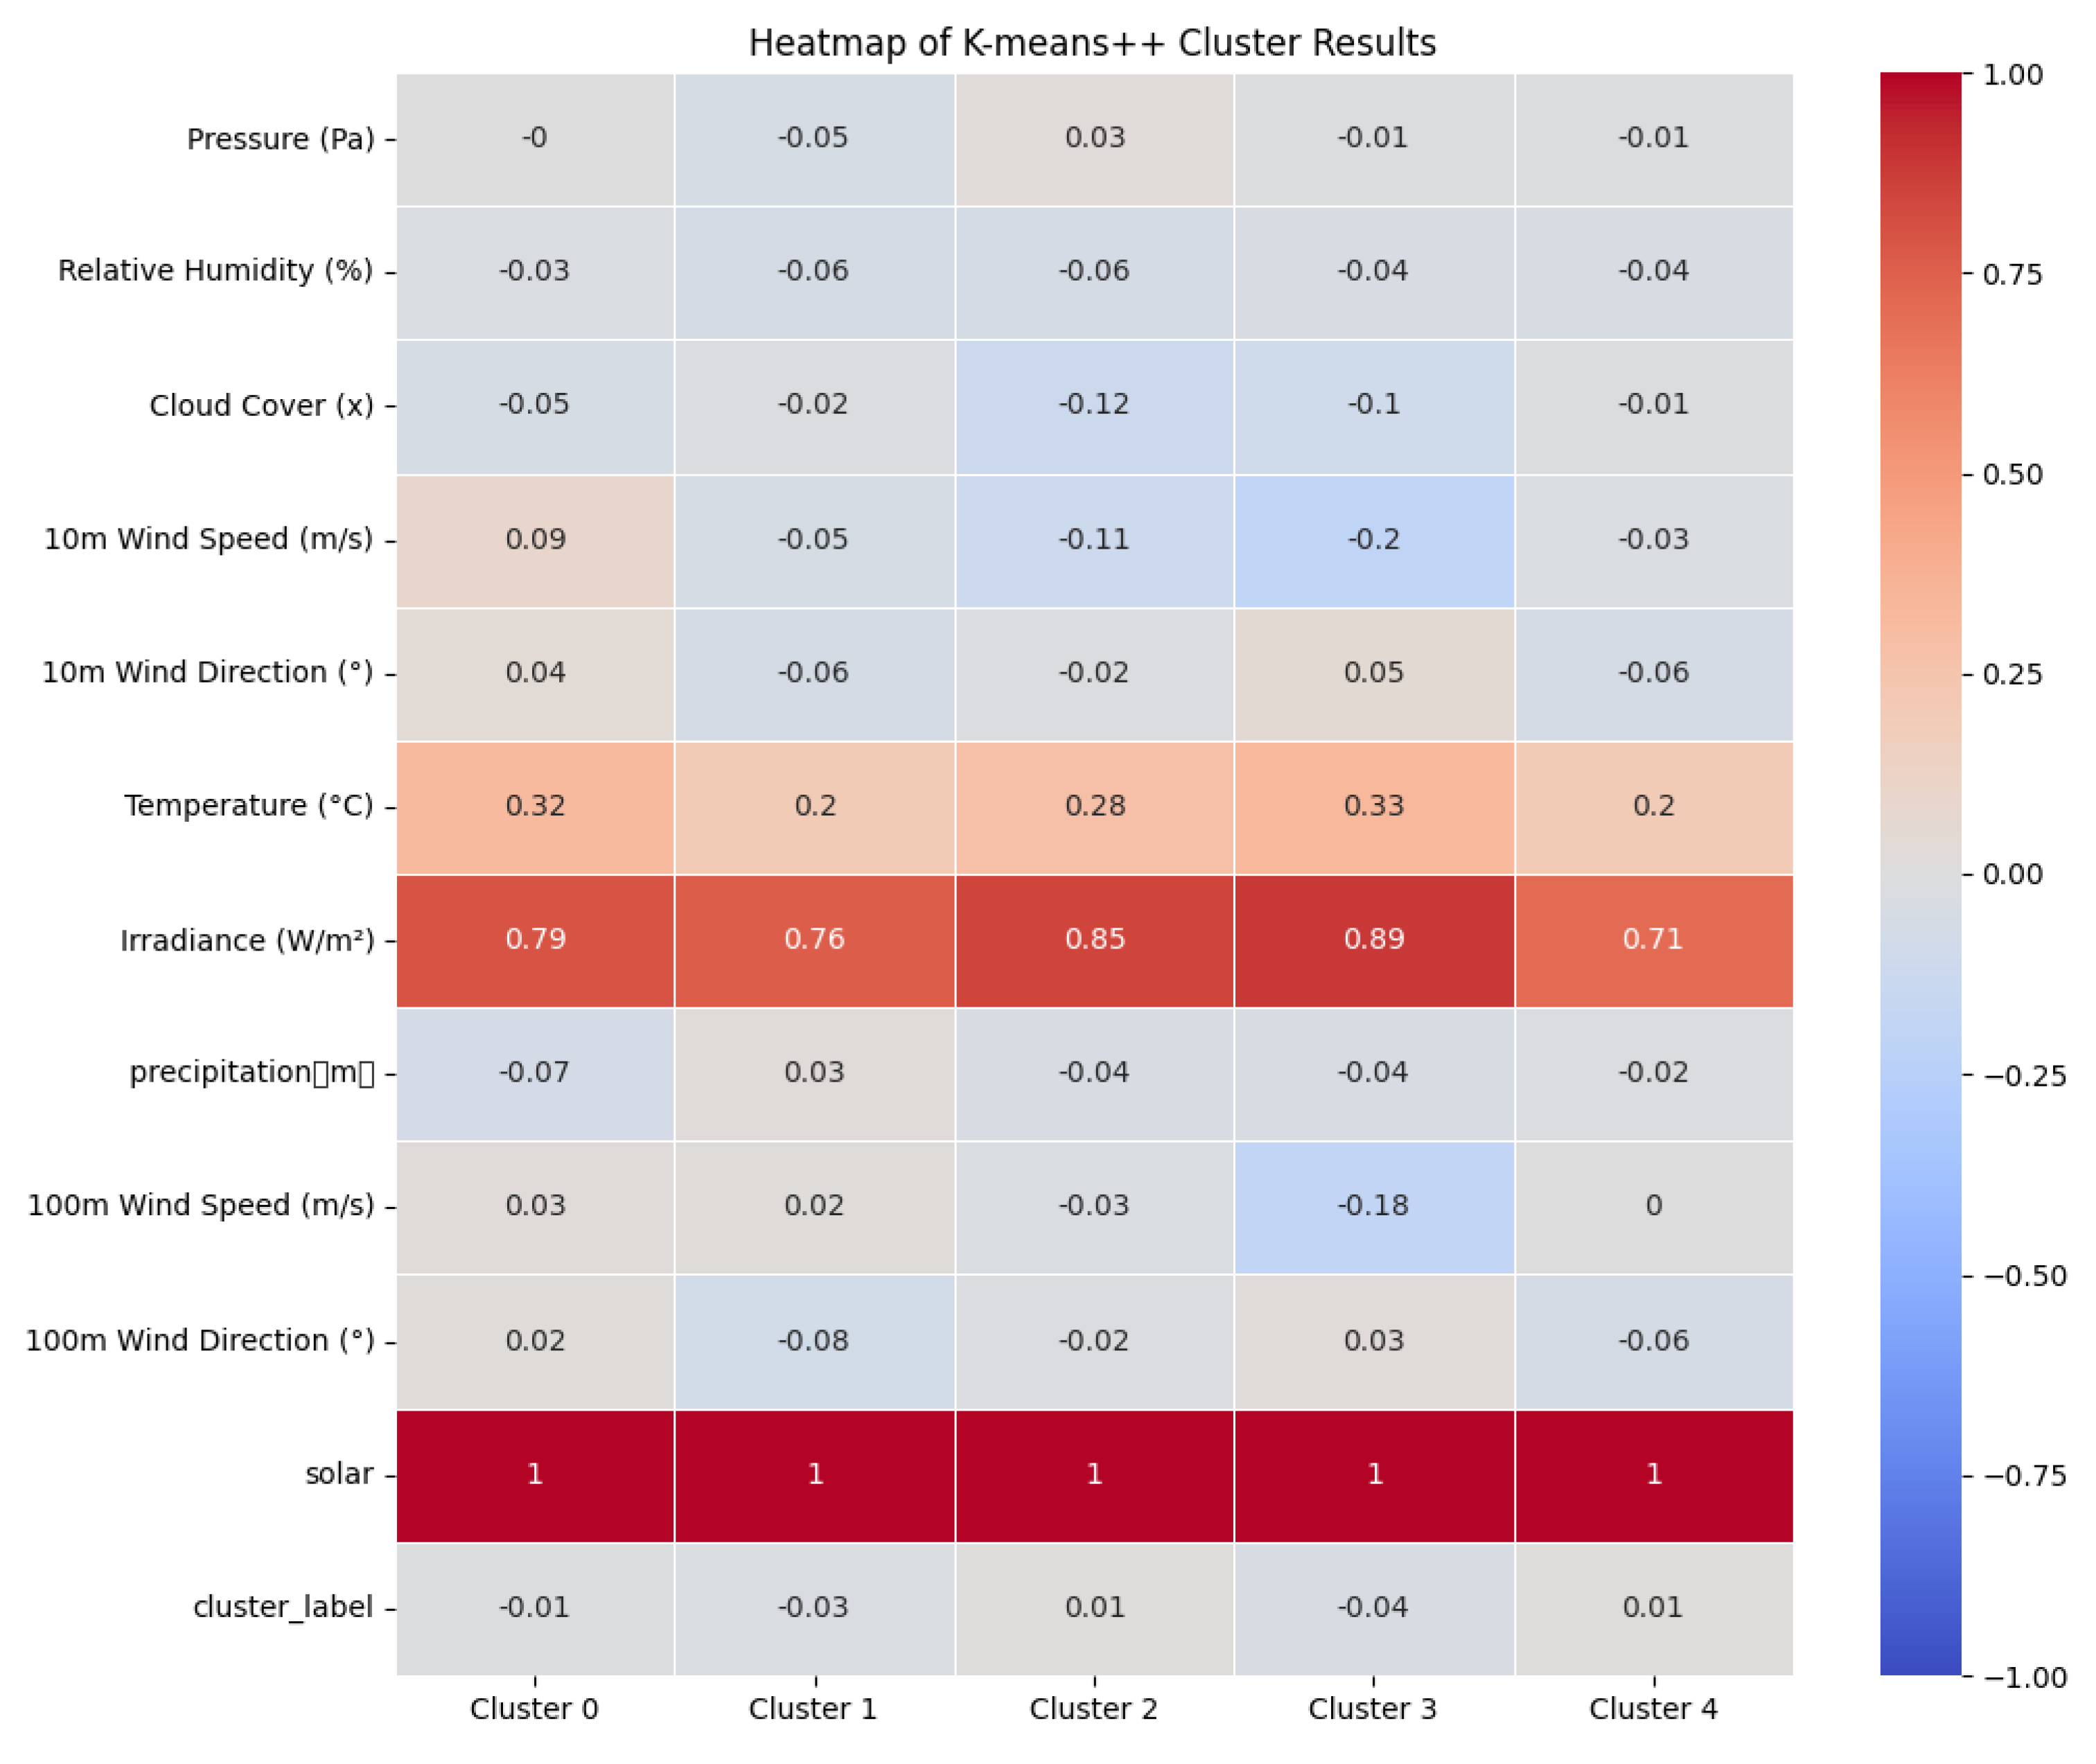

Table 1.
shows the impact weights of every element in every clustering model.
| Cluster 0 | Cluster 1 | Cluster 2 | Cluster 3 | Cluster 4 | |
|---|---|---|---|---|---|
| Temperature | 296 | 286 | 288 | 296 | 289 |
| Irradiance | 213 | 68 | 162 | 242 | 103 |
| Cloud Cover | 0.75 | 0.95 | 0.59 | 0.51 | 0.86 |
| precipitation | 0.0071 | 0.0115 | 0.0034 | 0.0022 | 0.0113 |
From the table and heatmap, it is obvious and intuitive that the photovoltaic output of the five clusters is mainly determined by the same four influencing factors. The influence weights, from highest to lowest, are temperature, irradiation level, cloud cover, and precipitation. Additionally, the influence weights of these four factors are much higher than those of the remaining eight factors.
6.3. Based on the Information Criterion Model of the Silhouette Coefficient Method
In analyzing a dataset's scatter distribution, especially when the silhouette width is plotted on a ratio scale and when looking for compact and well-separated clusters, The Silhouette Coefficient Method, which is based on the Information Criterion Model, is quite helpful. Two components are needed to build the silhouette: some proximity measurements between all objects and the partitioning that was acquired using the clustering technique.
For each object i, we introduce a specific value called S(i) , and then combine these numbers into a graph. Let us first define S(i) in terms of dissimilarity. Take any object i in the dataset, and let A represent the cluster to which it is assigned, as illustrated in the figure below. When cluster A contains objects other than i , we can calculate
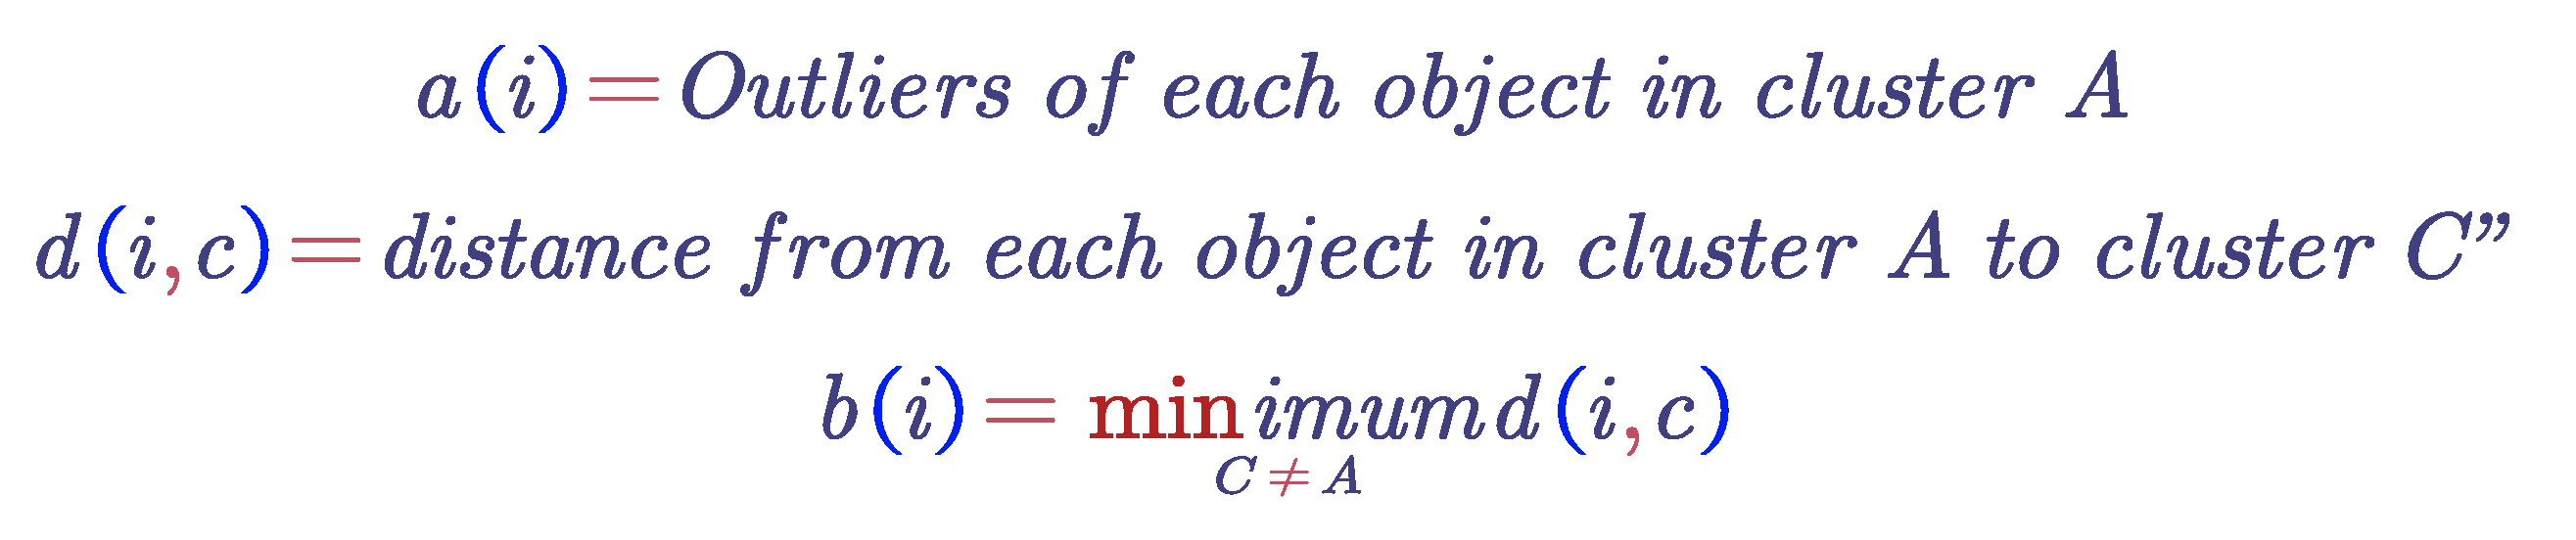
Figure 12.
Cluster assignment diagram.
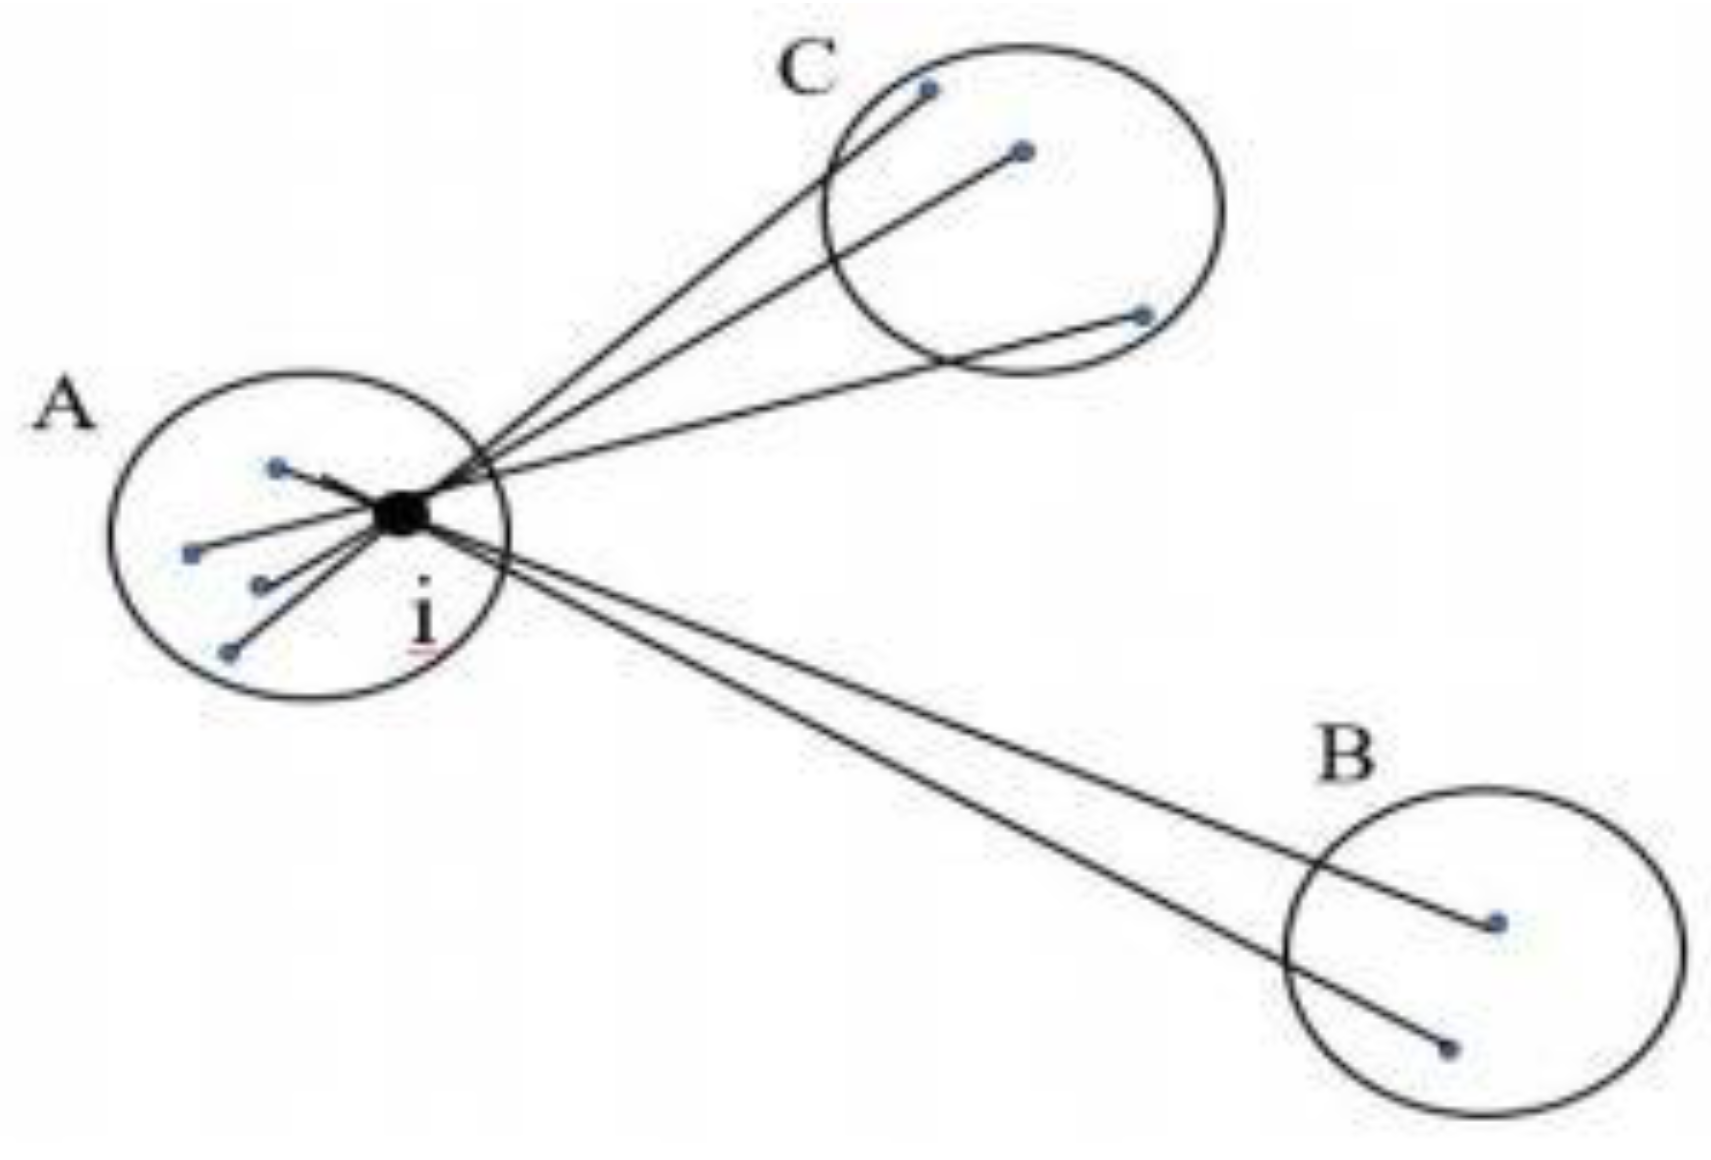
The cluster B corresponding to this minimum value (i.e., d(i, B) = b(i)) is referred to as the neighbor choice for object i: if object i cannot be accommodated in cluster A, then cluster B will be the closest alternative. In this figure , when cluster A is discarded, cluster B is the nearest cluster to object i. Therefore, understanding the neighbor of each object in the dataset is very useful. The silhouette coefficient S(i) in terms of dissimilarity can be calculated using the following formula :
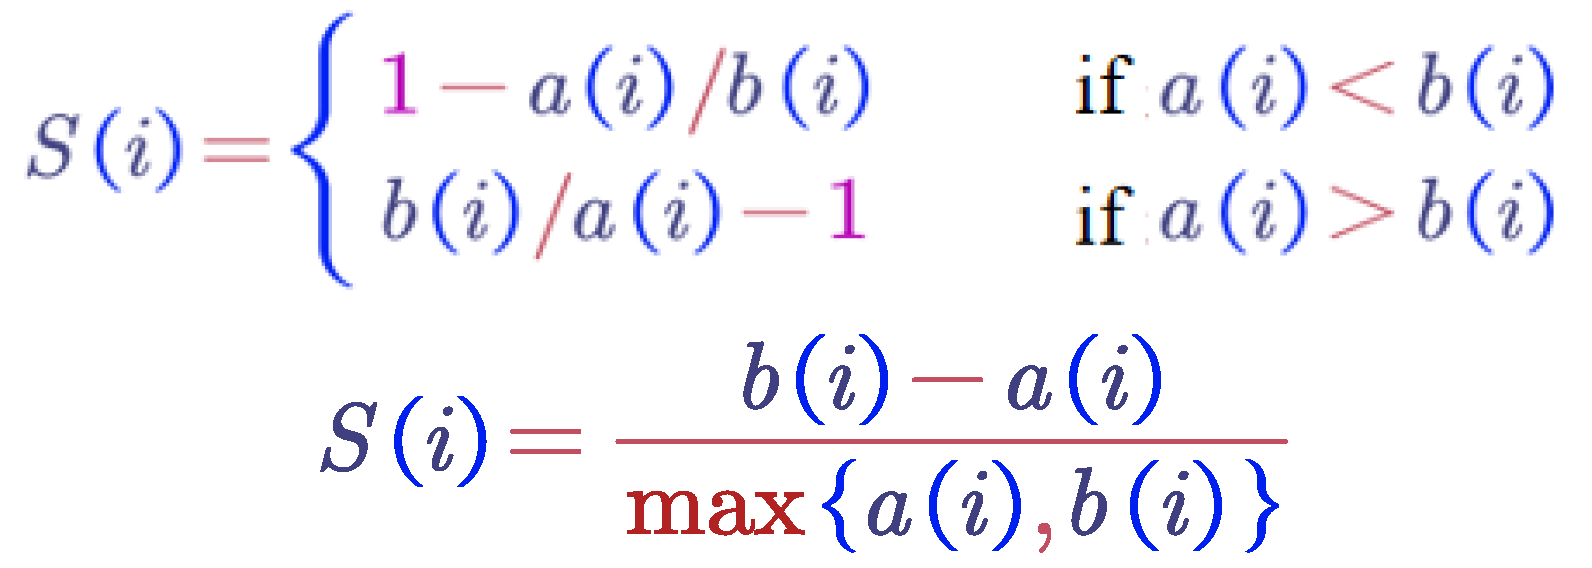
From the above steps, it is clear that the range of the silhouette coefficient S is from −1 to 1, with a higher silhouette coefficient indicating better clustering performance. In this method, given k values in the specific range of [2, 10], clustering is performed for each k value, and the silhouette coefficient for each clustering result is calculated. The silhouette coefficients are then plotted against k in a line graph, and the k value corresponding to the maximum silhouette coefficient is chosen as the final k value.
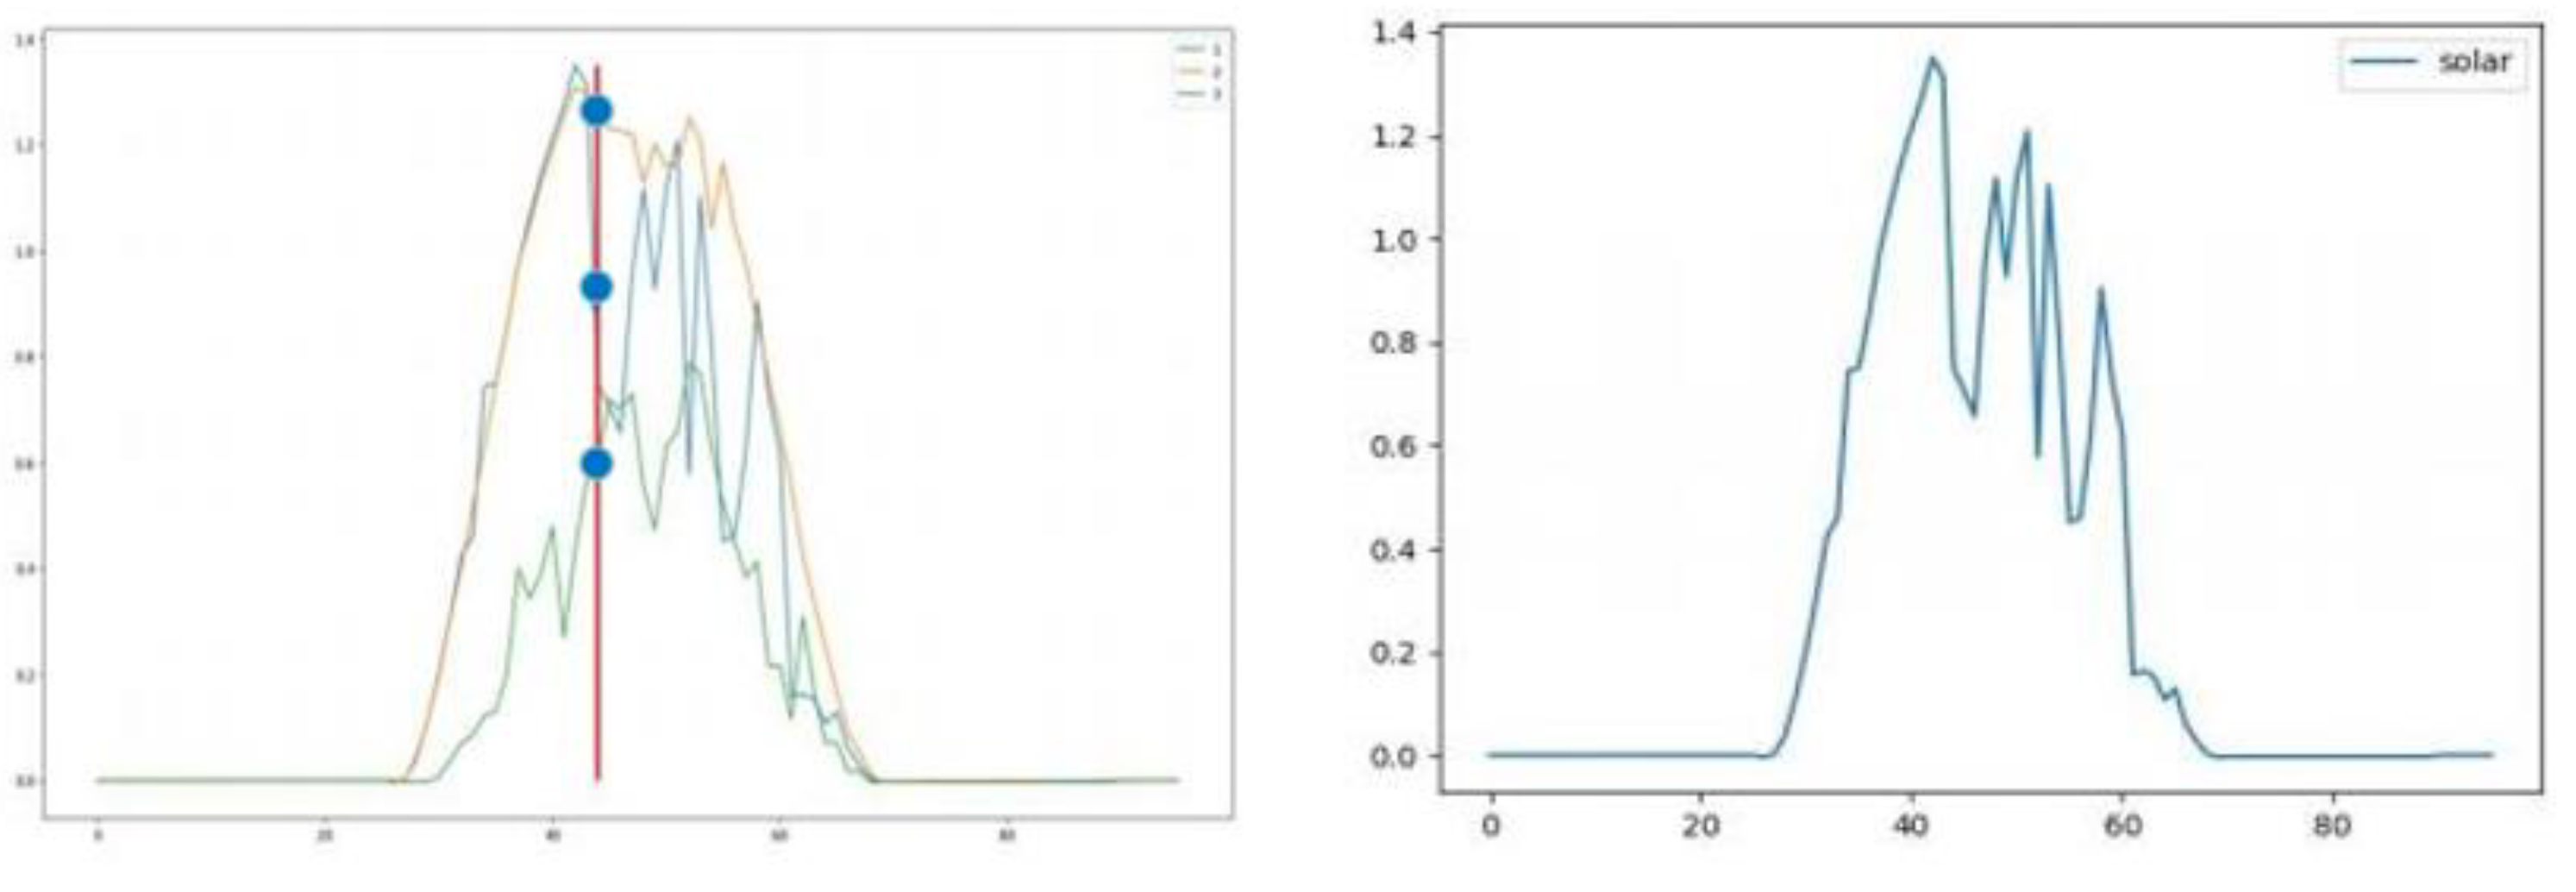
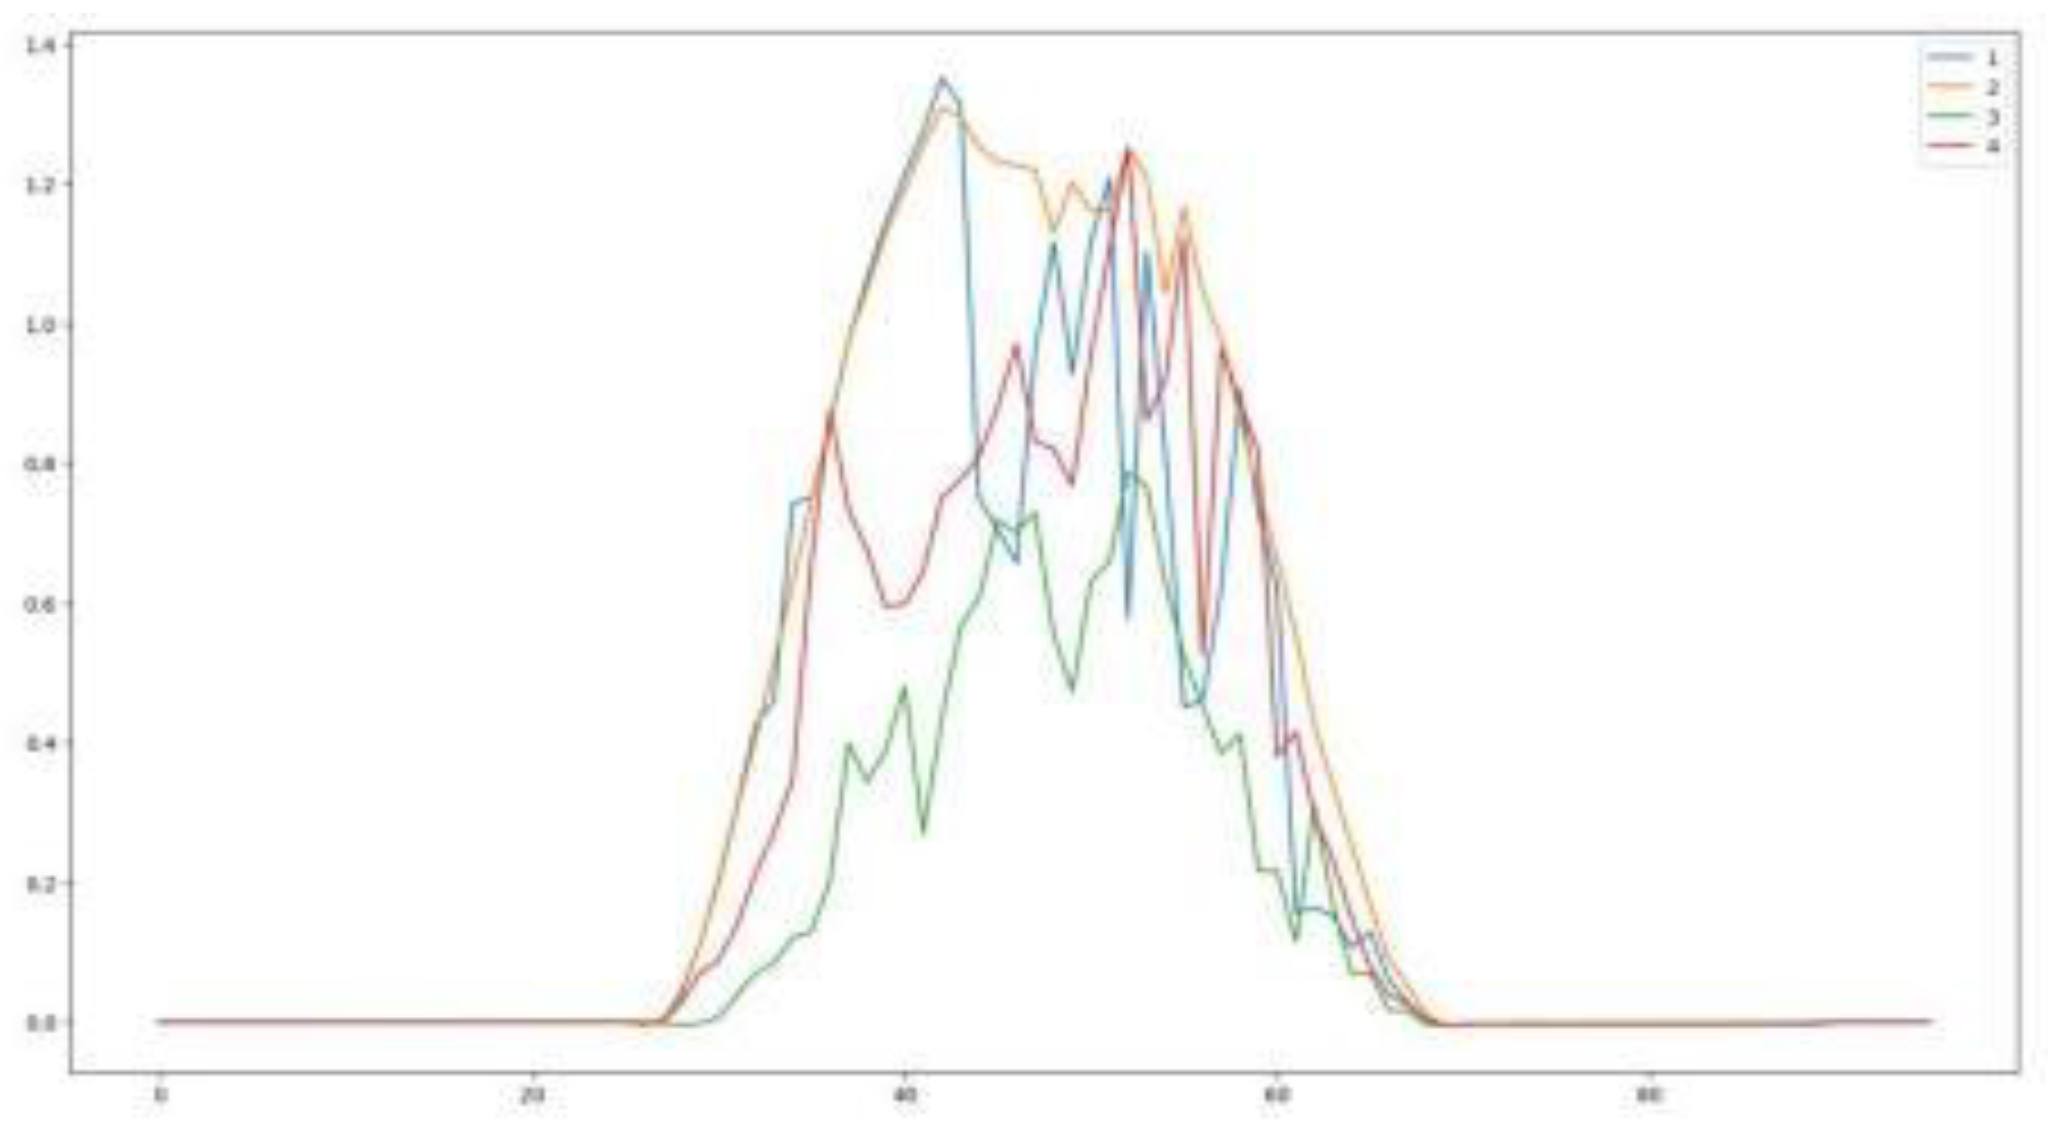
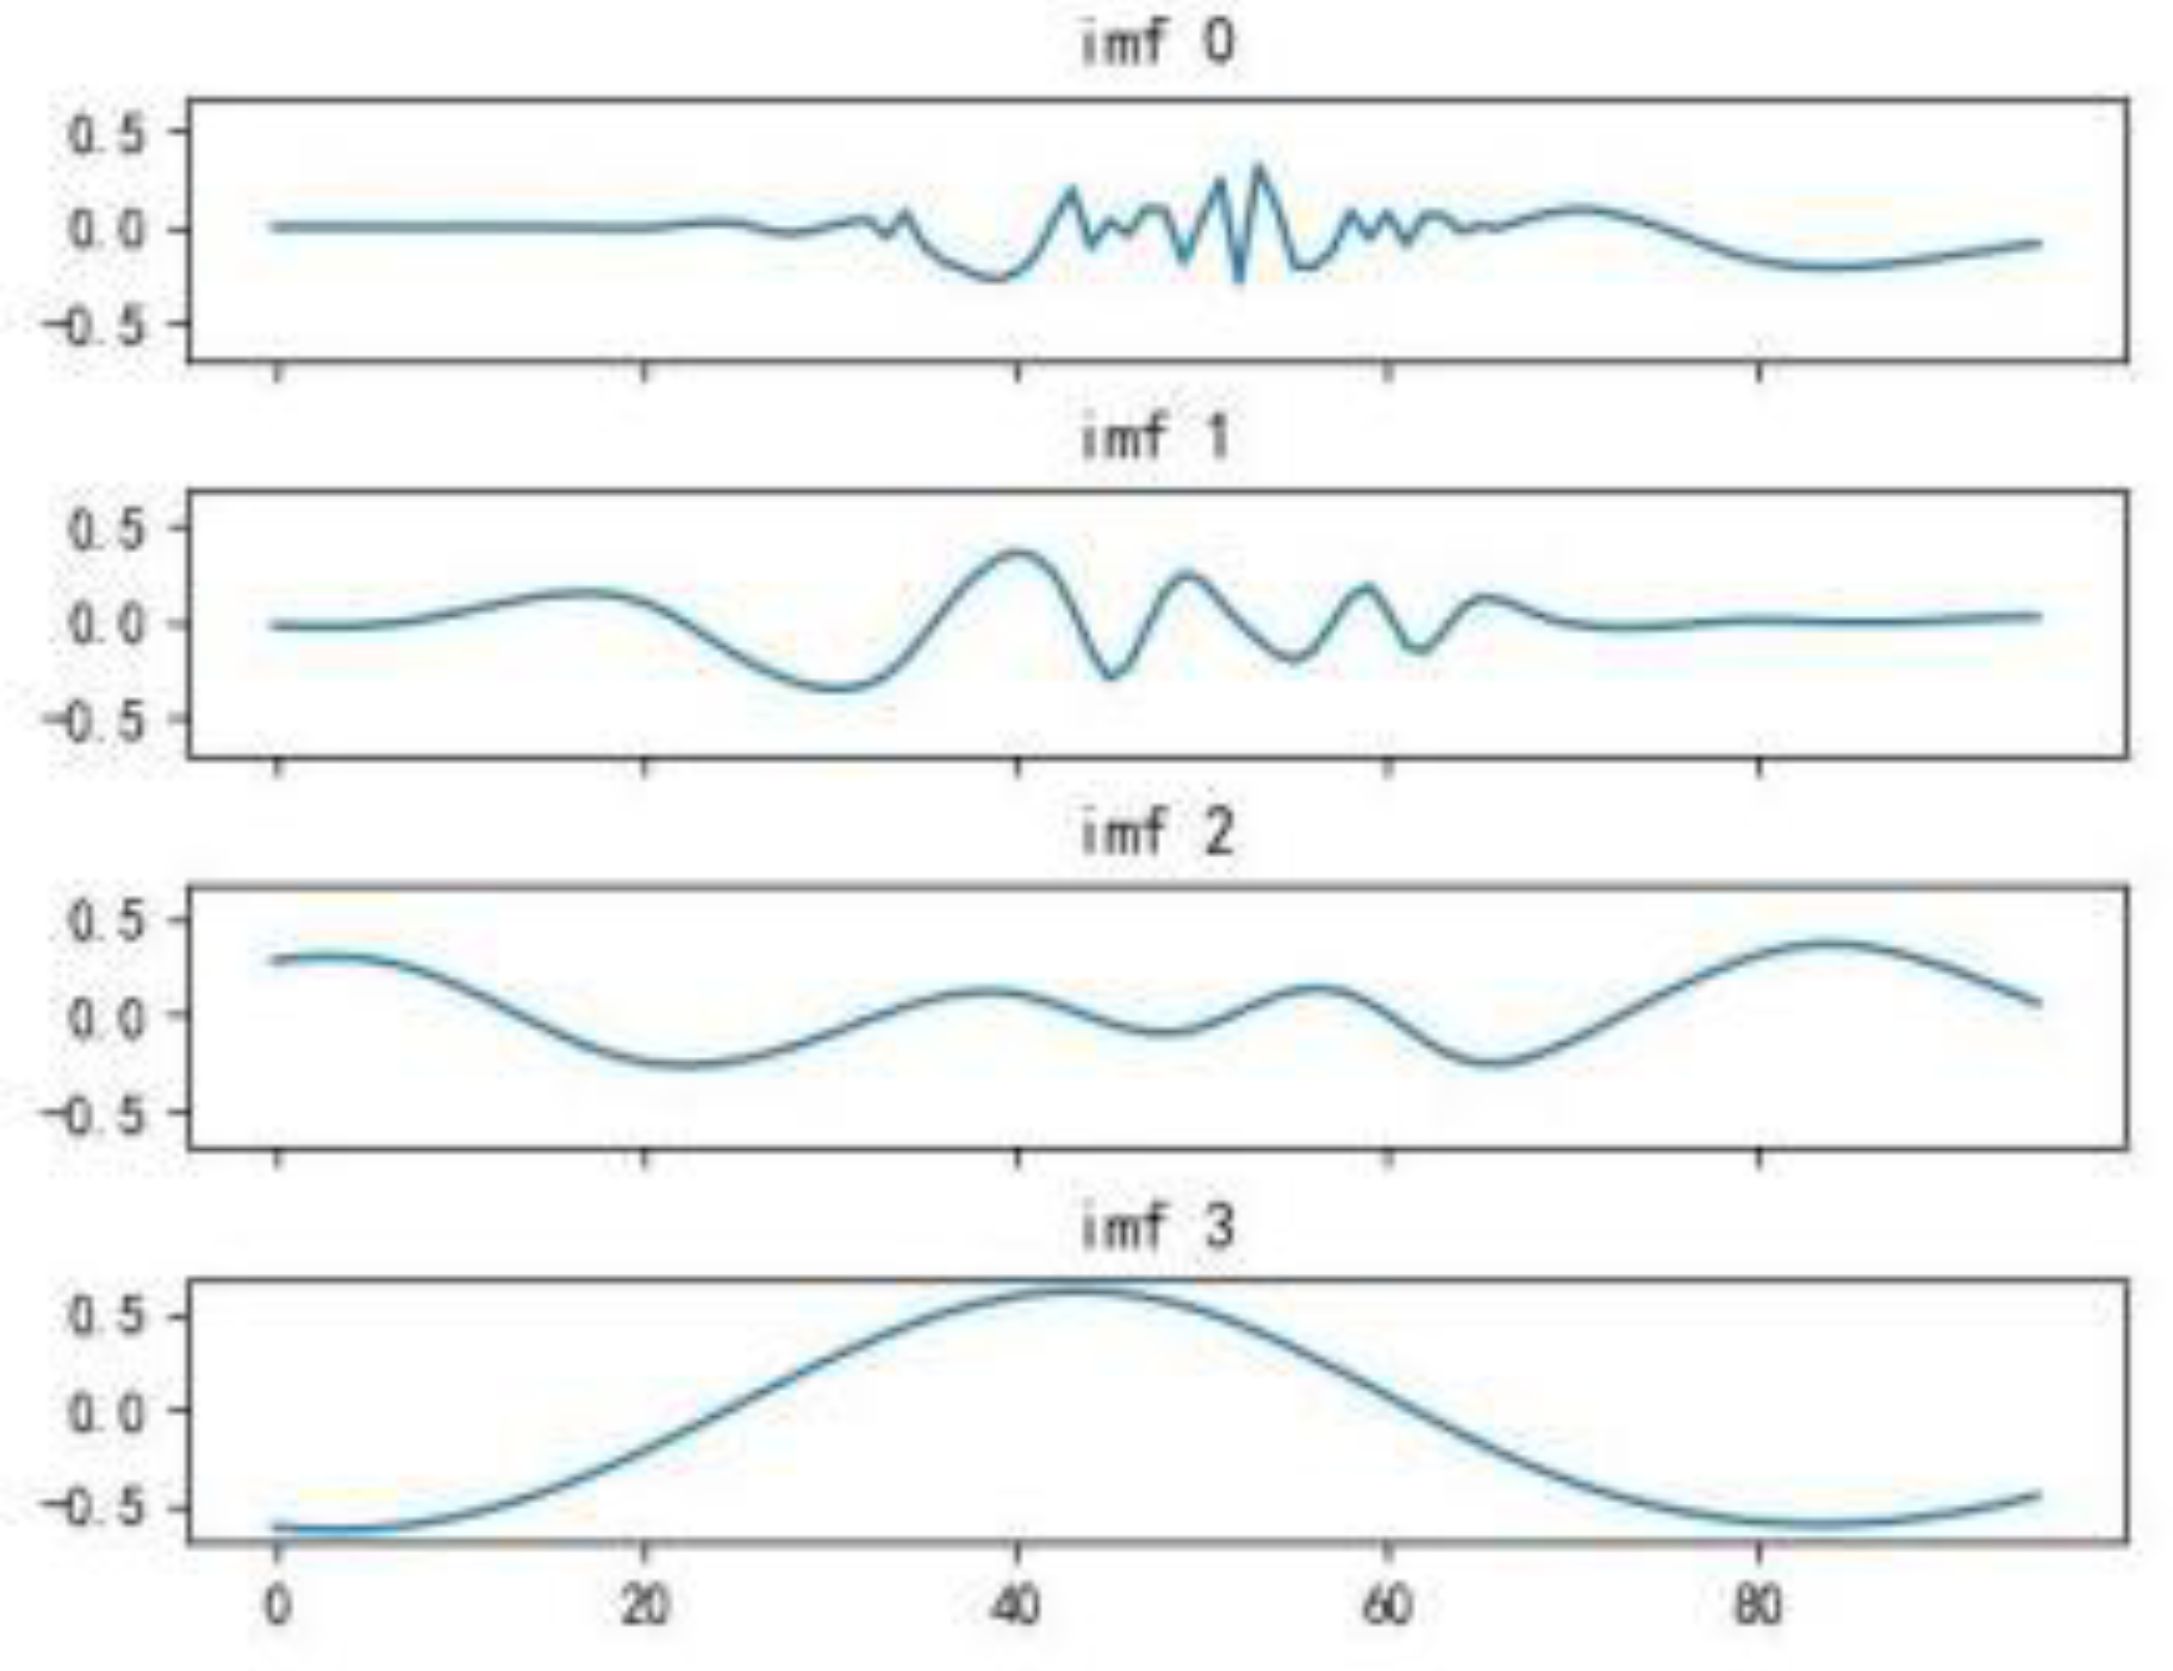
Compared to the process of infinite modal function decomposition, to reduce the computational cost of iterative operations, this study selects finite modal function decomposition. It is evident from the figure below that the photovoltaic power generation curve has higher volatility before decomposition. After three iterations of modal function decomposition, the volatility of the curve is significantly reduced. The result from the fourth decomposition approximates a horizontal line; thus, decomposition can be stopped after three iterations.
Figure 13.
The modal functions obtained from 3 iterations of CEEMDAN decomposition.
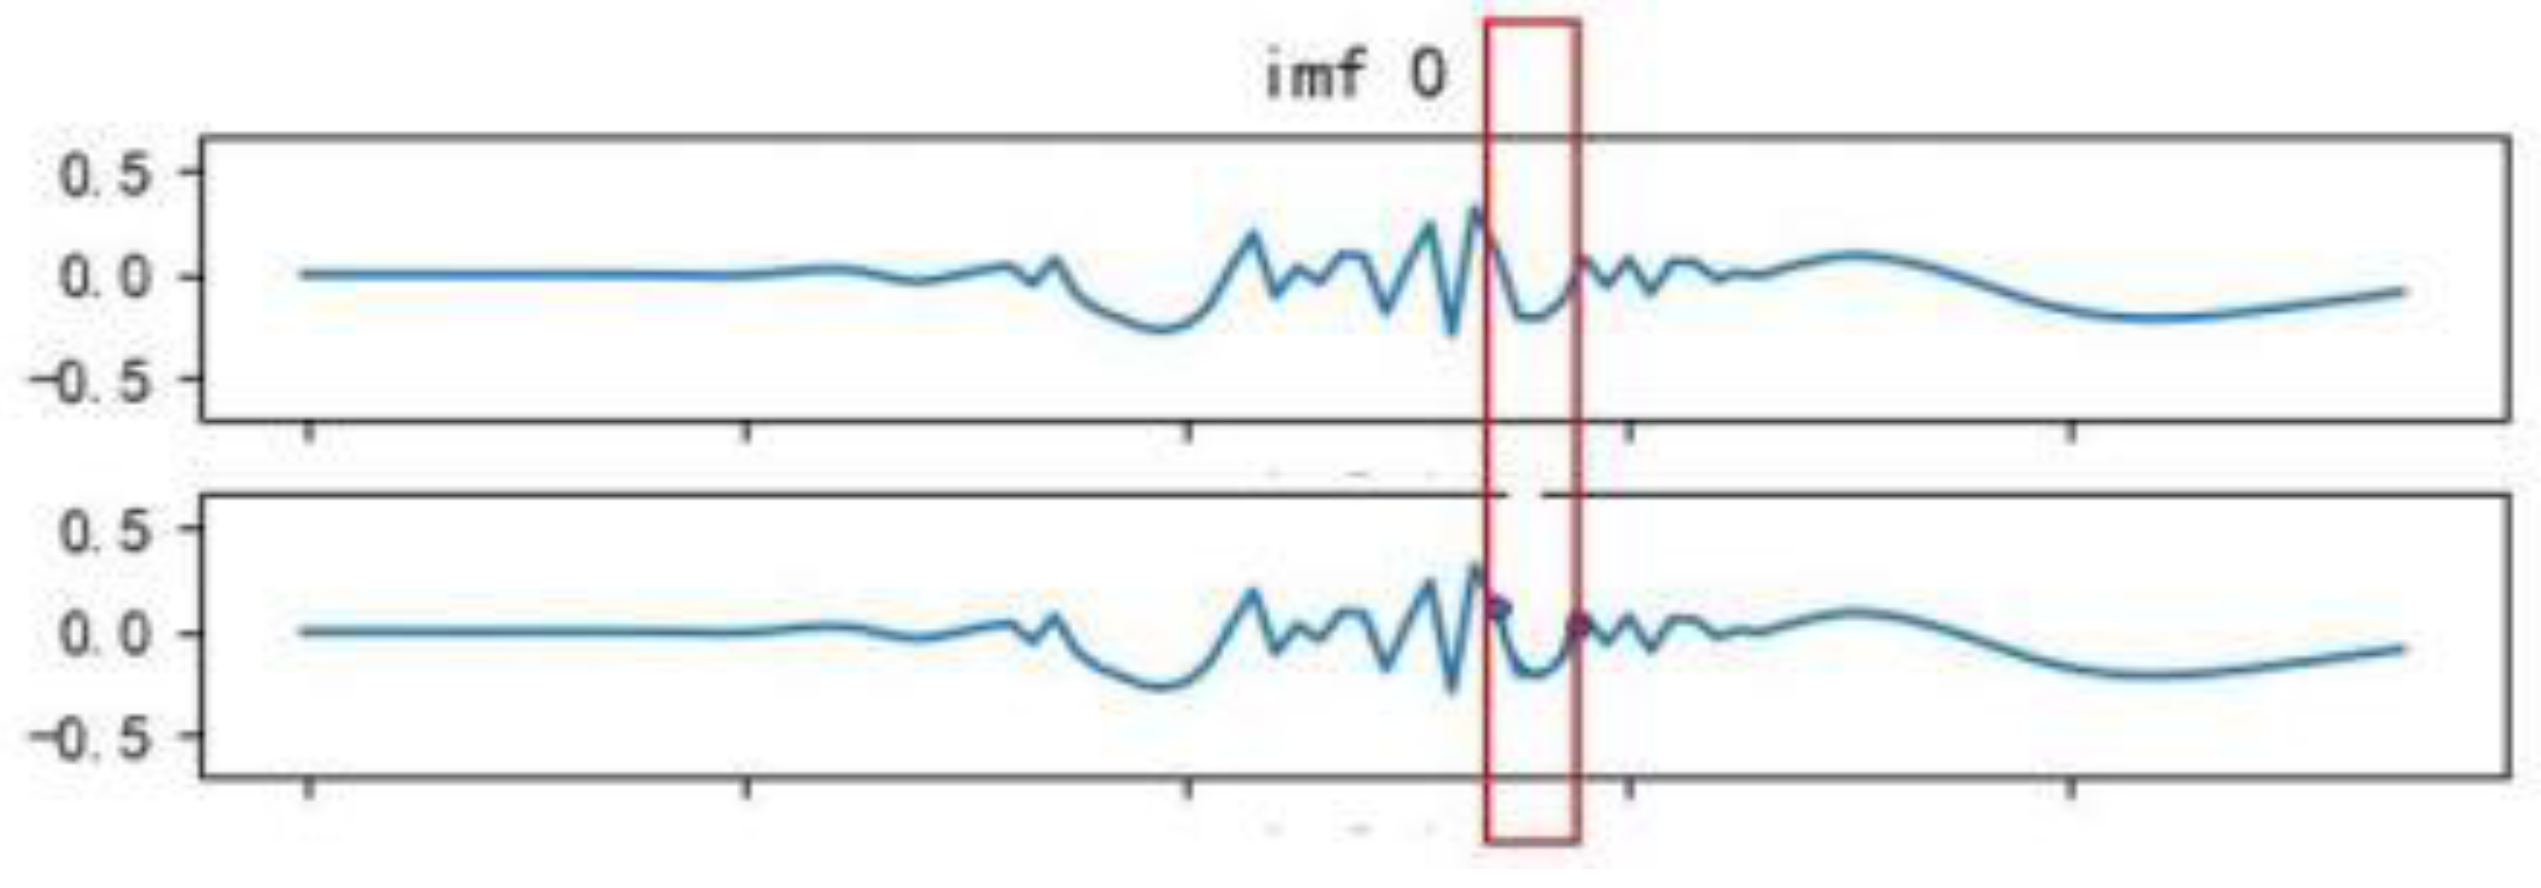
To practically validate that the modal functions obtained from 3 iterations of CEEMDAN decomposition can approximate the original function, this study compares the total function obtained by summing the data points of the first 3 modal functions with the original function. The error rate for each data point is analyzed and found to be only 3.4%. As shown in the figure below, there are only minor differences between the two sets of curves within the highlighted box.
Figure 14.
Comparison of the modal functions obtained from 3 iterations of CEEMDAN decomposition with the original function.
Figure 14.
Comparison of the modal functions obtained from 3 iterations of CEEMDAN decomposition with the original function.
6.4. Adaptive Noise Ensemble Empirical Mode Decomposition Model
This study applies CEEMDAN (Complete Ensemble Empirical Mode Decomposition with Adaptive Noise) to the historical fluctuation curve of photovoltaic power generation. The fluctuation curve is decomposed into modal functions. During the decomposition process, the ensemble averaging technique helps reduce the impact of random noise on the results, making them more stable and reliable.
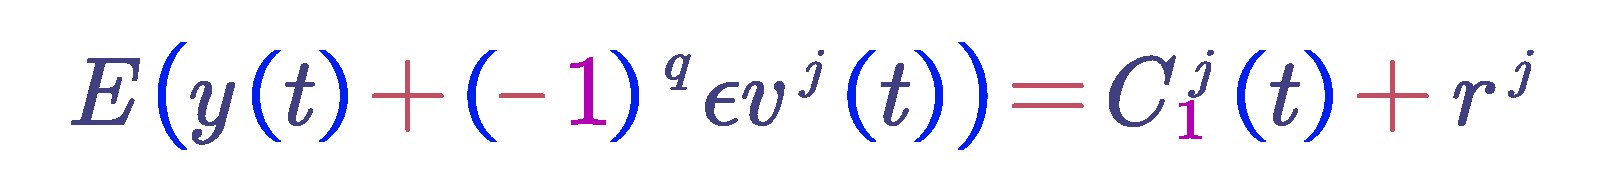
Let be the i-th intrinsic mode function obtained after EMD decomposition. The i-th intrinsic mode function obtained from CEEMDAN decomposition is denoted as , Vj represents Gaussian white noise signals that follow a standard normal distribution, ε is the number of times white noise is added, and y(t) is the signal to be decomposed with white noise added. The steps of CEEMDAN decomposition are as follows:
Add Gaussian white noise to the signal y(t) , resulting in a new signal y(t) + ( − 1)q εVj (t), where q = 1, 2.... Perform EMD decomposition on the new signal to obtain the first-order intrinsic mode function .
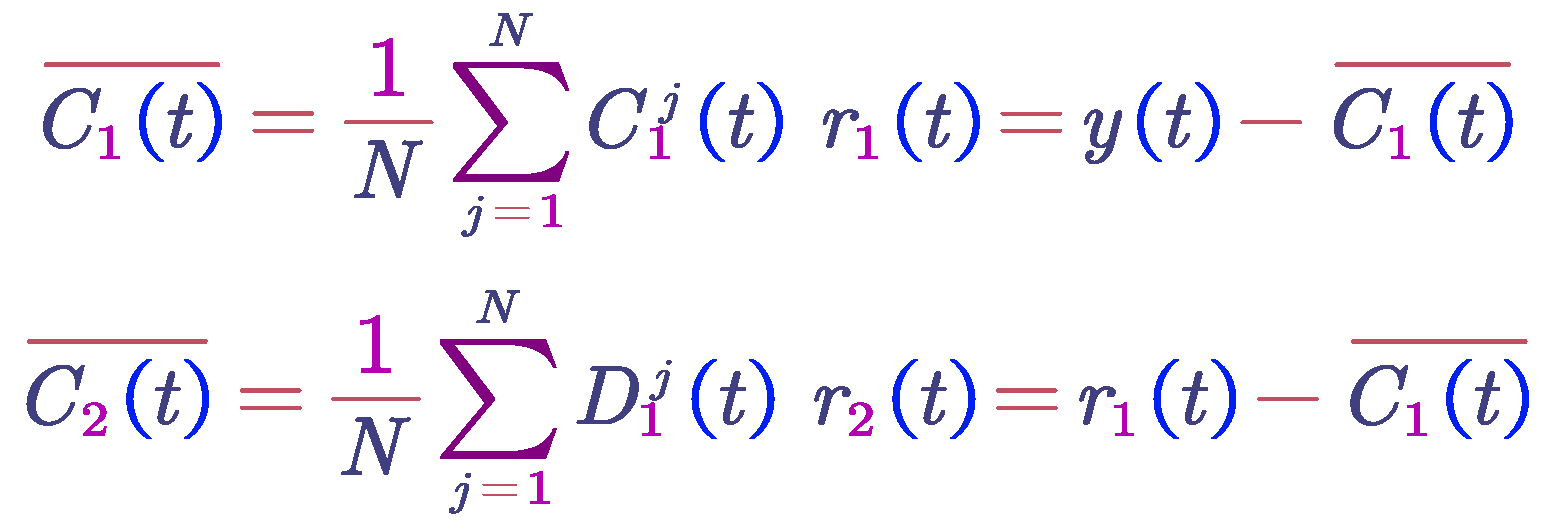
Average the N intrinsic mode functions obtained to get the first intrinsic mode function of the CEEMDAN decomposition. Calculate the residual by subtracting the first intrinsic mode function from the original signal.
Add paired positive and negative Gaussian white noise to (t) to obtain a new signal. Perform EMD decomposition on this new signal to obtain the first-order modal component D1. This results in the second intrinsic mode function of the CEEMDAN decomposition. Calculate the residual by subtracting the second intrinsic mode function from the current signal.
Repeat the above steps until the residual signal obtained is a monotonic function and cannot be further decomposed. The algorithm terminates. At this point, the number of intrinsic mode functions obtained is K, so the original signal y(t) is decomposed into: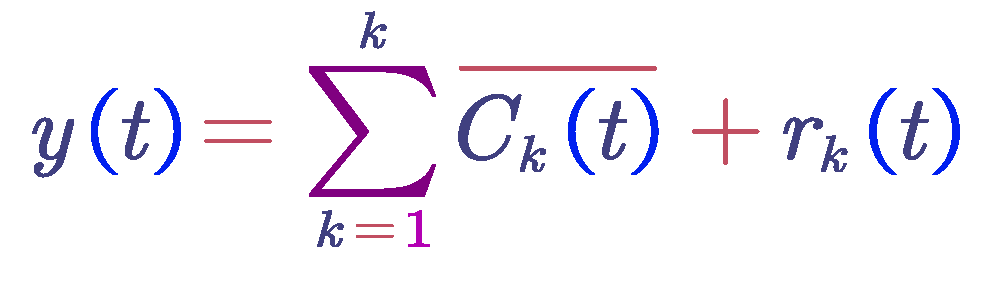
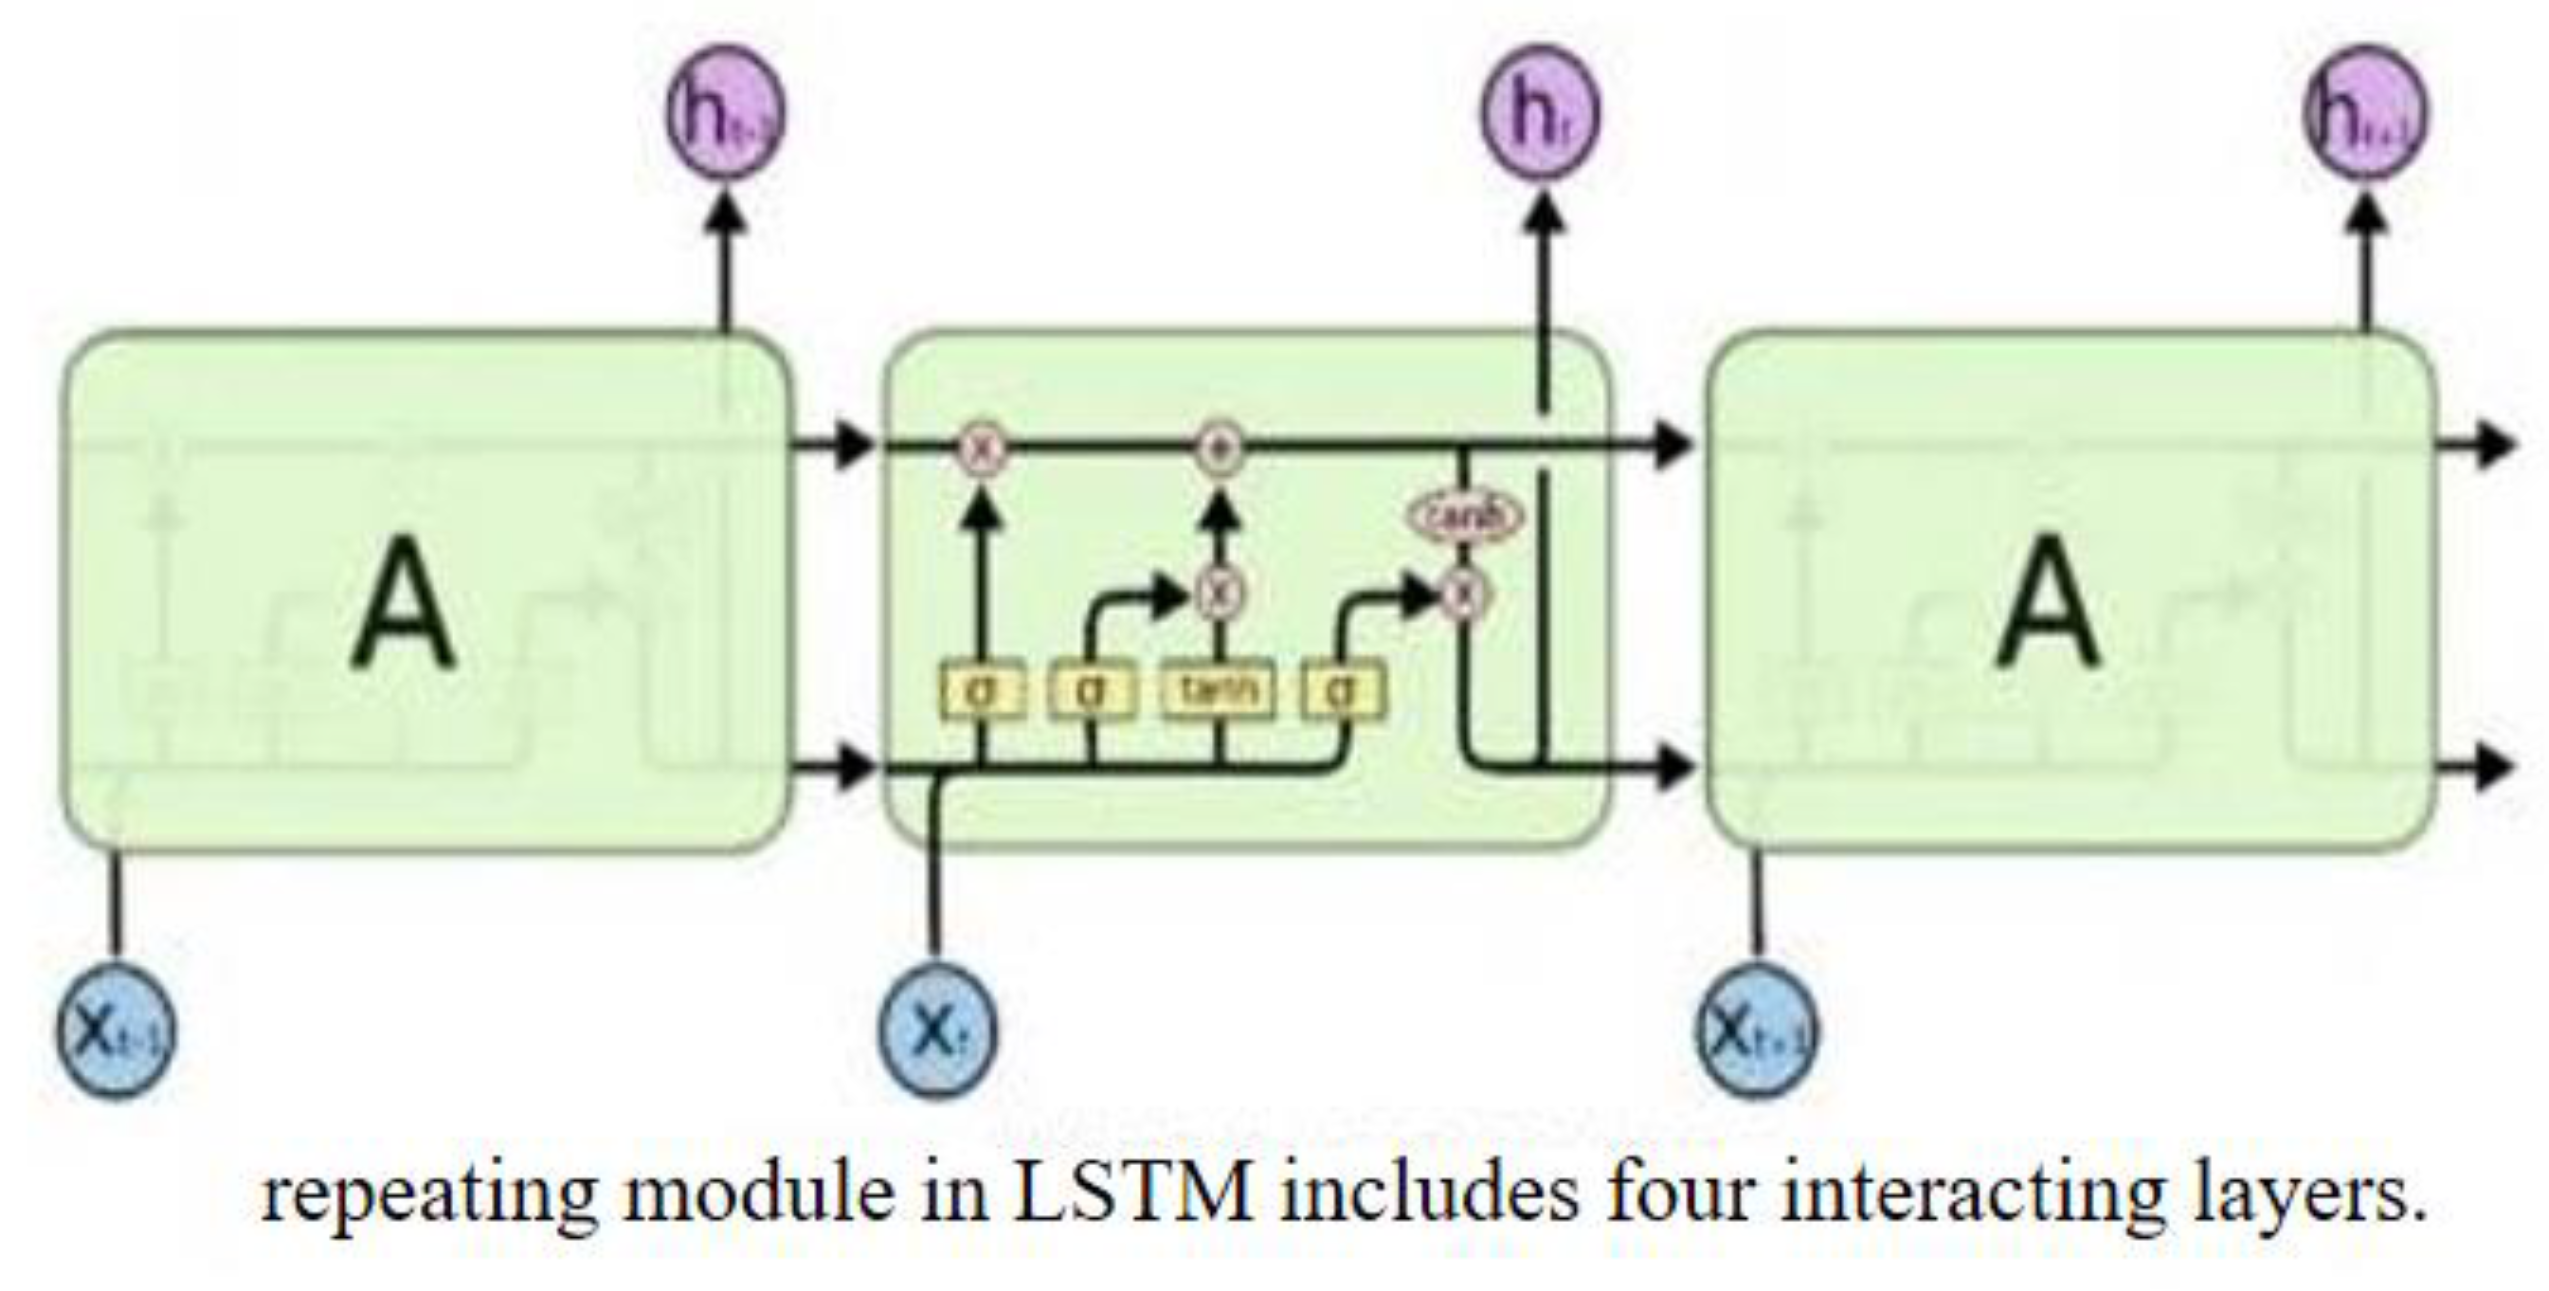
6.5. Long Short-Term Memory (LSTM) Network Model
The model may therefore easily adjust to the dynamic of the modal function that a small number of decomposments are obtained after gradually decreasing, which makes the model easier for the modeling of and predicting the results of those functions. This work uses the Long Short-Term Memory (LSTM) networks for the modal functions; this leads to a model for real-time temporal information-based real-time PV power generation forecasting for the purpose of predicting the power of the PV system.
By "cells" and "cells, "LSTM discusses the problem of whether to keep or forget information, which includes the following: "cellstates and gate architectures, respectively." Long-term information storage is possible by the cell state of the network, whereas the gate structure controls the information flow of information entering or leaving the network.
Input Layer: The input sequence should be changed into numerical form, which is the input of the word vector of each word is combined into a matrix of word vectors, which are used as the input for the neural network.
Hidden Layer:In the LSTM hidden layer, each time step receives an input and the cell state from the previous time step. Then, through a series of gating mechanisms(including the forget gate, input gate, and output gate)and cell state updates, the current time step's cell state and hidden state are computed and output. These gating processes control the flow of information, selecting which information is forgotten, which new information is added, and which information is output.
Figure 15.
Hidden Layer Structure Diagram.
Forget Gate : First, the model needs to decide how much of the previous cell state information should be retained and how much should be forgotten. This decision is based on the current input and the hidden state from the previous time step. These are input into a fully connected layer and processed through a sigmoid function to obtain the value of the forget gate. This value ranges from 0 to 1, where 0 indicates complete forgetting and 1 indicates complete retention. The calculation formula for the forget gate is as follows :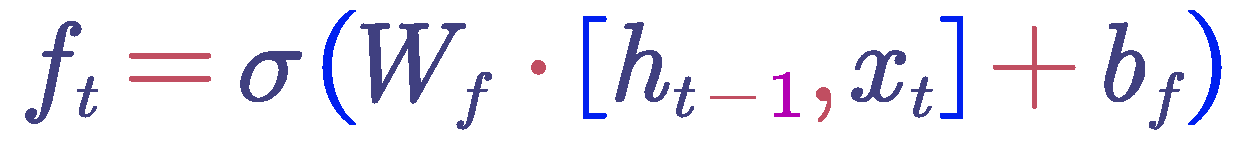 where is the weight matrix, is the bias term, is the hidden state from the previous time step, is the current input, and σ is the sigmoid function.
where is the weight matrix, is the bias term, is the hidden state from the previous time step, is the current input, and σ is the sigmoid function.Input Gate : The LSTM needs to determine which new information should be stored in the memory cell. This involves two parts: first, the input gate, which decides which parts of the memory cell should be updated; and second, a tanh layer that generates a new candidate value vector that may be added to the memory cell. Both the input gate values and the candidate values are computed based on the current input and the hidden state from the previous time step. The calculation formula for the input gate is as follows:
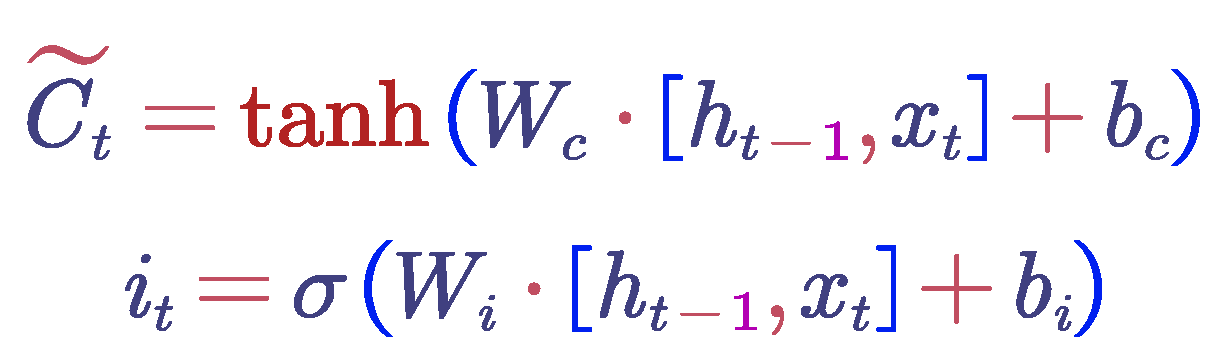 where is the candidate values, is the input gate values, is the weight matrix, is the bias term, is the hidden state from the previous time step, is the current input, σ is the sigmoid function, and is the hyperbolic tangent function.
where is the candidate values, is the input gate values, is the weight matrix, is the bias term, is the hidden state from the previous time step, is the current input, σ is the sigmoid function, and is the hyperbolic tangent function.Update Memory Cell: Update the memory cell based on the decisions made by the forget gate and the input gate. First, multiply the cell state by the values from the forget gate, which represents the selective forgetting of some of the previous state information. Next, add the product of the input gate values and the candidate values, which represents the addition of new state information. The updated cell state can be expressed using the following formula:
 where is the output of the forget gate, is the cell state from the previous time step, is the candidate values, and is the input gate values.
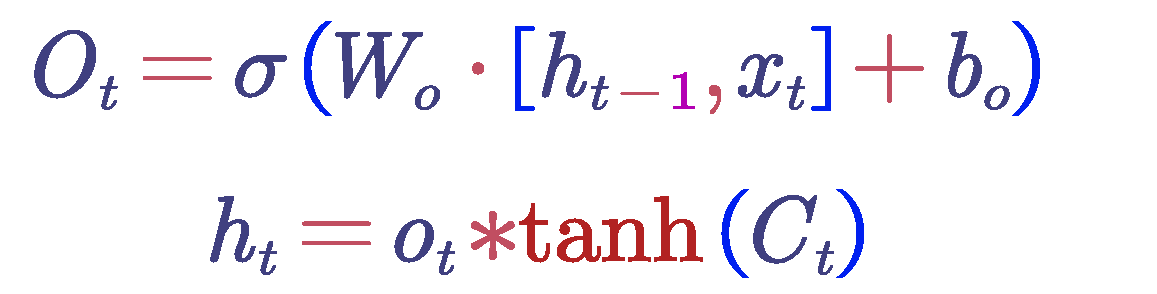
where is the output of the forget gate, is the cell state from the previous time step, is the candidate values, and is the input gate values.Output Gate and Hidden State : The output gate determines the output of the cell state based on the current input and the hidden state from the previous time step. This is achieved through a fully connected layer followed by a sigmoid function. The value of the output gate ranges from 0 to 1, where 0 indicates no output and 1 indicates full output. Subsequently, the cell state is transformed into a value between -1 and 1 using the tanh function, and this is multiplied by the output gate values to obtain the final hidden state. The calculation formula for the output gate is as follows:
Based on the previously discussed principles and structure of the Long Short-Term Memory (LSTM) network model, including the input layer, hidden layers, and output layer, a two-hidden-layer LSTM network structure was constructed, tailored to the specific practical conditions of photovoltaic output in real-life scenarios. Through fitting and prediction across multiple time axes, a model for ultra-short-term point prediction under five different clustered typical scenarios was developed.
Figure 16.
LSTM network structure diagram.
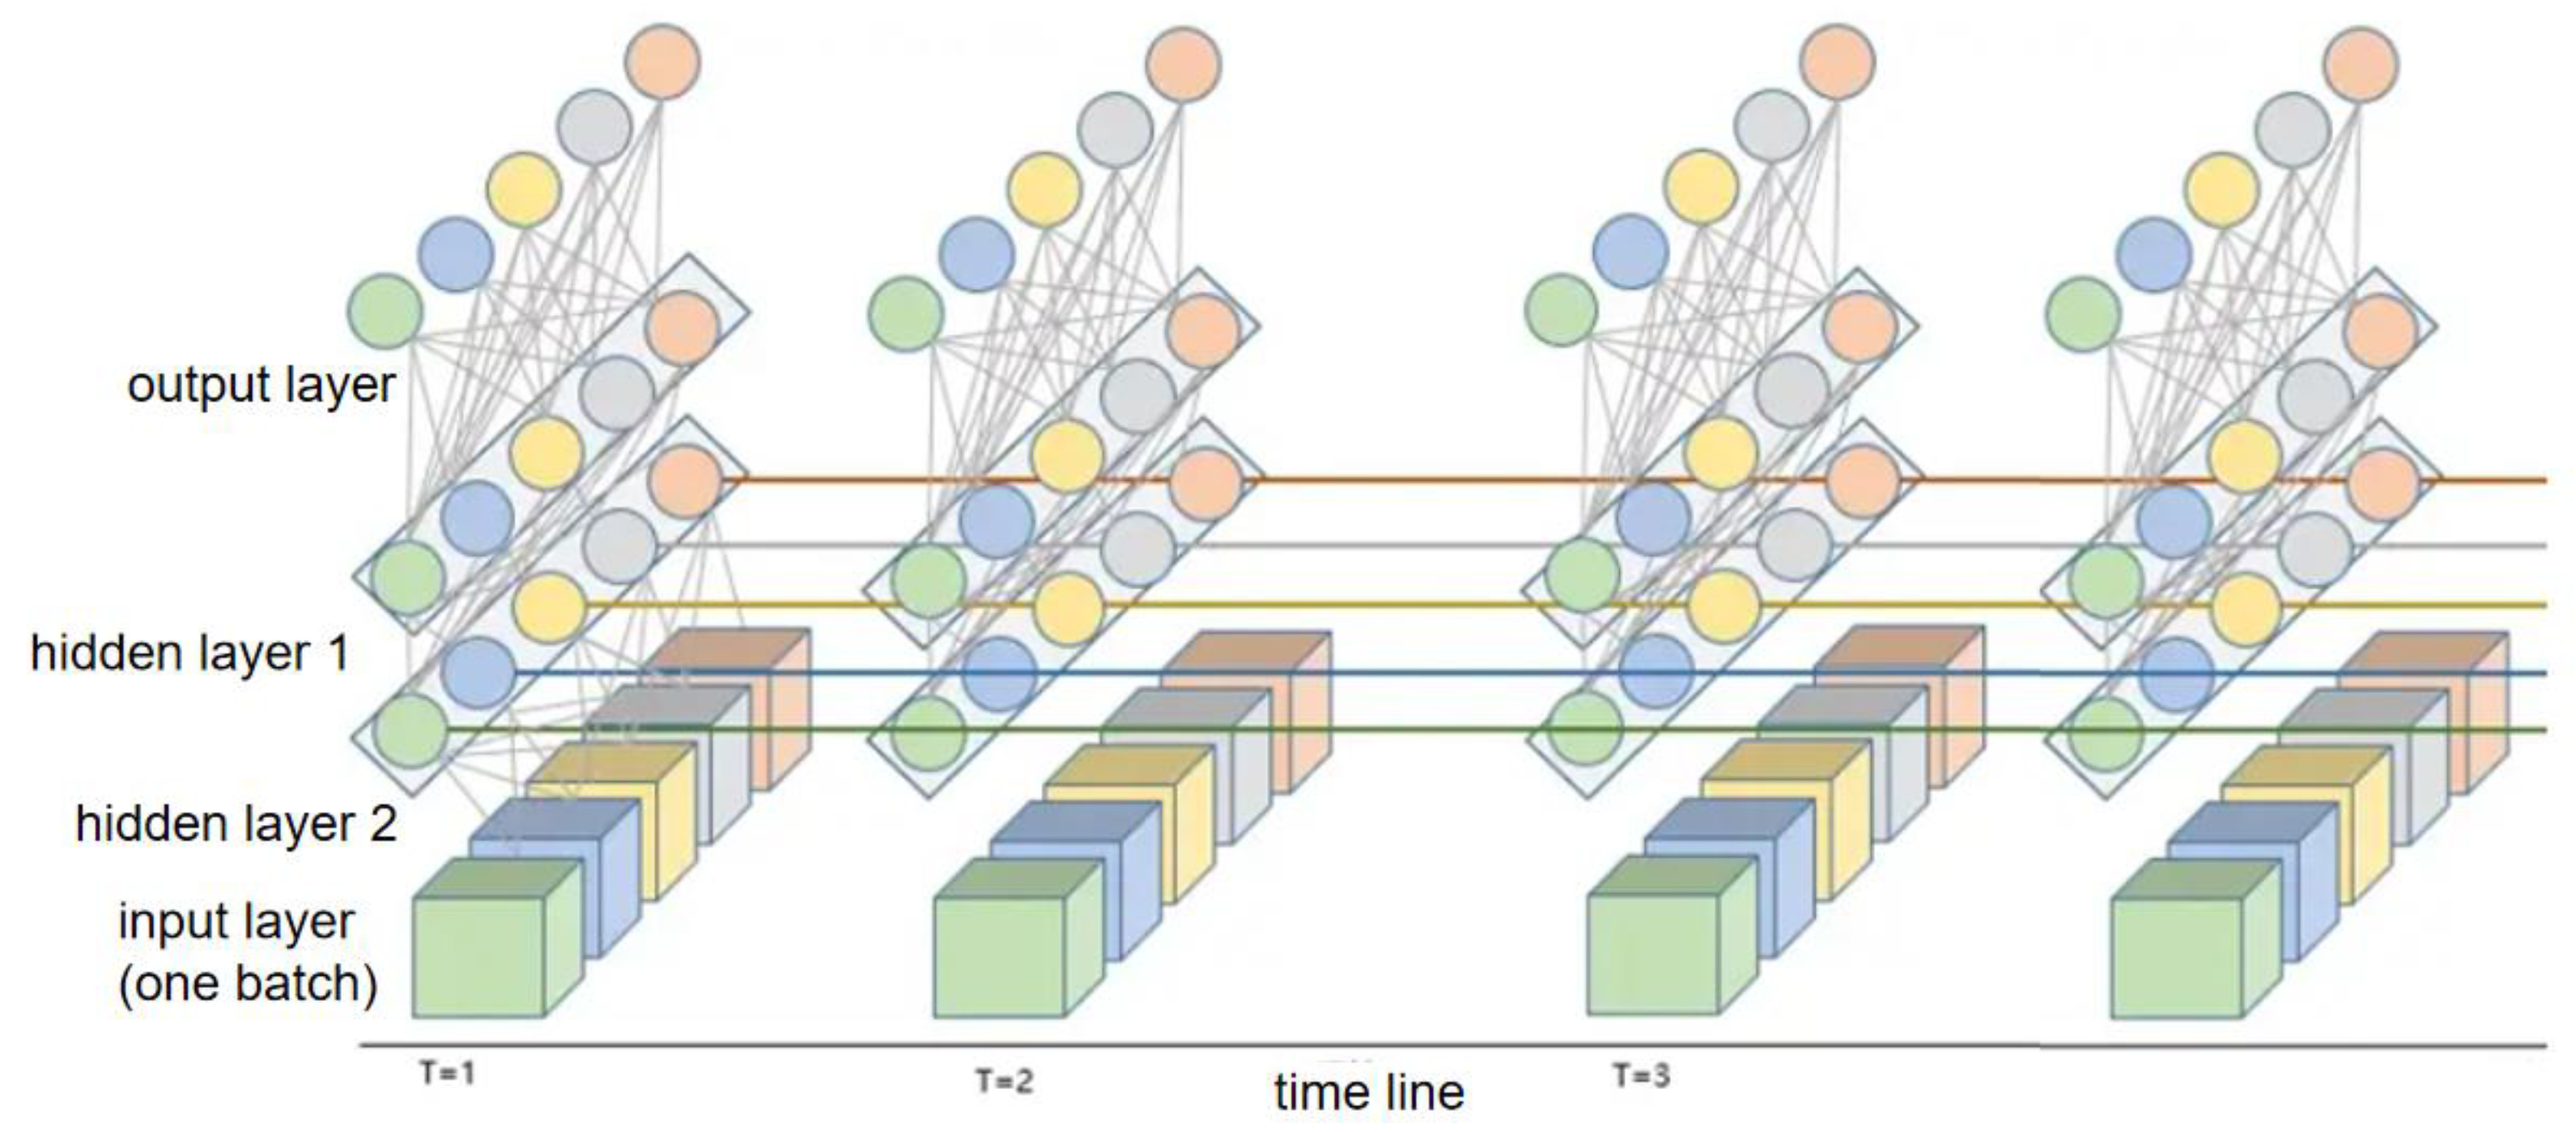
Figure 17.
Comparison of ultra-short-term point prediction results with actual outcomes across five different typical clustering scenarios.
Figure 17.
Comparison of ultra-short-term point prediction results with actual outcomes across five different typical clustering scenarios.
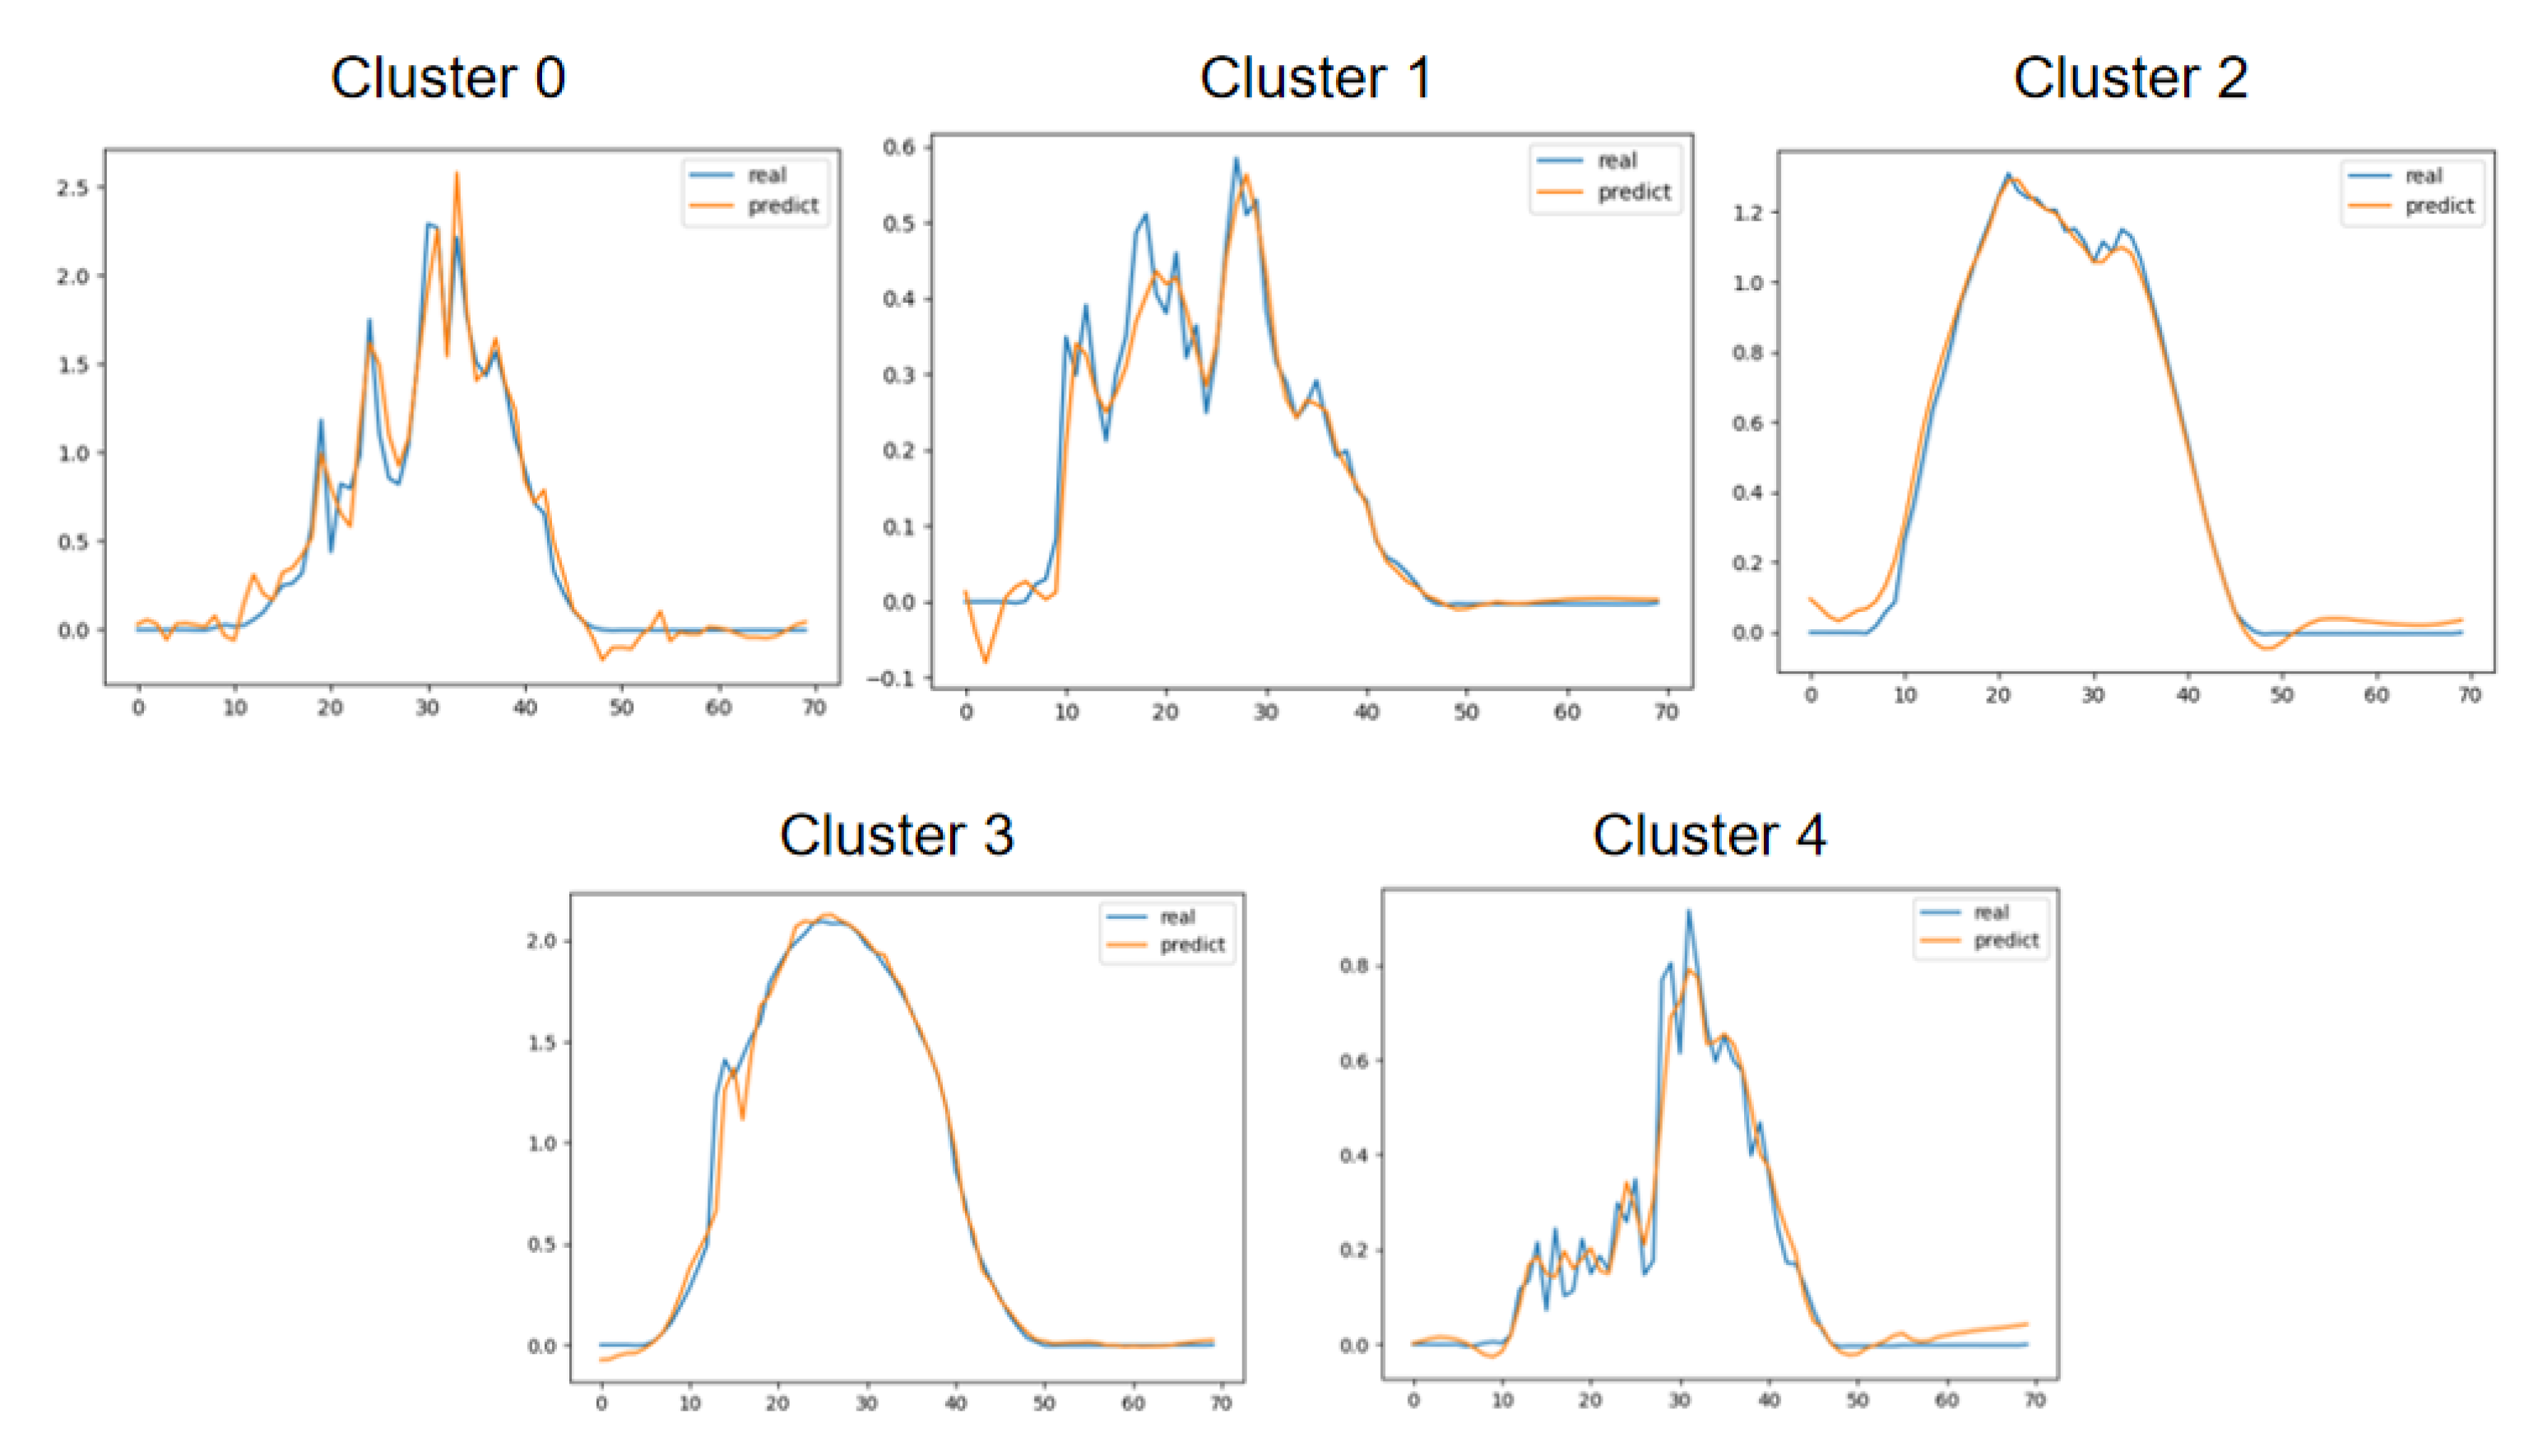
Table 2.
Prediction results versus actual outcomes across five different typical clustering scenarios.
Table 2.
Prediction results versus actual outcomes across five different typical clustering scenarios.
| Cluster 0 | Cluster 1 | Cluster 2 | Cluster 3 | Cluster 4 | |
|---|---|---|---|---|---|
| Error rate | 5.32% | 1.55% | 1.34% | 4.37% | 2.61% |
7. Discussion and Future Outlook
7.1. Research Limitations
Challenges in PV Power Forecasting
In the domain of photovoltaic (PV) power generation, several practical challenges need to be addressed. Despite the robust performance of LSTM (Long Short-Term Memory) networks in time-series forecasting, issues such as overfitting with limited data or complex feature sets remain. The high computational demands of LSTM models also pose obstacles for real-time forecasting applications. CEEMDAN (Complete Ensemble Empirical Mode Decomposition with Adaptive Noise) helps in denoising and feature extraction but may introduce instability in predictions due to its sensitivity to noise in complex data environments.
Issues with Secure Data Aggregation
Homomorphic encryption and the Paillier algorithm are necessary to preserve data privacy in the field of secure data aggregation; however, they also have to deal with performance and efficiency issues. Although it allows calculations on encrypted data, homomorphic encryption usually has a lot of processing power because it makes real-time use of the same computational power. Similar to this, the Paillier algorithm has performance restrictions, particularly when it comes to handling frequent data aggregation jobs with little processing power, even though it works well in secure computations.
7.2. Future Work
Improve the Efficiency and Scale of Similarity Between Homogeneous Encryption Algorithm and Computing
This paper uses the Paillier and BVG algorithms to encrypt user information in a PV power generation system, trying to reduce the possibility of data leakage. These algorithms have reliable security measures, although they bring about large amounts of computational and data storage costs when working with large amounts of data and doing real-time analysis. These costs may restrict the further promotion and upgrading of the complete model.
For next task, we recommend that we should increase the scale and efficiency for the same of these homomorphic methods of the encrypted, which we should try to reduce the related equipment as much and reduce the corresponding costs as possible when we have to meet the same processing and storage requirement with a given data set, so as to reduce these costs and compress the related equipment as much as possible.
Integration of Intelligent Prediction Models with Dynamic Security Strategies
In the analysis stage, we adopted an LSTM network model to predict the photovoltaic power generation, proving its potential as a time series prediction tool. To further improve prediction accuracy and enhance the safety of the photovoltaic power generation system, we suggest future improvement directions, which can combine the prediction model with adaptive security measures. We will also delve deeper into the more profound connection between the LSTM model and the real-time monitoring framework for detecting potential security threats. Two possible directions are: adopting machine learning technology to create advanced anomaly detection systems, accelerating the identification of abnormal patterns in the data, so that we can modify our security protocols in a timely manner; and studying distributed storage solutions based on blockchain technology, which can not only enhance data integrity but also effectively prevent tampering attempts.
8. Conclusion
Using a PV electricity generation system, which is separated into four sections—the data collecting, transmission, storage, and analysis—and the four different life cycles of data transmission are analyzed in this study. To achieve real-time and accurate power forecasting as well as to guarantee user information security in various phases, a secure aggregation method is put out based on these four phases.
The researcher considers the characteristics of distributed PV systems in the data collecting and uses the Paillier algorithms to implement the efficient homomorphic encryption method in the BVG algorithm, which are the most effective homomorphic cryptography methods in the data collection stage. The two above methods allow the original data to be encrypted in real time, and we can split the data set into two kinds of PV system types.
In order to guarantee the security of the data transmission procedure and to effectively reduce the attacks of two different kinds of attackers, the author uses TLS and other secure protocols in the data transfer and transmission stage.
In the data processing and analysis stage, this paper uses partial homomorphic encryption methods to allow us to do complicated operations on encrypted information without knowing the individual user data. At the same time, we apply the LSTM model to time series forecasting, greatly increasing the accuracy and reliability of power generation forecasting.
By applying multi-level security protection measures, this study not only ensures the security of big data in the four stages, but also realizes real-time and accurate power forecasting.
References
- Bonawitz, K., Ivanov, V., Kreuter, B., Marcedone, A., McMahan, H. B., Patel, S., ... & Seth, K. (2017, October). Practical secure aggregation for privacy-preserving machine learning. In proceedings of the 2017 ACM SIGSAC Conference on Computer and Communications Security (pp. 1175-1191).
- Hu, L., & Evans, D. (2003, January). Secure aggregation for wireless networks. In 2003 Symposium on Applications and the Internet Workshops, 2003. Proceedings. (pp. 384-391). IEEE.
- Bonawitz, K., Ivanov, V., Kreuter, B., Marcedone, A., McMahan, H. B., Patel, S., ... & Seth, K. (2016). Practical secure aggregation for federated learning on user-held data. arXiv preprint arXiv:1611.04482.
- Fereidooni, H., Marchal, S., Miettinen, M., Mirhoseini, A., Möllering, H., Nguyen, T. D., ... & Zeitouni, S. (2021, May). SAFELearn: Secure aggregation for private federated learning. In 2021 IEEE Security and Privacy Workshops (SPW) (pp. 56-62). IEEE.
- Kadhe, S., Rajaraman, N., Koyluoglu, O. O., & Ramchandran, K. (2020). Fastsecagg: Scalable secure aggregation for privacy-preserving federated learning. arXiv preprint arXiv:2009.11248.
- Acar, A., Aksu, H., Uluagac, A. S., & Conti, M. (2018). A survey on homomorphic encryption schemes: Theory and implementation. ACM Computing Surveys (Csur), 51(4), 1-35.
- Naehrig, M., Lauter, K., & Vaikuntanathan, V. (2011, October). Can homomorphic encryption be practical?. In Proceedings of the 3rd ACM workshop on Cloud computing security workshop (pp. 113-124).
- Gentry, C. (2009, May). Fully homomorphic encryption using ideal lattices. In Proceedings of the forty-first annual ACM symposium on Theory of computing (pp. 169-178).
- Fan, J., & Vercauteren, F. (2012). Somewhat practical fully homomorphic encryption. Cryptology ePrint Archive.
- Gentry, C., & Halevi, S. (2011, May). Implementing gentry’s fully-homomorphic encryption scheme. In Annual international conference on the theory and applications of cryptographic techniques (pp. 129-148). Berlin, Heidelberg: Springer Berlin Heidelberg.
- Hazay, C., Mikkelsen, G. L., Rabin, T., & Toft, T. (2012). Efficient RSA key generation and threshold paillier in the two-party setting. In Topics in Cryptology–CT-RSA 2012: The Cryptographers’ Track at the RSA Conference 2012, San Francisco, CA, USA, February 27–March 2, 2012. Proceedings (pp. 313-331). Springer Berlin Heidelberg.
- Bahmani, B., Moseley, B., Vattani, A., Kumar, R., & Vassilvitskii, S. (2012). Scalable k-means++. arXiv preprint arXiv:1203.6402.
- Arthur, D., & Vassilvitskii, S. (2006). k-means++: The advantages of careful seeding. Stanford.
- Gao, B., Huang, X., Shi, J., Tai, Y., & Zhang, J. (2020). Hourly forecasting of solar irradiance based on CEEMDAN and multi-strategy CNN-LSTM neural networks. Renewable Energy, 162, 1665-1683.
- Yu, Y., Si, X., Hu, C., & Zhang, J. (2019). A review of recurrent neural networks: LSTM cells and network architectures. Neural computation, 31(7), 1235-1270.
- Sherstinsky, A. (2020). Fundamentals of recurrent neural network (RNN) and long short-term memory (LSTM) network. Physica D: Nonlinear Phenomena, 404, 132306.
- Staudemeyer, R. C., & Morris, E. R. (2019). Understanding LSTM--a tutorial into long short-term memory recurrent neural networks. arXiv preprint arXiv:1909.09586.
- Singh, G. K. (2013). Solar power generation by PV (photovoltaic) technology: A review. Energy, 53, 1-13.
- Das, U. K., Tey, K. S., Seyedmahmoudian, M., Mekhilef, S., Idris, M. Y. I., Van Deventer, W., ... & Stojcevski, A. (2018). Forecasting of photovoltaic power generation and model optimization: A review. Renewable and Sustainable Energy Reviews, 81, 912-928.
- Hosenuzzaman, M., Rahim, N. A., Selvaraj, J., Hasanuzzaman, M., Malek, A. A., & Nahar, A. (2015). Global prospects, progress, policies, and environmental impact of solar photovoltaic power generation. Renewable and sustainable energy reviews, 41, 284-297.
Disclaimer/Publisher’s Note: The statements, opinions and data contained in all publications are solely those of the individual author(s) and contributor(s) and not of MDPI and/or the editor(s). MDPI and/or the editor(s) disclaim responsibility for any injury to people or property resulting from any ideas, methods, instructions or products referred to in the content. |
© 2024 by the authors. Licensee MDPI, Basel, Switzerland. This article is an open access article distributed under the terms and conditions of the Creative Commons Attribution (CC BY) license (http://creativecommons.org/licenses/by/4.0/).
Copyright: This open access article is published under a Creative Commons CC BY 4.0 license, which permit the free download, distribution, and reuse, provided that the author and preprint are cited in any reuse.


