1. Introduction
The cryptocurrency market has attracted the attention of many investors in recent years. Blockchain technology makes it possible to conduct digital transactions between two parties directly and without intermediaries. This technology provides high security for transactions by encrypting information and preventing the possibility of fraud and changes in transactions [
1].
The first and most well-known cryptocurrency is Bitcoin, introduced in 2008 by the pseudonym Satoshi Nakamoto. Bitcoin is one of the most important economic developments, leading to the cryptocurrency market's rapid growth.
Forecasting stock prices in financial markets has always been a challenging task. The main reasons for this challenge are the dynamics of the markets, the impact of unpredictable factors such as global and economic events, and the countless number of variables that affect stock prices. Analyzing users' sentiments and understanding their behaviors can be a valuable tool for predicting the direction of markets and stock prices [
2].
In this paper, we take an essential look at sentiment analysis. In the science of sentiment analysis, the scores obtained from the analysis of different texts are usually used. However, in this research, we are looking for new approaches. Instead of relying solely on scores, we score tweets based on various criteria, including the highest number of likes and volume of tweets. This new method allows us to have a more detailed and comprehensive look at analyzing users' sentiments from the stock market [
3].
Also, this paper discusses the importance of weighting tweet scores and shows how this weighting can improve sentiment analysis and provide more accurate results. On the other hand, it is essential to pay attention to public opinions and experts' views about the impact of sentiment analysis on financial markets. This paper comprehensively examines the various advantages and challenges of these approaches. Finally, this article tries to clarify the critical role that sentiment analysis and social networks like Twitter can play in predicting the direction of markets and financial decisions [
4].
Deep learning models can extract complex patterns from texts, and through learning from big data, they can recognize hidden connections. In addition, deep learning models can combine textual data with numerical and temporal data for better and more detailed analysis. This combination provides information from different sources and enables multi-dimensional analysis of the market and user opinions. This helps to increase accuracy in forecasting and financial decisions. This becomes more important for predicting the direction of markets and financial decisions because it allows maneuvering against complex variables and rapid changes in the market [
5].
In general, deep learning models are of great importance in sentiment analysis and market direction prediction and can significantly improve the accuracy and efficiency of the models. These advanced tools can guide decision-makers in financial markets to make better decisions in the rapid changes and complexities of the market.
We used a dataset that contained several features for sentiment analysis, including the volume of tweets, the highest number of likes received by a tweet, and the score obtained from Vader's output. Instead of using a composite column that includes Vader's output scores, the mean emotional score was used as a feature [
6].
Our analysis in this paper was performed daily; some days, there was more than one tweet. For this reason, we decided to use the average sentiment scores of the tweets in the first part of the sentiment analysis.
In addition, we examined the number of tweets sent in a day, and this factor can effectively predict the price of Bitcoin in the future. For this reason, this factor was also considered in our models.
In the initial phase of our study, an extensive evaluation was conducted on various deep learning models, including SL, LG, LGC, BL, and BG, with a primary focus on their performance without incorporating sentiment analysis considerations. Through meticulous assessment, it was observed that the BG model exhibited noteworthy performance in evaluation metrics, mainly showcasing impressive results in Mean Absolute Error (MAE) and Loss.
Building upon these findings, the investigation progressed to a second stage, where we assessed how tweet volume influences the performance of the models mentioned above. This exploration aimed to unravel the intricate interplay between the tweets' volume and the selected models' predictive capabilities that the result obtained from this model has low accuracy.
The third stage of our study involved a comprehensive examination of the simulation results derived from the VADER model. By integrating these results, we sought to gain deeper insights into the intricate nuances of sentiment analysis and its potential impact on the performance of deep learning models. Regarding the MAE metric, we improved between %1.85 and %2.2. In terms of Loss metric, we improved between %0.33 and %39.
In the subsequent phase, the fourth stage, we explored an unconventional approach by considering the maximum likes for tweets as a tool for sentiment analysis. This novel perspective aimed to leverage user engagement metrics as a potential sentiment indicator, providing an alternative viewpoint to conventional sentiment analysis methods. Regarding the MAE metric, we improved between % 5 and %26. In terms of Loss metric, we improved between %11 and %35.
The culmination of our research, central to the focus of this scientific article, is encapsulated in the fifth and final stage, where we unveil a sophisticated approach to sentiment analysis. Within this pivotal phase, we strategically employed weighted averaging to significantly enhance the precision and accuracy of sentiment analysis within the scope of our study.
Upon scrutinizing the outcomes derived from our two prior sentiment analysis methods—specifically, tweet volume and maximum likes—we concluded that incorporating maximum likes as weights for the weighted averaging sentiment analysis method proves advantageous. By incorporating this innovative technique, our objective is to provide pioneering insights and methodologies that advance the field of sentiment analysis, particularly within the domain of deep learning models. In
Table 1, we have given the models' names and their abbreviations.
The BG model provided approximately 11% improvement based on the MAE metric and about 15% improvement based on the Loss metric for better detection on the following day. These significant enhancements underscore the superior and notable performance of the BG model in prediction and detection for the next day.
The research presented in this paper makes noteworthy contributions in the following key areas:
Major contribution
Innovations in the Article
This article introduces significant innovations in sentiment analysis and Bitcoin price prediction. The key innovations include:
Use of Weighted Average in Sentiment Analysis:
The article employs a weighted average approach to enhance the accuracy of sentiment analysis. This method improves the precision of predictions by considering the number of likes on tweets as weights.
In fact, In the pursuit of practical sentiment analysis, we delved into various methodologies, with a particular focus on the analysis of tweet volume and maximum likes. Exploring these techniques yielded valuable insights, prompting the realization that a novel methodology was imperative. Through an iterative process of continuous investigation, we successfully devised an innovative solution to augment the system's performance. This involved leveraging the maximum likes as weights to calculate the average scores of tweets. In essence, we established weighted averaging as the principal and definitive tool for sentiment analysis.
2. Bidirectional GRU Neural Network Model
One of the pivotal outcomes of our study involves integrating the BG deep neural network to predict the future price trends of Bitcoin. By combining advanced neural network architectures, we aimed to provide an accurate and reliable forecast of Bitcoin price movements, contributing to the broader understanding of cryptocurrency market dynamics.
By addressing these essential aspects, our research aims to enhance the methodologies employed in sentiment analysis and contribute valuable insights to cryptocurrency price prediction, fostering advancements in sentiment analysis and financial forecasting.
In
Table 1, we have given the names of all the models used in this article and their abbreviations.
2. Related Work
Background and Definitions
The strong correlation between market sentiment and price fluctuations drives the use of sentiment analysis in cryptocurrency price prediction. Emotions and opinions on social media platforms like Twitter can significantly impact investor behavior and market trends. Consequently, integrating sentiment analysis into prediction models has become a focal point of research, offering insights that enhance the accuracy of cryptocurrency price forecasts.
The extensive literature on Bitcoin price prediction using sentiment analysis and Twitter features reflects the increasing interest and ongoing investment in this research area. Numerous studies have examined various methods and techniques for incorporating sentiment analysis into price prediction models, highlighting the critical relationship between sentiment and Bitcoin prices [Staliūnaitė, #23].
In advancing the field of Bitcoin price prediction, a comprehensive understanding of existing research is crucial. This section delves into critical studies that have laid the groundwork for our research, reviewing their findings and methodologies to establish a solid foundation for our work and identify gaps warranting further exploration. Among the pivotal aspects of this exploration is the examination of various models and techniques employed in related studies. Key concepts such as Convolutional Neural Networks (CNN), Gated Recurrent Units (GRU), Long Short-Term Memory (LSTM), Bidirectional Gated Recurrent Units (BiGRU), and Bidirectional Long Short-Term Memory (BiLSTM) have significantly contributed to the advancement of price prediction [
8].
Convolutional Neural Networks (CNN)
The modified Convolutional Neural Network (CNN) architecture integrates textual and temporal data for sequential analysis. It begins with an embedding layer that transforms words into dense vectors, followed by 1D convolutional layers to capture local features within the text. Max-pooling operations then down-sample the data while retaining essential information [
9].
Gated Recurrent Units (GRU)
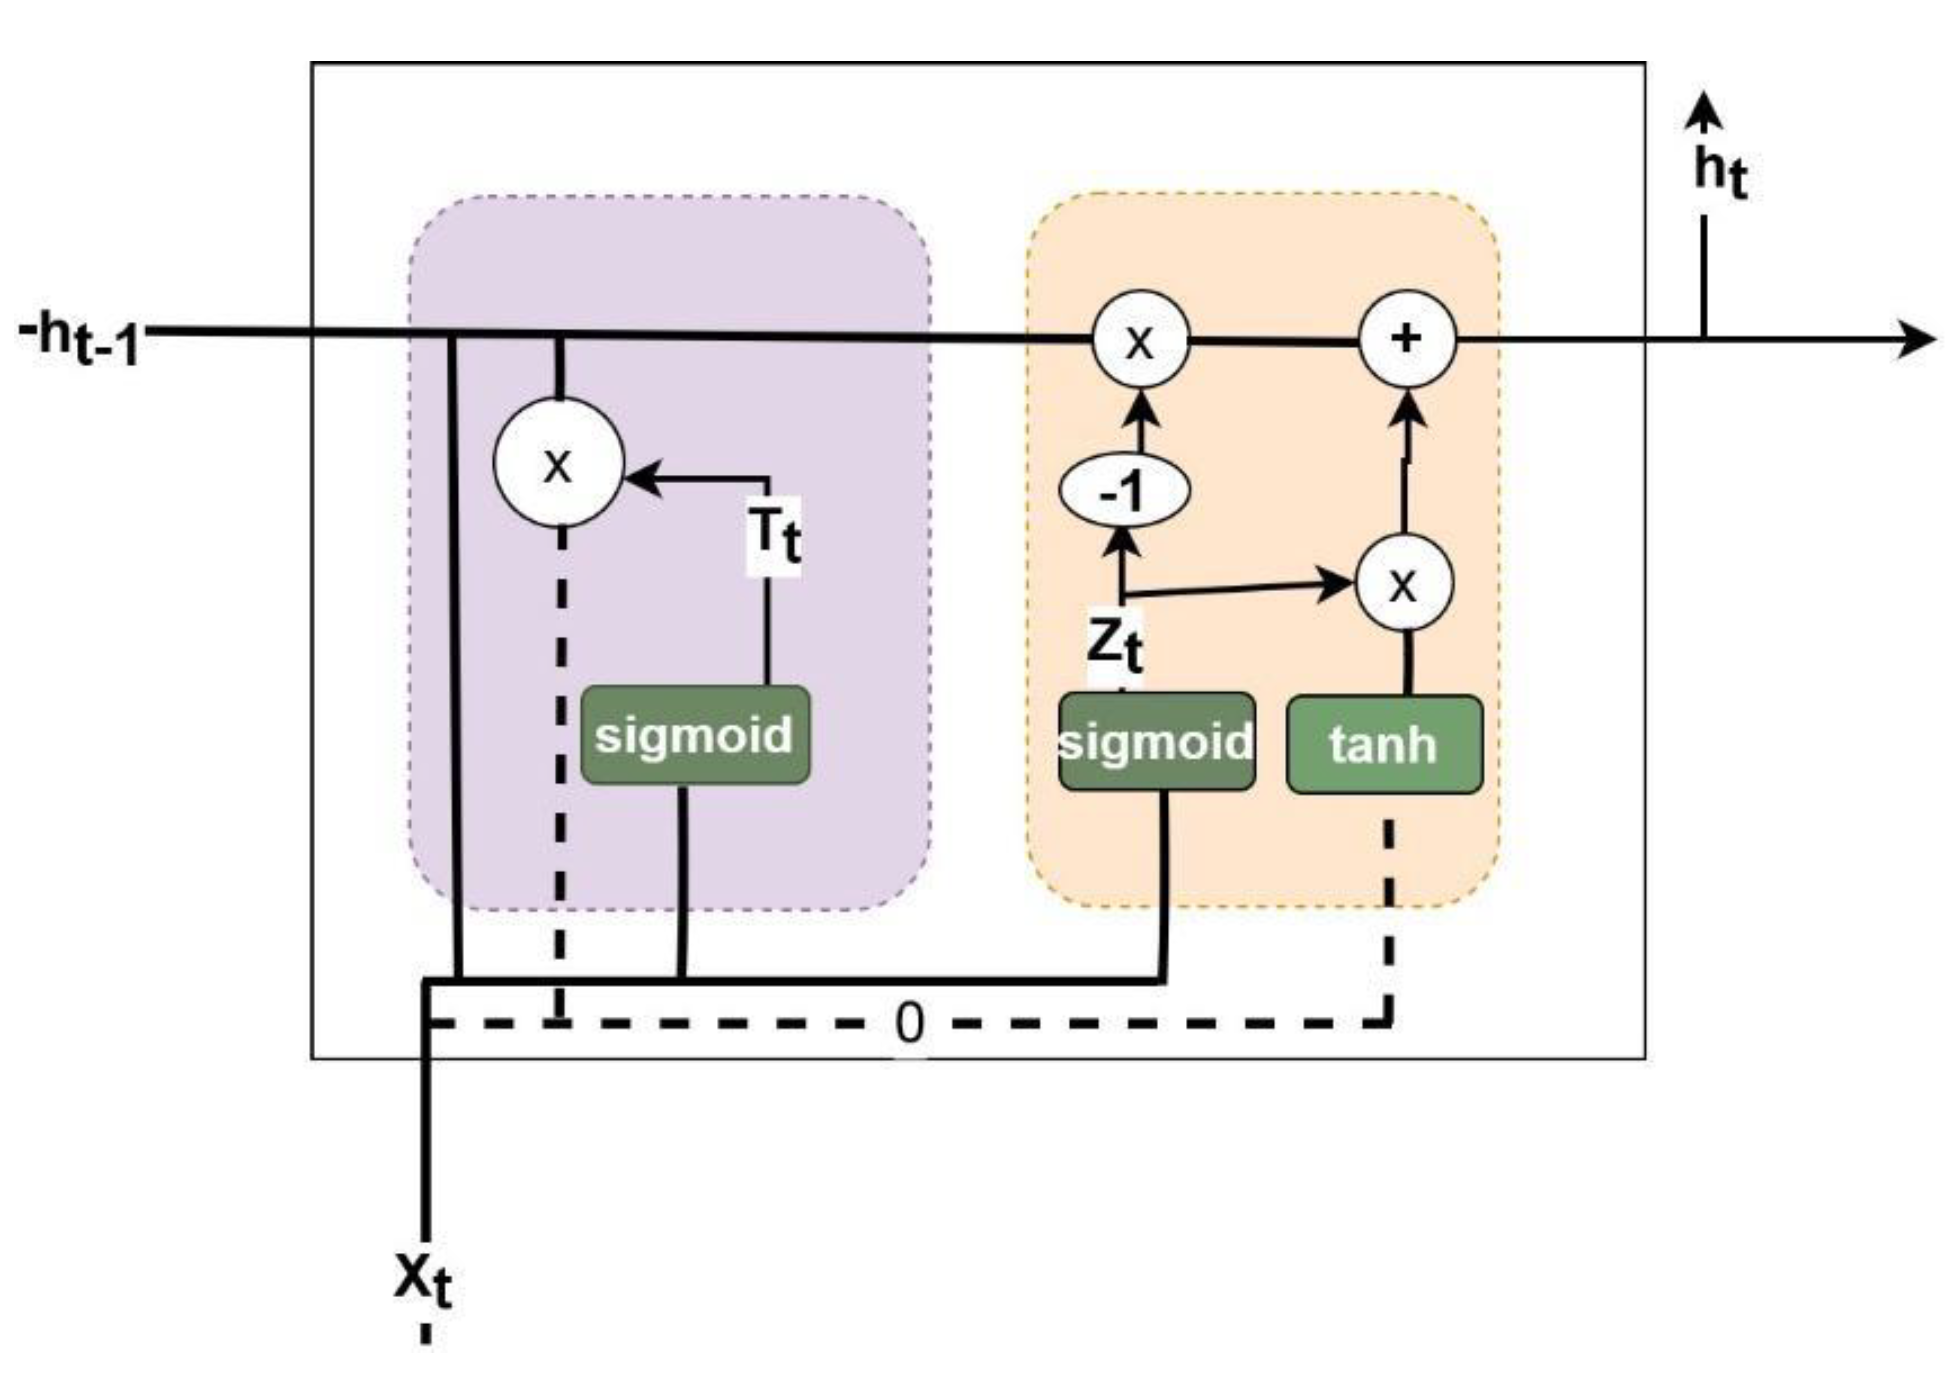
GRUs are a type of recurrent neural network (RNN) architecture designed to address the vanishing gradient problem in traditional RNNs. As we can see in
Figure 1, GRUs use gating mechanisms to control the flow of information within the network, allowing them to capture long-range dependencies in sequential data while mitigating the challenges associated with vanishing gradients. In
Figure 1, we show the diagram of GRU [
7]
.
Long Short-Term Memory (LSTM)
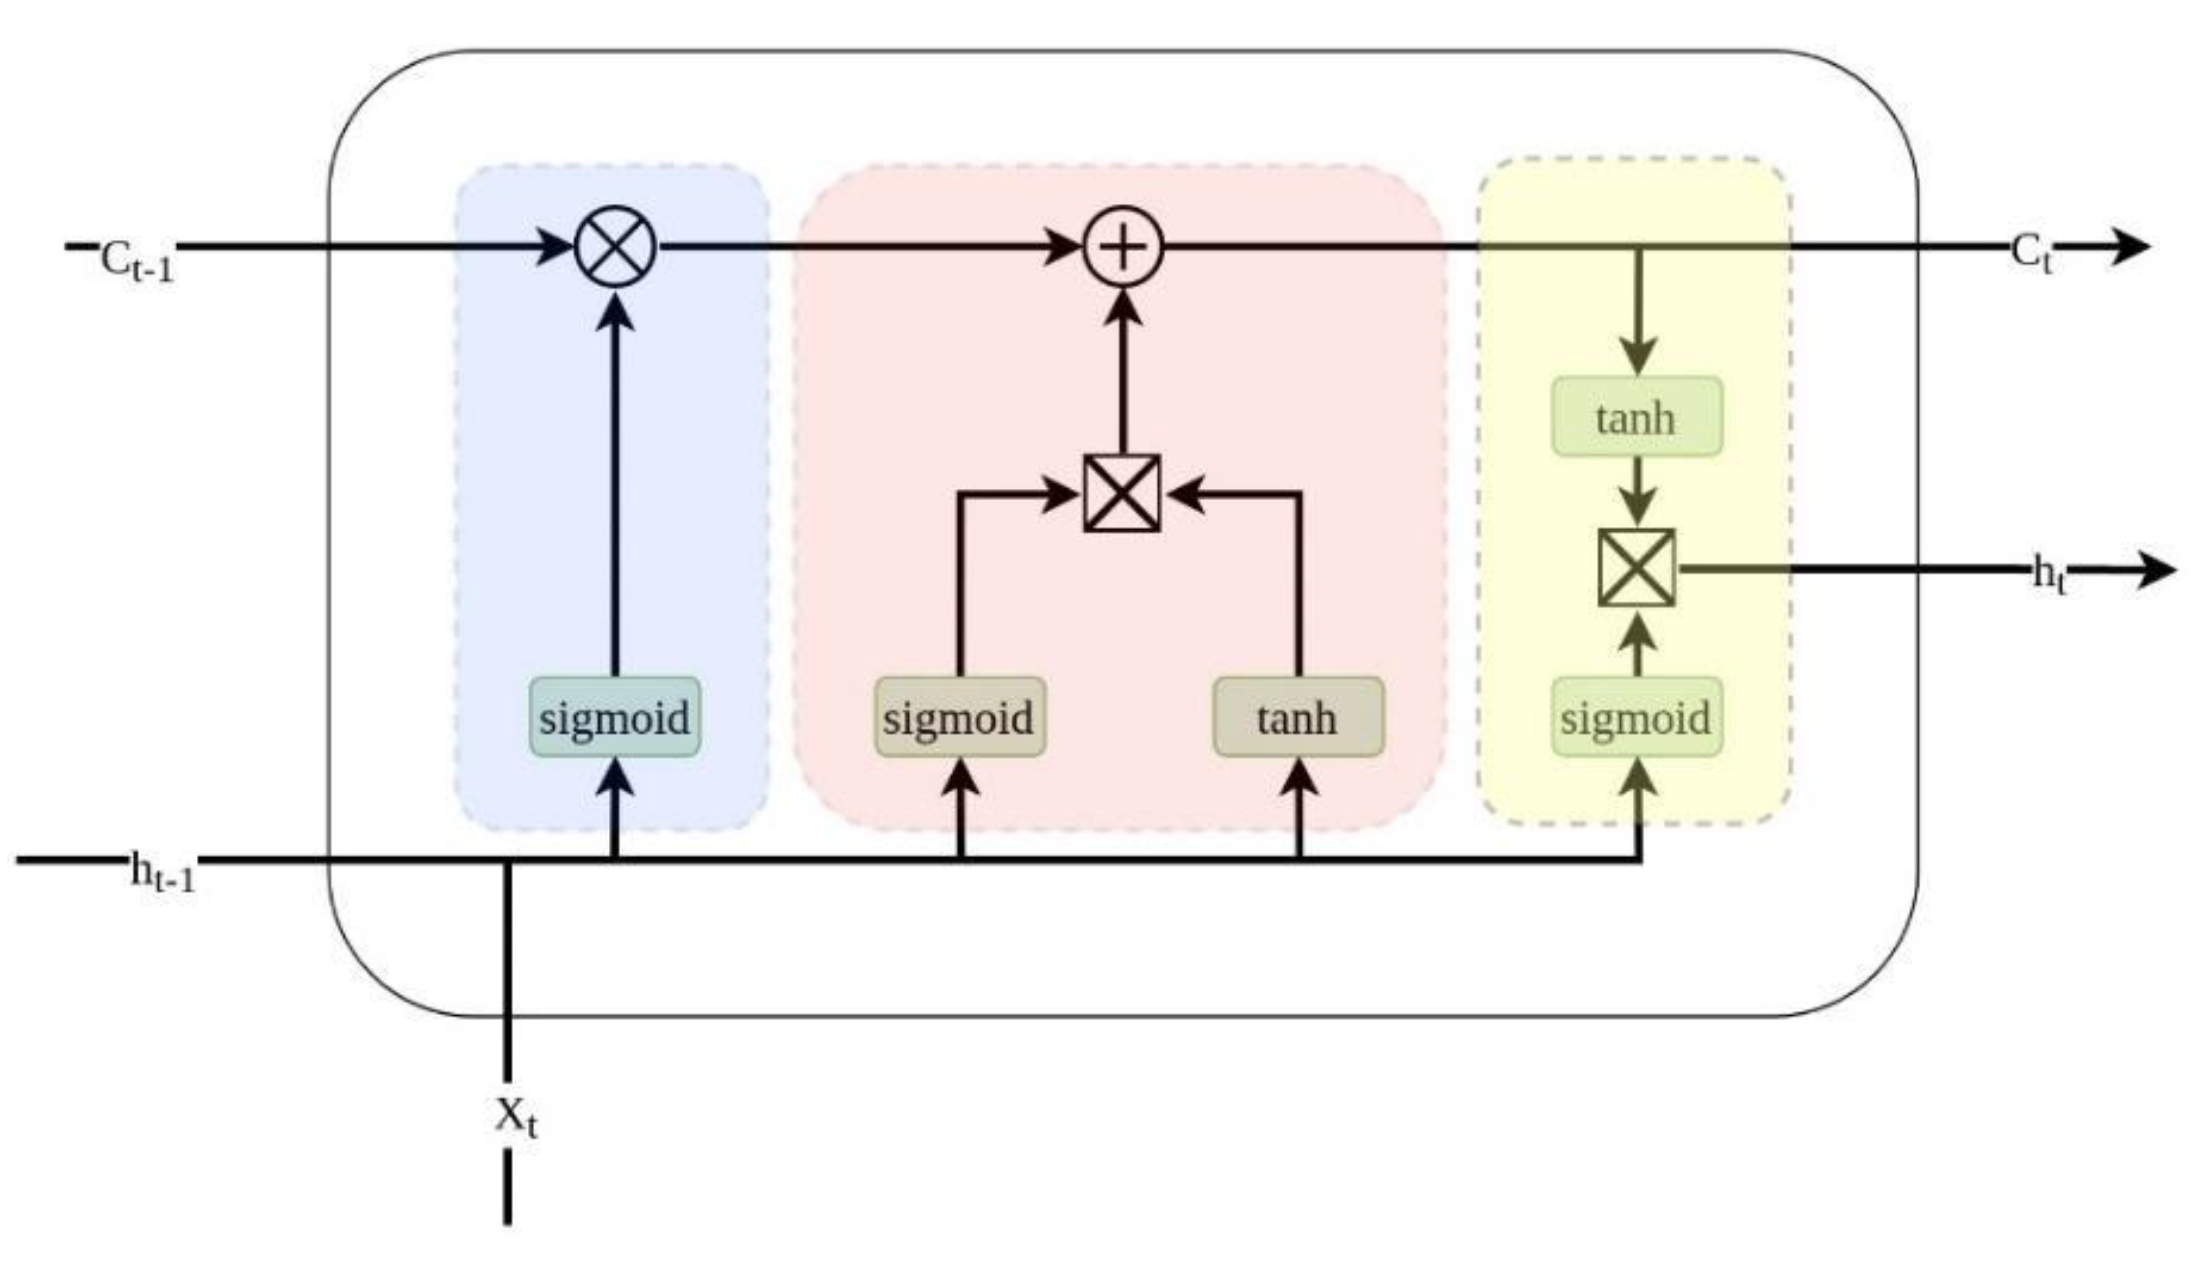
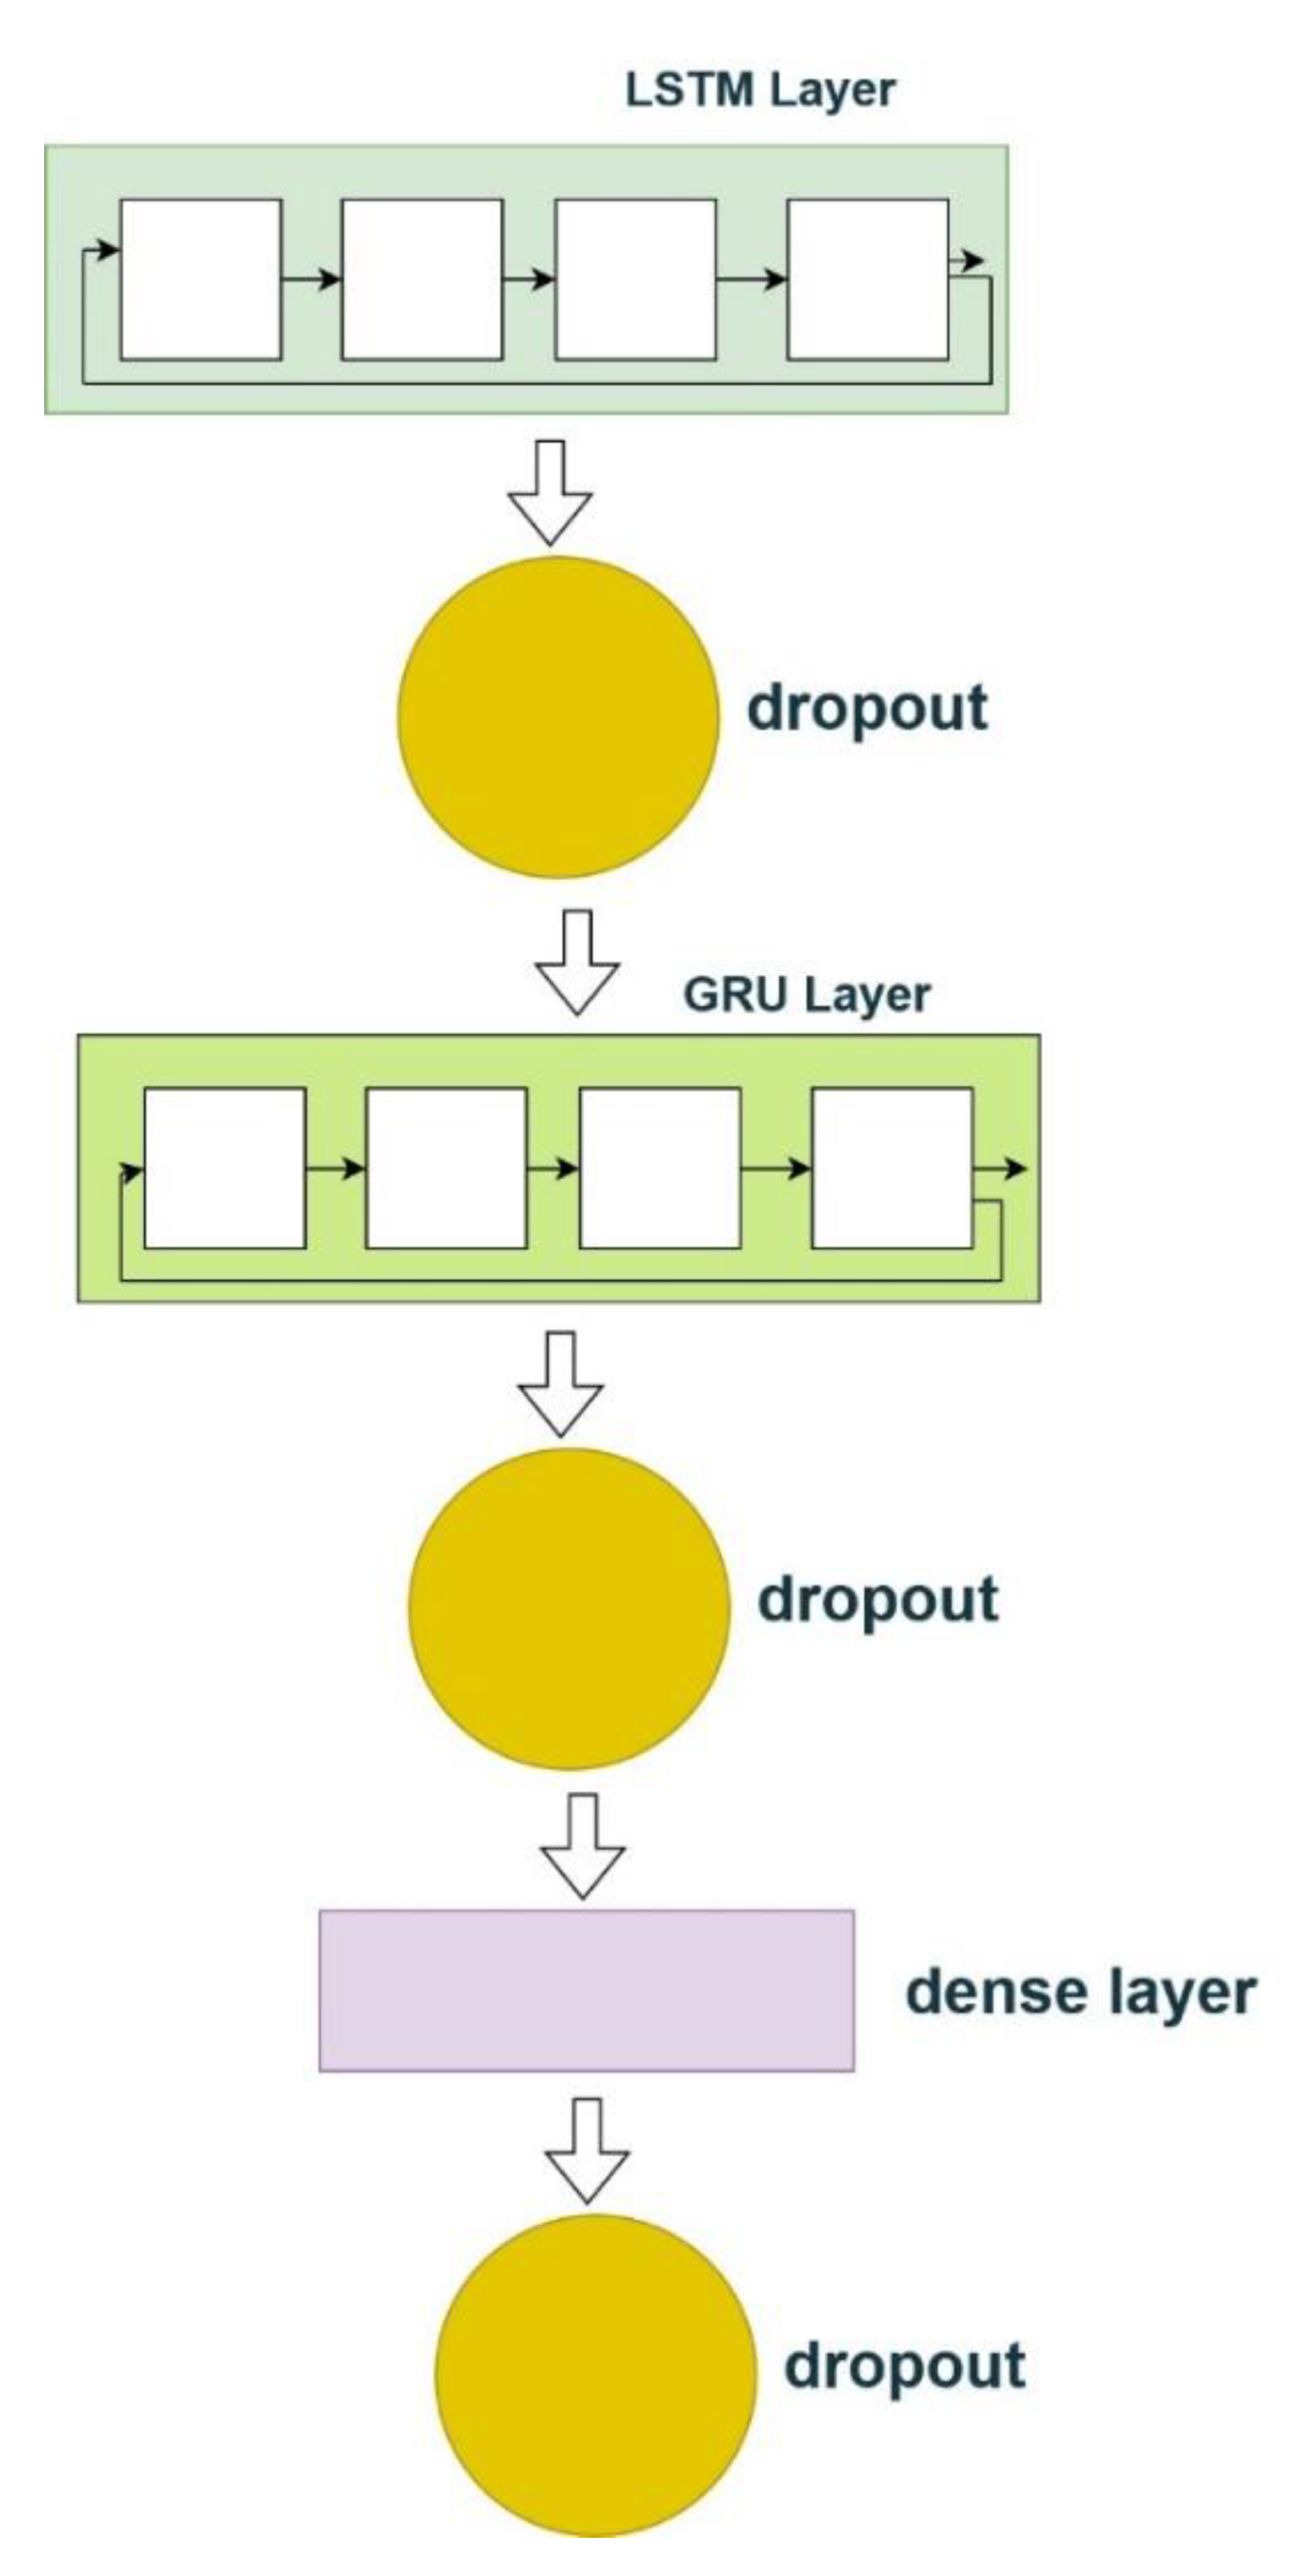
Figure 2 illustrates the architecture of the LSTM (Long Short-Term Memory) model used in the study. The model consists of multiple LSTM layers that are designed to capture temporal dependencies in the financial market data. Each LSTM layer includes a specified number of units, which are the individual memory cells responsible for learning and retaining information over long sequences. The final output layer produces predictions based on the learned representations. The use of LSTM is particularly suitable for time-series data due to its ability to manage long-term dependencies and mitigate issues like vanishing gradients.
Bidirectional Gated Recurrent Units (BiGRU)
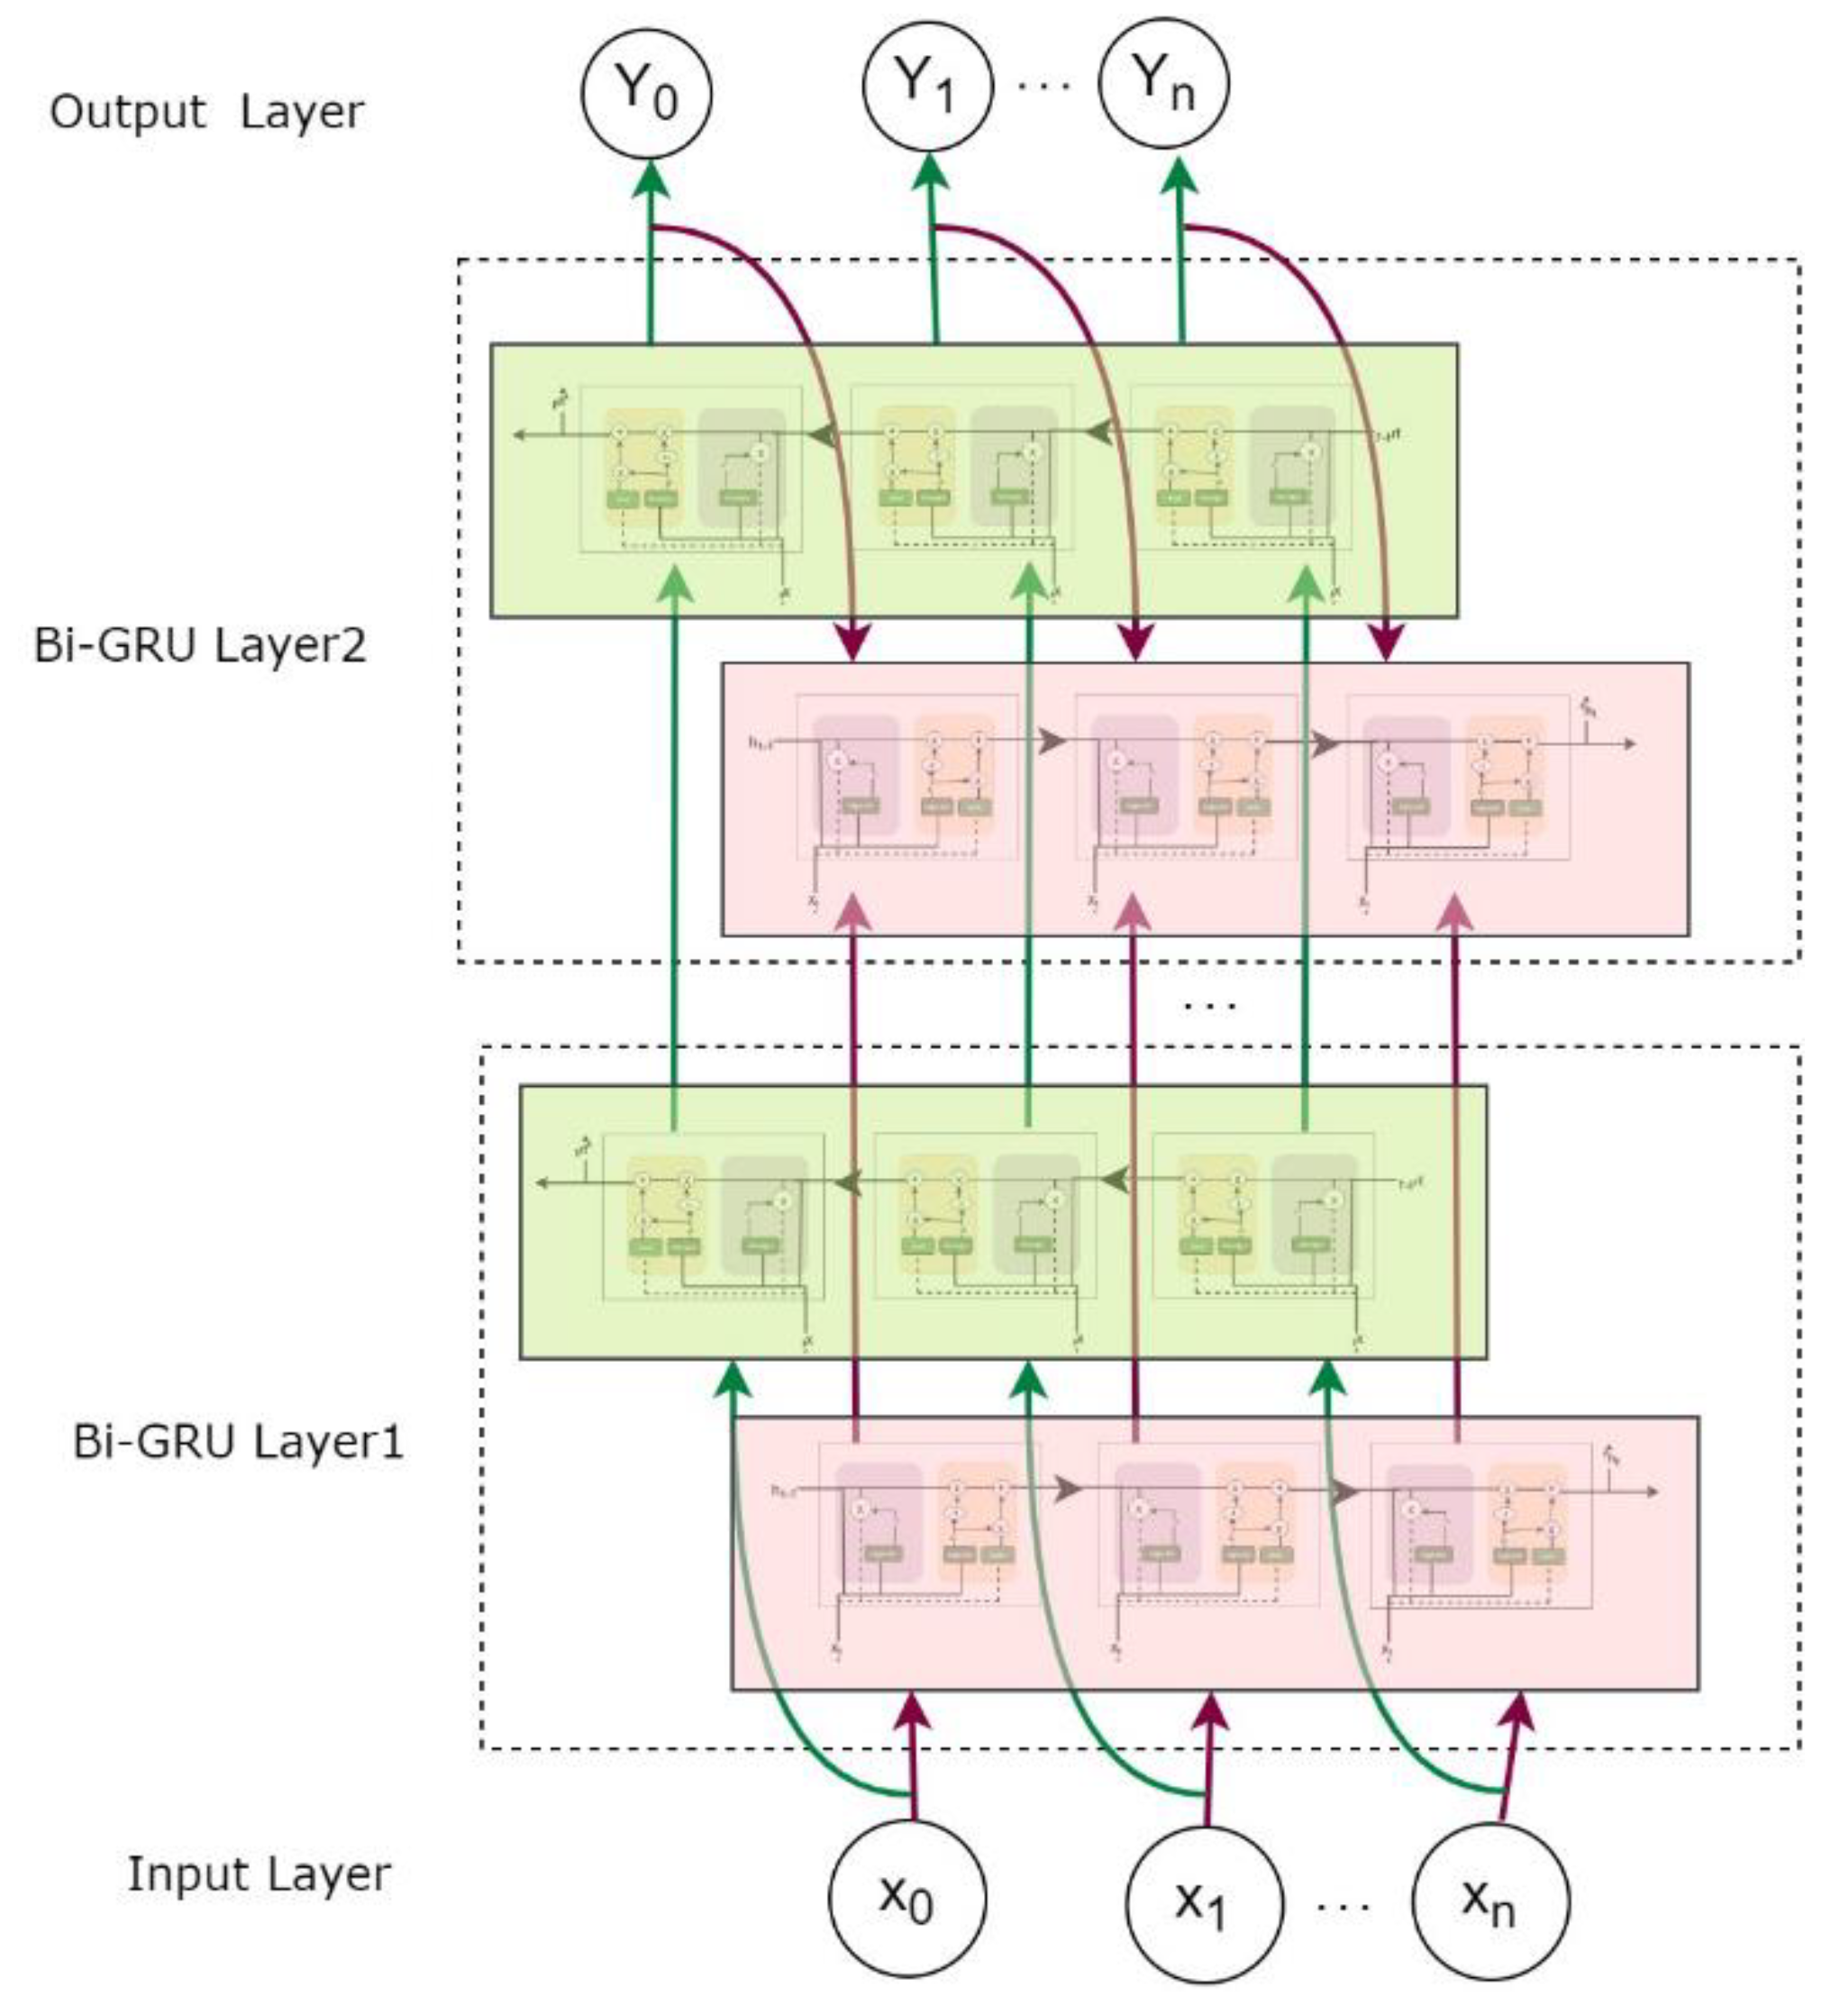
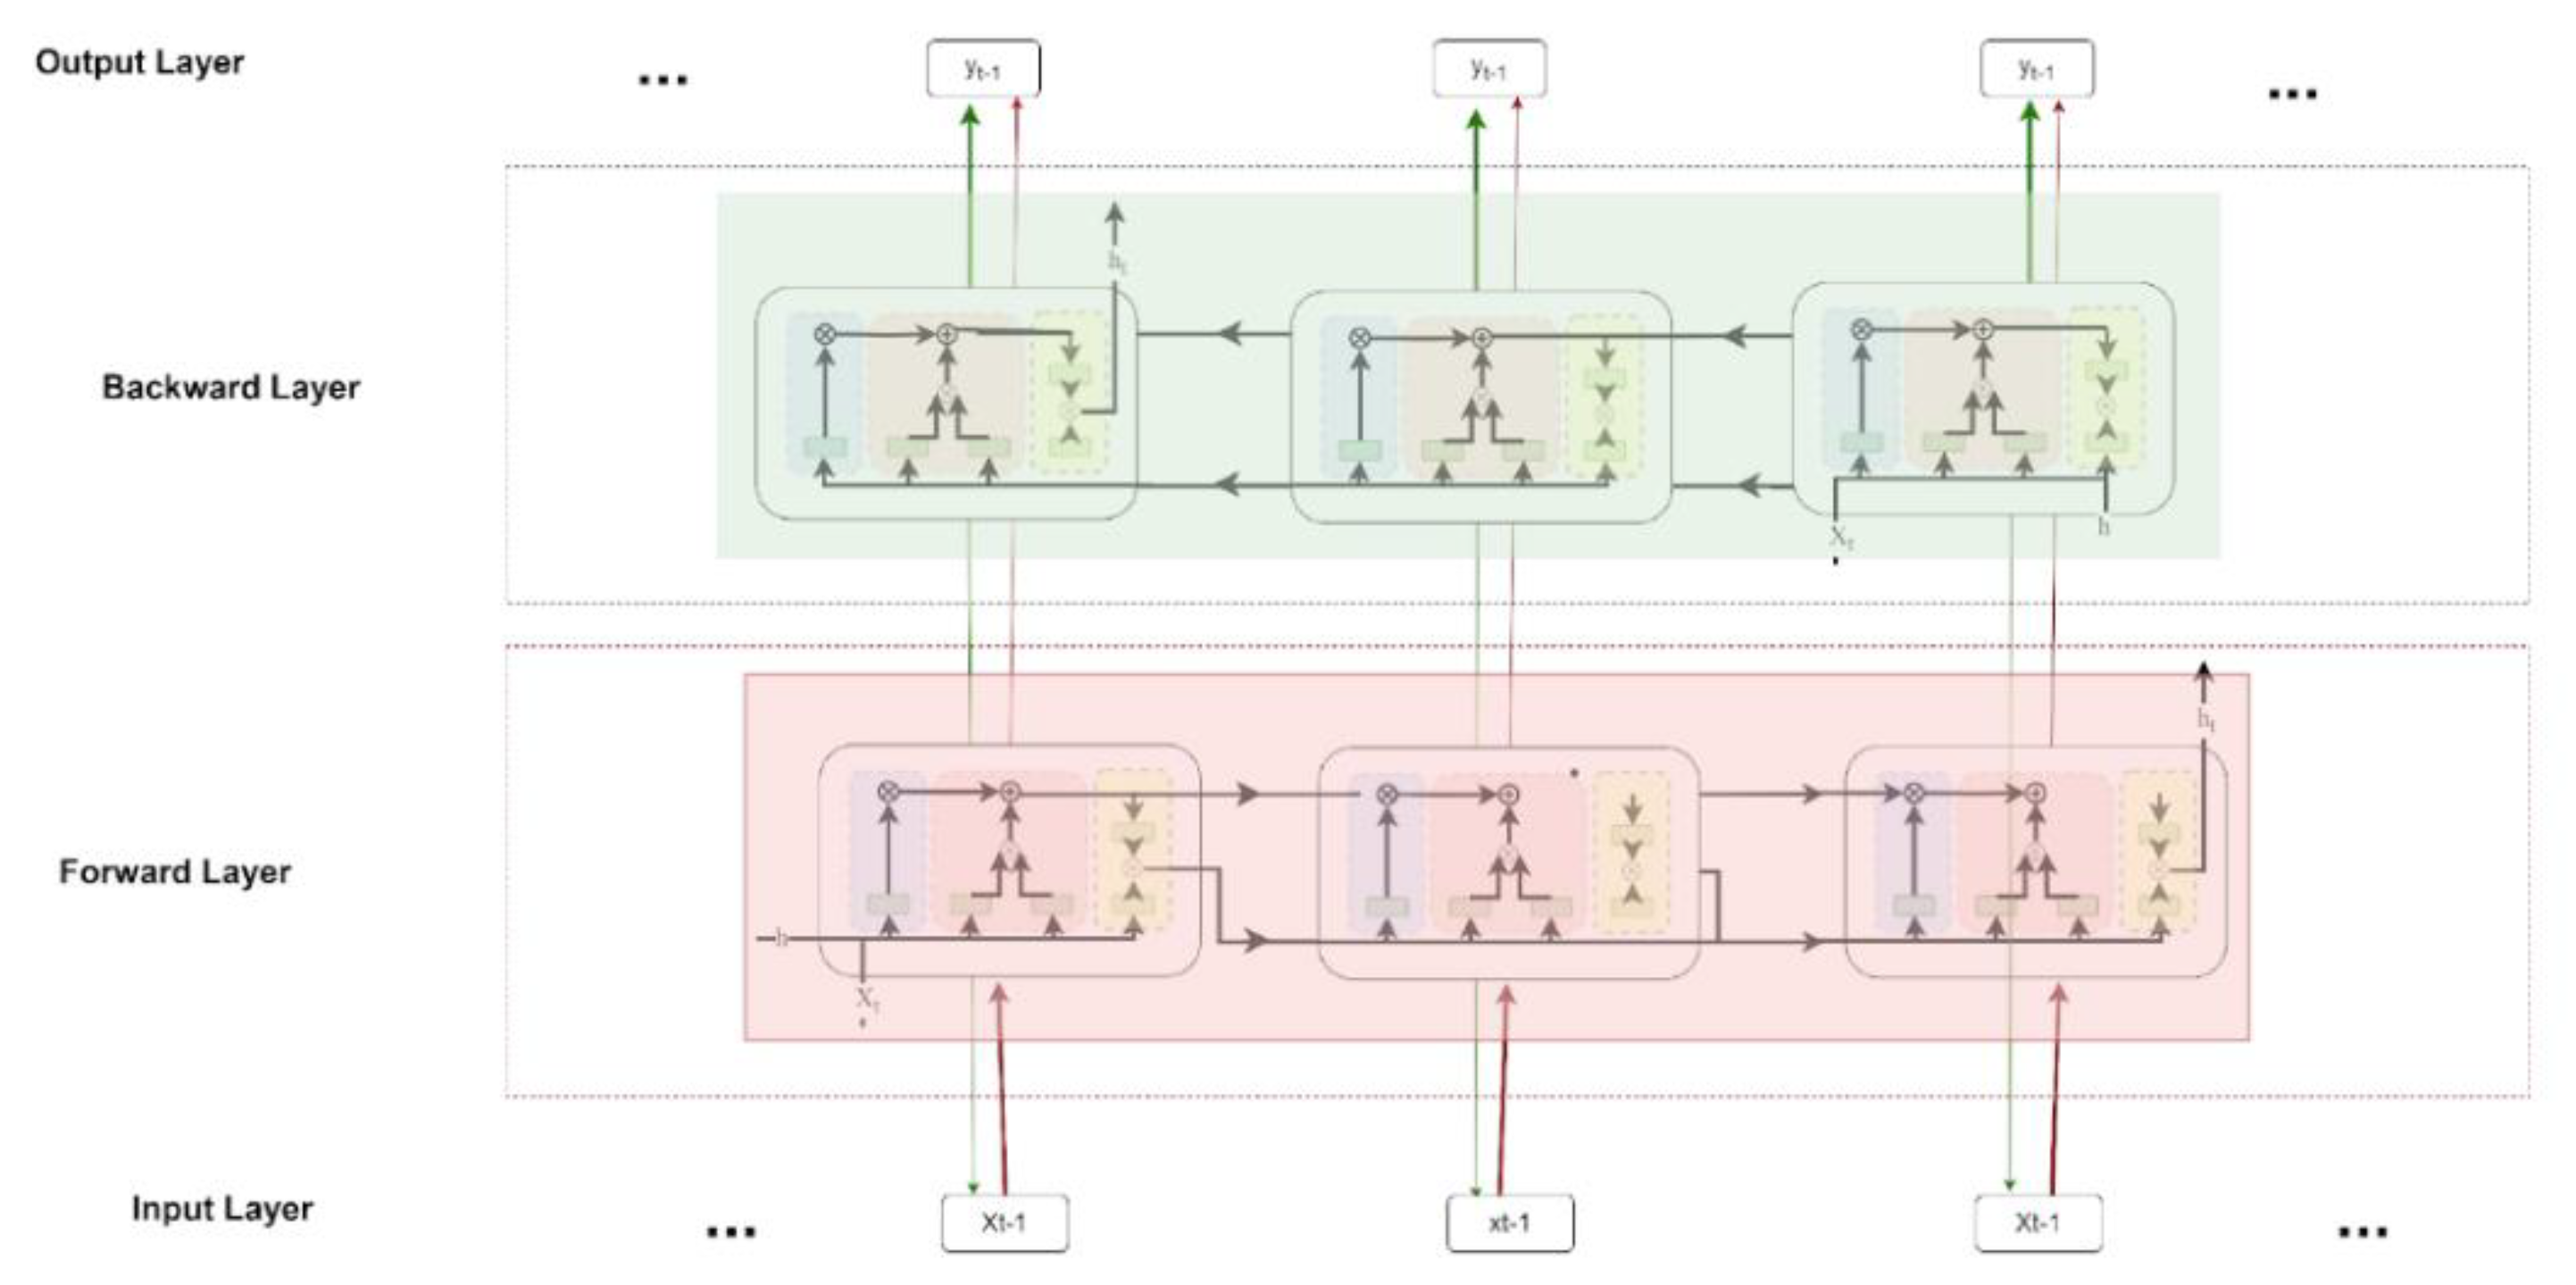
BiGRU extends GRU by processing input data in both forward and backward directions, allowing the model to capture dependencies from past and future contexts. This bidirectional processing enhances the model's ability to understand sequential patterns in data [
11].
Bidirectional Long Short-Term Memory (BiLSTM)
Similar to BiGRU, BiLSTM processes data in both forward and backward directions, enhancing the model's ability to capture long-range dependencies in sequential data. This bidirectional approach is particularly effective in tasks requiring a comprehensive understanding of context [
12].
These concepts serve as the building blocks for many state-of-the-art models in cryptocurrency price prediction, and a thorough exploration of their applications and limitations will contribute significantly to the development of our research framework [
13].
Review of Related Works:
The integration of sentiment analysis into digital currency forecasting has garnered significant attention due to the demonstrated impact of social media sentiment on market trends. This section reviews key studies that have employed sentiment analysis and machine learning techniques to predict Bitcoin prices, highlighting their methodologies and findings. By examining these works, we can contextualize our research within the broader landscape and draw insights to inform our model development. before them,
Table 2 compares several models with our model.
Nasra et al. examines the use of sentiment analysis and machine learning techniques to predict the price of Bitcoin. The authors collect Twitter data and apply sentiment analysis to determine the sentiment tags of tweets. They then use machine learning algorithms to predict the price of Bitcoin based on these emotional tags. This study shows that sentiment analysis can be a useful tool in predicting Bitcoin price movements [
8].
Zhang This article examines the relationship between Twitter sentiment and Bitcoin price volatility. The authors collect Twitter data and perform sentiment analysis to determine the sentiment score of tweets. They then analyze the correlation between these sentiment scores and Bitcoin price movements. This study shows that there is a significant relationship between Twitter sentiment and Bitcoin price volatility, which suggests that sentiment analysis can be a valuable tool for predicting Bitcoin price movements [
9].
In this article, Zhang examines the use of sentiment analysis of Twitter data to predict the price of Bitcoin. The authors collect a large dataset of Bitcoin-related tweets and perform sentiment analysis to determine the sentiment score of the tweets. They then analyze the relationship between these sentiment scores and Bitcoin price movements. This study shows that there is a significant correlation between Twitter sentiment and Bitcoin price, suggesting that sentiment analysis can be a useful tool for predicting Bitcoin price movements [
10].
In this paper, Chen and Zhu propose a Bitcoin price prediction model that combines sentiment analysis and machine learning techniques. The authors collect Twitter data and perform sentiment analysis on tweets. They then use machine learning algorithms, such as support vector regression, to predict the price of Bitcoin based on the results of sentiment analysis. This study shows that combining sentiment analysis with machine learning can improve the accuracy of Bitcoin price predictions [
11].
Wang et al. propose a Bitcoin price prediction model that combines sentiment analysis with a short-term memory (LSTM) neural network. The authors collect Twitter data and perform sentiment analysis on tweets. Then they use the LSTM neural network to predict the price of Bitcoin based on the results of sentiment analysis. This study shows that the proposed model outperforms traditional machine learning models in predicting the price of Bitcoin [
12].
Garcia and Schweitzer examine the relationship between social signals, including sentiment from Twitter, and algorithmic trading of Bitcoin. The authors analyze a large dataset of Bitcoin-related tweets and investigate the impact of sentiment on Bitcoin price volatility. They found that sentiment analysis can provide valuable insights for algorithmic trading strategies in the Bitcoin market [
12,
13].
Kristofek examines the efficiency of Bitcoin markets and how it has evolved over time. The author analyzes Bitcoin price data and examines whether the market is efficient or not. This study shows that Bitcoin markets have become more efficient over time and suggests that Bitcoin price movements are becoming harder to predict [
14].
Schweitzer, Garcia examines the relationship between social signals, such as sentiment expressed on Twitter, and algorithmic trading of Bitcoin. The authors analyze Twitter data and Bitcoin price data to investigate how social signals influence trading decisions. This study shows that social signals can have a significant impact on Bitcoin trading and that incorporating sentiment analysis into trading strategies can lead to improved performance [
13].
This paper, authored by Satoshi Nakamoto, introduces the concept of Bitcoin as a decentralized digital currency. It presents the technical details of the Bitcoin protocol, including the use of cryptographic techniques and a peer-to-peer network for transaction verification and record-keeping. The paper outlines the motivation behind Bitcoin's creation and its potential to revolutionize the financial system by eliminating the need for intermediaries [
15].
Kristofek This research paper by Kristofek examines the main drivers of Bitcoin price volatility using wavelet coherence analysis. This study examines the relationship between the price of Bitcoin and various factors such as trading volume, Google search trends, and the price of gold. This analysis shows significant co-movements between the Bitcoin price and these factors, indicating their influence on the Bitcoin price dynamics [
16].
This paper by Zhang, Fuhrs, Glover examines the predictive power of Twitter sentiment analysis for stock market indices. Although not specifically focused on Bitcoin, the methodology and findings of this study are relevant to the use of sentiment analysis in cryptocurrency price forecasting. This research shows that sentiment expressed on Twitter can provide valuable insights into stock market movements and potentially be used as a predictive tool [
17].
Bach and Sweeney's paper specifically focuses on cryptocurrency price forecasting using sentiment analysis. This study uses Twitter data and sentiment tags, such as the number of likes, to analyze the relationship between sentiment and cryptocurrency price movements. This research uses machine learning techniques to develop predictive models and evaluate their performance in predicting digital currency prices [
8].
In
Table 3, we have compared the results obtained from our own model with the models mentioned in
Table 2. In order to compare these models with our model, we have used two RMSE and MAE metric, which will be fully explained in the methodology section.
In this study, we have used two primary metrics for evaluating the performance of our models: Root Mean Square Error (RMSE) and Mean Absolute Error (MAE). These metrics were chosen for their distinct and complementary characteristics in assessing model accuracy.
Root Mean Square Error (RMSE)
RMSE is a widely used metric that measures the square root of the average squared differences between predicted and actual values. It is particularly sensitive to large errors because it squares the differences before averaging, thus giving more weight to larger discrepancies. This sensitivity makes RMSE a valuable tool for detecting significant errors and outliers in model predictions, which is crucial in financial applications where large prediction errors can have substantial impacts.
Mean Absolute Error (MAE)
MAE, on the other hand, calculates the average absolute differences between predicted and actual values. Unlike RMSE, MAE does not square the differences, making it less sensitive to outliers and more interpretable in terms of the average size of the errors. MAE provides a straightforward measure of the accuracy of predictions, offering insights into the average magnitude of errors without overemphasizing larger errors.
Justification for Using Both Metrics
The combination of RMSE and MAE provides a more comprehensive evaluation of model performance. RMSE highlights larger errors and is useful for ensuring that the model minimizes significant prediction deviations, which is essential in high-stakes environments such as financial markets. Meanwhile, MAE offers a clear and interpretable measure of overall prediction accuracy, helping to ensure that the model performs consistently well across all predictions.
By employing both RMSE and MAE, we ensure that our model not only minimizes large errors but also maintains a high level of overall prediction accuracy, making it robust and reliable for predicting Bitcoin price trends.
3. Materials and Methods
Forecasting stock prices in financial markets has always been a challenging task. The main reasons for this challenge are the dynamics of the markets, the impact of unpredictable factors such as global and economic events, and the countless number of variables that affect stock prices. In this situation, analyzing the sentiments of users and understanding their behaviors can serve as a valuable tool for predicting the direction of markets and stock prices.
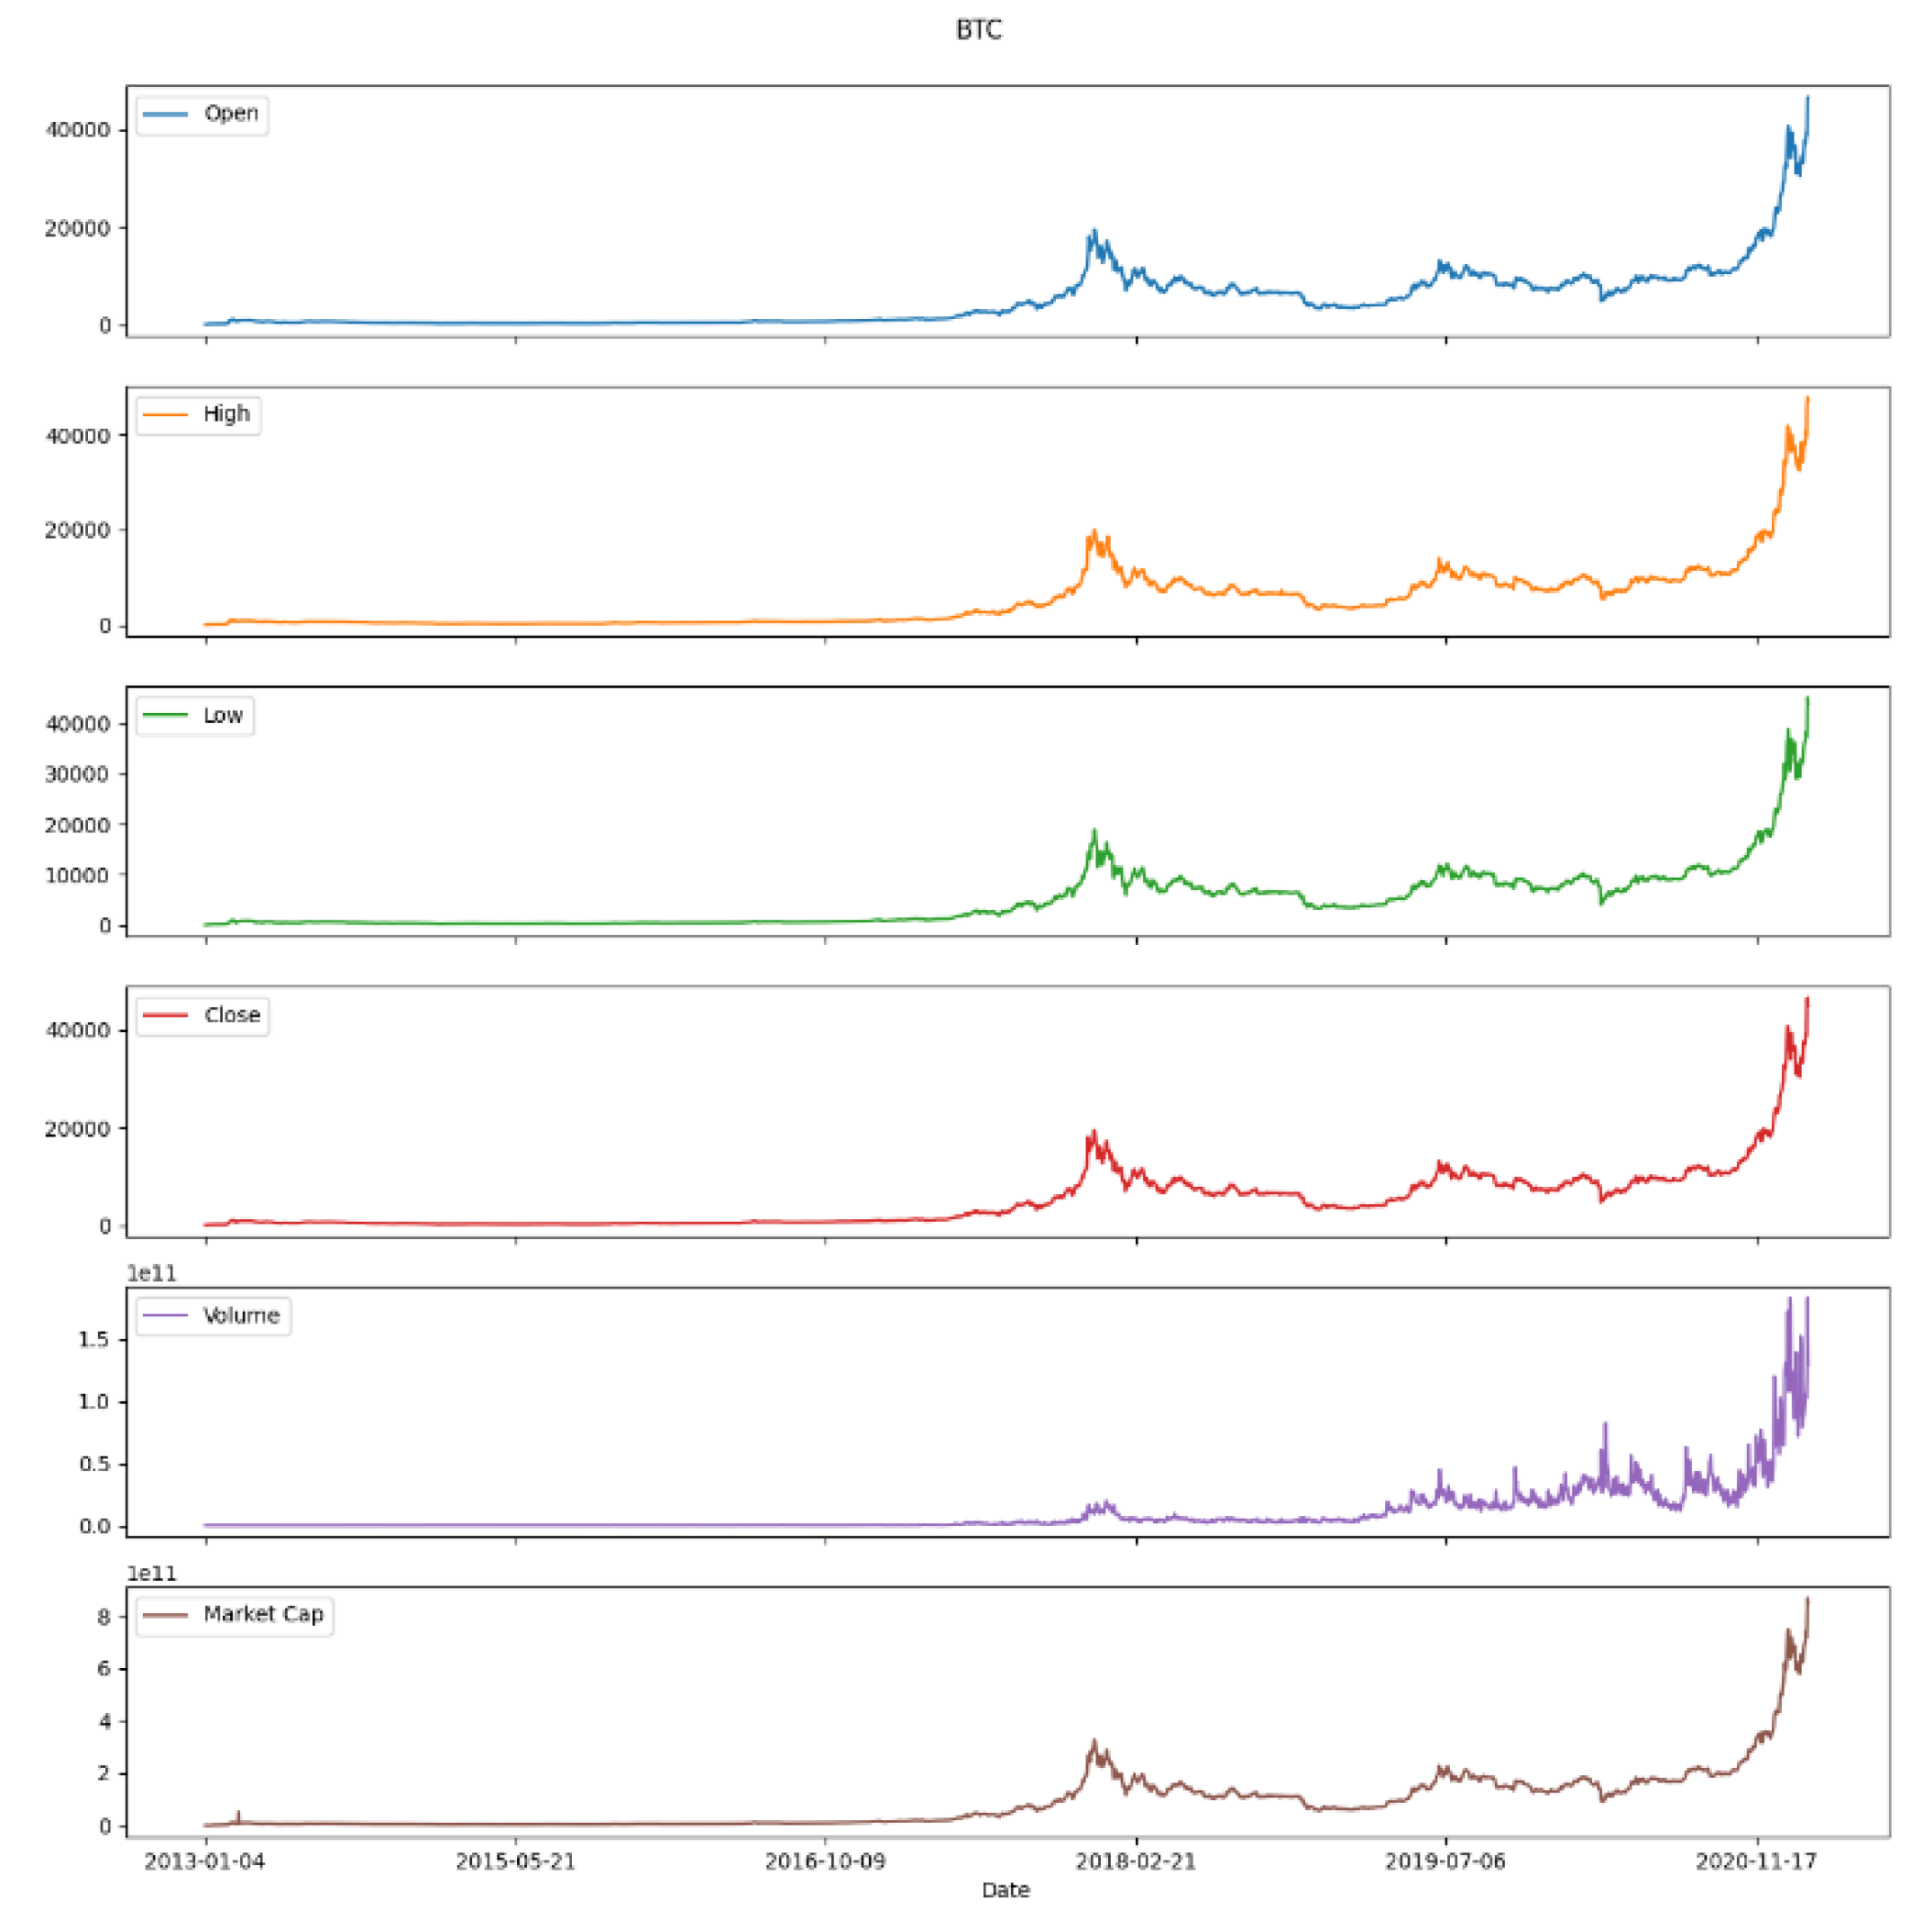
In this article, in the first step, only the price data of the "close" column is used as input to the model. In
Figure 7, we show the data related to the features of this Dataset. The Dataset utilized in our study comprises a total of 2585 samples, encompassing a diverse range of information encapsulated within 6 distinct features. With the substantial size of our Dataset, we strategically opted to leverage most of the available data to train our predictive model. To achieve this, a prudent allocation was made, allocating 90% of the Dataset for the training phase, while the remaining 10% was earmarked for rigorously testing the model's performance.
This balanced approach ensures that our model is exposed to a robust training set while still being rigorously evaluated on an independent test set, contributing to the reliability and generalizability of our findings.
Next, this Figure 6 shows a flowchart that describes the method of predicting the price of Bitcoin using machine learning models and sentiment analysis of tweets. Here is an explanation of the methodology shown in the flowchart:
1. Tweet Cleaning and Creating the Sentiment Dataset: The process begins with collecting tweets, presumably related to Bitcoin, and then cleaning this data to create a dataset that reflects the sentiment (positive, negative, or neutral) expressed in these tweets. This step likely involves removing irrelevant data, such as non-textual content, normalizing text, and possibly using natural language processing (NLP) methods to determine the sentiment of each tweet.
2. Bitcoin Price Dataset Preprocessing: Simultaneously, historical Bitcoin price data is preprocessed. Preprocessing could include normalizing prices, filling missing values, and transforming the data into a format suitable for time series analysis.
3. Merging of Datasets: The sentiment dataset derived from tweets is merged with the Bitcoin price dataset. This merged Dataset would then serve as input for machine learning models, with the sentiment data providing additional context that might influence price movements.
4. Comparing the Models: Various machine learning models are used to predict Bitcoin prices based on the merged Dataset. The models compared in the flowchart are combinations of Convolutional Neural Networks (CNN), Long Short-Term Memory networks (LSTM), Gated Recurrent Units (GRU), Bidirectional LSTM (BiLSTM), and Bidirectional GRU (BiGRU). Each of these models has unique characteristics that make them suitable for different aspects of sequence data prediction:
- CNN: Good for capturing local patterns within data.
- LSTM: Designed to remember long-term dependencies.
- GRU: Similar to LSTM but more efficient computationally.
- BiLSTM: Capable of learning from both past (backward) and future (forward) states.
- BiGRU: Combines the bidirectional approach with the efficiency of GRUs.
5. BiGRU is the Best: The final part of the flowchart states that after comparing the performance of the models, BiGRU was found to be the best. This suggests that the bidirectional GRU model provided the most accurate predictions for Bitcoin prices when trained on the merged sentiment and price data dataset.
In the article's methodology section, you would expect a detailed description of each step, including how the tweets were cleaned and the sentiment was assessed, how the datasets were merged, the specific architecture of each neural network model, and the metrics used to determine the "best" model, which in this case is noted as the BiGRU.
Figure 6. An overview of the process undertaken to determine the best model and parameters to use
Next, sentiment data for that date is added to the price data. By adding this data, the model is able to make the decision better about future price changes. Our method provides the best combination of financial and sentimental data, which can significantly improve the prediction of financial market prices.
Figure 7 presents a detailed visualization of the key features within our Dataset for Bitcoin price prediction. The Dataset consists of 2,585 samples and encompasses six distinct features, each contributing uniquely to the prediction model. Here is an overview of the features:
1. Timestamp: The date and time associated with each data entry, ensuring the temporal aspect is captured.
2. Open Price: The price of Bitcoin at the beginning of the time interval.
3. High Price: The highest price reached during the time interval.
4. Low Price: The lowest price recorded during the time interval.
5. Close Price: The price of Bitcoin at the end of the time interval.
6. Volume: The amount of Bitcoin traded during the time interval.
The figure highlights the Dataset's division into training and testing sets, with 90% of the data allocated for training and 10% reserved for testing. This split ensures that the model is trained on a substantial portion of the data while still being rigorously evaluated on an independent test set. This division is crucial for validating the model's predictive accuracy and generalizability to new, unseen data. The comprehensive feature set and the balanced data split contribute to the robustness and reliability of the predictive models developed in this study.
In this article, we take an important look at sentiment analysis. In the science of sentiment analysis, they usually use the scores obtained from the analysis of different texts. But in the proposed method, we are looking for new approaches. Instead of relying solely on scores, we score tweets based on a variety of criteria, including the highest number of likes and the highest volume of tweets. This new method allows us to have a more detailed and comprehensive look at the analysis of users' sentiments from the stock market.
Also, in this paper, we discuss the importance of weighting tweet scores and show how this weighting can improve sentiment analysis and provide more accurate results. On the other hand, it is very important to pay attention to public opinions and experts' views about the impact of sentiment analysis on financial markets.
Finally, this article tries to clarify the important role that sentiment analysis and social networks like Twitter can play in predicting the direction of markets and financial decisions.
At the beginning of the design process, it is necessary to have the ability to obtain the data we need. It is better to use reliable sources to extract this data. We have obtained sentiment data from Kaggle and Bitcoin price data from Yahoo.com. The time period of this data is from January 4, 2013, to February 10, 2021. The total number of these data is equal to 2586 days. In between, we don't have some days. This is because there are no tweets recorded in the Dataset on some days. From this number of samples, we will use 90% for model training and the remaining 10% for model testing.
Sentiment data is the data that users post on their Twitter. In this article, we have used a dataset that includes various features for sentiments, including the volume of tweets, the highest number of likes received by a tweet, or the score obtained from Vader's output because this Dataset uses VADER for getting the score of each tweet.
In this paper, unlike many previous works in this field, we have used several types of sentiment tools. For this, instead of using the compound score column that contains Vader's output scores, we have used the average sentiment scores as a tool. The reason for this is that the basis of our work in this article is in terms of daily time frame and some days we had more than one tweet. For this reason, we decided to use the average sentiment scores of tweets in the first part of the sentiment analysis.
As we continued our work, we found that some days we only have one tweet, while on other days there are many tweets. For this reason, to be more accurate in sentiment analysis, we used the volume of tweets as a second tool. In this way, we checked the number of tweets sent in one day. This factor can be effective in predicting the price of Bitcoin in the future, so we should also include it in our model. However, after investigations, it was found that this agent could not fulfill the properties that we expect in our model when inputting sentiment data very well. For this reason, we turned to the third tool of sentiment analysis.
Looking closely at the Dataset, we noticed that some tweets got more attention than others and therefore received more likes. To check the impact of this factor, i.e. the highest number of likes, we have used this column in the sentiment dataset. The method of using this column was that we chose the score of the tweet that received the most like counts among the tweets.
After checking the outputs of the models, we came to the conclusion that this tool has improved the situation to some extent, but still the need for another tool was felt. We referred to Dataset and this time we used a different tool from the previous tools. This tool is similar to one of the indicators of technical analysis in the global forex market, but it has differences. This tool, which is also our own innovative sentiment analysis tool, works using a weighted moving average. But what is the weight we have assigned to the averages? Or why did we go to the average tool?
To answer these questions, we take a look at the results of using these tools in different models. Examining the results, we found that the averaging tool performed better for this Dataset in various models but failed to meet our expectations. For this reason, we have used this tool, the simple average, and assigned a coefficient to it to see if better results are obtained or not.
We assigned the highest number of likes as a multiplier to the average to construct a weighted moving average. This tool, which we arrived at by carefully observing the datasets, is a completely new tool that has not been discussed in previous articles. By observing the results obtained from the models, we came to the conclusion that our innovative tool, i.e. the weighted average, performed better than the other tools in all models. It is very important to note that some sentiment analysis tools may perform well in some models and have much weaker results in others, but our weighted average tool performed best in all models.
After describing the sentiment tools, we now describe our selected deep-learning models. We have used five different models to analyze the price data of the "close" column alone and together with the sentiment data. In all five models, we have laid the foundation of the work on the LSTM model. This model is very suitable for analyzing and predicting the price of financial markets due to the ability to process sequential data and the ability to recognize time patterns [
18].
In the first model, which consists only of LSTM, a set of hyperparameters is also used to make the model perform better. These hyper-parameters are shown in
Table 3. But how are these hyperparameters defined?
Grid search is a hyperparameter optimization technique that systematically searches through a predefined hyperparameter space to identify the optimal combination. Our study implemented a grid search to explore a range of hyperparameter values for our cryptocurrency price prediction model. The method involves specifying a grid of hyperparameter values and training the model for each combination. The performance metrics are then evaluated for each set of hyperparameters, and the configuration yielding the best results is selected.
Our experimentation with the grid search method revealed notable improvements in prediction accuracy compared to alternative hyperparameter tuning techniques. By systematically exploring the hyperparameter space, we identified a combination that consistently outperformed others regarding predictive performance, robustness, and generalization to unseen data.
To validate the effectiveness of our chosen hyperparameter configuration, we compared the grid search results with alternative methods such as random search and manual tuning. The grid search consistently demonstrated superior performance, indicating its efficacy in fine-tuning our cryptocurrency price prediction model.
The two architectures from our models can be seen in
Figure 10 and
Figure 11. Also, in models 2 and 3, the LSTM model with the same settings as this model has been used. This method has allowed the BiLSTM model to be used, significantly improving the prediction of financial market prices. In model 5, we have used the BiGRU model, which has shown that this method can significantly improve the prediction of financial market prices. Finally, we choose this method as the best one in this paper. The following box (
Figure 7) allows us to check their impact on the performance of the overall model just by adding other models.
You can see the number of parameters used in our model in Figures 8 and 9. The main point is that Figure 8 relates to the cases where we have not used the sentiment; in Figure 9, we have used the sentiment market and price.
In models 2 and 3, which use a combination of LSTM, GRU, and CNN, we have also used the same settings as the first model. In models 4 and 5, which have the best results, BiLSTM and BiGRU models are used, which are derivatives of LSTM and GRU models. In model 4, the BiLSTM model was used, which significantly improved the prediction of financial market prices. In model 5, we have used the BiGRU model, which shows that this method can significantly improve the prediction of financial market prices. Finally, we choose this method as the best one in this paper. The following box (
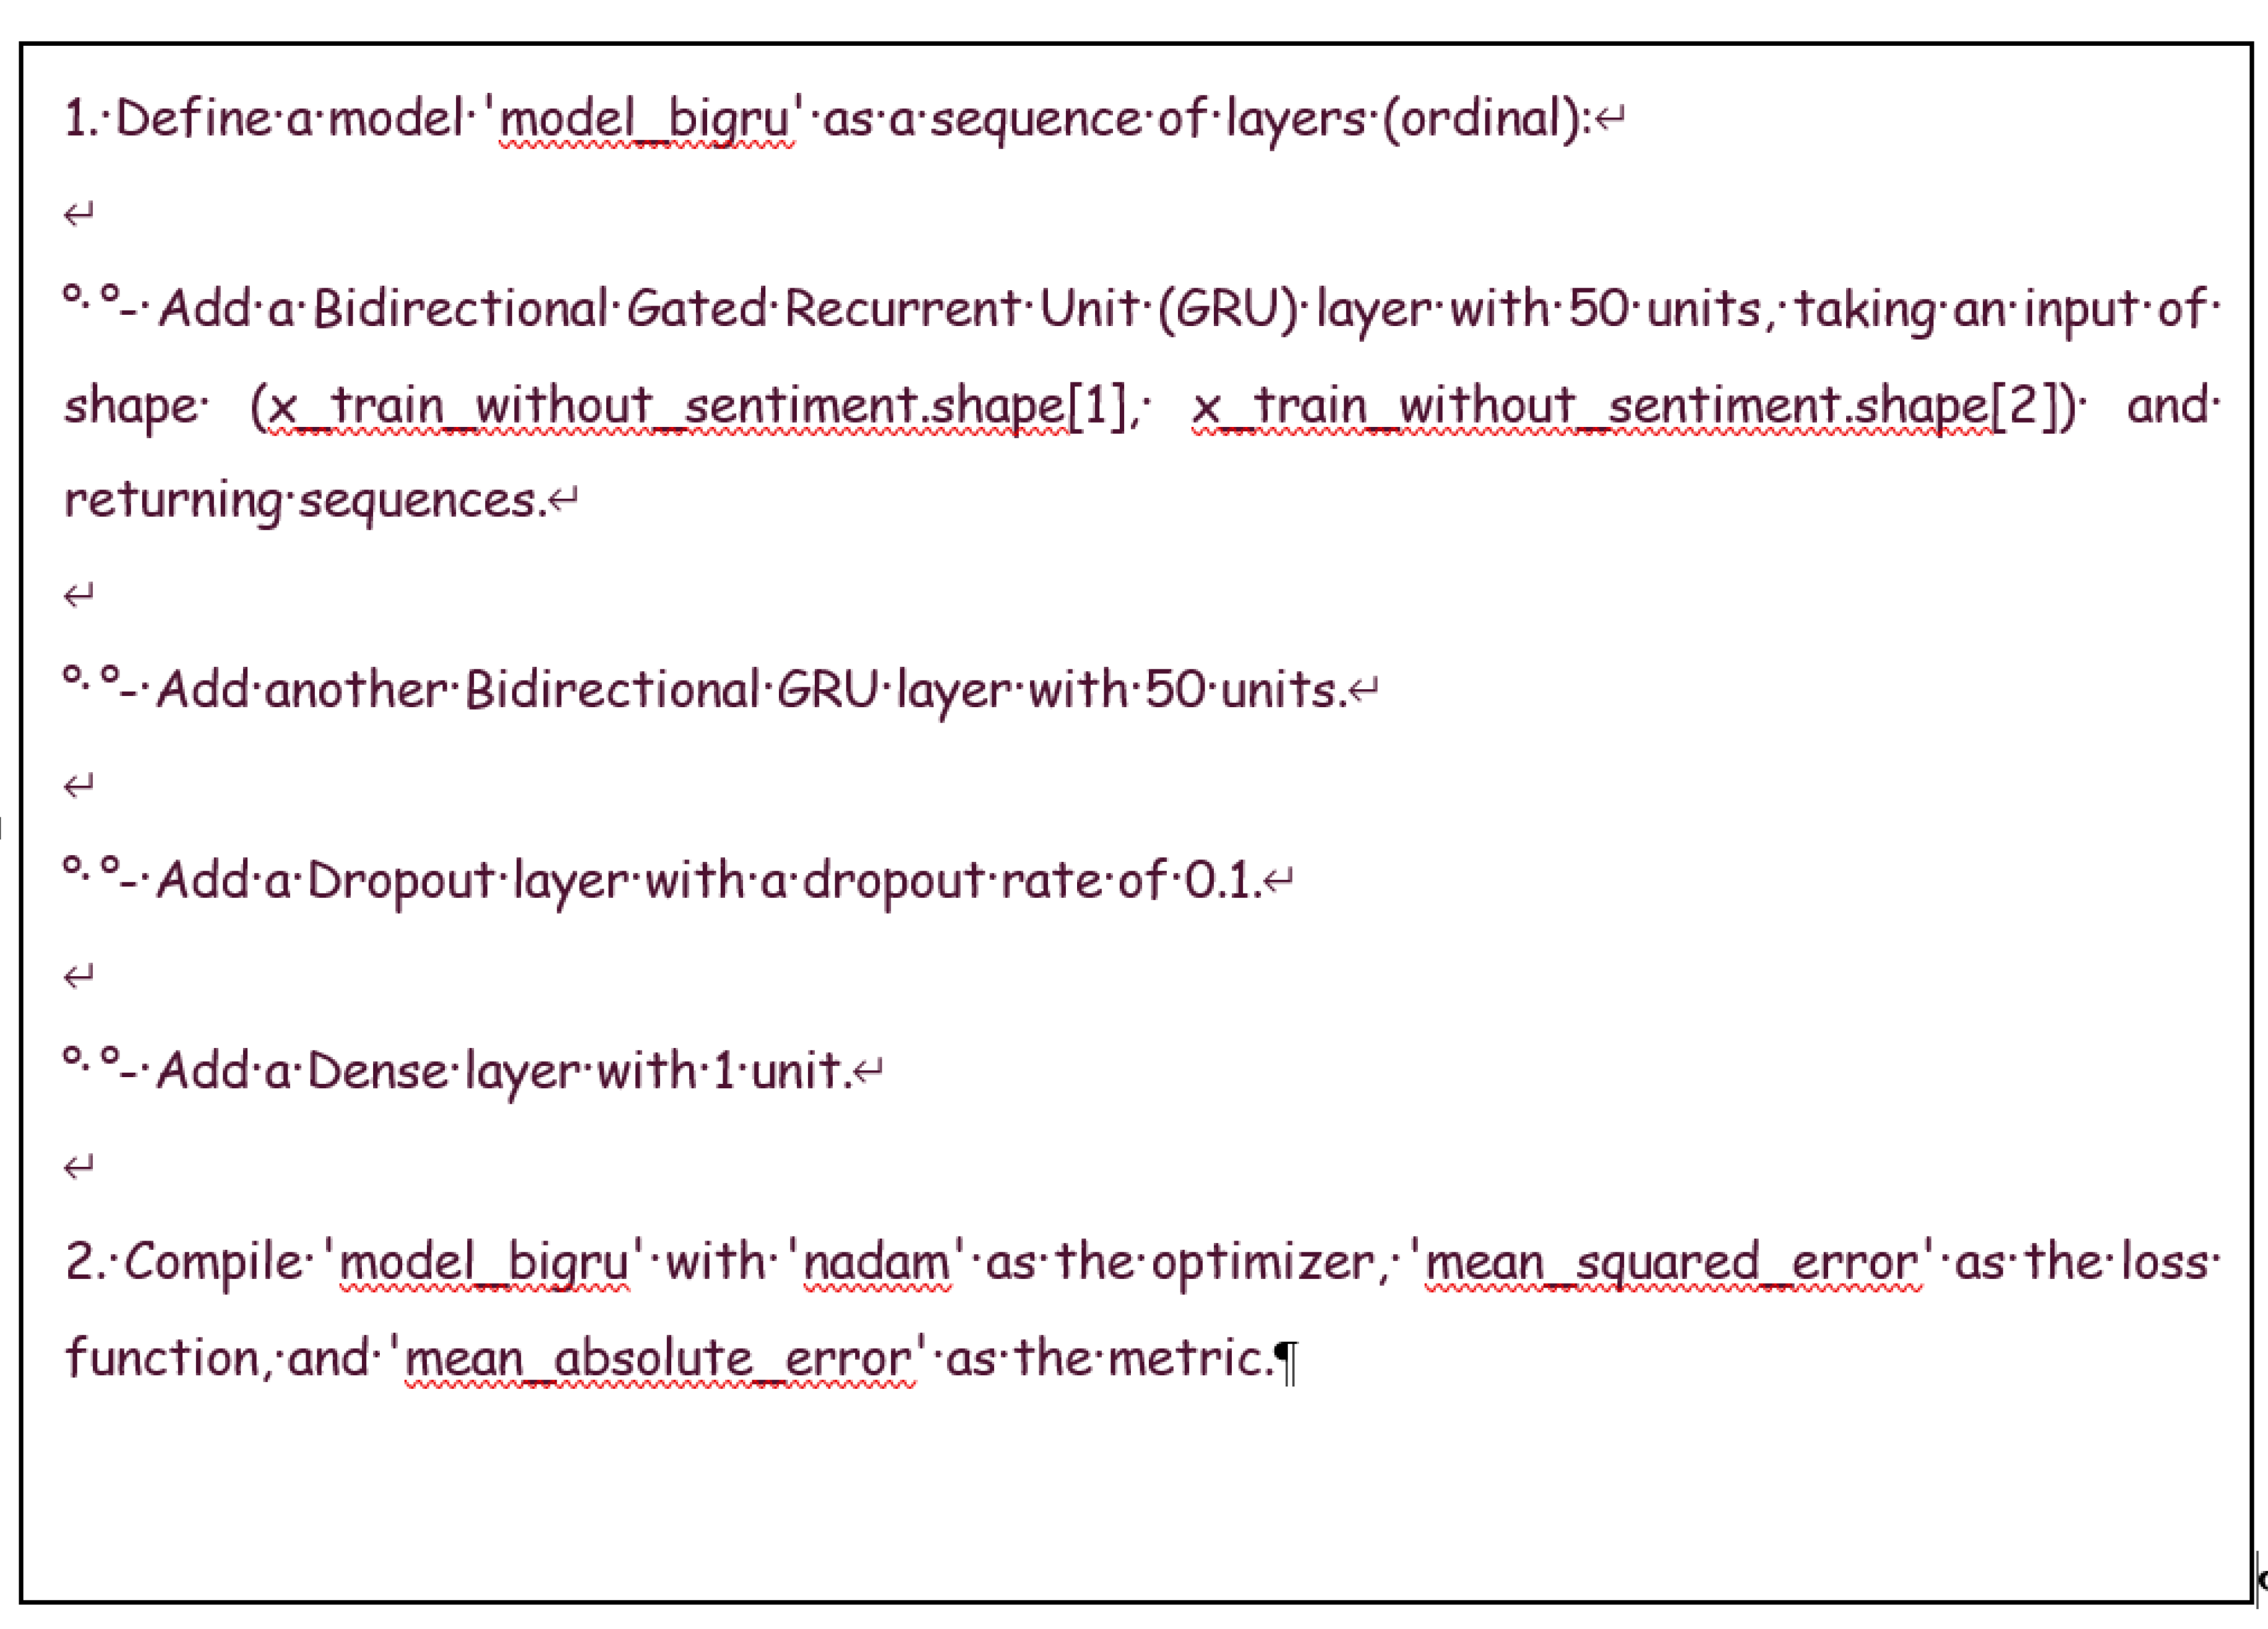
Figure 12) shows a pseudo-code for this model (BG). Also, Hyper-parameters of our models are shown in
Table 4.
This figure provides the pseudo-code for the Bidirectional GRU (BiGRU) model. The code outlines the sequence of layers in the model, including Bidirectional GRU layers, a Dropout layer, and a Dense layer. The model is compiled using the 'nadam' optimizer and 'mean_squared_error' loss function. This pseudo-code is a practical guide for implementing the BiGRU model, which has shown superior performance in the study.
4. Evaluation
Evaluating cryptocurrency price prediction models is crucial for assessing their efficacy and reliability in real-world applications. In this section, we rigorously assess the performance of the proposed models against various benchmarks and metrics. By conducting thorough evaluations, we aim to provide insights into the predictive capabilities of the models and their practical utility for investors, traders, and financial analysts operating in the dynamic cryptocurrency markets. Through comprehensive analyses and comparisons, we elucidate the strengths and limitations of each model, shedding light on their potential for accurate price forecasting and decision-making support. Additionally, we explore the impact of different architectural choices, training strategies, and data preprocessing techniques on model performance, offering valuable guidance for future research and practical implementation. The evaluation outcomes presented herein validate the proposed approaches' efficacy and contribute to advancing state-of-the-art cryptocurrency price prediction methodologies.
As we can see in
Table 4, the number of neurons or units, hidden layers, epochs, and batch sizes were obtained after trial and error, but for the number of epochs, we used function callbacks. EarlyStopping, which stopped the execution after 20 times whenever the Loss value did not improve.
To determine which activator functions to use for the models, we paid attention to the functions' nature to be more compatible with the data in the Dataset. However, like ReLU, SELU does not have a vanishing gradient problem and is used in deep neural networks. Compared to ReLUs, SELUs cannot die. SELUs learn faster and better than other activation functions.
For Optimizer, we can say that no single optimizer beats all the others. If you look at the published papers, you will see different optimizes used. However, Nesterov-accelerated adaptive moment (nadam) estimation is an extension of the Adam algorithm that integrates Nesterov momentum and can give better performance.
And finally, Dropout is a staggeringly in-vogue method to overcome overfitting in neural networks. In this article, after trial and error, we obtained a value of 0.1 for Dropout, which gave us the best results. The final results of the models are shown in
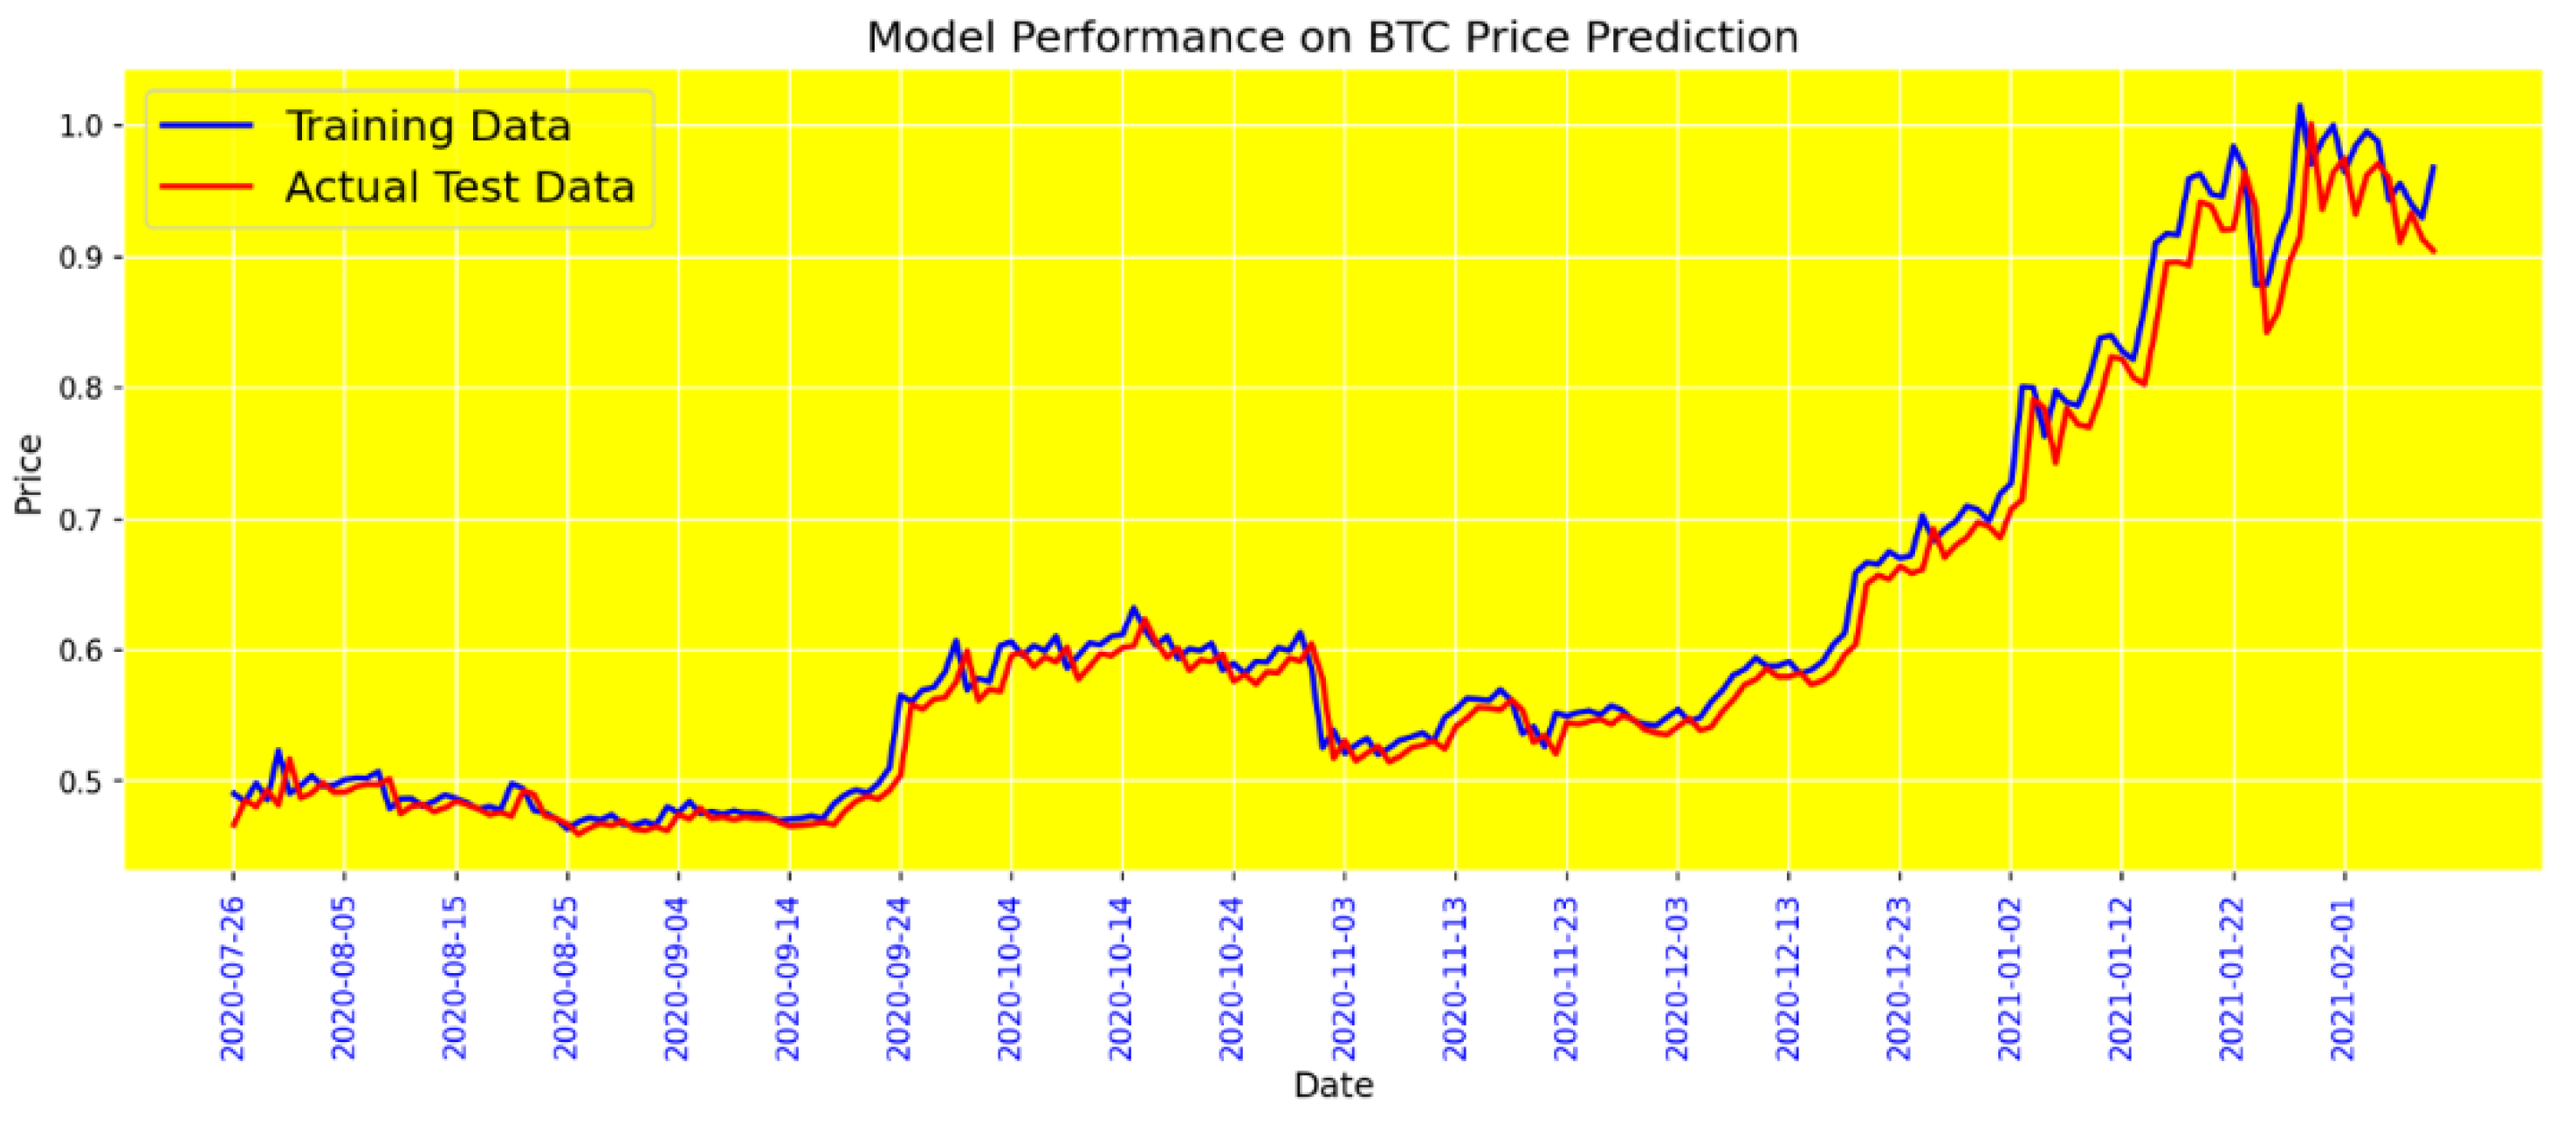
Table 5. and the results of the BG model in
Figure 13,
Figure 14,
Figure 15 and
Figure 16
Figure 13 illustrates the performance of the BiGRU (Bidirectional Gated Recurrent Unit) model without incorporating sentiment data. The evaluation metrics displayed include Mean Absolute Error (MAE) and Loss. The results highlight the predictive accuracy and reliability of the BiGRU model in forecasting Bitcoin prices based solely on historical price data. The model demonstrates strong performance, achieving a low MAE and Loss, underscoring its robustness in capturing the inherent patterns within the price data without the influence of sentiment. This analysis sets a baseline for understanding how much predictive power is derived from price trends.
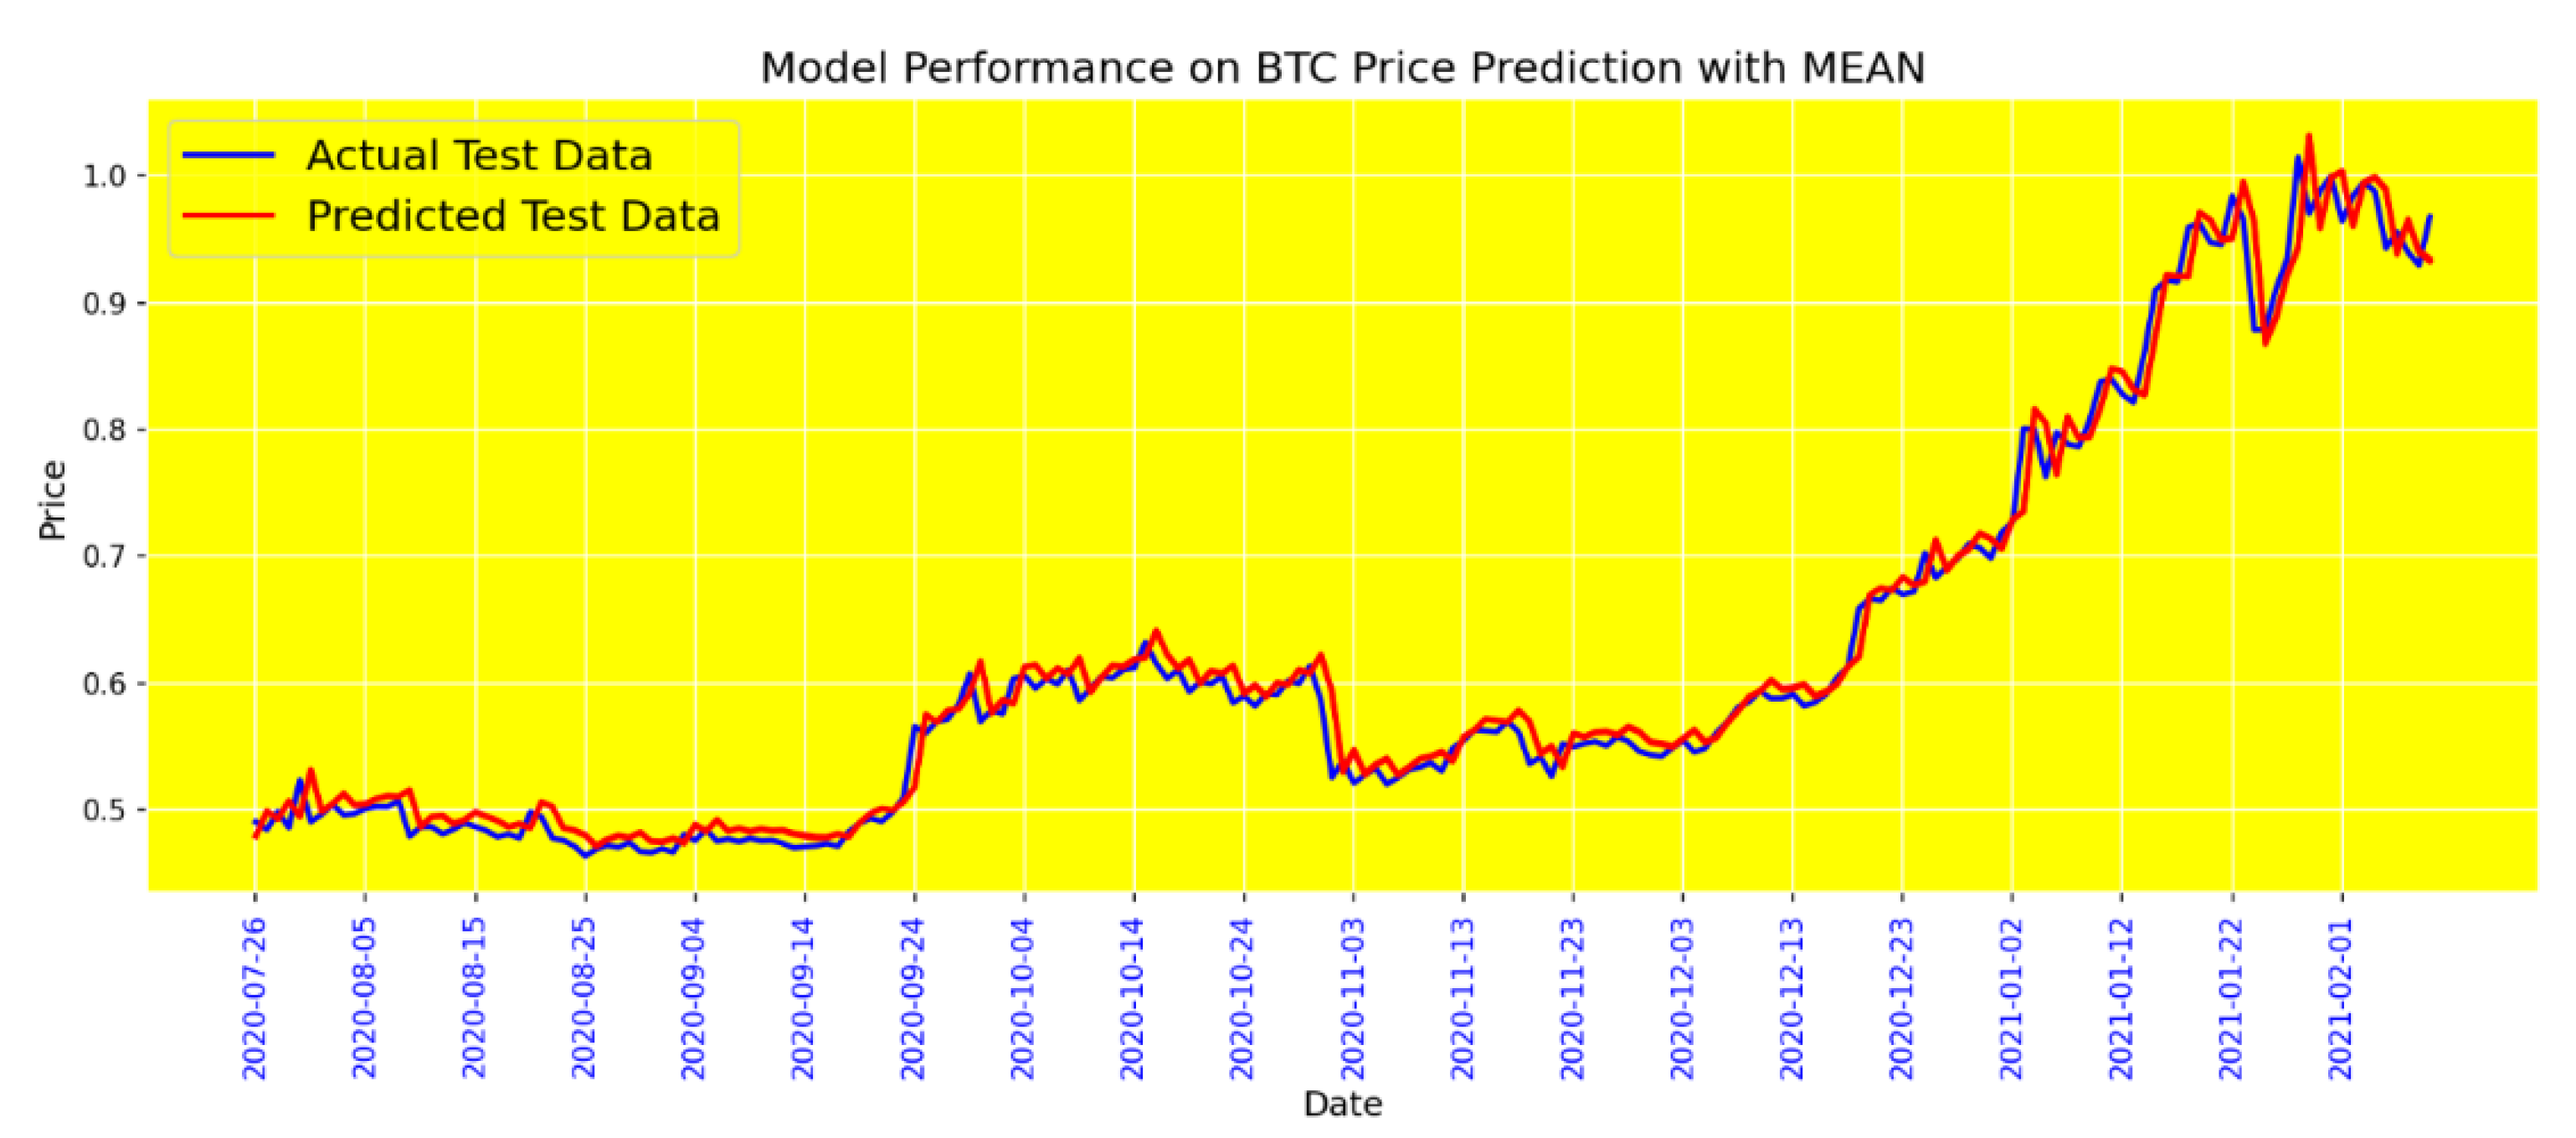
Figure 14 presents the performance of the BiGRU model when sentiment data is included using the Mean sentiment tool. This tool averages the sentiment scores from social media interactions to provide a single sentiment score for each period. Including the Mean sentiment data slightly enhances the model's performance, as indicated by the lower MAE and Loss values compared to the model without sentiment data. This improvement suggests that the collective average sentiment provides valuable information that can refine the model's predictions.
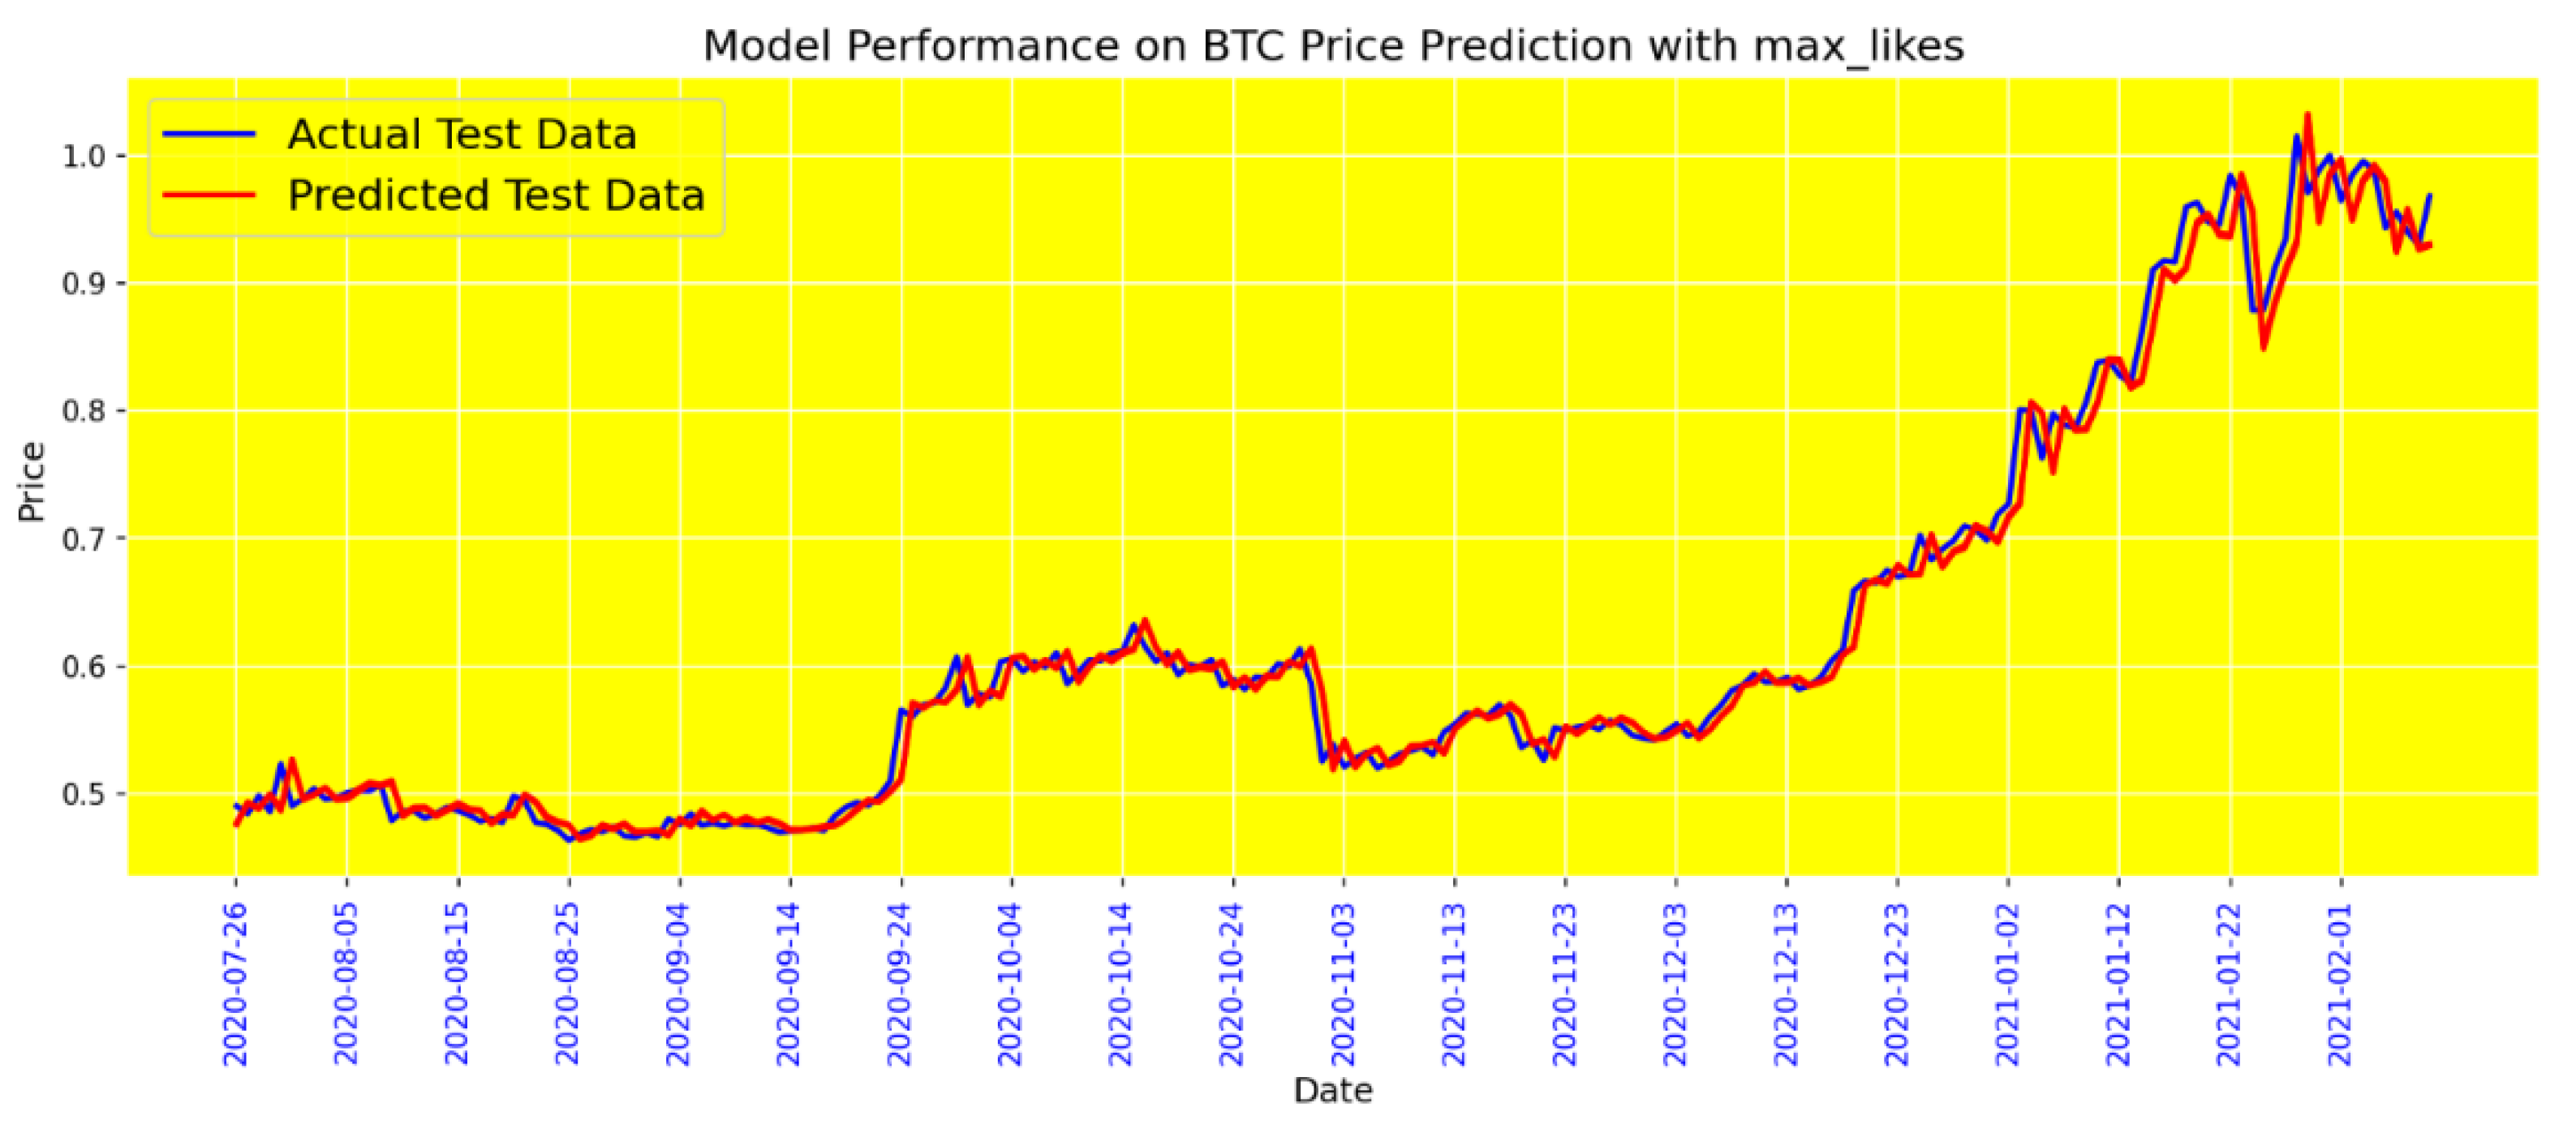
Figure 15 shows the performance of the BiGRU model incorporating sentiment data processed with the Max Likes tool. This sentiment tool prioritizes the sentiment of tweets with the highest number of likes, assuming these are more influential and reflective of public opinion. The model's performance metrics, including MAE and Loss, indicate an improvement over the baseline and Mean tool methods. This suggests that the most liked tweets capture significant market sentiment, making them a powerful indicator for enhancing the prediction accuracy of the BiGRU model.
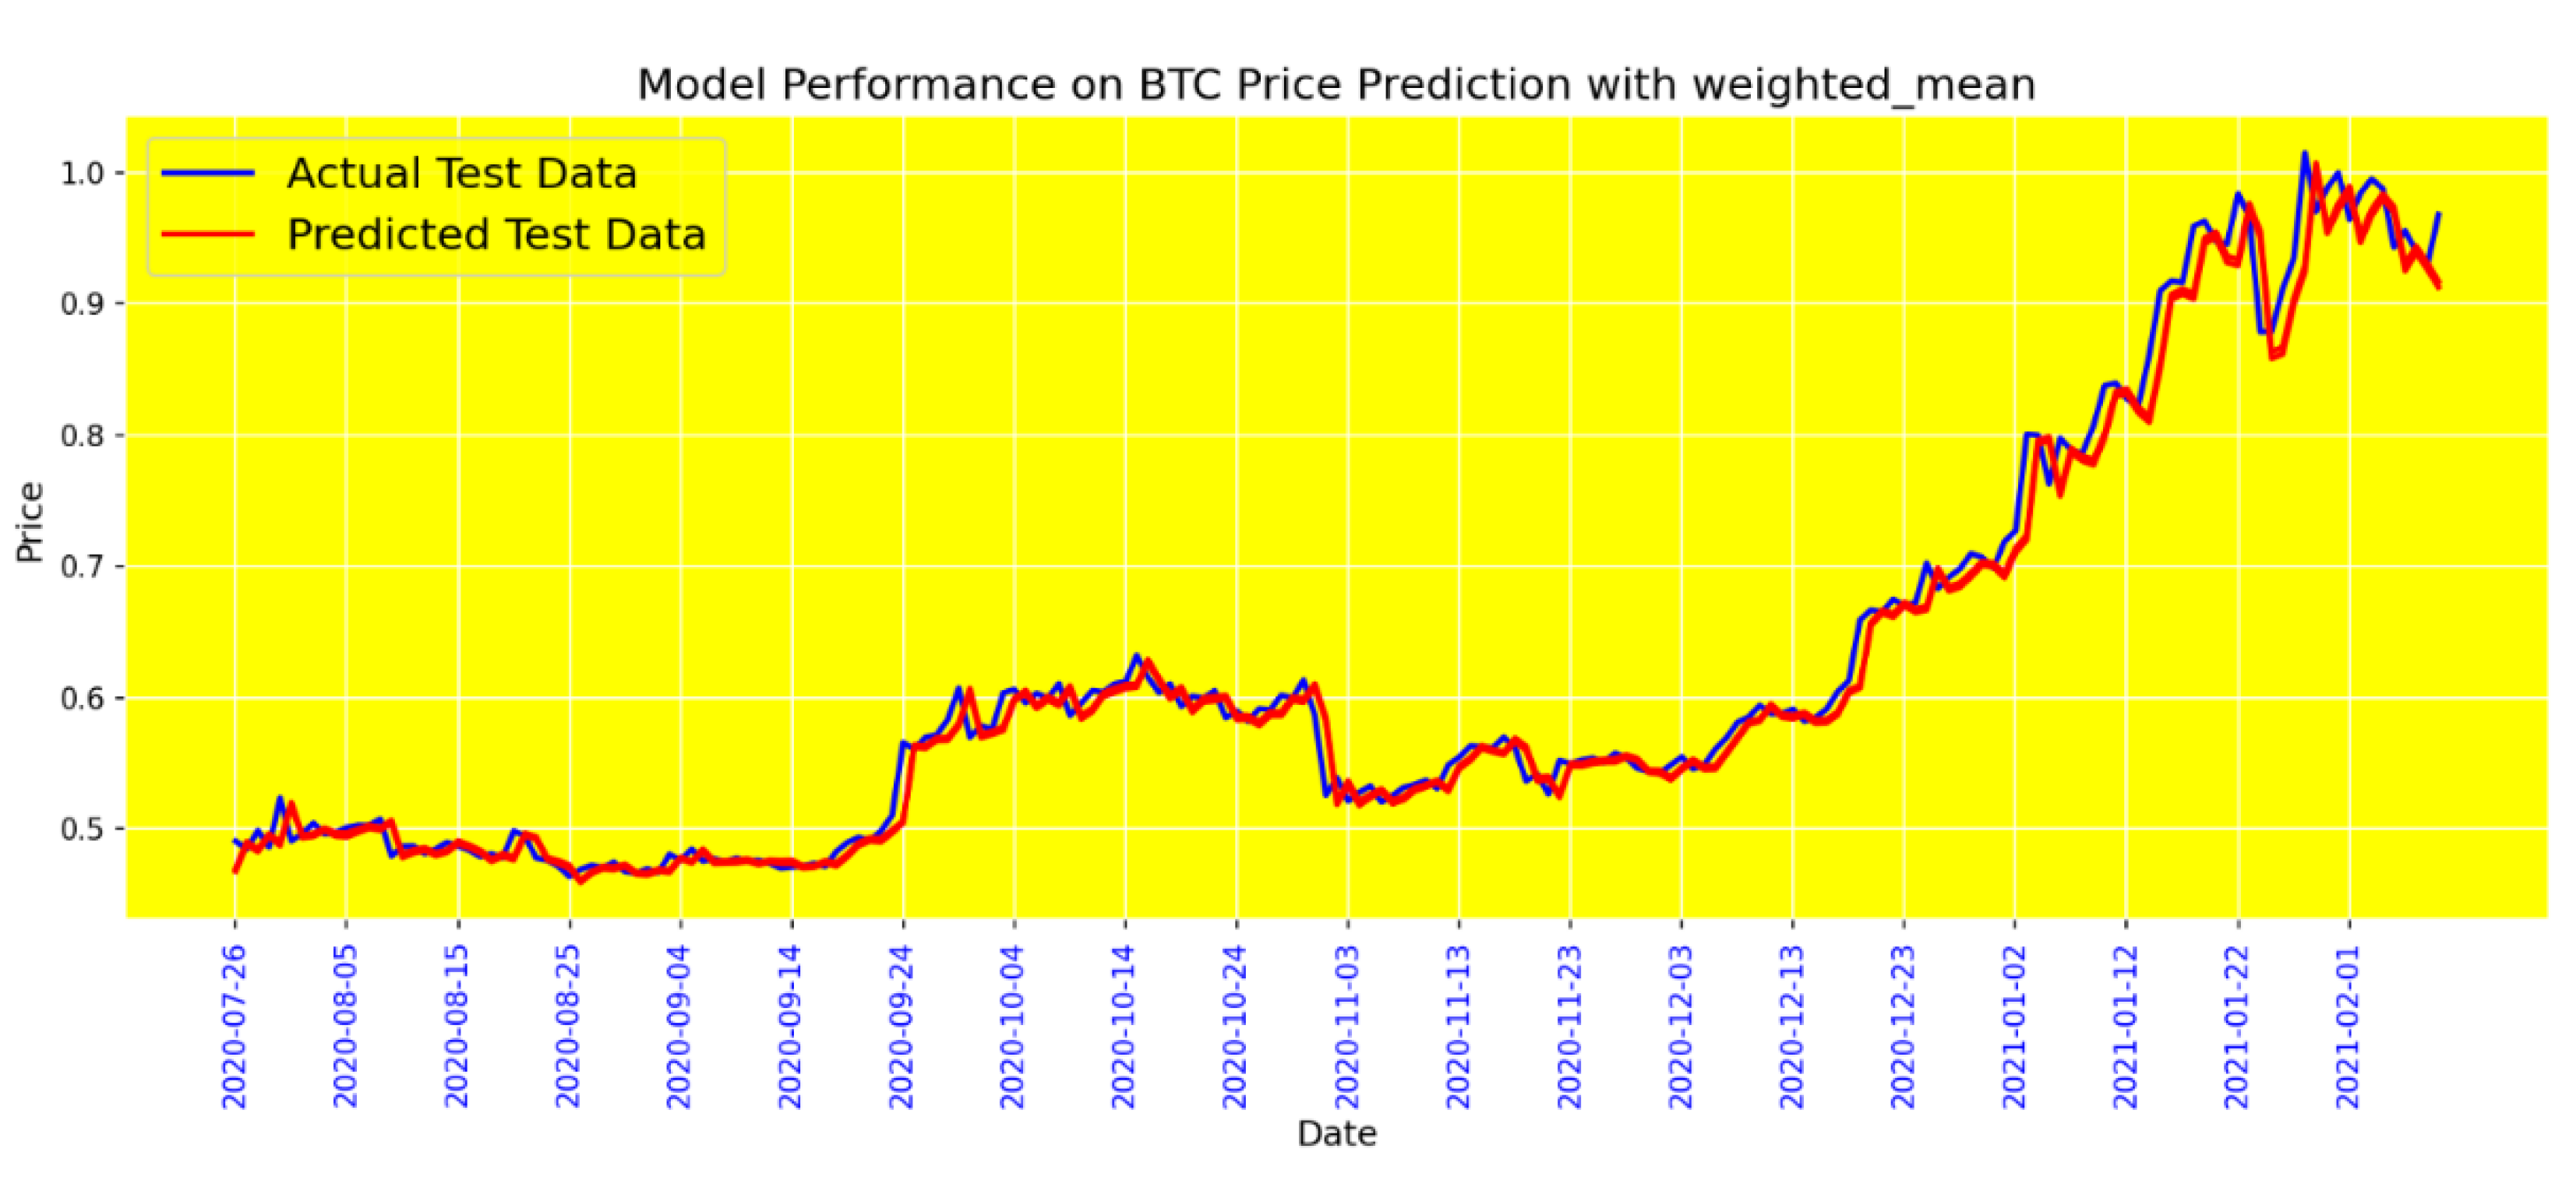
Figure 16 displays the performance of the BiGRU model using the Weighted Mean sentiment tool, which assigns different weights to tweets based on criteria such as likes, retweets, and volume. This approach aims to provide a more nuanced and representative sentiment score. The results, as shown by the MAE and Loss values, reflect the best performance among the sentiment tools tested. The Weighted Mean tool significantly reduces prediction errors, highlighting its effectiveness in capturing the most relevant sentiment signals for accurate Bitcoin price forecasting. This demonstrates the value of a sophisticated sentiment analysis approach in enhancing model performance.
The relevance of social network data to our research objectives is underscored by its ability to capture the collective sentiment of market participants, incorporating qualitative insights beyond traditional quantitative indicators. By leveraging social network data, our model aims to discern trends, sentiments, and potential market shifts that may not be fully captured by historical price and trading volume data alone.
Furthermore, our choice to employ a weighted average in aggregating social network data is motivated by the inherent variability in the impact of different sources and types of information. We assign weights to individual data sources based on their historical relevance, credibility, and impact on market sentiment. This approach recognizes that not all social media sources contribute equally to market dynamics, and assigning appropriate weights allows for a more nuanced and accurate representation of the overall sentiment.
The superiority of the weighted average over a direct average becomes evident in scenarios where certain influential sources or specific types of information have a more pronounced impact on market sentiment. By incorporating weights, our model adapts to the dynamic nature of social network data, giving greater importance to sources that have historically demonstrated a stronger correlation with subsequent price movements. This adaptability enhances the robustness and responsiveness of our prediction model to the ever-changing landscape of cryptocurrency markets.
In contrast to a direct average, which treats all sources equally, the weighted average provides a more refined and context-aware approach to incorporating social network data into our predictive framework. This nuanced aggregation method contributes to the model's ability to filter out noise, identify genuine market signals, and improve the overall accuracy of cryptocurrency price predictions.
In conclusion, including social network data in our cryptocurrency price prediction model and adopting a weighted average aggregation method enhances the model's capacity to capture and respond to the complex interplay of sentiment and information within the cryptocurrency market. This strategic integration contributes to the advancement of predictive accuracy, offering a more comprehensive understanding of the factors influencing cryptocurrency prices and supporting informed decision-making for market participants.
Bidirectional Gated Recurrent Units (BiGRU) offer notable advantages in the context of cryptocurrency price prediction models. BiGRU excels in capturing bidirectional context, allowing simultaneous processing of past and future information, which is particularly beneficial for understanding dynamic market trends. Furthermore, BiGRU Gated Recurrent Unit architecture enhances memory, facilitates effective feature learning, and reduces information loss, improving predictive accuracy. Notably, BiGRU stands out for its lightness and speed, making it a computationally efficient choice for time-sensitive tasks. The model bidirectional architecture, In this article, we presented a tool to analyze the sentiment of Twitter users regarding the price of Bitcoin. Our research involved the implementation and evaluation of various models, leading to several key findings:
1. Effectiveness of the Weighted Average Tool: The weighted average tool demonstrated the highest accuracy among the sentiment analysis tools we tested. Unlike previous works that relied on simple averages or tweet volumes, our innovative approach using the maximum likes as weights provided superior results. This method leveraged the varying impact of tweets, assigning more weight to those with higher engagement, thus offering a more nuanced sentiment analysis.
2. Comparison of Models: We employed several deep learning models, including LSTM, LSTM+GRU, LSTM+GRU+CNN, BiLSTM, and BiGRU. Our evaluations showed that the BiGRU model, in particular, excelled in predictive accuracy due to its bidirectional architecture and efficient learning capabilities. This model could process and learn from sequential data more effectively, making it an excellent choice for time-sensitive tasks in cryptocurrency price prediction.
3. Integration of Sentiment Data with Financial Data: Our methodology combined sentiment data with financial data to enhance prediction accuracy. By incorporating sentiment scores derived from Twitter data into our models, we provided a holistic view that accounted for both market sentiment and traditional financial indicators. This hybrid approach significantly improved the models' ability to forecast future price movements.
4. Implications for Future Research: Our findings highlight the importance of considering social network data in financial forecasting. The success of our weighted average tool suggests that future research could benefit from exploring similar innovative approaches to sentiment analysis. Additionally, the effectiveness of the BiGRU model in our study underscores the potential of advanced neural network architectures in improving predictive accuracy.
Our study contributes valuable insights into sentiment analysis and cryptocurrency price prediction. By demonstrating the superiority of the weighted average tool and the BiGRU model, we provide a robust framework for future research and practical applications in financial forecasting.
5. Discussion and Conclusions
In this article, we propose a novel approach to predicting Bitcoin prices using social media sentiment analysis. We combine sentiment scores based on various criteria, such as the highest like counts, the highest volume of tweets, and weighted scores of tweets. The study consists of five stages, each focusing on different aspects of sentiment analysis and model evaluation.
The first stage involves evaluating deep learning models without considering sentiment. The BG model performs well in evaluation metrics such as MAE and Loss. In the second stage, we examine the impact of tweet volume on the models' performance. In the third stage, we utilize the VADER scores. The fourth stage considers the maximum likes for tweets as a sentiment analysis tool. Finally, in the last stage, we employ weighted averaging for sentiment analysis, which provides approximately 11% improvement based on the MAE metric and about 15% improvement based on the Loss metric for better detection the following day.
The key contributions of this paper include:
The introduction of a new method for combining sentiment scores based on various criteria.
The evaluation of different deep learning models for Bitcoin price prediction.
The examination of the impact of tweet volume and maximum likes on model performance.
The implementation of weighted averaging for sentiment analysis, resulting in improved prediction accuracy.
While the study presents an innovative approach to Bitcoin price prediction, there are some limitations to consider. First, the study focuses solely on Bitcoin and does not explore other cryptocurrencies. Second, we use a specific dataset, which may not be representative of the entire Twitter population. Lastly, the study could benefit from further exploration of other sentiment analysis tools and techniques to strengthen the proposed method.
In conclusion, this article offers a valuable contribution to the field of cryptocurrency price prediction using social media sentiment analysis. The proposed method, combining sentiment scores based on various criteria and employing weighted averaging, shows promising results. Future research should aim to expand this approach to other cryptocurrencies and explore additional sentiment analysis tools and techniques to enhance prediction accuracy.
6. Future Work Section
The current study has demonstrated the potential of sentiment analysis, coupled with advanced machine learning and deep learning techniques, to predict the price of Bitcoin with a reasonable degree of accuracy. However, as with any research, there is room for further exploration and improvement. Future work in this area could include the following:
1. Expanding Data Sources: Incorporating additional social media platforms, forums, and news outlets could provide a more comprehensive understanding of the sentiment landscape and its impact on cryptocurrency prices.
2. Real-time Sentiment Analysis: Developing real-time sentiment analysis tools could enable more immediate predictions and potentially be integrated into high-frequency trading systems.
3. Multimodal Data Analysis: Combining textual sentiment analysis with other data types, such as images and videos, could reveal new insights into market sentiment and improve prediction models.
4. Cross-Asset Sentiment Analysis: Extending the analysis to include the sentiment of other financial assets, such as stocks, commodities, and foreign exchange, could help identify broader market trends and interdependencies.
5. Advanced Machine Learning Techniques: Exploring more sophisticated machine learning algorithms, such as ensemble methods or deep learning architectures like transformers, could enhance the predictive power of the models.
6. Sentiment-Driven Trading Strategies: Developing and backtesting algorithmic trading strategies based on sentiment analysis could provide empirical evidence of the practical utility of these predictions in live trading environments.
7. Robustness and Generalizability: Testing the robustness of the models across different time periods and market conditions and their generalizability to other cryptocurrencies would be crucial for validating the approach.
8. Explainability and Interpretability: Improving the explainability of the models to understand how sentiment affects price predictions could increase trust in the models and provide actionable insights for investors.
9. Adaptive Models: Creating models that can adapt to the evolving nature of cryptocurrency markets and the changing dynamics of social media could ensure the longevity of the predictive capabilities.
By addressing these areas, future research can build upon the findings of this study to create more robust, accurate, and actionable predictive models for cryptocurrency prices.
References
- Z. Shahbazi and Y.-C. Byun, "Analysis of the security and reliability of cryptocurrency Systems Using Knowledge Discovery and Machine Learning Methods," Sensors, vol. 22, no. 23, p. 9083, 2022. https://doi.org/10.3390/s22239083.
- M. Stallen, N. M. Stallen, N. Borg, and B. Knutson, "Brain activity foreshadows stock price dynamics," Journal of Neuroscience, vol. 41, no. 14, pp. 3266-3274, 2021. https://doi.org/10.1523/JNEUROSCI.1727-20.2021.
- R. H. Ali, G. R. H. Ali, G. Pinto, E. Lawrie, and E. J. Linstead, "A large-scale sentiment analysis of tweets pertaining to the 2020 US presidential election," Journal of big Data, vol. 9, no. 1, p. 79, 2022. https://doi.org/10.1186/s40537-022-00633-z.
- K. Jahanbin, M. A. Z. K. Jahanbin, M. A. Z. Chahooki, M. Yazdian-Dehkordi, and F. Rahmanian, "Database comments on Telegram channels related to cryptocurrencies with sentiments," BMC Research Notes, vol. 17, no. 1, p. 135, 2024. https://doi.org/10.1186/s13104-024-06778-9.
- A. H. Khan et al., "A performance comparison of machine learning models for stock market prediction with novel investment strategy," Plos one, vol. 18, no. 9, p. e0286362, 2023. https://doi.org/10.1371/journal.pone.0286362.
- P. B. Washington, P. P. B. Washington, P. Gali, F. Rustam, and I. Ashraf, "Analyzing influence of COVID-19 on crypto & financial markets and sentiment analysis using deep ensemble model," Plos one, vol. 18, no. 9, p. e0286541, 2023. https://doi.org/10.1371/journal.pone.0286541.
- M. O. Turkoglu, S. M. O. Turkoglu, S. D'Aronco, J. D. Wegner, and K. Schindler, "Gating revisited: Deep multi-layer RNNs that can be trained," IEEE Transactions on Pattern Analysis and Machine Intelligence, vol. 44, no. 8, pp. 4081-4092, 2021.
- F. Valencia, A. F. Valencia, A. Gómez-Espinosa, and B. Valdés-Aguirre, "Price movement prediction of cryptocurrencies using sentiment analysis and machine learning," Entropy, vol. 21, no. 6, p. 589, 2019. https://doi.org/10.3390/e21060589.
- E. Stenqvist and J. Lönnö, "Predicting Bitcoin price fluctuation with Twitter sentiment analysis," ed, 2017.
- A. Gurrib and F. Kamalov, "Predicting bitcoin price movements using sentiment analysis: a machine learning approach," Studies in Economics and Finance, vol. 39, no. 3, pp. 347-364, 2022.
- S. Raju and A. M. arXiv:2006.14473, 2020.
- X. Huang et al., "Lstm based sentiment analysis for cryptocurrency prediction," in Database Systems for Advanced Applications: 26th International Conference, DASFAA 2021, Taipei, Taiwan, April 11–14, 2021, Proceedings, Part III 26, 2021: Springer, pp. 617-621.
- D. Garcia and F. Schweitzer, "Social signals and algorithmic trading of Bitcoin," Royal Society open science, vol. 2, no. 9, p. 150288, 2015. https://doi.org/10.1098/rsos.150288.
- L. Kristoufek, "On Bitcoin markets (in) efficiency and its evolution," Physica A: statistical mechanics and its applications, vol. 503, pp. 257-262, 2018.
- S. Nakamoto, "Bitcoin: A peer-to-peer electronic cash system," 2008.
- L. Kristoufek, "What are the main drivers of the Bitcoin price? Evidence from wavelet coherence analysis," PloS one, vol. 10, no. 4, p. e0123923, 2015. https://doi.org/10.1371/journal.pone.0123923.
- X. Zhang, H. X. Zhang, H. Fuehres, and P. A. Gloor, "Predicting stock market indicators through twitter "I hope it is not as bad as I fear"," Procedia-Social and Behavioral Sciences, vol. 26, pp. 55-62, 2011. https://doi.org/10.1016/j.sbspro.2011.10.562.
- P. Forecast, "LSTM-based Sentiment Analysis for Stock.
|
Disclaimer/Publisher’s Note: The statements, opinions and data contained in all publications are solely those of the individual author(s) and contributor(s) and not of MDPI and/or the editor(s). MDPI and/or the editor(s) disclaim responsibility for any injury to people or property resulting from any ideas, methods, instructions or products referred to in the content. |
© 2024 by the authors. Licensee MDPI, Basel, Switzerland. This article is an open access article distributed under the terms and conditions of the Creative Commons Attribution (CC BY) license (http://creativecommons.org/licenses/by/4.0/).
