
Submitted:
01 November 2024
Posted:
04 November 2024
You are already at the latest version
Abstract
Purpose: This study investigates radiomics efficacy in post-surgical traumatic spinal cord injury (SCI), overcoming MRI limitations from metal artifacts to enhance diagnosis, severity assessment, and lesion characterization for prognosis and therapy guidance. Background: Traumatic spinal cord injury (SCI) causes severe neurological deficits. While MRI allows qualitative injury evaluation, standard imaging alone has limitations for precise SCI diagnosis, severity stratification, and pathology characterization needed to guide prognosis and therapy. Radiomics enables quantitative tissue phenotyping by extracting a high-dimensional set of descriptive texture features from medical images. However, the efficacy of postoperative radiomic quantification in the presence of metal-induced MRI artifacts from spinal instrumentation has yet to be fully explored. Methods: 50 healthy controls and 12 SCI patients post-stabilization surgery underwent 3D multi-spectral MRI. Automated spinal cord segmentation was followed by radiomic feature extraction. Supervised machine learning categorized SCI versus controls, injury severity, and lesion location relative to instrumentation. Results: Radiomics differentiated SCI patients (Matthews correlation coefficient (MCC) 0.97; accuracy 1.0), categorized injury severity (MCC: 0.95; ACC: 0.98) and localized lesions (MCC: 0.85; ACC: 0.90). Combined T1 and T2 features outperformed individual modalities across tasks with gradient boosting models showing highest efficacy. Conclusion: The radiomic framework achieved excellent performance, differentiating SCI from controls and accurately categorizing injury severity. The ability to reliably quantify SCI severity and localization could potentially inform diagnosis, prognosis, and guide therapy. Further research is warranted to validate radiomic SCI biomarkers and explore clinical integration.
Keywords:
Radiomics
; Spinal cord Injury
; Multi-Spectral Imaging
; Magnetic Resonance Imaging
; Metal artefact
1. Introduction
Traumatic spinal cord injury (SCI) is a devastating condition affecting millions of individuals worldwide. SCI profoundly impacts physical, psychological, and socioeconomic well-being [1]. In the United States alone, approximately 17,800 new SCI cases occur annually [2]. SCI can damage axons, neurons, glia, and blood vessels, resulting in temporary or permanent sensory and motor deficits below the lesion level [3]. Most SCIs occur at cervical levels, with common causes being motor vehicle collisions, falls, violence, and sports activities [2].
Magnetic resonance imaging (MRI) is the preferred modality for visualizing the spinal cord and soft tissues [4]. Conventional MRI protocols enable cord compression, signal changes, edema, hemorrhage, and morphologic alterations to be detected after injury. However, qualitative image evaluation has limitations in providing microstructural and functional details needed to guide SCI prognosis and management [5].
Quantitative MRI techniques like diffusion tensor imaging, magnetization transfer, and functional MRI have demonstrated potential for extracting precise biomarkers of post-traumatic cord integrity and function [6]. Still, these methods probe specific physiological phenomena in isolation. Radiomics offers a more holistic approach by extracting multiple descriptive features from medical images through high-throughput data characterization [7]. Radiomic methods have shown promise for prognosis in oncology [8]. Recently, radiomic techniques have been explored in spinal cord studies. Okimatsu et al. developed a radiomic model using T2*-weighted MRI and machine learning to predict neurological outcomes after acute cervical SCI [9]. However, a key challenge is that SCI frequently requires surgical stabilization involving the implantation of metallic instrumentation. The hardware can produce artifacts on conventional postoperative MRI [10] that disrupt quantitative radiomic analyses.
This study aimed to implement a radiomic modeling approach to analyze MRI of the instrumented spinal cord in SCI subjects. Multi-spectral imaging sequences were leveraged to suppress metal artifacts and thus enable unobstructed radiomic feature extraction at instrumented levels [11]. We hypothesized that radiomic signatures could reliably categorize SCI severity and lesion location. Successfully quantifying MRI traits in instrumented cords could ultimately enable monitoring of traumatic changes to inform SCI diagnosis and therapeutic regimens.
2. Materials and Methods
Reporting and analysis in this study followed the CheckList for EvaluAtion of Radiomics Research (CLEAR) documentation standard focusing on repeatability, reproducibility, and transparency of radiomic studies [12].
2.1. Study Cohorts
This study involved 12 subjects with traumatic SCI who underwent MRI scans 1-14 months (mean 7.08 ± 4.03) following surgical stabilization at cervical levels using metallic instrumentation. SCI severity was graded using the American Spinal Injury Association (ASIA) Impairment Scale (AIS). The study also included 50 healthy controls with no SCI or cord disorders history. Informed consent was obtained from all participants per our Institutional Review Board protocol. Table 1 summarizes the cohort demographics.
Imaging was performed at 3T (GE Signa Premier) using a 21-channel neurovascular coil. Multi-spectral 3D fast spin echo MRI was acquired to suppress metal artifacts [11]. Isotropic 1.2 mm resolution T1 and T2-weighted volumes were obtained with 8 spectral bins. Imaging parameters were TR/TE: T1 - 750/8 ms, T2 - 2100/60 ms, ARC 2x2 acceleration.
2.2. Image Analysis
The spinal cord was automatically segmented on T1 and T2 volumes using the Spinal Cord Toolbox deep learning model [13], followed by refinements to handle residual artifacts (Figure 1) [14]. Radiomic feature extraction was performed within cord segmentation using PyRadiomics [15]. A total of 1374 features describing intensity, shape, and texture patterns were generated from original and filtered images, including (wavelet, square, square root, logarithm, exponential, gradient, and local binary pattern).
2.3. Classification Framework
The radiomic feature sets were input into a supervised machine-learning pipeline to differentiate
SCI subjects from controls and categorize injury severity and cord location relative to the injury site. The dataset was divided into training (70%), validation (15%), and testing (15%) subsets. An automated modeling framework (H2O AutoML) evaluated various classifiers (random forest, XGBoost, neural networks, etc.) using 5-fold cross-validation on the training data [16]. The best model for each target was selected, and performance was assessed on the independent test set.
Three classification tasks were: 1) Differentiating SCI cases from healthy controls, 2) SCI severity (severe AIS A-B vs. non-severe AIS C-D), and 3) Lesion zone (above, at, or below instrumentation level). For each target, models were trained using T1, T2, or combined T1+T2 radiomic features to compare performance. Evaluation metrics were accuracy, Matthew’s correlation coefficient (MCC), F1-score, and the area under the ROC (receiver operating characteristic) curve (AUC).
3. Results
Figure 2 depicts sample T1 and T2 weighted MRI images and the segmented cord on an instrumented slice.
As shown in Figure 3, a combined T1 and T2 feature set achieved strong performance in discriminating between healthy controls and SCI patients, with 0.97 MCC, 0.98 F1 score, 1.00 Accuracy, and 1.00 AUC. For predicting injury severity, the T1+T2 model again achieved robust performance with 0.95 MCC, 0.98 F1 score, 0.98 Accuracy, and 0.99 AUC. The T2 model achieved 0.86 MCC and 0.94 Accuracy. For lesion zone classification, the T1+T2 model performed best with 0.85 MCC, 0.90 F1 score, 0.90 Accuracy, and 0.98 AUC. The T2 model achieved 0.81 MCC and 0.88 Accuracy.
Gradient boosting machine (GBM) models achieved the top performance for most tasks. The only exception was the zone classification task using T1 features, for which XGBoost was optimal.
Overall, the combined T1+T2 models outperformed individual modalities across tasks. The models demonstrated excellent discrimination for SCI vs. controls and good predictive performance for injury severity. Results were strong but comparatively lower for the more challenging 3-class zone classification task.
4. Discussion
This study demonstrates the potential of a radiomic modeling approach for instrumented spinal cord MRI analysis in traumatic SCI. A key advance was the use of multi-spectral imaging to suppress instrumentation artifacts that can distort quantitative feature extraction. Radiomic SCI characterization could offer advantages over qualitative evaluation alone or standard diffusion/functional MRI methods that assess specific microstructural or physiological properties in isolation. The high-throughput radiomic feature set provides a more comprehensive phenotypic profiling of overall cord tissue traits linked to injury.
The radiomic framework reliably differentiated severe and non-severe SCI categories, achieving robust classification performance. This ability to determine injury severity, which has significant implications for prognosis and therapy, demonstrates clinical utility.
While global accuracy metrics were relatively high across tasks, lower MCC and F1 scores imply some degree of inter-class imbalance likely exists in the dataset. This imbalance means majority classes were more successfully predicted than minority classes. Techniques such as oversampling of minority classes or cost-sensitive learning could address this and improve MCC and F1 metrics. Additionally, discrimination power was weaker for more nuanced tasks like severity level or subtle zone differences. These findings warrant focused efforts on feature engineering and model tuning targeting MCC and F1 improvements.
When assessing the advantages of combined T1 and T2 features versus prolonged scan times, the MCC is particularly informative in the presence of class imbalance. For cohort differentiation, the MCC increase from 0.92 to 0.97 with combined features is substantial. However, the 0.92 baseline already indicates robust predictive power. In efficiency-focused clinical settings, marginal T1+T2 benefits may not outweigh longer scans, especially for resource optimization.
For severity classification, the MCC rose slightly from 0.86 to 0.95 with combined features. While showing an increase, the 0.86 T2 baseline is respectable. The slight absolute MCC increase may have limited utility depending on clinical use. T2 could suffice when efficiency is critical and acceptable severity discrimination is achievable. However, for applications where severity subtleties carry high stakes, the T1+T2 approach may provide value despite a longer scan time.
For multiclass zone classification, the more substantial MCC boost from 0.81 to 0.85 with T1+T2 features could justify extra scan time. While context-dependent, this degree of performance lift may warrant dual-acquisition protocols.
In summary, T1+T2 improved performance metrics across tasks. However, clinical value versus efficiency tradeoffs depends on the classification specifics and performance requirements.
Further feature engineering or integrating other imaging modalities could refine model performance. More extensive longitudinal studies are essential to fully explore clinical utility. Overall, radiomic modeling shows promise for quantitative SCI MRI, potentially guiding diagnosis and management.
Author Contributions
A.A. and K.K.; Data curation, A.A.; Formal analysis, A.A.; Funding acquisition, K.K.; Investigation, K.K.; Methodology, A.A.; Project administration, K.K.; Resources, K.K.; Software, A.A.; Supervision, K.K.; Validation, A.A. and K.K.; Visualization, A.A.; Writing—original draft, A.A.; Writing—review & editing, A.K. and K.K. All authors have read and agreed to the published version of the manuscript.
Funding
This research was funded by Department of Defense Congressionally Directed Medical Research Program, Spinal Cord Injury Research Program, award number W81XWH1910273.
Institutional Review Board Statement
The study was conducted in accordance with the Declaration of Helsinki and approved by the Institutional Review Board of Medical College of Wisconsin (protocol code PRO00034880, date of approval: 2/15/2024).
Informed Consent Statement
Informed consent was obtained from all subjects involved in the study.
Data Availability Statement
The data presented in this study are openly available in Mendeley Data at https://data.mendeley.com/datasets/sjpx7md7cf/1.
Conflicts of Interest
The authors declare no conflicts of interest. The funders had no role in the design of the study; in the collection, analyses, or interpretation of data; in the writing of the manuscript; or in the decision to publish the results.
References
- Lee, B.; Cripps, R.A.; Fitzharris, M.; Wing, P. The global map for traumatic spinal cord injury epidemiology: Update 2011, global incidence rate. Spinal Cord 2014, 52, 110–116. [Google Scholar] [CrossRef] [PubMed]
- Singh, A.; Tetreault, L.; Kalsi-Ryan, S.; et al. Global prevalence and incidence of traumatic spinal cord injury. Clinical Epidemiology 2014, 309–331. [Google Scholar]
- Dulin, J.N.; Adler, A.F.; Kumamaru, H.; et al. Injured adult motor and sensory axons regenerate into appropriate organotypic domains of neural progenitor grafts. Nature Communications 2018, 9, 84. [Google Scholar] [CrossRef] [PubMed]
- Shabani, S.; Meyer, B.P.; Budde, M.D.; Wang, M.C. Diagnostic imaging in spinal cord injury. Neurosurgery Clinics 2021, 32, 323–331. [Google Scholar] [CrossRef] [PubMed]
- Martin, A.R.; Aleksanderek, I.; Cohen-Adad, J.; et al. Translating state-of-the-art spinal cord MRI techniques to clinical use: A systematic review of clinical studies utilizing DTI, MT, MWF, MRS, and fMRI. NeuroImage: Clinical 2016, 10, 192–238. [Google Scholar] [CrossRef] [PubMed]
- Cohen-Adad, J.; El Mendili, M.; Lehéricy, S.; et al. Demyelination and degeneration in the injured human spinal cord detected with diffusion and magnetization transfer MRI. Neuroimage 2011, 55, 1024–1033. [Google Scholar] [CrossRef] [PubMed]
- Lambin, P.; Leijenaar, R.T.; Deist, T.M.; et al. Radiomics: The bridge between medical imaging and personalized medicine. Nature Reviews Clinical Oncology 2017, 14, 749–762. [Google Scholar] [CrossRef] [PubMed]
- Aerts, H.J.; Velazquez, E.R.; Leijenaar, R.T.; et al. Decoding tumour phenotype by noninvasive imaging using a quantitative radiomics approach. Nature Communications 2014, 5, 4006. [Google Scholar] [CrossRef] [PubMed]
- Okimatsu, S.; Maki, S.; Furuya, T.; et al. Determining the short-term neurological prognosis for acute cervical spinal cord injury using machine learning. Journal of Clinical Neuroscience 2022, 96, 74–79. [Google Scholar] [CrossRef] [PubMed]
- Hargreaves, B.; Worters, P.W.; Pauly, K.B.; et al. Metal induced artifacts in MRI. AJR American Journal of Roentgenology 2011, 197, 547. [Google Scholar] [CrossRef] [PubMed]
- Koch, K.M.; Lorbiecki, J.E.; Hinks, R.S.; King, K.F. A multispectral three-dimensional acquisition technique for imaging near metal implants. Magnetic Resonance in Medicine: An Official Journal of the International Society for Magnetic Resonance in Medicine 2009, 61, 381–390. [Google Scholar] [CrossRef] [PubMed]
- Kocak, B.; Baessler, B.; Bakas, S.; et al. CheckList for EvaluAtion of radiomics research (CLEAR): A step-by-step reporting guideline for authors and reviewers endorsed by ESR and EuSoMII. Insights into Imaging 2023, 14, 75. [Google Scholar] [CrossRef] [PubMed]
- De Leener, B.; Lévy, S.; Dupont, S.M.; et al. SCT: Spinal cord toolbox, an open-source software for processing spinal cord MRI data. Neuroimage 2017, 145, 24–43. [Google Scholar] [CrossRef] [PubMed]
- Koch, K.M.; Nencka, A.S.; Klein, A.; et al. Diffusion-weighted MRI of the spinal cord in cervical spondylotic myelopathy after instrumented fusion. Frontiers in Neurology 2023, 14, 1172833. [Google Scholar] [CrossRef] [PubMed]
- Van Griethuysen, J.J.; Fedorov, A.; Parmar, C.; et al. Computational radiomics system to decode the radiographic phenotype. Cancer Research 2017, 77, e104–e107. [Google Scholar] [CrossRef] [PubMed]
- LeDell, E.; Poirier, S. H2O AutoML: Scalable automatic machine learning. In Proceedings of the 7th ICML Workshop on Automated Machine Learning (AutoML); 2020. [Google Scholar]
Figure 1.
The flowchart depicts the processing pipeline for segmenting the spinal cord as suggested in [14]. First, N4 bias field correction is applied to the images to remove shading. Then, the SCT deep learning model segments the spinal cord individually on T1 and T2 volumes. However, these segmentations exhibit intermittent failures caused by metal implant artifacts. To mitigate these failures, the T1 data is registered to the T2 space. Then, a radial basis function algorithm integrates the T1 and T2 segmentations, thereby correcting the intermittent failures. Finally, the improved segmentation is used by SCT to label the vertebral levels automatically.
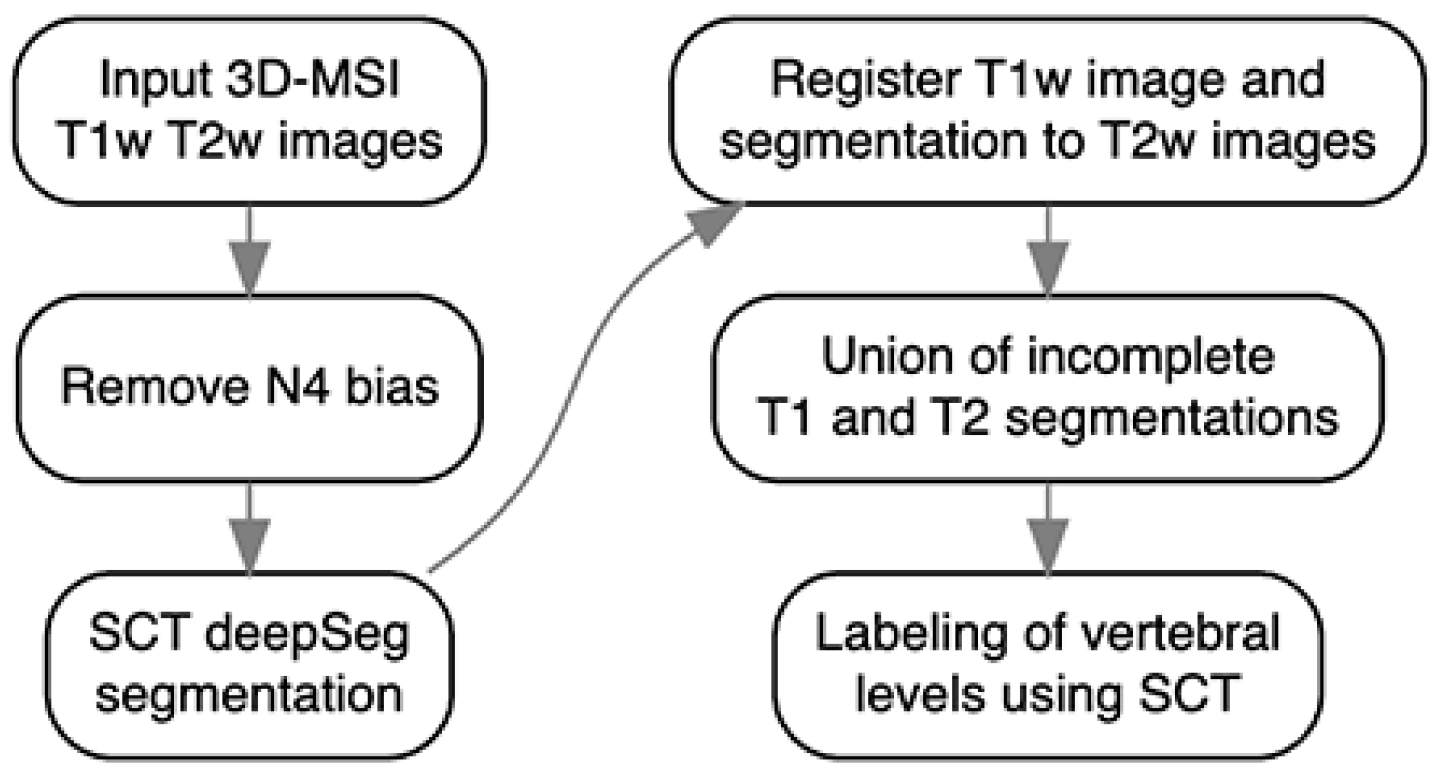
Figure 2.
Sagittal (a) T2-weighted and (b) T1-weighted 3D-MSI MRI images of an instrumented damaged spinal cord. Axial sections, reformatted at the level of the dashed green line from (a) and (b), are shown in (c) and (d) respectively. The spinal cord is outlined in red in all images.
Figure 2.
Sagittal (a) T2-weighted and (b) T1-weighted 3D-MSI MRI images of an instrumented damaged spinal cord. Axial sections, reformatted at the level of the dashed green line from (a) and (b), are shown in (c) and (d) respectively. The spinal cord is outlined in red in all images.
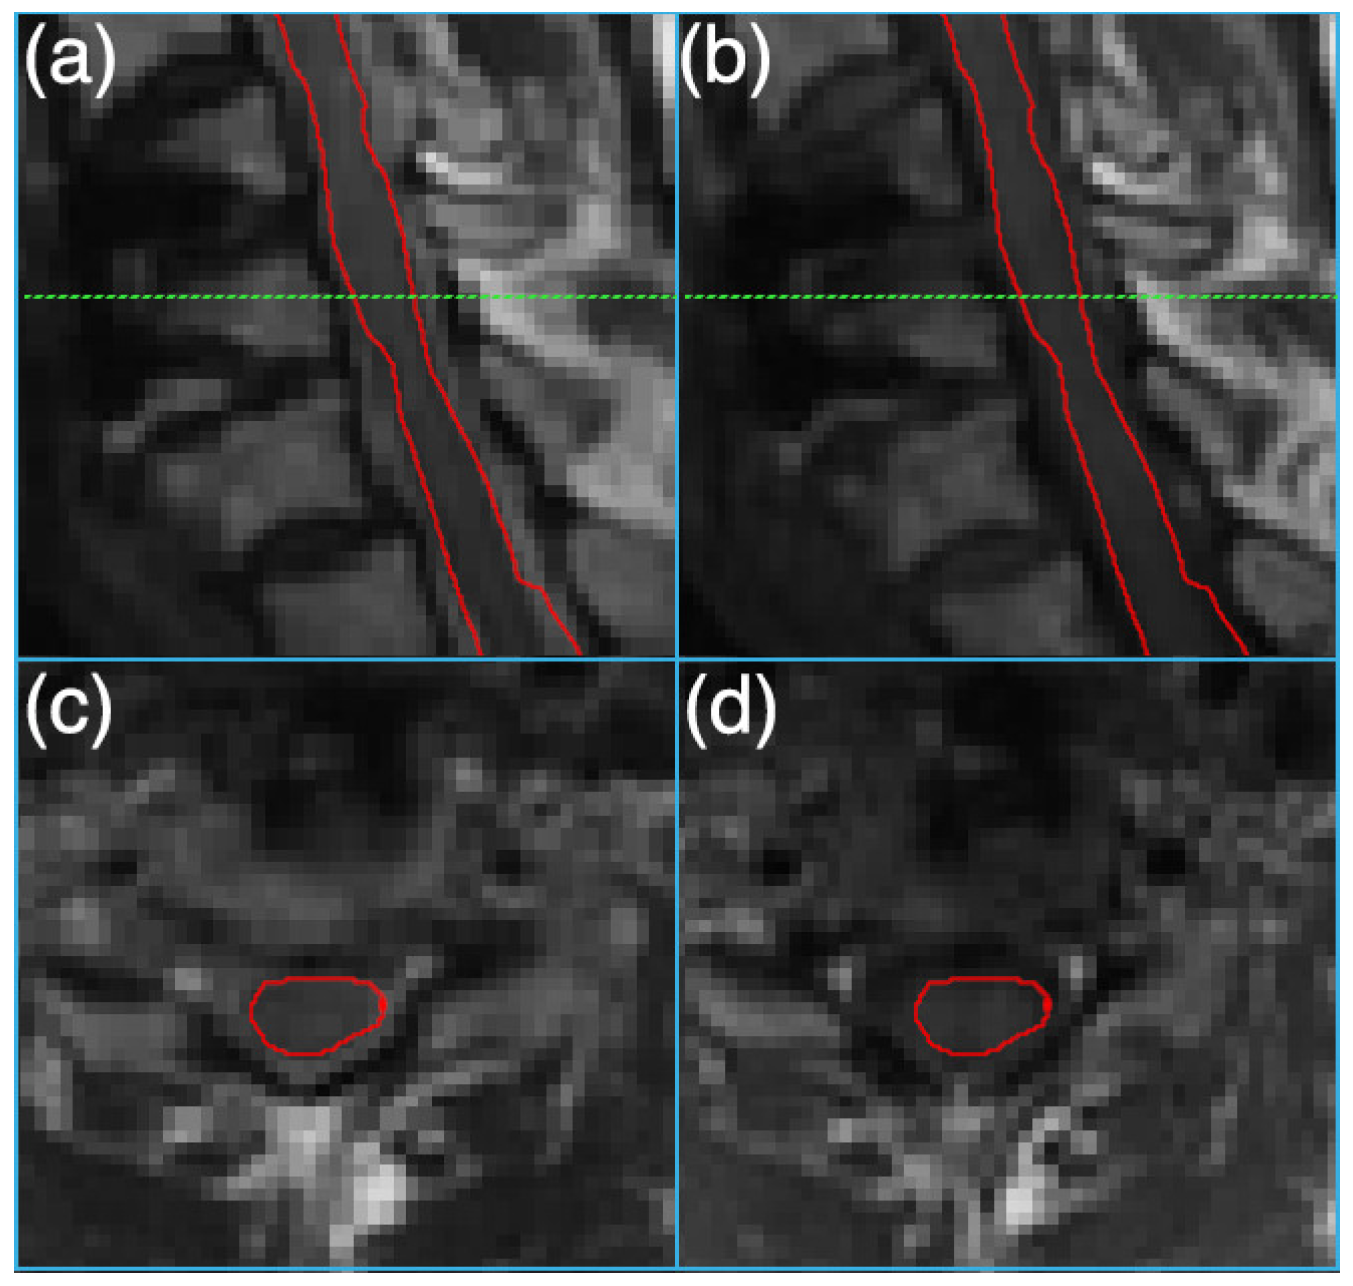
Figure 3.
Comparison of accuracy, F1 score, area under the curve (AUC-ROC), and mean per-class error across radiomic classification tasks using T1, T2, and combined T1/T2 feature sets. The tasks include categorizing cohorts into healthy or spinal cord injury (SCI) groups, determining injury severity levels, and distinguishing between cord zones relative to the injury site.
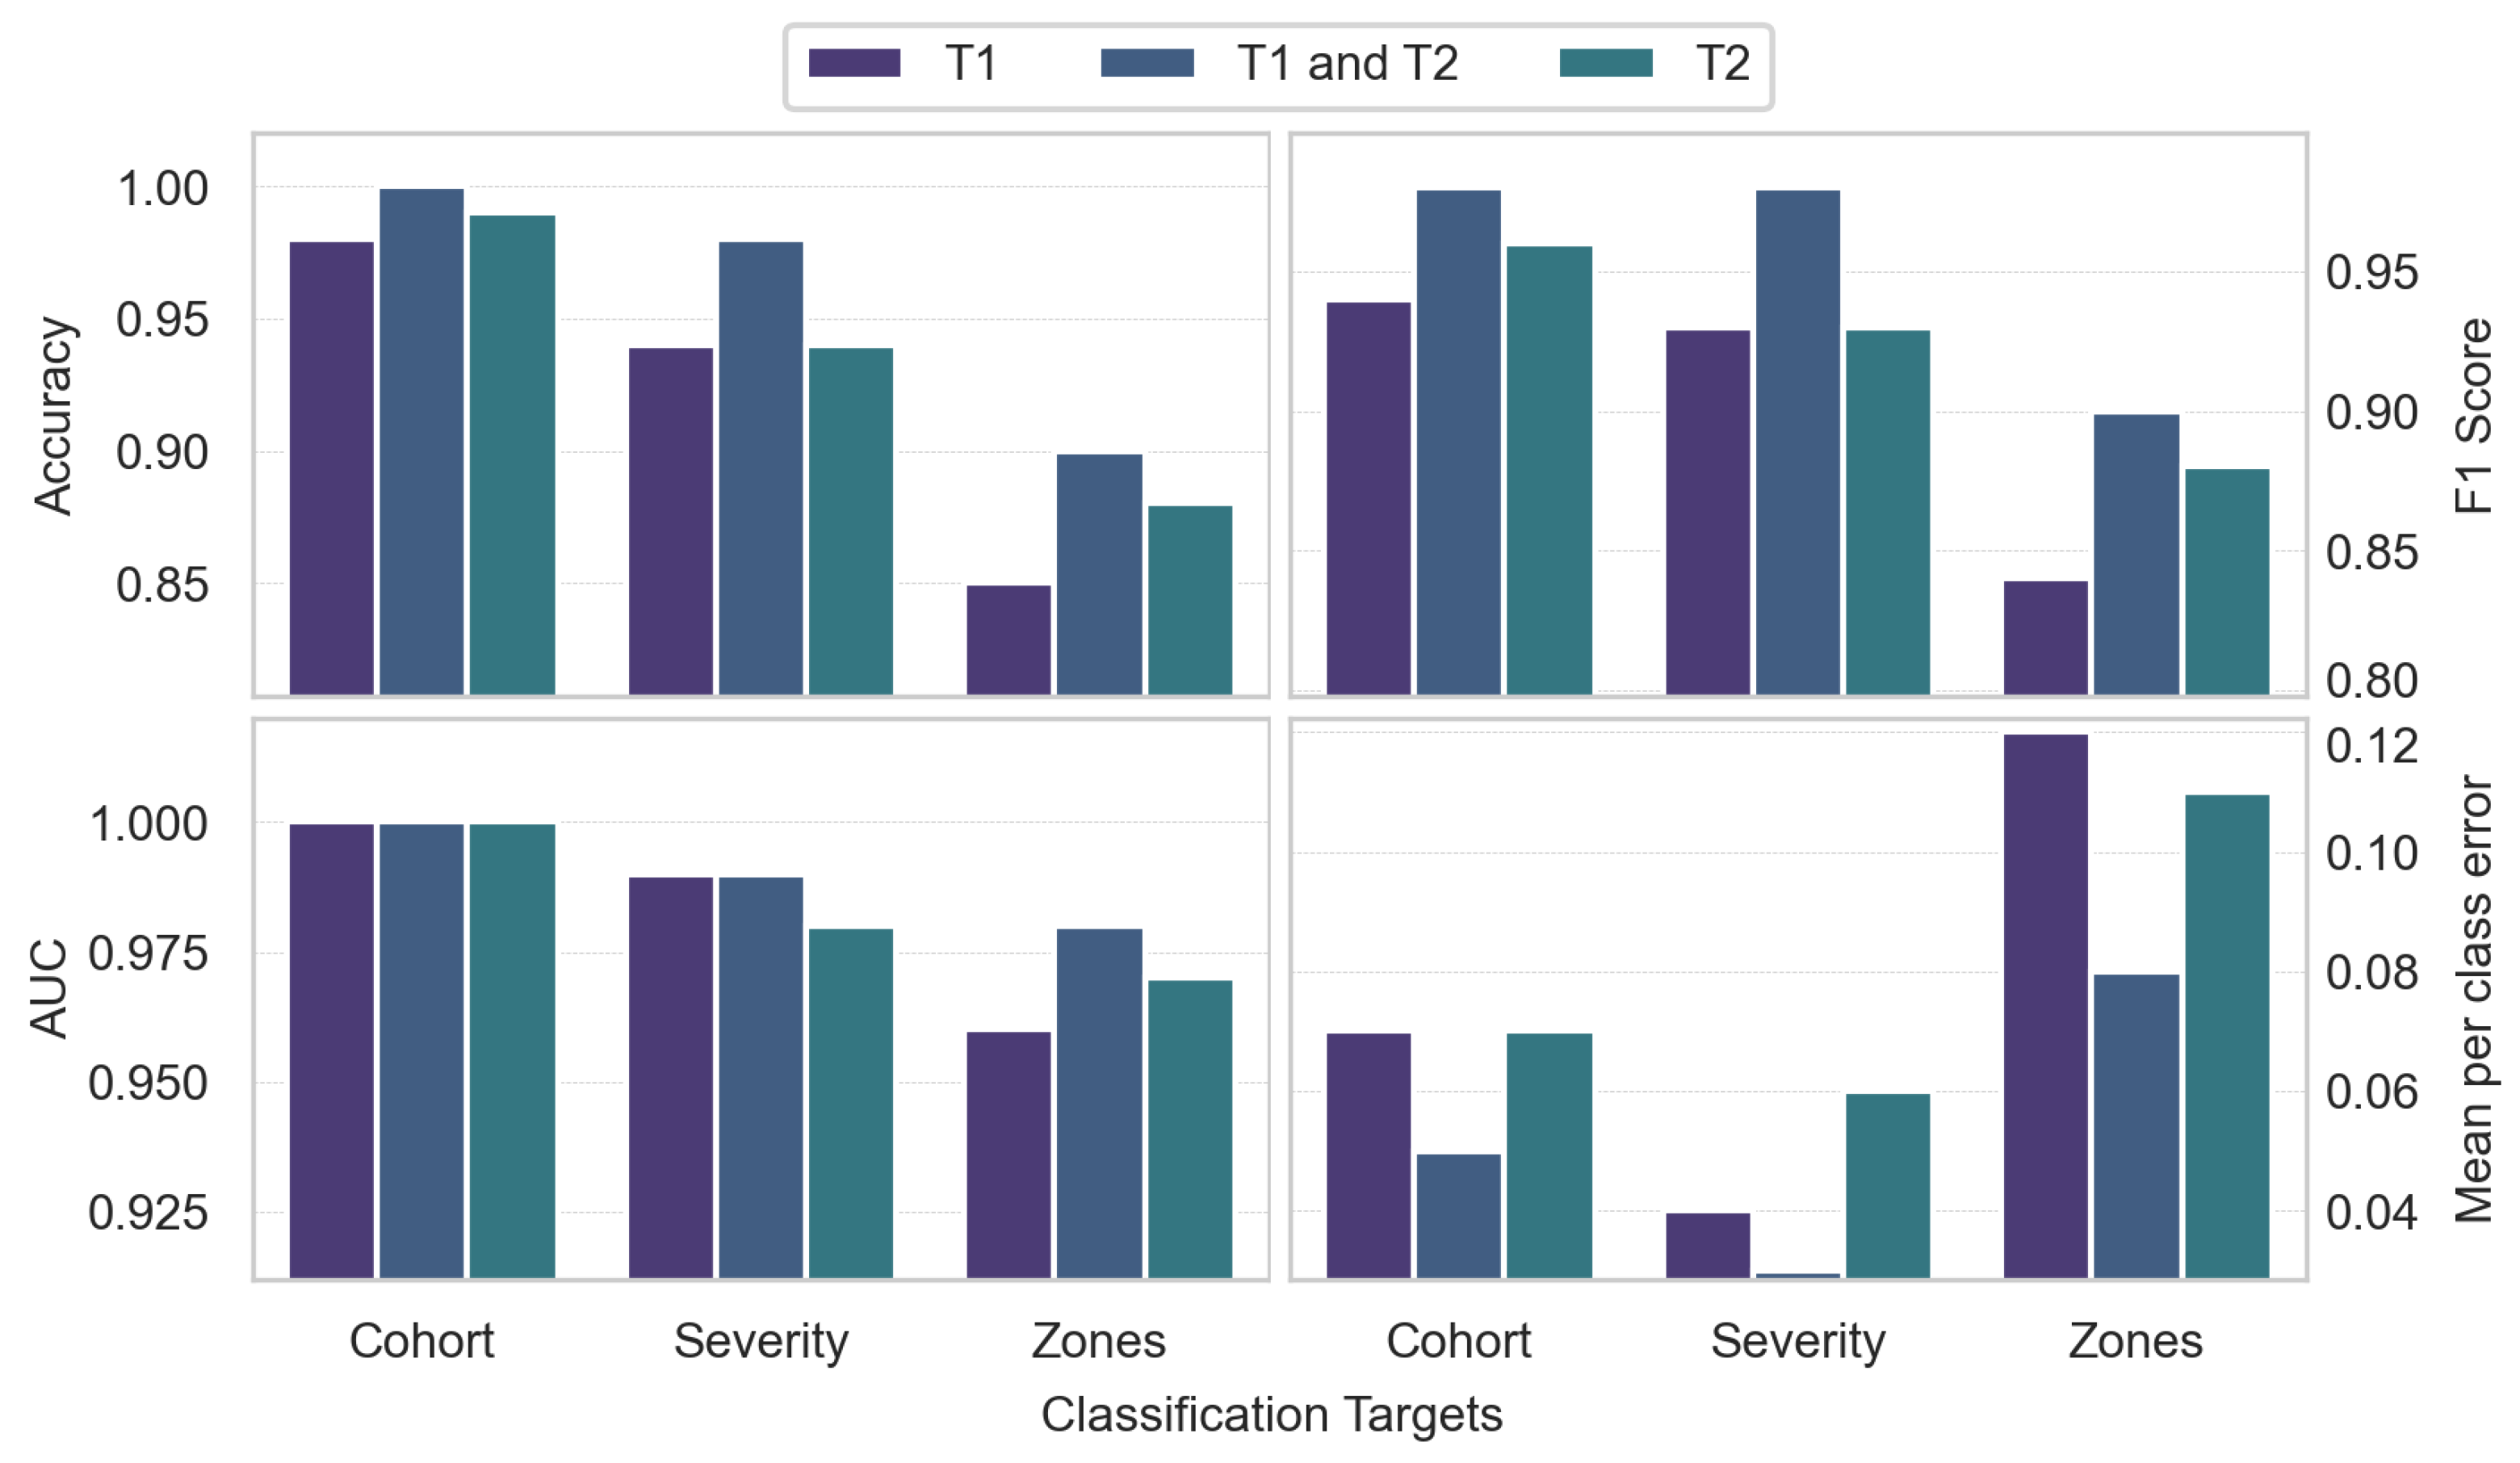

Table 1.
Characteristics of the study cohorts.
| Cohorts | Gender | Count | Age | BMI | ASIA: A | ASIA: B | ASIA: C | ASIA: D |
|---|---|---|---|---|---|---|---|---|
| Healthy | Female | 25 | 47.52 ± 15.23 | 27.22 ± 7.18 | 0 | 0 | 0 | 0 |
| Male | 26 | 48.50 ± 16.92 | 27.84 ± 4.67 | 0 | 0 | 0 | 0 | |
| Total | 51 | 48.02 ± 15.96 | 27.54 ± 5.98 | 0 | 0 | 0 | 0 | |
| SCI | Female | 6 | 59.50 ± 18.62 | 25.57 ± 5.90 | 0 | 1 | 2 | 3 |
| Male | 6 | 48.50 ± 21.95 | 23.52 ± 2.68 | 2 | 1 | 1 | 2 | |
| Total | 12 | 54.00 ± 20.24 | 24.54 ± 4.50 | 2 | 2 | 3 | 5 |
Disclaimer/Publisher’s Note: The statements, opinions and data contained in all publications are solely those of the individual author(s) and contributor(s) and not of MDPI and/or the editor(s). MDPI and/or the editor(s) disclaim responsibility for any injury to people or property resulting from any ideas, methods, instructions or products referred to in the content. |
© 2024 by the authors. Licensee MDPI, Basel, Switzerland. This article is an open access article distributed under the terms and conditions of the Creative Commons Attribution (CC BY) license (http://creativecommons.org/licenses/by/4.0/).
Copyright: This open access article is published under a Creative Commons CC BY 4.0 license, which permit the free download, distribution, and reuse, provided that the author and preprint are cited in any reuse.


