1. Introduction
Characteristics of rainfall events and its spell durations are the most important information for water-related disasters such as floods, coastal erosion, landslides, water hazards etc. This is because the water-related disasters are mainly associated with the rainfall events and are strongly determined by the rainfall amount and its spell duration [
1,
2,
3,
4,
5,
6,
7]. Here spell duration refers to the continuous period of rain events. Many studies have discussed the rainfall characteristics over different regions at different timescale (mostly hourly or daily). Recently, Kendon et al. [
1] examined the characteristics of rain spell duration and associated peak intensity events from hourly rainfall across southern UK. Their results indicate that low peak intensity events (<1mm/h) are short-lived and last up to 1-3hrs, while peak intensity events (<5mm/h) last up to 15hrs. In another study, Wakazuki et al. [
2] examined the rainfall amounts for various accumulation periods (1 to 72hrs) over Japan during Baiu season. Their study indicates that rainfall amount is more in shorter accumulation periods compared to the longer accumulation periods. All these studies provide reliable information of rainfall characteristics on hourly timescale, but the behavior of rainfall events on sub-hourly timescale is not well documented so far. Thus, an attempt is made to analyze the temporal characteristics of rainfall events from 1296 station observations at 10 minutes timescale across Japan to discuss (1) the spell durations for rain exceeding various thresholds and (2) the peak intensity events associated with rain spell durations.
2. Data and Methods
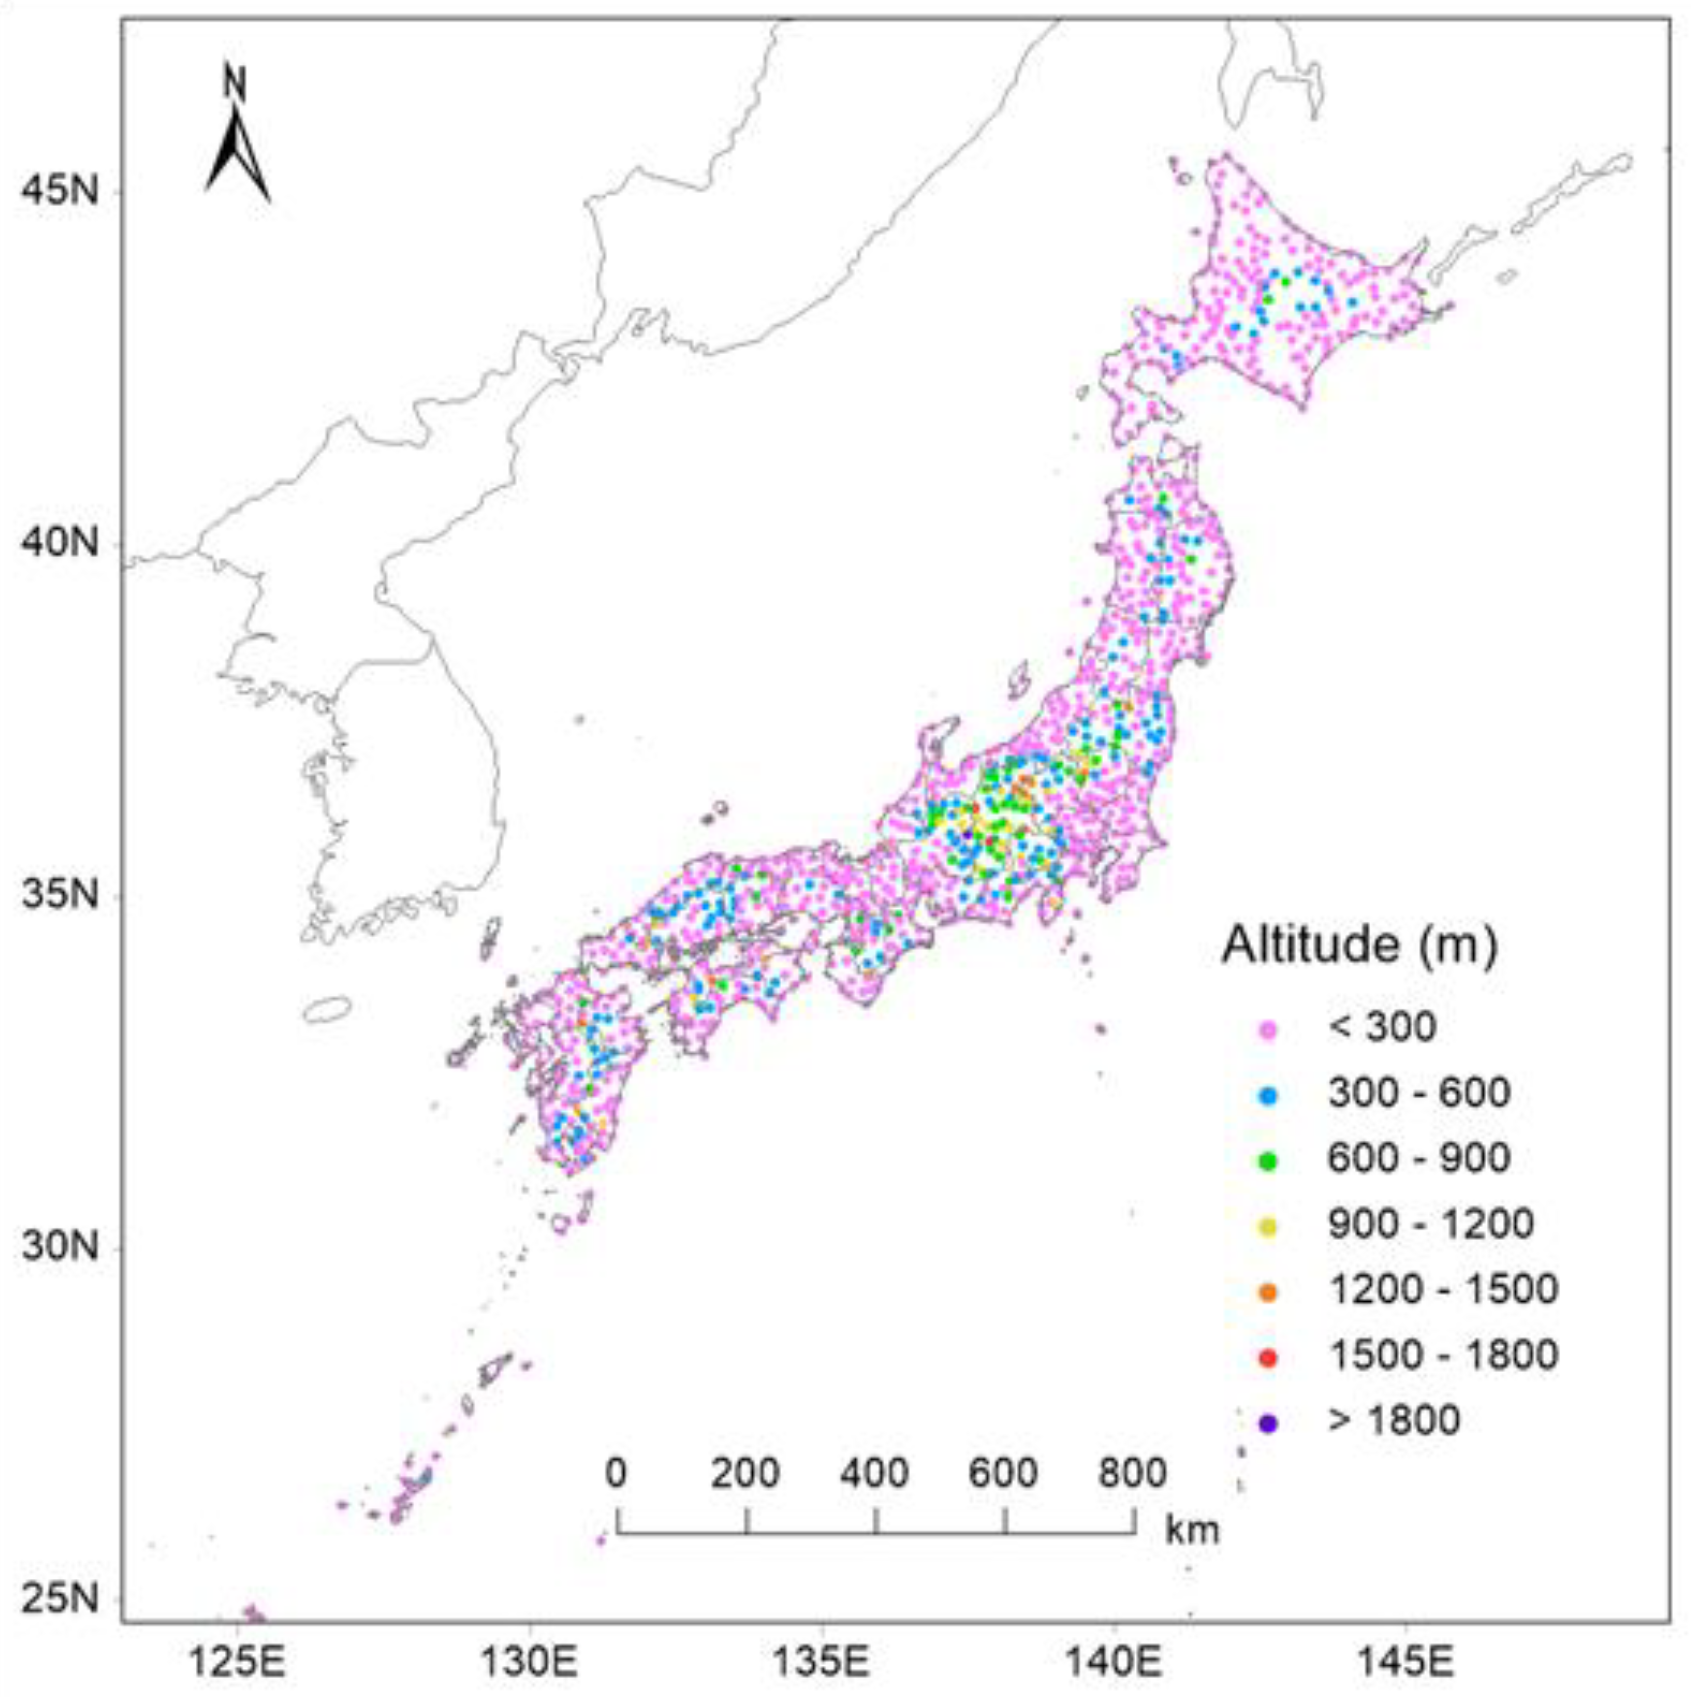
We analyzed the Automated Meteorological Data Acquisition System (AMeDAS) datasets at 10-minute timescale from 1296 stations across Japan for the period of about 10 years. Though more number of AMeDAS stations was available, but we considered those stations at which minimum 7 years of data are available. The locations of these 1296 stations are shown in
Figure 1.
To assess the temporal characteristics of rainfall over Japan, we investigated the probability distribution of spell duration for rain exceeding various thresholds (0.5, 1, 2mm/10min) and the joint probability distributions of rain spell durations versus various peak intensity events (2, 5, 10, 20mm/10min). Spell duration is defined as the continuous period of rain events exceeding the threshold in the 10 minutes time series. The overlapping of any duration of rain was not permitted, so that each spell will be independent. We identify the occurrences of different spell durations of rain exceeding the threshold. We then calculate the peak intensities in all spell durations. Lastly, we computed the normal probability distribution functions of spell durations and the peak intensities associated with different spell durations.
3. Results and Discussions
3.1. Rainfall Distributions
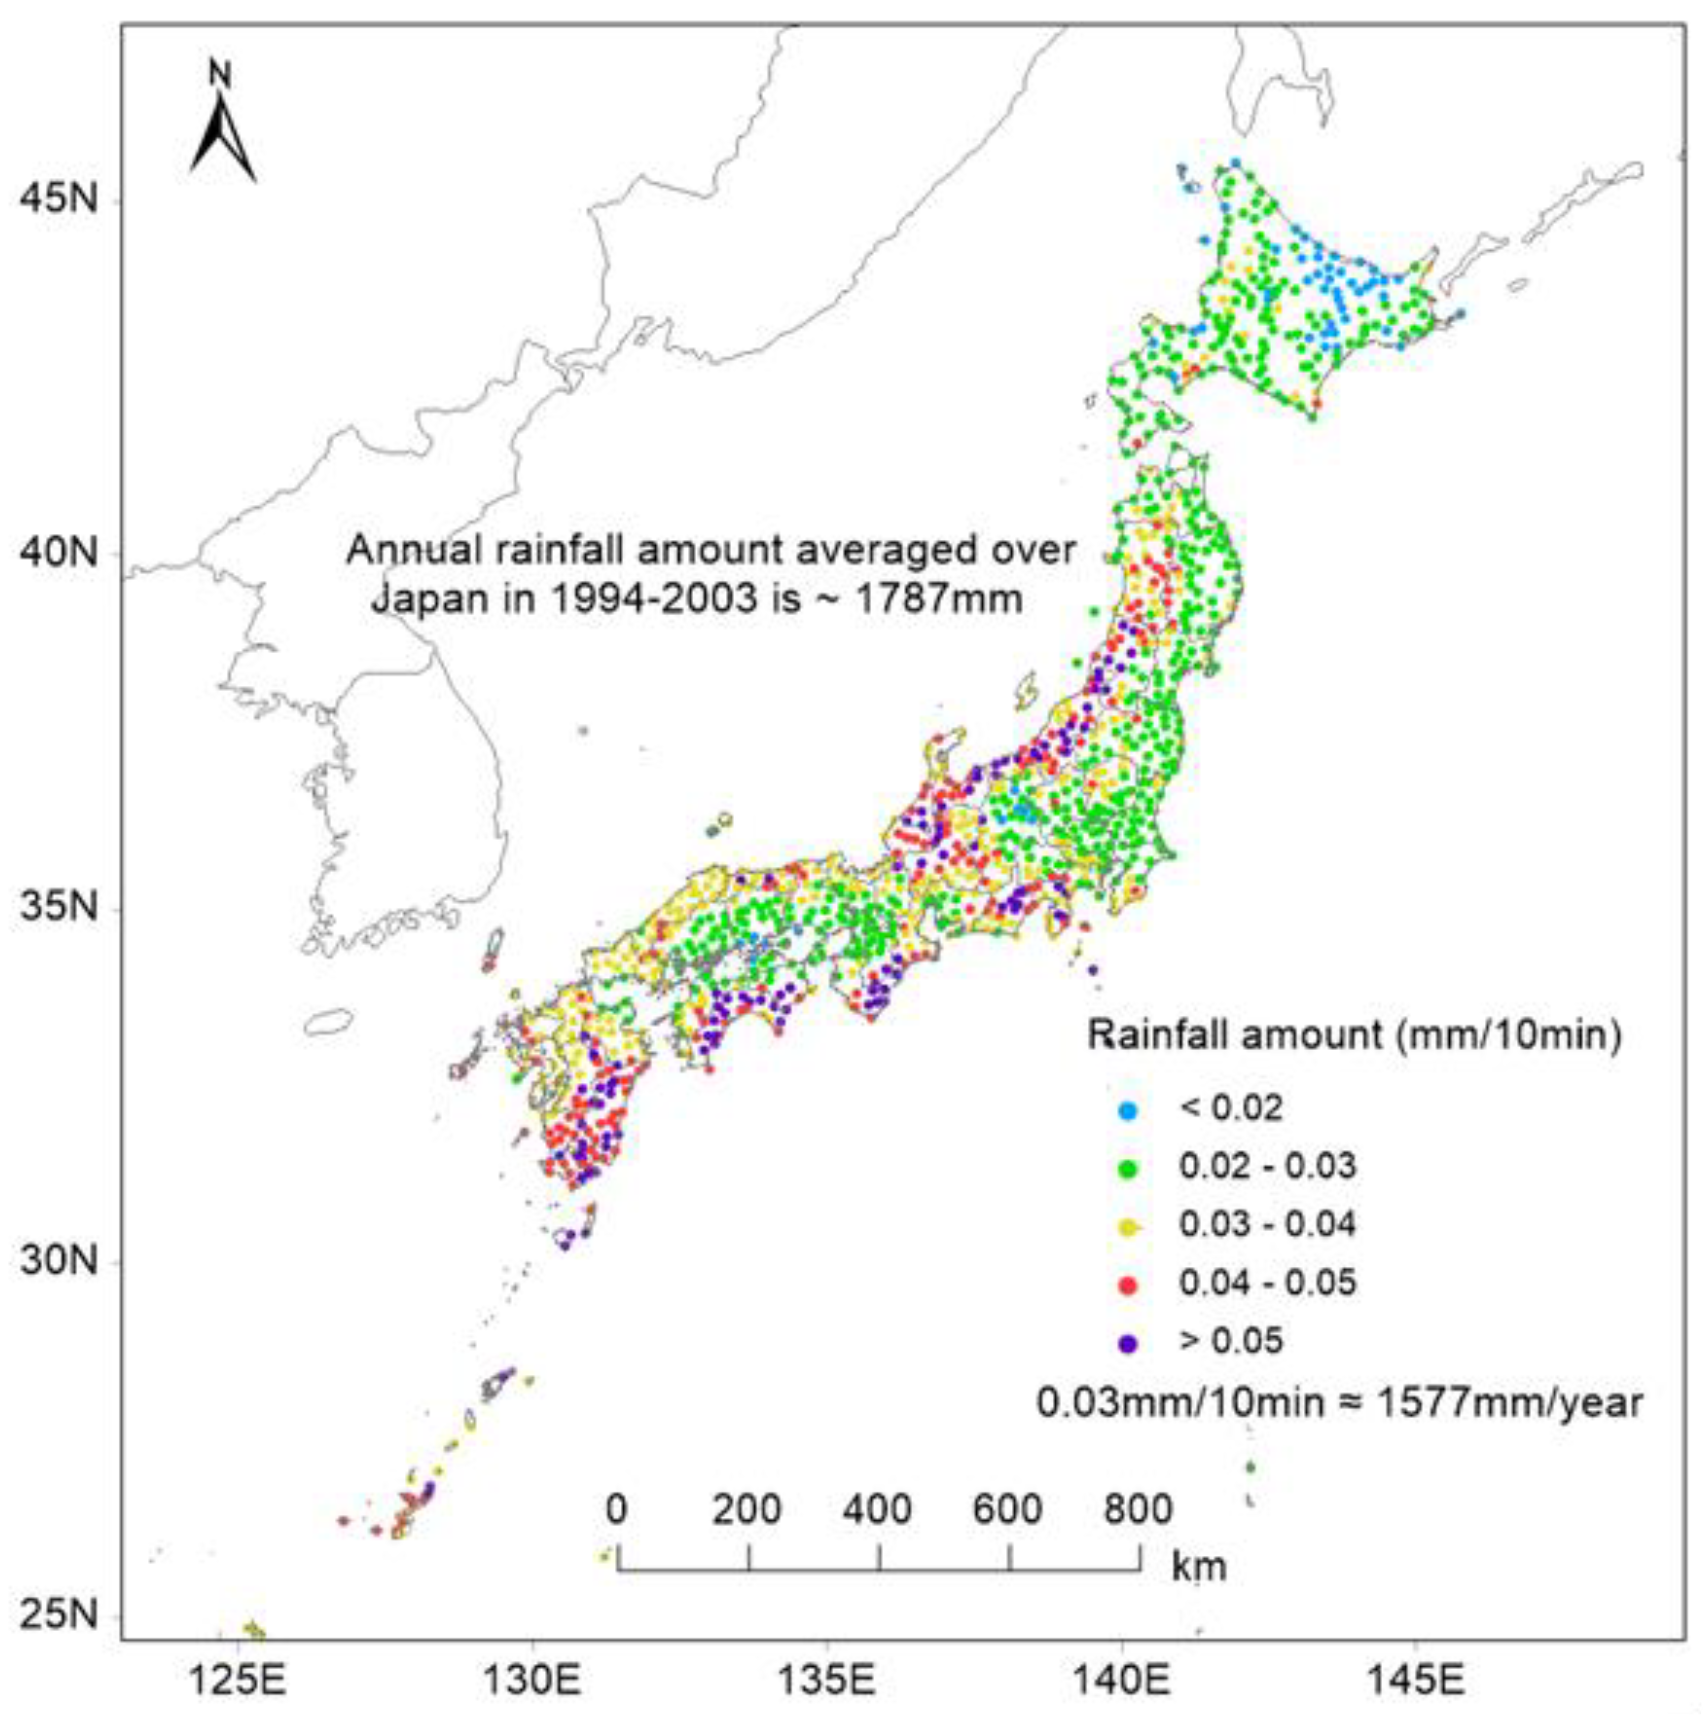
The amount of rainfall (mm/10min) averaged at each station is computed. It shows that heavy rainfall (above annual average) occurs over south east and west central region of Japan. The rainfall amount over south west region is more than over east central region.
3.2. Heavy Wet Events
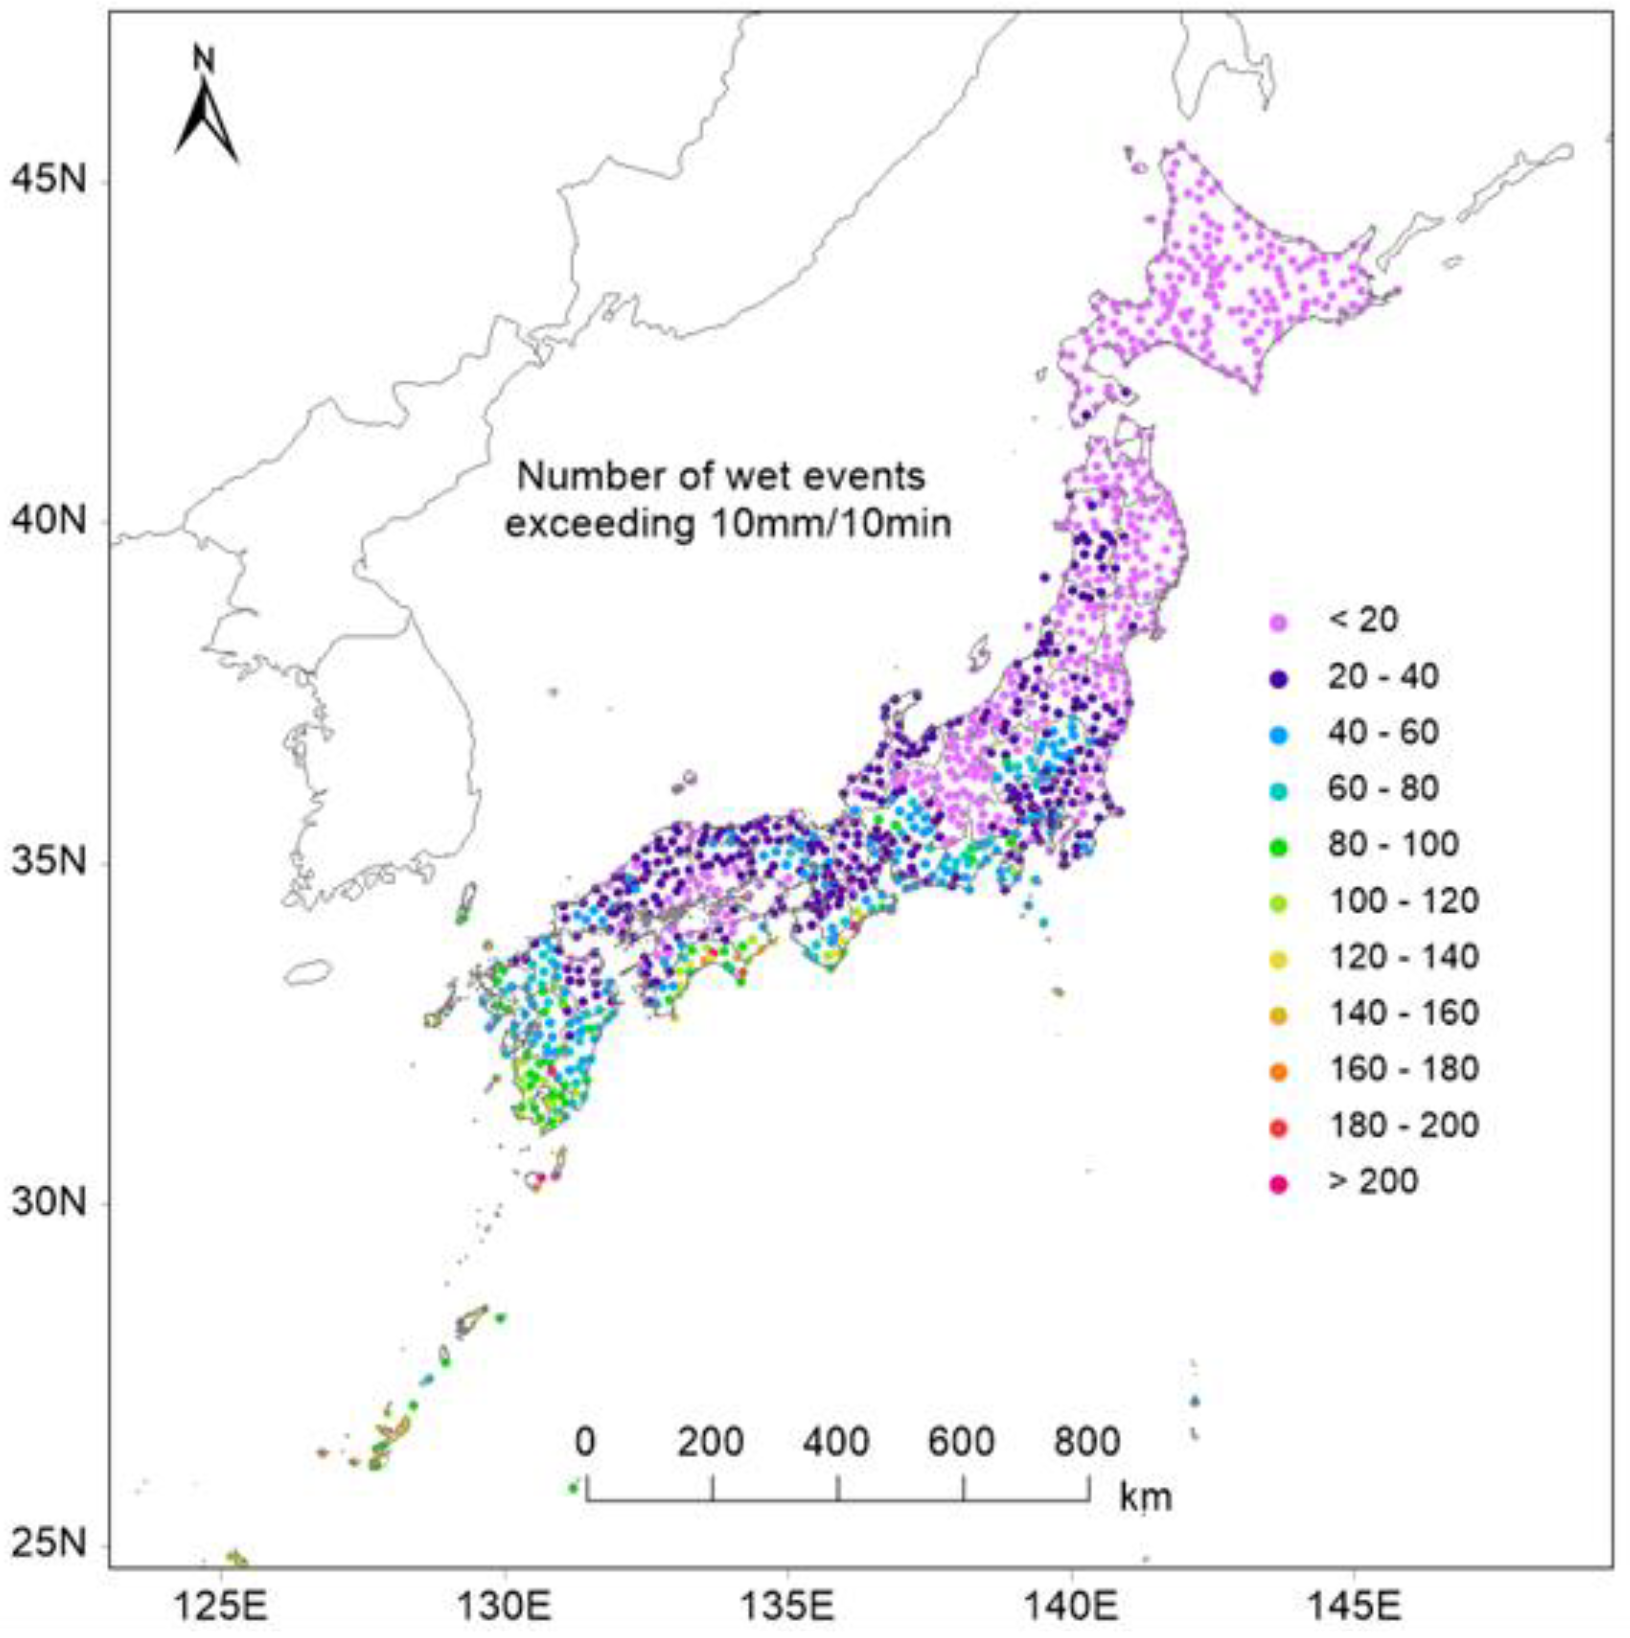
Figure 3 shows the occurrences (in numbers) of wet events exceeding 10mm/10min at each station over japan. It indicates that the heavy rainfall events (> 10mm/10min) occurs more frequently over south of Japan compared to northern regions. Western regions show comparatively more extreme rainfall events followed by Okinawa areas. Northern regions show relatively less extreme rainfall events.
3.3. Probability Distributions of Rainfall Events Exceeding Different Percentiles
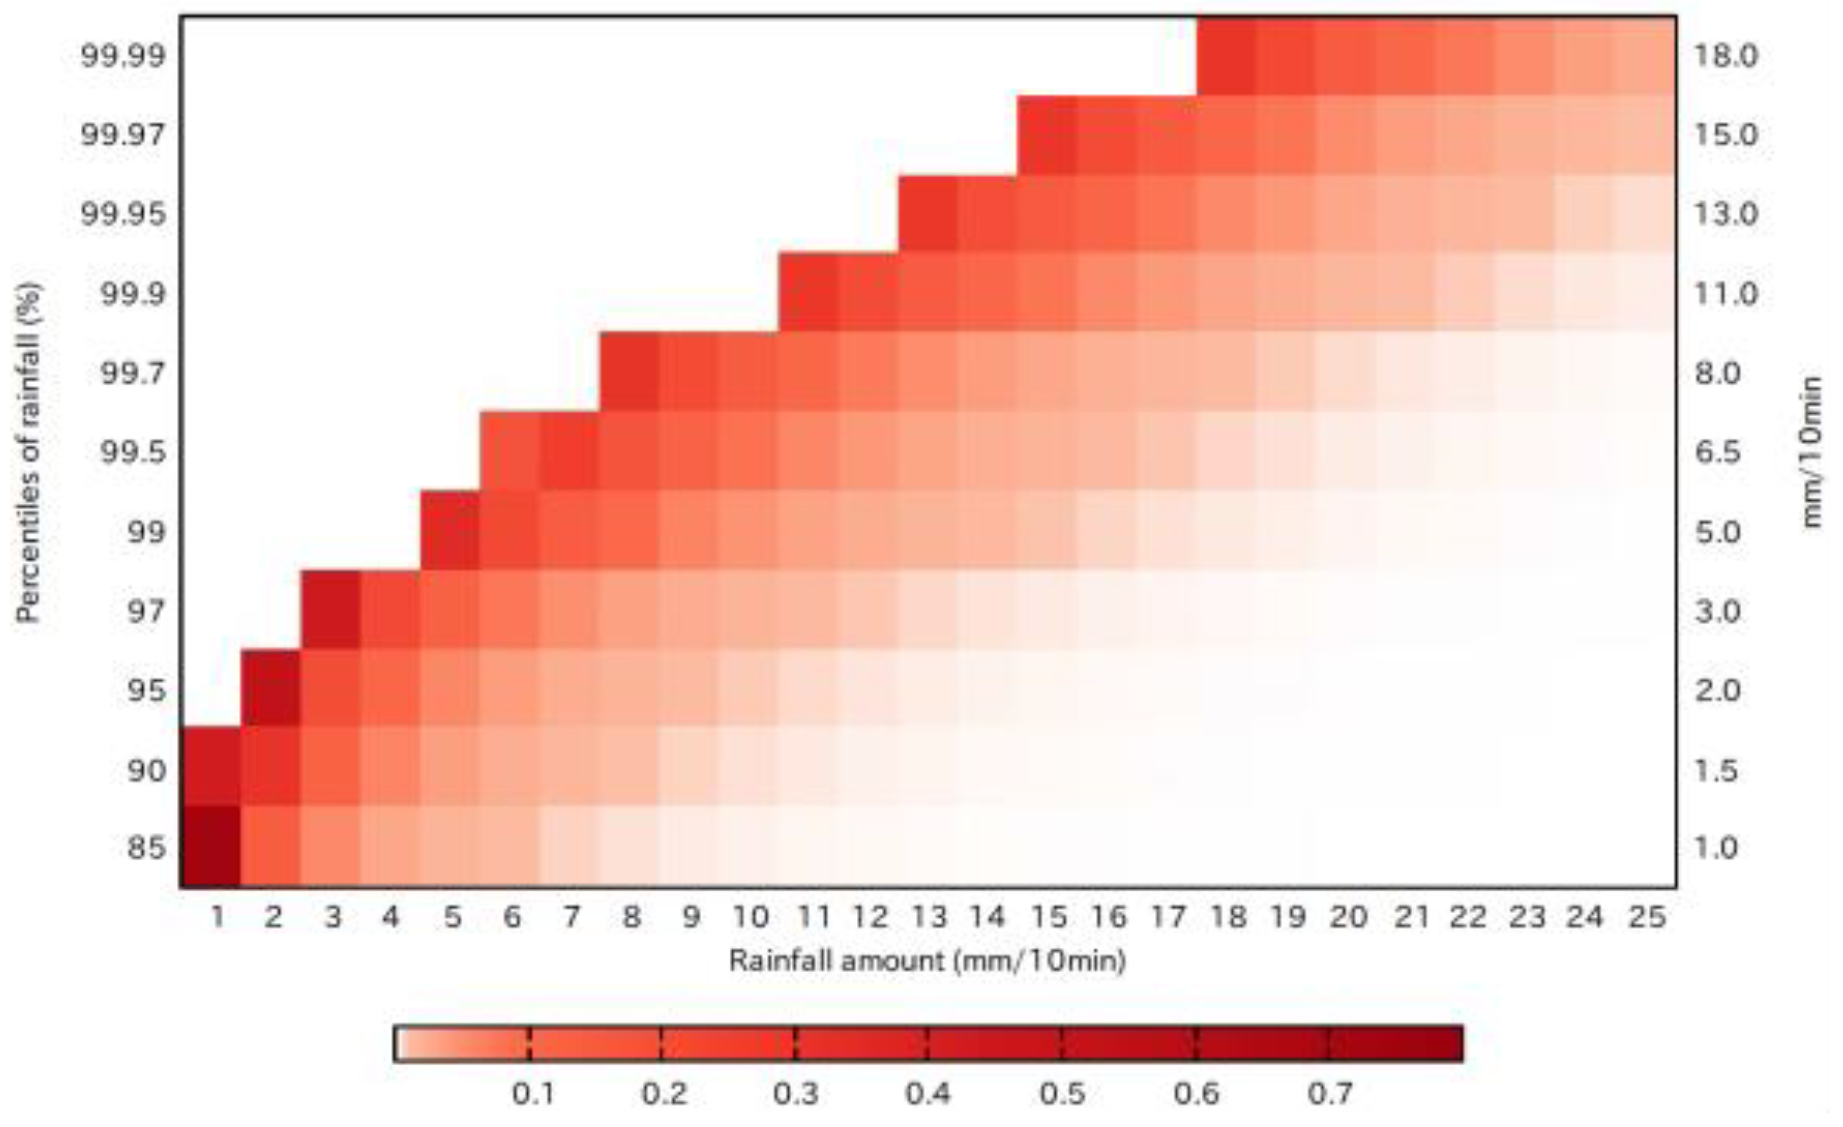
Figure 4 presents the probability of rainfall events exceeding various percentiles is computed. The value of the rainfall amount for each percentile is shown in the right y-axis. The minimum sample size is observed for the wet events exceeding 99.99th percentile, which is 2409 and the maximum sample size is noticed from the wet events exceeding 85th percentile, which is 5903329.
It shows that the light rainfall events exceeding a percentile occur more frequently than the heavy rainfall events exceeding same percentile. However, very heavy rainfall events (>20mm/10min) also occur over Japan, though probability is less compared to low rainfall events.
3.4. Spell Duration
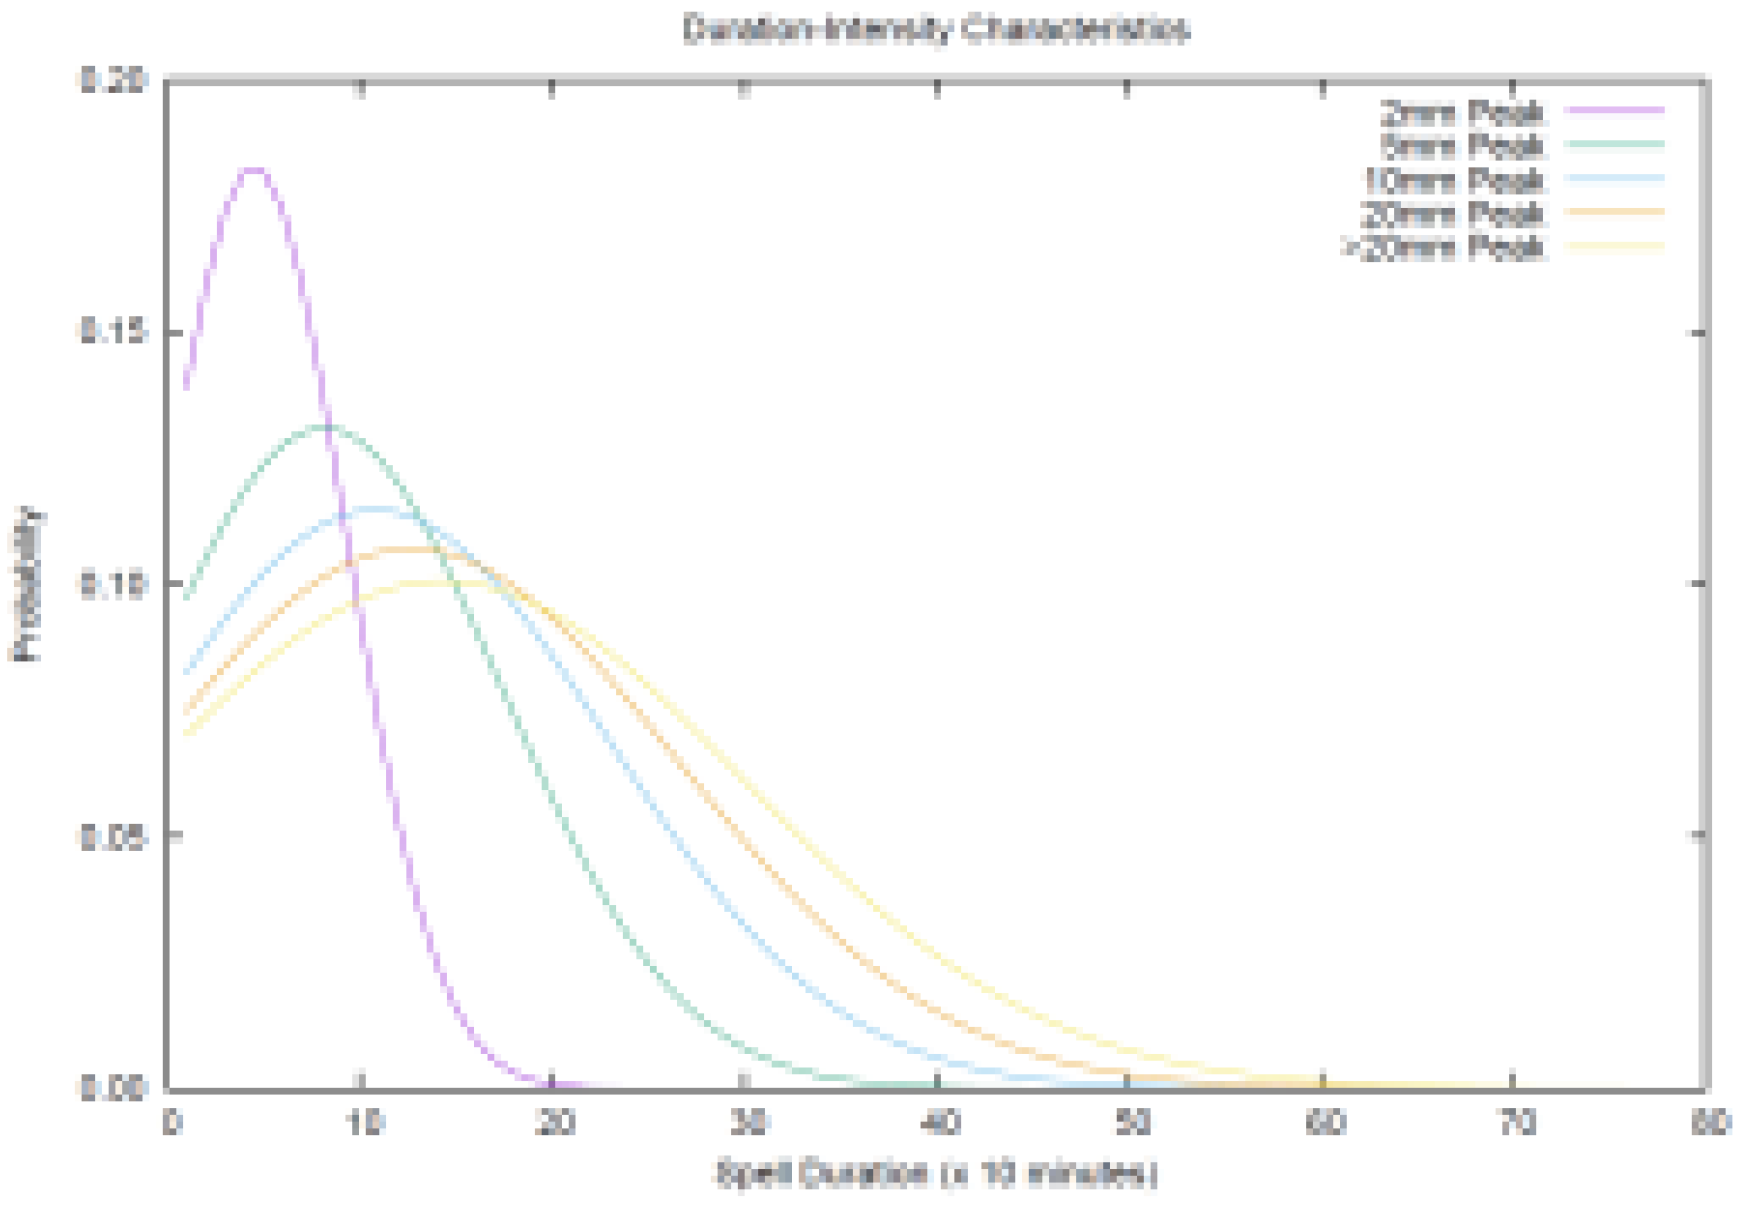
The joint probability distributions of rain spell durations versus peak intensity events is shown in
Figure 5 (computed from the wet events > 1mm/ 10min). It clearly indicates that the low intensity events with 2mm/10min peak are short-lived and last up to 3 hours, while the high peak intensity events of more than 5mm/10min are long-lived and last up to 10 hours.
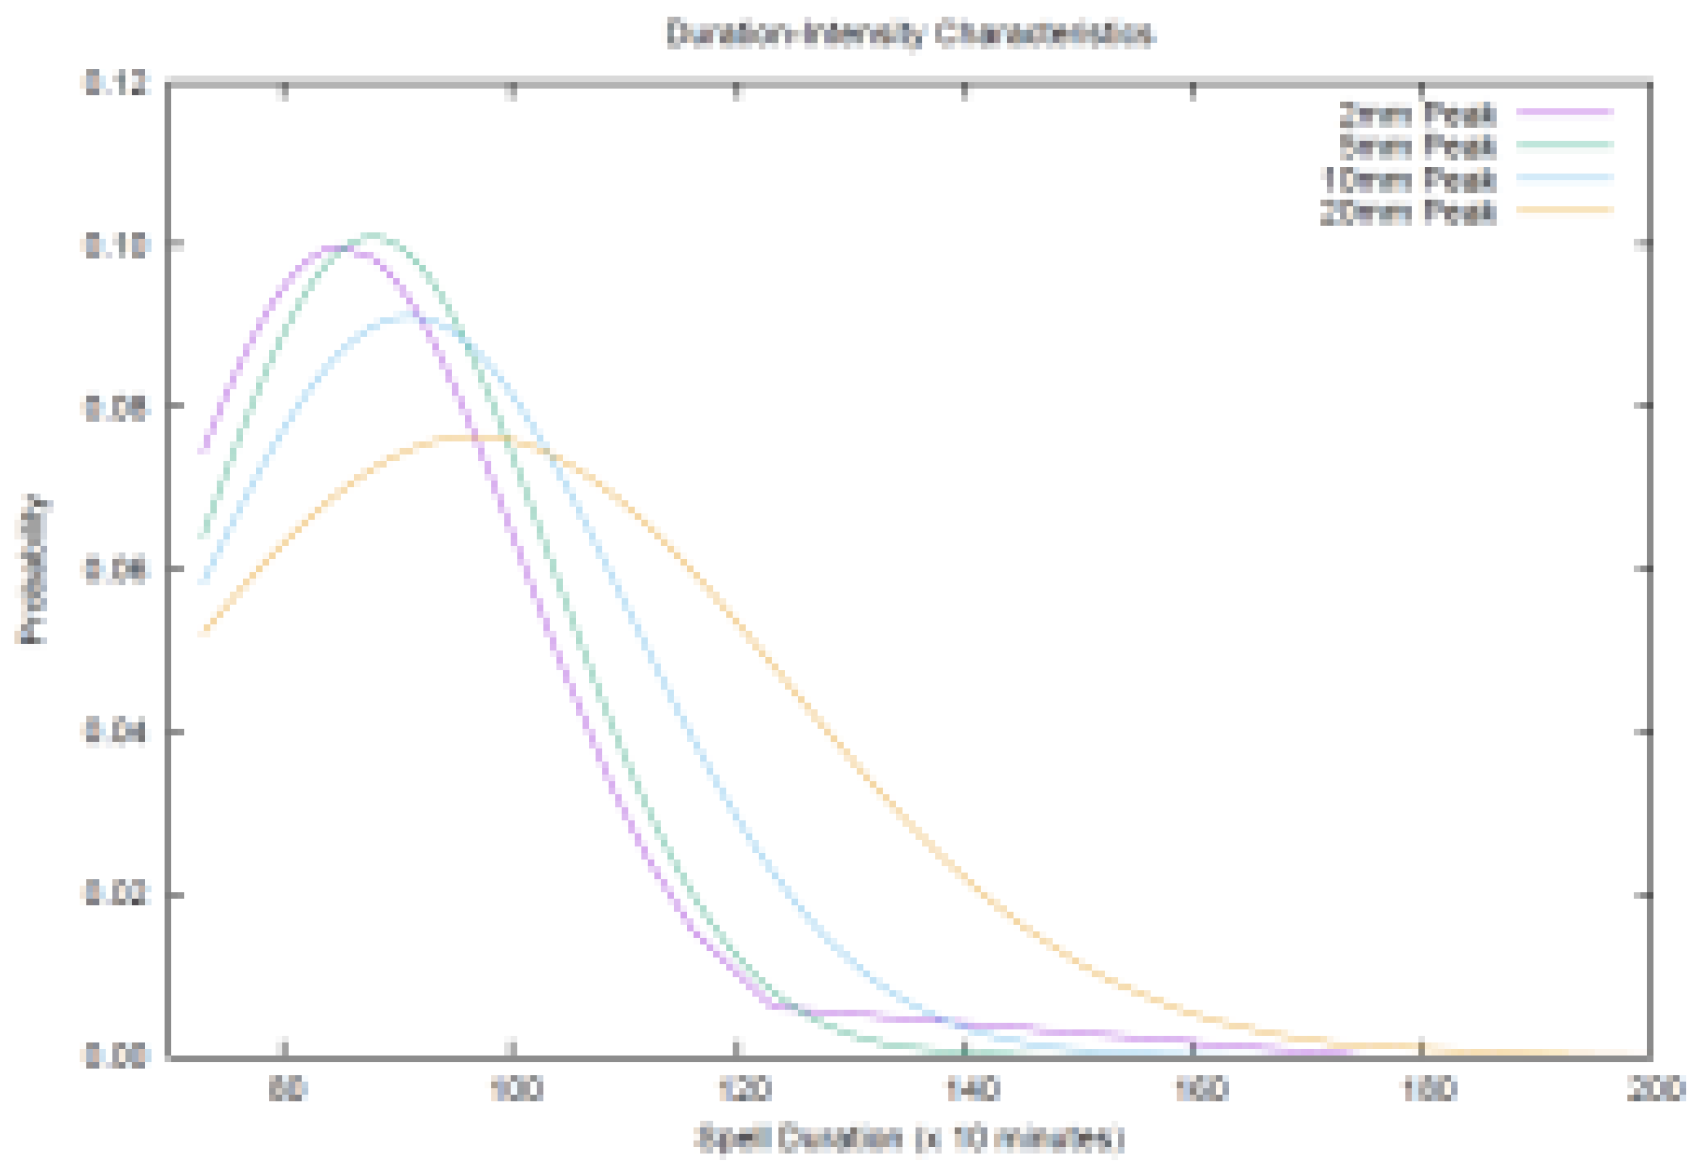
We extended our analysis to discuss the rainfall characteristics from the wet events whose spell duration last for at least 12 hours (
Figure 6).
This characteristic is the key importance of flooding. The analysis of longer spell wet events indicates that the ~15hrs spell duration with 2-10mm/10min peak intensity events occurs more frequently than longer duration events (
Figure 6).
These results highlight the importance of analyzing high-resolution, sub-daily rainfall data to better understand the dynamics of extreme rainfall events. For example, the Clausius-Clapeyron relationship indicates that as temperatures rise, the atmosphere can hold approximately 7% more water vapor per degree Celsius. This increase in atmospheric moisture can lead to more intense rainfall events over shorter timescales [
8,
9,
10,
11]. Such extreme precipitation events not only increase the risk of flash flooding but also contribute to other climate-related impacts, such as rising sea levels due to increased runoff into oceans and damage to forest ecosystems from soil saturation and erosion [
12,
13,
14,
15,
16,
17,
18]. High-resolution rainfall data are therefore critical for accurately assessing these risks and preparing for the potential impacts of climate change on various environmental systems [
19,
20,
21,
22,
23,
24,
25].
4. Conclusions
In this study, we analyzed the characteristics of rainfall events from very high timescale (10min) observations across Japan to discuss the spell durations for rain exceeding various thresholds and the peak intensity events associated with rain spell durations. Our results infer that the heavy rainfall events over Japan last for shorter duration and the light rainfall events last for longer duration. The low peak intensity events are found to be short-lived, while the high peak intensity events are long-lived. The analysis of longer spell wet events (last for at least 12 hours) indicates that the very high peak rainfall intensity events (up to 10-20mm/10min) last up to 24-33hours.
Acknowledgments
This study was conducted as part of the research project "Research on evaluation of hazard and risk of natural disasters” (National Research Institute for Earth Science and Disaster Prevention; PI: Koji Dairaku) and was supported by the SOUSEI Program, funded by MEXT, Government of Japan. National Research Institute for Earth Science and Disaster Resilience (NIED) is acknowledged for providing the required facilities for conducting the research work.
References
- Kendon et al.Heavier summer downpours with climate change revealed by weather forecast resolution model. Nature Climate Change 2014, 4, 570–576. [CrossRef]
- Wakazuki, Y.; Nakamura, M.; Kanada, S.; Muroi, C. Climatological Reproducibility Evaluation and Future Climate Projection of Extreme Precipitation Events in the Baiu Season Using a High-Resolution Non-Hydrostatic RCM in Comparison with an AGCM. J. Meteorol. Soc. Jpn. Ser. II 2008, 86, 951–967. [Google Scholar] [CrossRef]
- Morimoto, J.; Aiba, M.; Furukawa, F.; Mishima, Y.; Yoshimura, N.; Nayak, S.; Takemi, T.; Chihiro, H.; Matsui, T.; Nakamura, F. Risk assessment of forest disturbance by typhoons with heavy precipitation in northern Japan. For. Ecol. Manag. 2021, 479, 118521. [Google Scholar] [CrossRef]
- Nayak, S. Do extreme precipitation intensities linked to temperature over India follow the Clausius–Clapeyron relationship? Current Science 2018, 115, 391–392. [Google Scholar] [CrossRef]
- Nayak, S.; Dairaku, K. Future changes in extreme precipitation intensities associated with temperature under SRES A1B scenario. Hydrol. Res. Lett. 2016, 10, 139–144. [Google Scholar] [CrossRef]
- Nayak, S. , & Mandal, M. Assessment of sea level and morphological changes along Indian coastal areas during 1975-2005. Earth Science India, 2019; 12, 117–125. [Google Scholar] [CrossRef]
- Nayak, S.; Takemi, T. Dependence of extreme precipitable water events on temperature. Atmos. 2019, 32, 159–165. [Google Scholar] [CrossRef]
- Berg, P.; Moseley, C.; Haerter, J.O. Strong increase in convective precipitation in response to higher temperatures. Nat. Geosci. 2013, 6, 181–185. [Google Scholar] [CrossRef]
- Jones, R.H.; Westra, S.; Sharma, A. Observed relationships between extreme sub-daily precipitation, surface temperature, and relative humidity. Geophys. Res. Lett. 2010, 37. [Google Scholar] [CrossRef]
- Nayak, S.; Takemi, T. Clausius-Clapeyron Scaling of Extremely Heavy Precipitations: Case Studies of the July 2017 and July 2018 Heavy Rainfall Events over Japan. J. Meteorol. Soc. Jpn. Ser. II 2020, 98, 1147–1162. [Google Scholar] [CrossRef]
- Nayak, S.; Takemi, T. Atmospheric driving mechanisms of extreme precipitation events in July of 2017 and 2018 in western Japan. Dyn. Atmos. Oceans 2021, 93, 101186. [Google Scholar] [CrossRef]
- Nayak, S. , Mandal, M., & Adhikari, A. Estimation of Indian coastal areas inundated into the sea due to sea-level rise during the 20th century. Current Science 2013, 104, 583–585. [Google Scholar]
- Nayak, S.; Dairaku, K.; Takayabu, I.; Suzuki-Parker, A.; Ishizaki, N.N. Extreme precipitation linked to temperature over Japan: current evaluation and projected changes with multi-model ensemble downscaling. Clim. Dyn. 2018, 51, 4385–4401. [Google Scholar] [CrossRef]
- Sahu, R.K.; Choudhury, G.; Vissa, N.K.; Tyagi, B.; Nayak, S. The Impact of El-Niño and La-Niña on the Pre-Monsoon Convective Systems over Eastern India. Atmosphere 2022, 13, 1261. [Google Scholar] [CrossRef]
- Nayak, S.; Kanda, I. Examining the Effectiveness of Doppler Lidar-Based Observation Nudging in WRF Simulation for Wind Field: A Case Study over Osaka, Japan. Atmosphere 2023, 14, 972. [Google Scholar] [CrossRef]
- Sahu, R.K.; Nayak, S.; Singh, K.S.; Nayak, H.P.; Tyagi, B. Evaluating the impact of topography on the initiation of Nor’westers over eastern India. Geomatics, Nat. Hazards Risk 2023, 14. [Google Scholar] [CrossRef]
- Nayak, S. Exploring the Future Rainfall Characteristics over India from Large Ensemble Global Warming Experiments. Climate 2023, 11, 94. [Google Scholar] [CrossRef]
- Nayak, S. , & Takemi, T. (2022). Assessing the impact of climate change on temperature and precipitation over India. In T. Sumi et al., (Eds.), Wadi Flash Floods, Natural Disaster Science and Mitigation Engineering: DPRI Reports (pp. 121-142). Springer. [CrossRef]
- Nayak, S. , & Takemi, T. (2024). Climate change scenario over Japan: trends and impacts. In Khare (Ed.), The Role of Tropics in Climate Change (pp. 145-169), Elsevier Inc.
- Nayak, S.; Takemi, T.; Maity, S. Precipitation and Temperature Climatologies over India: A Study with AGCM Large Ensemble Climate Simulations. Atmosphere 2022, 13, 671. [Google Scholar] [CrossRef]
- Sahu, N.; Panda, A.; Nayak, S.; Saini, A.; Mishra, M.; Sayama, T.; Sahu, L.; Duan, W.; Avtar, R.; Behera, S. Impact of Indo-Pacific Climate Variability on High Streamflow Events in Mahanadi River Basin, India. Water 2020, 12, 1952. [Google Scholar] [CrossRef]
- Nayak, S.; Mandal, M. Impact of land use and land cover changes on temperature trends over India. Land Use Policy 2019, 89, 104238. [Google Scholar] [CrossRef]
- Nayak, S. , & Mandal, M. (2012). Impact of land-use and land-cover changes on temperature trends over Western India. Current Science, 102(8), 1166-1173.
- Saini, A.; Sahu, N.; Kumar, P.; Nayak, S.; Duan, W.; Avtar, R.; Behera, S. Advanced Rainfall Trend Analysis of 117 Years over West Coast Plain and Hill Agro-Climatic Region of India. Atmosphere 2020, 11, 1225. [Google Scholar] [CrossRef]
- Trošelj, J.; Nayak, S.; Hobohm, L.; Takemi, T. Real-time flash flood forecasting approach for development of early warning systems: integrated hydrological and meteorological application. Geomatics, Nat. Hazards Risk 2023, 14. [Google Scholar] [CrossRef]
|
Disclaimer/Publisher’s Note: The statements, opinions and data contained in all publications are solely those of the individual author(s) and contributor(s) and not of MDPI and/or the editor(s). MDPI and/or the editor(s) disclaim responsibility for any injury to people or property resulting from any ideas, methods, instructions or products referred to in the content. |
© 2024 by the authors. Licensee MDPI, Basel, Switzerland. This article is an open access article distributed under the terms and conditions of the Creative Commons Attribution (CC BY) license (http://creativecommons.org/licenses/by/4.0/).
