Preprint
Article

Combined Effect of Temperature and Different Light conditions on the photosynthetic activity and Lipid Accumulation in the Diatom Phaeodactylum tricornutum

Submitted:

04 November 2024

Posted:

04 November 2024

You are already at the latest version

Abstract
We have investigated the individual and combined effects of temperature and light on the physi-ology of the diatom Phaeodactylum tricornutum, a model organism widely used for studies on diatom physiology and ecology and biofuel production. Our results show that the combination of changes in temperature and light intensity affects growth rates, the content of pigments and active photosystems, photosynthetic efficiency, lipid production and fatty acid composition of P. tricornutum. Measurements of the maximum electron transport rate (rETRmax) and rETR at maximum PAR, confirmed that in P. tricornutum light sensitivity is substantially higher as the growth temperature increases under light/dark cycles of two light intensities (25-60 µmol m-2 s-1) but it is just the opposite under continuous light (25 µmol m-2 s-1). Furthermore, higher rETRmax were observed at higher ir-radiance (either in intensity or in a continuous light time regime) at the two temperatures tested. On the other hand, increasing light intensity amplifies the observed effect of temperature on photo-system I (PSI) activity in light/dark regimes, but not in continuous light conditions, leading to a greater deficiency in PSI activity, due to limitations in the electron supply to this photosystem. Moreover, the change in the culture temperature from 20°C to 25°C triggers an increase in the number and size of cytoplasmic lipid droplets under conditions of increased light intensity, but even more drastically under continuous illumination. It should be noted that the combination of a temperature of 25°C and continuous illumination in P. tricornutum cell cultures causes a drastic increase of triacylglycerides, and a change in the composition of total fatty acids that is optimal for a possible use as biodiesel.
Keywords: 
Subject: 
Biology and Life Sciences  -   Biology and Biotechnology

1. Introduction

Understanding the effects of increasing temperature on phytoplankton growth and photosynthetic efficiency is a major challenge in addressing climate change. Diatoms are a group of eukaryotic microalgae found in marine and freshwater habitats considered to represent both the dominant life form in oceanic phytoplankton and the largest group of biomass producers on Earth [1]. In addition to their key role in the global carbon cycle and ecological relevance, several diatom strains represent a promising option as feedstock to produce biodiesel and high added value compounds [2]. Diatoms are also used in aquaculture as feed source, due to their highly valued nutritional profile, which includes a high protein to carbohydrate ratio and elevated levels of highly unsaturated fatty acids (HUFAs) [3,4].
Environmental factors, such as temperature or light intensity, can influence the growth, survival, and distribution of diatoms, as well as their biotechnological performance [5,6]. Diatoms have an optimal temperature range for growth, and temperatures outside this range can lead to reduced growth rates or even death [7]. Therefore, understanding the thermal tolerance of diatoms is a major challenge to predict how they will respond to changes in global climate. Studies on temperature tolerance in diatoms have been conducted to understand their response to thermal stress in cell growth and productivity, including the effects of temperature on photosynthesis, growth rates, cell size and nutrient uptake [7,8,9,10,11]. These studies have revealed that diatoms have complex mechanisms for coping with changes in temperature, including alterations in cell membranes –mainly in lipid composition–, changes in the levels and composition of their photosynthetic pigments, and alterations in their metabolic processes [7,10,11].
Phaeodactylum tricornutum is a coastal marine diatom used as a model organism for studies on diatom physiology and ecology, as well as in biotechnology and biofuel production [12,13]. The optimal temperature for the growth of P. tricornutum is about 20°C, growth rates declining significantly above and below this value [7,14]. Several studies have investigated the temperature tolerance of P. tricornutum, with a focus on the effects of temperature on growth rates, lipid accumulation and photosynthetic efficiency [7,10,11].
Changes of temperature alter membrane lipids production and composition in diatoms. Generally, there is an inverse relationship between temperature and degree of lipid desaturation [10,15]. At low temperature, P. tricornutum increases the unsaturation of its membrane lipids to maintain membrane fluidity, while at elevated temperatures an increased saturation of the cellular and thylakoid membranes fatty acids is observed [9,10,15,16]. In addition to lipid metabolism, temperature also influences the photosynthetic performance of diatoms. P. tricornutum is generally able to carry out efficient photosynthesis in the range of temperature close to its optimal growth temperature. However, the photosynthetic rate decreases when this optimal temperature is exceeded [10]. This limitation produces an excess of light energy and causes photoinhibition, mainly damaging photosystem II (PSII), which is the most thermosensitive component of the photosynthetic apparatus [17]. The reported transcriptomic response of P. tricornutum to elevated temperatures has shown that this organism downregulates genes involved in photosynthesis but activates signaling pathways involved in fatty acid and nitrogen metabolism [11].
Many of the response mechanisms to temperature changes in microalgae are also observed in their reaction to high light levels [5]. It is well established that growth rate increases with increasing light until the maximum growth rate is reached, after which growth may decrease due to photoinhibition [18]. In this sense, P. tricornutum has developed several strategies to cope with stress by excess light. These adaptations include: i) the adjustment of photosynthetic apparatus by altering the composition and activity of the photosynthetic complexes, to protect the photosynthetic machinery from damage caused by excess light; ii) the activation of non-photochemical quenching (NPQ) mechanisms to dissipate excess light energy as heat, to prevent the formation of reactive oxygen species (ROS); iii) an enhanced PSII repair; and iv) the favoring of cyclic electron flow to optimize ATP production while minimizing the risk of ROS production [2,19]. On the other hand, high light conditions are known to trigger the accumulation of neutral lipids, mainly in the form of triacylglycerides (TAGs), which are stored as reserve lipids in organelles called lipid droplets (LDs) [20,22]. In this way, diatoms redirect carbon metabolism towards the production of energy-rich lipids, accumulated within LDs, which can be rapidly degraded and recycled when conditions become optimal [21,22].
The effects of temperature and light on marine diatoms have been studied and characterized in an independent way; however, fewer studies have reported the combined effect of the interaction of temperature and light on these organisms [23,24]. It has been shown that the response of photosynthesis to temperature depends on the available light (both in intensity and type of light), being very different at sub saturating light levels than at saturating levels [25]. In fact, some studies have shown that the photosynthetic apparatus shows greater thermal stability at low than at high irradiances [26].
This study examines the combined effect of temperature and light on cell growth, photosynthetic activity and the accumulation of neutral lipids, mainly in the form of TAGs stored in LDs, in the model marine diatom Phaeodactylum tricornutum, considered a potential resource for biodiesel production.

2. Results

2.1. Influence of Temperature under Two Different Light Intensities in Light/Dark Regime.

The growth of P. tricornutum cells was studied under light/dark cycles of a moderate radiation of 25 µmol m-2 s-1 (standard light conditions, SL) and 60 µmol m-2 s-1 (high light conditions, HL) at two different temperatures, 20°C and 25°C, corresponding to optimal and higher temperature conditions, respectively [14]. A decreased growth was observed at 25°C compared to 20°C at both SL and HL conditions, measured as lower values for the final number of cells per mL of culture and specific growth rates (µ) (Table 1). This decreased growth was greater under SL conditions (a decrease to ≈74% in both cells number per mL and µ) as compared to HL (decrease to ≈80-90% in both cells number and µ) (Table 1). It should be noted that HL, both at 20°C and 25°C, promoted only a small increase in the cell growth of P. tricornutum (Table 1), indicating that this light intensity (60 µmol m-2 s-1) is already close to light saturation in our culture conditions, as previously reported [27].
It has been described that P. tricornutum cells exposed to warmer temperatures showed a reduced photosynthetic efficiency but an increase in the content of photosynthetic pigments [10]. Consistently, the content per cell of total Chl and carotenoids determined under SL and HL conditions increased when the temperature was increased from 20°C to 25°C (Table 1). While this increase was not relevant under SL conditions, under HL conditions the temperature change from 20°C to 25°C did cause a clear increase in total Chl (up to 135%) and carotenoids (up to 200%) values (normalised per cell) (Table 1).
Diatoms contain Chl a as the primary pigment in photosynthesis, while Chl c acts as an accessory pigment in the light-harvesting antennae, improving photosynthesis by optimizing the efficiency of light energy capture and transfer [28]. The proportion Chl a/Chl c is thus an indicator of the ratio of the photosynthetic reaction center/antenna complex that can vary in terms of light availability, enhancing light capture under low-light conditions, or increasing at higher light intensities [28]. As can be seen in Table 1, the absolute values for this ratio are higher under HL conditions as compared to SL (≈140%; Table 1). However, both under SL and HL conditions, the increase in temperature from 20°C to 25°C also promotes a similar increase in the Chl a/Chl c ratio.
The global photosynthetic activity of the cultures under SL and HL conditions was also determined by measuring the net oxygen evolution (Table 1). As expected, in both cases the highest value of the net photosynthetic activity, normalized per cell, was obtained at the optimum temperature of 20°C compared to 25°C. However, while under SL conditions a more drastic decrease (up to ≈60%) in the normalized net photosynthetic activity per cell was observed at 25°C compared to 20°C, under HL conditions the photosynthetic activity decreased to a much lesser extent (up to ≈80%) when increasing temperature (Table 1).
Changes in cell morphology at the two different temperatures and light intensities were studied in vivo by fluorescence microscopy (Figure 1). Microscopy morphological analysis of cells cultured under SL conditions, and its comparison with HL conditions, showed no apparent differences in the morphology and size of the cells grown at the different temperatures and light intensities (Figure 1). In both cases, the typical fusiform morphotype largely predominates, although cells grown at 25°C occasionally showed the formation of intergranules that can be assigned to lipid droplets (LDs), more abundant at HL (Figure 1, and see below). It has been previously described that under stress conditions P. tricornutum increases lipid accumulation [21,22]. Thus, the production of neutral lipids, stored as LDs, was qualitatively analyzed in cells cultured under SL and HL conditions at the two temperatures investigated. Using cell staining with NR and fluorescence microscopy (Figure 1) [29], the content of neutral lipids was highlighted, this content being proportional to the detected yellow fluorescence intensity of the cells [30]. Although cells grown at 20°C showed some fluorescence associated with NR staining and the appearance of LDs, fluorescence was significantly higher at 25°C in both under SL and HL conditions, indicating the accumulation of neutral lipids (Figure 1).
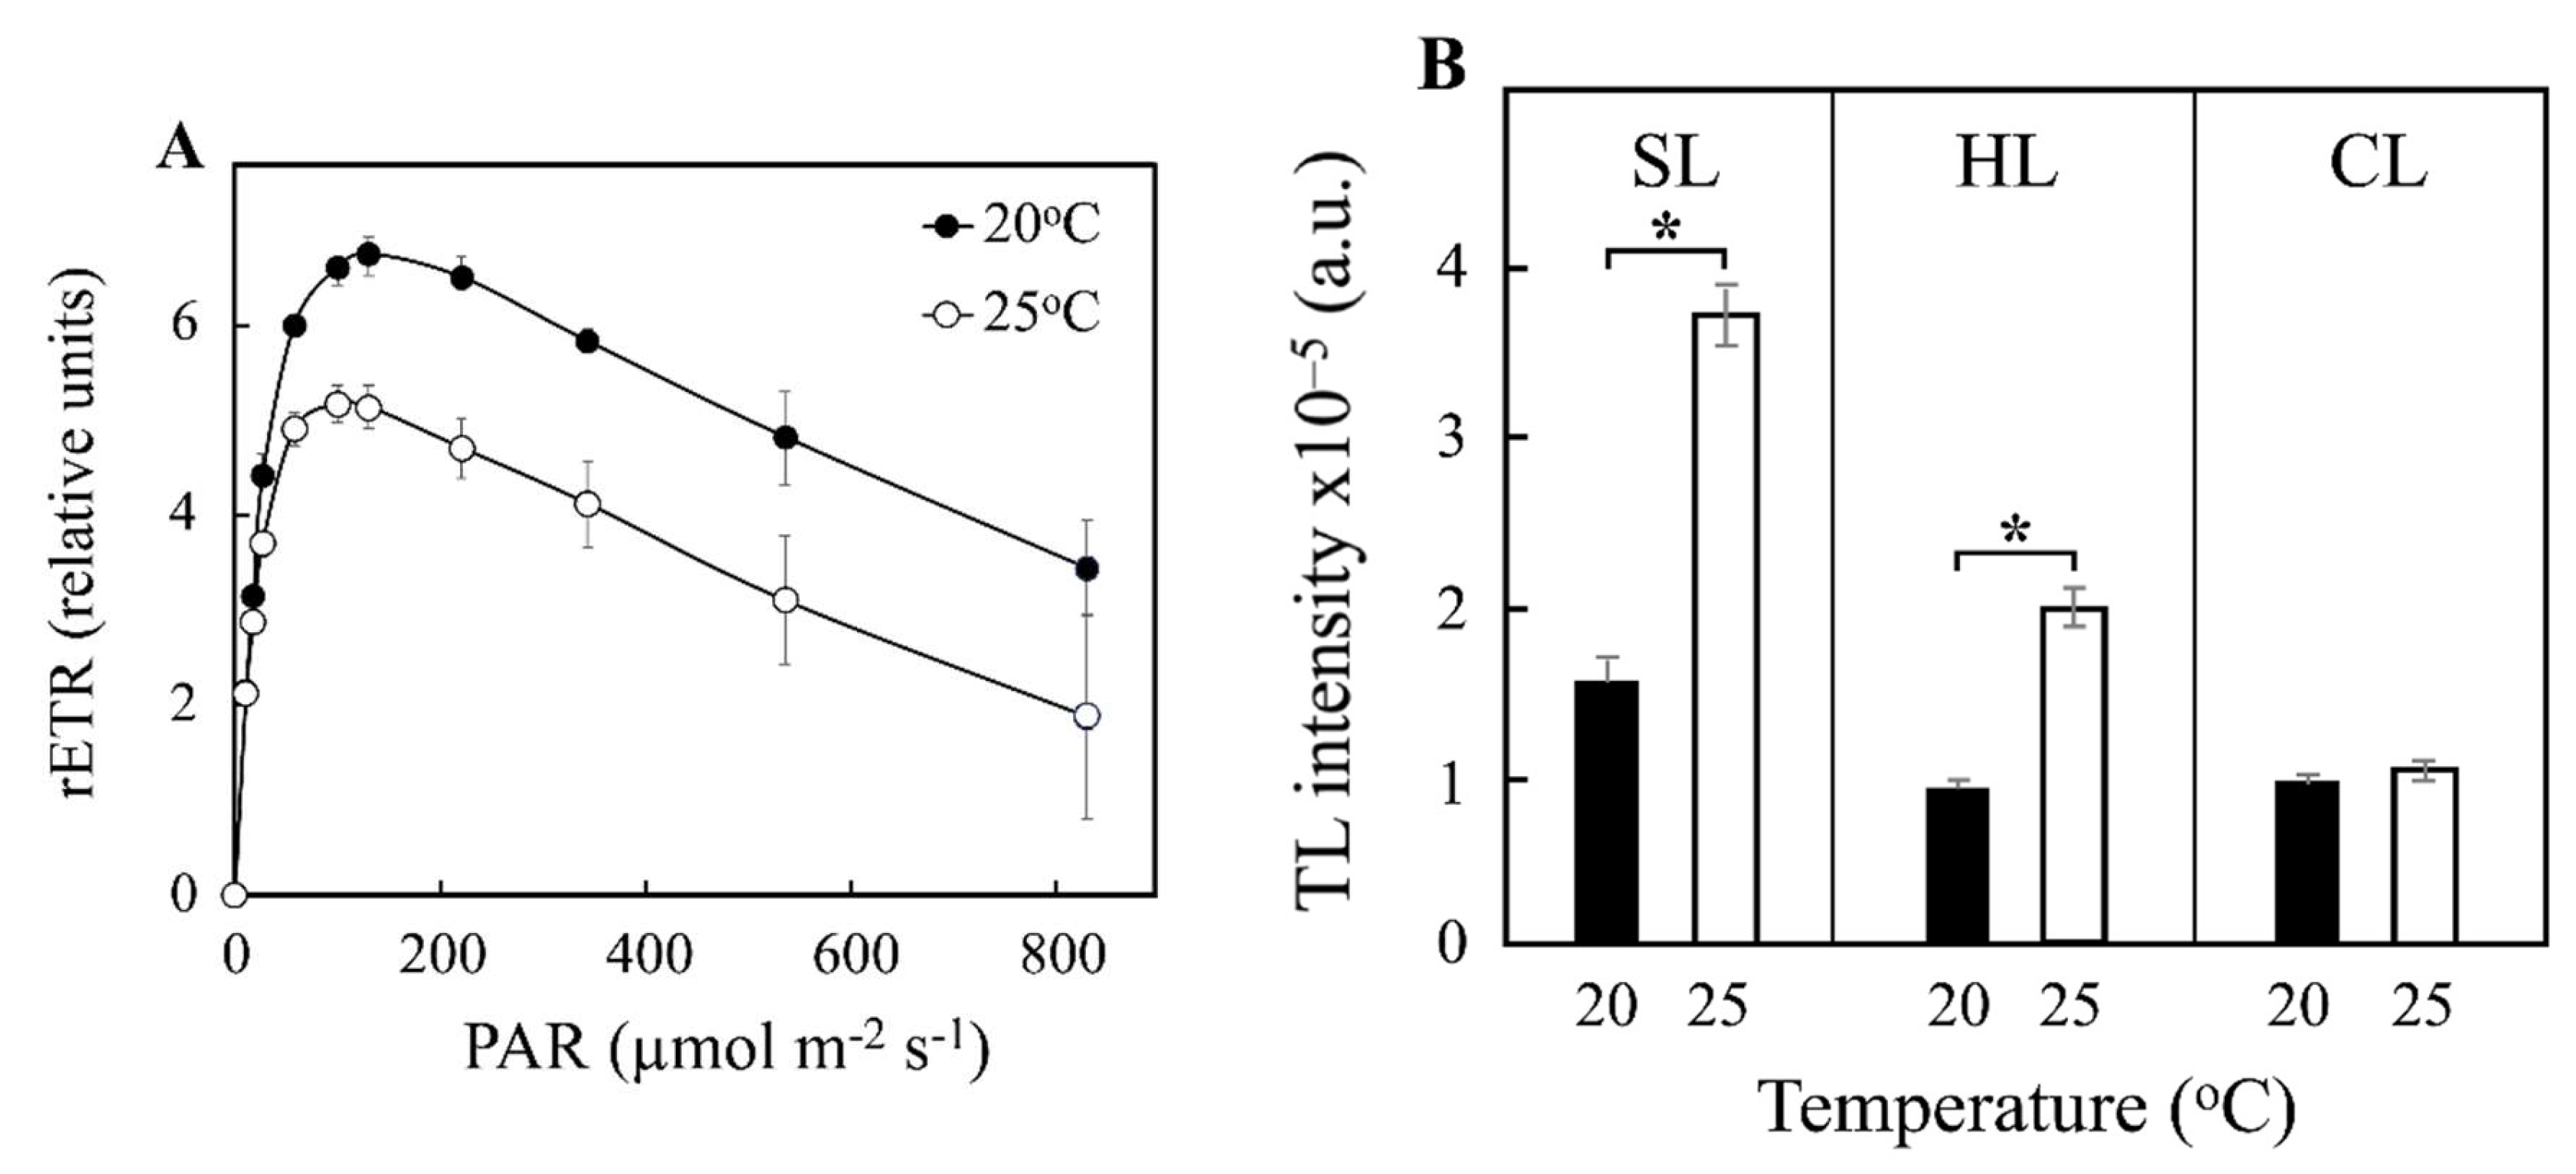
The combined effects of temperature and light intensity on the photosynthetic activities of P. tricornutum cells have been further studied. First, the effects of temperature on PSII activity were investigated by measurements of Chl a fluorescence using a DUAL-PAM fluorometer. As can be seen in Table 1, a moderate, but statistically significant increase (p-values < 0.05), of the maximum quantum yield of PSII values, Fv/Fm, was observed when increasing temperature in both SL and HL conditions. Rapid light curves (RLCs) of cell cultures under SL and HL illumination at 20°C and 25°C were also carried out, Figure 2A showing the data obtained under SL conditions as an example. In RLCs, when cells are exposed to gradually increasing light intensities, the relative electron transport rate (rETR, i.e., the ratio between absorbed light quanta and transported electrons) increases in parallel up to its limit capacity, corresponding to its maximum electron transport rate (rETRmax; Figure 2A and Table 1). Beyond this point, increasing light intensity induces photoinhibition, i.e., a decrease of the rETR (Figure 2A) [31,32,33]. As shown in Table 1, the rETRmax calculated from the analysis of the RLCs was temperature sensitive, values decreasing with increasing temperature from 20°C to 25°C in both SL and HL conditions (Table 1). However, values for rETRmax were lower under SL conditions as compared to HL (≈7 to 5 versus ≈12 to 8; Table 1). A similar behaviour was observed when comparing rETR values at the highest light intensity tested (PARmax ≈830 µmol m-2 s-1), with a decrease in these values with increasing temperature from 20°C to 25°C in SL and HL conditions (Table 1). Again, the values for rETR values (at PARmax) were lower under SL conditions as compared to HL (from ≈3.4 to 1.9 versus ≈11.3 to 6.8; Table 1). Taken together, these results confirmed a substantially higher rETRmax at higher intensity of irradiance at each temperature for P. tricornutum, but also a significantly higher light sensitivity as the growth temperature increases.
The thermoluminescence (TL) technique was also used to study the effect of temperature on the electron transfer activity of PSII from P. tricornutum cells cultured under SL and HL conditions (Figure 2B and supplementary Figure S1). Under SL conditions, excitation of P. tricornutum cells with two flashes at 1°C induced the appearance of TL glow curves, with significant differences in signal intensity depending on temperature culture conditions (supplementary Figure S1). A similar significant decrease in the total TL signal intensity (of ≈50-60%) was observed in cells grown at 20°C in comparison with cells grown at 25°C under both SL and HL conditions (Figure 2B). However, the signal intensity at each temperature was significantly higher (≈2 times) at SL conditions compared to HL (Figure 2B).
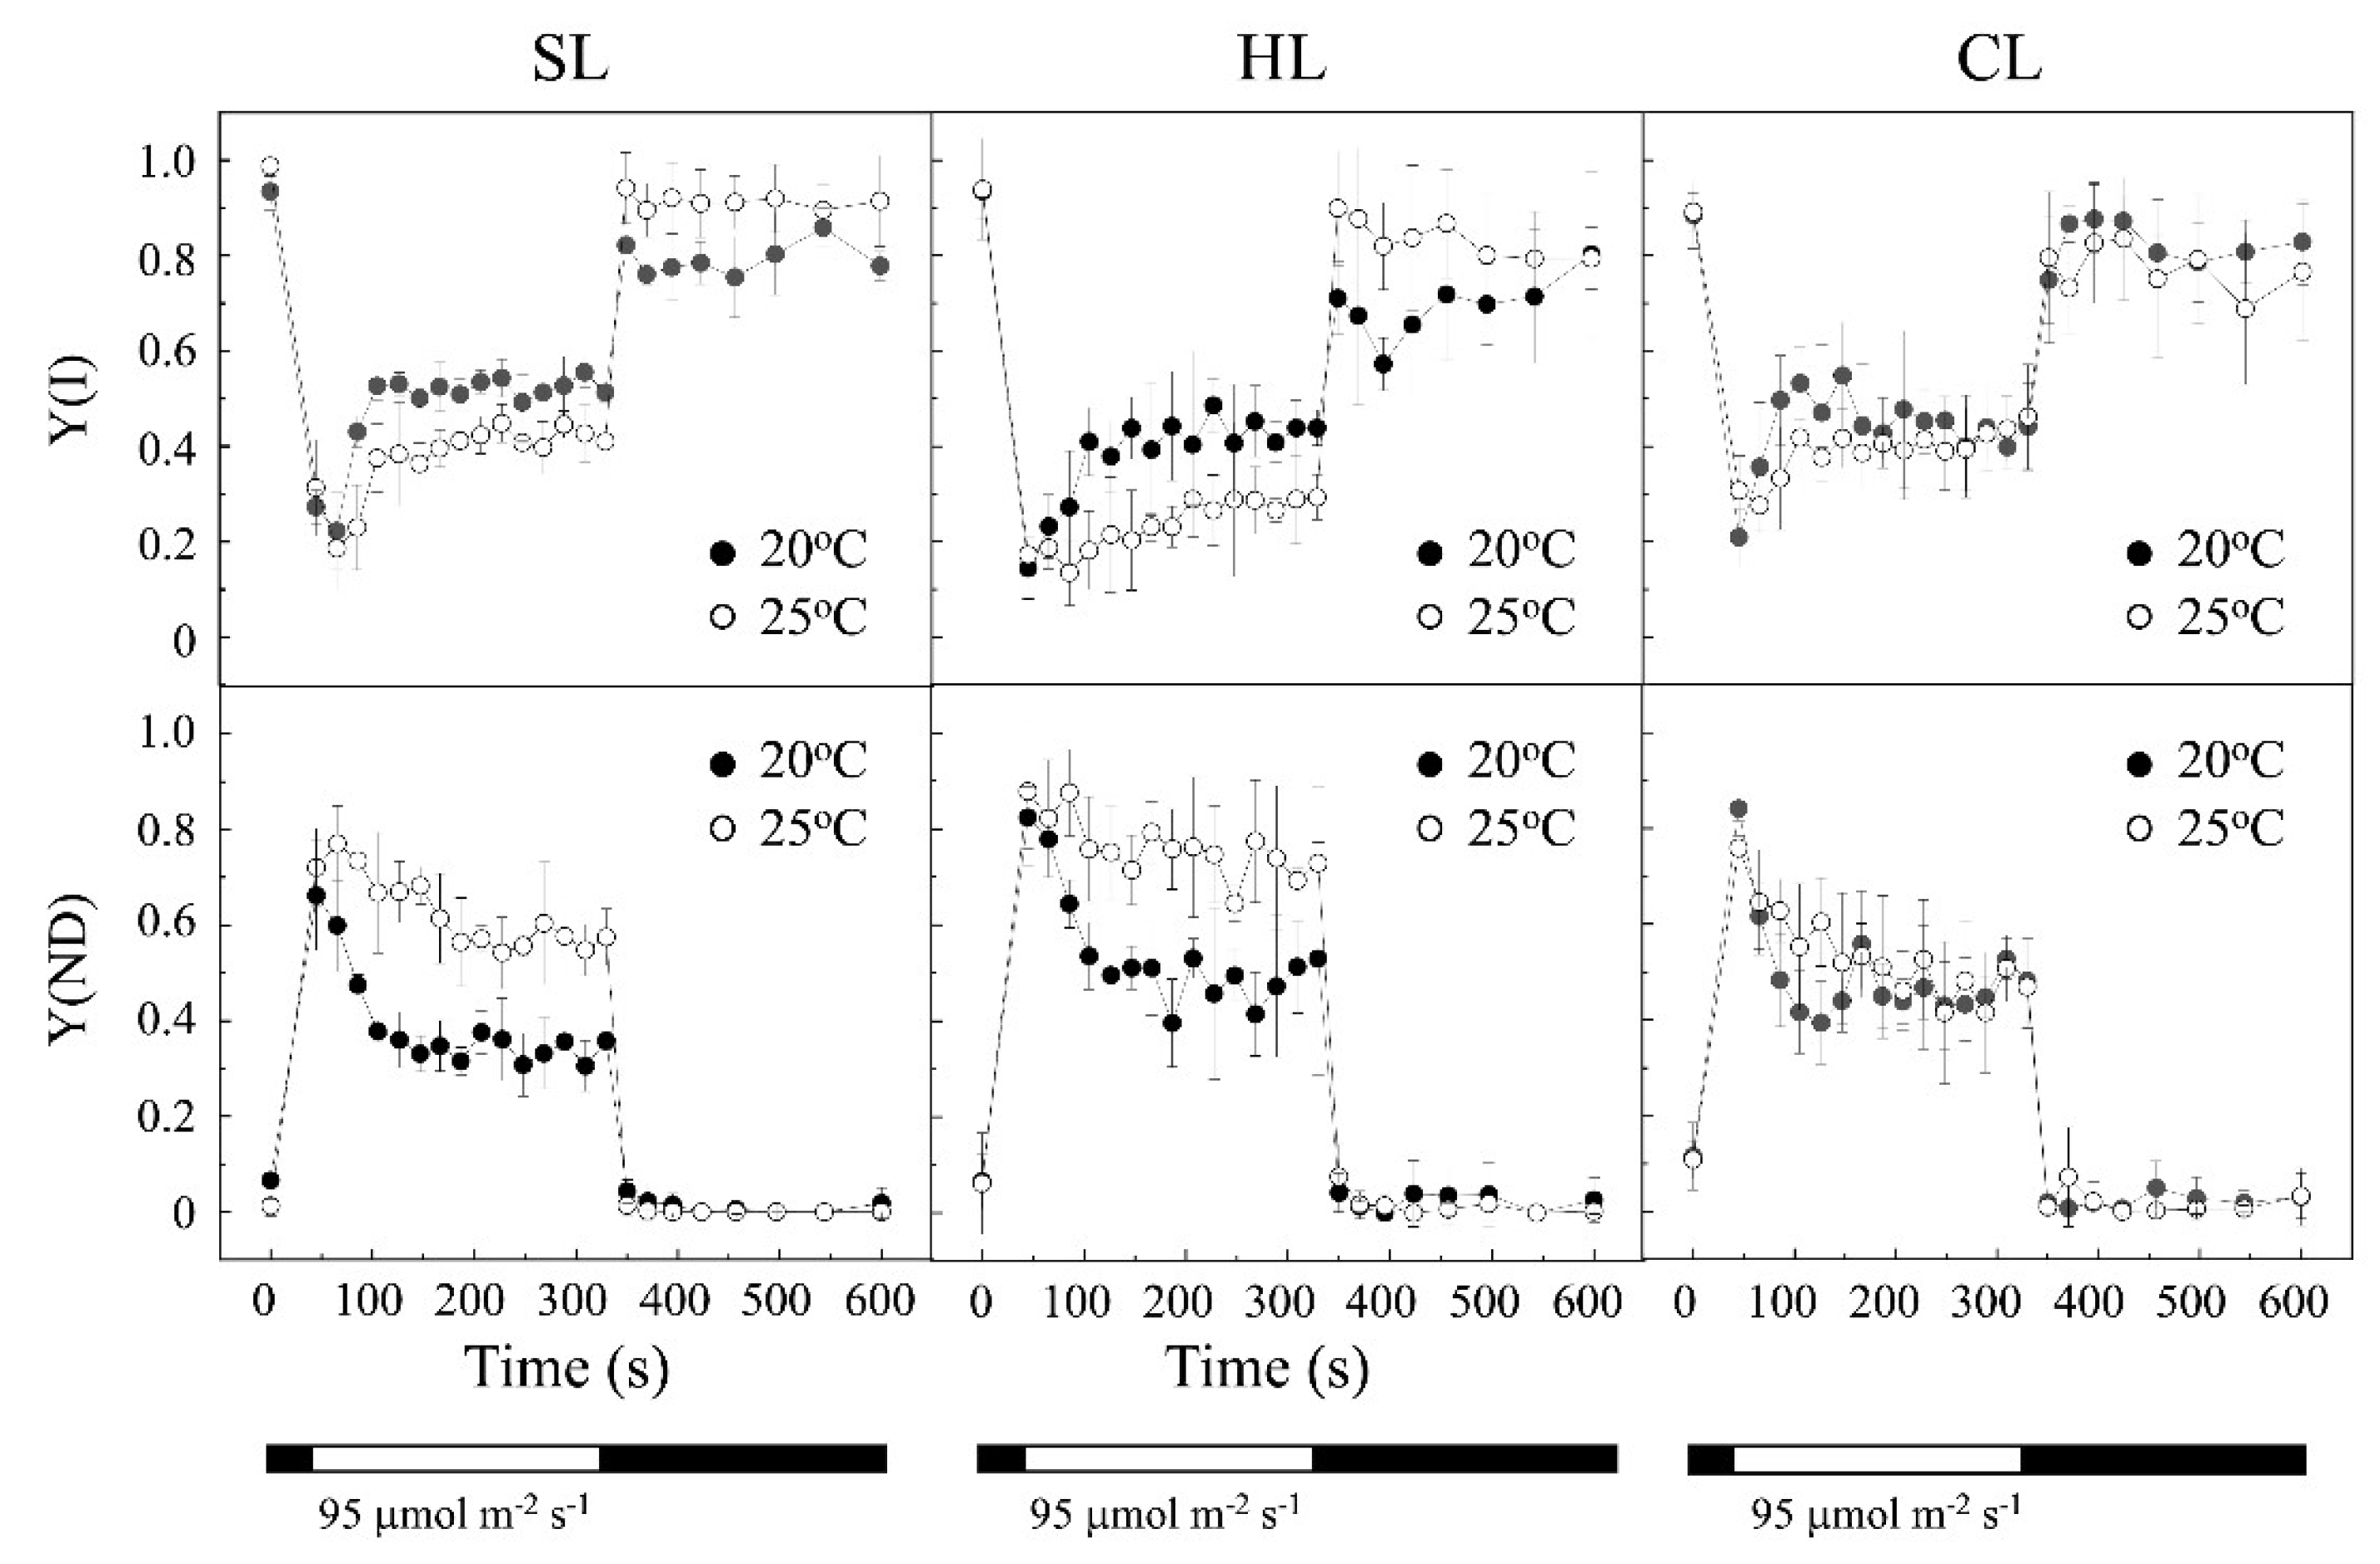
The effect of temperature on PSI activity from P. tricornutum cells cultured under SL and HL conditions was also investigated by measuring the P700 redox state changes during illumination (Figure 3), as previously described [32,33]. In dark-adapted cultures, P700 is reduced, since the acceptor side of P700, i.e., the Calvin-Benson cycle and subsequent reactions, are deactivated. Under actinic light, P700 is first oxidized and then re-reduced by electrons coming from the plastoquinone (PQ) pool; thus, by applying saturating pulses, its ability to become oxidized and re-reduced can be determined [32,33]. Induction-recovery curves were first performed in cell cultures grown at both 20°C and 25°C under SL conditions, showing that the calculated quantum yield of PSI photochemistry, Y(I), decreased at 25°C compared to 20°C (Figure 3, upper). On the other hand, a higher degree of donor side limitations, Y(ND), was also observed in cells cultured at 25°C compared to 20°C (Figure 3, lower). A lower Y(I) in cells cultured at 25°C would indicate a loss of the PSI activity because of the lack of availability of electron donors to PSI in the light [32,33]. On the other hand, HL conditions promoted a minor Y(I) and a higher Y(ND) compared to SL condition (Figure 3), showing a more marked effect at 25°C. The lower Y(I) of cells cultured at HL seems to indicate again a deficiency in PSI activity by a limitation in providing electrons to this photosystem, probably induced by the higher irradiance. Thus, it appears that increasing light intensity amplifies the previously observed temperature effect by producing a greater deficiency in PSI activity, due to limitations in providing electrons to PSI in high light. In contrast, small and similar acceptor-side limitations, Y(NA), were observed in all the conditions of temperature and illumination studied (data no shown).
The values of maximal P700+ signal upon full oxidation (Pm) were measured, at both SL and HL conditions, as previously described [32,33]. After illumination with FR light and thereafter with a saturating light pulse, P700 became oxidized and reached a maximal level of P700+. The amplitude values obtained show that Pm increased at both light conditions when increasing temperature from 20°C to 25°C (Table 1). Thus, the observed deficiency in PSI activity does not correlate with a lower amount of photochemically active PSI centres. In addition, Pm showed higher absolute values at SL conditions, in comparison with HL, in particular at 25°C (≈1.7 times higher; Table 1). Therefore, these results indicate a lower amount of photochemically active PSI at higher irradiance and lower temperature in P. tricornutum.

2.2. Influence of Temperature under Continuous Light

The response of cells cultured at 20°C and 25°C under continuous illumination conditions (CL) was analysed. Comparison between SL and CL conditions (both at 25 µmol m-2 s-1) allowed to observe some particularities in the response to the temperature change from 20°C to 25°C under constant illumination, although in both illumination regimes a similar decrease in µ rates was determined with increasing temperature (Table 1). However, similarly high values for the Chl c content were observed under CL conditions at 20°C and 25°C as compared to SL conditions (≈1.7 times higher; not shown). This translates into a decrease in the Chl a/Chl c ratio under CL conditions, more particularly at 25°C (Table 1), indicating a lower ratio of the photosynthetic reaction centre/antenna complex. In addition, carotenoids content decreases drastically under CL conditions with increasing temperature, in contrast to SL conditions, in which carotenoids levels were maintained (Table 1).
Morphological analysis of cells cultured under CL conditions, and its comparison with SL conditions, showed no apparent differences in the morphology and size of the cells grown at the different temperatures and light intensities (Figure 1). In addition, no differences in the size of LDs are apparent in representative fluorescence microscopy images (associated with NR staining) of cells cultured at 20°C under SL and CL conditions (Figure 1). However, cells cultured at 25°C, and CL showed a pronounced increase in NR fluorescence and a big number of large LDs, indicating an abundant accumulation of neutral lipids (Figure 1, and see below).
The PSII activity response of P. tricornutum cells grown at 20°C and 25°C under CL illumination condition was also assessed by measurements of Chl a fluorescence. As can be seen in Table 1, under continuous light the Fv/Fm values are slightly lower than those observed under SL conditions, but remain unchanged with increasing temperature, in contrast to the increase observed under SL conditions. This translates especially into a lower Fv/Fm at 25°C under CL conditions compared to SL (0.58 versus 0.66; Table 1). However, rETRmax was higher under CL compared with SL conditions at both 20°C and 25°C, with a value 2 times higher at 25°C (≈10.5 versus 5.2; Table 1). An intriguing result is that rETRmax values decrease with increasing temperature from 20°C to 25°C in SL and HL conditions, while this value increases with temperature in CL conditions (Table 1). A similar behaviour was observed when comparing the values of rETR at PARmax, the values decreasing with increasing temperature from 20°C to 25°C in SL and HL conditions but increasing under CL conditions (Table 1). Consequently, the absolute values for rETR at PARmax were sensibly higher (2 to 7 times) under CL conditions compared to SL (Table 1). On the other hand, the signal intensity of the TL glow curves obtained in P. tricornutum cells grown under CL was similarly low for the two temperatures, in contrast to the increase at higher temperature observed under SL and HL conditions (Figure 2B).
Induction-recovery curves were also performed to analyse the response of PSI activity of P. tricornutum cells cultured at 20°C and 25°C under CL conditions (Figure 3). Interestingly, in contrast to what occurred under light/dark cycles, both in SL and HL conditions, in CL conditions no significant changes were observed in Y(I), nor in Y(ND), when increasing the temperature from 20°C to 25°C (Figure 3). However, as in the SL and HL conditions, a low Y(NA) was observed (data not shown). Overall, the imbalance caused by CL appears to cancel the effect of the temperature increase. The Pm values of the P. tricornutum cells cultured at 20°C and 25°C under CL illumination condition were also determined. Table 1 shows that Pm values increased in this light condition when increasing temperature from 20°C to 25°C, as also observed previously under SL (and HL) conditions (Table 1). However, Pm showed lower absolute values at CL, in comparison with SL conditions, in particular at 25°C (Table 1); actually, the Pm values obtained under CL and HL conditions are similar at each temperature (Table 1). Therefore, these results indicate a lower amount of photochemically active PSI at higher irradiance (either in intensity or time regime) and temperature in P. tricornutum.

2.3. Combined Effect of Temperature and Light Regimes on Lipid Content and Fatty Acid Composition

The appearance of lipid droplets when using the NR technique indicates the accumulation of lipids in P. tricornutum cells under conditions of increased temperature and illumination, particularly in HL and CL conditions at 25°C (Figure 1). P. tricornutum has a great commercial potential due to its high lipid content, a factor of interest in both the aquaculture industry and biodiesel production [12,13]. Consequently, we have carried out a deeper analysis on the changes in lipid content and composition in P. tricornutum cells under SL, HL and CL light intensities in cultures grown at 20°C and 25°C.
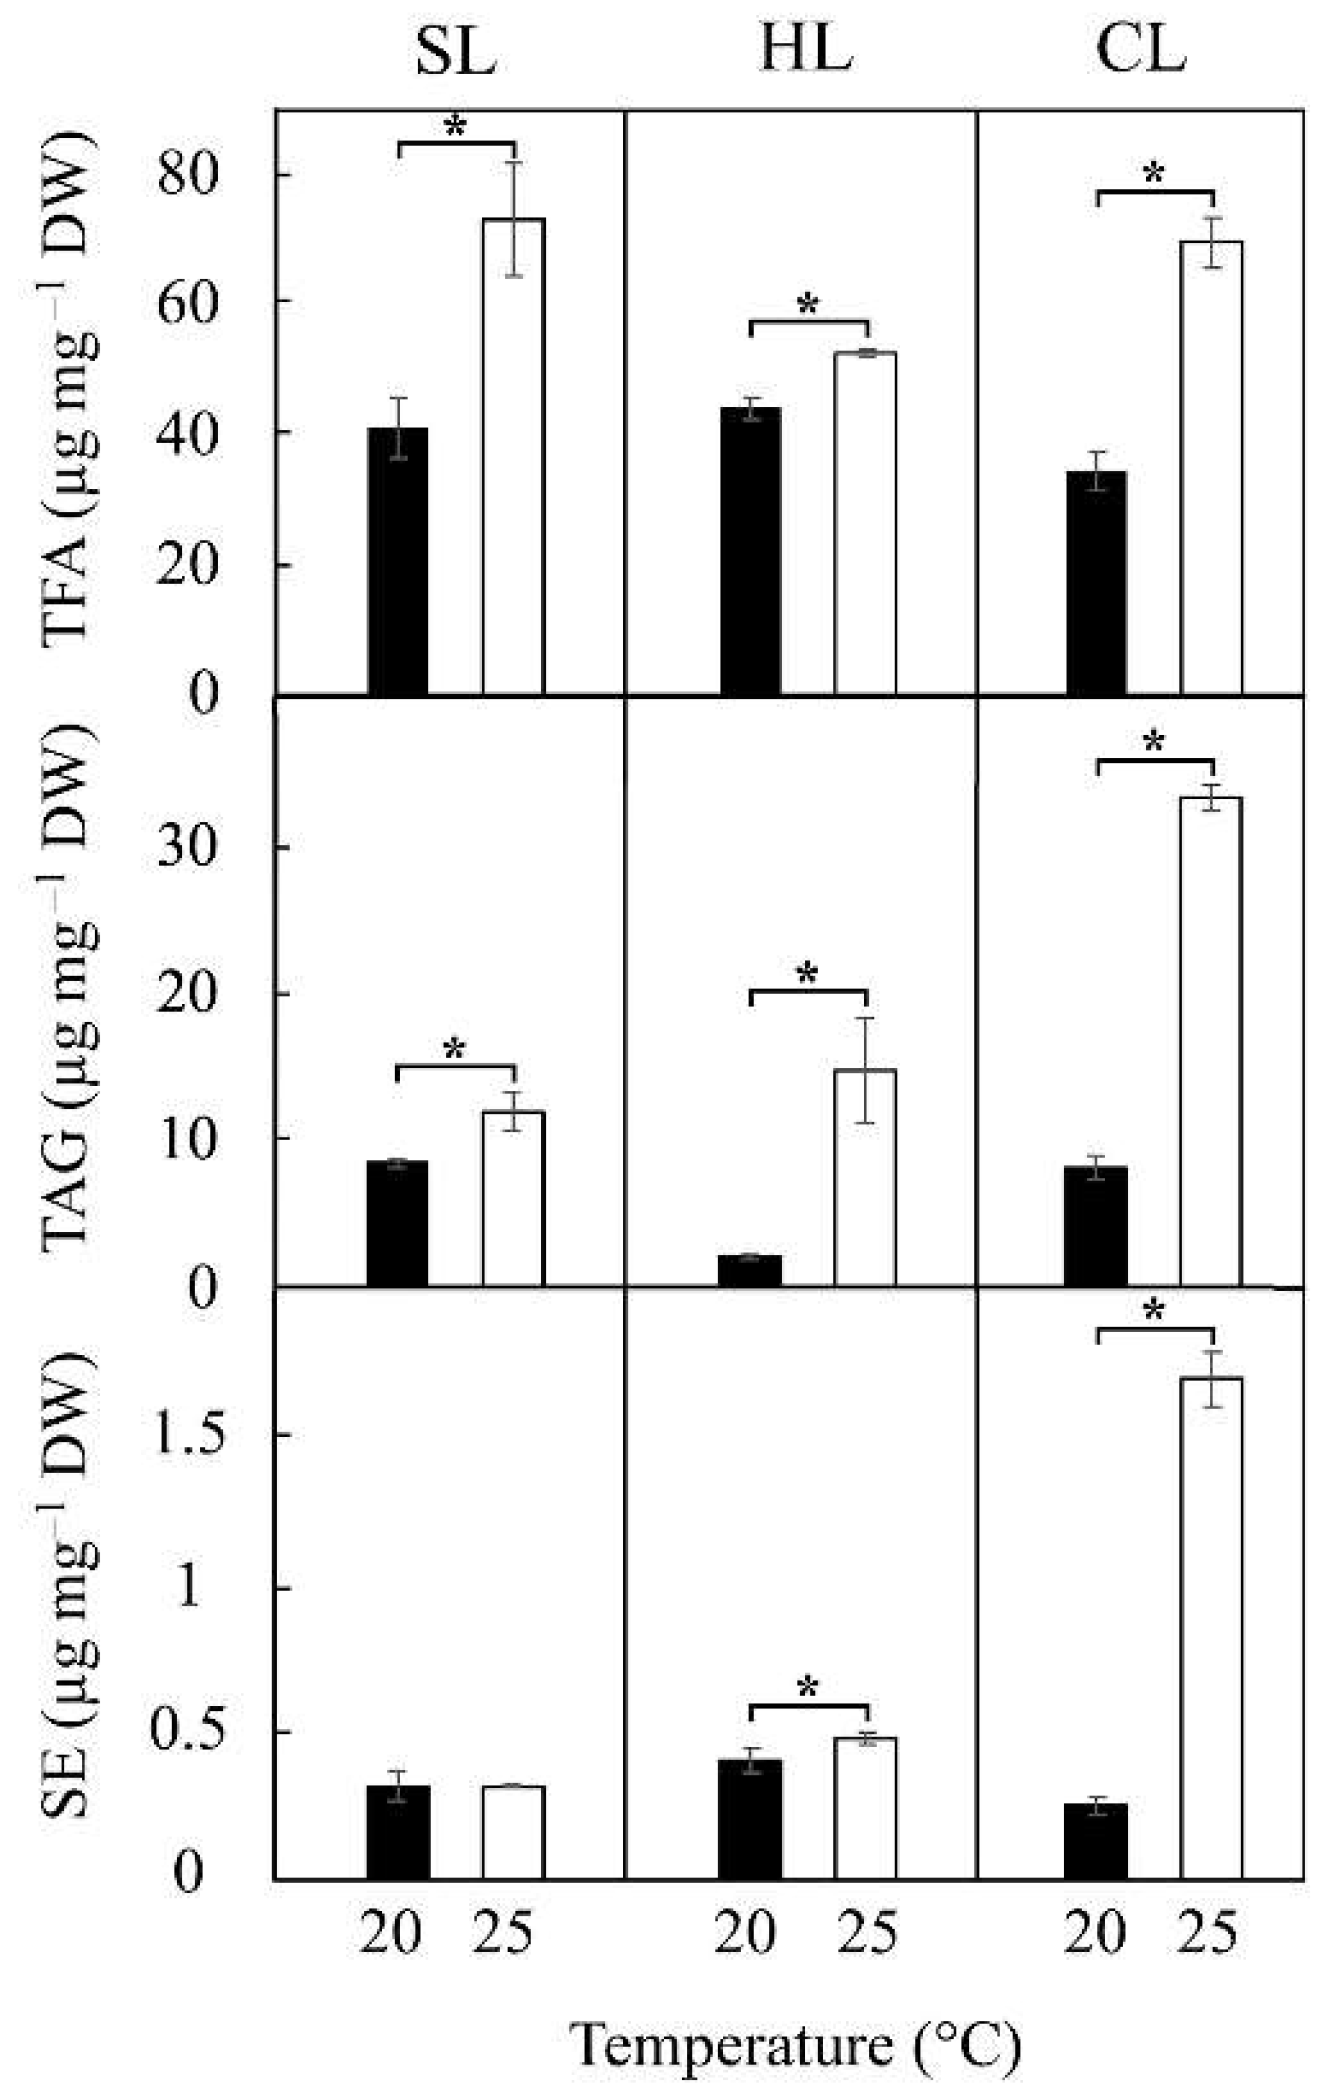
Figure 4 shows the content in total fatty acids (TFA), triacylglycerides (TAG) and sterol esters (SE) determined in P. tricornutum cells grown at 20°C and 25°C under the different light regimes investigated. In all cases, the TFAs and TAGs content increases in cells grown at 25°C relative to 20°C (Figure 4). An important increase in TAGs occurs at 25°C and HL/CL conditions (Figure 4), in agreement with the observations of NR staining (Figure 1). However, no relevant changes in the content of SEs were observed in cells grown at 25°C compared to 20°C under light/dark cycle illumination conditions. Nonetheless, the CL conditions did induce a large increase (ca. 7-fold) in the SEs content at 25°C, similar to that observed with TAGs under the same conditions (Figure 4).
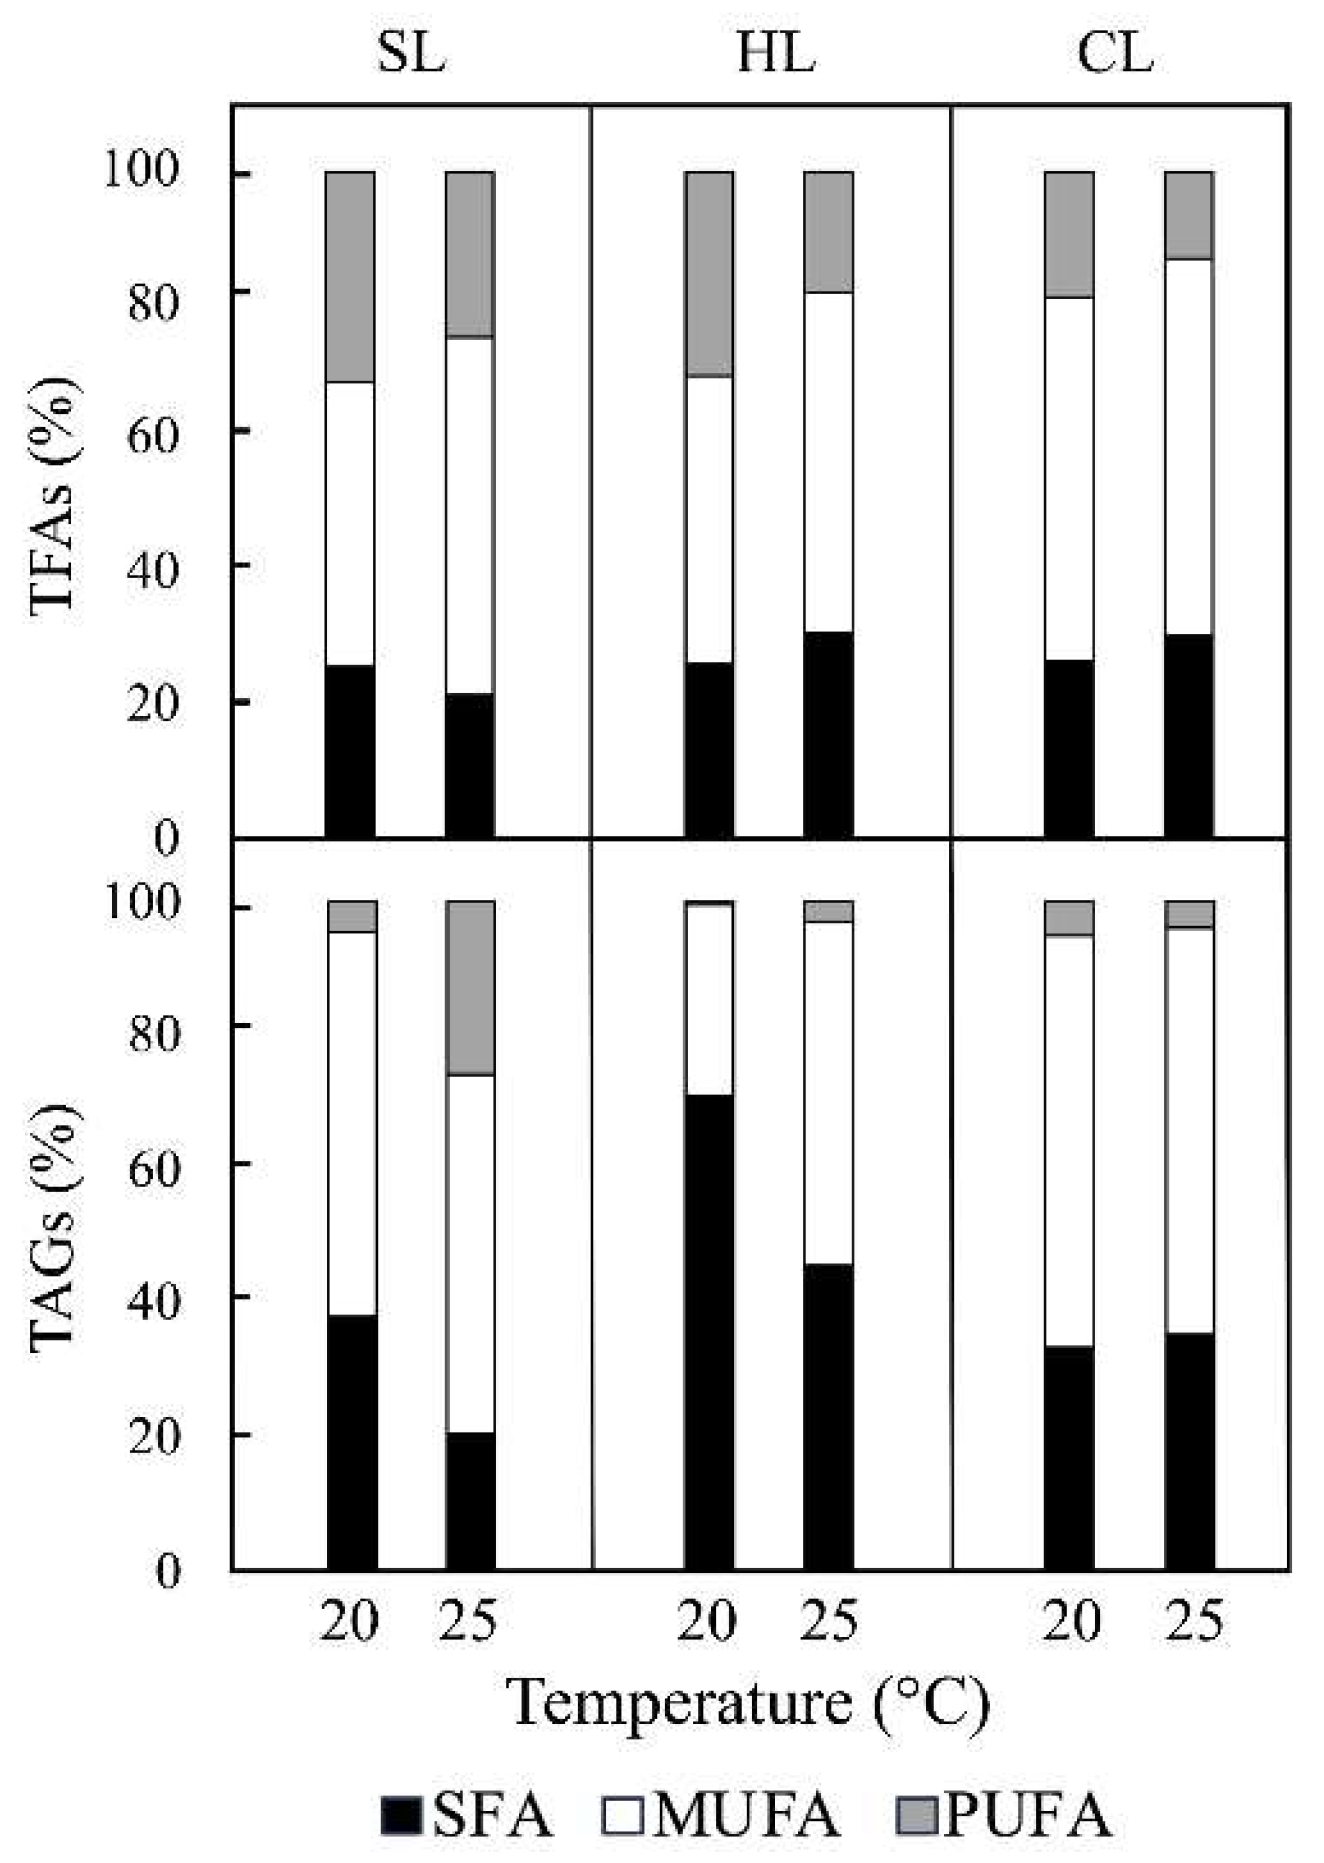
The TFAs composition of P. tricornutum cells cultured at different illumination conditions (SL, HL and CL) at 20°C and 25°C were quantified as lipid-derived fatty acid methyl esters (FAMEs) using GC-MS (see Material & Methods) (supplementary Table S1). In all the conditions tested, palmitoleic (C16:1), palmitic (C16:0) and hexadecatrienoic (C16:3) acids were the three most abundant fatty acids in P. tricornutum (supplementary Table S1), as previously described [2,34]. Unlike some other algal species and higher plants, diatoms have a low content in 18-carbon fatty acids [34]. The results obtained show that, at both 20°C and 25°C, the content of palmitoleic (C16:1) and palmitic (C16:0) acids increases as the intensity of light increases, while the content of hexadecatrienoic acid (C16:3) decreases (supplementary Table S1). From these data, the percentage of saturated, monounsaturated, and polyunsaturated (SFAs, MUFAs and PUFAs, respectively) of total fatty acids of P. tricornutum were calculated (Figure 5, upper). The percentage of PUFAs detected decreases in parallel with the increase of MUFAs when the intensity of illumination increases from SL to HL and CL conditions while the percentage of SFAs remains basically constant (Figure 5, upper). In additions, the ratio of UFAs to SFAs, in TFAs content in P. tricornutum cells, decreases as the illumination intensity increases, from a value of 2.86 to 2.74 (at 20°C) and from 3.61 to 2.26 (at 25°C) when comparing SL and CL conditions, respectively (supplementary Table S1).
Similarly, the composition of TAGs of P. tricornutum cells were determined (supplementary Table S2). The data revealed that under the different temperatures and light regimes here investigated, the main fatty acids present in TAGs were palmitoleic (C16:1) and palmitic (C16:0) acids, as previously found in the TFA content (supplementary Tables S1 and S2). The percentage of SFAs, MUFAs and PUFAs in total TAGs showed significant differences not only under the different illumination conditions, but in some cases also when comparing 20°C and 25°C under the same illumination (Figure 5, lower). Thus, while PUFAs in TAGs of P. tricornutum cells were almost undetectable except under SL at 25°C conditions, the percentage of SFAs decreases at 25°C compared to 20°C when the intensity of illumination increases from SL to HL conditions. Moreover, MUFAs increase in parallel in HL conditions (Figure 5, lower). However, no differences in TAGs percentages were detected under CL conditions at 20°C and 25°C, MUFAs representing the predominant component (Figure 5, lower). Finally, the UFAs/SFAs ratio calculated in TAGs increases as the culture temperature increases from 20°C to 25°C in SL and HL conditions (1.63 to 3.92 and 0.41 to 1.19, respectively; supplementary Table S2).

3. Discussion

3.1. Combined Effects of Temperature and Light Regimes on Cell Growth and Photosynthetic Parameters

Light and temperature are critical factors affecting diatoms growth and biochemical composition, so the independent effects of temperature and light on marine diatoms have been intensively studied and well characterized [5,35]. Nevertheless, only a few studies have already reported the joint effects of temperature and light on diatoms [23,24,36], although it is known that the effect of temperature on diatom growth and photosynthetic activity can vary as a function of the light regime. In this work we have studied the combined effects of temperature and light regimes on P. tricornutum grown at 20°C and 25°C, either under light/dark cycles of two light intensities or continuous light.
Growing P. tricornutum at 25°C, instead of 20°C, reveals an expected decrease in the specific growth rate and the total photosynthetic activity, measured as the net O2 production, either under light/dark cycles or continuous light (Table 1). Our results showed a positive correlation between the content of both total Chl and carotenoids with temperature under light/dark cycles, particularly under HL conditions (Table 1), as already described in other microalgae [37,38]. In addition, an increase of the Chl a/Chl c ratio with temperature is observed under light/dark cycles, indicating the favoring of photochemical energy conversion over accessory pigments. Carotenoid concentrations often increase as diatoms experience thermal and light stress, to help protect the cell against photooxidative damage caused by both heat and light [39]. The positive effect of temperature under light/dark cycles in promoting an increase of the Chl content overlaps with the opposite effect caused by a higher light intensity (Table 1). Thus, light intensity negatively affected photosynthetic pigment production in P. tricornutum, with higher contents observed under the lower SL irradiance, less favorable for cell growth (Table 1). However, in an opposite way, the higher chlorophyll levels under SL conditions correspond to the lower Chl a/Chl c ratios, showing that HL favors the photochemical conversion of energy by increasing the photosynthetic reaction center/antenna complex ratio. In a broader sense, a moderate increase of light intensity counteracts the negative effect of increasing temperature on cell growth and photosynthetic rates, indicating an antagonistic interaction between light and temperature.
The results obtained under continuous illumination clearly differ from those of SL conditions (both at 25 µmol m-2 s-1). Lower levels of total Chl, Chl a/Chl c ratio and mainly carotenoids were measured under CL when shifting from 20°C to 25°C (Table 1). Thus, it appears that the physiological deregulation induced by continuous illumination [40] alters the response of P. tricornutum to a higher temperature.
The combined effect of temperature and light intensity on the maximum quantum efficiency of PSII (Fv/Fm) observed here is moderate but significant (Table 1). Fv/Fm is a key indicator of the integrity and efficiency of the photosynthetic apparatus, reflecting how efficiently light energy is converted into chemical energy by PSII during photosynthesis. Different effects of temperature on Fv/Fm have been reported in different species of marine diatoms [11,41]. In our case, and at the range of temperature here applied, the maximum quantum efficiency of PSII is not drastically affected by changes in the illumination intensity, although under light/dark cycles Fv/Fm values increase slightly with temperature (Table 1). The most remarkable effect is the lowest Fv/Fm values observed under continuous light conditions (Table 1). In addition, the low increase in growth observed under CL conditions is not in agreement with the increased irradiance from SL to CL conditions (16 to 24 h of light), indicating again a lower efficiency in light use because of the stress conditions by the absence of dark periods [40].
The amplitude of the TL signal is related to the overall PSII activity, from the water-splitting system to the final quinone acceptor [42]. In our case, the TL signal was significantly higher at 25°C in comparison with 20°C for the cells grown under the two discontinuous illumination conditions (Figure 2B). Thus, this result may be attributed to an increased amount of photochemically competent PSII complexes in P. tricornutum cells growing at 25°C. On the other hand, TL experiments have also shown that the amount of functional PSII decreases when increasing light intensity at both 20°C and 25°C (Figure 2B). This fact can be related to the reduction of the Chl content at higher light intensities (Table 1), and the consequent loss of reaction centers and FCP complexes [43]. In the case of continuous illumination, the lower Fv/Fm ratios coincide with similar lower values of TL signals at both temperatures (Figure 2B). This indicates that deregulation induced by continuous illumination promoted a similar decreased amount of functional PSII complexes in P. tricornutum at 20°C and 25°C (Figure 2B). As mentioned above, only moderate effects of either temperature or light intensity were observed on the maximum quantum efficiency of PSII. However, a significant effect of temperature on rETRmax as a function of light regimes was observed in P. tricornutum cells (Table 1). rETRmax represents the efficiency with which electrons are transported through the photosynthetic apparatus under varying light conditions, thus being a key indicator of the maximum photosynthetic capacity. Our results show that rETRmax values were sensitive to temperature changes in two opposite ways in response to the light regimes tested. Under light/dark cycles, both in SL and HL conditions, rETRmax values decreased when increasing temperature, demonstrating its sensitivity to elevated temperatures (Figure 2A and Table 1). A similar pattern has been observed in other diatoms and microalgae [44,45]. The decrease in rETRmax beyond the optimum temperature could probably be due to the deactivation of carbon fixation [46]. In our case, this temperature dependence has been observed only under light/dark cycles, both at SL/HL. Moreover, under both conditions, a similar decrease is also observed in the rETR values obtained at the highest light intensity evaluated (830 µmol m-2 s-1) (Table 1). Thus, under light/dark cycles, light sensitivity is substantially greater as temperature increases. By contrast, under CL illumination conditions, both rETRmax values and rETR values at PARmax increased with temperature (Table 1), thus indicating that at a higher temperature a continuous photoperiod increases the photosynthetic activity.
On the other hand, the efficiency of PSI seems to be sensitive to temperature and light conditions. Y(I) represents the fraction of energy absorbed by PSI that is used in photochemistry, essentially reflecting the efficiency of PSI in converting light energy into chemical energy. Y(ND) reflects the fraction of energy dissipated non-photochemically due to donor-side limitations in PSI, indicating its inability to accept electrons efficiently. A decrease in PSI quantum yield, Y(I), and a higher degree of donor-side limitations, Y(ND), were observed with increasing temperature from 20°C to 25°C in the light/dark conditions studied, these changes being higher under HL (Figure 3). This effect can be attributed to a deficiency of PSI donors, causing P700 to fail to be reduced [32,33]. However, the limitation of the donor side of PSI should not be interpreted as a sign of loss of PSI activity. In fact, a mechanism of PSI photoprotection (donor-side regulation), based on down-regulation of the cytochrome b6f complex through photosynthetic control by luminal acidification, has been proposed to decrease the rate of electron transport from PSII to PSI, thus avoiding over-reduction of P700 [47].
Finally, it is interesting to compare the overall PSII activity, determined by TL, with the maximal P700+ signal, determined by PAM, and related to PSI photochemical activity (Figure 2B and Table 1). At all light intensities tested, significantly higher Pm values were obtained when the culture temperature increased to 25°C (Table 1), in a similar way to the PSII activity measured by TL (Figure 2B). Thus, the observed deficiency in PSI activity does not correlate with a lower amount of photochemically active PSI centers, but with a limitation in their donor side. As previously observed for TL signals from PSII, absolute Pm values also decreased when increasing light intensity, at both 20°C and 25°C, with the lower values being determined under CL conditions (Table 1). These facts could be related again to a loss of reaction centers and FCP complexes under higher illumination conditions.

3.2. Combined Effect of Temperature and Light Regimes on Lipid Content and Fatty Acid Composition

Due to their capacity to accumulate high levels of lipids, diatoms represent a source of food in aquaculture, as well as a potential source of biofuel production [12]. Diatoms synthesize both polar (phosphoglycerides and glycosylglycerides) and non-polar (acylglycerols, sterols, sterol esters, free fatty acids, and hydrocarbons) lipids. Under stress or unfavorable environmental conditions for growth, diatoms can alter their lipid content, mainly accumulating TAGs, the predominant neutral lipids and the primary storage lipids in diatoms, that serve both as carbon and energy storage [20]. Environmental stimuli promoting TAGs accumulation include nutrient starvation, external salinity, and pH [48,49]. In addition, although previous works have also revealed how the content and composition of lipids in diatoms is affected by temperature or light intensity, the studies on the combined effects of both parameters are scanty [23,24,50,51]. Typically, high light intensity decreases the total polar lipid content, with a concomitant increase in the amount of neutral storage lipids, mainly TAGs, in LDs [48]. However, although LDs are mainly composed of TAGs, they can also content SEs, among other minor compounds [22].
Analysis of the total content of TFAs, TAGs and SEs in P. tricornutum cells showed higher levels of these lipids when the culture temperature increased from 20°C to 25°C under all the tested illumination conditions (Figure 4). However, while TFAs levels are comparable at the same temperature under each illumination condition, the higher increase with temperature and the higher absolute values of TAGs and SEs, were typically observed under CL conditions and 25°C (Figure 4). Thus, under CL conditions, increased temperature adds additional stress to continuous light, which generates an accumulation of cytoplasmic LDs, even at the moderate light intensity used in our experiments (Figure 1). Therefore, continuous illumination conditions and 25°C not only promote physiological deregulation of diatom metabolism, but also cancels storage lipid remobilization due to the absence of dark periods [22]. Moreover, increases in sterols levels after exposure to high light conditions have also been observed in different microalgae, where stress induced by high light activated genes involved in sterol metabolism [52].
The fatty acid composition of microalgae is an important parameter to be evaluated. In particular, the presence of high levels of MUFAs, low levels of PUFAs and optimal amounts of SFAs are desirable properties of biodiesel, since an optimal ratio of saturated and unsaturated fatty acids will determine its quality [53,54]. Commonly, palmitic acid (C16:0), stearic acid (C18:0), oleic acid (C18:1), linoleic acid (C18:2) and linolenic acid (C18:3) are strong candidates for suitable biodiesel production [53]. In this study, although the TFA absolute levels are relatively similar at the same temperature, the lipid composition profile varied in a parallel manner at 20°C and 25°C as the light intensity increases (Figure 5, upper). Thus, at both 20°C and 25°C, high contents of SFAs and MUFAs were detected under SL/HL conditions and, more particularly, under continuous illumination (Figure 5, upper). The more detailed analysis of TFAs showed that, in agreement with previous works, SFAs and MUFAs (mainly C16:1 and C18:1) increase while PUFAs decrease with temperature at any light intensity (supplementary Table S1) [9,15]. Moreover, the absolute values of palmitic (C16:0) and palmitoleic (C16:1) acids increases both with temperature and light intensity, to reach the highest values (≈80% of total TFAs) under CL conditions, which represents an excellent quality composition to produce biodiesel (supplementary Table S1). It has been suggested that palmitic (C16:0) and palmitoleic (C16:1) acids played a similar role as membrane components, replacing for each other, depending on the temperature adaptation of cultures to maintain membrane fluidity in response to temperature changes [55]. In addition, both fatty acids are also considered storage products for excess energy in diatoms, which adjust their levels in response to photon flux densities [37].
The lipid composition profile of TAGs, the primary lipids of reserve in diatoms, has shown to be drastically altered with both temperature and light intensity (Figure 5, lower; and see supplementary Table S2). In fact, the parallel temperature dependence observed at the same illumination for TFAs, only occurs in the case of TAGs under CL conditions (Figure 5, lower). However, in a general sense, the PUFAs content in TAGs of P. tricornutum cells was almost undetectable under HL conditions (Figure 5, lower). Palmitoleic (C16:1) and palmitic (C16:0) acids widely predominate as the main components of TAGs under any illumination condition. However, while under SL/HL conditions they account for ≈65-80% of total TAGs, under continuous light they account for ≈90% (supplementary Table S2). Under CL conditions and at 25°C, the highest absolute values of TAGs and SEs were observed (Figure 4).

4. Materials and Methods

4.1. Microalgal Strain and Culture Conditions

Cells from the coastal pennate diatom Phaeodactylum tricornutum CCAP 1055/1 were grown in artificial seawater (ASW) medium [56], in rotatory shakers (100 rpm) at 20°C with regular transfer of the cells into fresh media and illuminated by LED white light (4500 K) lamps giving an intensity of 25 µmol m-2 s-1, following a light/dark cycle of 16/8 h, as standard conditions. To study the effects of light intensity, cells were grown for 15 days (at 25 µmol m-2 s-1 or 60 µmol m-2 s-1). An illumination of 25 µmol m-2 s-1 was set as moderate radiation [10] under both light/dark cycles (standard light; SL) and continuous light (continuous light; CL) conditions. A light intensity of 60 µmol m-2 s-1 (high light; HL) was set as roughly equivalent to natural noon radiation and close to light saturating conditions [10,27]. Experiments were carried out at two different temperatures: 20°C and 25°C, corresponding to optimal and higher temperature conditions, respectively. Cultures were inoculated with an initial cell concentration of ≈5.5 x 10⁵ cells mL-1. When required, culture cells were observed and photographed using a Leica Microscope DM6000B apparatus (IBVF Microscopy Service).

4.2. Analytical Methods

Growth cell parameters were obtained from at least ten independent experiments. Cells were counted with a Neubauer-improved hemocytometer (Marienfeld-Superior), according to the instructions of manufacturer. Cell specific growth rates (µ, day–1) were calculated in the exponential phase of growth of cultures using the equation: [µ = ln (Nt / N0) /∆t] where Nt and N0 are the final and initial cell concentration, respectively, and ∆t is the selected number of days of growth. Pigments extraction was carried out using glass beads (0.5 mm) and 90% cold acetone according to [57] with minor modifications. Chlorophyll (Chl) a and c content in P. tricornutum cells was estimated as described by [58], the total Chl content being calculated as the sum of these two values, while carotenoids concentration was determined by the equation given by [59]:
Chl a (µg mL–1) = 11.47 x (A664 – A750) – 0.40 x (A630 – A759)
Chl c (µg mL–1) = 24.34 x (A630 – A750) – 0.40 x (A664 – A759)
Carotenoids (µg mL–1) = 7.6 x (A480 – A750) – 1.49 x (A510– A750)

4.3. Nile Red staining and fluorescent microscopy

Nile Red (NR), was used to reveal the presence of neutral lipids, following the method described in [29] with minor modifications. Briefly, aliquots of P. tricornutum cell cultures from different irradiance and temperature growth conditions were collected by centrifugation at 5,000 g for 5 min and resuspended in ultrapure water. Subsequently, the cells were stained with NR (0.5 mg mL-1 stock solution in DMSO) at a final concentration of 5 μg mL-1 and incubated in the dark 20 min at 37°C. NR fluorescence was observed with a fluorescence microscope (Leica DM6000B) using a 100x oil-immersion objective with DIC optics or wide-field fluorescence equipped with a Leica L5 filter cube (excitation bandpass, 480/40 nm; dichroic 505 nm; emission bandpass, 527/30 nm). Images were recorded with a digital camera (ORCA-ER, Hamamatsu).

4.4. Lipid Analysis

Total lipids were extracted from P. tricornutum cells grown under different irradiance and temperature conditions, according to the method described by [60] with some modifications. Briefly, 0.1-0.3 g of dry weight (DW) of P. tricornutum cells were homogenized in a chloroform:methanol:water (1:2:2) mixture and subjected to ultrasonic treatment for 20 min in ice water. Then, samples were centrifuged for 5 min at 5,000 g to separate the two phases. The lower layer of chloroform containing lipids was collected. To the upper layer with the methanol:water mixture, 5 mL of distilled water was added to extract the remaining lipids, the solution being vortexed for 120 s and subjected to a second chloroform:methanol:water extraction. Finally, both chloroform samples –containing the lipids– were combined, the solvent was completely removed under a stream of N2, and total lipids were dissolved in chloroform for further analysis.
Neutral lipids analysis was carried out separating total lipids by thin-layer chromatography [61]. Individual lipids were visualized under iodine vapor and identification was made by reference to standards. Fatty acid methyl esters of the total lipid fraction and the individual lipid classes were produced by acid-catalyzed transmethylation [62], and analyzed by gas chromatography using a GC-MS-QP2010 Plus equipment (Shimadzu, Kyoto, Japan) [63]. Heptadecanoic acid was used as an internal standard to calculate the lipid and fatty acid contents in the samples. Results are presented as means (μg per mg of DW) ± SD of three independent biological replicates.

4.5. Photosynthetic Measurements

To study photosynthetic global activity, cells from 2.5 mL of the different cultures were collected by centrifugation and resuspended in fresh culture medium. Rates of oxygen intake or evolution were then determined from three independent experiments by using a Clark-type oxygen electrode (Hansatech). Measurements were carried out at 20°C, both in the dark and under illumination (215 µmol m-2 s-1), to establish the net photosynthetic activity per cell.
The Chl a fluorescence of PSII and the redox state of P700 (the photosystem I primary donor) from intact cells were determined at room temperature using a pulse-amplitude modulation fluorometer (DUAL-PAM-100, Walz). The photosynthetic parameters were obtained from at least five independent experiments, carried out basically as previously described [32,33]. Fluorescence experiments were performed using cell suspensions at a concentration of ≈4.5 x 10⁶ cells mL-1 that were previously dark adapted for 30 min. The maximum quantum yield of PSII (Fv/Fm) and the relative linear electron transport rates (rETR) for each actinic light intensity were determined as already published [32,33]. The redox state of P700 was monitored by following the changes in absorbance at 830 nm versus 875 nm at a cellular concentration of ≈4.5 x 10⁷ cells mL-1. The level of maximal P700+ signal observed upon P700 full oxidation, Pm, was determined by pre-illumination of cell suspensions with FR light (730 nm) for 10 s, and after that, with a saturating pulse of red light (635 nm) at 10,000 μmol m-2 s-1 intensity and 0.2 s duration. The quantum yields of photosystem I (PSI) photochemistry, Y(I), donor side limitations, Y(ND), and acceptor side limitations, Y(NA), were determined according to [32,33].
Thermoluminescence (TL) glow curves of P. tricornutum cell suspensions were obtained using a home-built apparatus designed by Dr. Jean-Marc Ducruet, for luminescence detection from 1°C to 80°C. A detailed description of the system can be obtained elsewhere [32,33]. Data acquisition, signal analysis and graphical simulation were performed as previously described [64,65]. TL measurements were carried out as previously reported [32, 33]. Typically, P. tricornutum cell suspensions were dark-incubated for 2 min at 20°C, then cooled to 1°C for 1 min and illuminated at the end of this period with two saturating single turn-over flashes (separated by 1 s). Luminescence emission was then recorded while warming samples from 1°C to 65°C at a heating rate of 0.5°C per second. Experiments were performed using suspensions with a cellular concentration of ≈4.5 × 10⁷ cells mL-1. TL parameters were obtained from five independent measurements.

4.6. Statistical Significance Level

The significance of the results from two data sets was analyzed using a Two Sample t-Test calculator tool (https://www.statskingdom.com). Data inputs were means, standard deviations, and N (number of measurements per group). Data were considered significantly different for a p-value < 0.05.

5. Conclusions

To conclude, this study reveals that the combination of increasing temperature from 20°C to 25°C with increasing light intensity under light/dark or continuous light conditions increases the accumulation of lipids, mainly as TAGs, and affects the fatty acid composition in P. tricornutum cells. Moreover, this change of temperature triggers an increase in the number and size of cytoplasmic LDs under HL conditions, but even more dramatically under CL conditions. Our most remarkable result is that the combination of temperature and light (25°C and continuous illumination) in P. tricornutum cell cultures causes a drastic increase of TAGs, and a change in their composition of TFAs optimal for their use as biodiesel.

Supplementary Materials

The following supporting information can be downloaded at the website of this paper posted on Preprints.org. Figure S1: Thermoluminescence band emissions of P. tricornutum cultures grown under standard illumination conditions and different temperatures. Table S1. Total fatty acid content, composition, and saturation ratio of P. tricornutum cells grown under different conditions of temperature and light intensity. Table S2. Triacylglycerides content, composition, and saturation ratio of P. tricornutum cells grown under different conditions of temperature and light intensity.

Author Contributions

MR and JAN conceived and designed the project. ED-S and LGH-M carried out the physiological and biochemical characterization, with some contributions of MH, JAN and LL-M. ED-S and LGH-M also performed lipid analysis. MR and LGH-M carried out PAM experiments and JMO and LGH-M, TL measurements. All the authors discussed the results, and MR wrote the manuscript with their collaboration. The manuscript was corrected, revised and approved by all authors. All authors have read and agreed to the published version of the manuscript.

Funding

This work was supported by the Spanish Ministry of Science and Innovation, MCIN (grant PID2020-112645GB-100; funded by MCIN/AEI/10.13039/501100011033; to LL-M and JAN) the University of Seville (grant US-1380339; co-financed by the EU FEDER 2014-2020 Program and the “Consejería de Transformación Económica, Industria, Conocimiento y Universidades de la Junta de Andalucía”; to MR and JAN), and the “Junta de Andalucía” (grant PCM_00004, “Plan de Recuperación, Transformación y Resiliencia” –funded by the European Union– NextGenerationEU).

Data Availability Statement

The data that support the findings of this study are available from the corresponding author upon reasonable request.

Acknowledgments

The authors thank to C. Parejo (Chromatography Service, IBVF) and Dr. A. Orea (Microscopy Service, IBVF) for their technical assistance. The authors also thank to Dr. M.L. Hernández (IBVF) for her help and advice on the lipid analysis and for critically reading the manuscript.

Conflicts of Interest

The authors declare no conflicts of interest.

References

  1. Bowler, C.; Vardi, A.; Allen, A.E. Oceanographic and biogeochemical insights from diatom genomes. Ann. Rev. Mar. Sci. 2010, 2, 333–365. [Google Scholar] [CrossRef] [PubMed]
  2. Büchel, C.; Goss, R.; Bailleul, B.; Campbell, D.; Lavaud, J.; Lepetit, B. Photosynthetic light reactions in diatoms. I. The lipids and light-harvesting complexes of the thylakoid membrane. In The Molecular Life of Diatoms, Falciatore, A., Mock, T. Eds.; Springer International Publishing, Cham. 2022, pp. [CrossRef]
  3. Chauton, M.S.; Reitan, K.I.; Norsker, N.H.; Tveterås, R.; Kleivdal, H.T. A techno-economic analysis of industrial production of marine microalgae as a source of EPA and DHA-rich raw material for aquafeed: Research challenges and possibilities. Aquaculture 2015, 436, 95–103. [Google Scholar] [CrossRef]
  4. Chen, F.; Leng, Y.; Lu, Q.; Zhou, W. The Application of Microalgae Biomass and Bio-Products as Aquafeed for Aquaculture. Algal Res. 2021, 60, 102541. [Google Scholar] [CrossRef]
  5. Kumari, P.; Kumar, M.; Reddy, C.R.K.; Jha, B. Algal lipids, fatty acids and sterols. In Functional Ingredients from Algae for Foods and Nutraceuticals; Elsevier Ltd., 2013; pp. [CrossRef]
  6. Singh, S.P.; Singh, P. Effect of temperature and light on the growth of algae species: A review. Renew Sustain. Energy Rev. 2015, 50, 431–444. [Google Scholar] [CrossRef]
  7. Bojko, M.; Brzostowska, K.; Kuczyńska, P.; Latowski, D.; Ol-Chawa-Pajor, M.; Krzeszowiec, W.; Waloszek, A.; Strzałka, K. Temperature effect on growth, and selected parameters of Phaeodactylum tricornutum in batch cultures. Acta Biochim. Pol. 2013, 60, 861–4. [Google Scholar] [CrossRef]
  8. Suzuki, Y.; Takahashi, M. Growth responses of several diatom species isolated from various environments to temperature. J. Phycol. 1995, 31, 880–888. [Google Scholar] [CrossRef]
  9. Rousch, J.M.; Bingham, S.E.; Sommerfeld, M.R. Changes in fatty acid profiles of thermo-intolerant and thermo-tolerant marine diatoms during temperature stress. J. Exp. Mar. Biol. Ecol. 2003, 295, 145–156. [Google Scholar] [CrossRef]
  10. Feijão, E.; Gameiro, C.; Franzitta, M.; Duarte, B.; Caçador, I.; Cabrita, M.T.; Matos, A.R. Heat wave impacts on the model diatom Phaeodactylum tricornutum: Searching for photochemical and fatty acid biomarkers of thermal stress. Ecol. Indic. 2018, 95, 1026–1037. [Google Scholar] [CrossRef]
  11. Hong, T.; Huang, N.; Mo, J.; Chen, Y.; Li, T.; Du, H. Transcriptomic and physiological responses of a model diatom (Phaeodactylum tricornutum) to heat shock and heat selection. Ecol. Indic. 2023, 153. [Google Scholar] [CrossRef]
  12. Butler, T.; Kapoore, R.V.; Vaidyanathan, S. Phaeodactylum tricornutum: A diatom cell factory. Trends Biotechnol. 2020, 38, 606–622. [Google Scholar] [CrossRef]
  13. Celi, C.; Fino, D.; Savorani, F. Phaeodactylum tricornutum as a source of value-added products: A review on recent developments in cultivation and extraction technologies. Bioresour. Technol. Rep. 2022, 101122. [Google Scholar] [CrossRef]
  14. Kudo, I.; Miyamoto, M.; Noiri, Y.; Maita, Y. Combined effects of temperature and iron on the growth and physiology of the marina diatom Phaeodactylum triconutum (Bacillariophyceae). J. Phyco.l 2000, 36, 1096–1102. [Google Scholar] [CrossRef]
  15. Jiang, H.; Gao, K. Effects of lowering temperature during culture on the production of polyunsaturated fatty acids in the marine diatom Phaeodactylum tricornutum (Bacillariophyceae). J. Phycol. 2004, 40, 651–654. [Google Scholar] [CrossRef]
  16. Cheong, K.Y. , Firlar, E., Ficaro, L., Gorbunov, M.Y., Kaelber, J.T., Falkowski, P.G. Saturation of thylakoid-associated fatty acids facilitates bioenergetic coupling in a marine diatom allowing for thermal acclimation. Glob. Chang. Biol. 3133. [Google Scholar] [CrossRef]
  17. Wu, H.; Roy, S.; Alami, M.; Green, B.R.; Campbell, D.A. Photosystem II photoinactivation, repair, and protection in marine centric diatoms. Plant Physiol. 2012, 160, 464–476. [Google Scholar] [CrossRef]
  18. Fisher, N.L.; Halsey, K.H. Mechanisms that increase the growth efficiency of diatoms in low light. Photosynth Res 2016, 129, 183–197. [Google Scholar] [CrossRef]
  19. Nymark, M.; Valle, K.C.; Brembu, T.; Hancke, K.; Winge, P.; Andresen, K.; Johnsen, G.; Bones, A.M. An integrated analysis of molecular acclimation to high light in the marine diatom Phaeodactylum tricornutum. PLoS One 2009, 4, e7743. [Google Scholar] [CrossRef]
  20. Guschina, I.A.; Harwood, J.L. Algal lipids and effect of the environment on their biochemistry. In Lipids in Aquatic Ecosystems 2009, Springer New York, pp. 24. [CrossRef]
  21. Tanaka, T.; Yoneda, K.; Maeda, Y. Lipid metabolism in diatoms. In The Molecular Life of Diatoms, Falciatore, A., Mock, T. Eds.; Springer International Publishing, Cham. 2022. [Google Scholar] [CrossRef]
  22. Leyland, B.; Boussiba, S.; Khozin-Goldberg, I. A review of diatom lipid droplets. Biology (Basel) 2020, 9, 38. [Google Scholar] [CrossRef]
  23. Fawley, M.W. Effects of light intensity and temperature interactions on growth characteristics of Phaeodactylum tricornutum (bacillariophyceae). J. Phycol. 1984, 20, 67–72. [Google Scholar] [CrossRef]
  24. Strzepek, R.F.; Price, N.M. Influence of irradiance and temperature on the iron content of the marine diatom Thalassiosira weissflogii (Bacillariophyceae). Mar. Ecol. Prog. Ser. 2000, 206, 107–117. [Google Scholar] [CrossRef]
  25. Davison, I.R. Enviromental effects on algal photosynthesis: Temperature. J. Phycol. 1991, 27, 2–8. [Google Scholar] [CrossRef]
  26. Kalituho, L.; Pshybytko, N.; Kabashnikova, L.; Jahns, P. Photosynthetic apparatus and high temperature: role of light. Bulg. J. Plant Physiol.
  27. Agarwal, A.; Levitan, O.; de Carvalho, H.C.; Falkowski, P.G. Light-dependent signal transduction in the marine diatom Phaeodactylum tricornutum. Proc. Natl. Acad. Sci. USA 2023, 120. [Google Scholar] [CrossRef] [PubMed]
  28. Kuczynska, P.; Jemiola-Rzeminska, M.; Strzalka, K. Photosynthetic pigments in diatoms. Mar. Drugs 2015, 13, 5847–5881. [Google Scholar] [CrossRef] [PubMed]
  29. León-Vaz, A.; León, R.; Díaz-Santos, E.; Vigara, J.; Raposo, S. Using agro-industrial wastes for mixotrophic growth and lipids production by the green microalga Chlorella sorokiniana. N. Biotechnol. 2019, 51, 31–38. [Google Scholar] [CrossRef] [PubMed]
  30. Kwok, A.C.M.; Wong, J.T.Y. Lipid biosynthesis and its coordination with cell cycle progression. Plant Cell Physiol. 2005, 46, 1973–1986. [Google Scholar] [CrossRef]
  31. Ralph, P.J.; Gademann, R. Rapid light curves: a powerful tool to assess photosynthetic activity. Aquat. Bot. 2005, 82, 222–237. [Google Scholar] [CrossRef]
  32. Roncel, M.; González-Rodríguez, A.A.; Naranjo, B.; Bernal-Bayard, P.; Lindahl, M.; Hervás, M.; Navarro, J.A.; Ortega, J.M. Iron deficiency induces a partial inhibition of the photosynthetic electron transport and a high sensitivity to light in the diatom Phaeodactylum tricornutum. Front. Plant. Sci. 2016, 7, 208522. [Google Scholar] [CrossRef]
  33. Castell, C.; Bernal-Bayard, P.; Ortega, J.M.; Roncel, M.; Hervás, M.; Navarro, J.A. The heterologous expression of a plastocyanin in the diatom Phaeodactylum tricornutum improves cell growth under iron-deficient conditions. Physiol. Plant. 2021, 171, 277–290. [Google Scholar] [CrossRef]
  34. Orcutt, D.M.; Patterson, G.W. Sterol, fatty acid and elemental composition of diatoms grown in chemically defined media. Comp. Biochem. Physiol. B 1975, 50, 579–583. [Google Scholar] [CrossRef]
  35. Singh, S.P.; Singh, P. Effect of temperature and light on the growth of algae species: a review. Renewable and Sustainable Energy Reviews 2015, 50, 431–444. [Google Scholar] [CrossRef]
  36. Zeng, X.; Jin, P.; Jiang, Y.; Yang, H.; Zhong, J.; Liang, Z.; Guo, Y.; Li, P.; Huang, Q.; Pan, J.; Lu, H.; Wei, Y.; Zou, D.; Xia, J. Light alters the responses of two marine diatoms to increased warming. Mar. Environ. Res. 2020, 154, 158767. [Google Scholar] [CrossRef]
  37. Thompson, P. The response of growth and biochemical composition to variations in daylength, temperature, and irradiance in the marine diatom Thalassiosira pseudonana (Bacillariophyceae). J. Phycol. 1999, 35, 1215–1223. [Google Scholar] [CrossRef]
  38. Rehder, L.; Rost, B.; Rokitta, S.D. Abrupt and acclimation responses to changing temperature elicit divergent physiological effects in the diatom Phaeodactylum tricornutum. New Phytologist. 2023, 239, 1005–1013. [Google Scholar] [CrossRef] [PubMed]
  39. Sheehan, C.E.; Baker, K.G.; Nielsen, D.A.; Petrou, K. Temperatures above thermal optimum reduce cell growth and silica production while increasing cell volume and protein content in the diatom Thalassiosira pseudonana. Hydrobiologia 2020, 847, 4233–4248. [Google Scholar] [CrossRef]
  40. Ragni, M.; Ribera D’ Alcalá, M. Circadian variability in the photobiology of Phaeodactylum tricornutum: Pigment content. J. Plankton Res. 2007, 29, 141–156. [Google Scholar] [CrossRef]
  41. Zhong. J., Guo, Y., Liang, Z., Huang, Q., Lu, H., Pan, J., Li, P., Jin, P., Xia, J. 2021. Adaptation of a marine diatom to ocean acidification and warming reveals constraints and trade-offs. Sci. Total Environ. 1451. [CrossRef]
  42. Rutherford, A.W.; Renger, G.; Koike, H.; Inoue, Y. Thermoluminescence as a probe of photosystem II. The redox and protonation states of the secondary acceptor quinone and the O2-evolving enzyme. Biochim. Biophys. Acta (BBA) - Bioenergetics. [CrossRef]
  43. Friedman, A.L.; Alberte, R.S. Biogenesis and light regulation of the major light harvesting chlorophyll-protein of diatoms. Plant Physiol. 1986, 80, 43–51. [Google Scholar] [CrossRef]
  44. Salleh, S.; McMinn, A. The effects of temperature on the photosynthetic parameters and recovery of two temperate benthic microalgae, Amphora cf. coffeaeformis and Cocconeis cf. sublittoralis (Bacillariophyceae). J. Phycol. 2011, 47, 1413–1424. [Google Scholar] [CrossRef]
  45. Gleich, S.J.; Plough, L. V.; Glibert, P.M. Photosynthetic efficiency and nutrient physiology of the diatom Thalassiosira pseudonana at three growth temperatures. Mar. Biol. 2020, 167. [Google Scholar] [CrossRef]
  46. MacIntyre, H.L.; Sharkey, T.D.; Geider, R.J. Activation and deactivation of Ribulose-1,5-bisphosphate carboxylase/oxygenase (Rubisco) in three marine microalgae. Photosynth. Res. 1997, 51, 93–106. [Google Scholar] [CrossRef]
  47. Yamamoto, H.; Shikanai, T. PGR5-dependent cyclic electron flow protects photosystem I under fluctuating light at donor and acceptor sides. Plant Physiol. 2019, 179, 588–600. [Google Scholar] [CrossRef]
  48. Hu, Q.; Sommerfeld, M.; Jarvis, E.; Ghirardi, M.; Posewitz, M.; Seibert, M.; Darzins, A. Microalgal triacylglycerols as feedstocks for biofuel production: Perspectives and advances. Plant J. 2008, 54, 621–639. [Google Scholar] [CrossRef]
  49. Maeda, Y.; Nojima, D.; Yoshino, T.; Tanaka, T. Structure and properties of oil bodies in diatoms. Philos. Trans. R. Soc Lond. B Biol. Sci. 2017, 372. [Google Scholar] [CrossRef]
  50. Kurpan Nogueira, D.P.; Silva, A.F.; Araújo, O.Q.F.; Chaloub, R.M. Impact of temperature and light intensity on triacylglycerol accumulation in marine microalgae. Biomass Bioenergy 2015, 72, 280–287. [Google Scholar] [CrossRef]
  51. Spilling, K.; Ylöstalo, P.; Simis, S.; Seppälä, J. Interaction effects of light, temperature and nutrient limitations (N, P and Si) on growth, stoichiometry and photosynthetic parameters of the cold-water diatom Chaetoceros wighamii. PLoS One 2015, 10. [Google Scholar] [CrossRef] [PubMed]
  52. Scodelaro Bilbao, P.G.; Garelli, A.; Díaz, M.; Salvador, G.A.; Leonardi, P.I. Crosstalk between sterol and neutral lipid metabolism in the alga Haematococcus pluvialis exposed to light stress. Biochim. Biophys. Acta Mol. Cell Biol. Lipids 2020, 1865, 158767. [Google Scholar] [CrossRef] [PubMed]
  53. Knothe, G. “Designer” Biodiesel: optimizing fatty ester composition to improve fuel properties. Energ. Fuels 2008, 22, 1358–1364. [Google Scholar] [CrossRef]
  54. Manzoor, M.; Hussain, A.; Ahmad, Q. ul A.; Chaudhary, A.; Schenk, P.M.; Deepanraj, B.; Loke Show, P. Biodiesel quality assessment of microalgae cultivated mixotrophically on sugarcane bagasse. Sustain. Energy Technol. Assess. 2022, 53, 102359. [Google Scholar] [CrossRef]
  55. Dodson, V.J.; Mouget, J.L.; Dahmen, J.L.; Leblond, J.D. The long and short of it: temperature-dependent modifications of fatty acid chain length and unsaturation in the galactolipid profiles of the diatoms Haslea ostrearia and Phaeodactylum tricornutum. Hydrobiologia 2014, 727, 95–107. [Google Scholar] [CrossRef]
  56. McLachlan, J. Some considerations of the growth of marine algae in artificial media. Can. J. Microbiol. 2011, 10, 769–782. [Google Scholar] [CrossRef]
  57. Giovagnetti, V.; Ruban, A. V. Detachment of the fucoxanthin chlorophyll a/c binding protein (FCP) antenna is not involved in the acclimative regulation of photoprotection in the pennate diatom Phaeodactylum tricornutum. Biochim. Biophys. Acta (BBA) - Bioenergetics 2017, 1858, 218–230. [Google Scholar] [CrossRef]
  58. Jeffrey, S.W.; Humphrey, G.F. New spectrophotometric equations for determining chlorophylls a, b, c1 and c2 in higher plants, algae and natural phytoplankton. Biochem. Physiol. Pfl. 1975, 167, 191–194. [Google Scholar] [CrossRef]
  59. Strickland, J.D.H.; Parsons, T.R. A Practical Handbook of Seawater Analysis, 1972, 310, 2nd edition, Ottawa, Canada, Fisheries Research Board of Canada, (Bulletin Fisheries Research Board of Canada, Nr. 167). [CrossRef]
  60. Ren, X.; Wei, C.; Yan, Q.; Shan, X.; Wu, M.; Zhao, X.; Song, Y. Optimization of a novel lipid extraction process from microalgae. Sci. Rep. 2021, 11, 20221. [Google Scholar] [CrossRef] [PubMed]
  61. Hernández, M.L.; Guschina, I.A.; Martínez-Rivas, J.M.; Mancha, M.; Harwood, J.L. The utilization and desaturation of oleate and linoleate during glycerolipid biosynthesis in Olive (Olea Europaea L.) callus cultures. J. Exp. Bot. 2008, 59, 2425–2435. [Google Scholar] [CrossRef]
  62. Garcés, R.; Mancha, M. One-step lipid extraction and fatty acid methyl esters preparation from fresh plant tissues. Anal Biochem 1993, 211, 139–143. [Google Scholar] [CrossRef] [PubMed]
  63. Gallardo-Martínez, A.M.; Jiménez-López, J.; Hernández, M.L.; Pérez-Ruiz, J.M.; Cejudo, F.J. Plastid 2-Cys peroxiredoxins are essential for embryogenesis in Arabidopsis. Redox Biol. 2023, 62, 102645. [Google Scholar] [CrossRef] [PubMed]
  64. Ducruet, J.M.; Miranda, T. Graphical and numerical analysis of thermoluminescence and fluorescence F0 emission in photosynthetic material. Photosynth. Res. 1992, 33, 15–27. [Google Scholar] [CrossRef]
  65. Ducruet, J.M.; Serrano, A.; Roncel, M.; Ortega, J.M. Peculiar properties of chlorophyll thermoluminescence emission of autotrophically or mixotrophically grown Chlamydomonas reinhardtii. J. Photochem. Photobiol. B 2011, 104, 301–307. [Google Scholar] [CrossRef]
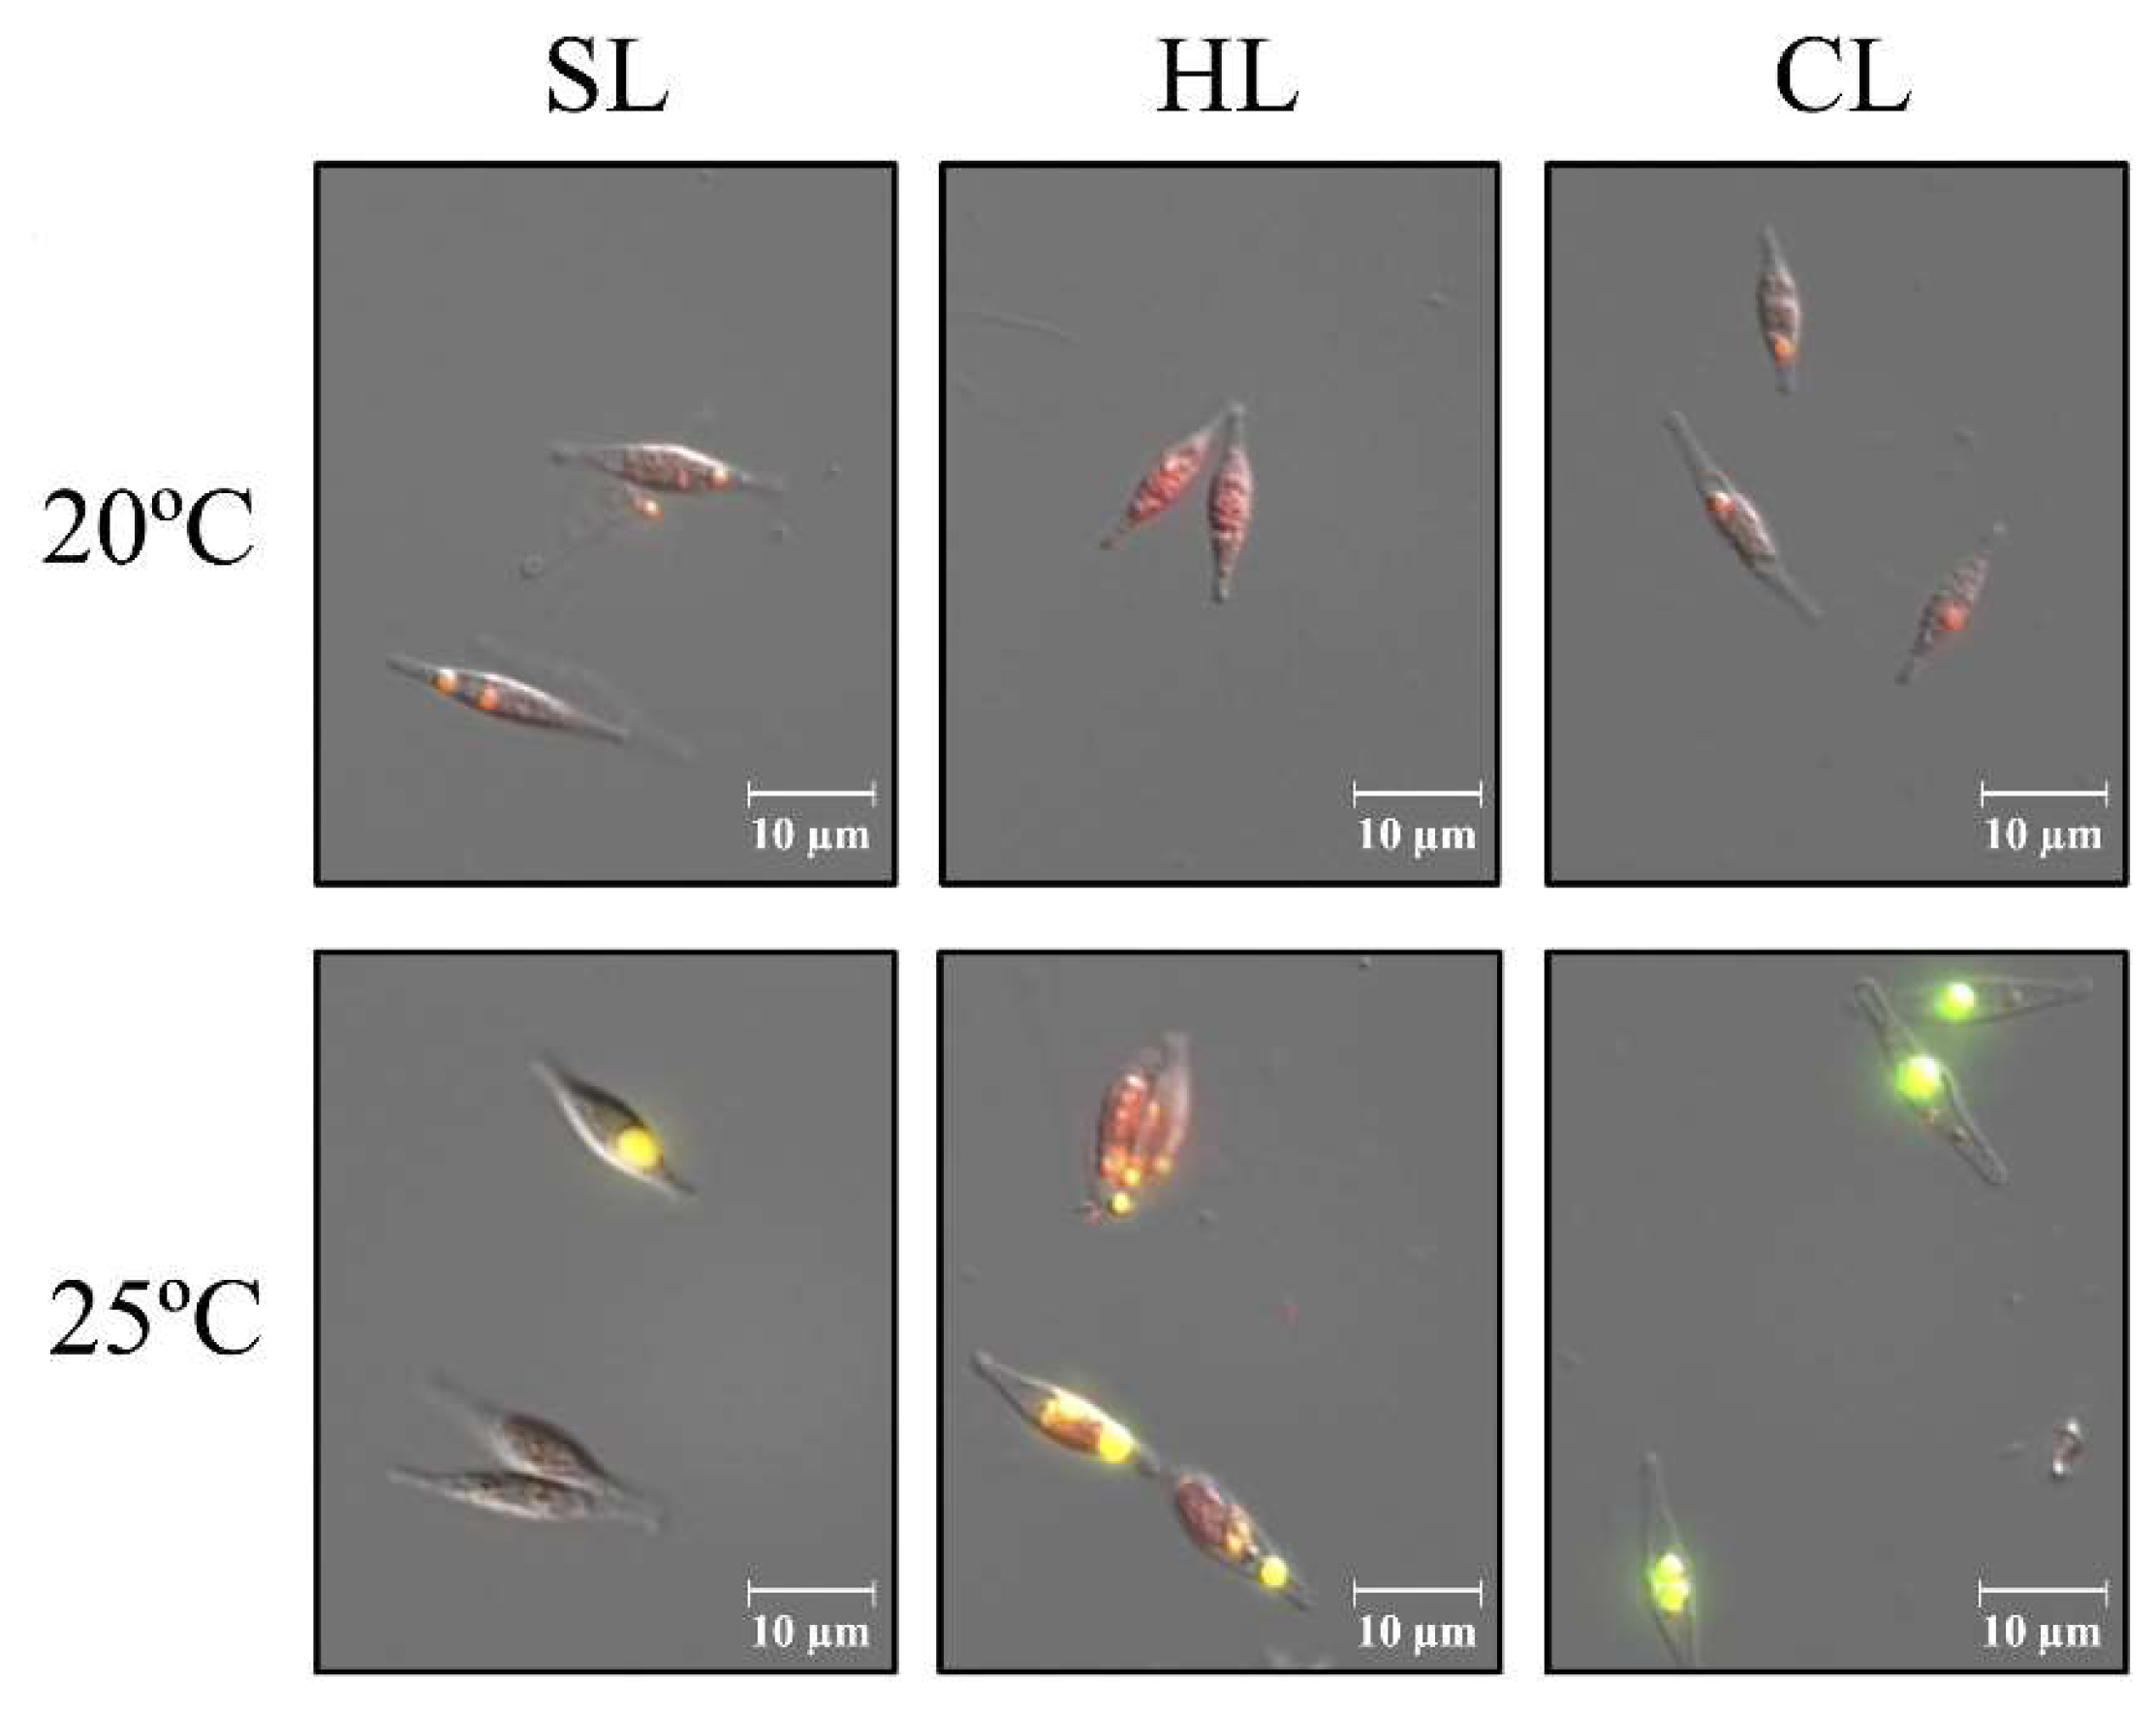
Figure 1. Fluorescent microscopy images of cells stained with Red Nile from P. tricornutum cultures grown under different conditions of temperature and light intensity, as indicated. SL, 25 µmol m-2 s-1; HL, 60 µmol m-2 s-1; CL, continuous illumination at 25 µmol m-2 s-1. See the Material and Methods section for more details.
Preprints 138477 g001
Figure 2. (A) Relative linear electron transport rate (rETR) in P. tricornutum cultures under standard light (SL; 25 µmol m-2 s-1) at 20°C or 25°C, as indicated. rETR values were determined as a function of irradiance derived from steady-state light curves. Chlorophyll fluorescence was measured with a pulse-amplitude modulation fluorometer and rETR values were determined during stepwise increasing photosynthetically active radiation (PAR) from 0 up to 830 µmol m-2 s-1 light intensity. Data represent mean values ± SD of five independent measurements. (B) Intensities of the TL B-band for P. tricornutum cultures investigated under different conditions of temperature and light intensity, as indicated (SL, 25 µmol m-2 s-1; HL, 60 µmol m-2 s-1; CL, continuous illumination at 25 µmol m-2 s-1). Intensities were obtained from the component analysis of the TL glow curves. Data represent mean values ± SD of five independent measurements. Asterisks mark statistically significant different data groups (p < 0.05). For other details see the Material and Methods section.
Preprints 138477 g002
Figure 3. PSI activity of P. tricornutum cultures grown under different conditions of temperature and light intensity, as indicated. The redox state of the PSI reaction centre, P700, was monitored through the changes in absorbance at 830 nm versus 875 nm, measured with a pulse-amplitude modulation fluorometer. Cultures were kept in the dark for 30 min prior to the measurements. After the initial determination of the maximal oxidation of P700, actinic light was turned on at an intensity of 95 µmol m-2 s-1 and saturating pulses were applied every 20 s. After 5 min, the actinic light was switched off and measurements continued for another 5 min. Changes of (upper) quantum yields of PSI, Y(I), and (lower) donor side limitations, Y(ND), during the induction curve are displayed. Data represent the mean values ± SD of five independent measurements. White and black bars below graphs indicate periods of illumination with actinic light and darkness, respectively. SL, 25 µmol m-2 s-1; HL, 60 µmol m-2 s-1; CL, continuous illumination at 25 µmol m-2 s-1.
Preprints 138477 g003
Figure 4. Total fatty acids (TFA), triacylglycerides (TAG) and sterol esters (SE) content, measured as µg per mg of dry weight, of P. tricornutum cells grown under different conditions of temperature and light intensity, as indicated. Data represent mean values ± SD of three independent biological replicates. SL, 25 µmol m-2 s-1; HL, 60 µmol m-2 s-1; CL, continuous illumination at 25 µmol m-2 s-1. Asterisks mark statistically significant different data groups (p < 0.05) (see the Material and Methods section).
Preprints 138477 g004
Figure 5. Ratio of saturated (SFA), monounsaturated (MUFA) and polyunsaturated (PUFA) fatty acids contents in P. tricornutum cells grown under different conditions of temperature and light intensity, as indicated. Values are referred to the percentage of total fatty acids (upper; TFAs) or triacylglycerides (lower; TAGs). Data represent mean percentage values from three independent biological replicates. SL, 25 µmol m-2 s-1; HL, 60 µmol m-2 s-1; CL, continuous illumination at 25 µmol m-2 s-1.
Preprints 138477 g005
Table 1. General physiological and biochemical parameters of P. tricornutum cells and cultures grown under the different conditions of temperature and light intensity here investigated.
SL (25 µmol m-2 s-1) HL (60 µmol m-2 s-1) CL (25 µmol m-2 s-1)
Parametera) 20ºC 25ºC 20ºC 25ºC 20ºC 25ºC
Specific growth rate, µ(day-1) 0.294±0.021(100%)b) 0.218±0.001(74%) 0.311±0.021(100%) 0.290±0.001(93%) 0.317±0.018(100%) 0.266±0.001 (84%)
Cells per mL (x10–7) 1.680±0.180(100%) 1.250±0.003(74%) 1.880±0.201(100%) 1.550±0.004(82%) 1.120±0.120 (100%) 1.210±0.003(108%)
Net photosynthetic rate (µmol O2 h-1 per 106 cells) 35.536±0.176(100%) 15.451±0.091(43%) 22.309±1.499(100%) 17.690±0.969(79%) 36.696±1.668(100%) 16.926±0.445(46%)
Total Chl per cell(pg cell-1) 0.851±0.057(100%) 0.863±0.074(102%) 0.606±0.025(100%) 0.816±0.029(135%) 1.033±0.053(100%) 0.818±0.035(79%)
Chl a/Chl c 4.163(100%) 6.238(150%) 6.032(100%) 8.263(137%) 3.331(100%) 2.582(78%)
Total carotenoids per cell (pg cell-1) 0.260±0.004(100%) 0.287±0.001(110%) 0.245±0.001(100%) 0.512±0.001(209%) 0.361±0.009(100%) 0.140±0.004(39%)
Fv/Fm 0.61 ± 0.02 0.66 ± 0.01 0.59 ± 0.01 0.64 ± 0.02 0.59 ± 0.07 0.58 ± 0.04
rETRmax 6.75 ± 0.18 5.17± 0.13 11.82 ± 0.22 7.67 ± 0.55 7.66 ± 0.19 10.54 ± 0.39
rETR (at PARmax) 3.44 ± 0.51 1.88 ± 1.13 11.35 ± 0.63 6.79 ± 0.69 6.89 ± 0.41 10.55 ± 0.18
Pm 0.238 ± 0.022 0.426 ± 0.005 0.176 ± 0.025 0.254 ± 0.015 0.123 ± 0.016 0.236 ± 0.007
a)See the Materials and Methods section for more details. Specific growth rates (µ) were calculated in the exponential phase of culture growth, while the rest of the parameters were determined after 15 days of culture growth. b)Below, in parentheses, values referred to as the percentage of that of cells grown at 20°C under each condition. Fv/Fm, maximum quantum yield of PSII. rETRmax, relative maximum electron transport rate. rETR, relative electron transport rate at the maximum photosynthetically active radiation intensity (PARmax) of 830 µmol m-2 s-1). Pm maximal P700+ signal upon full oxidation.
Disclaimer/Publisher’s Note: The statements, opinions and data contained in all publications are solely those of the individual author(s) and contributor(s) and not of MDPI and/or the editor(s). MDPI and/or the editor(s) disclaim responsibility for any injury to people or property resulting from any ideas, methods, instructions or products referred to in the content.
Copyright: This open access article is published under a Creative Commons CC BY 4.0 license, which permit the free download, distribution, and reuse, provided that the author and preprint are cited in any reuse.
Alerts
Prerpints.org logo

Preprints.org is a free preprint server supported by MDPI in Basel, Switzerland.

Subscribe

© 2025 MDPI (Basel, Switzerland) unless otherwise stated