Submitted:
02 November 2024
Posted:
05 November 2024
You are already at the latest version
Abstract
Keywords:
1. Introduction
2. Materials and Methods

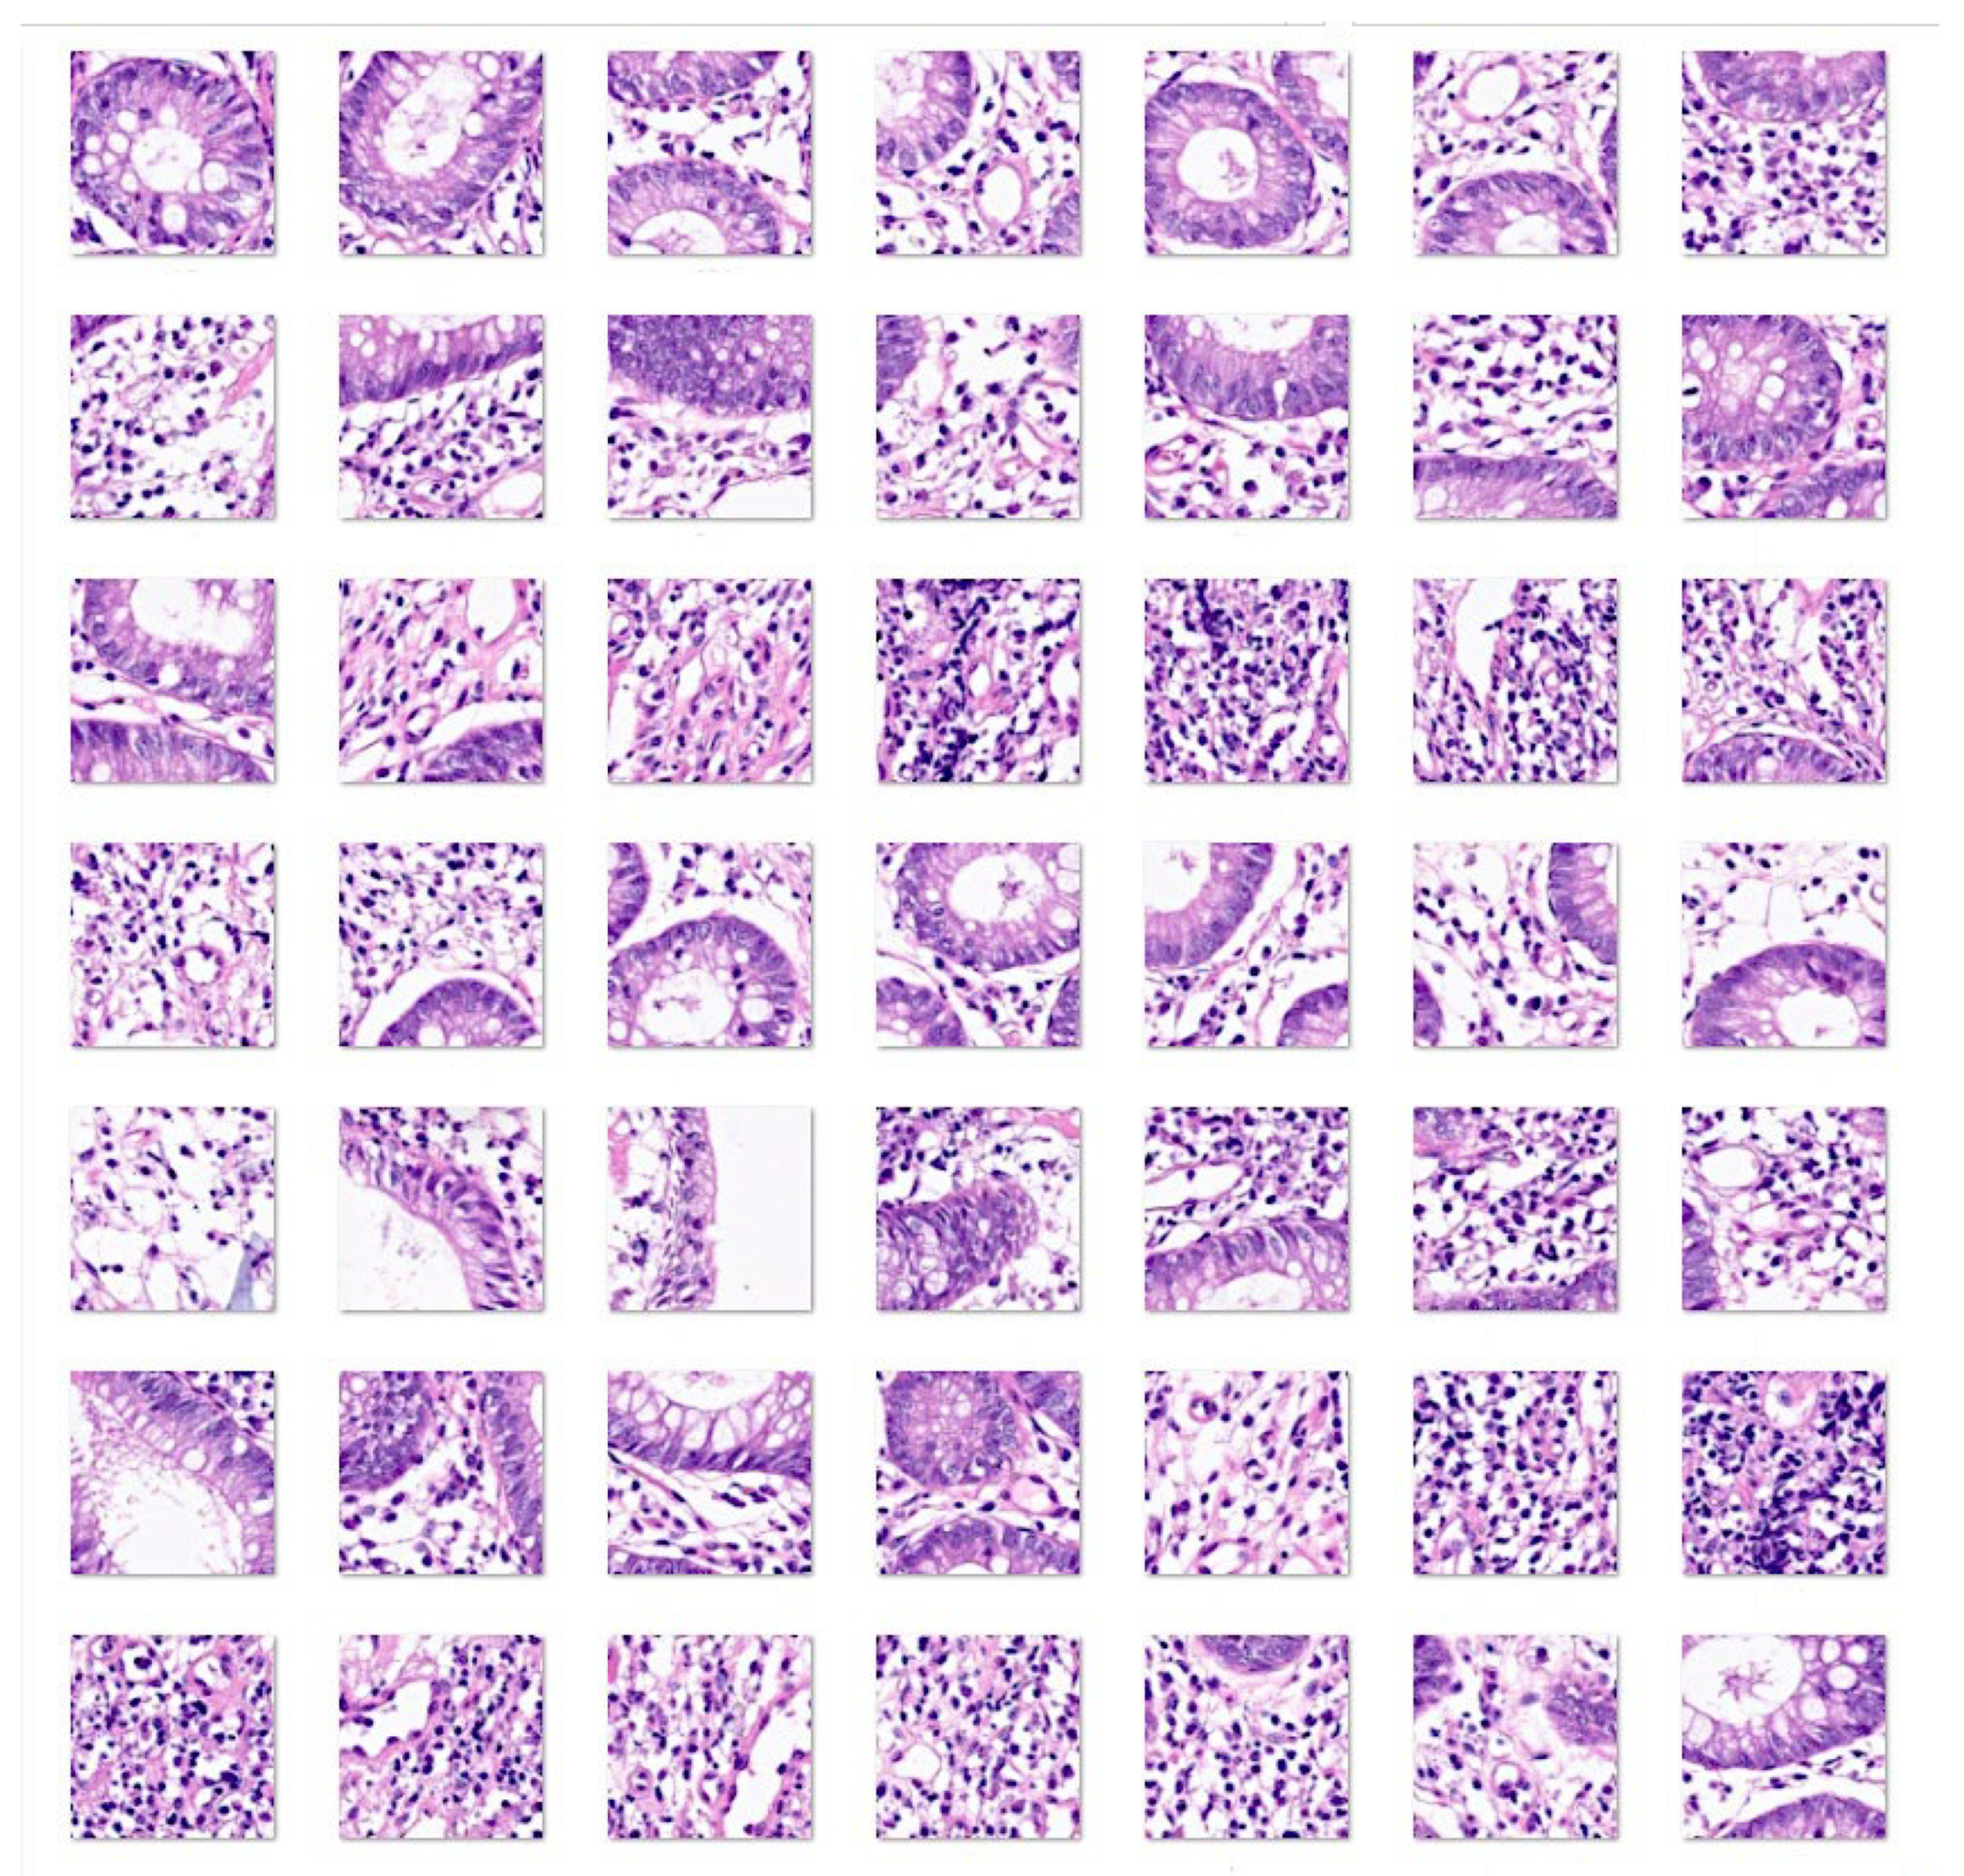
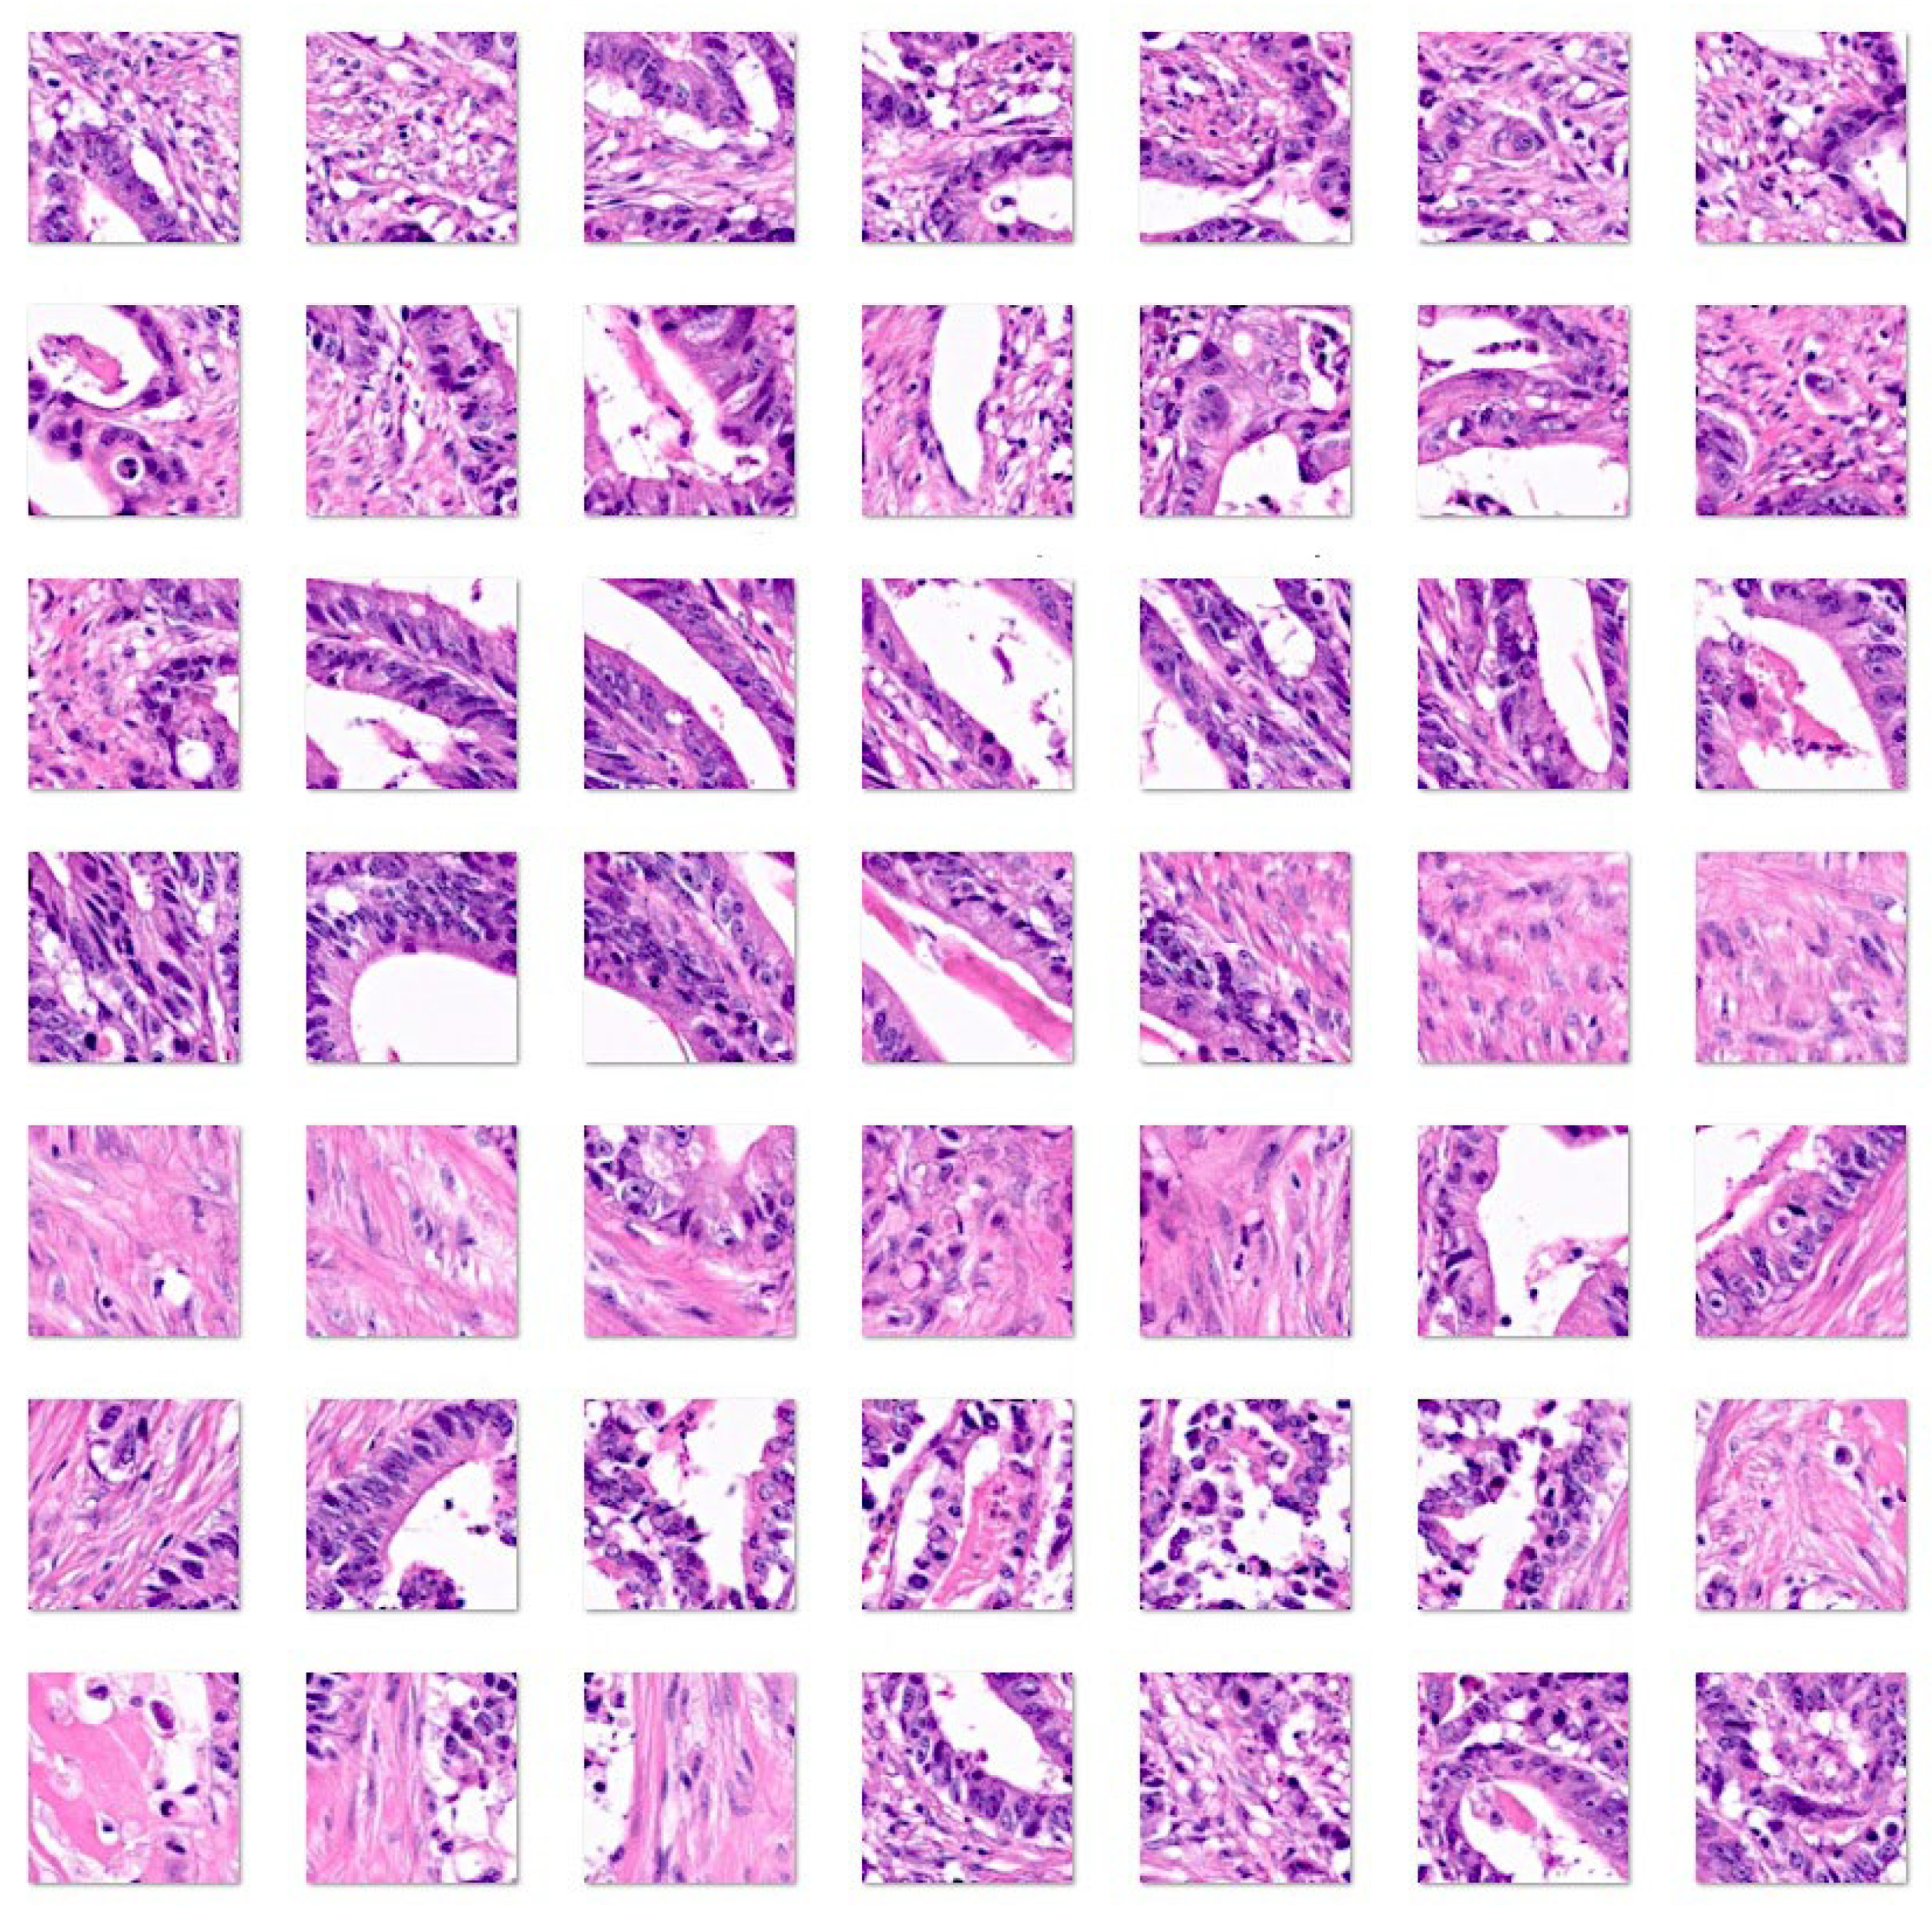
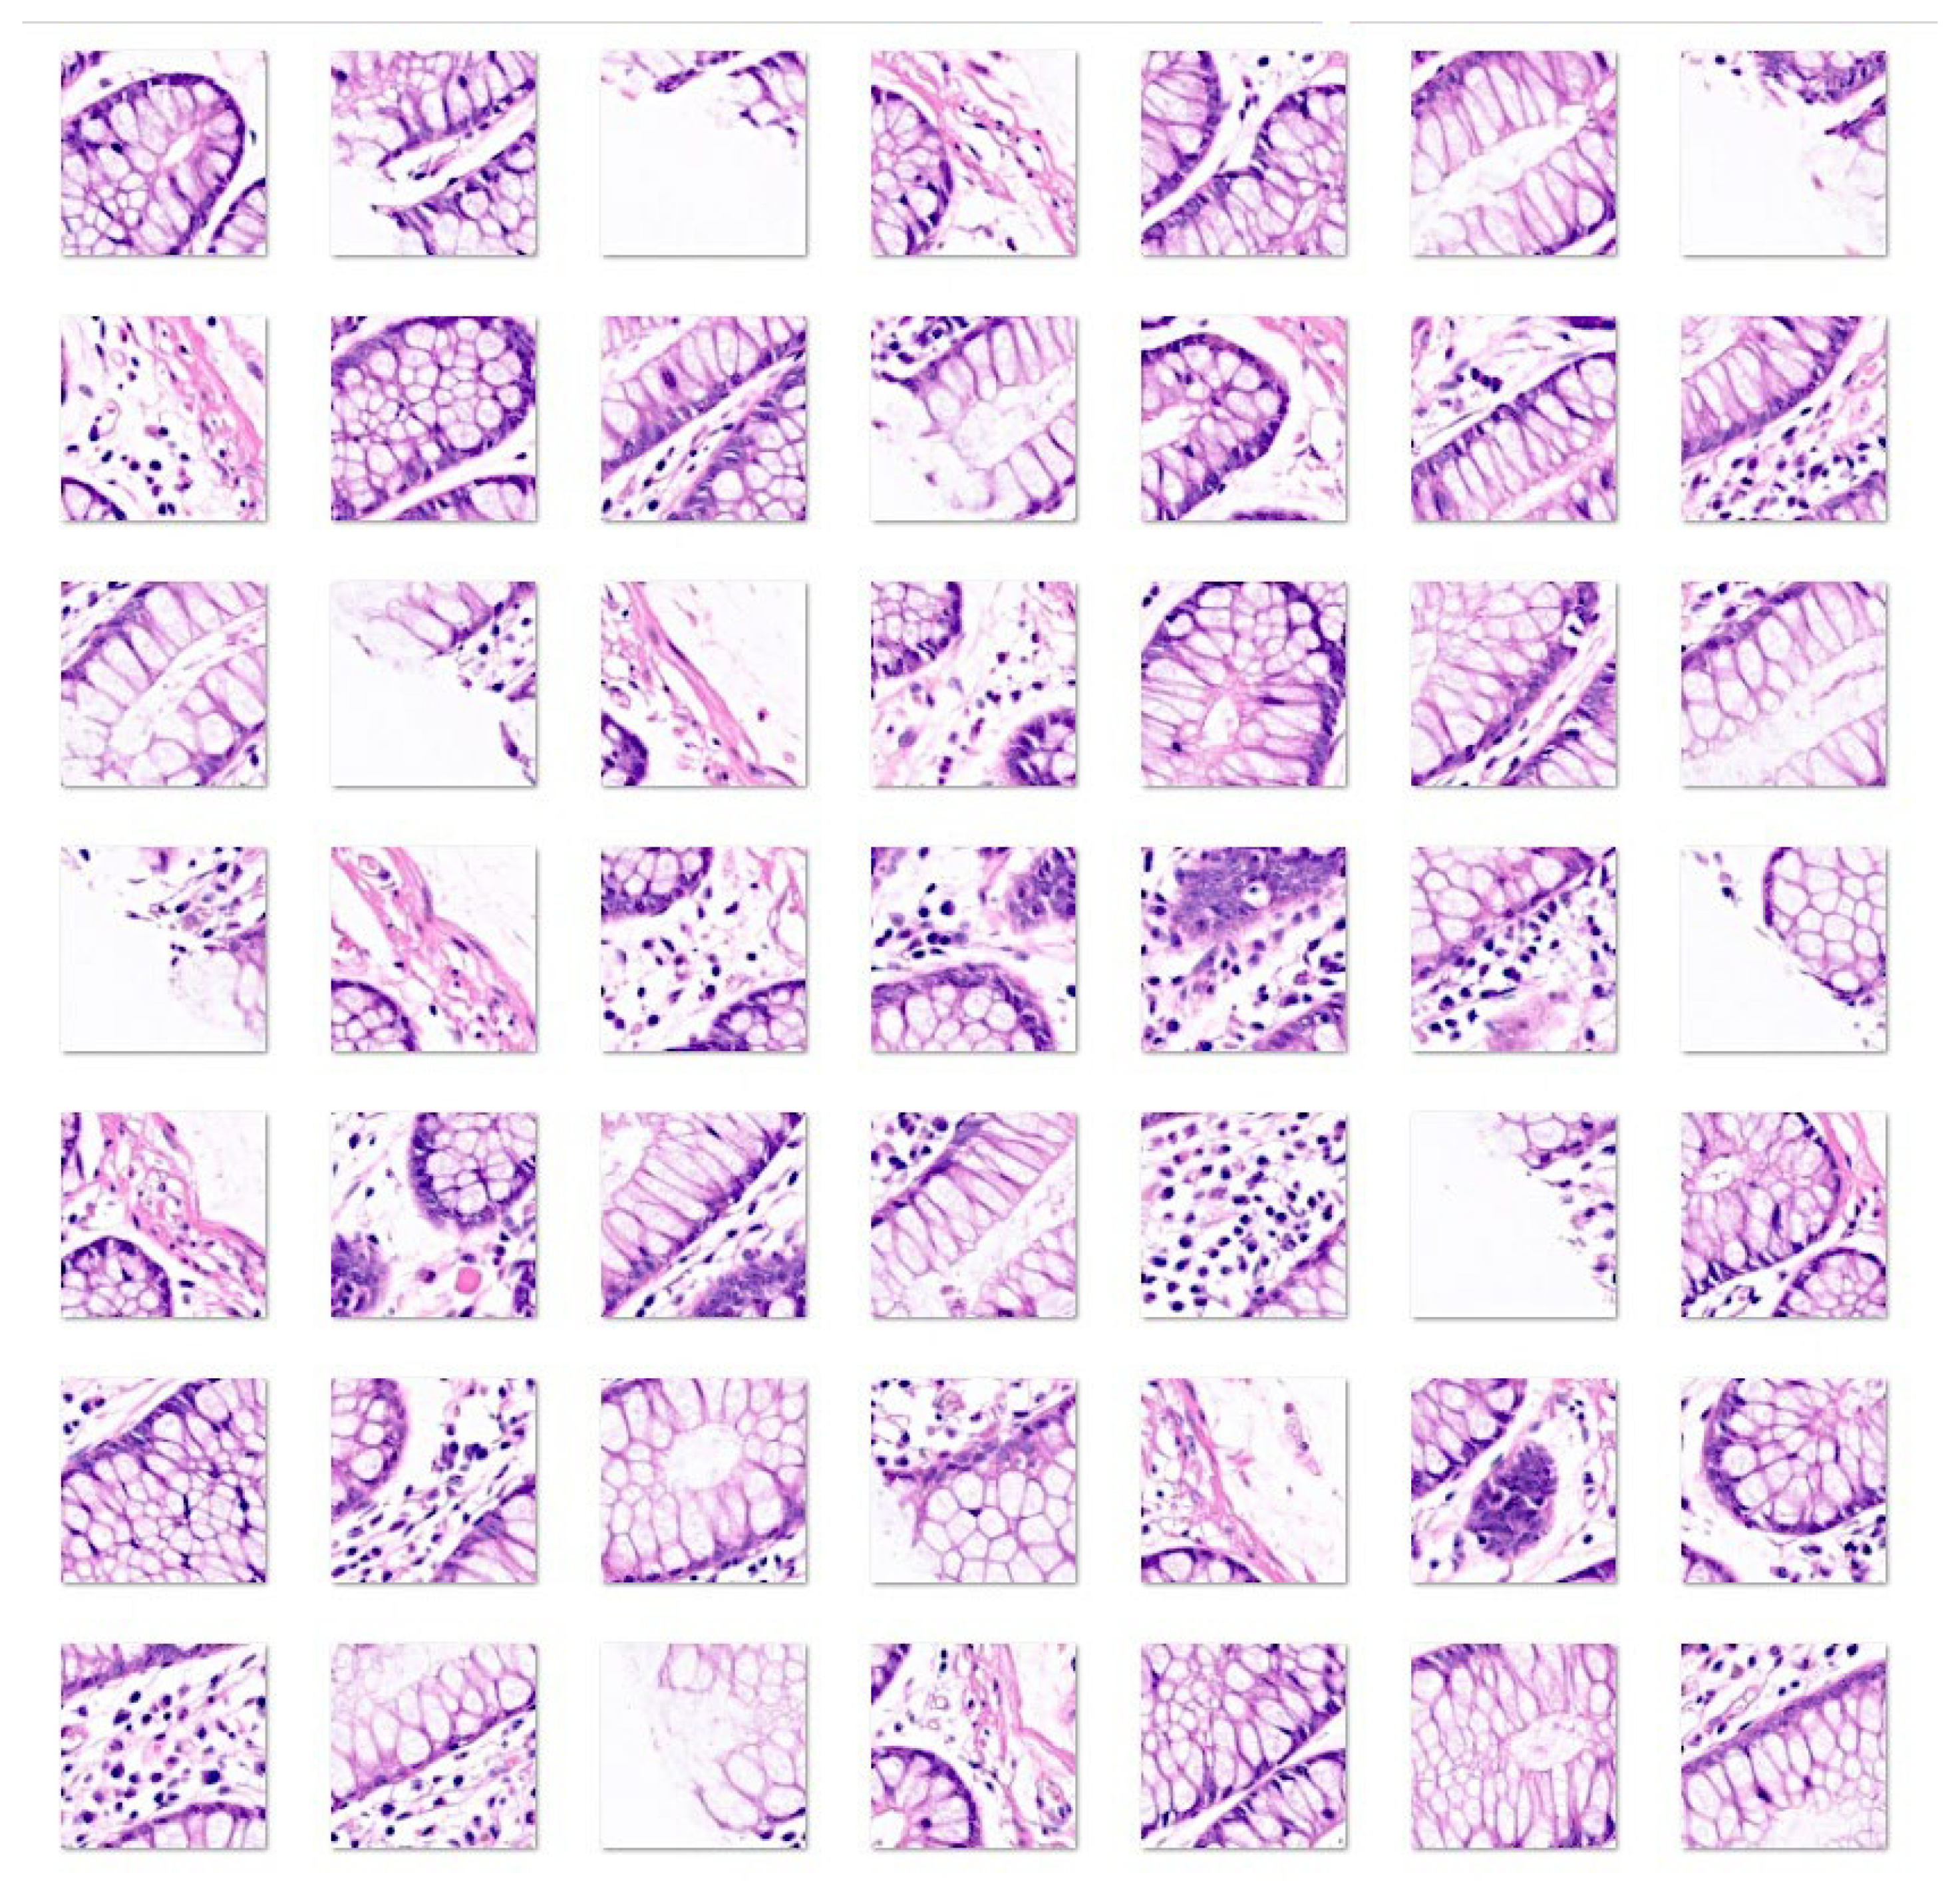
3. Results
3.1. Image classification based on transfer learning from ResNet-18
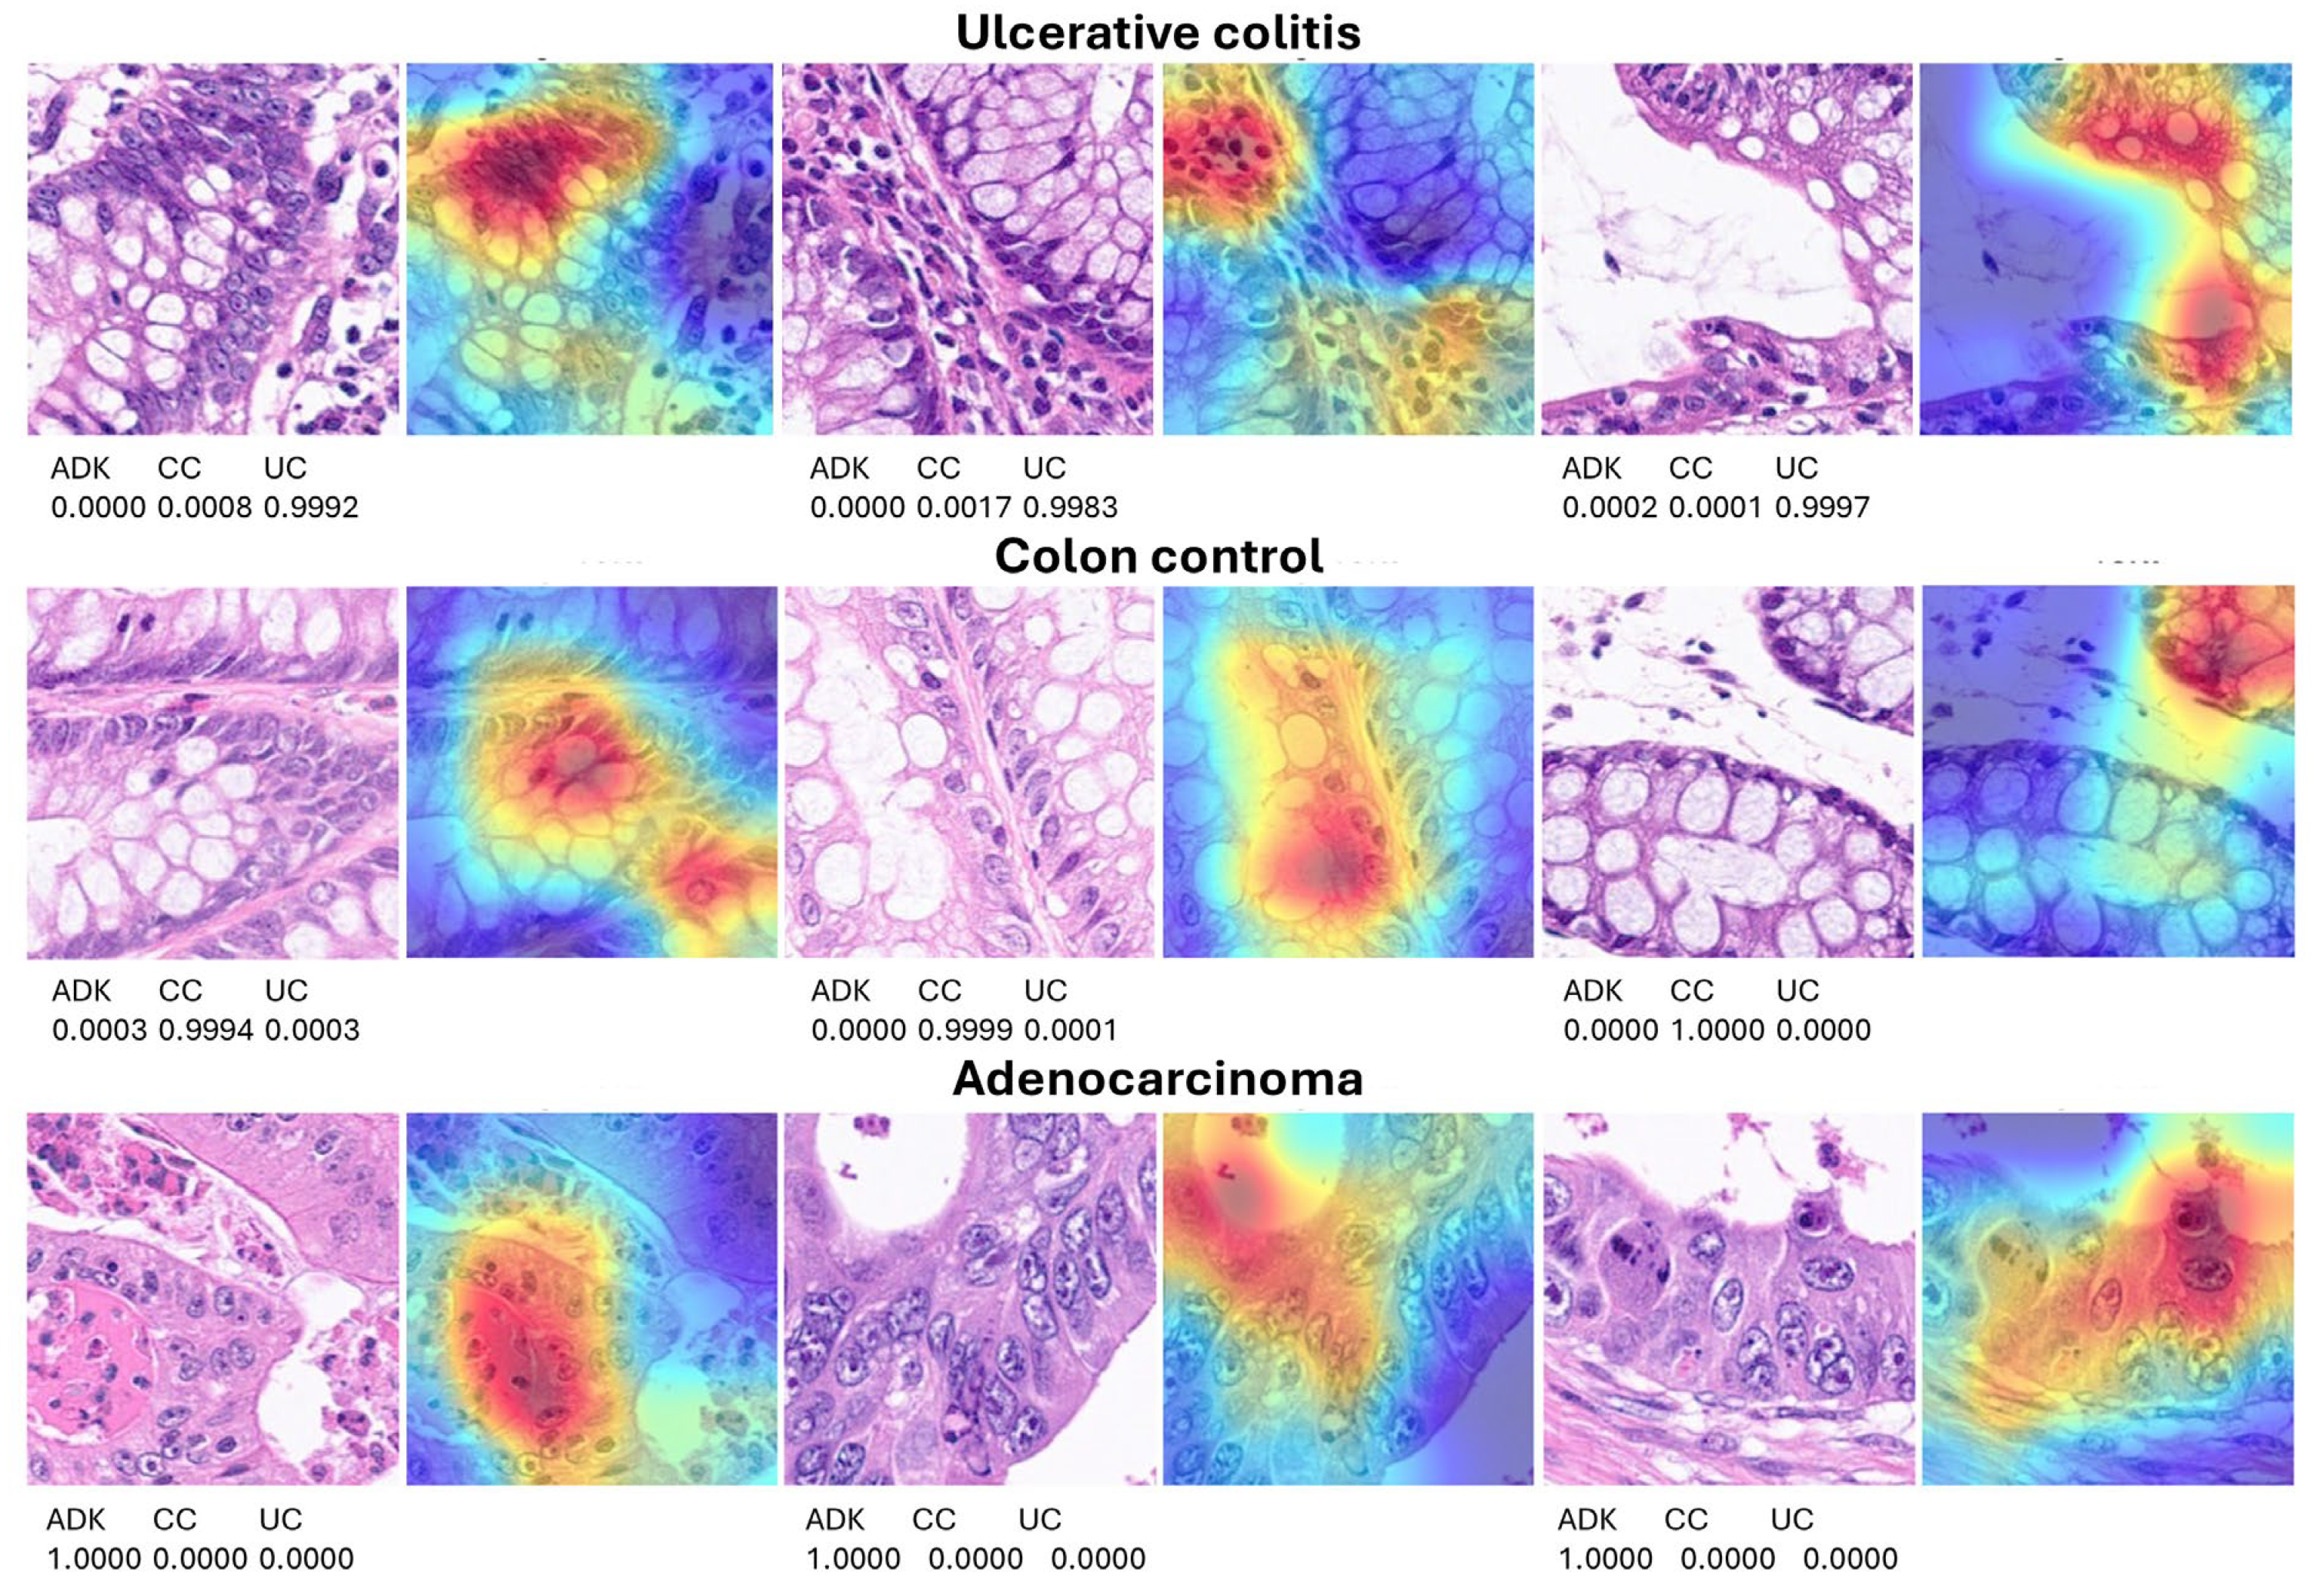
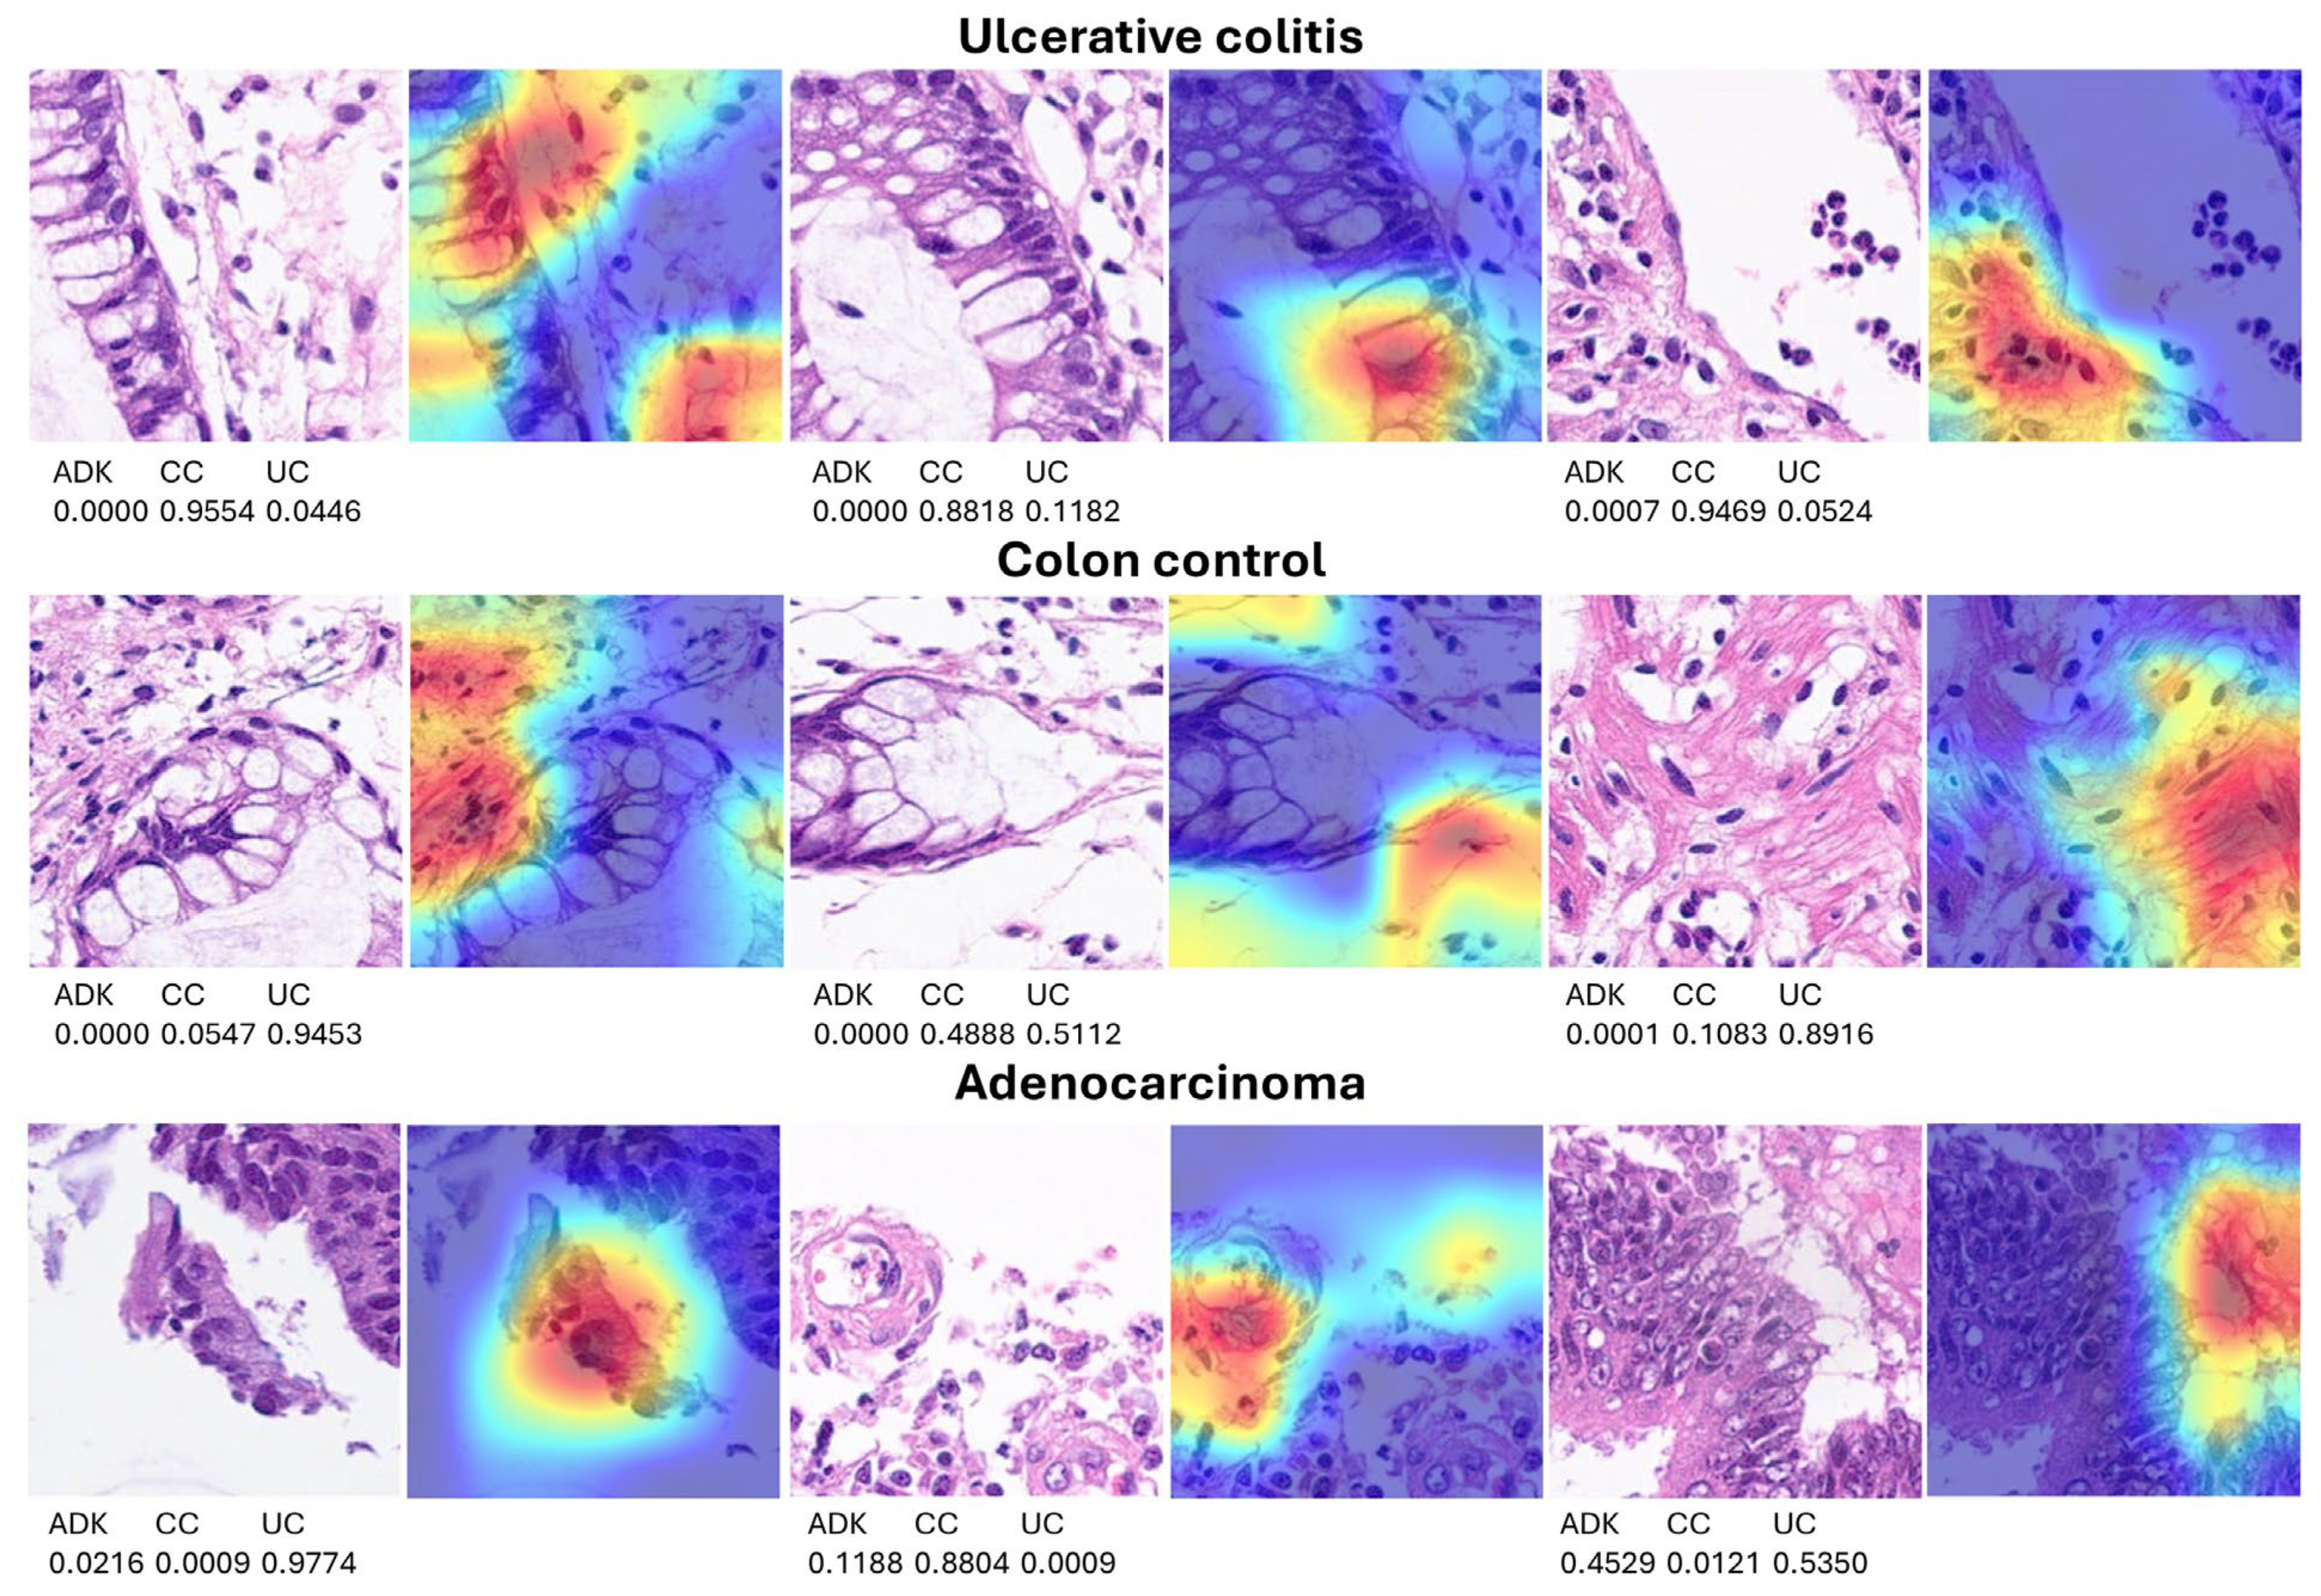
3.2. Grad-CAM Heatmap Analysis
3.3. Differentiation between steroid-requiring (SR) and nonsteroid requiring (non-SR) ulcerative colitis
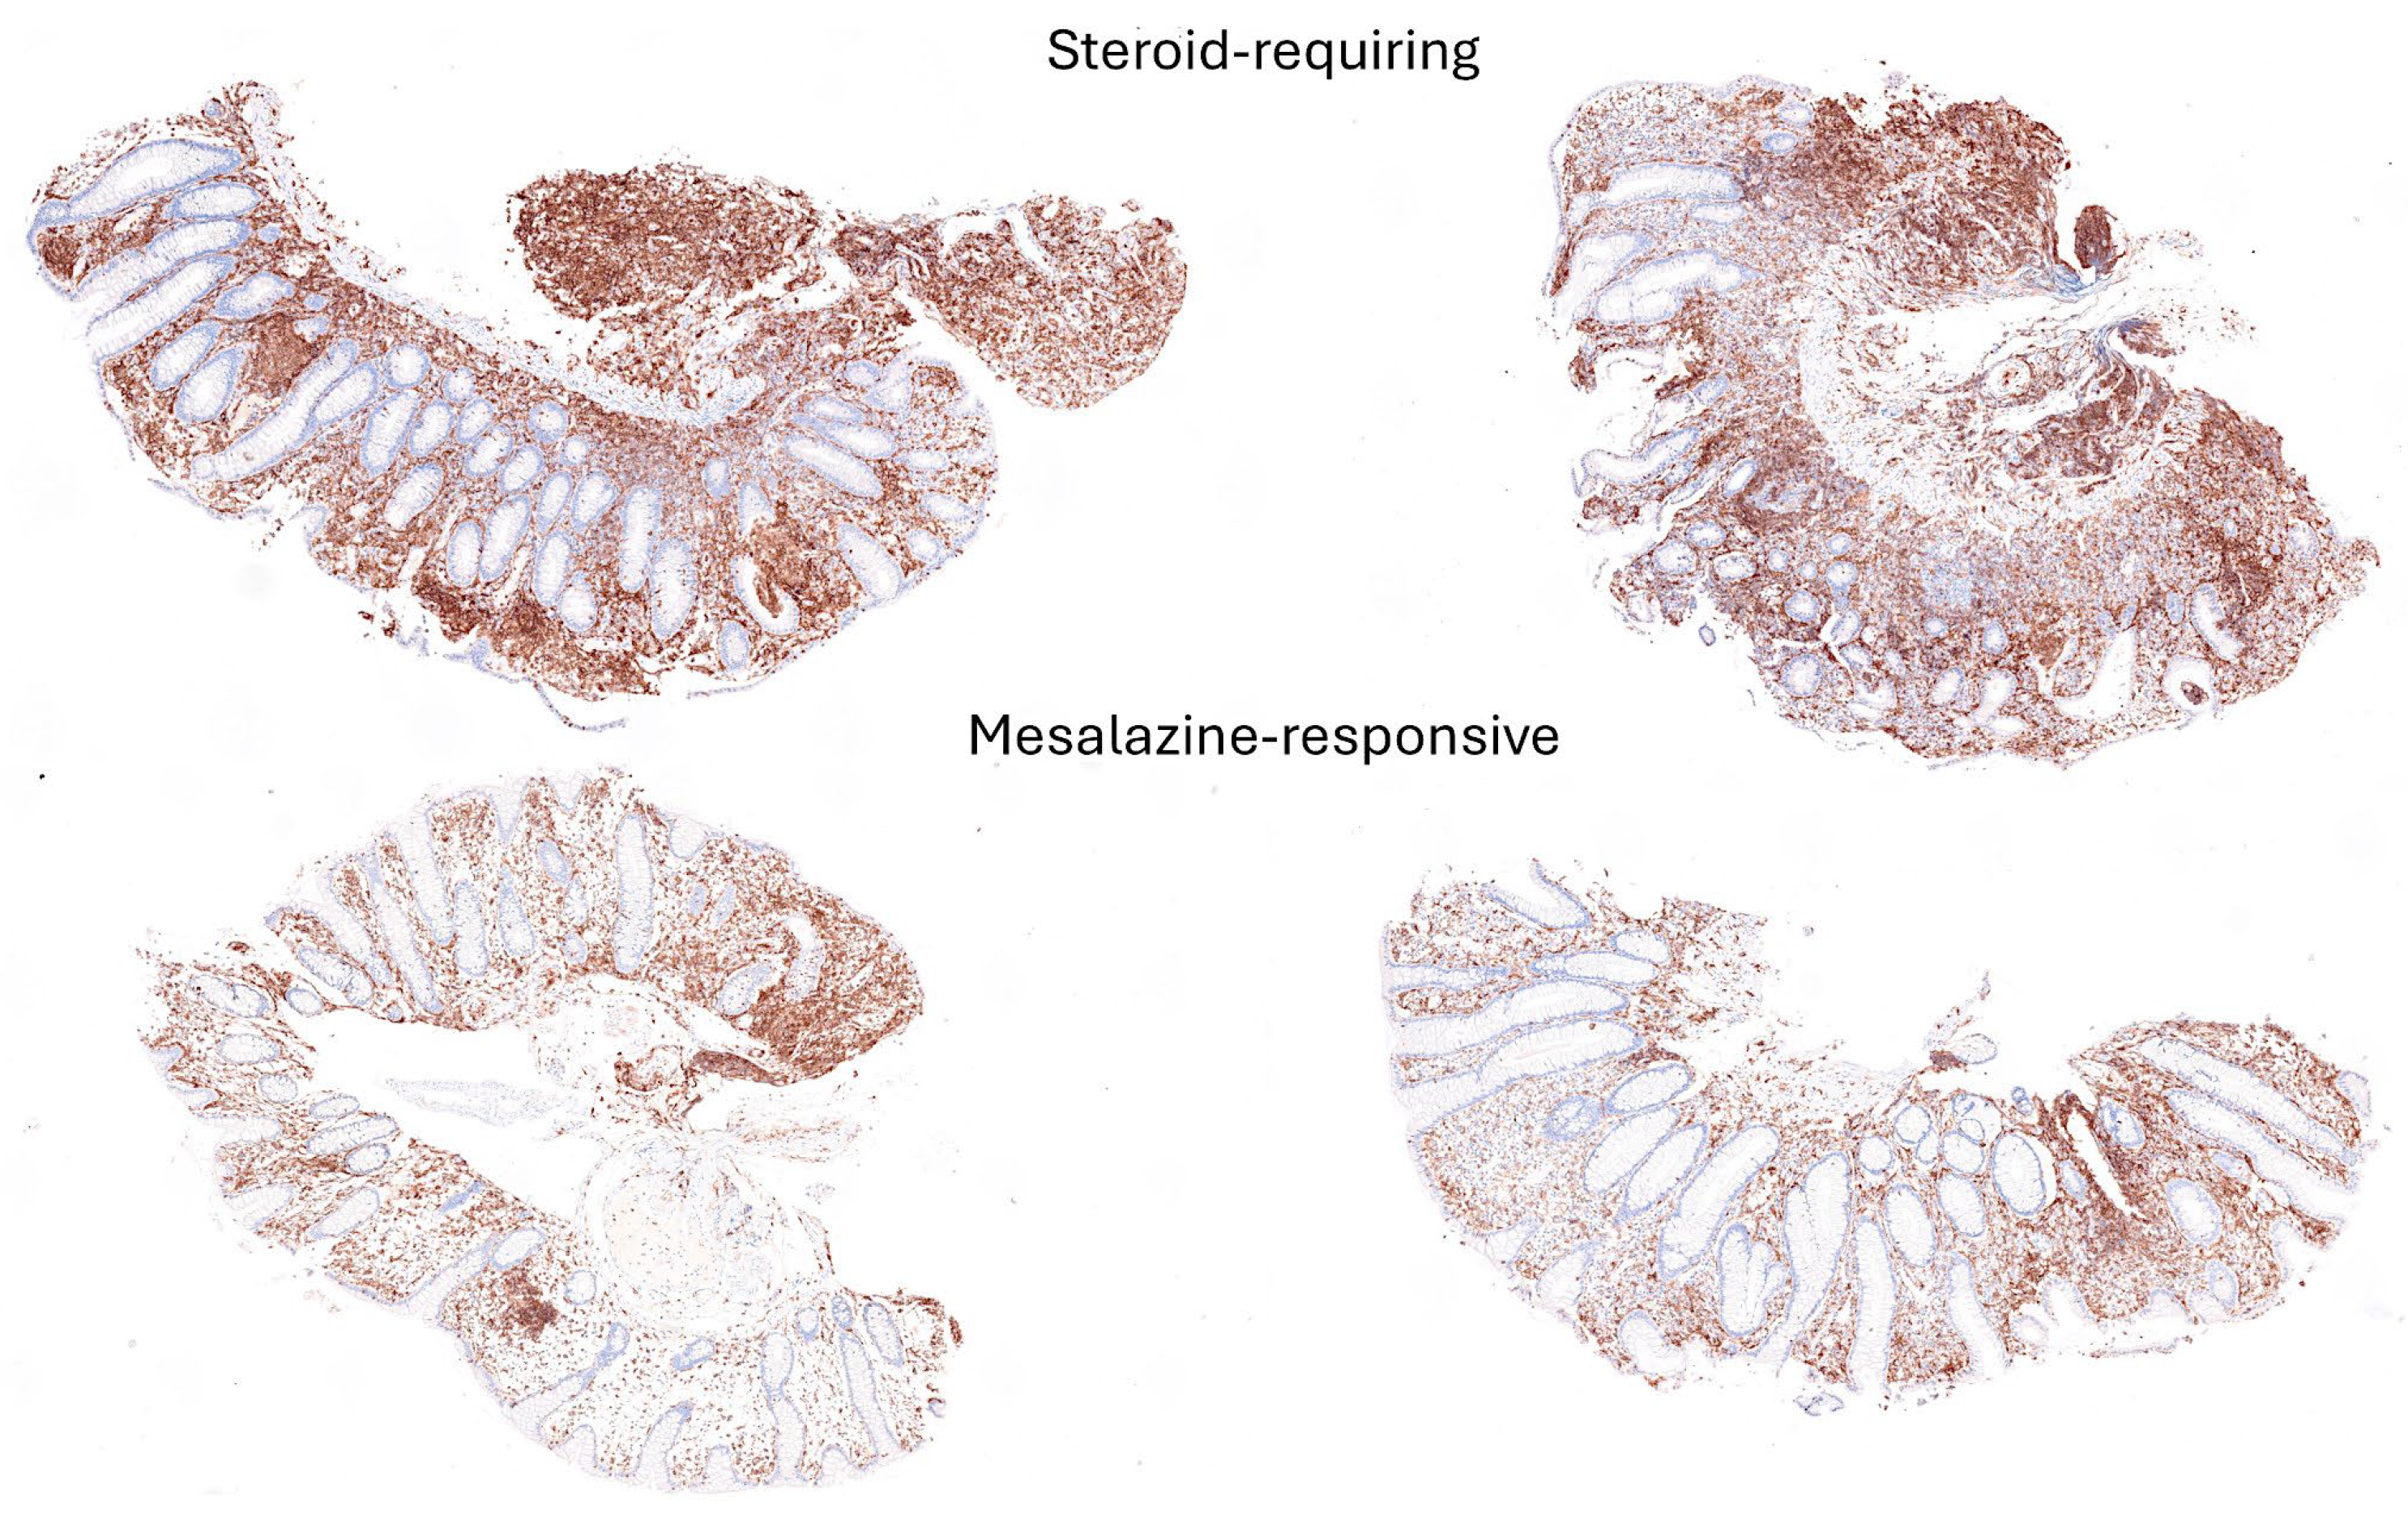
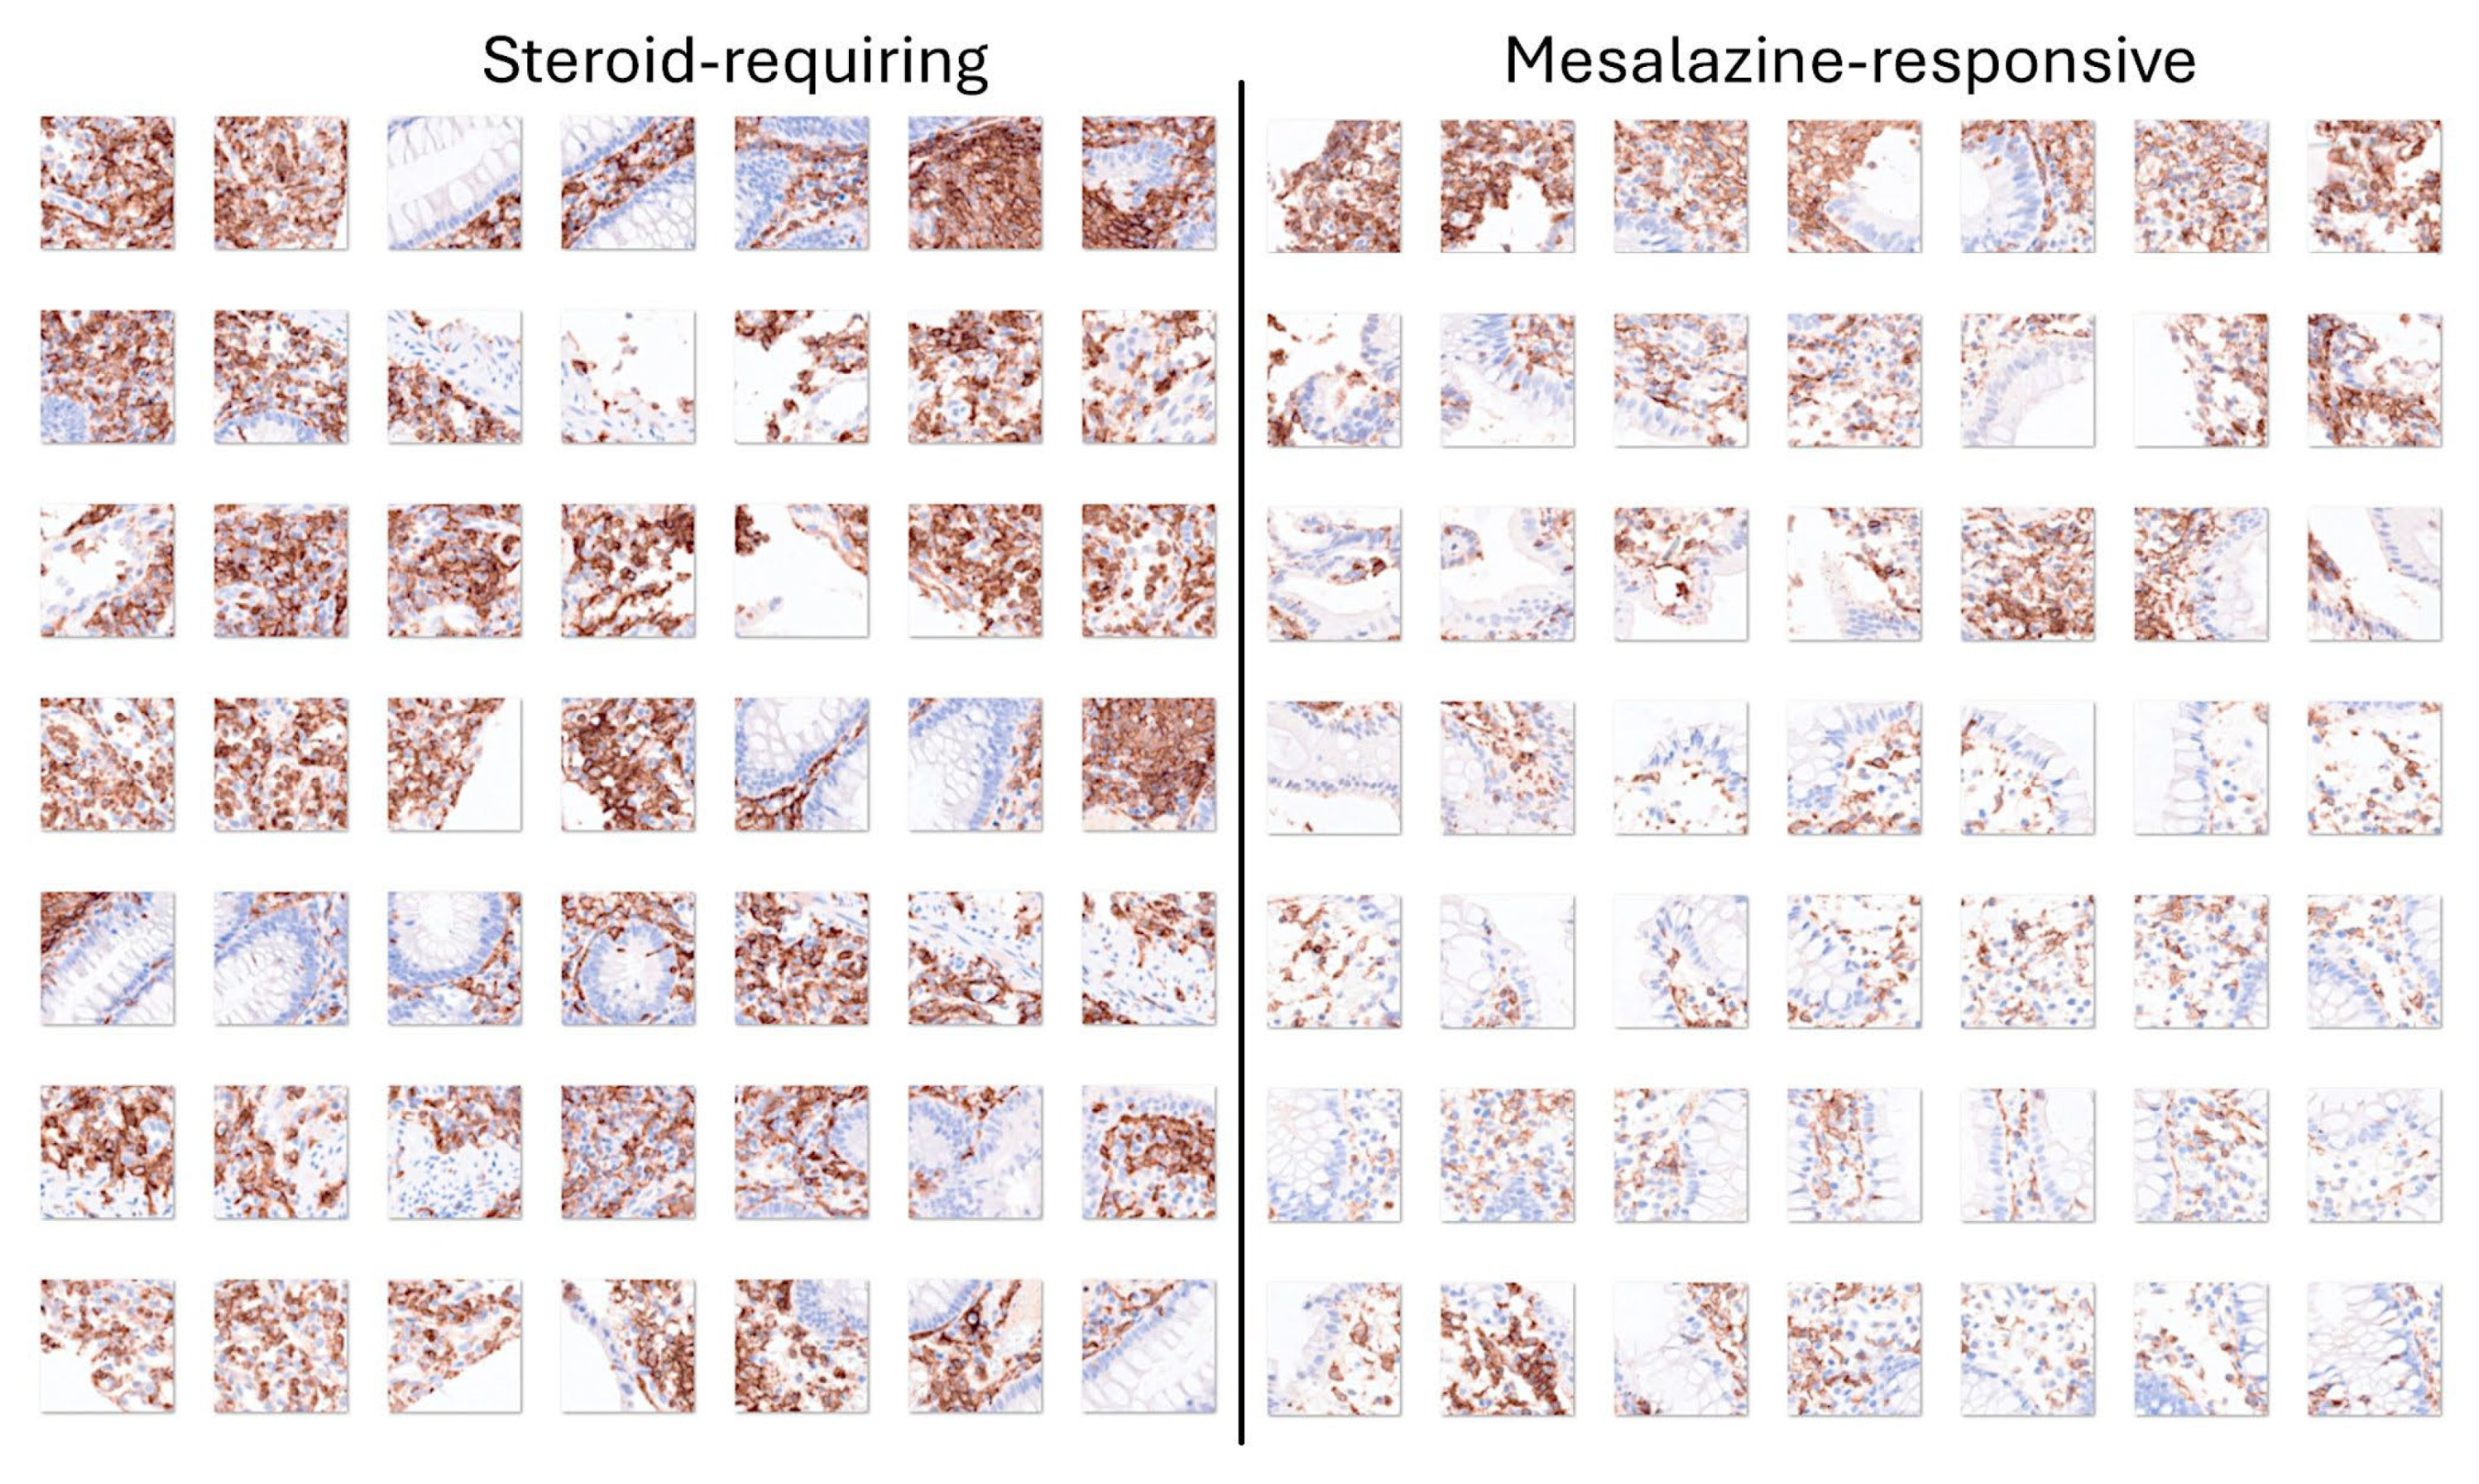
3.4. Differentiation Between Steroid-Requiring (SR) and Nonsteroid Requiring (non-SR) Ulcerative Colitis Using LAIR1 Immunohistochemistry
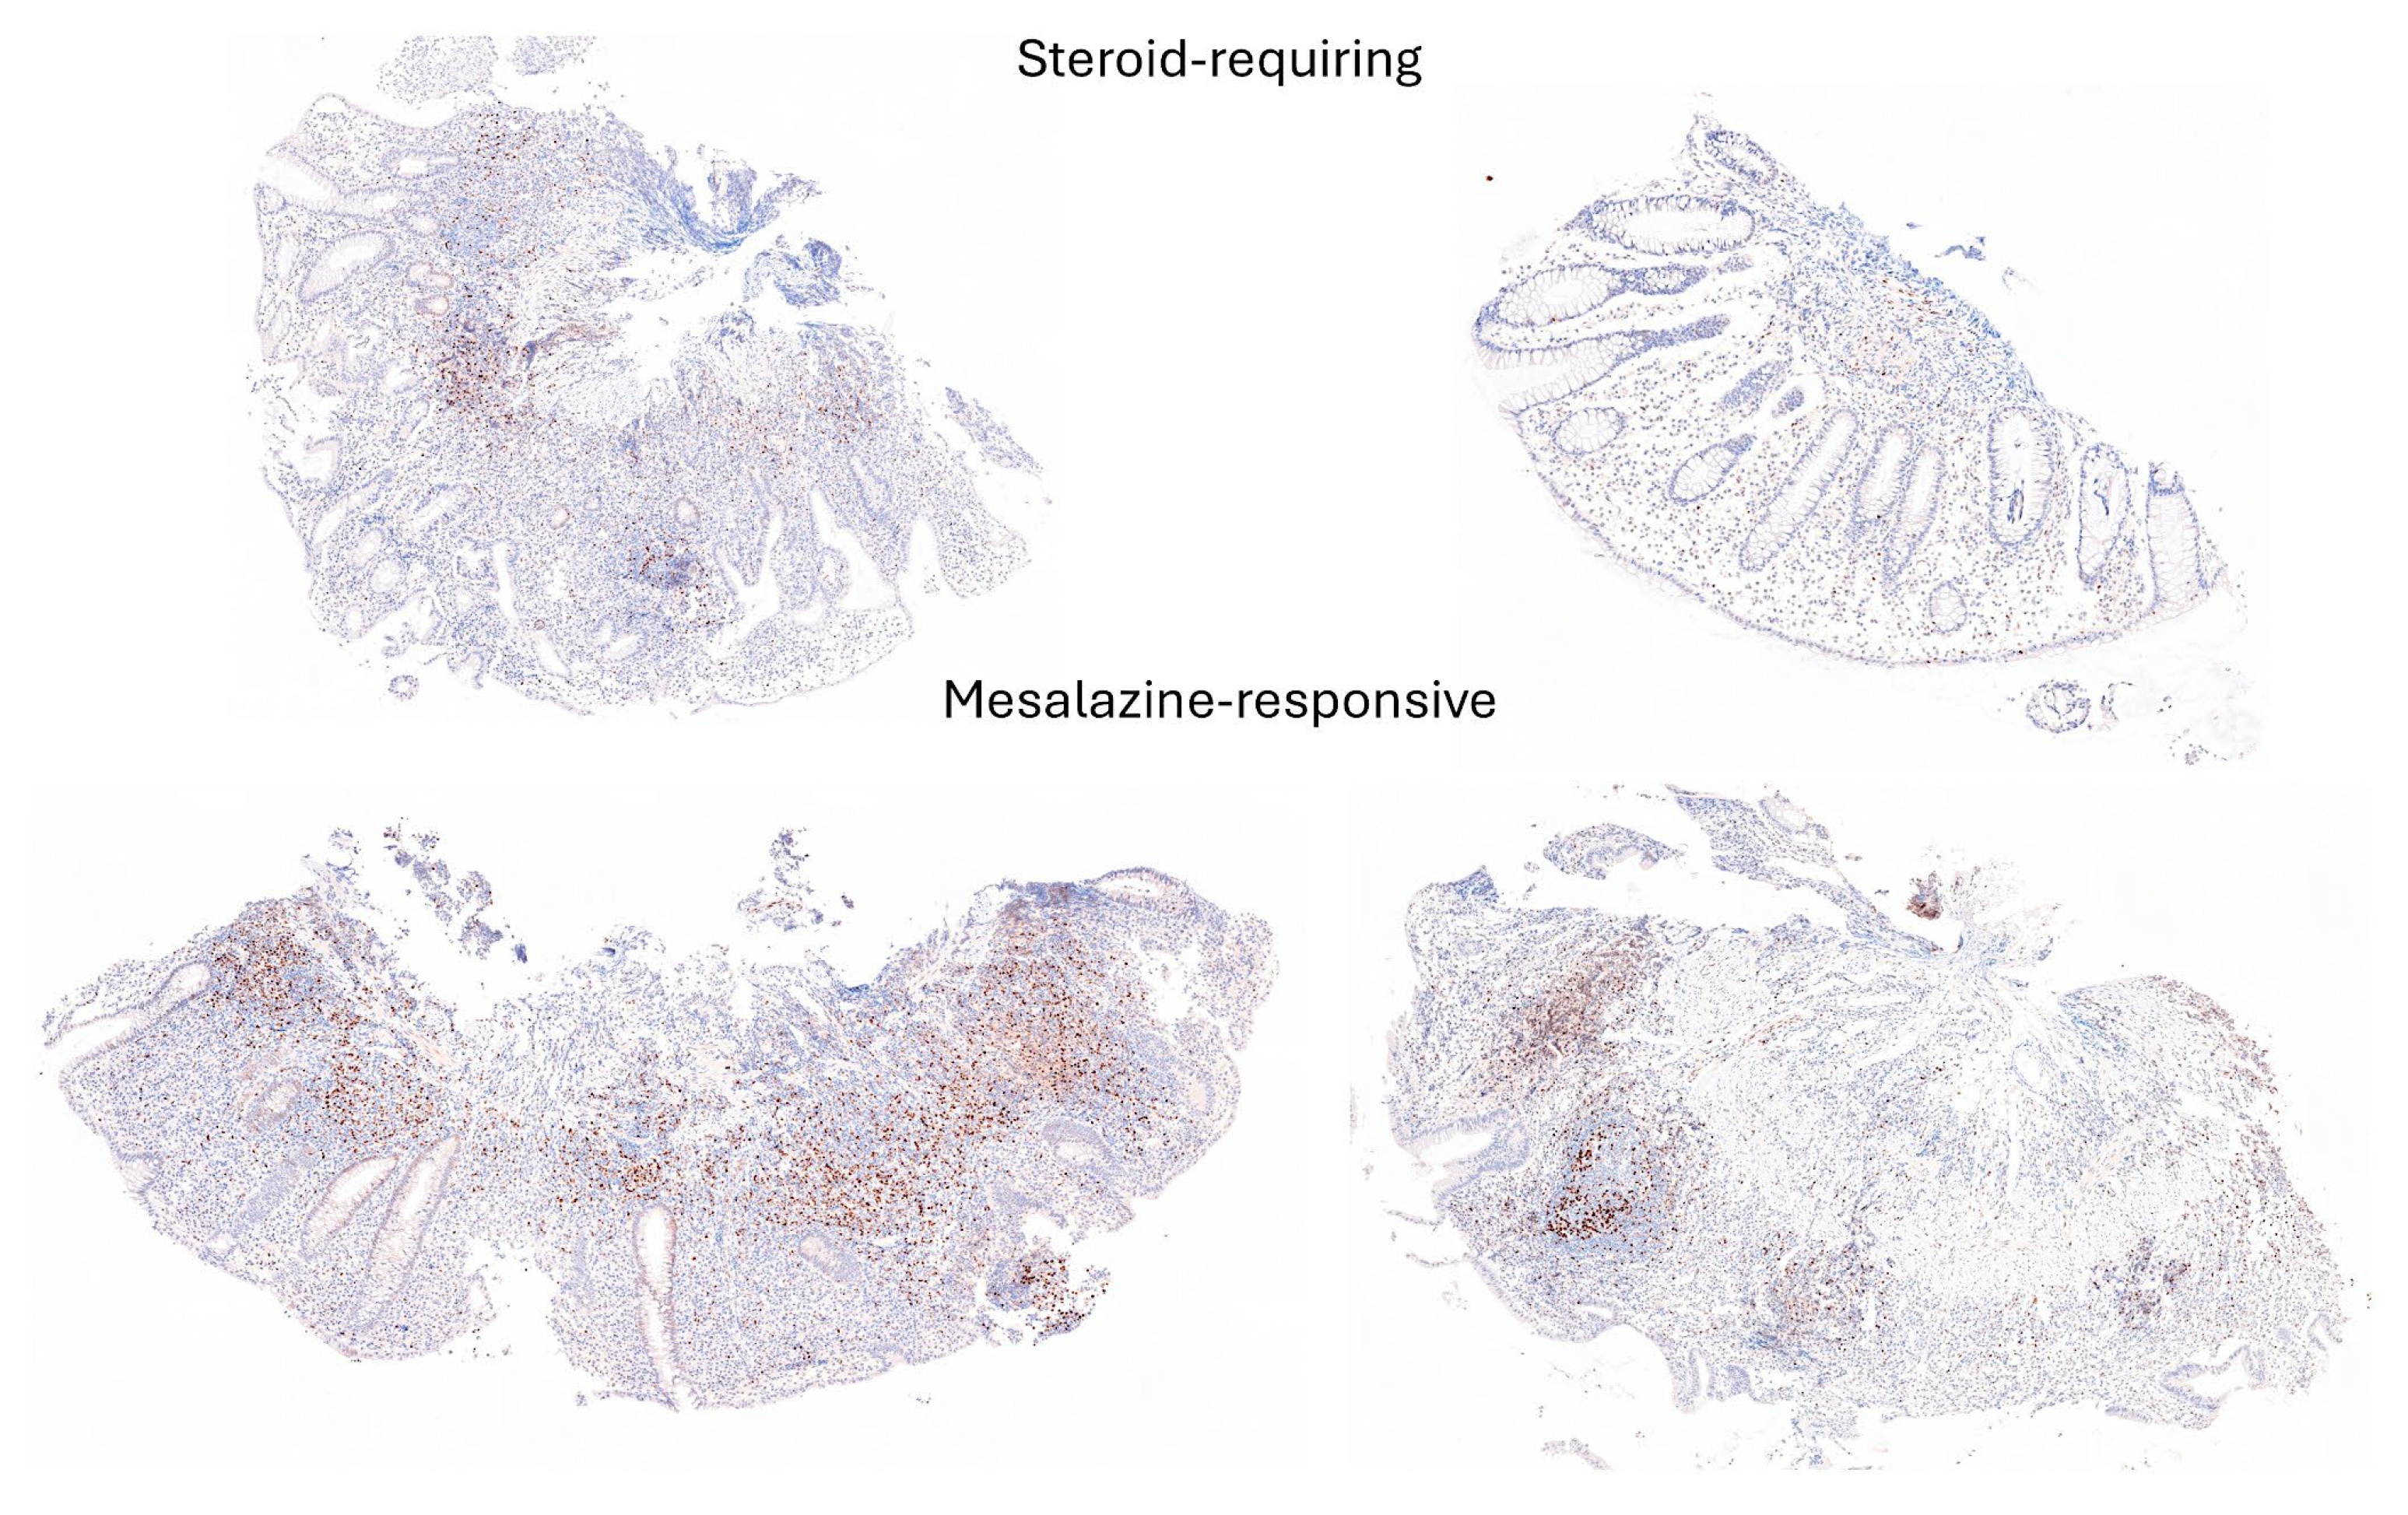
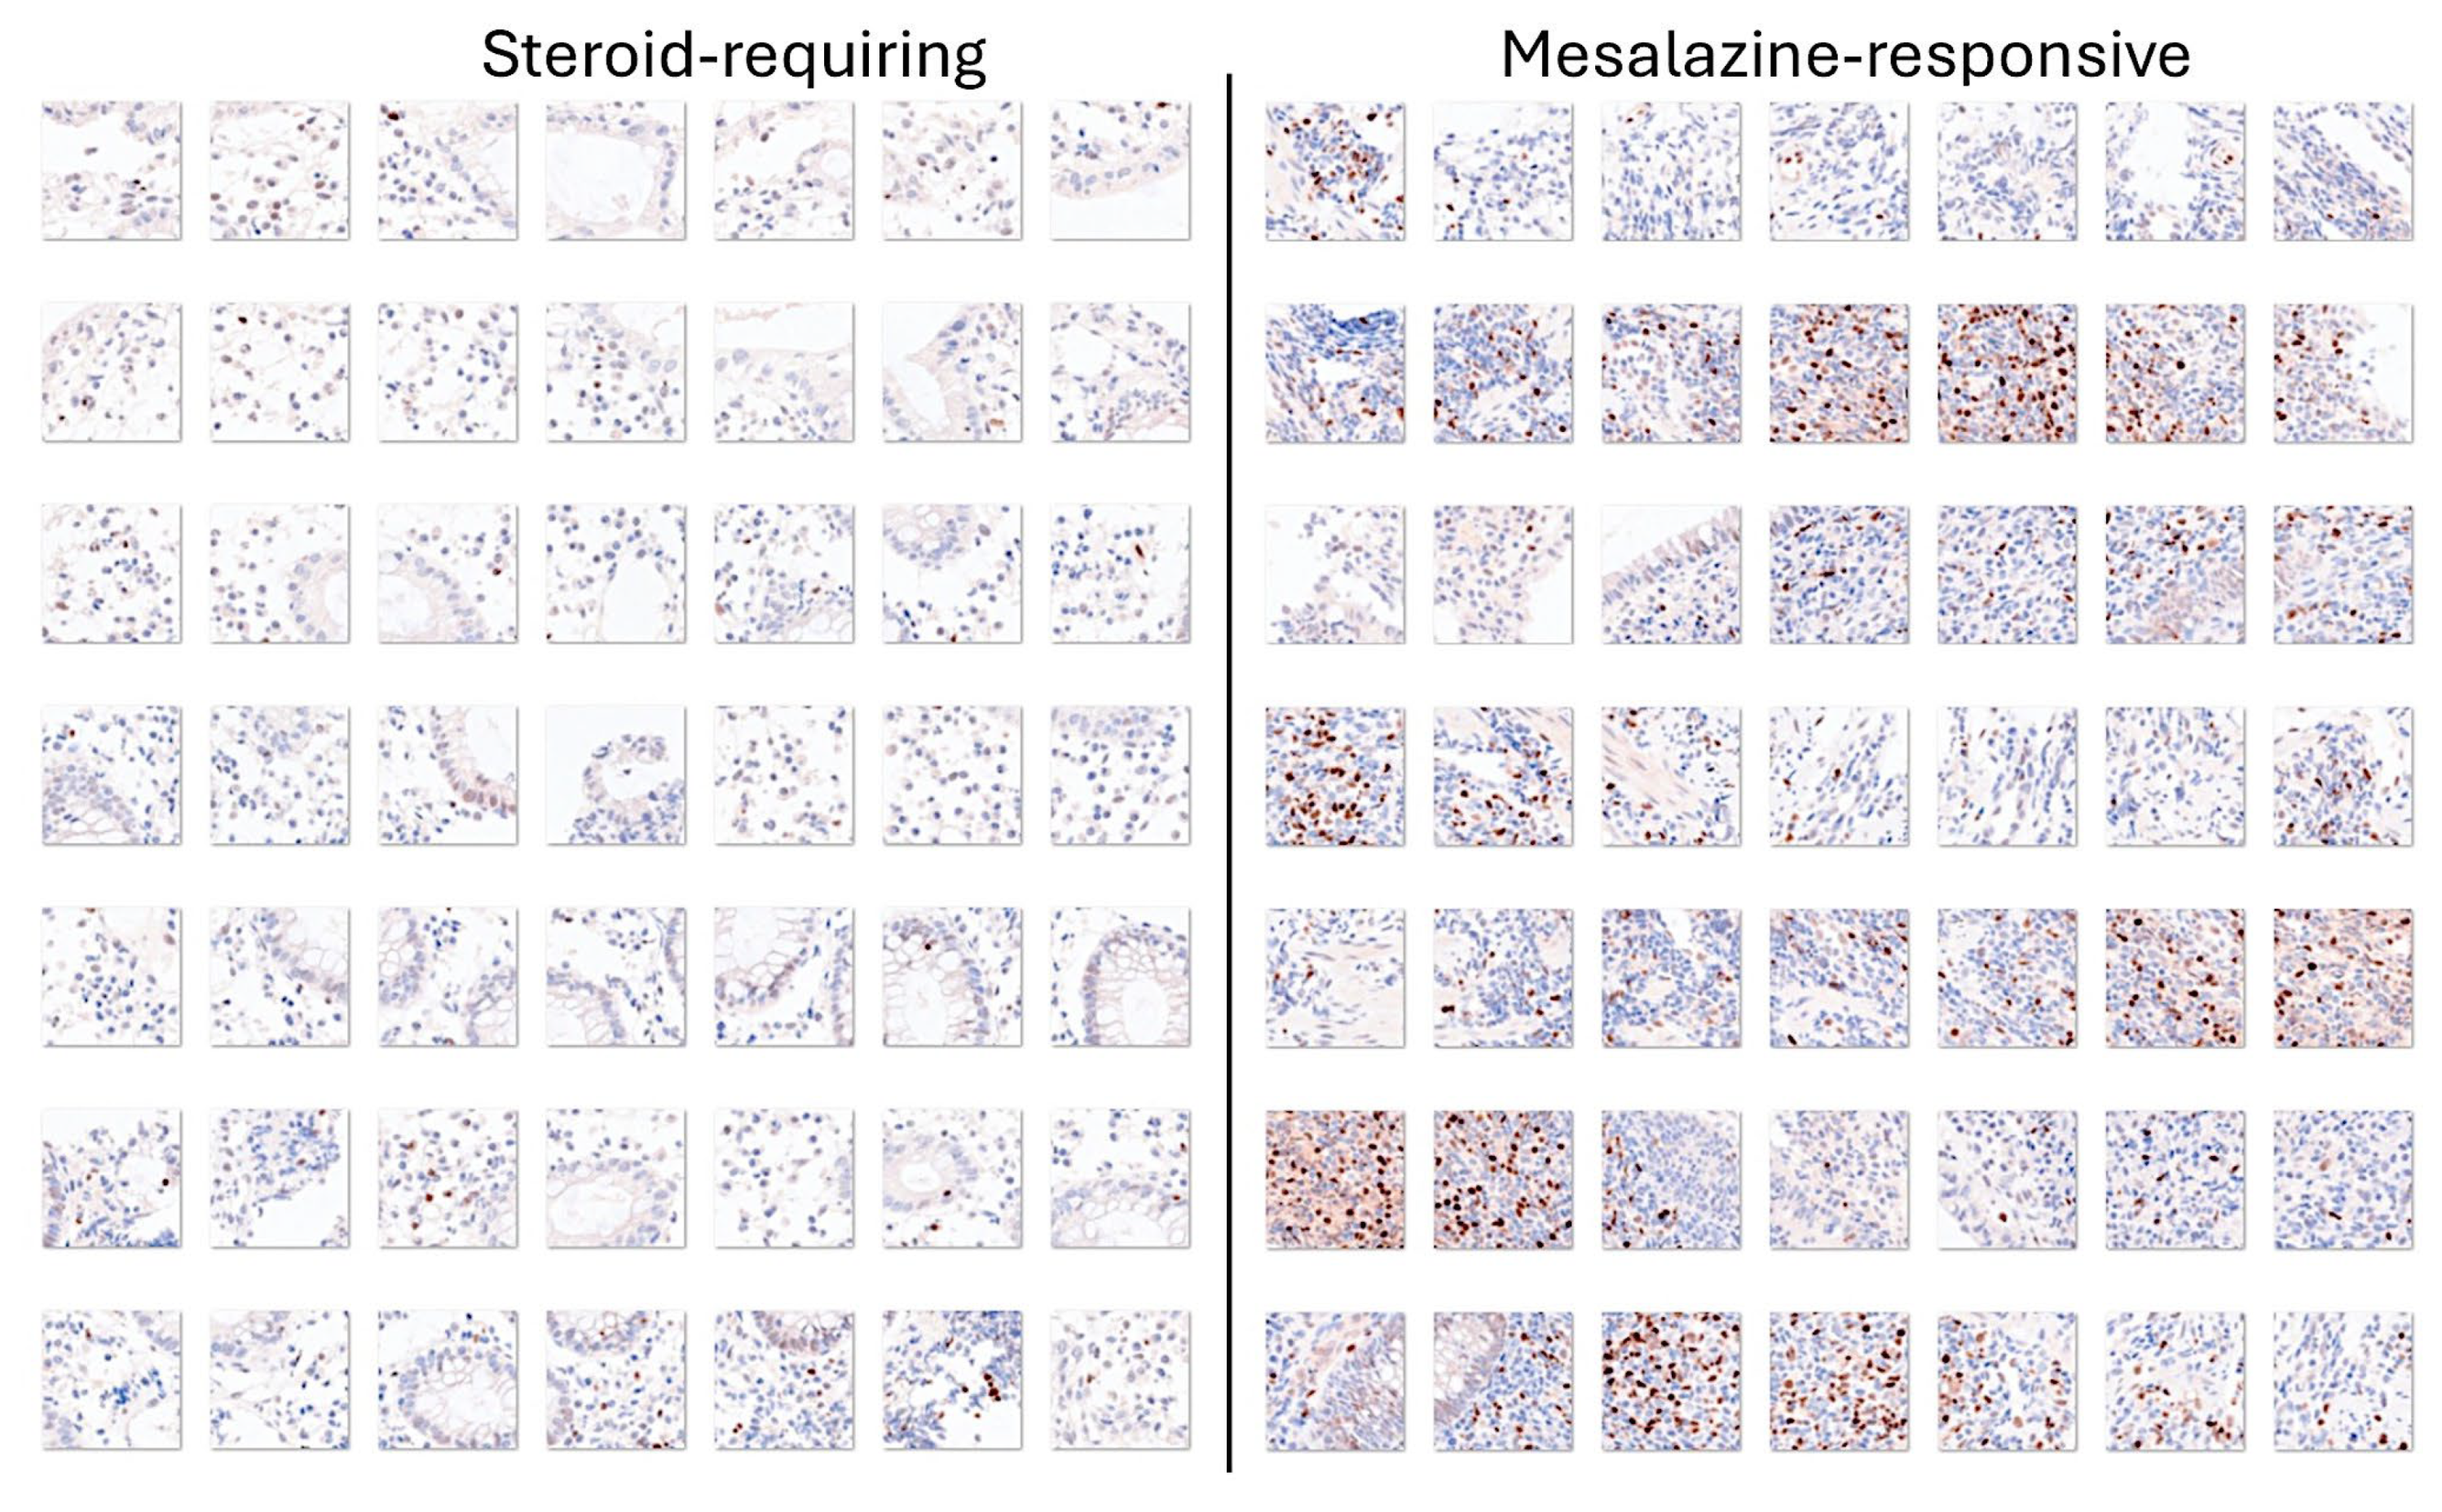
3.5. Differentiation Between Steroid-Requiring (SR) and Nonsteroid Requiring (non-SR) Ulcerative Colitis Using TOX2 Immunohistochemistry
3.6. Image Classification Using Transfer Learning with Other Convolutional Neural Networks
4. Discussion
5. Conclusions
Supplementary Materials
Author Contributions
Funding
Institutional Review Board Statement
Informed Consent Statement
Data Availability Statement
Conflicts of Interest
Appendix A. Confusion matrices (test set, new data) (Accuracy)
| Adenocarcinoma | 12741 | 3 | 0 |
| Colon control | 1 | 2362 | 29 |
| Ulcerative colitis | 3 | 84 | 1827 |
| Adenocarcinoma | Colon control | Ulcerative colitis |
| Adenocarcinoma | 12740 | 12 | 4 |
| Colon control | 3 | 2355 | 44 |
| Ulcerative colitis | 2 | 82 | 1808 |
| Adenocarcinoma | Colon control | Ulcerative colitis |
| Adenocarcinoma | 12737 | 12 | 5 |
| Colon control | 3 | 2350 | 37 |
| Ulcerative colitis | 5 | 87 | 1814 |
| Adenocarcinoma | Colon control | Ulcerative colitis |
| Adenocarcinoma | 12740 | 11 | 8 |
| Colon control | 0 | 2359 | 51 |
| Ulcerative colitis | 5 | 79 | 1797 |
| Adenocarcinoma | Colon control | Ulcerative colitis |
| Adenocarcinoma | 12732 | 13 | 2 |
| Colon control | 5 | 2345 | 52 |
| Ulcerative colitis | 8 | 91 | 1802 |
| Adenocarcinoma | Colon control | Ulcerative colitis |
| Adenocarcinoma | 12734 | 14 | 8 |
| Colon control | 7 | 2336 | 49 |
| Ulcerative colitis | 4 | 99 | 1799 |
| Adenocarcinoma | Colon control | Ulcerative colitis |
| Adenocarcinoma | 12734 | 19 | 24 |
| Colon control | 7 | 2334 | 40 |
| Ulcerative colitis | 4 | 96 | 1792 |
| Adenocarcinoma | Colon control | Ulcerative colitis |
| Adenocarcinoma | 12732 | 23 | 8 |
| Colon control | 5 | 2287 | 8 |
| Ulcerative colitis | 8 | 139 | 1840 |
| Adenocarcinoma | Colon control | Ulcerative colitis |
| Adenocarcinoma | 12702 | 4 | 0 |
| Colon control | 24 | 2332 | 35 |
| Ulcerative colitis | 19 | 113 | 1821 |
| Adenocarcinoma | Colon control | Ulcerative colitis |
| Adenocarcinoma | 1270 | 19 | 13 |
| Colon control | 3 | 2371 | 109 |
| Ulcerative colitis | 2 | 59 | 1734 |
| Adenocarcinoma | Colon control | Ulcerative colitis |
| Adenocarcinoma | 12733 | 8 | 8 |
| Colon control | 4 | 2311 | 49 |
| Ulcerative colitis | 8 | 130 | 1799 |
| Adenocarcinoma | Colon control | Ulcerative colitis |
| Adenocarcinoma | 12740 | 18 | 12 |
| Colon control | 2 | 2302 | 46 |
| Ulcerative colitis | 3 | 129 | 1798 |
| Adenocarcinoma | Colon control | Ulcerative colitis |
| Adenocarcinoma | 12718 | 30 | 12 |
| Colon control | 16 | 2302 | 43 |
| Ulcerative colitis | 11 | 117 | 1801 |
| Adenocarcinoma | Colon control | Ulcerative colitis |
| Adenocarcinoma | 12744 | 26 | 59 |
| Colon control | 1 | 2363 | 85 |
| Ulcerative colitis | 0 | 60 | 1712 |
| Adenocarcinoma | Colon control | Ulcerative colitis |
| Adenocarcinoma | 12726 | 23 | 9 |
| Colon control | 5 | 2256 | 17 |
| Ulcerative colitis | 14 | 170 | 1830 |
| Adenocarcinoma | Colon control | Ulcerative colitis |
| Adenocarcinoma | 12724 | 18 | 4 |
| Colon control | 17 | 2320 | 88 |
| Ulcerative colitis | 4 | 111 | 1764 |
| Adenocarcinoma | Colon control | Ulcerative colitis |
References
- Guan, Q. A Comprehensive Review and Update on the Pathogenesis of Inflammatory Bowel Disease. J. Immunol. Res. 2019, 2019, 7247238. [Google Scholar] [CrossRef] [PubMed]
- Jones, G.R.; Lyons, M.; Plevris, N.; Jenkinson, P.W.; Bisset, C.; Burgess, C.; Din, S.; Fulforth, J.; Henderson, P.; Ho, G.T.; et al. IBD prevalence in Lothian, Scotland, derived by capture-recapture methodology. Gut 2019, 68, 1953–1960. [Google Scholar] [CrossRef] [PubMed]
- Porter, R.J.; Arends, M.J.; Churchhouse, A.M.D.; Din, S. Inflammatory Bowel Disease-Associated Colorectal Cancer: Translational Risks from Mechanisms to Medicines. J. Crohns Colitis 2021, 15, 2131–2141. [Google Scholar] [CrossRef] [PubMed]
- Michielan, A.; D’Inca, R. Intestinal Permeability in Inflammatory Bowel Disease: Pathogenesis, Clinical Evaluation, and Therapy of Leaky Gut. Mediators Inflamm. 2015, 2015, 628157. [Google Scholar] [CrossRef] [PubMed]
- Scott B Snapper, Clara Abraham. Immune and microbial mechanisms in the pathogenesis of inflammatory bowel disease. In: UpToDate, Sunanda V Kane and Kristen M Robson (Ed), Wolters Kluwer. Accessed September 21, 2024.
- Kudelka, M.R.; Stowell, S.R.; Cummings, R.D.; Neish, A.S. Intestinal epithelial glycosylation in homeostasis and gut microbiota interactions in IBD. Nat. Rev. Gastroenterol. Hepatol. 2020, 17, 597–617. [Google Scholar] [CrossRef]
- Png, C.W.; Linden, S.K.; Gilshenan, K.S.; Zoetendal, E.G.; McSweeney, C.S.; Sly, L.I.; McGuckin, M.A.; Florin, T.H. Mucolytic bacteria with increased prevalence in IBD mucosa augment in vitro utilization of mucin by other bacteria. Am. J. Gastroenterol. 2010, 105, 2420–2428. [Google Scholar] [CrossRef]
- Yao, Y.; Kim, G.; Shafer, S.; Chen, Z.; Kubo, S.; Ji, Y.; Luo, J.; Yang, W.; Perner, S.P.; Kanellopoulou, C.; et al. Mucus sialylation determines intestinal host-commensal homeostasis. Cell 2022, 185, 1172–1188.e1128. [Google Scholar] [CrossRef]
- Amoroso, C.; Perillo, F.; Strati, F.; Fantini, M.C.; Caprioli, F.; Facciotti, F. The Role of Gut Microbiota Biomodulators on Mucosal Immunity and Intestinal Inflammation. Cells 2020, 9. [Google Scholar] [CrossRef]
- de Souza, H.S.; Fiocchi, C. Immunopathogenesis of IBD: current state of the art. Nat. Rev. Gastroenterol. Hepatol. 2016, 13, 13–27. [Google Scholar] [CrossRef]
- Kong, L.; Pokatayev, V.; Lefkovith, A.; Carter, G.T.; Creasey, E.A.; Krishna, C.; Subramanian, S.; Kochar, B.; Ashenberg, O.; Lau, H.; et al. The landscape of immune dysregulation in Crohn’s disease revealed through single-cell transcriptomic profiling in the ileum and colon. Immunity 2023, 56, 444–458. [Google Scholar] [CrossRef]
- Lee, S.H.; Kwon, J.E.; Cho, M.L. Immunological pathogenesis of inflammatory bowel disease. Intest. Res. 2018, 16, 26–42. [Google Scholar] [CrossRef] [PubMed]
- Mitsialis, V.; Wall, S.; Liu, P.; Ordovas-Montanes, J.; Parmet, T.; Vukovic, M.; Spencer, D.; Field, M.; McCourt, C.; Toothaker, J.; et al. Single-Cell Analyses of Colon and Blood Reveal Distinct Immune Cell Signatures of Ulcerative Colitis and Crohn’s Disease. Gastroenterology 2020, 159, 591–608.e510. [Google Scholar] [CrossRef] [PubMed]
- Ramos, G.P.; Papadakis, K.A. Mechanisms of Disease: Inflammatory Bowel Diseases. Mayo Clin. Proc. 2019, 94, 155–165. [Google Scholar] [CrossRef] [PubMed]
- Rosen, M.J.; Dhawan, A.; Saeed, S.A. Inflammatory Bowel Disease in Children and Adolescents. JAMA Pediatr. 2015, 169, 1053–1060. [Google Scholar] [CrossRef]
- Xavier, R.J.; Podolsky, D.K. Unravelling the pathogenesis of inflammatory bowel disease. Nature 2007, 448, 427–434. [Google Scholar] [CrossRef] [PubMed]
- Xu, X.R.; Liu, C.Q.; Feng, B.S.; Liu, Z.J. Dysregulation of mucosal immune response in pathogenesis of inflammatory bowel disease. World J. Gastroenterol. 2014, 20, 3255–3264. [Google Scholar] [CrossRef]
- Del Sordo, R.; Lougaris, V.; Bassotti, G.; Armuzzi, A.; Villanacci, V. Therapeutic agents affecting the immune system and drug-induced inflammatory bowel disease (IBD): A review on etiological and pathogenetic aspects. Clin. Immunol. 2022, 234, 108916. [Google Scholar] [CrossRef]
- Dunkin, D.; Mehandru, S.; Colombel, J.F. Immune cell therapy in IBD. Dig. Dis. 2014, 32 Suppl. 1, 61–66. [Google Scholar] [CrossRef]
- Elhag, D.A.; Kumar, M.; Saadaoui, M.; Akobeng, A.K.; Al-Mudahka, F.; Elawad, M.; Al Khodor, S. Inflammatory Bowel Disease Treatments and Predictive Biomarkers of Therapeutic Response. Int. J. Mol. Sci. 2022, 23. [Google Scholar] [CrossRef]
- Fantini, M.C.; Monteleone, G. Update on the Therapeutic Efficacy of Tregs in IBD: Thumbs up or Thumbs down? Inflamm. Bowel Dis. 2017, 23, 1682–1688. [Google Scholar] [CrossRef]
- Griffin, H.; Ceron-Gutierrez, L.; Gharahdaghi, N.; Ebrahimi, S.; Davies, S.; Loo, P.S.; Szabo, A.; Williams, E.; Mukhopadhyay, A.; McLoughlin, L.; et al. Neutralizing Autoantibodies against Interleukin-10 in Inflammatory Bowel Disease. N. Engl. J. Med. 2024, 391, 434–441. [Google Scholar] [CrossRef] [PubMed]
- Jiang, P.; Zheng, C.; Xiang, Y.; Malik, S.; Su, D.; Xu, G.; Zhang, M. The involvement of TH17 cells in the pathogenesis of IBD. Cytokine Growth Factor. Rev. 2023, 69, 28–42. [Google Scholar] [CrossRef] [PubMed]
- Qiu, B.; Zhang, T.; Qin, X.; Ma, S.; Wang, Q. The immune factors have complex causal regulation effects on inflammatory bowel disease. Front. Immunol. 2023, 14, 1322673. [Google Scholar] [CrossRef] [PubMed]
- Yan, J.B.; Luo, M.M.; Chen, Z.Y.; He, B.H. The Function and Role of the Th17/Treg Cell Balance in Inflammatory Bowel Disease. J. Immunol. Res. 2020, 2020, 8813558. [Google Scholar] [CrossRef] [PubMed]
- Larabi, A.; Barnich, N.; Nguyen, H.T.T. New insights into the interplay between autophagy, gut microbiota and inflammatory responses in IBD. Autophagy 2020, 16, 38–51. [Google Scholar] [CrossRef]
- Lee, M.; Chang, E.B. Inflammatory Bowel Diseases (IBD) and the Microbiome-Searching the Crime Scene for Clues. Gastroenterology 2021, 160, 524–537. [Google Scholar] [CrossRef]
- Nishida, A.; Inoue, R.; Inatomi, O.; Bamba, S.; Naito, Y.; Andoh, A. Gut microbiota in the pathogenesis of inflammatory bowel disease. Clin. J. Gastroenterol. 2018, 11, 1–10. [Google Scholar] [CrossRef]
- Schirmer, M.; Garner, A.; Vlamakis, H.; Xavier, R.J. Microbial genes and pathways in inflammatory bowel disease. Nat. Rev. Microbiol. 2019, 17, 497–511. [Google Scholar] [CrossRef]
- Tarris, G.; de Rougemont, A.; Charkaoui, M.; Michiels, C.; Martin, L.; Belliot, G. Enteric Viruses and Inflammatory Bowel Disease. Viruses 2021, 13. [Google Scholar] [CrossRef]
- Zhang, H.; Zhao, S.; Cao, Z. Impact of Epstein-Barr virus infection in patients with inflammatory bowel disease. Front. Immunol. 2022, 13, 1001055. [Google Scholar] [CrossRef]
- Zhang, Q.; Chen, D.; Yang, Y. Incidence and Prevalence of Human Papilloma Virus-associated Cancers in IBD. Inflamm. Bowel Dis. 2020, 26, e101. [Google Scholar] [CrossRef] [PubMed]
- Beheshti-Maal, A.; Shahrokh, S.; Ansari, S.; Mirsamadi, E.S.; Yadegar, A.; Mirjalali, H.; Zali, M.R. Gut mycobiome: The probable determinative role of fungi in IBD patients. Mycoses 2021, 64, 468–476. [Google Scholar] [CrossRef] [PubMed]
- Sokol, H.; Leducq, V.; Aschard, H.; Pham, H.P.; Jegou, S.; Landman, C.; Cohen, D.; Liguori, G.; Bourrier, A.; Nion-Larmurier, I.; et al. Fungal microbiota dysbiosis in IBD. Gut 2017, 66, 1039–1048. [Google Scholar] [CrossRef] [PubMed]
- Yan, Q.; Li, S.; Yan, Q.; Huo, X.; Wang, C.; Wang, X.; Sun, Y.; Zhao, W.; Yu, Z.; Zhang, Y.; et al. A genomic compendium of cultivated human gut fungi characterizes the gut mycobiome and its relevance to common diseases. Cell 2024, 187, 2969–2989.e2924. [Google Scholar] [CrossRef]
- Doecke, J.D.; Simms, L.A.; Zhao, Z.Z.; Huang, N.; Hanigan, K.; Krishnaprasad, K.; Roberts, R.L.; Andrews, J.M.; Mahy, G.; Bampton, P.; et al. Genetic susceptibility in IBD: overlap between ulcerative colitis and Crohn’s disease. Inflamm. Bowel Dis. 2013, 19, 240–245. [Google Scholar] [CrossRef]
- Ye, B.D.; McGovern, D.P. Genetic variation in IBD: progress, clues to pathogenesis and possible clinical utility. Expert. Rev. Clin. Immunol. 2016, 12, 1091–1107. [Google Scholar] [CrossRef]
- Vermeire, S. Review article: genetic susceptibility and application of genetic testing in clinical management of inflammatory bowel disease. Aliment. Pharmacol. Ther. 2006, 24 Suppl. 3, 2–10. [Google Scholar] [CrossRef]
- Lees, C.W.; Barrett, J.C.; Parkes, M.; Satsangi, J. New IBD genetics: common pathways with other diseases. Gut 2011, 60, 1739–1753. [Google Scholar] [CrossRef]
- Peters, L.A.; Perrigoue, J.; Mortha, A.; Iuga, A.; Song, W.M.; Neiman, E.M.; Llewellyn, S.R.; Di Narzo, A.; Kidd, B.A.; Telesco, S.E.; et al. A functional genomics predictive network model identifies regulators of inflammatory bowel disease. Nat. Genet. 2017, 49, 1437–1449. [Google Scholar] [CrossRef]
- Graham, D.B.; Xavier, R.J. From genetics of inflammatory bowel disease towards mechanistic insights. Trends Immunol. 2013, 34, 371–378. [Google Scholar] [CrossRef]
- Liu, J.Z.; van Sommeren, S.; Huang, H.; Ng, S.C.; Alberts, R.; Takahashi, A.; Ripke, S.; Lee, J.C.; Jostins, L.; Shah, T.; et al. Association analyses identify 38 susceptibility loci for inflammatory bowel disease and highlight shared genetic risk across populations. Nat. Genet. 2015, 47, 979–986. [Google Scholar] [CrossRef] [PubMed]
- de Lange, K.M.; Moutsianas, L.; Lee, J.C.; Lamb, C.A.; Luo, Y.; Kennedy, N.A.; Jostins, L.; Rice, D.L.; Gutierrez-Achury, J.; Ji, S.G.; et al. Genome-wide association study implicates immune activation of multiple integrin genes in inflammatory bowel disease. Nat. Genet. 2017, 49, 256–261. [Google Scholar] [CrossRef]
- Liu, Z.; Liu, R.; Gao, H.; Jung, S.; Gao, X.; Sun, R.; Liu, X.; Kim, Y.; Lee, H.S.; Kawai, Y.; et al. Genetic architecture of the inflammatory bowel diseases across East Asian and European ancestries. Nat. Genet. 2023, 55, 796–806. [Google Scholar] [CrossRef]
- Le Berre, C.; Honap, S.; Peyrin-Biroulet, L. Ulcerative colitis. Lancet 2023, 402, 571–584. [Google Scholar] [CrossRef] [PubMed]
- Schroeder, K.W.; Tremaine, W.J.; Ilstrup, D.M. Coated oral 5-aminosalicylic acid therapy for mildly to moderately active ulcerative colitis. A randomized study. N. Engl. J. Med. 1987, 317, 1625–1629. [Google Scholar] [CrossRef]
- Travis, S.P.; Schnell, D.; Krzeski, P.; Abreu, M.T.; Altman, D.G.; Colombel, J.F.; Feagan, B.G.; Hanauer, S.B.; Lichtenstein, G.R.; Marteau, P.R.; et al. Reliability and initial validation of the ulcerative colitis endoscopic index of severity. Gastroenterology 2013, 145, 987–995. [Google Scholar] [CrossRef] [PubMed]
- Lewis, J.D.; Chuai, S.; Nessel, L.; Lichtenstein, G.R.; Aberra, F.N.; Ellenberg, J.H. Use of the noninvasive components of the Mayo score to assess clinical response in ulcerative colitis. Inflamm. Bowel Dis. 2008, 14, 1660–1666. [Google Scholar] [CrossRef]
- Gros, B.; Kaplan, G.G. Ulcerative Colitis in Adults: A Review. JAMA 2023, 330, 951–965. [Google Scholar] [CrossRef] [PubMed]
- Yu, Y.R.; Rodriguez, J.R. Clinical presentation of Crohn’s, ulcerative colitis, and indeterminate colitis: Symptoms, extraintestinal manifestations, and disease phenotypes. Semin. Pediatr. Surg. 2017, 26, 349–355. [Google Scholar] [CrossRef]
- Conrad, K.; Roggenbuck, D.; Laass, M.W. Diagnosis and classification of ulcerative colitis. Autoimmun. Rev. 2014, 13, 463–466. [Google Scholar] [CrossRef]
- Wang, C.R.; Tsai, H.W. Seronegative spondyloarthropathy-associated inflammatory bowel disease. World J. Gastroenterol. 2023, 29, 450–468. [Google Scholar] [CrossRef] [PubMed]
- Rawal, K.K.; Shukla, V.P.; Chikani, S.; Thakkar, M.; Ruparelia, M.; Chudasama, R.K. Prevalence of extraintestinal manifestations in ulcerative colitis and associated risk factors. Indian. J. Gastroenterol. 2021, 40, 477–482. [Google Scholar] [CrossRef] [PubMed]
- Fine, S. Extraintestinal Manifestations of Inflammatory Bowel Disease. R I Med J (2013) 2022, 105, 13–19. [Google Scholar] [PubMed]
- Lutgens, M.W.; van Oijen, M.G.; van der Heijden, G.J.; Vleggaar, F.P.; Siersema, P.D.; Oldenburg, B. Declining risk of colorectal cancer in inflammatory bowel disease: an updated meta-analysis of population-based cohort studies. Inflamm. Bowel Dis. 2013, 19, 789–799. [Google Scholar] [CrossRef]
- Steenholdt, C.; Dige Ovesen, P.; Brynskov, J.; Seidelin, J.B. Tofacitinib for Acute Severe Ulcerative Colitis: A Systematic Review. J. Crohns Colitis 2023, 17, 1354–1363. [Google Scholar] [CrossRef]
- Lopez-Sanroman, A.; Esplugues, J.V.; Domenech, E. Pharmacology and safety of tofacitinib in ulcerative colitis. Gastroenterol. Hepatol. 2021, 44, 39–48. [Google Scholar] [CrossRef]
- Sandborn, W.J.; Su, C.; Sands, B.E.; D’Haens, G.R.; Vermeire, S.; Schreiber, S.; Danese, S.; Feagan, B.G.; Reinisch, W.; Niezychowski, W.; et al. Tofacitinib as Induction and Maintenance Therapy for Ulcerative Colitis. N. Engl. J. Med. 2017, 376, 1723–1736. [Google Scholar] [CrossRef]
- Vieujean, S.; Peyrin-Biroulet, L. Pharmacokinetics of S1P receptor modulators in the treatment of ulcerative colitis. Expert. Opin. Drug Metab. Toxicol. 2024, 1–12. [Google Scholar] [CrossRef]
- Bencardino, S.; D’Amico, F.; Faggiani, I.; Bernardi, F.; Allocca, M.; Furfaro, F.; Parigi, T.L.; Zilli, A.; Fiorino, G.; Peyrin-Biroulet, L.; et al. Efficacy and Safety of S1P1 Receptor Modulator Drugs for Patients with Moderate-to-Severe Ulcerative Colitis. J. Clin. Med. 2023, 12. [Google Scholar] [CrossRef]
- Pugliese, D.; Felice, C.; Papa, A.; Gasbarrini, A.; Rapaccini, G.L.; Guidi, L.; Armuzzi, A. Anti TNF-alpha therapy for ulcerative colitis: current status and prospects for the future. Expert. Rev. Clin. Immunol. 2017, 13, 223–233. [Google Scholar] [CrossRef]
- Sandborn, W.J.; Baert, F.; Danese, S.; Krznaric, Z.; Kobayashi, T.; Yao, X.; Chen, J.; Rosario, M.; Bhatia, S.; Kisfalvi, K.; et al. Efficacy and Safety of Vedolizumab Subcutaneous Formulation in a Randomized Trial of Patients With Ulcerative Colitis. Gastroenterology 2020, 158, 562–572.e512. [Google Scholar] [CrossRef] [PubMed]
- Kucharzik, T.; Koletzko, S.; Kannengiesser, K.; Dignass, A. Ulcerative Colitis-Diagnostic and Therapeutic Algorithms. Dtsch. Arztebl. Int. 2020, 117, 564–574. [Google Scholar] [CrossRef]
- Lasa, J.S.; Olivera, P.A.; Danese, S.; Peyrin-Biroulet, L. Efficacy and safety of biologics and small molecule drugs for patients with moderate-to-severe ulcerative colitis: a systematic review and network meta-analysis. Lancet Gastroenterol. Hepatol. 2022, 7, 161–170. [Google Scholar] [CrossRef] [PubMed]
- Hirten, R.P.; Sands, B.E. New Therapeutics for Ulcerative Colitis. Annu. Rev. Med. 2021, 72, 199–213. [Google Scholar] [CrossRef] [PubMed]
- Burri, E.; Maillard, M.H.; Schoepfer, A.M.; Seibold, F.; Van Assche, G.; Riviere, P.; Laharie, D.; Manz, M.; Swiss Ibdnet, a.o.w.g.o.t.S.S.o.G. Treatment Algorithm for Mild and Moderate-to-Severe Ulcerative Colitis: An Update. Digestion 2020, 101 Suppl. 1, 2–15. [Google Scholar] [CrossRef] [PubMed]
- Siegel, R.L.; Miller, K.D.; Wagle, N.S.; Jemal, A. Cancer statistics, 2023. CA Cancer J Clin 2023, 73, 17–48. [Google Scholar] [CrossRef]
- Faye, A.S.; Holmer, A.K.; Axelrad, J.E. Cancer in Inflammatory Bowel Disease. Gastroenterol. Clin. North. Am. 2022, 51, 649–666. [Google Scholar] [CrossRef]
- Shin, A.E.; Giancotti, F.G.; Rustgi, A.K. Metastatic colorectal cancer: mechanisms and emerging therapeutics. Trends Pharmacol. Sci. 2023, 44, 222–236. [Google Scholar] [CrossRef]
- Baxi, V.; Edwards, R.; Montalto, M.; Saha, S. Digital pathology and artificial intelligence in translational medicine and clinical practice. Mod. Pathol. 2022, 35, 23–32. [Google Scholar] [CrossRef]
- Carreras, J. Celiac Disease Deep Learning Image Classification Using Convolutional Neural Networks. J. Imaging 2024, 10. [Google Scholar] [CrossRef]
- Tsuda, S.; Carreras, J.; Kikuti, Y.Y.; Nakae, H.; Dekiden-Monma, M.; Imai, J.; Tsuruya, K.; Nakamura, J.; Tsukune, Y.; Uchida, T.; et al. Prediction of steroid demand in the treatment of patients with ulcerative colitis by immunohistochemical analysis of the mucosal microenvironment and immune checkpoint: role of macrophages and regulatory markers in disease severity. Pathol. Int. 2019, 69, 260–271. [Google Scholar] [CrossRef] [PubMed]
- Mohammed Vashist, N.; Samaan, M.; Mosli, M.H.; Parker, C.E.; MacDonald, J.K.; Nelson, S.A.; Zou, G.Y.; Feagan, B.G.; Khanna, R.; Jairath, V. Endoscopic scoring indices for evaluation of disease activity in ulcerative colitis. Cochrane Database Syst. Rev. 2018, 1, CD011450. [Google Scholar] [CrossRef] [PubMed]
- Baron, J.H.; Connell, A.M.; Lennard-Jones, J.E. Variation between Observers in Describing Mucosal Appearances in Proctocolitis. Br. Med. J. 1964, 1, 89–92. [Google Scholar] [CrossRef] [PubMed]
- Feagan, B.G.; Greenberg, G.R.; Wild, G.; Fedorak, R.N.; Pare, P.; McDonald, J.W.; Dube, R.; Cohen, A.; Steinhart, A.H.; Landau, S.; et al. Treatment of ulcerative colitis with a humanized antibody to the alpha4beta7 integrin. N. Engl. J. Med. 2005, 352, 2499–2507. [Google Scholar] [CrossRef] [PubMed]
- Geboes, K.; Riddell, R.; Ost, A.; Jensfelt, B.; Persson, T.; Lofberg, R. A reproducible grading scale for histological assessment of inflammation in ulcerative colitis. Gut 2000, 47, 404–409. [Google Scholar] [CrossRef]
- Krizhevsky, Alex, Ilya Sutskever, and Geoffrey E. Hinton. “ImageNet Classification with Deep Convolutional Neural Networks.” Communications of the ACM 60, no. 6 (May 24, 2017): 84–90. [CrossRef]
- Huang, Gao, Zhuang Liu, Laurens Van Der Maaten, and Kilian Q. Weinberger. “Densely Connected Convolutional Networks.” In CVPR, vol. 1, no. 2, p. 3. 2017.
- Mingxing Tan and Quoc, V. Le, “EfficientNet: Rethinking Model Scaling for Convolutional Neural Networks,” ArXiv Preprint ArXiv:1905.1194, 2019.
- Places. http://places2.csail.mit.edu/.
- Szegedy, Christian, Wei Liu, Yangqing Jia, Pierre Sermanet, Scott Reed, Dragomir Anguelov, Dumitru Erhan, Vincent Vanhoucke, and Andrew Rabinovich. “Going deeper with convolutions.” In Proceedings of the IEEE conference on computer vision and pattern recognition, pp. 1–9. 2015.
- Szegedy, Christian, Vincent Vanhoucke, Sergey Ioffe, Jon Shlens, and Zbigniew Wojna. “Rethinking the inception architecture for computer vision.” In Proceedings of the IEEE Conference on Computer Vision and Pattern Recognition, pp. 2818–2826. 2016.
- Sandler, M. , Howard, A., Zhu, M., Zhmoginov, A. and Chen, L.C. “MobileNetV2: Inverted Residuals and Linear Bottlenecks.” In 2018 IEEE/CVF Conference on Computer Vision and Pattern Recognition (pp. 4510-4520). IEEE.
- Zoph, Barret, Vijay Vasudevan, Jonathon Shlens, and Quoc V. Le. “Learning Transferable Architectures for Scalable Image Recognition.” arXiv preprint arXiv:1707.07012 2, no. 6 (2017).
- He, Kaiming, Xiangyu Zhang, Shaoqing Ren, and Jian Sun. “Deep residual learning for image recognition.” In Proceedings of the IEEE conference on computer vision and pattern recognition, pp. 770–778. 2016.
- Zhang, Xiangyu, Xinyu Zhou, Mengxiao Lin, and Jian Sun. “ShuffleNet: An Extremely Efficient Convolutional Neural Network for Mobile Devices.” arXiv preprint arXiv:1707.01083v2 (2017).
- Simonyan, Karen, and Andrew Zisserman. “Very deep convolutional networks for large-scale image recognition.” arXiv preprint arXiv:1409.1556 (2014).
- Chollet, F. , 2017. “Xception: Deep Learning with Depthwise Separable Convolutions.” arXiv preprint, pp.1610-02357.
- Feakins, R.M. Ulcerative colitis or Crohn’s disease? Pitfalls and problems. Histopathology 2014, 64, 317–335. [Google Scholar] [CrossRef]
- Ordas, I.; Eckmann, L.; Talamini, M.; Baumgart, D.C.; Sandborn, W.J. Ulcerative colitis. Lancet 2012, 380, 1606–1619. [Google Scholar] [CrossRef]
- Kawachi, H. Histopathological diagnosis of ulcerative colitis-associated neoplasia. Dig. Endosc. 2019, 31 Suppl. 1, 31–35. [Google Scholar] [CrossRef]
- Jauregui-Amezaga, A.; Geerits, A.; Das, Y.; Lemmens, B.; Sagaert, X.; Bessissow, T.; Lobaton, T.; Ferrante, M.; Van Assche, G.; Bisschops, R.; et al. A Simplified Geboes Score for Ulcerative Colitis. J. Crohns Colitis 2017, 11, 305–313. [Google Scholar] [CrossRef]
- Poulogiannis, G.; Frayling, I.M.; Arends, M.J. DNA mismatch repair deficiency in sporadic colorectal cancer and Lynch syndrome. Histopathology 2010, 56, 167–179. [Google Scholar] [CrossRef]
- Cerretelli, G.; Ager, A.; Arends, M.J.; Frayling, I.M. Molecular pathology of Lynch syndrome. J. Pathol. 2020, 250, 518–531. [Google Scholar] [CrossRef] [PubMed]
- Landskron, G.; De la Fuente Lopez, M.; Dubois-Camacho, K.; Diaz-Jimenez, D.; Orellana-Serradell, O.; Romero, D.; Sepulveda, S.A.; Salazar, C.; Parada-Venegas, D.; Quera, R.; et al. Interleukin 33/ST2 Axis Components Are Associated to Desmoplasia, a Metastasis-Related Factor in Colorectal Cancer. Front. Immunol. 2019, 10, 1394. [Google Scholar] [CrossRef]
- Nagtegaal, I.D.; Odze, R.D.; Klimstra, D.; Paradis, V.; Rugge, M.; Schirmacher, P.; Washington, K.M.; Carneiro, F.; Cree, I.A.; Board, W.H.O.C.o.T.E. The 2019 WHO classification of tumours of the digestive system. Histopathology 2020, 76, 182–188. [Google Scholar] [CrossRef] [PubMed]
- Ahadi, M.; Sokolova, A.; Brown, I.; Chou, A.; Gill, A.J. The 2019 World Health Organization Classification of appendiceal, colorectal and anal canal tumours: an update and critical assessment. Pathology 2021, 53, 454–461. [Google Scholar] [CrossRef]
- Dunne, P.D.; Arends, M.J. Molecular pathological classification of colorectal cancer-an update. Virchows Arch. 2024, 484, 273–285. [Google Scholar] [CrossRef]
- Muller, M.F.; Ibrahim, A.E.; Arends, M.J. Molecular pathological classification of colorectal cancer. Virchows Arch. 2016, 469, 125–134. [Google Scholar] [CrossRef]
- O’Connell, J.B.; Maggard, M.A.; Livingston, E.H.; Yo, C.K. Colorectal cancer in the young. Am. J. Surg. 2004, 187, 343–348. [Google Scholar] [CrossRef]
- Kather, J.N.; Weis, C.A.; Bianconi, F.; Melchers, S.M.; Schad, L.R.; Gaiser, T.; Marx, A.; Zollner, F.G. Multi-class texture analysis in colorectal cancer histology. Sci. Rep. 2016, 6, 27988. [Google Scholar] [CrossRef] [PubMed]
- Treanor, D.; Quirke, P. Pathology of colorectal cancer. Clin Oncol (R Coll Radiol) 2007, 19, 769–776. [Google Scholar] [CrossRef]
- Histology For Pathologists. ISBN 1496398947, 978-1496398949.
- Kierszenbaum, L. Tres. Histology and Cell Biology: An Introduction to Pathology 5th Edition 2020. May 27, 2020. Elsevier Language: English ISBN-13: 978-0323673211 ISBN-10: 032367321X.
- Angkeow, J.; Rothman, A.; Chaaban, L.; Paul, N.; Melia, J. Systematic Review: Outcome Prediction in Acute Severe Ulcerative Colitis. Gastro Hep Adv. 2024, 3, 260–270. [Google Scholar] [CrossRef]
- Pabla, B.S.; Schwartz, D.A. Assessing Severity of Disease in Patients with Ulcerative Colitis. Gastroenterol. Clin. North. Am. 2020, 49, 671–688. [Google Scholar] [CrossRef] [PubMed]
- Heinz, M.V.; Bhattacharya, S.; Trudeau, B.; Quist, R.; Song, S.H.; Lee, C.M.; Jacobson, N.C. Testing domain knowledge and risk of bias of a large-scale general artificial intelligence model in mental health. Digit. Health 2023, 9, 20552076231170499. [Google Scholar] [CrossRef]
- Li, H.; Ma, C.; Chen, X.; Liu, X. Dynamic Consolidation for Continual Learning. Neural Comput. 2023, 35, 228–248. [Google Scholar] [CrossRef] [PubMed]
- Oliveira, O.N., Jr.; Christino, L.; Oliveira, M.C.F.; Paulovich, F.V. Artificial Intelligence Agents for Materials Sciences. J. Chem. Inf. Model. 2023, 63, 7605–7609. [Google Scholar] [CrossRef]
- Korteling, J.E.H.; van de Boer-Visschedijk, G.C.; Blankendaal, R.A.M.; Boonekamp, R.C.; Eikelboom, A.R. Human- versus Artificial Intelligence. Front. Artif. Intell. 2021, 4, 622364. [Google Scholar] [CrossRef]
- Stanley, K. Artificial Intelligence and the Future of Dentistry. Compend. Contin. Educ. Dent. 2023, 44, 250–253. [Google Scholar]
- Artificial Intelligence. IBM Design for AI. Available online: https://www.ibm.com/design/ai/basics/ai/ (accessed on 26 September 2024).
- Bharadwaj, S.; Narula, N.; Tandon, P.; Yaghoobi, M. Role of endoscopy in inflammatory bowel disease. Gastroenterol Rep (Oxf) 2018, 6, 75–82. [Google Scholar] [CrossRef] [PubMed]
- Gajendran, M.; Loganathan, P.; Jimenez, G.; Catinella, A.P.; Ng, N.; Umapathy, C.; Ziade, N.; Hashash, J.G. A comprehensive review and update on ulcerative colitis(). Dis. Mon. 2019, 65, 100851. [Google Scholar] [CrossRef]
- Computer vision. MathWorks. R2024b. Available online: https://mathworks.com (accessed on 26 September 2024).
- van der Velden, B.H.M.; Kuijf, H.J.; Gilhuijs, K.G.A.; Viergever, M.A. Explainable artificial intelligence (XAI) in deep learning-based medical image analysis. Med. Image Anal. 2022, 79, 102470. [Google Scholar] [CrossRef]
- Tosun, A.B.; Pullara, F.; Becich, M.J.; Taylor, D.L.; Fine, J.L.; Chennubhotla, S.C. Explainable AI (xAI) for Anatomic Pathology. Adv. Anat. Pathol. 2020, 27, 241–250. [Google Scholar] [CrossRef]
- de Vries, B.M.; Zwezerijnen, G.J.C.; Burchell, G.L.; van Velden, F.H.P.; Menke-van der Houven van Oordt, C.W.; Boellaard, R. Explainable artificial intelligence (XAI) in radiology and nuclear medicine: a literature review. Front Med (Lausanne) 2023, 10, 1180773. [Google Scholar] [CrossRef] [PubMed]
- O’Sullivan, S.; Janssen, M.; Holzinger, A.; Nevejans, N.; Eminaga, O.; Meyer, C.P.; Miernik, A. Explainable artificial intelligence (XAI): closing the gap between image analysis and navigation in complex invasive diagnostic procedures. World J. Urol. 2022, 40, 1125–1134. [Google Scholar] [CrossRef] [PubMed]
- Ramprasaath, R. Selvaraju, Michael Cogswell, Abhishek Das, Ramakrishna Vedantam, Devi Parikh, Dhruv Batra. Grad-CAM: Visual Explanations from Deep Networks via Gradient-based Localization. [CrossRef]
- Selvaraju, R.R., M. Cogswell, A. Das, R. Vedantam, D. Parikh, and D. Batra. “Grad-CAM: Visual Explanations from Deep Networks via Gradient-Based Localization.” In IEEE International Conference on Computer Vision (ICCV), 2017, pp. 618–626.
- Arun Das, Paul Rad. Opportunities and Challenges in Explainable Artificial Intelligence (XAI): A Survey. arXiv:2006.11371.
- Turan, M.; Durmus, F. UC-NfNet: Deep learning-enabled assessment of ulcerative colitis from colonoscopy images. Med. Image Anal. 2022, 82, 102587. [Google Scholar] [CrossRef]
- Jiang, X.; Luo, X.; Nan, Q.; Ye, Y.; Miao, Y.; Miao, J. Application of deep learning in the diagnosis and evaluation of ulcerative colitis disease severity. Therap Adv. Gastroenterol. 2023, 16, 17562848231215579. [Google Scholar] [CrossRef]
- Bhambhvani, H.P.; Zamora, A. Deep learning enabled classification of Mayo endoscopic subscore in patients with ulcerative colitis. Eur. J. Gastroenterol. Hepatol. 2021, 33, 645–649. [Google Scholar] [CrossRef]
- Fan, Y.; Mu, R.; Xu, H.; Xie, C.; Zhang, Y.; Liu, L.; Wang, L.; Shi, H.; Hu, Y.; Ren, J.; et al. Novel deep learning-based computer-aided diagnosis system for predicting inflammatory activity in ulcerative colitis. Gastrointest. Endosc. 2023, 97, 335–346. [Google Scholar] [CrossRef] [PubMed]
- Byrne, M.F.; Panaccione, R.; East, J.E.; Iacucci, M.; Parsa, N.; Kalapala, R.; Reddy, D.N.; Ramesh Rughwani, H.; Singh, A.P.; Berry, S.K.; et al. Application of Deep Learning Models to Improve Ulcerative Colitis Endoscopic Disease Activity Scoring Under Multiple Scoring Systems. J. Crohns Colitis 2023, 17, 463–471. [Google Scholar] [CrossRef]
- Qi, J.; Ruan, G.; Ping, Y.; Xiao, Z.; Liu, K.; Cheng, Y.; Liu, R.; Zhang, B.; Zhi, M.; Chen, J.; et al. Development and validation of a deep learning-based approach to predict the Mayo endoscopic score of ulcerative colitis. Therap Adv. Gastroenterol. 2023, 16, 17562848231170945. [Google Scholar] [CrossRef]
- Gutierrez Becker, B.; Arcadu, F.; Thalhammer, A.; Gamez Serna, C.; Feehan, O.; Drawnel, F.; Oh, Y.S.; Prunotto, M. Training and deploying a deep learning model for endoscopic severity grading in ulcerative colitis using multicenter clinical trial data. Ther. Adv. Gastrointest. Endosc. 2021, 14, 2631774521990623. [Google Scholar] [CrossRef]
- Kim, J.E.; Choi, Y.H.; Lee, Y.C.; Seong, G.; Song, J.H.; Kim, T.J.; Kim, E.R.; Hong, S.N.; Chang, D.K.; Kim, Y.H.; et al. Deep learning model for distinguishing Mayo endoscopic subscore 0 and 1 in patients with ulcerative colitis. Sci. Rep. 2023, 13, 11351. [Google Scholar] [CrossRef]
- Rymarczyk, D.; Schultz, W.; Borowa, A.; Friedman, J.R.; Danel, T.; Branigan, P.; Chalupczak, M.; Bracha, A.; Krawiec, T.; Warchol, M.; et al. Deep Learning Models Capture Histological Disease Activity in Crohn’s Disease and Ulcerative Colitis with High Fidelity. J. Crohns Colitis 2024, 18, 604–614. [Google Scholar] [CrossRef] [PubMed]
- Vande Casteele, N.; Leighton, J.A.; Pasha, S.F.; Cusimano, F.; Mookhoek, A.; Hagen, C.E.; Rosty, C.; Pai, R.K.; Pai, R.K. Utilizing Deep Learning to Analyze Whole Slide Images of Colonic Biopsies for Associations Between Eosinophil Density and Clinicopathologic Features in Active Ulcerative Colitis. Inflamm. Bowel Dis. 2022, 28, 539–546. [Google Scholar] [CrossRef] [PubMed]
- Ohara, J.; Nemoto, T.; Maeda, Y.; Ogata, N.; Kudo, S.E.; Yamochi, T. Deep learning-based automated quantification of goblet cell mucus using histological images as a predictor of clinical relapse of ulcerative colitis with endoscopic remission. J. Gastroenterol. 2022, 57, 962–970. [Google Scholar] [CrossRef]
- Peyrin-Biroulet, L.; Adsul, S.; Stancati, A.; Dehmeshki, J.; Kubassova, O. An artificial intelligence-driven scoring system to measure histological disease activity in ulcerative colitis. United European Gastroenterol. J. 2024. [Google Scholar] [CrossRef]
- Helou, D.G.; Quach, C.; Hurrell, B.P.; Li, X.; Li, M.; Akbari, A.; Shen, S.; Shafiei-Jahani, P.; Akbari, O. LAIR-1 limits macrophage activation in acute inflammatory lung injury. Mucosal Immunol. 2023, 16, 788–800. [Google Scholar] [CrossRef]
- Carreras, J.; Ikoma, H.; Kikuti, Y.Y.; Miyaoka, M.; Hiraiwa, S.; Tomita, S.; Kondo, Y.; Ito, A.; Nagase, S.; Miura, H.; et al. Mutational, immune microenvironment, and clinicopathological profiles of diffuse large B-cell lymphoma and follicular lymphoma with BCL6 rearrangement. Virchows Arch. 2024, 484, 657–676. [Google Scholar] [CrossRef] [PubMed]
- Hassan-Zahraee, M.; Ye, Z.; Xi, L.; Dushin, E.; Lee, J.; Romatowski, J.; Leszczyszyn, J.; Danese, S.; Sandborn, W.J.; Banfield, C.; et al. Baseline Serum and Stool Microbiome Biomarkers Predict Clinical Efficacy and Tissue Molecular Response After Ritlecitinib Induction Therapy in Ulcerative Colitis. J. Crohns Colitis 2024, 18, 1361–1370. [Google Scholar] [CrossRef]
- Seo, H.; Chen, J.; Gonzalez-Avalos, E.; Samaniego-Castruita, D.; Das, A.; Wang, Y.H.; Lopez-Moyado, I.F.; Georges, R.O.; Zhang, W.; Onodera, A.; et al. TOX and TOX2 transcription factors cooperate with NR4A transcription factors to impose CD8(+) T cell exhaustion. Proc. Natl. Acad. Sci. U S A 2019, 116, 12410–12415. [Google Scholar] [CrossRef]
- Blank, C.U.; Haining, W.N.; Held, W.; Hogan, P.G.; Kallies, A.; Lugli, E.; Lynn, R.C.; Philip, M.; Rao, A.; Restifo, N.P.; et al. Defining ‘T cell exhaustion’. Nat. Rev. Immunol. 2019, 19, 665–674. [Google Scholar] [CrossRef]
- Canaria, D.A.; Rodriguez, J.A.; Wang, L.; Yeo, F.J.; Yan, B.; Wang, M.; Campbell, C.; Kazemian, M.; Olson, M.R. Tox induces T cell IL-10 production in a BATF-dependent manner. Front. Immunol. 2023, 14, 1275423. [Google Scholar] [CrossRef]
- Gu, X.G.; Yu, X.; Zhou, B.Y.; Li, M.; Xu, W.; Li, Y.; Li, L.F. Immune Cell Profiling of Atopic Dermatitis Patients Before and After Treatment with Halometasone Cream Wet-Wrap Therapy by Single-Cell Sequencing. Indian. J. Dermatol. 2023, 68, 8–14. [Google Scholar] [CrossRef] [PubMed]




| Mechanisms | Key players |
|---|---|
| Dysregulation of the epithelial barrier | Alterations of the mucus, increased number of bacteria within the mucus, and increased intestinal permeability [6,7,8] |
| Dysregulation of immune cells | Increased recruitment and activation of immune cell, including myeloid inflammatory cells, natural killer cells, T cells, B cells, plasma cells, neutrophils, and other leukocytes [9,10,11,12,13,14,15,16,17]. |
| Dysregulation of immune regulators and inflammatory cytokines | CD4+T lymphocytes, interferon (IFN)-gamma, Th1, Th2, Th17, FOXP3+regulatory T lymphocytes (Tregs), IL-10, TGFB, CD8+cytotoxic T lymphocytes [18,19,20,21,22,23,24,25] |
| Microbes | Alterations in the diversity and density of bacteria [26,27,28,29], specific microbial components, intestinal viruses [9,30,31,32], and fungi [33,34,35] |
| Genetic susceptibility | Over 240 different susceptibility loci, NOD2, ATG16L1, NADPH, and immune-related (Th17/IL-23, IL-10, TNFSF15, cytokine, adaptive immune response and epithelial pathways) [14,36,37,38,39,40,41,42,43,44] |
| Variable No. (%) |
Mesalazine -responsive |
Steroid -requiring |
All cases | P value |
|---|---|---|---|---|
| Number of patients | 22 | 13 | 35 | |
| Age (mean ±STD) | 43.7 ±13.6 | 29.5 ±17.6 | 38.4 ±16.4 | 0.012 |
| Sex Male | 14/22 (63.6) | 6/13 (46.2) | 20/35 (57.1) | 0.481 |
| Colon biopsy location | ||||
| Ascending | 0/22 (0) | 1/13 (7.7) | 1/35 (2.9) | 0.009 |
| Transverse | 0/22 (0) | 2/13 (15.4) | 2/35 (5.7) | |
| Descending | 2/22 (9.1) | 3/13 (23.1) | 5/35 (14.3) | |
| Sigmoid | 2/22 (9.1) | 3/13 (23.1) | 5/35 (14.3) | |
| Rectum | 18/22 (81.8) | 4/13 (30.8) | 22/35 (62.9) | |
| Endoscopic Baron score | ||||
| 1 | 13/22 (59.1) | 2/13 (15.4 | 15/35 (42.9) | 0.009 |
| 2 | 9/22 (40.9) | 8/13 (61.5) | 17/35 (48.6) | |
| 3 | 0/22 (0) | 3/13 (23.1) | 3/35 (8.6) | |
| Histologic Geboes score | ||||
| 1 | 2/22 (9.1) | 0/13 (0) | 2/35 (5.) | 0.101 (0.007*) |
| 2 | 13/22 (59.1) | 4/13 (30.8) | 17/35 (48.6) | |
| 3 | 5/22 (22.7) | 3/13 (23.1) | 8/35 (22.9) | |
| 4 | 2/22 (9.1) | 5/13 (38.5) | 7/35 (20) | |
| 5 | 0/22 (0) | 1/13 (7.7) | 1/35 (2.9) |
| ResNet-18-based CNN | Training (70%) | Validation (10%) | Training options |
|---|---|---|---|
| Input type: image Output type: classification Number of layers: 71 Number of connections: 78 |
Observations: 59677 Classes: 3 Ulcerative colitis: 6497 Colorectal cancer: 44608 Colon control: 8572 |
Observations: 8525 Classes: 3 Ulcerative colitis: 928 Colorectal cancer: 6372 Colon control: 1225 |
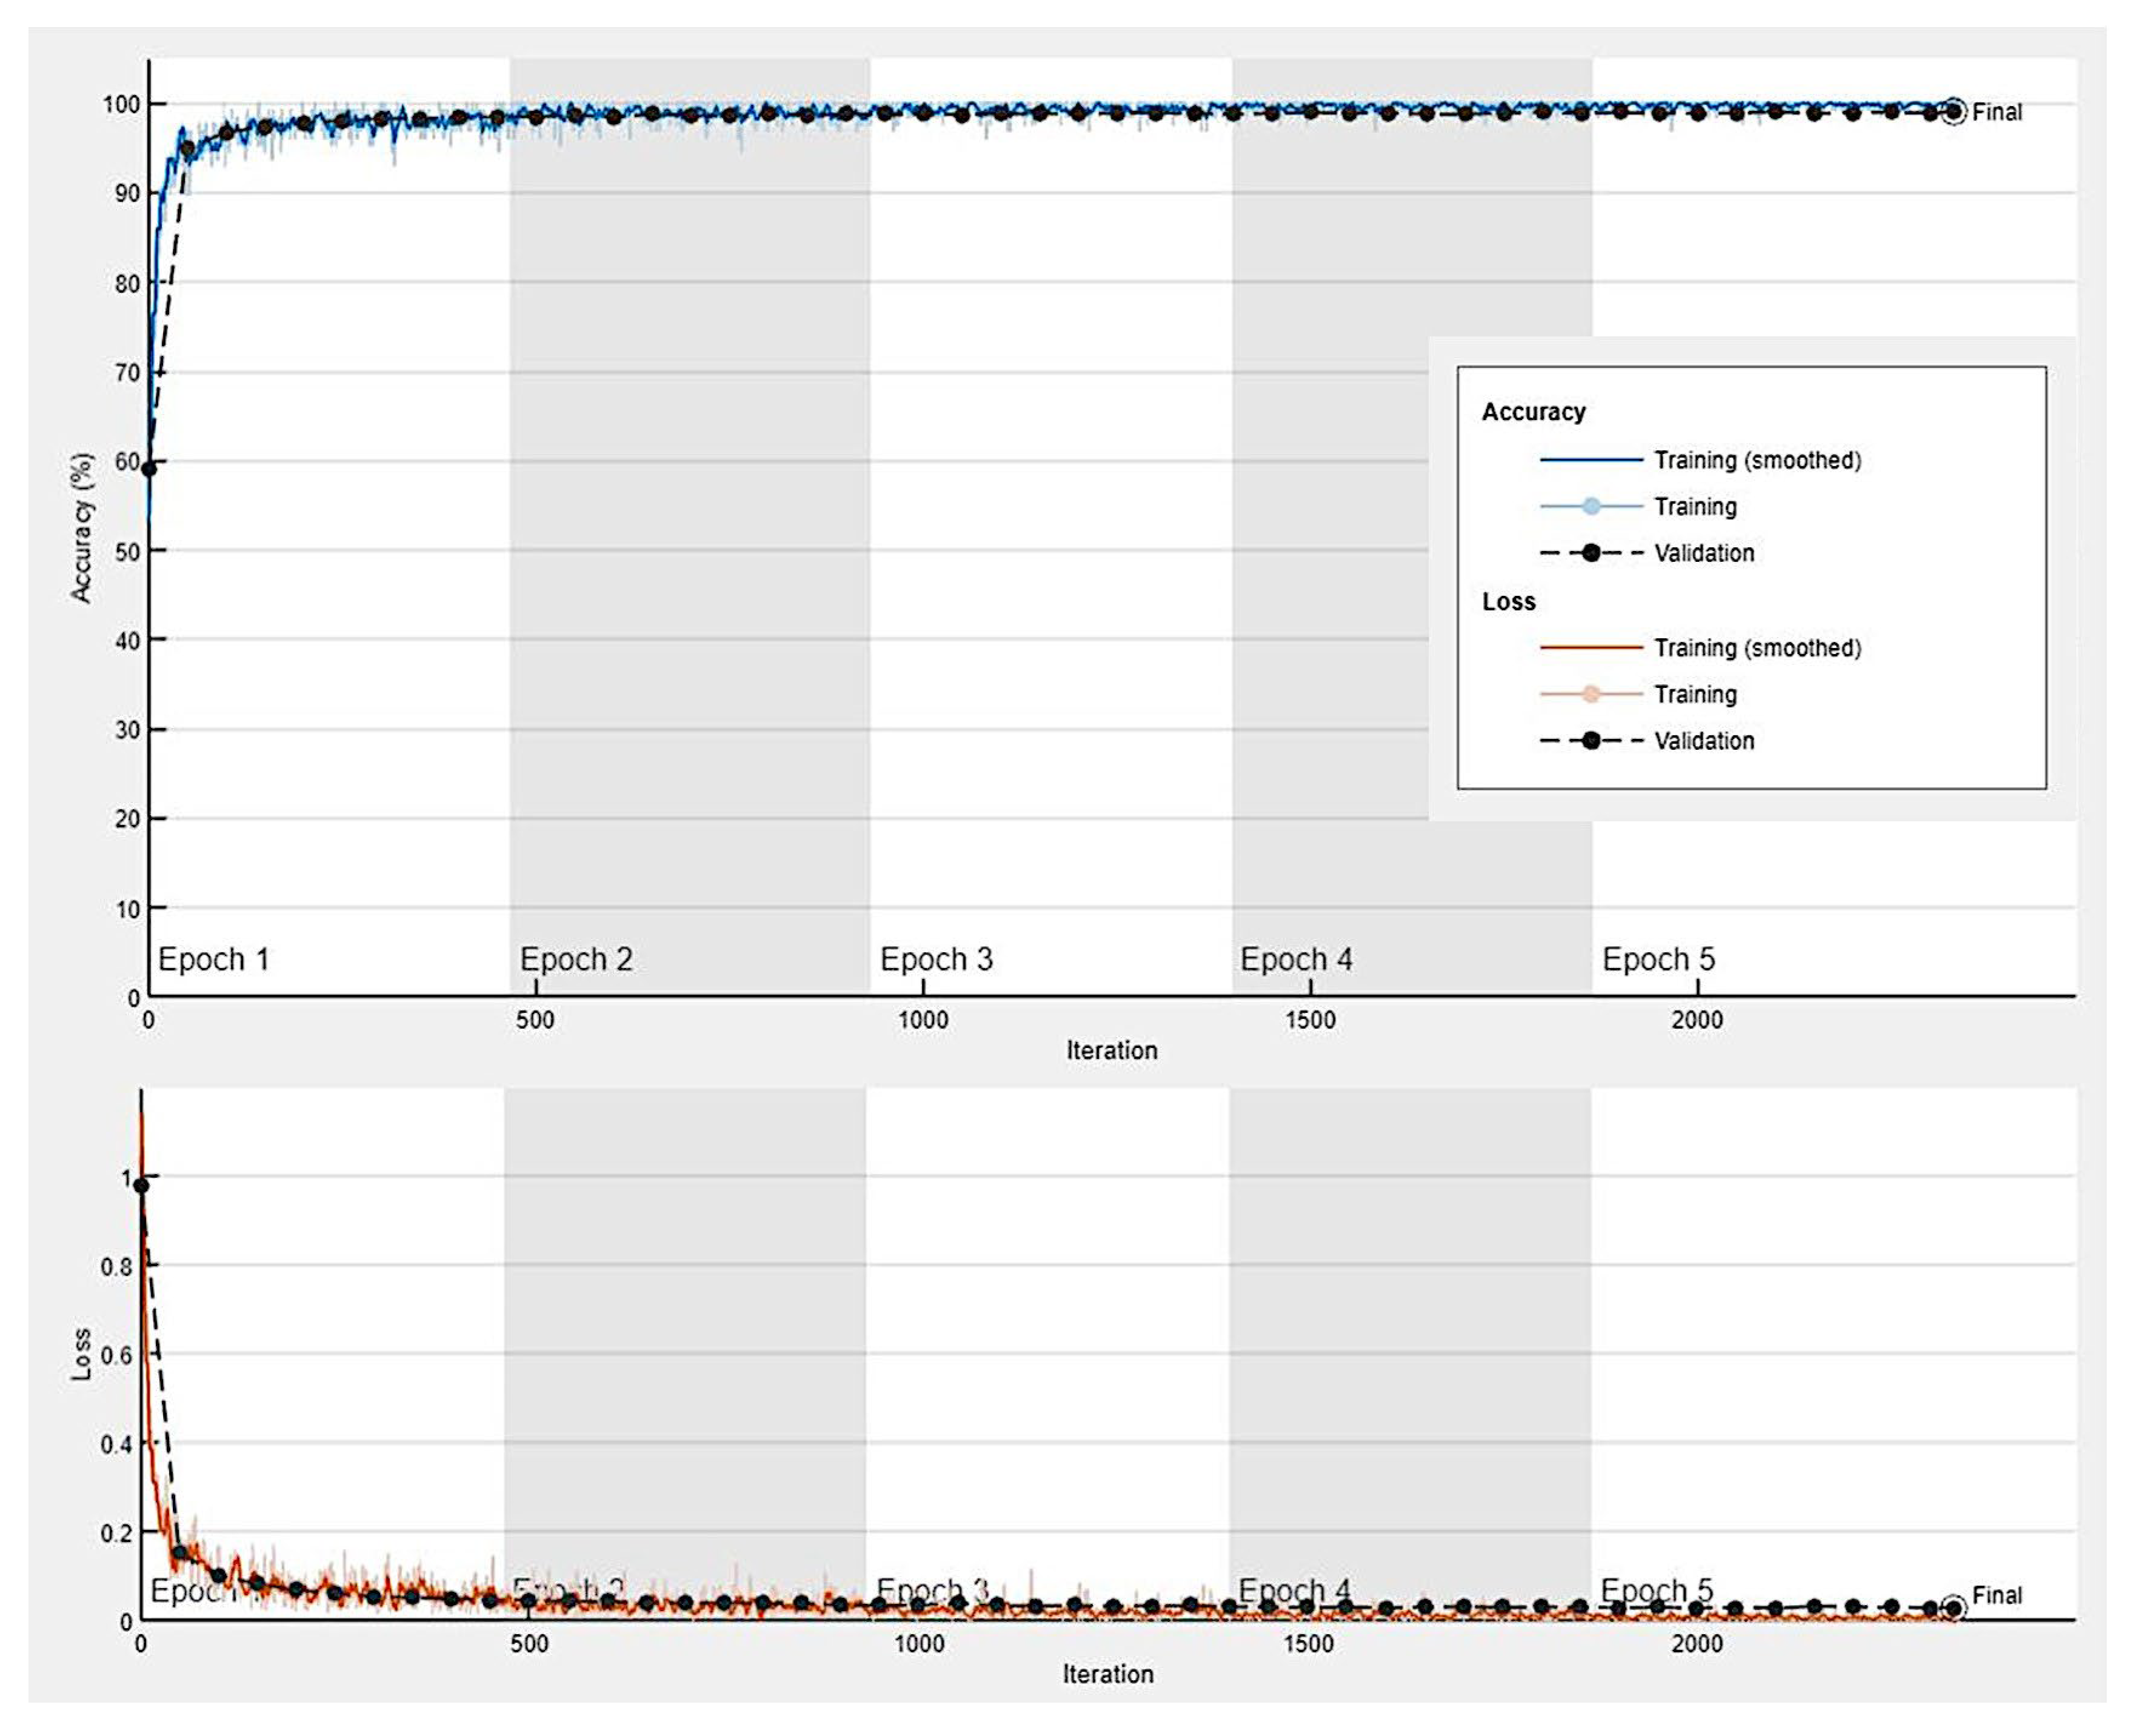
Solver: sgdm Initial learning rate: 0.001 MiniBatch size: 128 MaxEpochs: 5 Validation frequency: 50 Iterations: 2330 Iterations per epoch: 466 |
| Name [Reference] | Model Name Argument | Depth | Size (MB) | Parameters (Millions) | Image Input Size |
|---|---|---|---|---|---|
| AlexNet [77] | “alexnet” | 8 | 227 | 61 | 227-by-227 |
| DenseNet-201 [78] | “densenet201” | 201 | 77 | 20 | 224-by-224 |
| EfficientNet-b0 [79] | “efficientnetb0” | 82 | 20 | 5.3 | 224-by-224 |
| GoogLeNet [80,81] | “googlenet” | 22 | 27 | 7 | 224-by-224 |
| “googlenet-places365” | |||||
| Inception-v3 [82] | “inceptionv3” | 48 | 89 | 23.9 | 299-by-299 |
| MobileNet-v2 [83] | “mobilenetv2” | 53 | 13 | 3.5 | 224-by-224 |
| NASNet-Large [84] | “nasnetlarge” | * | 332 | 88.9 | 331-by-331 |
| NASNet-Mobile [84] | “nasnetmobile” | * | 20 | 5.3 | 224-by-224 |
| ResNet-18 [85] | “resnet18” | 18 | 44 | 11.7 | 224-by-224 |
| ResNet-50 [85] | “resnet50” | 50 | 96 | 25.6 | 224-by-224 |
| ResNet-101 [85] | “resnet101” | 101 | 167 | 44.6 | 224-by-224 |
| ShuffleNet [86] | “shufflenet” | 50 | 5.4 | 1.4 | 224-by-224 |
| VGG-16 [87] | “vgg16” | 16 | 515 | 138 | 224-by-224 |
| VGG-19 [87] | “vgg19” | 19 | 535 | 144 | 224-by-224 |
| Xception [88] | “xception” | 71 | 85 | 22.9 | 299-by-299 |
| Predicted variable | Accuracy (%) | Precision (%) | Recall (%) | F1-Score (%) | Specificity (%) | False Positive Rate (%) |
|---|---|---|---|---|---|---|
| Ulcerative colitis | 99.10 | 97.09 | 94.79 | 95.93 | 99.64 | 0.36 |
| Adenocarcinoma | 99.84 | 99.90 | 99.88 | 99.89 | 99.70 | 0.30 |
| Colon control | 99.06 | 95.75 | 97.63 | 96.68 | 99.29 | 0.71 |
| Predicted variable | Accuracy (%) | Precision (%) | Recall (%) | F1-Score (%) | Specificity (%) | False Positive Rate (%) |
|---|---|---|---|---|---|---|
| Steroid-requiring | 79.53 | 66.18 | 70.74 | 68.39 | 83.53 | 16.47 |
| Mesalazine-responsive | 79.53 | 86.23 | 83.53 | 84.86 | 70.74 | 29.26 |
| Predicted variable | Accuracy (%) | Precision (%) | Recall (%) | F1-Score (%) | Specificity (%) | False Positive Rate (%) |
|---|---|---|---|---|---|---|
| Steroid-requiring | 88.31 | 79.38 | 82.26 | 80.79 | 90.89 | 9.11 |
| Mesalazine-responsive | 88.31 | 92.31 | 90.89 | 91.59 | 82.26 | 17.74 |
| Predicted variable | Accuracy (%) | Precision (%) | Recall (%) | F1-Score (%) | Specificity (%) | False Positive Rate (%) |
|---|---|---|---|---|---|---|
| Steroid-requiring | 85.62 | 72.04 | 79.51 | 75.59 | 87.99 | 12.01 |
| Mesalazine-responsive | 85.62 | 91.69 | 87.99 | 89.80 | 79.51 | 20.49 |
| Model | Accuracy (%) |
|---|---|
| DenseNet-201 | 99.30 |
| ResNet-50 | 99.14 |
| Inception-v3 | 99.13 |
| ResNet-101 | 99.10 |
| ResNet-18 | 99.00 |
| ShuffleNet | 98.94 |
| MobileNet-v2 | 98.89 |
| NasNet-Large | 98.88 |
| GoogLeNet-Places365 | 98.86 |
| VGG-19 | 98.80 |
| EfficientNet-b0 | 98.79 |
| AlexNet | 98.77 |
| Xception | 98.66 |
| VGG-16 | 98.65 |
| GoogLeNet | 98.60 |
| NasNet-Mobile | 98.58 |
Disclaimer/Publisher’s Note: The statements, opinions and data contained in all publications are solely those of the individual author(s) and contributor(s) and not of MDPI and/or the editor(s). MDPI and/or the editor(s) disclaim responsibility for any injury to people or property resulting from any ideas, methods, instructions or products referred to in the content. |
© 2024 by the authors. Licensee MDPI, Basel, Switzerland. This article is an open access article distributed under the terms and conditions of the Creative Commons Attribution (CC BY) license (http://creativecommons.org/licenses/by/4.0/).


