3.1. Measuring System
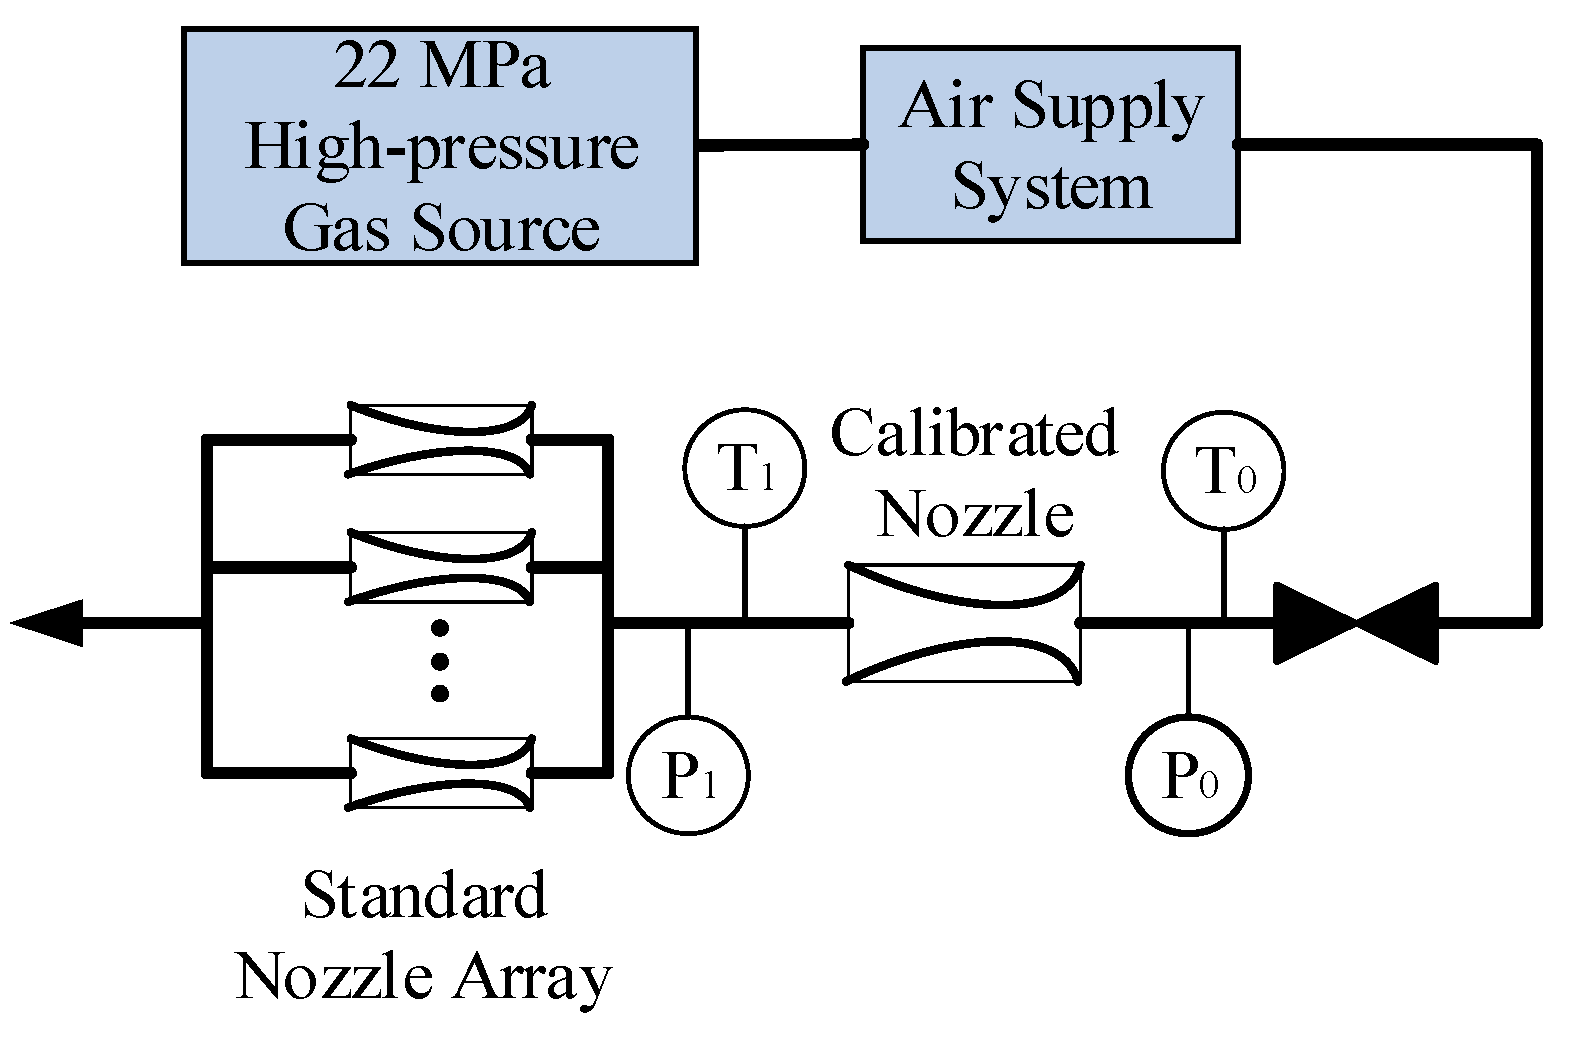
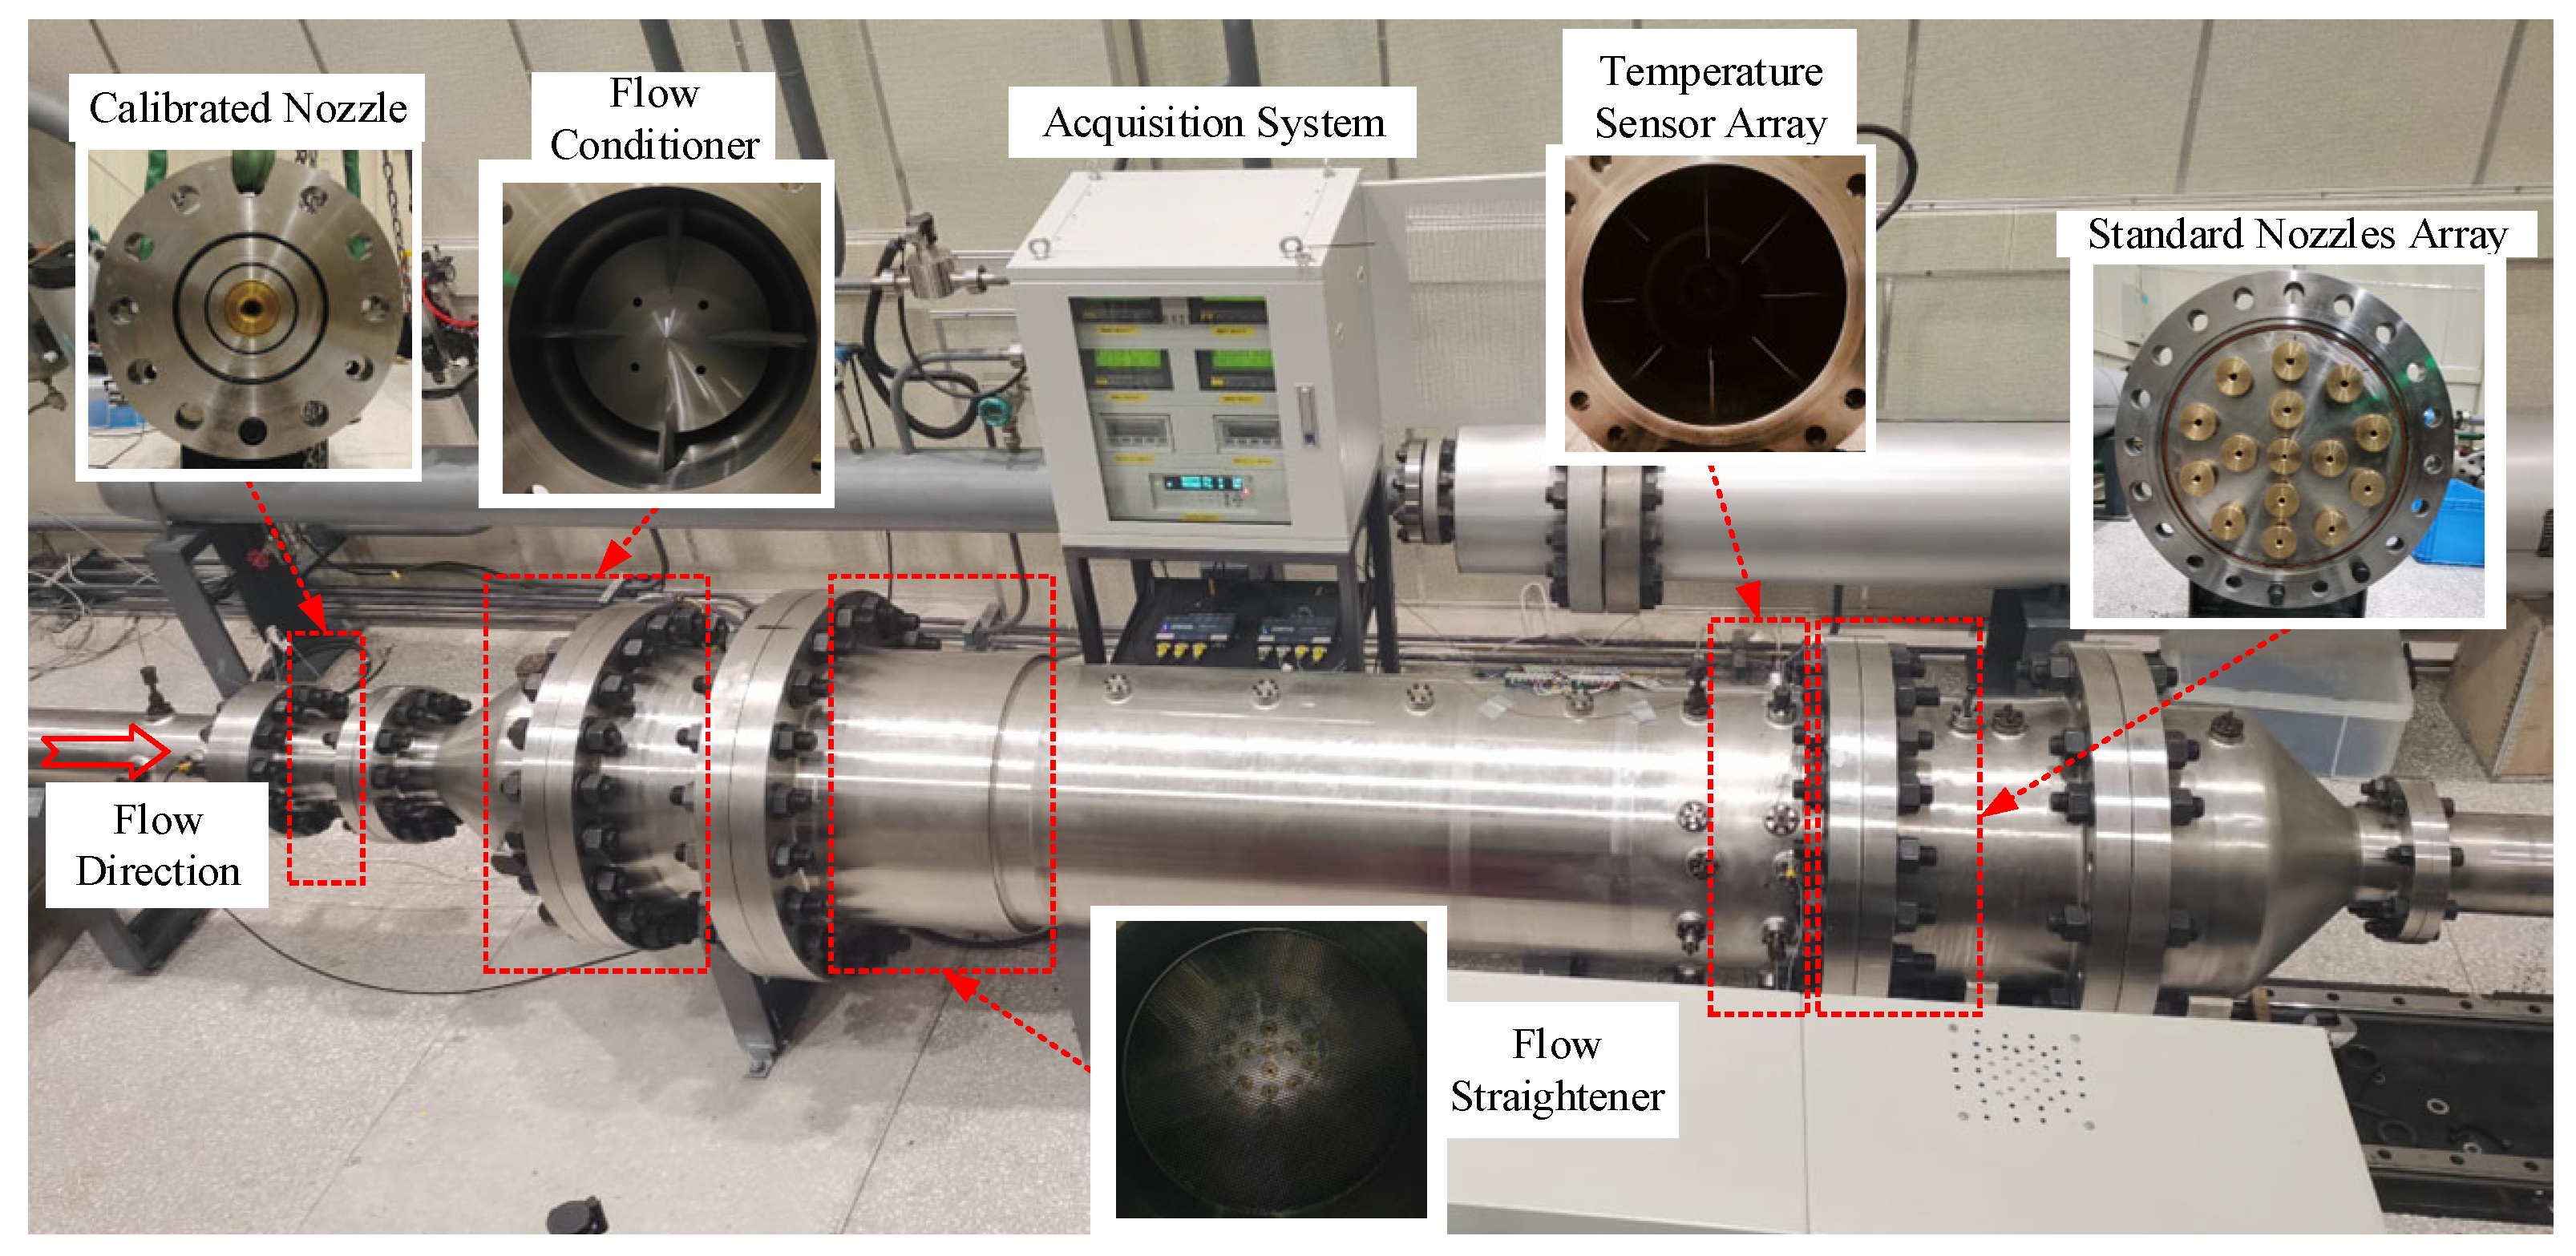
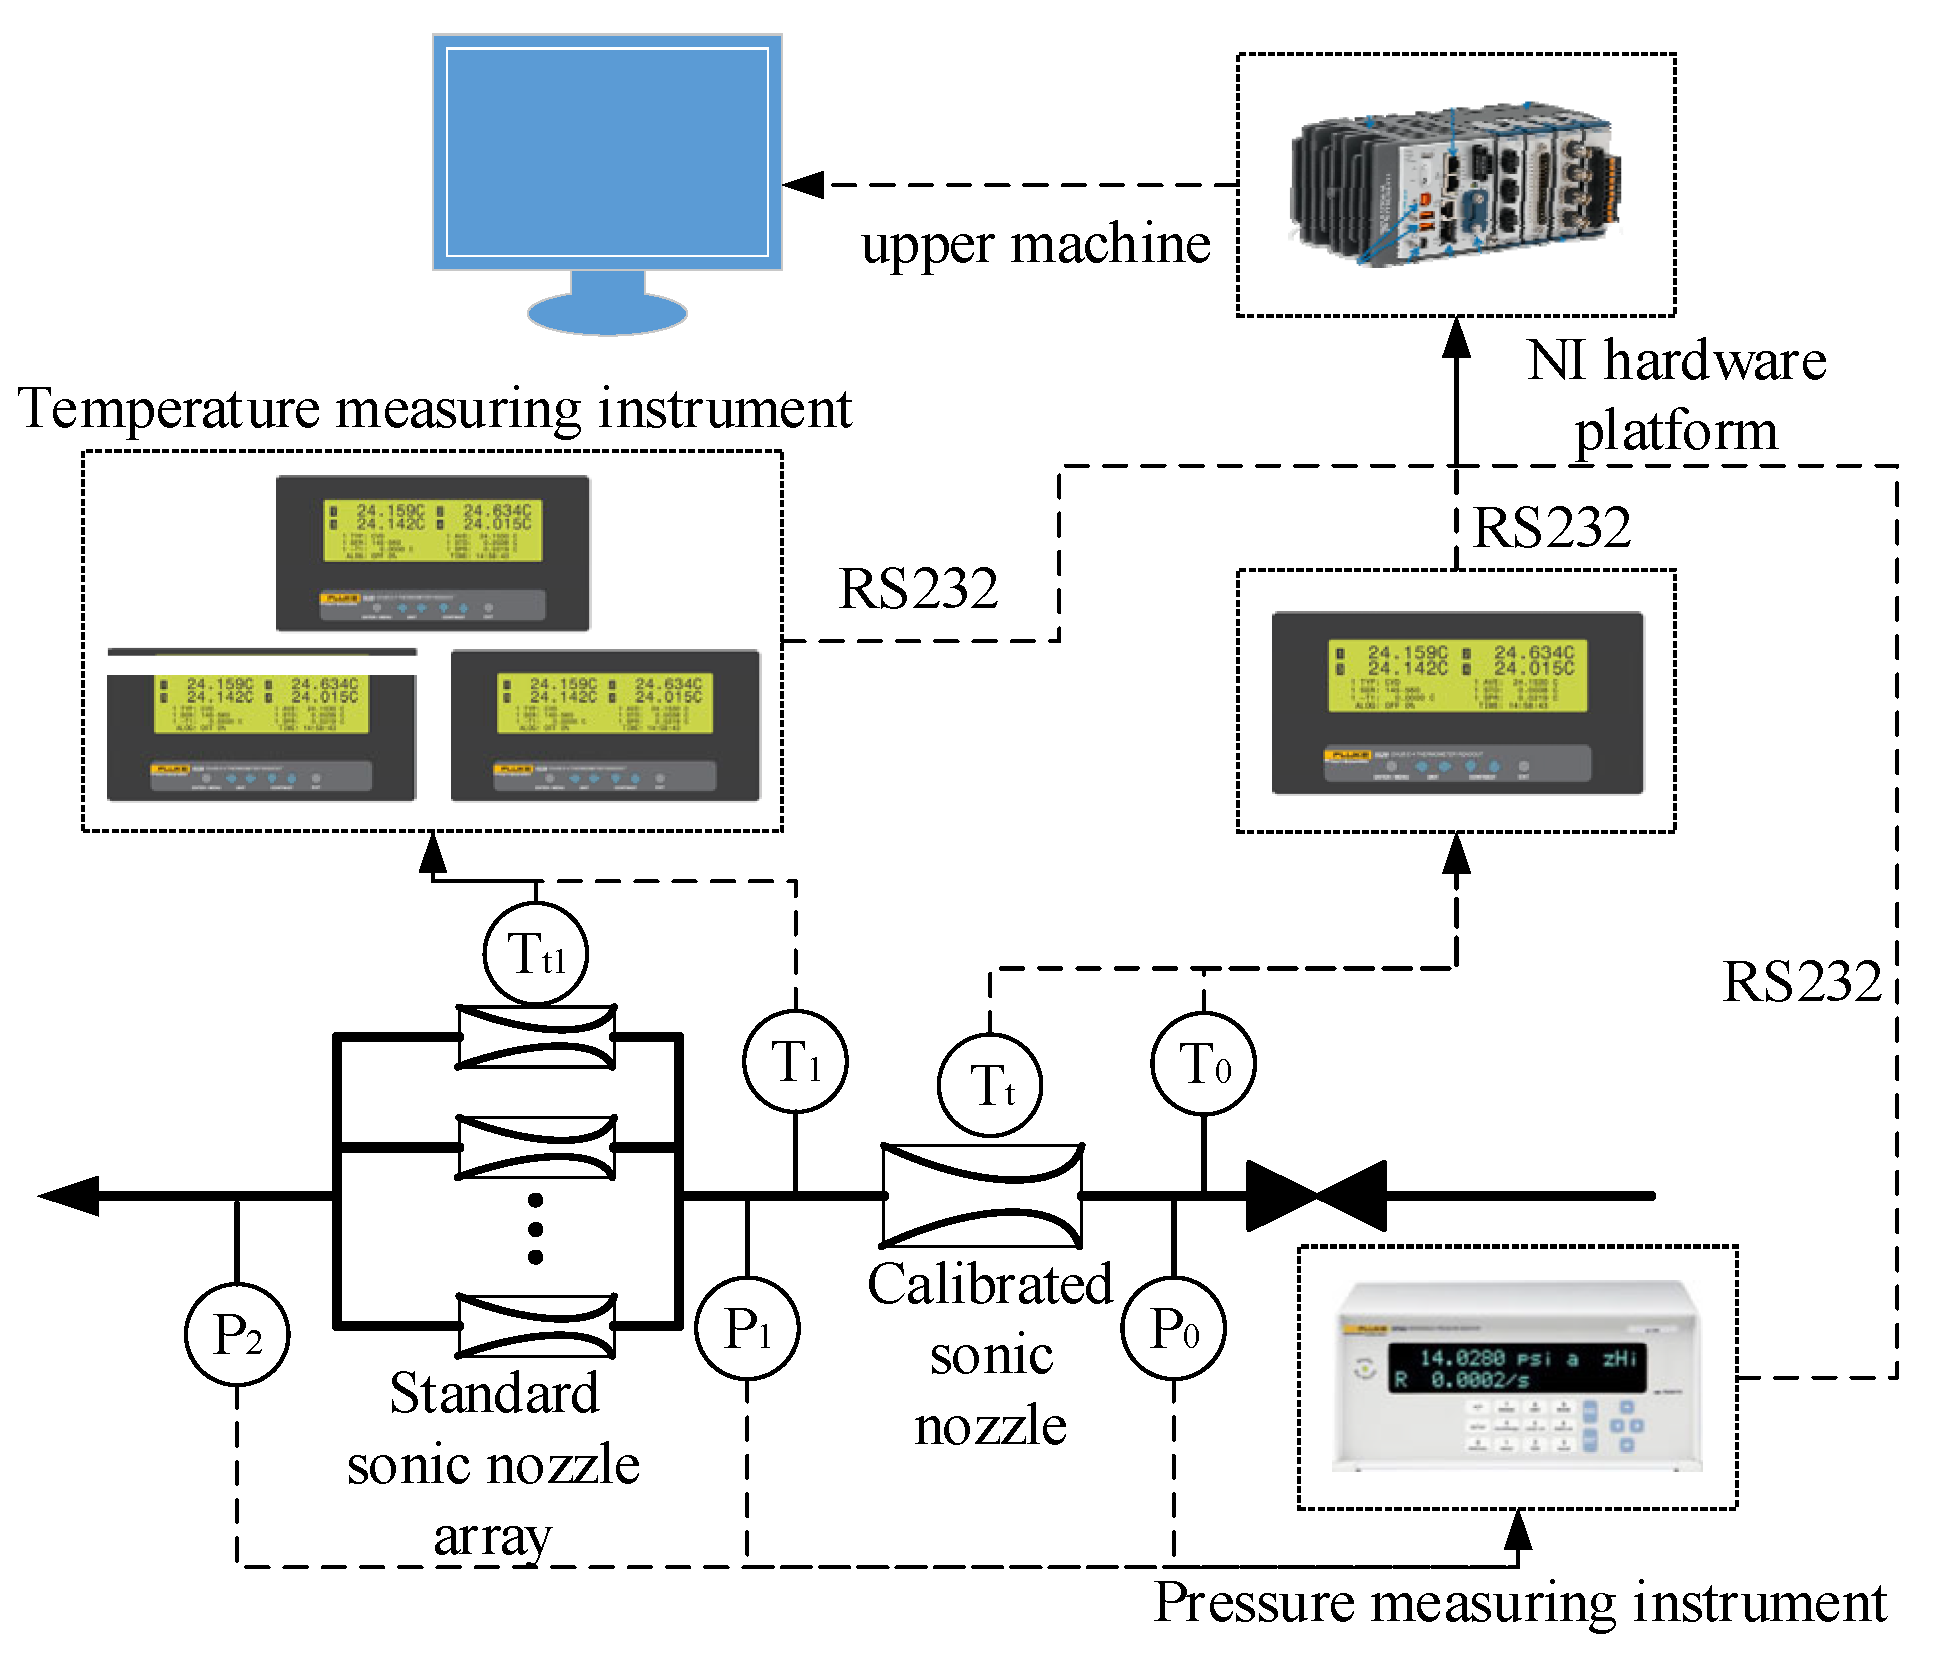
The structure of the measurement system is shown in
Figure 8, and its function is to measure the atmospheric pressure, stagnation pressure, stagnation temperature, back pressure, and throat material temperature of the calibrated sonic nozzle and the standard sonic nozzle. It consists of the temperature sensor, temperature measuring instrument, pressure measuring instrument, and upper machine.
The measurement range of the temperature sensor is (0~100) ℃, with uncertainty is ±0.01 ℃, and the size of the temperature sensor is Φ3.2×229 mm; the measurement accuracy of the temperature measuring instrument is lower than ±0.01 ℃; the measurement range of the pressure measuring instrument is (0~7) MPa, and the measurement uncertainty is subdivided into 600 Pa (absolute pressure 6.0 MPa) , 300 Pa (absolute pressure 3.0 MPa) , 220 Pa (absolute pressure 2.0 MPa) . The measuring instrument communicates with the upper machine through the cluster communication port (RS232) to achieve real-time and high-precision measurement and detection.
3.2. Temperature Measurement at Different Flow Rates
We considered that the inner diameter of the second-stage pipe was 500 mm before the test, and related studies have shown [
14] that due to the temperature stratification phenomenon, there will be an average temperature difference of 1.7 K on the temperature measurement profile within the larger pipe diameter. To more accurately obtain the temperature field in the second-stage pipe inner profile, the temperature of the cross-section at 12
d (
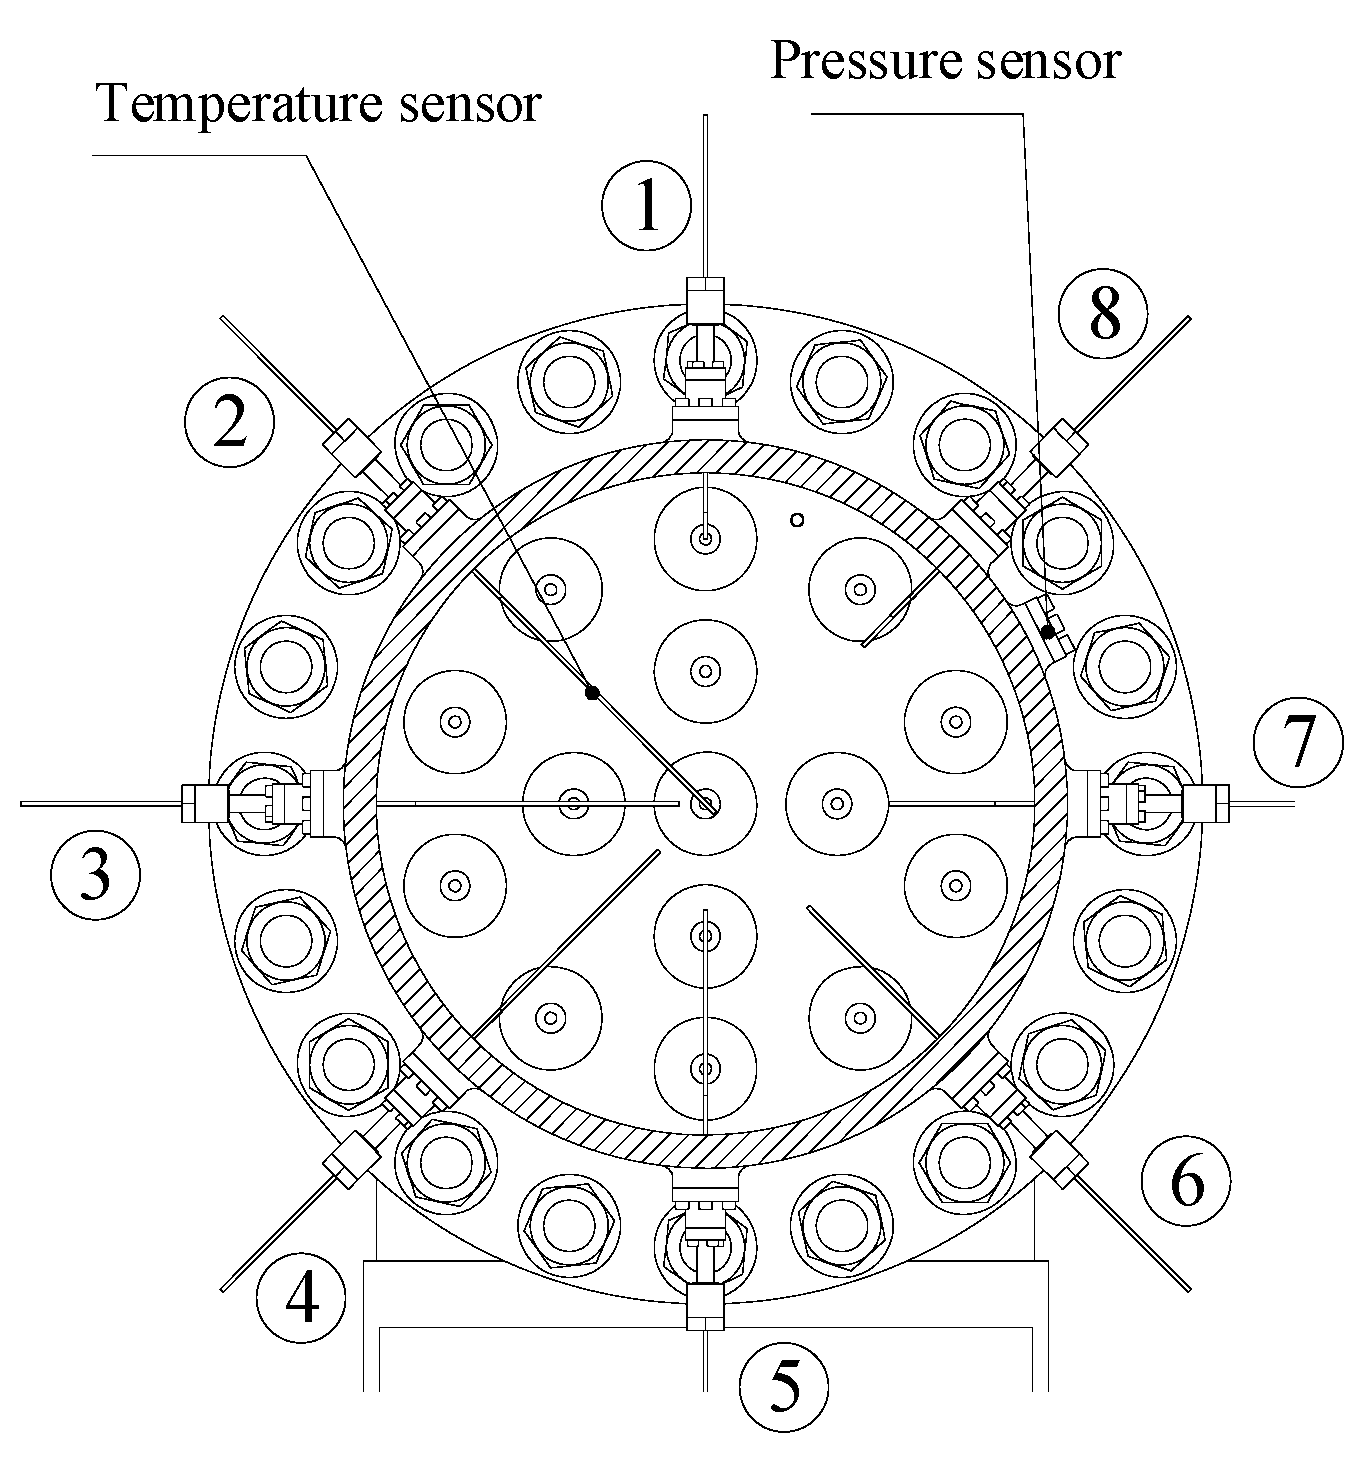
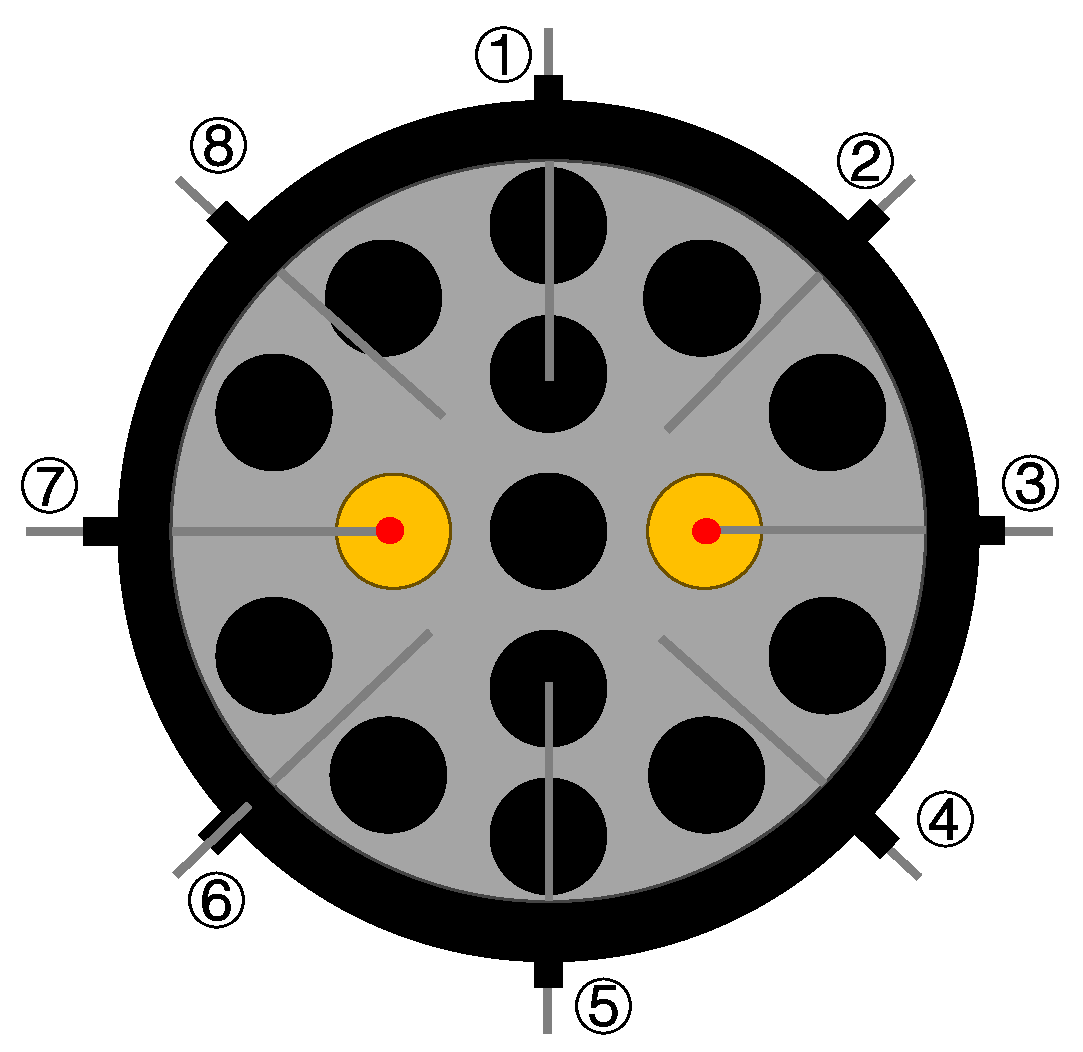
d: the maximum throat diameter of 9 mm in the standard nozzles) upstream of the standard sonic nozzle array was measured. As shown in
Figure 9, 8 temperature sensors were installed at a distance of 12
d (
d=9 mm) upstream of the standard sonic nozzle array, and each sensor was inserted at a maximum depth of 150 mm and a minimum depth of 50 mm.
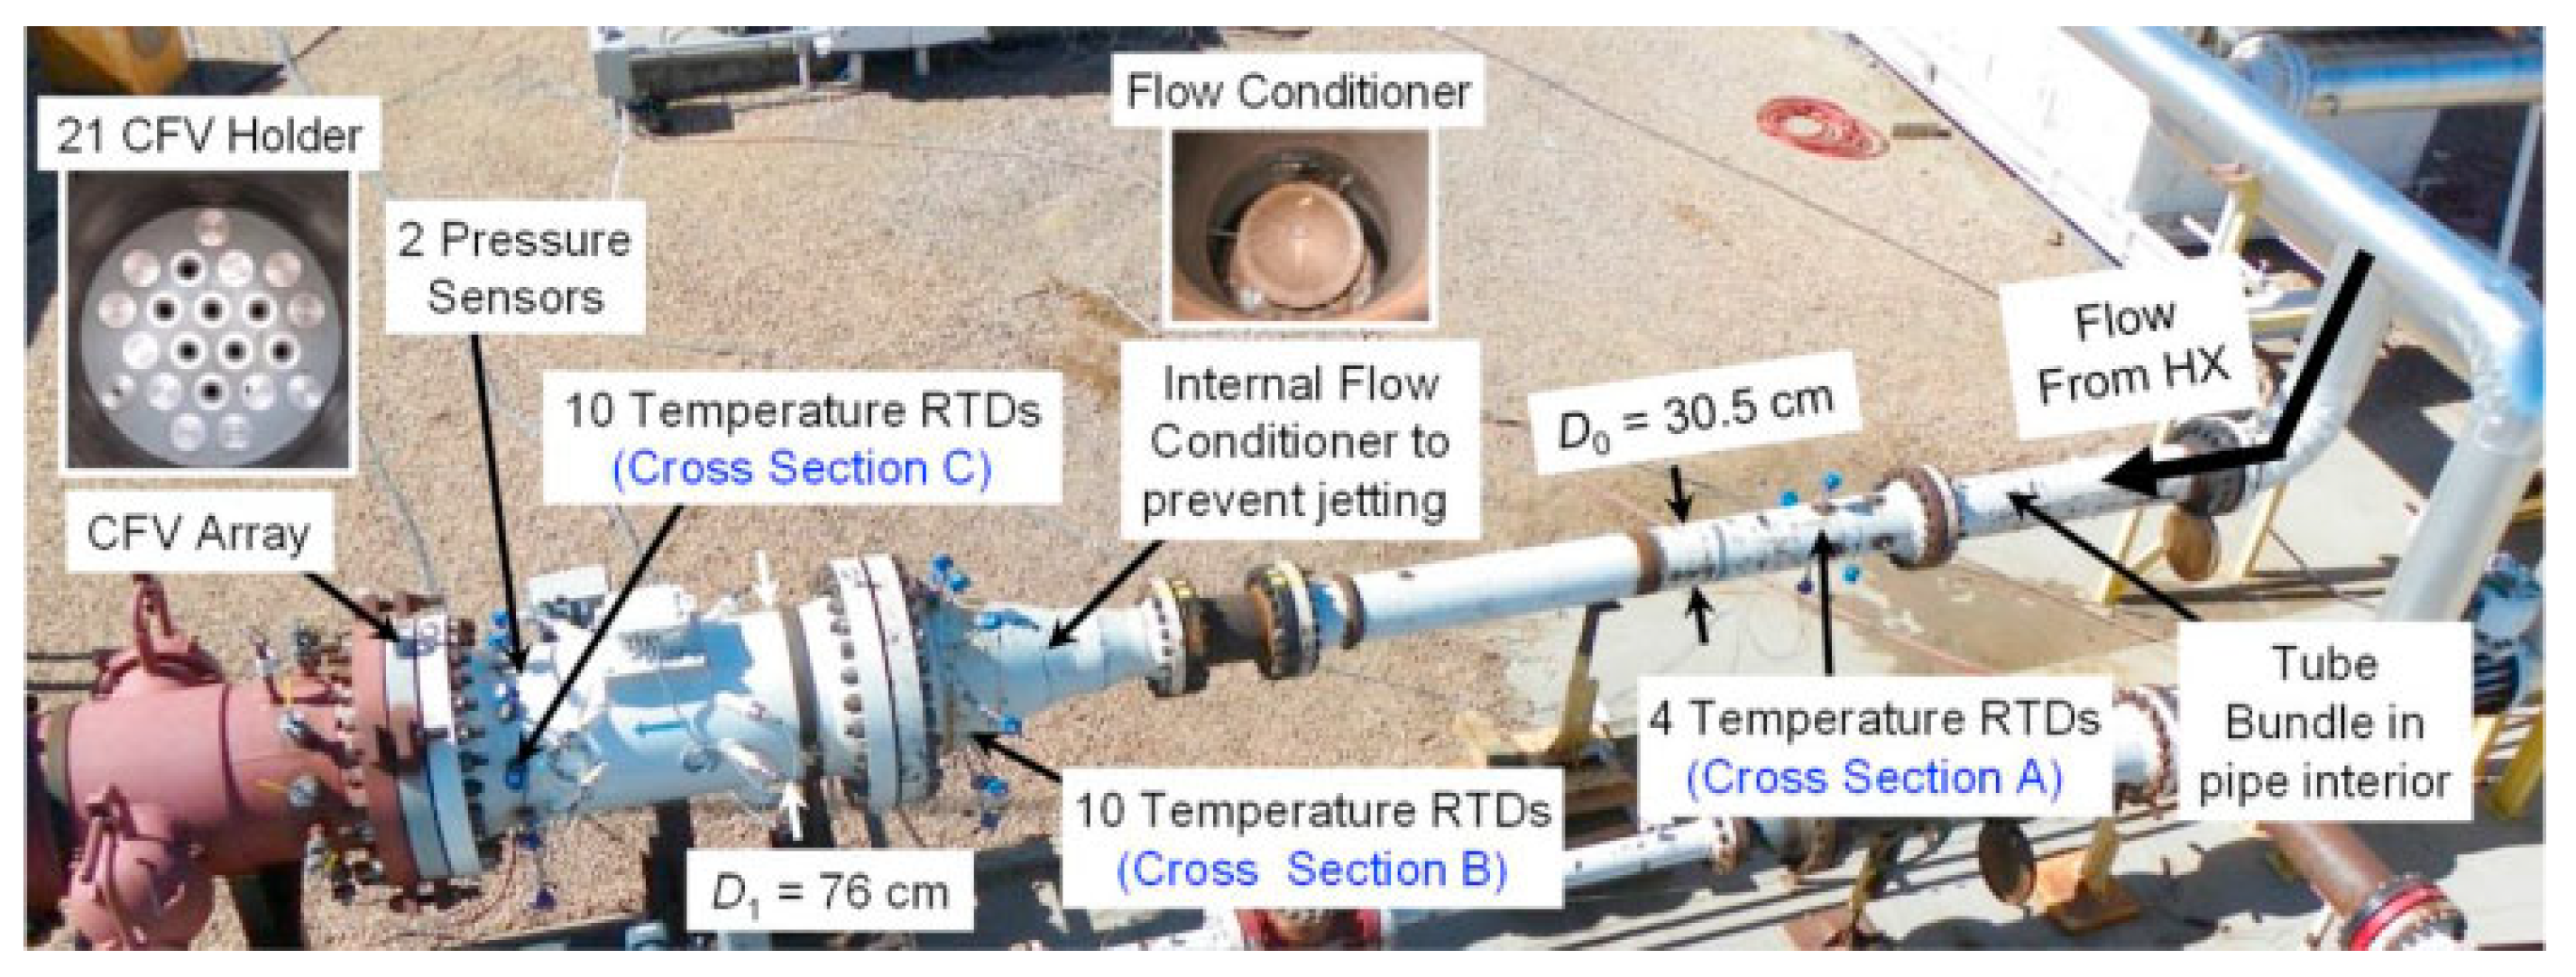
At present, there are different measurement methods for the upstream temperature of the sonic nozzle array. Aaron N. Johnson's method is to measure the temperature at three different distance points (Cross Section A, Cross Section B, Cross Section C) upstream of the sonic nozzle array, as shown in
Figure 10, and take the average value to represent
Tm,array. There is then:
If the temperature gradient among the three points is large, the temperature measurement will try to select the point close to the sonic nozzle array, i.e., Cross Section C; NIST [
9] proposed that when measuring the temperature of the sonic nozzle array, two temperature sensor arrays at different locations are used to average
T1. The first temperature sensor array uses 10 temperature sensors at equal distances to average
Tm1, and the second temperature sensor array uses 10 uniformly distributed temperature sensors with the same insertion depth to average
Tm2, as shown in
Figure 11.
However, we found that due to the non-uniform temperature distribution shown in the temperature section upstream of the standard sonic nozzle array under different gas flow rates, at a small flow rate (qm=0.12 kg/s) , the maximum temperature of the temperature measurement section is 1.97 K, only 0.03 K when the flow rate is large (qm=3.00 kg/s) . Therefore, when measuring different flow rates, different measurement methods should be used to calculate Tm,array, and the averaging method of the temperature sensor array cannot be used.
When calibrating the calibrated sonic nozzle with a small throat diameter, due to the small flow rate, the temperature difference in the same section of the pipeline is large. If the average value obtained by the temperature sensor array is used to represent
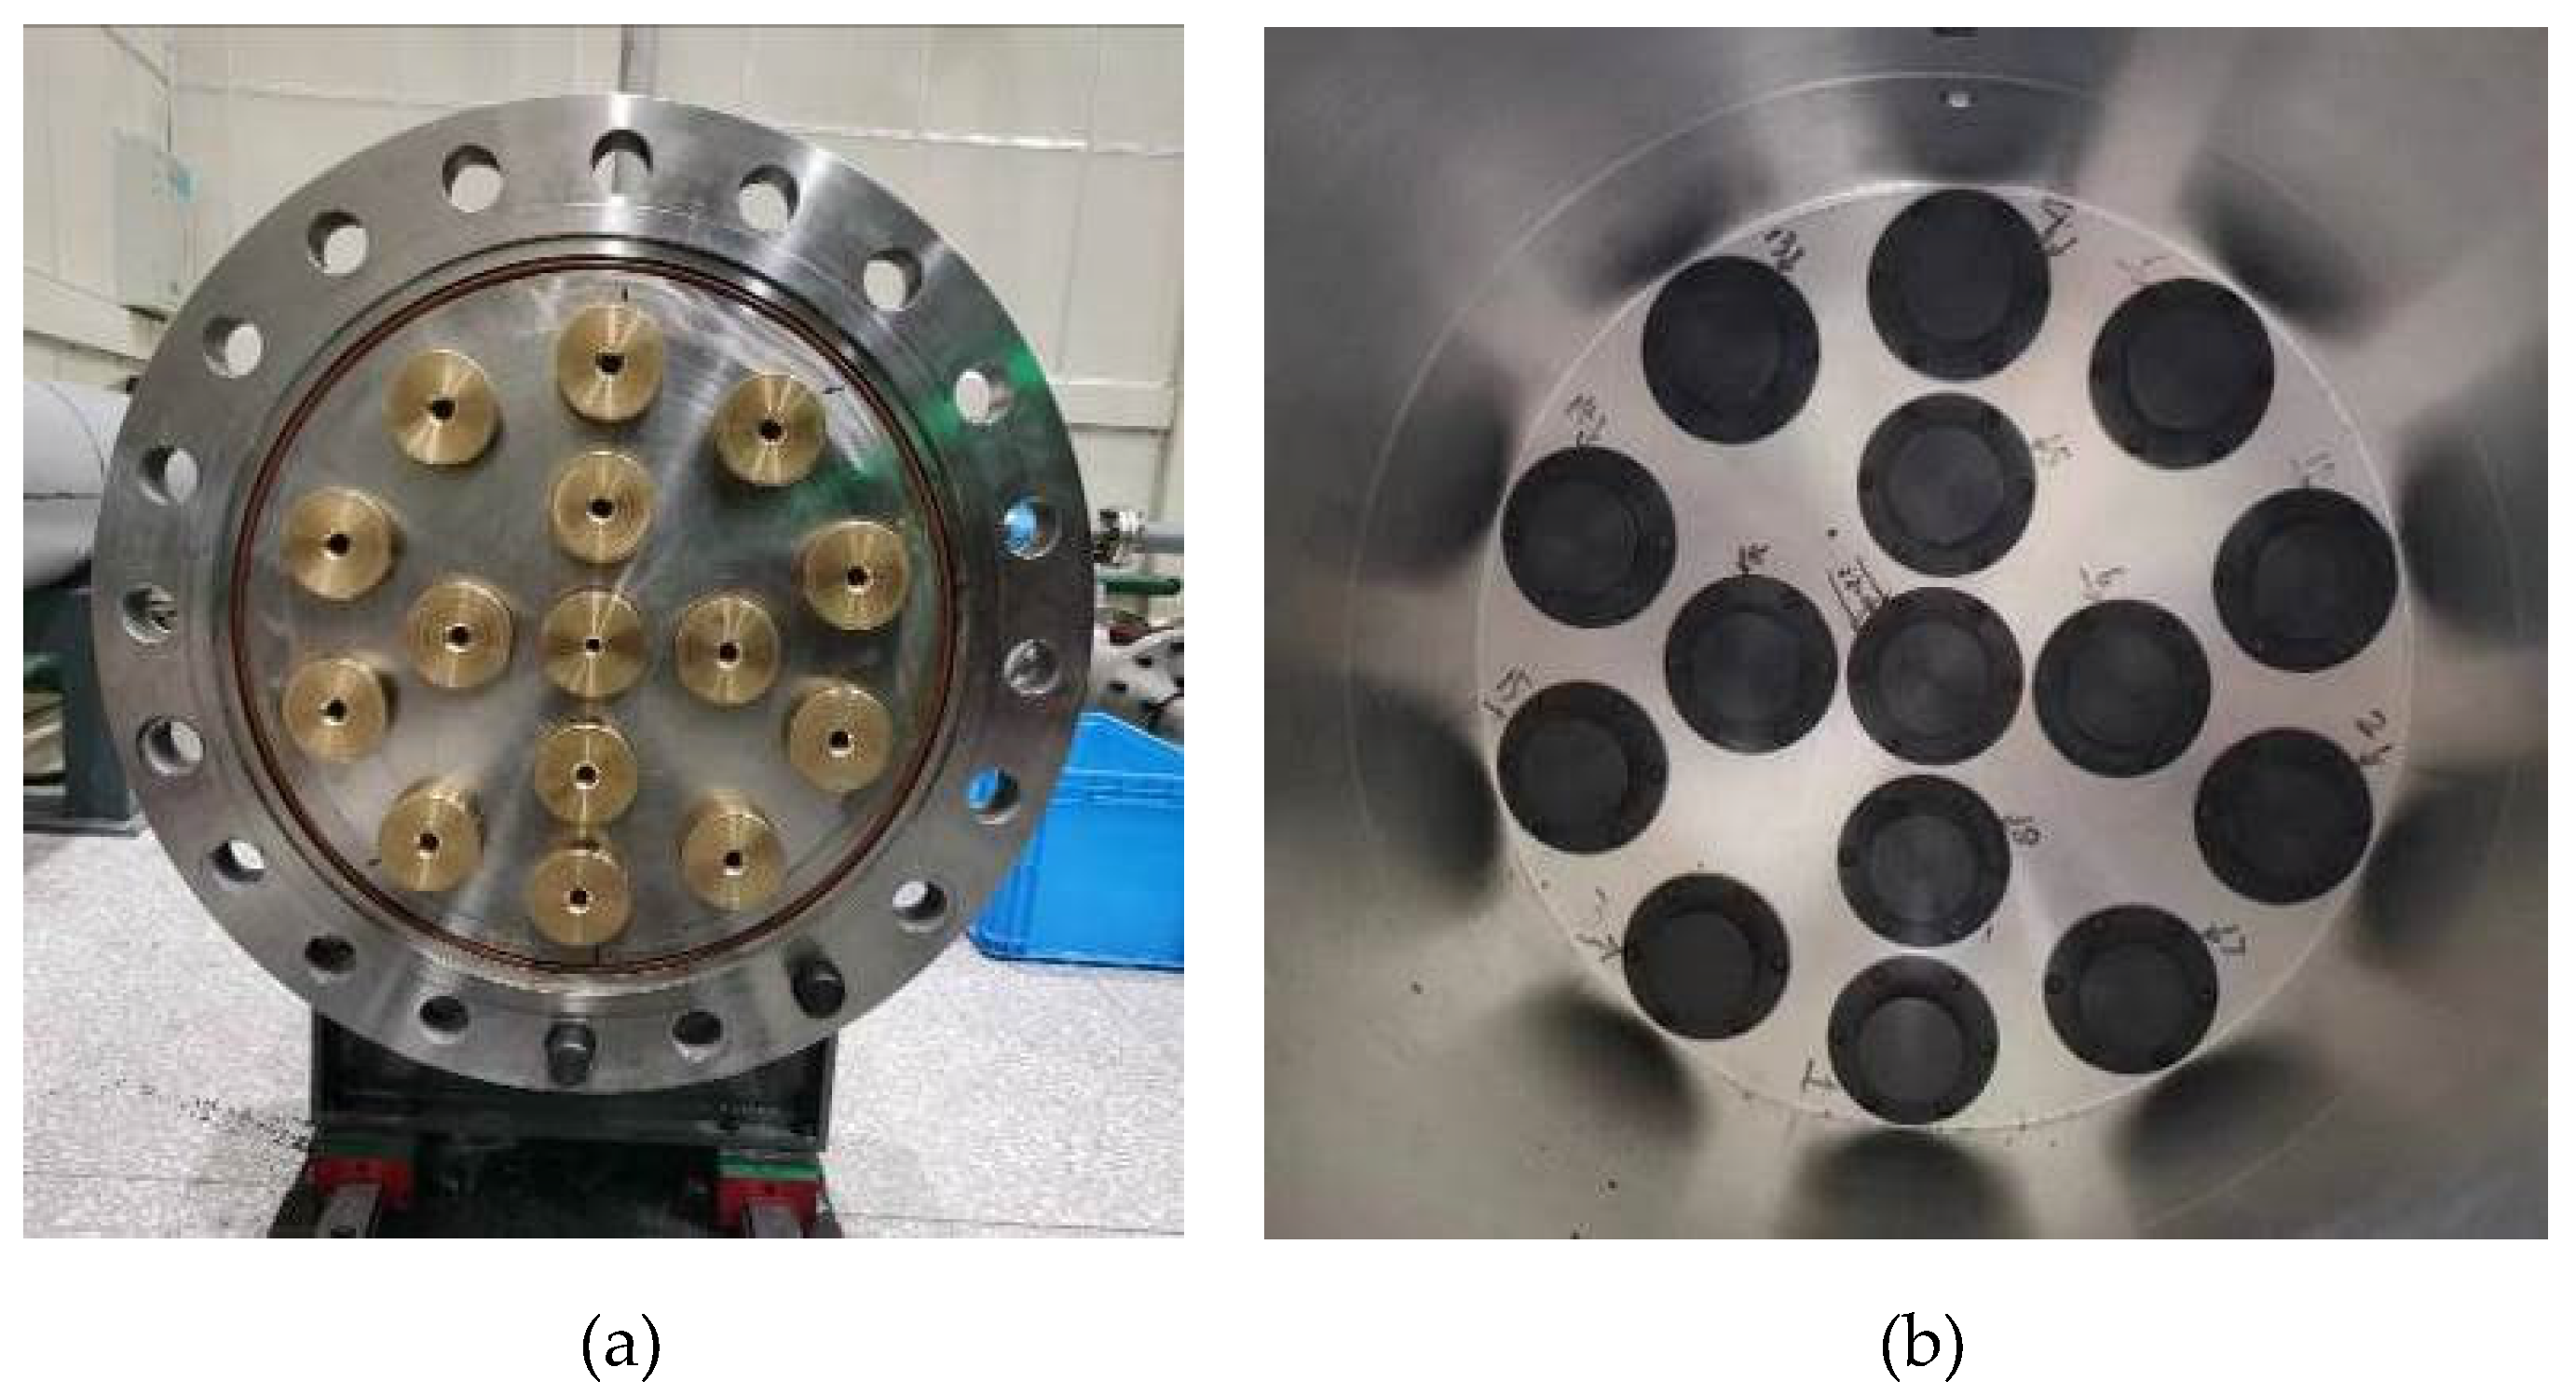
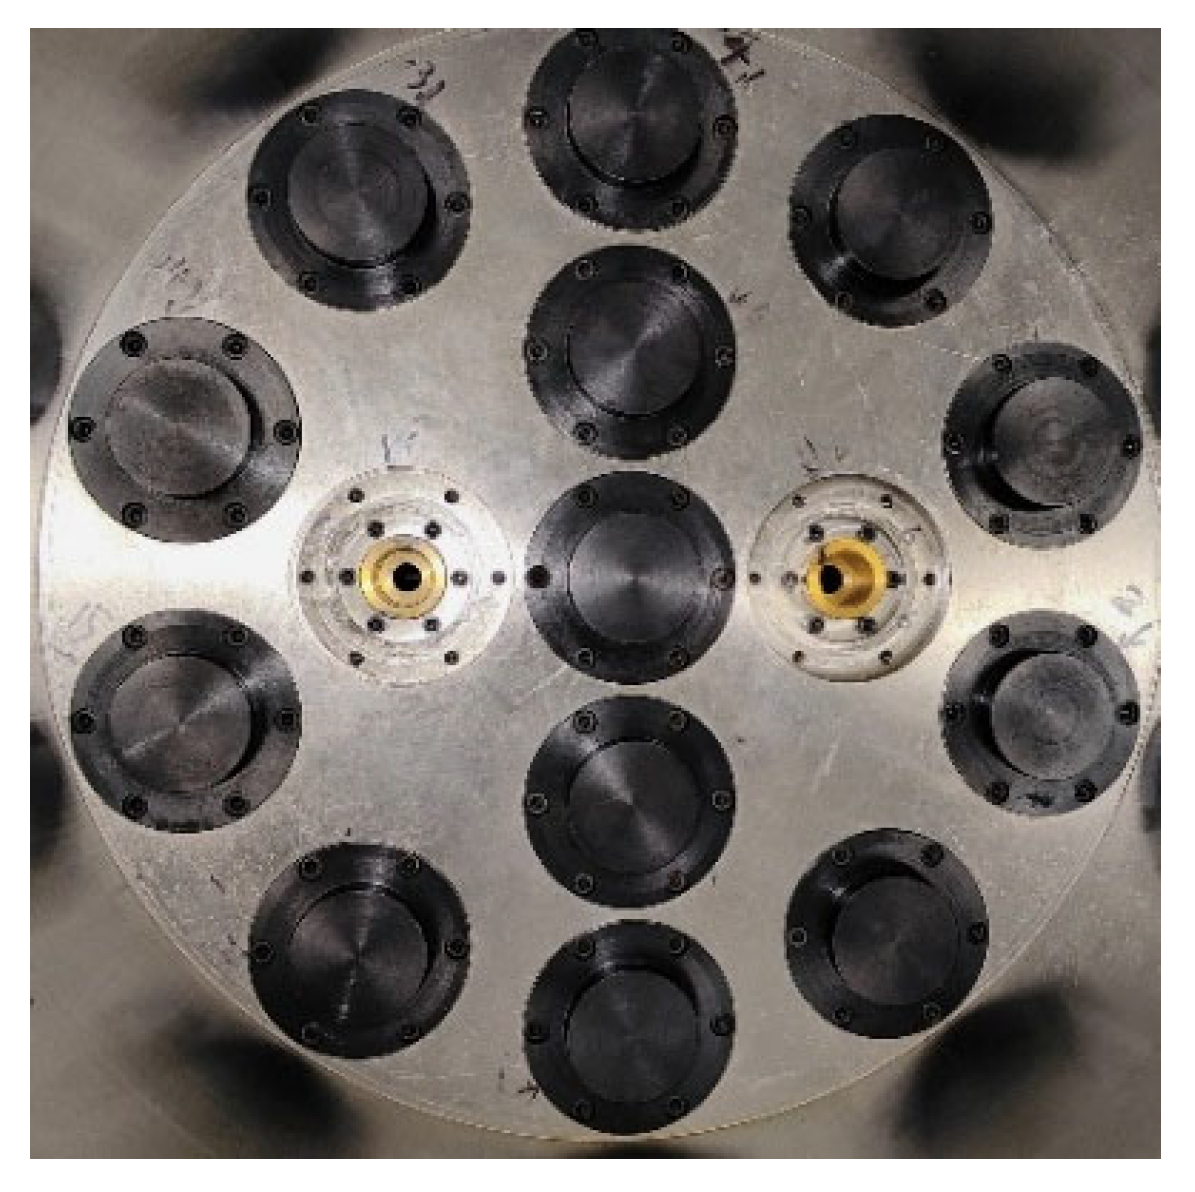
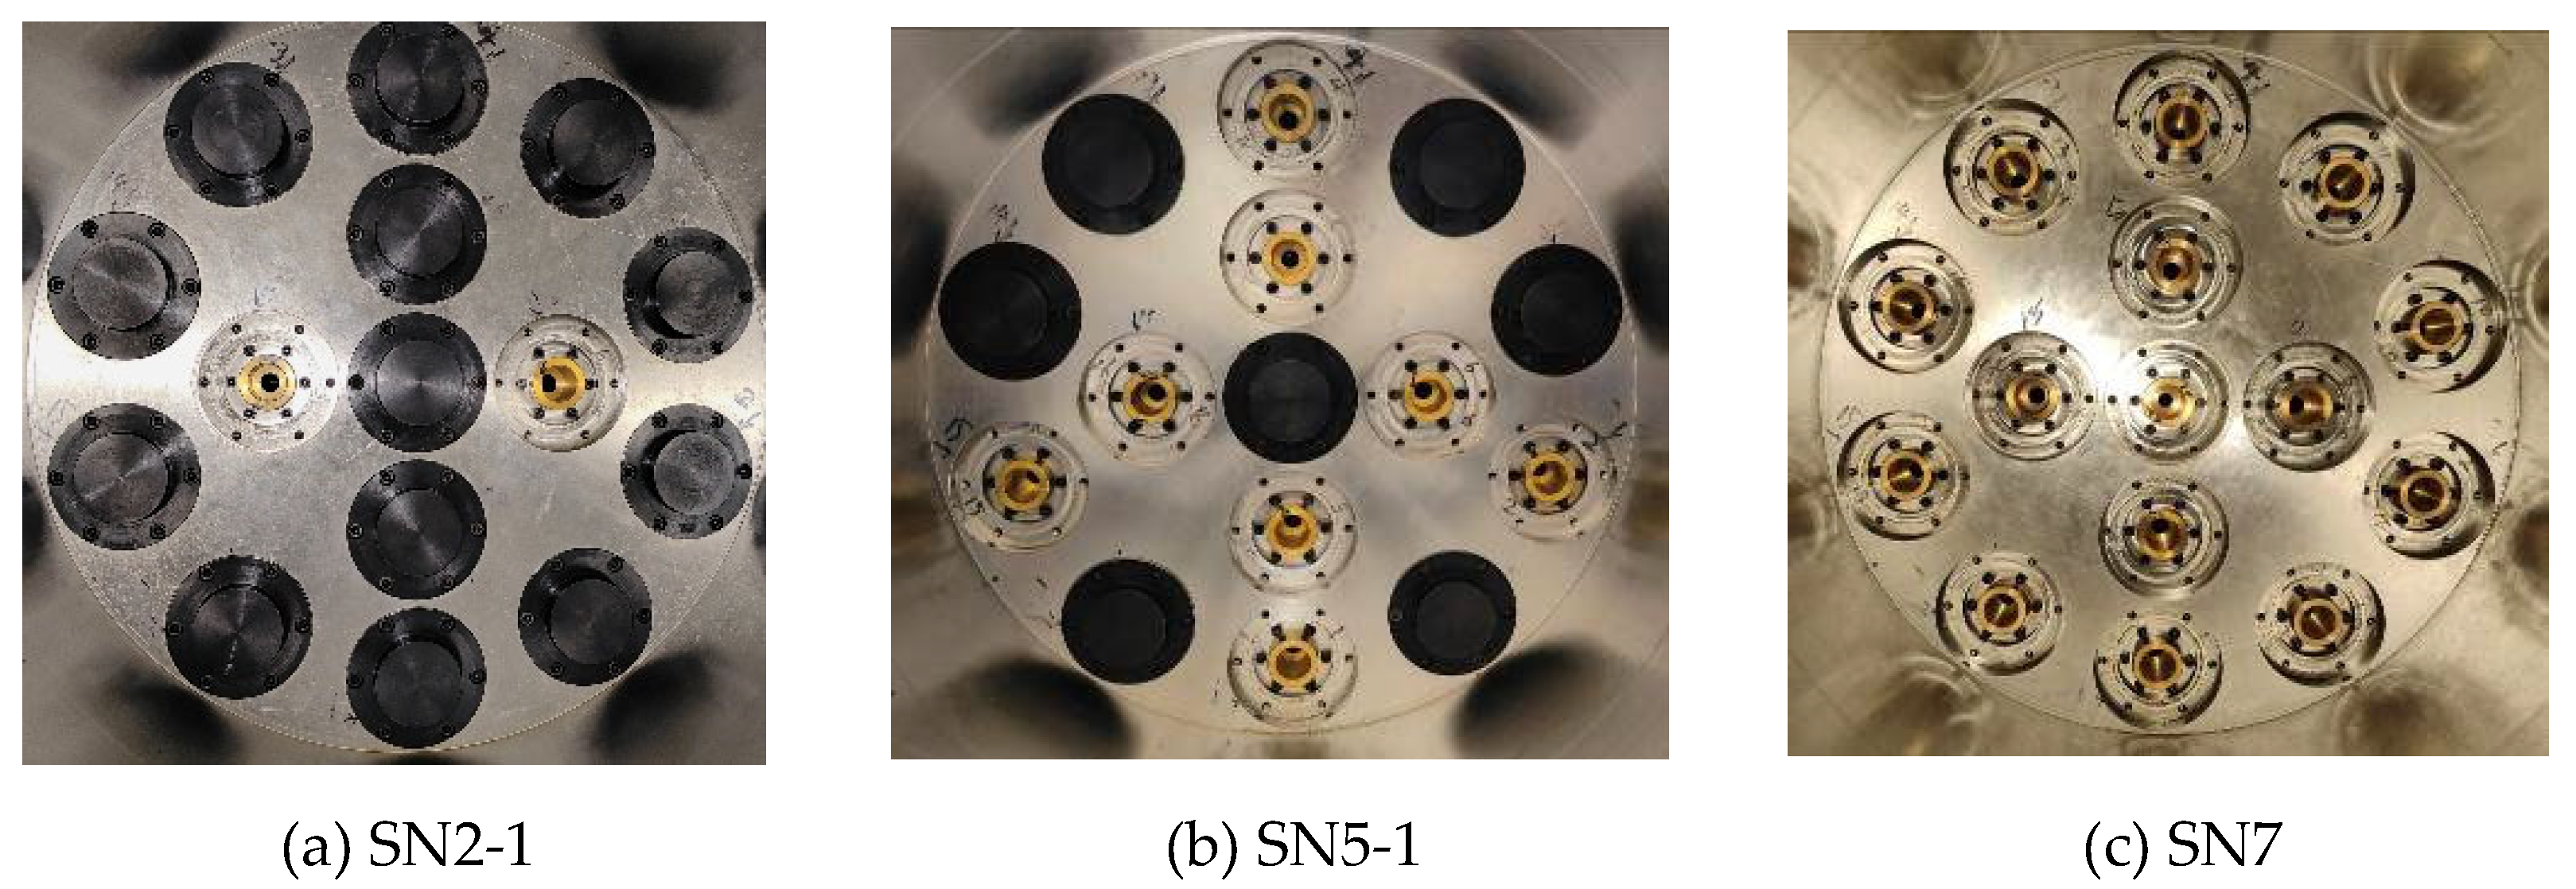
Tm,array, likely, the measured temperature value is likely not the actual stagnation temperature of the standard sonic nozzle array, which will cause a large error in the calculation of the mass flow rate and the the discharge coefficient of the calibrated sonic nozzle. In the calibration test of small flow rates, relatively few standard sonic nozzles are used, so the temperature sensor array is used to directly measure the temperature upstream of the used standard sonic nozzle, and the stagnation temperature is obtained by correction. As shown in the opening method of the standard sonic nozzle array in
Figure 12, we will insert the left and right temperature sensors in the temperature sensor array into the central axis of the used standard sonic nozzle to accurately measure the upstream temperature of the standard sonic nozzle, as shown in
Figure 13.
Tm,array could be obtained by:
where
i is the
ith temperature sensor,
i≤8, and
Ti denotes the temperature measured by the
ith temperature sensor.
We compared the discharge coefficient of the calibrated sonic nozzle obtained by the above temperature measurement method and the method of using the average temperature obtained by the temperature sensor array with the results of NIM traceability. The discharge coefficient calculated by the average temperature measurement method is 0.9902, and the discharge coefficient calculated by the above temperature measurement method is 0.9904, which is closer to the traceability result of 0.9907, so the above temperature measurement method is more accurate.
3.4. Model for Uncertainty Analysis
From the gas flow calculation Equation (1) based on the sonic nozzle array, it can be seen that the relative standard uncertainty of the flow standard facility is:
where,
ur (
Cd,i) is the relative uncertainty of the
ith standard sonic nozzle,
ur (
At,i) is the relative uncertainty of throat area of the
ith standard sonic nozzle,
ur (
C*) is the relative uncertainty of critical flow function,
ur (
parray) and
ur (
Tarray) are the respective relative uncertainty of the stagnation pressure and temperature of the sonic nozzle array,
ur (
M) is the relative uncertainty of molar mass,
ur (
Ru) is the relative uncertainty of gas constant.
Since the relative uncertainty of At,i, C*, Ru and M has been taken into account in the calculation of ur (Cd,i) , the influence of these items does not need to be considered here.
Therefore, the relative standard uncertainty of the standard facility
ur (
Qr,array) can be simplified as:
ur (
Cd,i) has been given in the traceability and does not need to be analyzed, but
ur (
parray) and
ur (
Tarray) also contain other uncertainty components, so they need to be analyzed one by one.
ur (parray) contents:
- (1)
Uncertainty of pressure sensor ur (parray,1) ;
- (2)
Uncertainty of pressure stability ur (parray,2) ;
- (3)
Uncertainty of the difference between the calibrated and traceable pressure value causes the difference in the discharge coefficient ur (parray,3) .
ur (
parray,1) is provided by the calibration certificate,
ur (
parray,2) is the standard deviation divided by the mean value of the pressure during the acquisition time, so
ur (
parray,2) is
where
is the average value of
parray during the acquisition time;
parray,
i is the pressure value measured at the
ith second, a total of 60 s.
During the measurement, the stagnation pressure upstream of the standard sonic nozzle array is kept as close as possible to the stagnation pressure at traceability, with the difference kept within 100 kPa. During data processing, the discharge coefficient of the traceability is piecewise interpolation according to the measured stagnation pressure.
ur (
parray,3) caused by the difference between the interpolated discharge coefficient and the actual discharge coefficient due to different stagnation pressures is as follows:
where
Cd,std is the standard discharge coefficient,
Cd,m is the interpolated discharge coefficient.
ur (Tarray) contents:
- (1)
Uncertainty of temperature sensor ur (Tarray,1) ;
- (2)
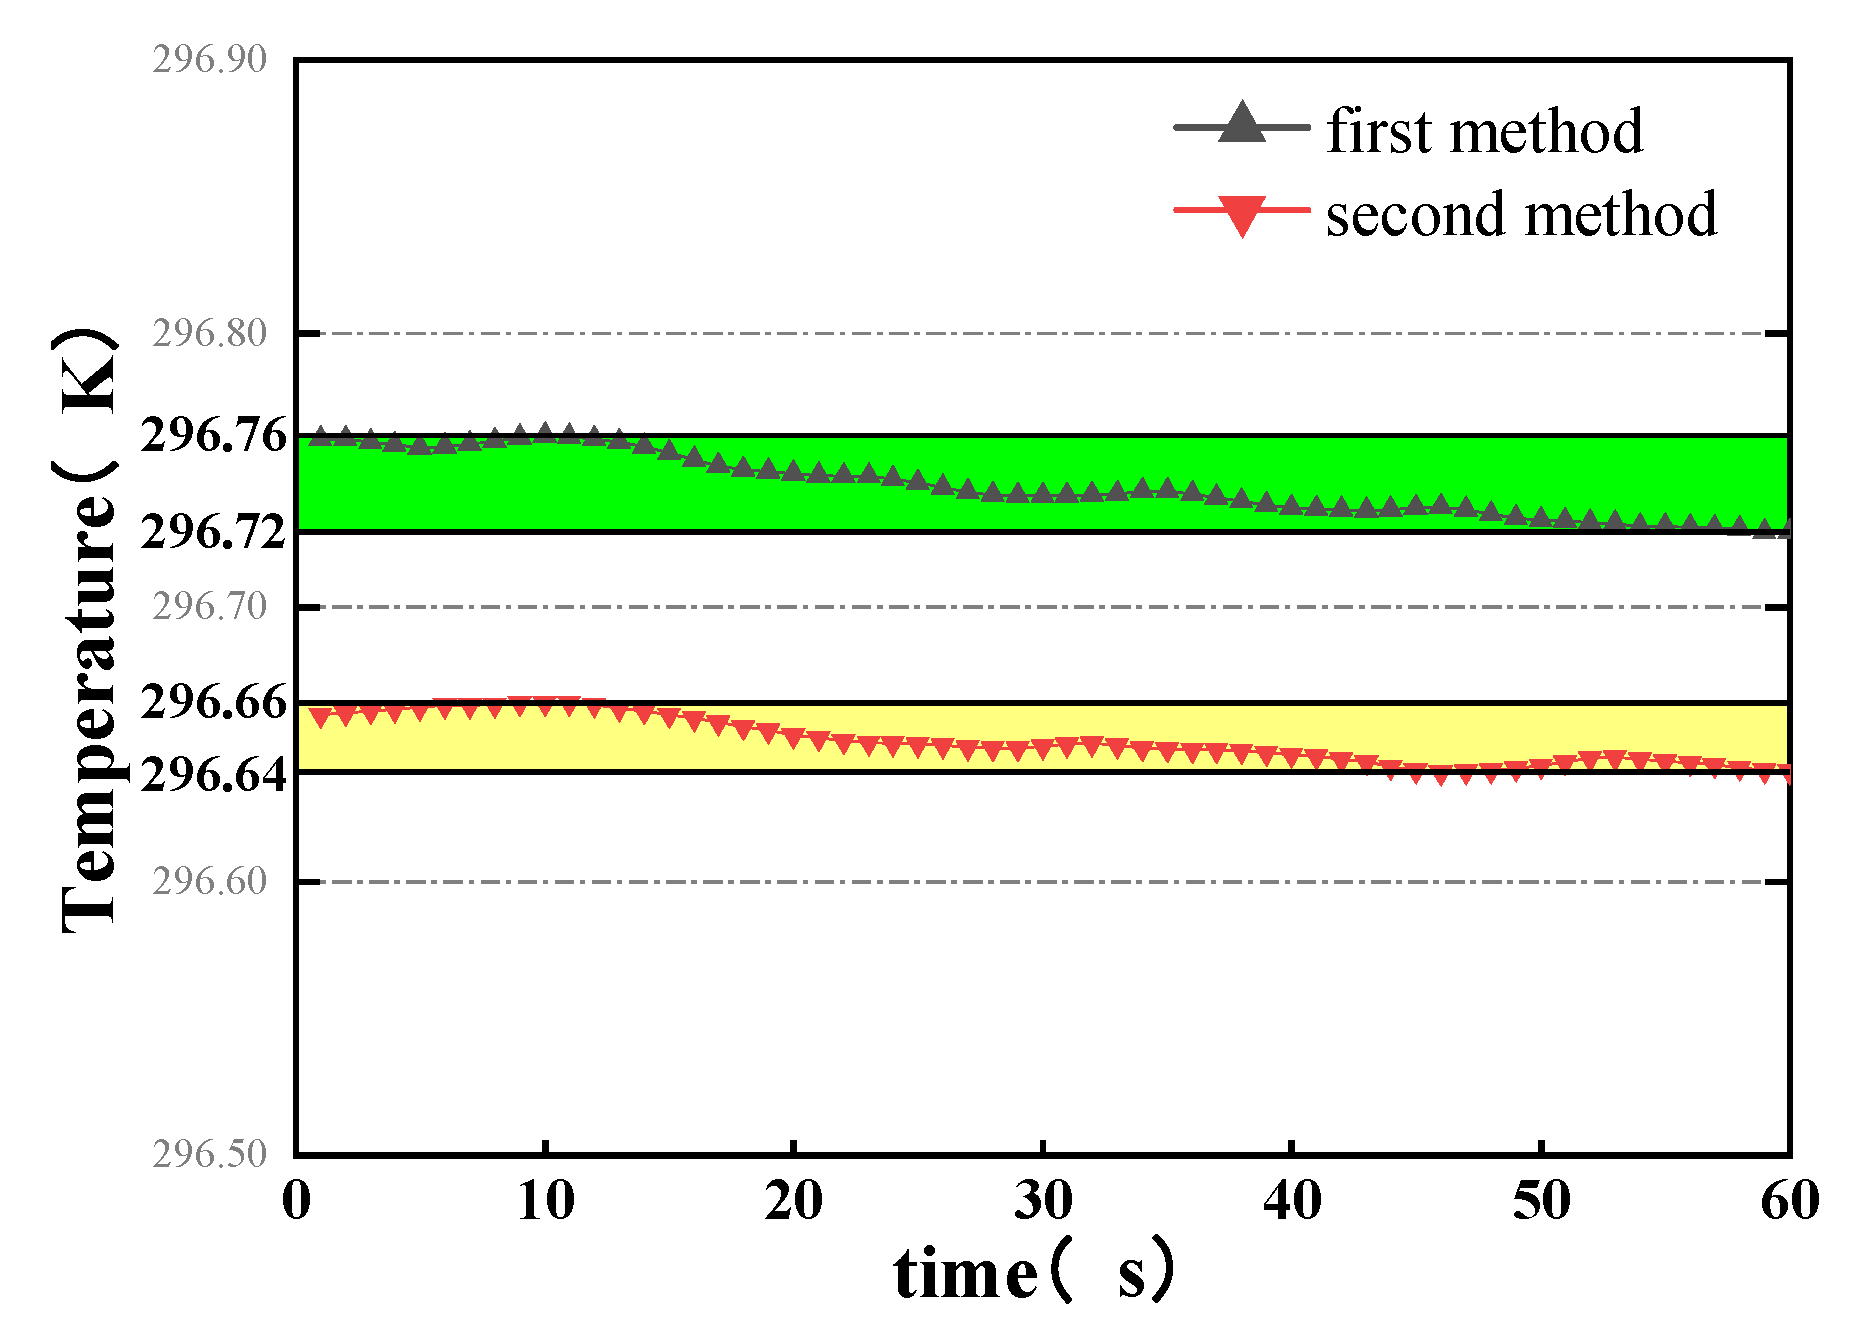
Uncertainty of temperature stability ur (Tarray,2) .
ur (
Tarray,1) is provided by the calibration certificate, different temperature measurement methods upstream of the standard sonic nozzle array will affect the value of
ur (
Tarray,2) .
ur (
Tarray,2) is
where
is the average value of
Tarray during the acquisition time,
n is the amount of data collected,
Tarray,i is the temperature data collected each time.
The discharge coefficient of the calibrated sonic nozzle is
where
and
are the critical flow functions at the stagnation pressure and stagnation temperature corresponding to the calibrated sonic nozzle and the standard sonic nozzle array, respectively, which are obtained by querying the relevant database [
17],
pSN and
TSN are the respective stagnation pressure and temperature of the calibrated nozzle.
According to Equation (12) , the relative uncertainty of the discharge coefficient of the calibrated sonic nozzle is
where
u ( ) / ( ) is the relative uncertainty of the parameter in the bracket,
uR (
Cd) is repeatability measured by the repeatability test,
is the change in gas mass in the space between the calibrated and the standard sonic nozzles,
is the uncertainty caused by the gas storage effect of the pipe.
For the high-pressure gas flow standard facility, is a very small amount relative to Qr,array, i.e., . When the environmental conditions of the nozzle use and measurement are similar, the uncertainty caused by the critical flow function and nozzle throat diameter can be ignored.
Therefore, the relative uncertainty of the discharge coefficient of the calibrated nozzle can be simplified as follows:
ur (
Cd,M) ,
ur (
p1) and
ur (
T1) have been calculated in Equation (7) , therefore, Equation (14) can be further simplified as:
In the analysis of the uncertainty components of
ur (
Cd) ,
ur (
Qr,array) has been given in Equation (7) , and since the pressure stability and temperature stability of
ur (
parray) and
ur (
Tarray) have been analyzed in
ur (
Qr,array) , the impact of their uncertainty components will not be analyzed here.
ur (
pSN) and
ur (
TSN) are only provided by the sensor. the repeatability of the discharge coefficient of the calibrated sonic nozzle
uR (
Cd) is
where
is the average value of the discharge coefficient of the calibrated sonic nozzle,
n is calibration times,
Cd,i is the discharge coefficient result obtained for each calibration.
