1. Introduction
Today, with the onset of globalization, there’s a need to use modern-day methods for cutting machinery, which has pressed the push button for productivity improvement, environment-friendly technologies, and sustainable manufacturing. Machining processes, especially those with company coolants, are central to manufacturing superior components. Machining technologies are rising in the intelligent manufacturing environment in the context of globalization and the unceasing advancement in the pursuit of productivity and environmentally friendly manufacturing. Cutting operations, especially those that involve cutting lubricants, are central to manufacturing quality parts. [
1] When compared to dry machining, conventional cutting fluid—which includes natural oils, straight oils, vegetable oils, and emulsions—reduces tool wear and surface roughness by 20–31% when utilized under machining settings.[
2] However, the extensive application of conventional cutting fluids, most of which are extracted from petroleum-based oils, has raised many health and ecological concerns.[
3] The substance contained in them is tough to let go of since it is dangerous to human health, causing skin infections and respiratory disorders, not to mention the many ailments it triggers among operators.[
3] To overcome these challenges, the manufacturing industry is employing environmentally friendly solutions.[
4] Of these, vegetable oil-based cutting fluids, especially the one based on sunflower oil, have been identified as a potential candidate due to being renewable, biodegradable, and non-toxic.[
5] Thus, sunflower oil can be an eco-friendly substitute for conventional cutting fluids, as it has a high viscosity index that provides good lubrication capabilities.[
5] However, to fully meet the demands of the modern machining process, the performance of sunflower oil-based cutting fluid can be significantly enhanced by incorporating nanoparticles.
Zinc oxide (ZnO) nanoparticles that are remarked for their enhanced thermal conductivity, anti-wear performance, and ability to enhance lubricant characteristics are effective for cutting fluids.[
6] These tiny particles shield the cutting tool from the workpiece, minimizing wear and prolonging tool life. It improves not only the cooling and lubrication possibility of the working fluid but also decreases the surface roughness and increases MRR during the machining process. Additionally, nanoparticles improve heat dissipation, reducing thermal impacts and improving cooling. Changing chip formation and evacuation procedures improves machining by smoothing operations.[
7] In a scenario where the manufacturing industry is trying to improve on the current machining processes, the incorporation of ZnO nanoparticles in sunflower oil-based cutting fluids is a new and sustainable method.[
8]
In machining operations, especially in milling, the role of cutting fluid together with other process parameters, which include cutting speed, feed rate, and tools used, among others, determine the particulars of the process.[
9] Milling involves shaping metal and other materials by cutting away unwanted sections. Mild steel is a common material often used in industries, and it’s worth noting that the efficiency and quality of milling operations depend on critical process parameters such as spindle speed feed rate and depth of cut.[
10] These parameters directly affect essential results such as surface roughness and material removal rate (MRR) and are important in determining the efficiency of the milling operation.[
11] Balancing these machining parameters is essential to realizing the right level of quality on the surface being machined and the rate at which it is performed. In light of this, Response Surface Methodology (RSM) provides a suitable strategy for examining the interconnection between several process factors and the corresponding machining performances.[
12] RSM assists in understanding such interaction and defining the desirable condition that can improve surface roughness and MRR simultaneously.[
12] While RSM enhances the optimization process by improving the accuracy and reliability of the models that exist to predict the outcome of an optimized design, machine-learning algorithms offer superior methods that can be used to augment these models even further.[
13] Following process parameters and concentration of sunflower oil-based cutting fluid containing ZnO nanoparticles, this research aims to construct a prediction model for surface roughness and MRR using algorithms like Linear Regression (LR), Random Forest (RF), and Support Vector Machine (SVM). The combined use of RSM and machine learning in the advancement of machining will create an impactful, sustainable machining system that will enhance machining practices in the manufacturing industries.
2. Literature Review
The increased environmental concerns due to the frequent use of petroleum-based lubricants in machining have, therefore, led to increasing demand for green lubricants. Currently, about 38 million metric tons of lubricants are used each year globally, most of which are petroleum-based, which poses great threats to the environment since they are non-biodegradable and contain potential health hazards.[
14] Biodegradable oils, such as those derived from vegetation, have recently been used for oil lubrication purposes since they are environmentally friendly.[
15] Most of this change is caused by the fluctuating prices of petroleum, the rising legal requirements, and personal concerns with the conservation of the environment. The HSE has presented evidence that some 79% of diseases affecting operators could be attributed to their skin interaction with MWFs, which calls for a search for safer products.[
16,
17]
Sunflower and other vegetable oils are a favorable candidate because of their lubricating nature, high viscosity grades, and ability to mix with various lubricating oil additives. They also appear to have good miscibility with other fluids and a minimal vaporization tendency, making them ideal for usage in most machining processes [
18]. Current research on nano-cutting fluids has considered using vegetable oils such as canola, sunflower, coconut, rapeseed, and soybean oil as base stocks in nano-cutting nano-cutting fluids developed by incorporating nanoparticles in vegetable oils. These nano cutters cut fluids take advantage of the improved properties of nanoparticles to get better lubrication and friction reduction, hence improving the machining processes' general efficiency [
19,
20].
Nano-cutting fluids are developed by incorporating metallic or metal oxide nanoparticles into base fluids, which include vegetable oils, zinc oxide (ZnO), titanium dioxide (TiO2), and aluminum oxide (Al2O3), among others. Such nanoparticles typically have a size of less than 100 nm and improve the performance of cutting fluids in various aspects like heat transfer, tool wear, and surface finish. For example, incorporating nano-MoS2 and nano-Al2O3 particles into sunflower oil-based cutting fluids has been reported to decrease the thrust force and torque at a reduced surface roughness and drill tip temperature by considerable measure [
8,
21]. Likewise, Cortes et al. also showed that blending SiO2 and TiO2 nanoparticles with sunflower oil decreased the coefficient of friction to as low as 93. 7%, thus underscoring the transformative nature of nano-cutting fluids in aerobic machining elements [
22].
Mild steel, with relatively higher ductility, machinability, and weldability than all ferrous materials, is used extensively in manufacturing industries. They love using it due to its flexibility and versatility in different applications, especially in machining processes such as milling [
23]. The milling process, in which material is removed from a workpiece with rotary cutting tools, strongly depends on parameters such as spindle speed, feed rate, and depth of cut. These parameters are critical in defining performance-related factors such as surface finish and Material Removal Rate (MRR), which are used in determining the quality of the milling operation [
24]. Hence, optimizing these machining parameters is crucial to obtain specific results, including surface finish and machining efficiency. Response Surface Methodology (RSM) is one of the most frequently used statistical techniques to define and assess causal relationships between several process factors and the results of machining operations. RSM has found its applications in studies on improving machining processes such as surface grinding, high-speed milling, and turning, focusing on reducing surface roughness and maximizing MRR [
25]. For instance, Patil et al. applied RSM to determine the best parameters of machining in surface grinding on EN24 steel, which allowed enhanced surface roughness and MRR [
26]. Phokobye et al. also used RSM and found that high-speed milling of Ti-6Al-4V could be optimized by appropriately selecting the machining parameters, including cutting speed, feed rate, and depth of cut [
27].
Suna et al. highlight that in recent years, more and more researchers have integrated machine-learning algorithms with RSM to improve prediction accuracy and machining performance [
28]. This integration has transformed the modeling and optimization process for the machining parameters to give a more visionary insight into the parameters' behaviors and consider the existence of interrelation between the parameters. Traditional machine learning techniques like Linear Regression (LR), Random Forest (RF), Support Vector Machine (SVM), etc., have been extensively used to predict essential outcomes like surface roughness and Material Removal Rate (MRR) with reasonable accuracy from input parameters [
29]. These models provide higher levels of prediction as a concern to the operation aspect and contribute to the creation of improved machining strategies for a wide range of manufacturing requirements. Furthermore, the consequence of process parameters is that these models give the ability to anticipate, modify, and control for errors added to product quality. It is therefore clear that this integration of RSM and machine learning provides a solid and all-encompassing methodology to optimize the machining performance, exhaust material utilization, utilize less energy in machining, and boost the total sustainability in current manufacturing practices [
28].
The present study envisions establishing a prediction model that would assess the roughness of the surface along with the Metal Removal Rate, MRR, in mild steel milling aided by nano-cutting fluids and Machine Learning Models of superior precision. Thus, the research aims to improve machining performance through the right milling parameters and compositions of sunflower oil-based nano-cutting fluid containing ZnO nanoparticles.
3. Materials, Methods, and Experiment
In this work, square bars of mild steel were used, and nano-cutting fluid was prepared using chemical ingredients such as sunflower oil, zinc oxide nanoparticles, and sodium laureth sulphate(surfactant). A Vertical Milling machine (Taiwan) was used for the machining processing. The scanning electron microscope (SEM) is a Carl Zeiss Ultra Plus type, while the surface roughness tester is used for measuring surface roughness. This study uses Response Surface Methodology (RSM) and Regression Analysis (RA) to address the problems. To measure the extent to which an input variable affects the output variable, RSM is used. On the contrary, RA uses a mathematical model to find the minimum cutting parameters that provide the desired surface roughness[
30].
3.1. Materials
3.1.1. Preparation Bio nano Cutting Fluid
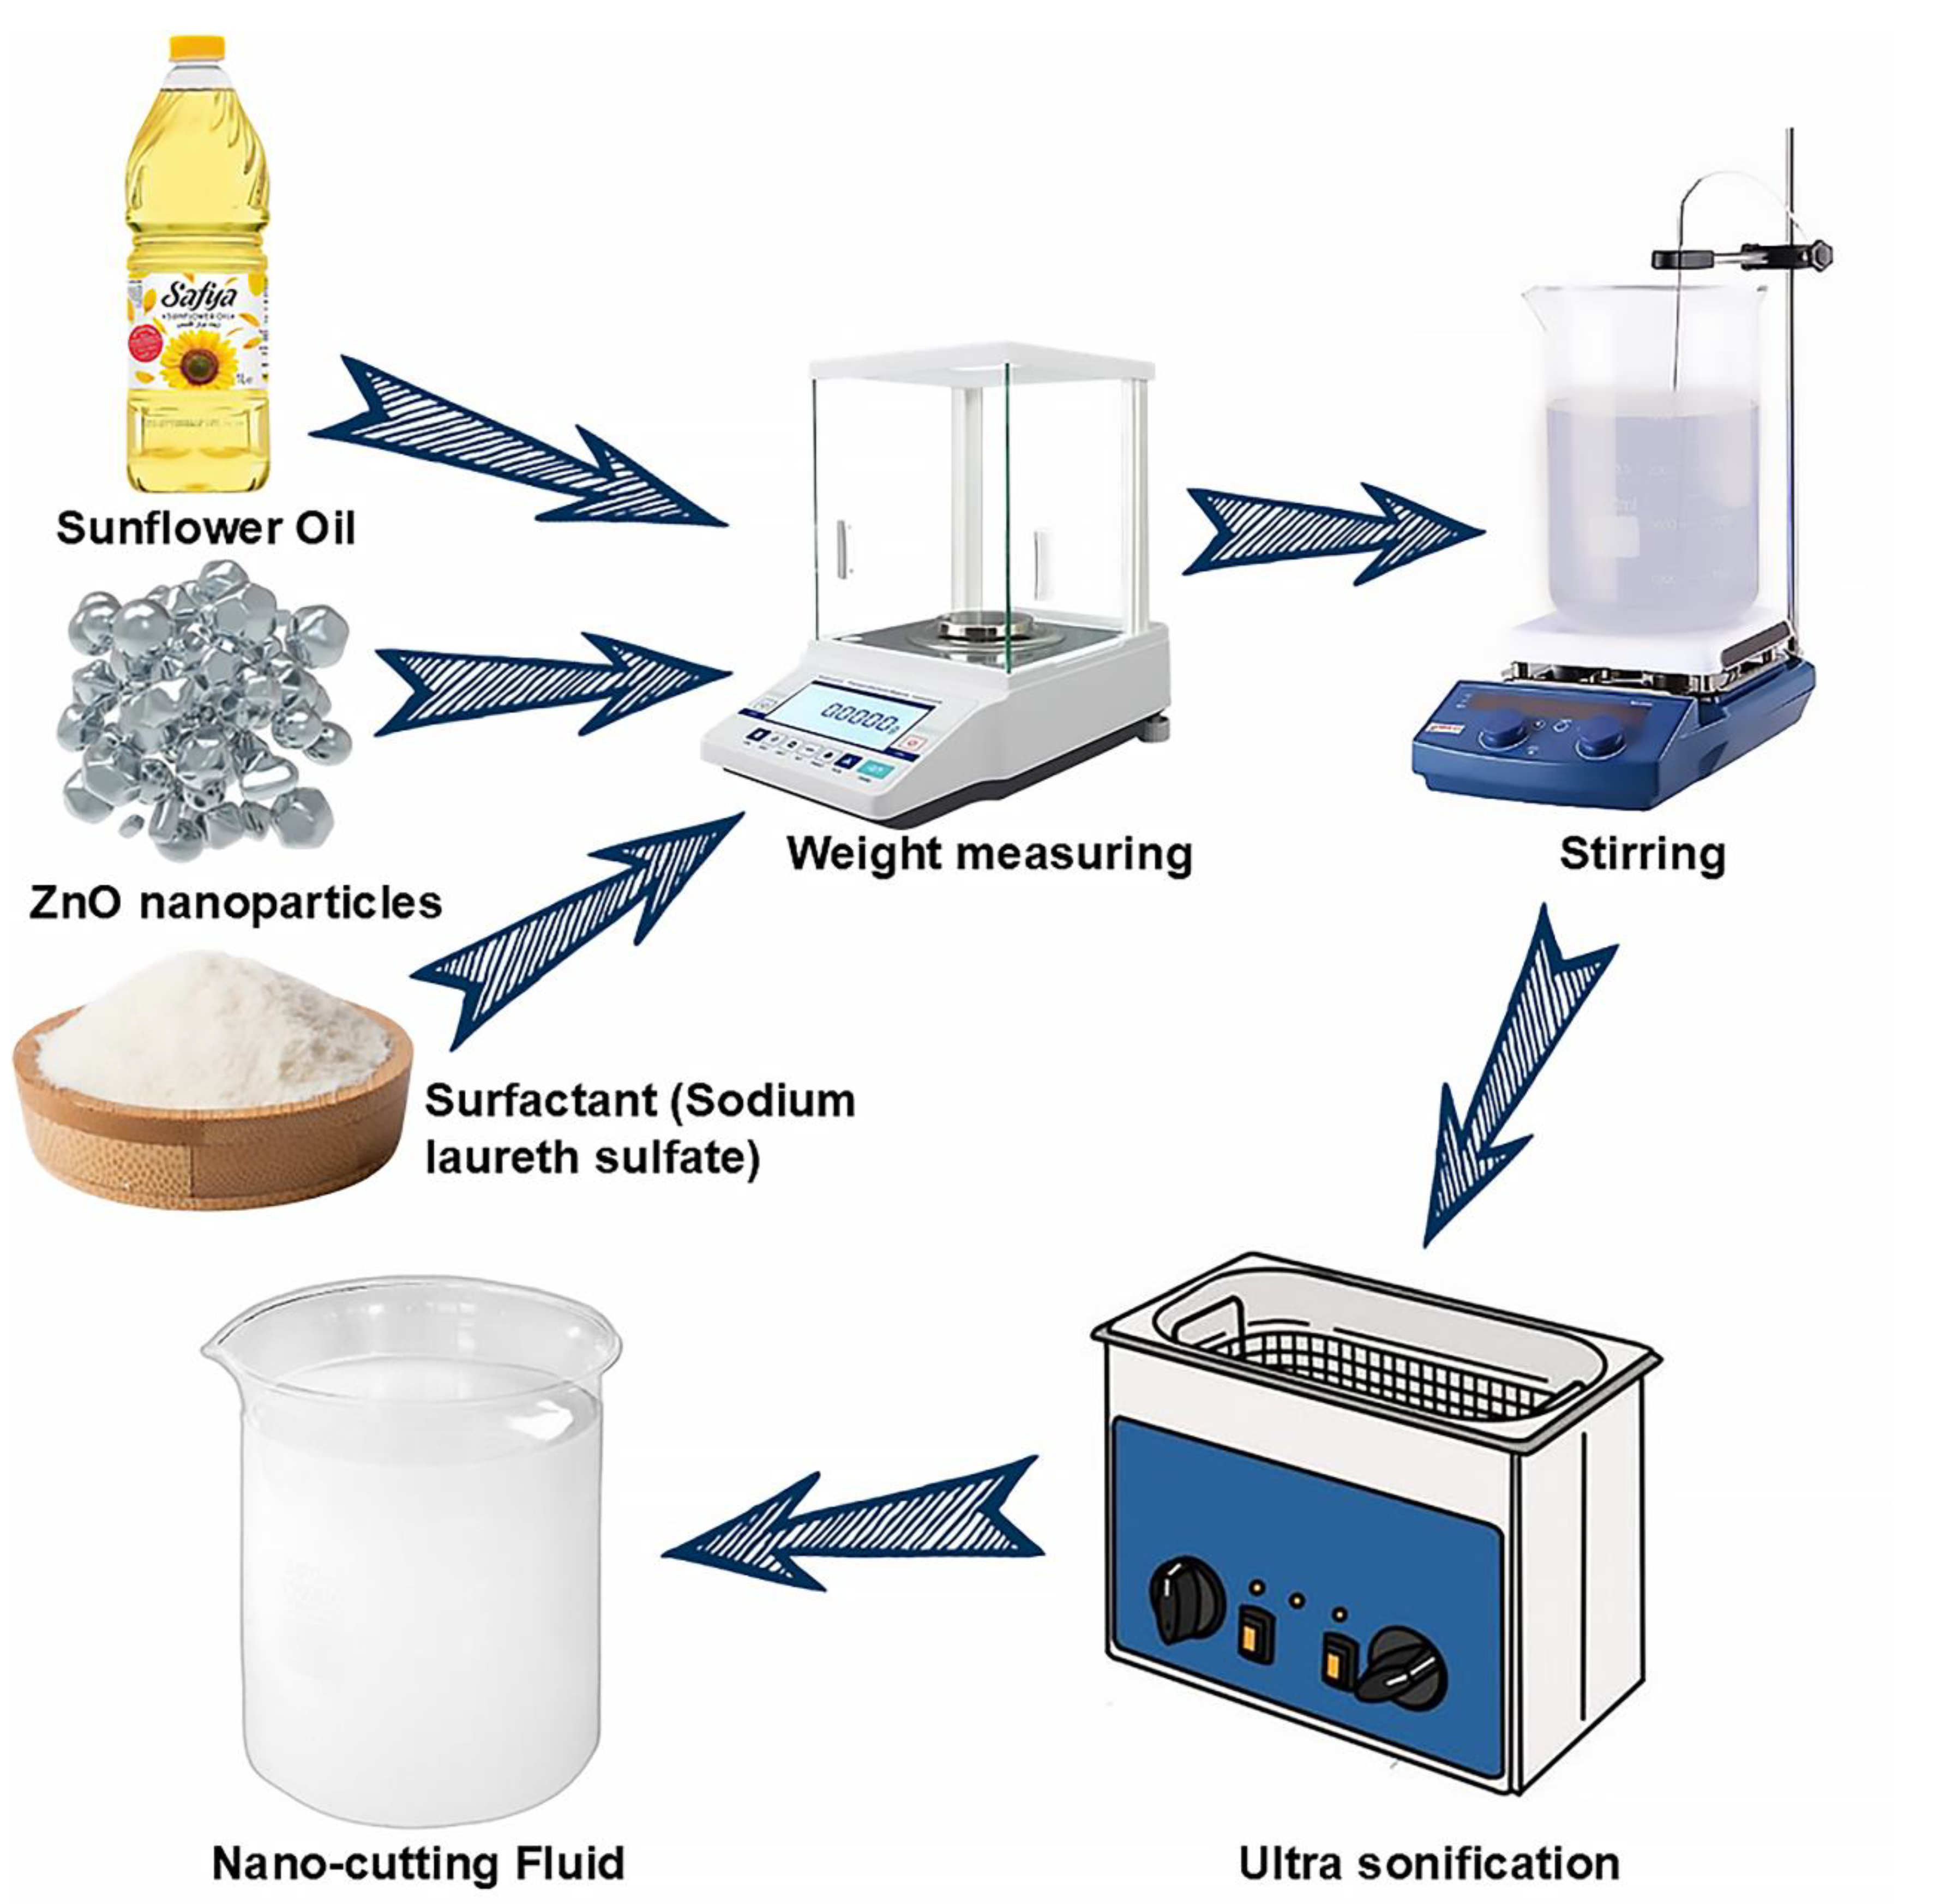
The nanofluid is synthesized by a two-step process. The synthesis process is demonstrated in [
Figure 1], in the process the sunflower oil, nanoparticles, and surfactant are combined. The base oil properties are exhibited in
Table 1 and characteristics of ZnO nanoparticles are exhibited in
Table 2. The combination undergoes ultra-sonication for about 60 minutes to achieve homogeneous dispersion of nanoparticles in the sunflower oil. The container was submerged in cold water to maintain a temperature below 55 ◦C. Two distinct combinations of nanofluid have been developed to examine the unique effects of ZnO nanoparticles.
The nanoparticle concentration was progressively modified to 1 and 1.5 weight percent and the mixing ratio of cutting fluid to water was 1,20[
31]. The concentration was calculated using Equation (1). Surfactants are used to emulsify cutting oil in water at a concentration of 5% (by weight) of the cutting oil.
3.1.2. Characterization of ZnO Nanoparticles
In this investigation, the ZnO nanoparticles were acquired from NAME Lab, Jashore University of Science and Technology (JUST). A Carl Zeiss Ultra Plus field emission scanning electron microscope (FESEM) was used to examine the nanoparticles' morphology. The provided SEM pictures demonstrate ZnO nanoparticles at magnifications of 70,000x [
Figure 2a] and 50,000x [
Figure 2b]. The nanoparticles have an irregular and aggregated morphology. The particles seem coarse and coarsely arranged, forming a porous structure. This is characteristic of ZnO nanoparticles produced using techniques such as sol-gel, where particle agglomeration often occurs owing to high surface energy.The [
Figure 2a] (70.00K magnification) micrograph has annotated dimensions between 23.0 nm and 26.2 nm, aligning with nanoscale ZnO. The nanoparticles are relatively small and uniform in size, which can enhance the material's surface area-to-volume ratio. The particles in SEM micrographs have a granular texture with clear boundaries, indicating a crystalline structure. The texture and structure indicate that the particles are polycrystalline.
The EDS (Energy Dispersive X-ray Spectroscopy) spectrum [
Figure 2c] illustrates the chemical composition of the ZnO nanoparticles. The spectrum exhibits two prominent peaks associated with zinc (Zn) and oxygen (O).
Prominent peaks appear at 1 keV and 8.5 keV, which correspond to the Lα and Kα emissions of zinc, respectively. The peaks confirm the presence of zinc in the nanoparticle sample, which is the primary ingredient in ZnO nanoparticles. The significant strength of the zinc peaks indicates that zinc constitutes 84.34% of the composition. Furthermore, the small peaks about 0.5 keV are attributed to oxygen, suggesting its existence inside the ZnO structure. The amount of oxygen is determined to be 15.66%, consistent with the anticipated stoichiometric ratio of Zn and O in ZnO.
3.1.3. Characterization of Nanofluid
The stability of nanofluids is crucial since it directly influences thermal conductivity and viscosity, both vital for effective heat transfer applications[
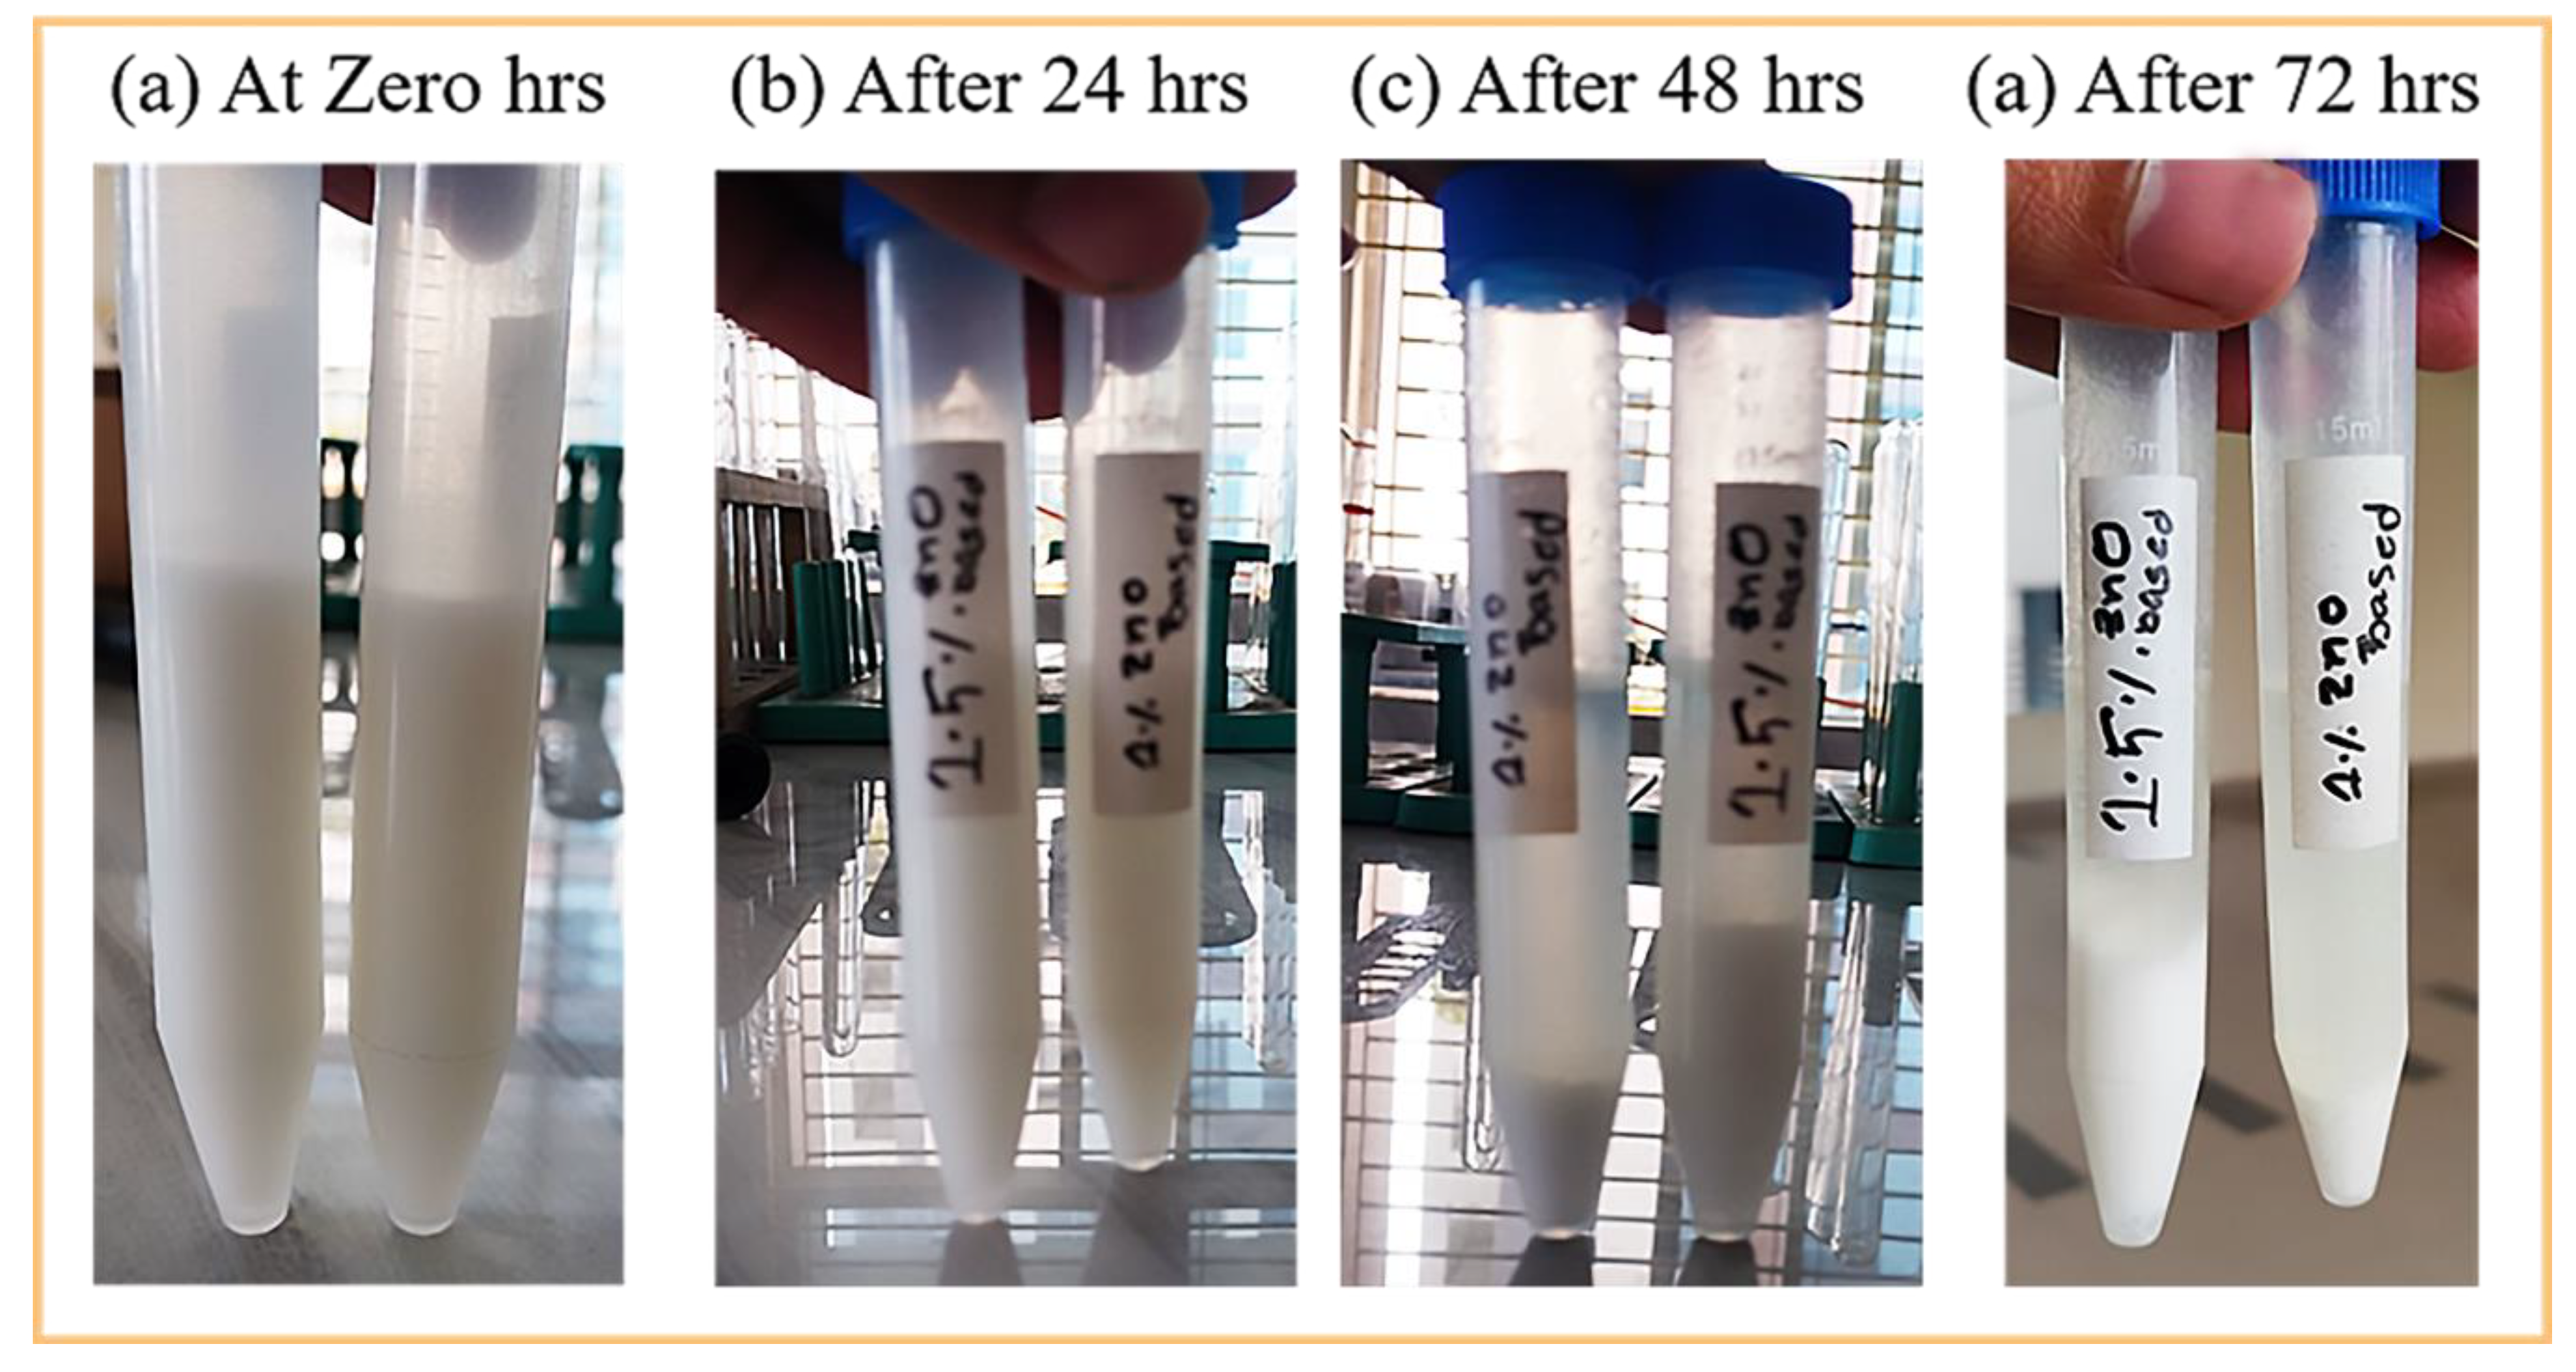
34]. Nanoparticles in a fluid tend to aggregate over time due to attraction forces, leading to sedimentation. This aggregation enhances thermal resistance, impeding heat transmission, and may also diminish viscosity, influencing the fluid's flow characteristics. The produced nanofluids were monitored for sedimentation, and their stability was assessed over 72 hours, [
Figure 3] demonstrating the process. A uniformly distributed nanofluid with little sedimentation ensures excellent performance by maintaining stable thermal conductivity and viscosity.
3.1.4. Mild Steel
Mild steel, or low carbon steel, has 0.25% to 0.29% carbon, making it softer, more malleable, and more ductile than higher carbon steels. It has low tensile strength but exhibits good workability, facilitating easy welding, machining, and shaping into diverse forms. Mild steel is extensively used in construction, automotive, and industrial sectors due to its superior weldability and high impact resistance. Its magnetic characteristics make it advantageous for electrical applications. In construction, mild steel's balance of strength and flexibility makes it ideal for structural components like beams, columns, and reinforcement bars[
35].
Table 3 illustrates the chemical characteristics of mild steel.
3.2. Methods
3.2.1. Response Surface Methodology (RSM)
Design of experiments (DoE) is a systematic method used to study the influence of multiple input factors on output responses, commonly applied in optimizing machining parameters[
37]. It reduces the number of trials, effort, and time required to identify optimal input variables. Response Surface Methodology (RSM) is a popular approach within DoE, known for its ability to model and optimize processes with multiple interacting factors[
38]. By using polynomial equations to approximate response surfaces, RSM efficiently identifies relationships between factors and responses, helping to find optimal conditions with minimal resources. This makes RSM essential in fields like manufacturing and engineering.
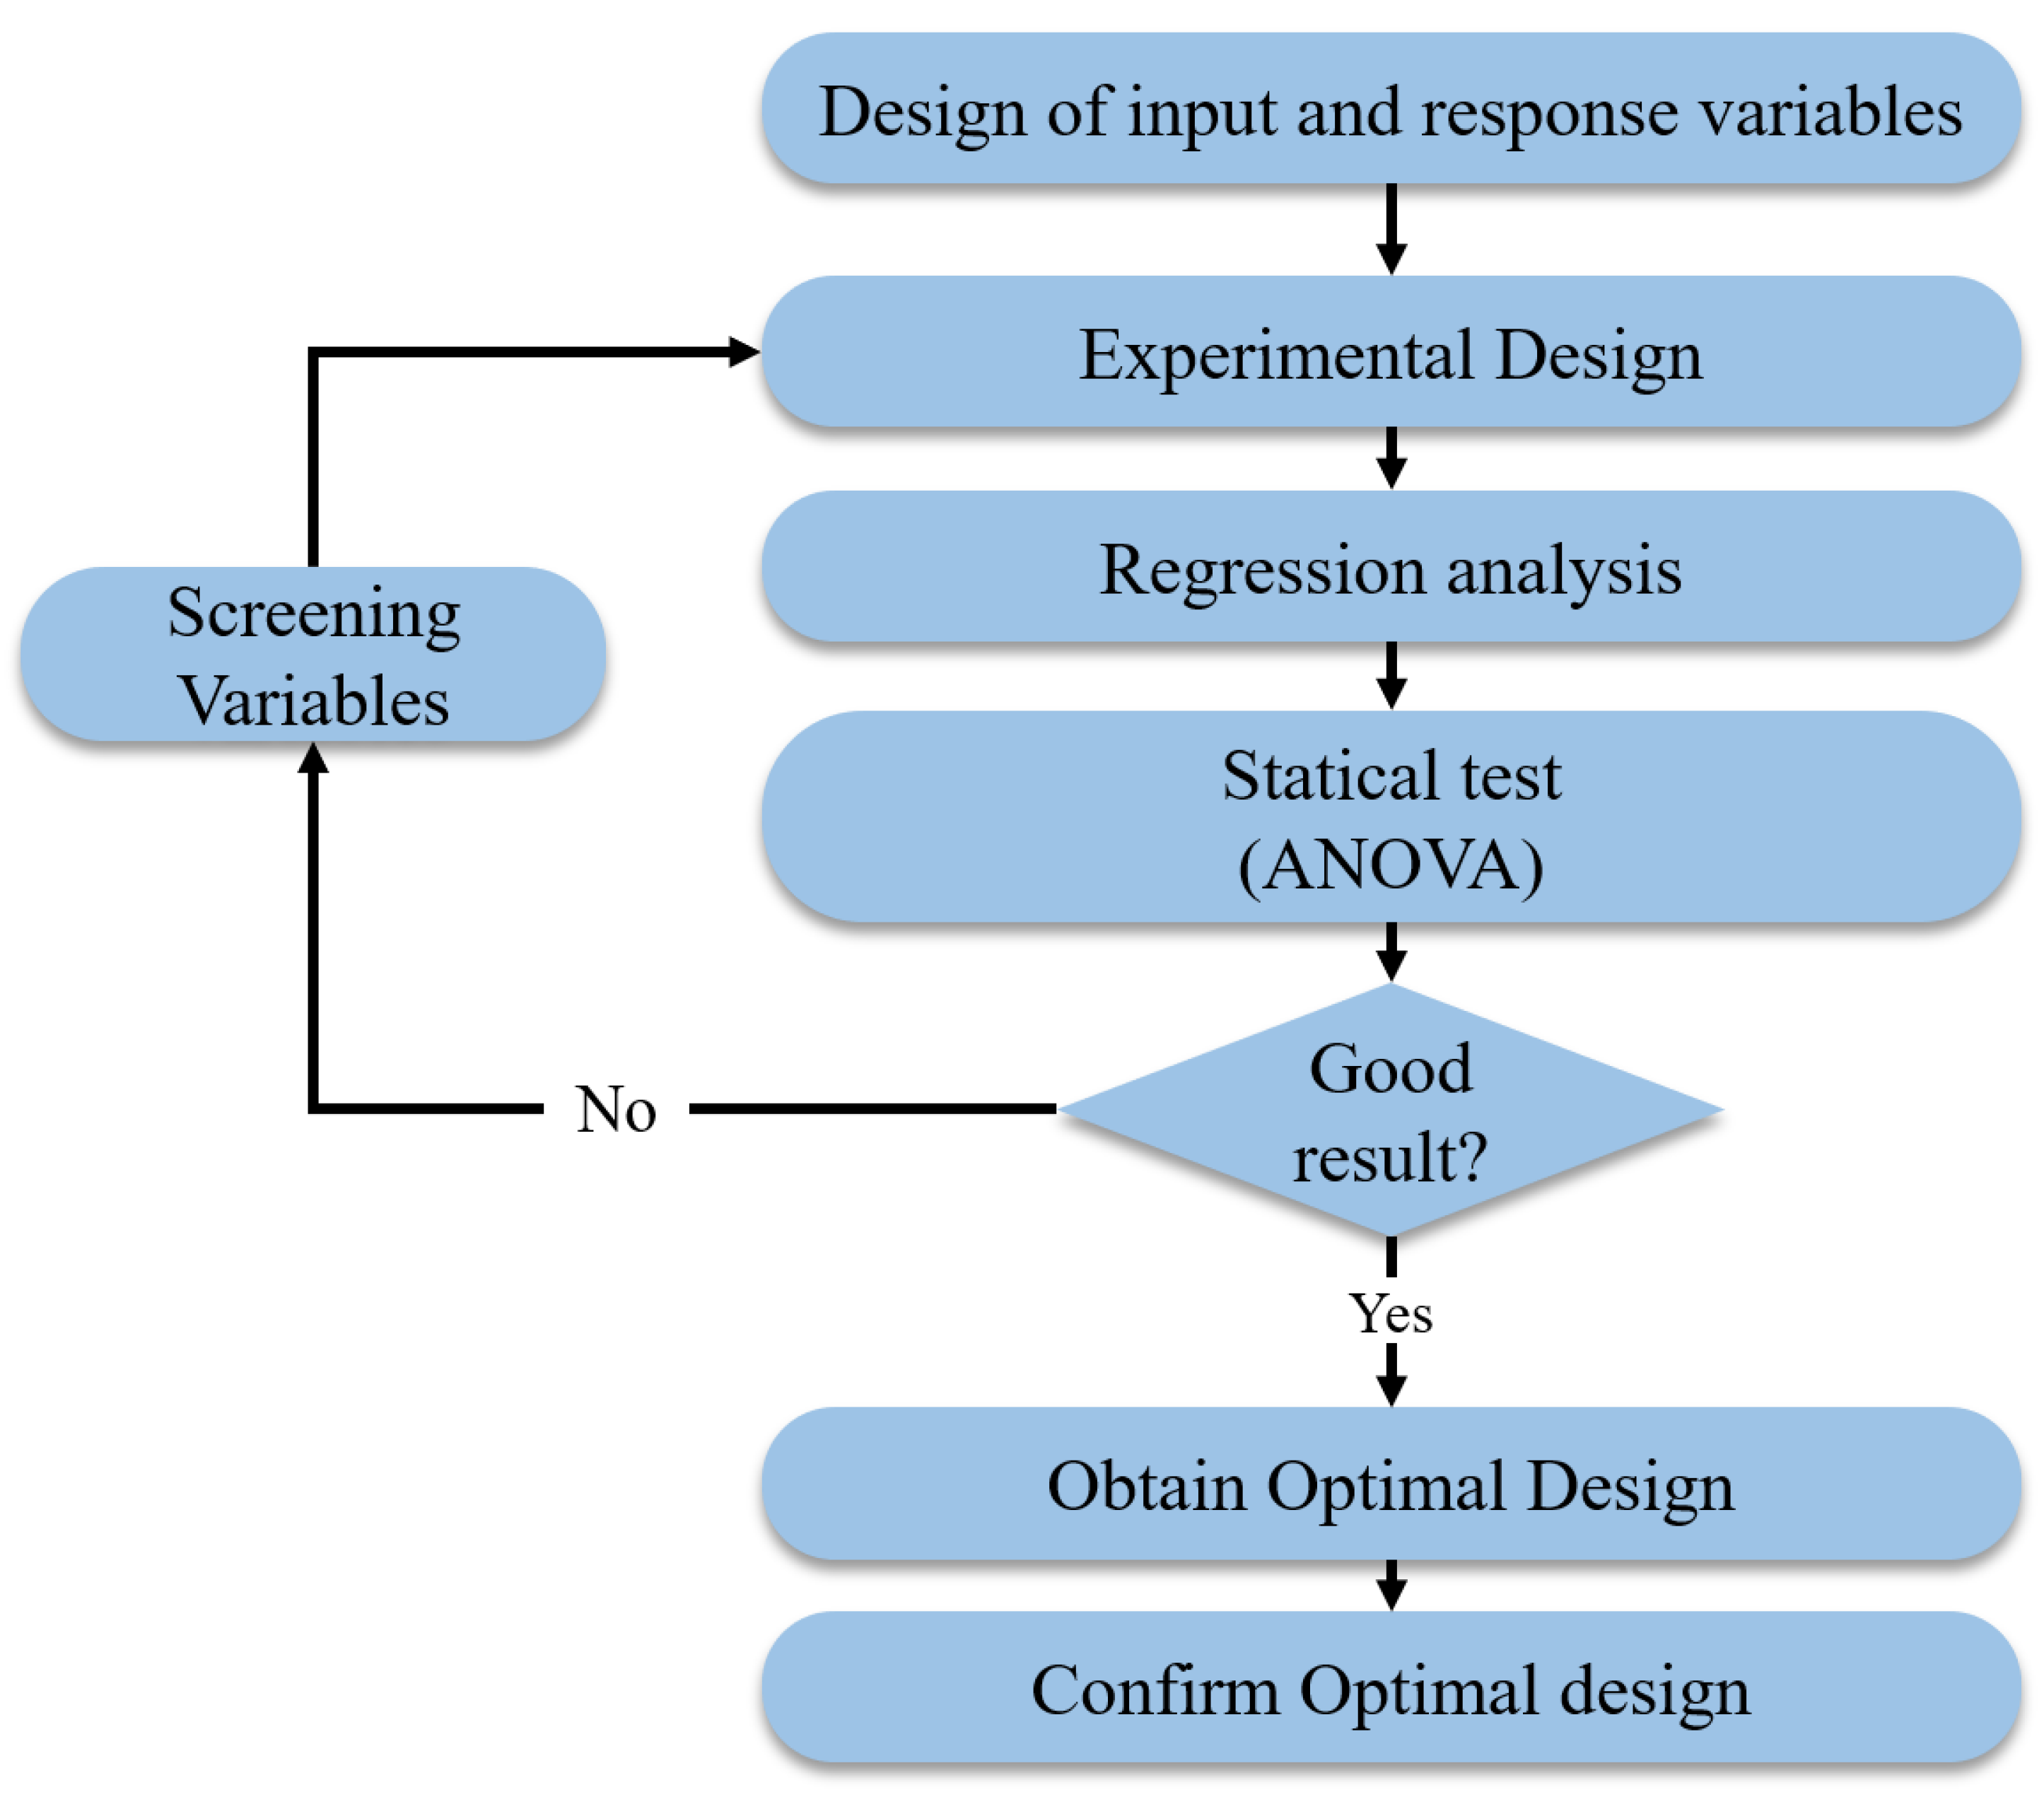
Figure 3 exhibits the RSM methodology.
3.2.2. Regression Analysis
Regression analysis comprises statistical techniques used to estimate the relationships between a dependent variable and one or more independent variables. It could potentially used to evaluate the strength of the correlation between variables and to predict their future interaction. Regression analysis encompasses various types, including linear, multiple linear, and nonlinear. The predominant models are simple linear and multiple linear regression. Nonlinear regression analysis is often used for complex data sets where the dependent and independent variables exhibit a nonlinear connection.
Figure 4 represents the flow diagram of the RSM method.
The steps involved in Regression analysis are-
1) Creation of the model with necessary parameters.
2) Compilation of information.
3) Computation of the coefficients of the correlation form.
4) Analysis the value.
5) Fitness evaluation.
6) Updating validation of the result.
7) Overview to the entire presumption
3.3. Experiments
3.3.1. Design of Experiment
The overall performance of the end milling process is primarily influenced by critical machining parameters, such as spindle speed (rpm), depth of cut (mm), and feed rate (mm/min). These parameters are recognized as the most significant factors affecting the process. The initial settings for the experiments were determined using response surface methodology (RSM).
Table 4 provides a detailed overview of the experimental design and the various combinations of input parameters tested.
3.3.2. Machining Process
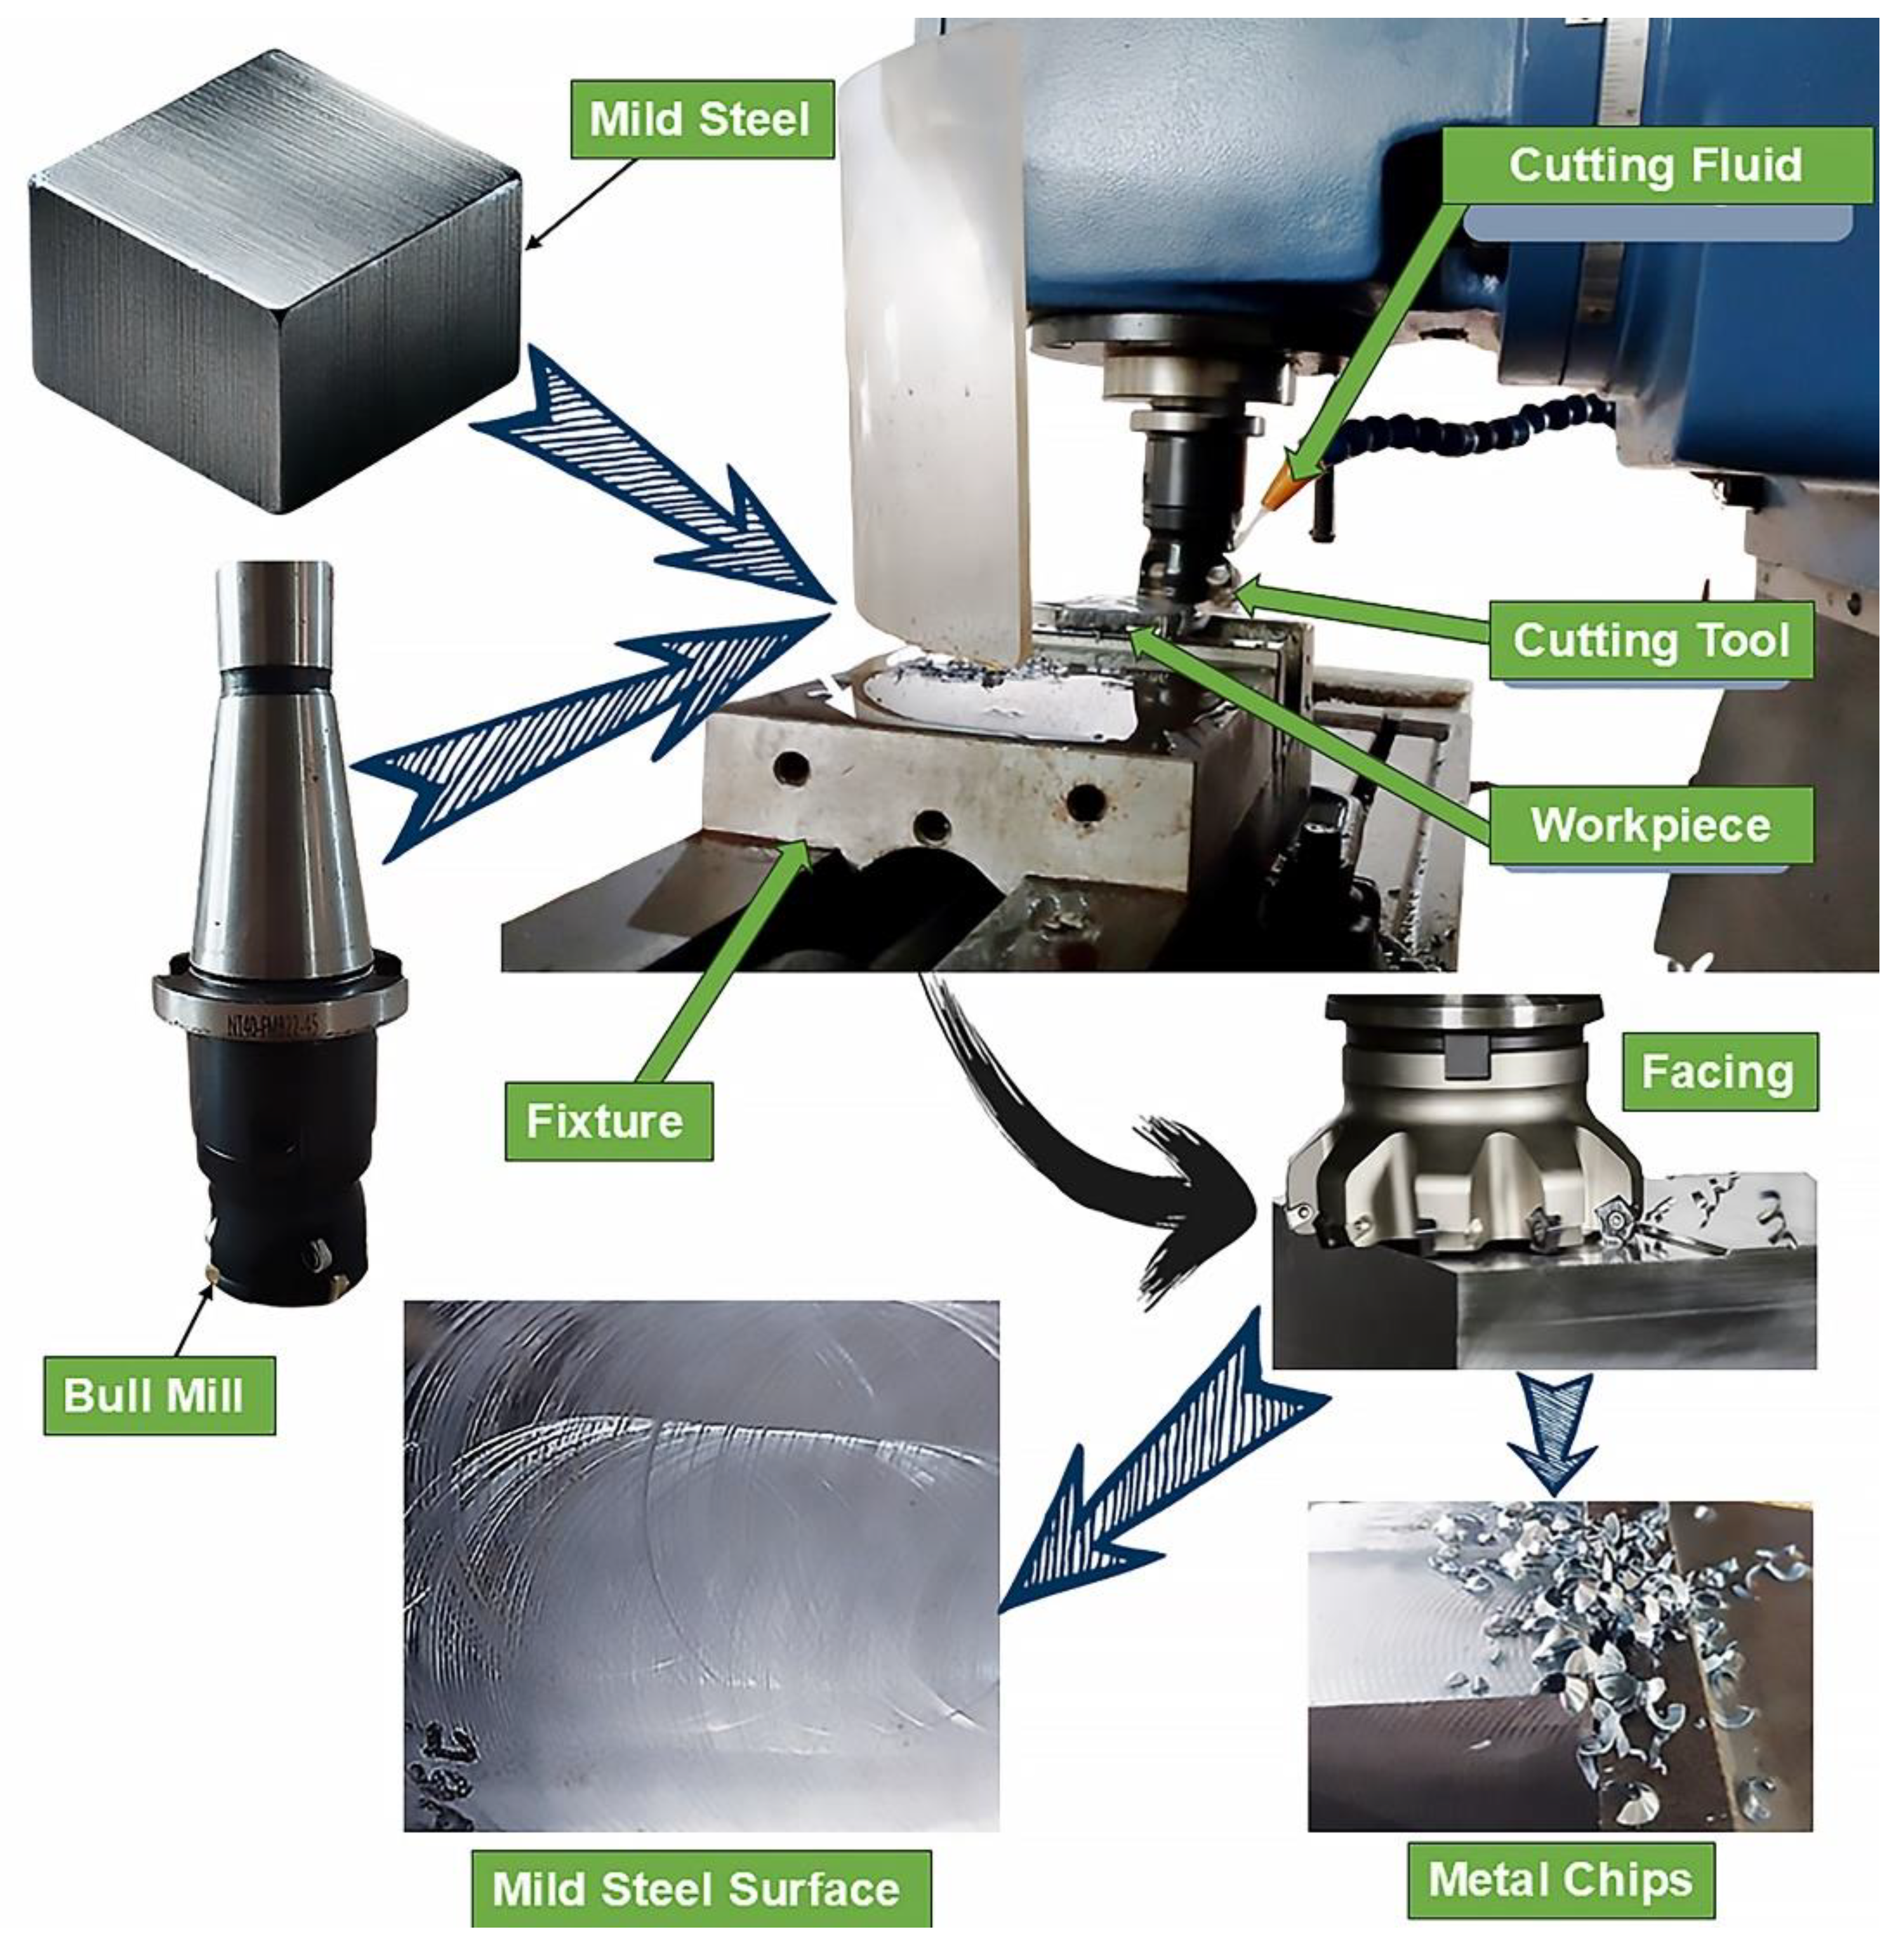
The machining processes were conducted using a Vertical Milling machine available at the university's Engineering WorkshoP. Initially, a facing operation was performed to finish one layer of the material, utilizing a Bull Mill (NT40-FMB 22.45 Bull Mill) as the cutting tool, as shown in
Figure 5. The tool's diameter was independent of the radius. During the facing operation, key parameters such as cutting speed, feed rate, and depth of cut were carefully monitored. Additionally, spindle load was checked to prevent damage to the workpiece from excessive load. The parameter values were manually adjusted for each workpiece, and data was collected for varying conditions during the facing operation, as depicted in
Figure 5. The operation was conducted on a total of 54 workpieces under two types of cutting fluid conditions. Since the Vertical Milling machine was not computerized, all parameter settings were applied manually.
3.3.3. Response Surface Measurement and Measured Material Removal Rate
The selection of an appropriate experimental design is essential to ensure the reliability of the response surface development.
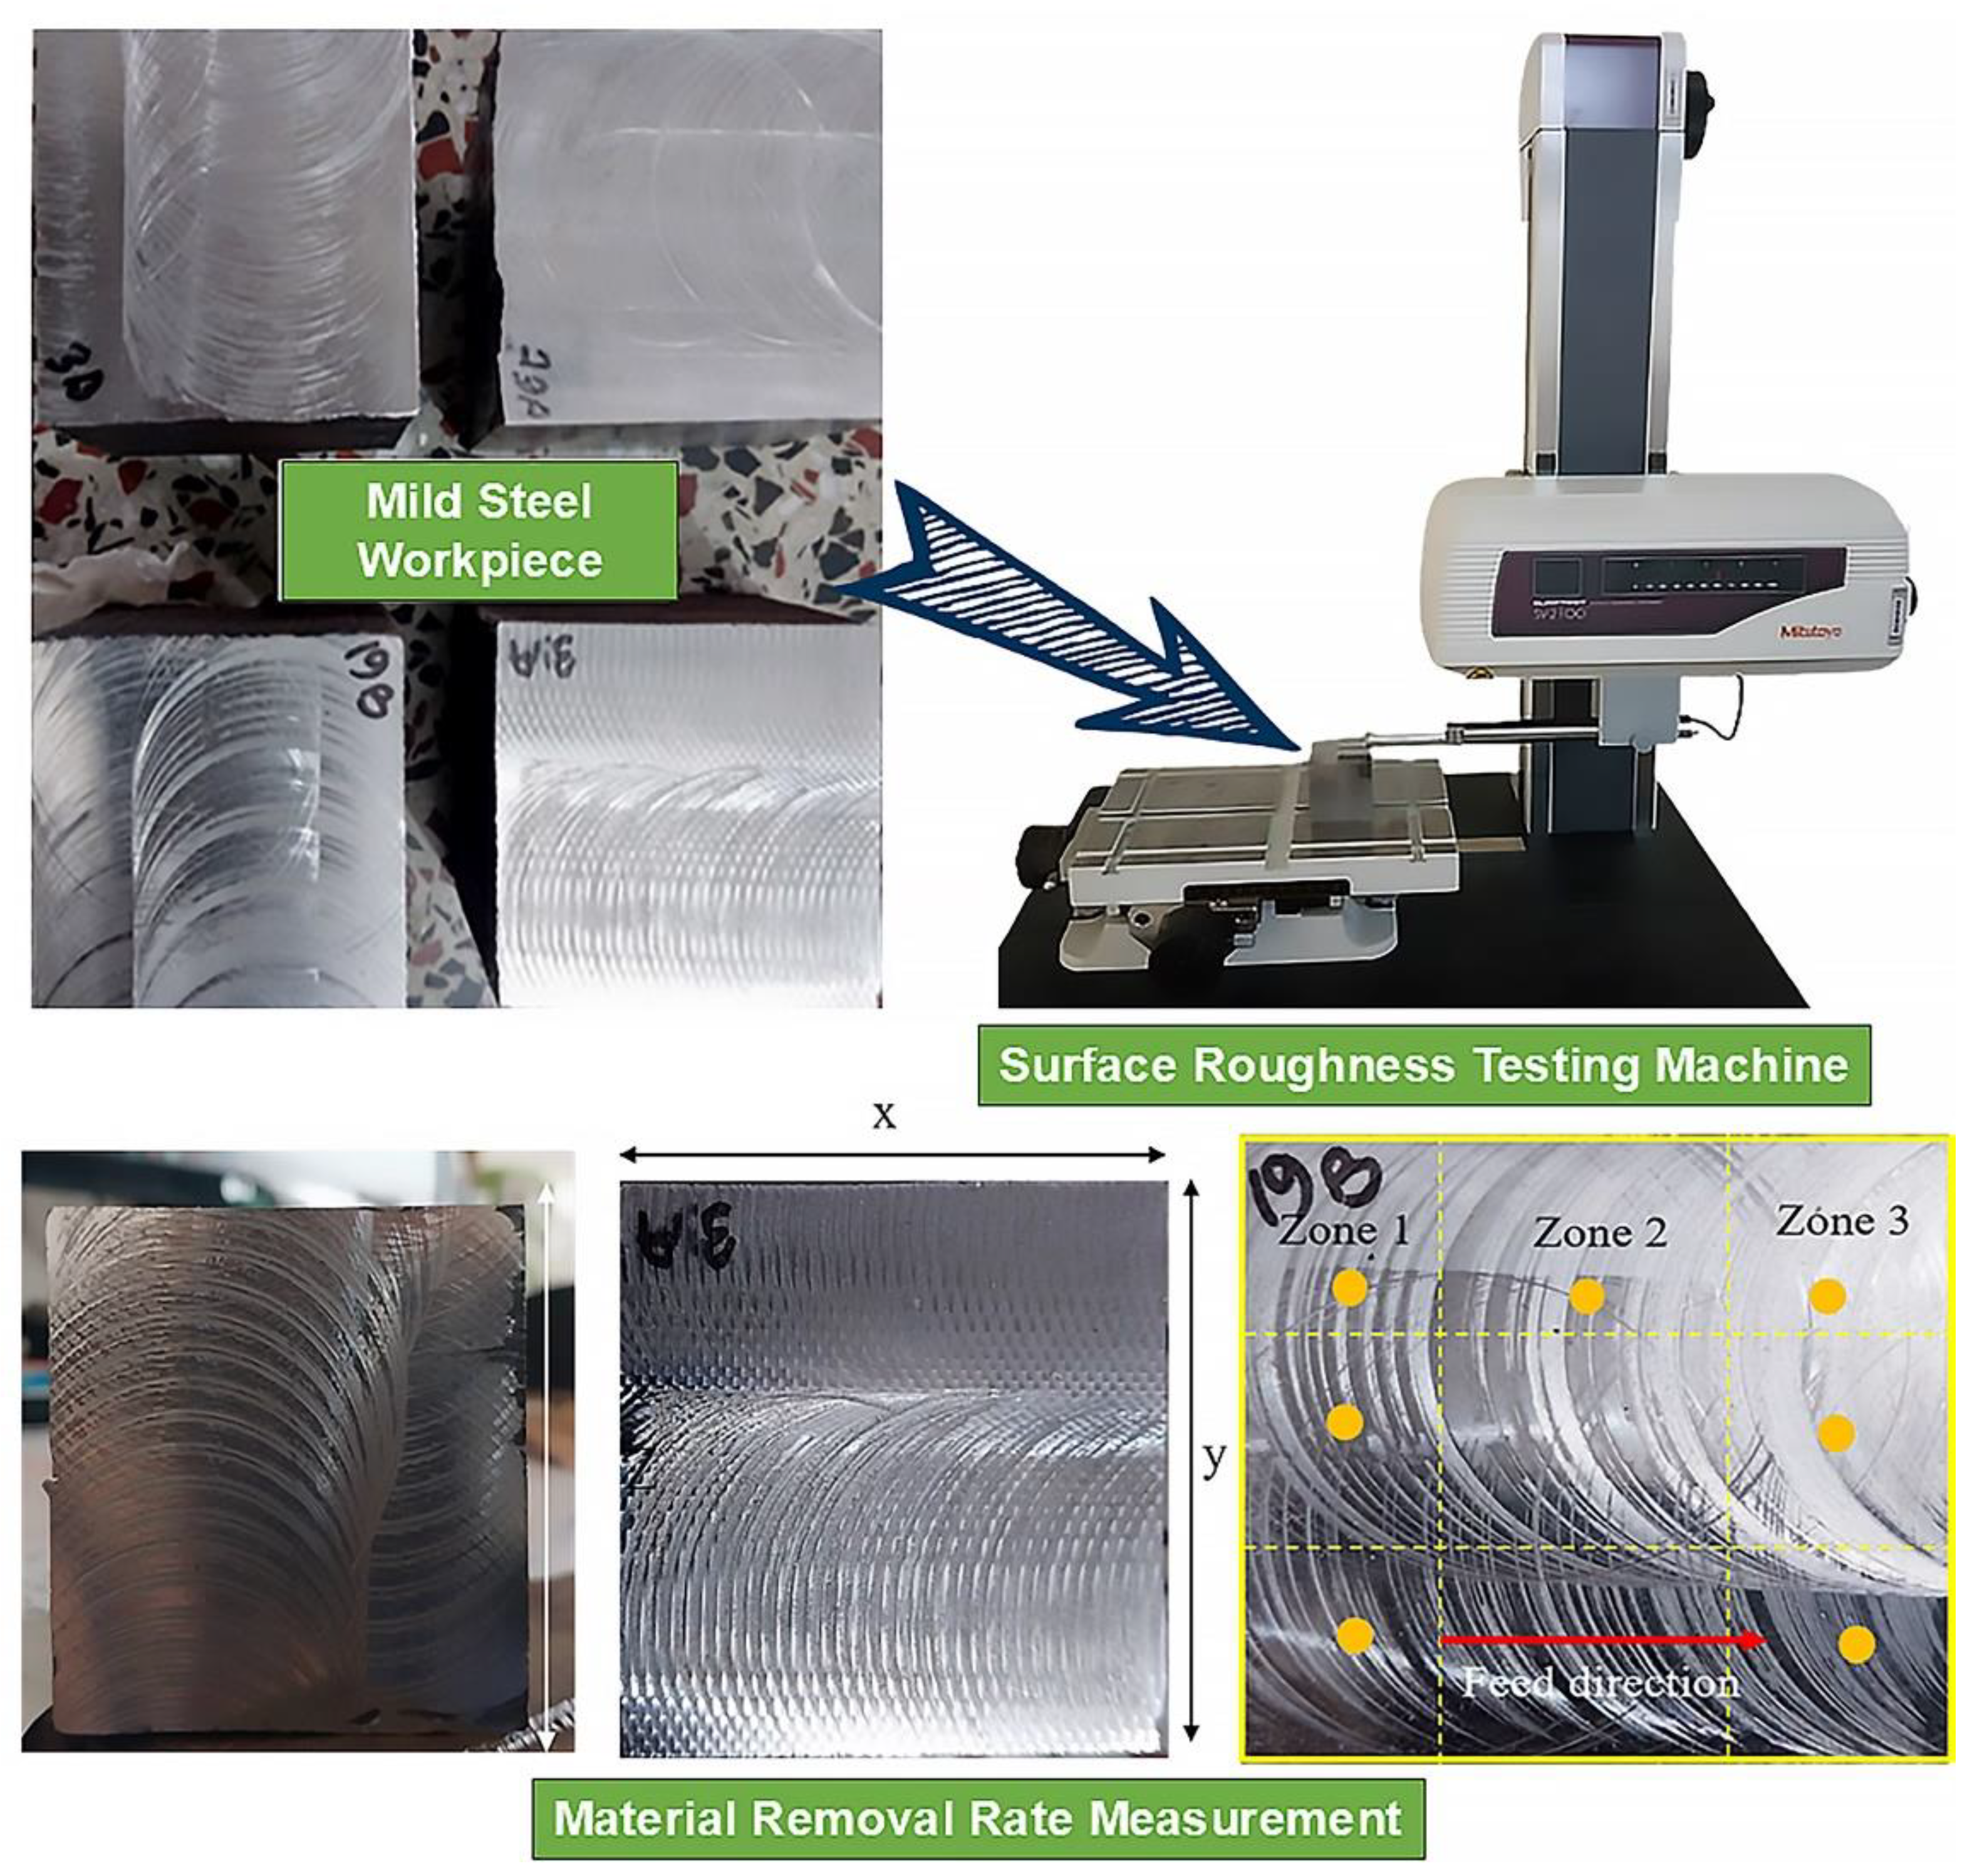
Figure 6 illustrates the application of response surface methodology (RSM) to examine the surface roughness of the workpiece. The surface roughness parameters Ra, Rp, and Rv were measured in this study. Among these, only the Ra value, as presented in
Table 5 and
Table 6, was used to evaluate surface roughness.
In
Figure 6, the surface roughness measurement device is depicted, accompanied by a detailed overview of the surface evaluation process. Surface roughness was assessed using a contact profilometer, where the Ra value serves as the primary metric for quantifying roughness. Additionally, the material removal rate (MRR) was measured using conventional methods. Digital slide calipers were employed to measure the dimensions of the workpiece, including length, width, and height, while a stopwatch was utilized to record the machining time. This combination of tools allowed for accurate measurement of both surface roughness and material removal rate during the machining process.
The equation used to calculate the material removal rate
Here workpiece, x= Length, y=Width, =The height difference and t=machining time.
3.4. Machine Learning Models for Predicting Surface Roughness and Material Removal Rate
3.4.1. Linear Regression (LR)
Linear regression, often applied for the categorical dependent variable to predict continuous quantitative variables, is one of the oldest and most basic statistical modeling and machine learning models [
39]. It assumes that the direction of the connection between the dependent variable (target value) and one or several independent variables (features or predictors) is linear [
40]. This model tries to make a straight line (or a hyperplane if there is more than one predictor) that goes closest to the points such that the total sum of the squares of the vertical distances between actual and predicted values is the least. This way of reducing the error is known as Ordinary Least Squares (OLS) [
41].
The general form of the linear regression equation is expressed as follows [
42]:
Where:
Y is the dependent variable, which is basically the target variable. X1, X2, ………., Xn are independent variables, which are the input features that influence the output Y. µ0 is the intercept term. It indicates the expected value of Y when all independent variables X1, X2, ……. Xn are zero. µ0, µ1, ……, Xn are the coefficients corresponding to each independent variable. These Coefficients reflect the magnitude and direction of the effect that each independent variable has on the dependent variable. ε is the error term, which accounts for the variations in the dependent variable that cannot be explained solely but the linear relationship with the independent variables.
However, the application of linear regression has areas for improvement, particularly in a data set with more complicated correlation or interaction [
43] . In such cases, the model is likely to provide a gross oversimplified view of the data, leading to poor predictive performance [
44]. Nevertheless, many approaches can be used to expand the linear model; for example, for polynomial features, it is possible to introduce interaction terms, and we use higher powers of predictors [
43]. In this manner, which makes the model more flexible for capturing non-linear relations, the simple and interpretable structure of linear regression is preserved.
3.4.2. Support Vector Machine (SVM)
SVM is a type of supervised learning algorithm mainly applied to classification and regression problems and, additionally, outlier detection [
45]. The prime concept integral to the use of SVM is identifying the best hyperplane that can effectively draw a clear line of separation between points belonging to different classes in classification exercises [
46]. In contrast, a regression exercise acts as a regression line that proposes probable results. This hyperplane is chosen so that the distance between the two classes is the maximum; thus, less overlap is possible.
The Supervised Machine Learning algorithm most suitable for classification is the Support Vector Machine (SVM) [
47]. The basic concept of SVM is constructing a hyperplane that maximizes the maximum margin between the two point classes [
48]. The points in the space that lie as close as possible to the hyperplane being constructed are referred to as the support vectors and have a vital role in determining the position of the hyperplane [
48].
Hyperplane and Support Vectors
For linearly separable data, SVM identifies the hyperplane that maximizes the distance (or margin) between the closest data points from each class, known as support vectors [
49]. These support vectors are the critical elements that define the margin and thus play a crucial role in determining the optimal hyperplane [
49]. The equation of the hyperplane in a linear SVM model is defined as [
50]:
Where,
W is the weight vector perpendicular to the hyperplane
X represents the feature vector
B is the bias or intercept term
For non-linear data, SVM employs kernel functions to project the data into a higher dimensional space where it becomes linear and separable. The most commonly used kernels are Linear Kernel, Polynomial Kernel, and Radial Basis Function (RBF) Kernel [
51].
3.4.3. Random Forest
Random Forest is another machine-learning algorithm that focuses on using tree-based model and entails a number of Decision trees [
52]. Specifically, it used for both classification as well as regression analysis [
52]. A Random Forest simultaneously trains n number of decision trees and the individual decision tree responses are combined to create the conclusion [
53]. The result is a more accurate model that is less inclined to overfit, as the function of the ensemble is to combine the output of any number of trees [
53].
Each tree is a decision tree that has been built from bootstrapping of the initial data set [
54]. Decision trees operate based on the splitting of the dataset at appropriate feature values; every split tries to minimize variance in regression or maximize the information gained in classification tasks best suited for the decision tree algorithm [
55]. The terminal nodes also known as the leaves of the trees hold the final forecasts [
55]. Another technique called bagging (bootstrap aggregating), where multiple subsets of the data are randomly sampled with replacement from the original dataset [
56]. Each decision tree is trained on a different bootstrapped subset, introducing variety among the trees and reducing the variance in the overall model. Further to bagging, in Random Forests the algorithm randomly samples a set of features when creating a split of a tree. This makes the number of trees larger and more diverse, and in this way it decreases the risk of over-determining the result by the few threatening features’ presence. Every tree in the forest uses only a part of the set of characteristics that can be found in the training sample, which in turn contributes to better generalization. In the case of regression tasks, Random Forest generates the mean of the trees’ prediction. Both trees are equally important for the final prediction and by averaging less noise is present in the final decision thereby improving the accuracy of the model [
52].
3.4.4. Evaluation Matrices
Four different evaluation measures have been chosen to compare the results obtained through the models to the actual surface roughness values. These applies include Coefficient of Determination referred to as R², Mean Squared Error often referred to as MSE, Mean Absolute Percentage Error also known as MAPE and Explained Variance Score designated as EVS [
57,
58,
59,
60]. Any one of these measures gives a user a different view of the model’s ability to capture the data, size of the prediction error, and the degree of total model variance respectively.
The equation of R
2 is [
57],
The equation of MSE is [
59],
The equation of MAPE is [
58],
The equation of EVS is [
60],
Here,
n = Number of data points
Yi = Observed values
Yp = Predicted values
Ym = Mean value
3.4.5. Data Pre-Processing Process
The surface roughness and material removal rate values for using 1% (weight) and 1.5% (weight) ZnO nano cutting fluid obtained from the experiments are imported in the jupyter notebook using the python library pandas. The given dataset has non-linear properties. That is why several preprocessing steps were employed for the data for modeling. To make a better generalization, 5% random noise was added to the actual spindle speed, feed rate, and depth of cut, and the new samples were synthesized into the dataset. The case of missing values was handled in two ways; either by replacing them or by eliminating records that contained them.
The input features were scaled to a standard normal distribution using a Standard Scaler to remove the indifference. The whole dataset was divided into the training (80%) and test (20%) sets and used for the individual evaluation of the models while having a separate independent test set for that purpose. Due to the presence of non-linear relationships in the dataset, the data was feature expanded through polynomial transformation that was able to capture the interactions between the inputs enhancing surface roughness and MRR predictions.
4. Result and Discussions
This study explores the development of a sunflower oil-based nano-cutting fluid and the optimization of vertical milling machine parameters using Response Surface Methodology (RSM). The aim is to improve machining performance and promote sustainable manufacturing. Key parameters—spindle speed, feed rate, and depth of cut—were tested at three levels (low, medium, high), and 27 experiments were conducted using Design Expert software. Surface roughness, a crucial indicator of machining quality, was the primary response variable, as higher surface roughness is undesirable in precision manufacturing.
To enhance lubrication and cooling, sunflower oil-based nanofluids containing zinc oxide (ZnO) nanoparticles were employed, with volume fractions of 1% and 1.5%. These fluids were applied using Minimum Quantity Lubrication (MQL), an efficient method that minimizes fluid usage while providing adequate cooling and lubrication.[
10]. The results showed that the sunflower oil-based nanofluids improved surface finish and reduced surface roughness, demonstrating their potential as environmentally friendly alternatives to conventional cutting fluids.
4.1. Characterization of Sunflower Oil-Based Nano Cutting Fluid
4.1.1. Stability Study
The stability of the nanofluids in this study was evaluated using the sedimentation method, with samples monitored over a 72-hour period. Two nanofluids were tested: one containing 1% by weight of zinc oxide (ZnO) nanoparticles and the other containing 1.5% by weight of ZnO nanoparticles.
The results, as shown in
Figure 3, indicate notable differences in the stability between the two concentrations. In the 1.5% ZnO nanofluid, minimal agglomeration was observed after 72 hours. Only a slight sedimentation of white nanoparticles and limited phase separation occurred, demonstrating the higher stability of this concentration. In contrast, the 1% ZnO nanofluid exhibited more pronounced agglomeration, with noticeable phase separation starting at 48 hours. This increased tendency for agglomeration in the 1% ZnO nanofluid suggests weaker stabilization forces compared to the 1.5% formulation.
4.2. Optimization of Milling Machine Parameters
Regression analysis was employed to examine the influence of input parameters on surface roughness (Ra) under 1% ZnO nano cutting fluid conditions. The significance of the regression model was tested, and backward elimination was used to remove non-significant terms. With a p-value below 0.5, the model was deemed statistically significant, indicating that the chosen parameters meaningfully impact surface roughness.
4.2.1. Zinc Oxide Nano Particles (1% weight) Cutting Oil Condition
The experimental investigation into the use of 1% Zinc Oxide (ZnO) nanoparticle-enriched cutting fluid reveals its significant impact on surface roughness (Ra) and material removal rate (MRR) during machining processes. The analysis of variance (ANOVA) conducted for Ra shows that spindle speed (V), feed rate (f), and depth of cut (d) affect the surface finish, with V and f being highly influential. The linear effects of spindle speed and feed rate have extremely low p-values (p < 0.05), indicating their strong statistical significance. In contrast, depth of cut showed a relatively weaker influence, both as a linear term and when interacting with the other factors. The regression model developed for Ra explains 91.58% of the variability (R-squared), suggesting that the model can reliably predict surface roughness based on the input parameters.
Table 6 demonstrates the Analysis of Variance for Ra in 1% ZnO nano cutting fluid condition. The regression equation indicates that increasing spindle speed leads to a reduction in Ra, while higher feed rates and depth of cut result in an increase in surface roughness. This model can be further used for optimizing machining conditions to minimize surface roughness in future applications.
Table 6.
Analysis of Variance for Ra in 1% ZnO nano cutting fluid condition.
Table 6.
Analysis of Variance for Ra in 1% ZnO nano cutting fluid condition.
| Source |
DF |
Adj SS |
Adj MS |
F-Value |
P-Value |
| Model |
9 |
82.2144 |
9.1349 |
20.56 |
0.000 |
| Linear |
3 |
55.8888 |
18.6296 |
41.92 |
0.000 |
| V |
1 |
20.7664 |
20.7664 |
46.73 |
0.000 |
| f |
1 |
33.6160 |
33.6160 |
75.65 |
0.000 |
| d |
1 |
0.9887 |
0.9887 |
2.22 |
0.154 |
| Square |
3 |
26.5119 |
8.8373 |
19.89 |
0.000 |
| V*V |
1 |
26.2991 |
26.2991 |
59.18 |
0.000 |
| f*f |
1 |
0.2060 |
0.2060 |
0.46 |
0.505 |
| d*d |
1 |
0.0068 |
0.0068 |
0.02 |
0.903 |
| 2-Way Interaction |
3 |
4.2781 |
1.4260 |
3.21 |
0.049 |
| V*f |
1 |
4.0694 |
4.0694 |
9.16 |
0.008 |
| V*d |
1 |
0.1994 |
0.1994 |
0.45 |
0.512 |
| f*d |
1 |
0.0093 |
0.0093 |
0.02 |
0.887 |
| Error |
17 |
7.5542 |
0.4444 |
|
|
| Total |
26 |
89.7686 |
|
|
|
Model Summary for Ra in 1% ZnO:
| S |
R-sq |
R-sq(adj) |
R-sq(pred) |
| 0.666607 |
91.58% |
87.13% |
78.38% |
The correlation between the influential factors (d, f, v) was obtained using multiple linear regressions. Here the generated mathematical model for average surface roughness (Ra).
Regression Equation:
| Ra |
= |
8.85 - 0.04896 V + 0.0397 f + 2.16 d + 0.000069 V*V - 0.000033 f*f + 0.84 d*d- 0.000040 V*f - 0.00361 V*d - 0.0017 f*d |
In the case of MRR, the ANOVA results indicate that spindle speed and feed rate are again the most dominant factors, with their linear and quadratic effects having statistically significant impacts (p < 0.05). Depth of cut, while affecting MRR, exhibited a lower significance level, as reflected by the higher p-values. The regression model for MRR, with an R-squared value of 91.58%, mirrors the strength of the surface roughness model, showcasing the model's capacity for accurate predictions.
Table 7 demonstrates ANOVA results for MRR in 1% ZnO nano cutting fluid condition. The regression equation highlights that increasing spindle speed and feed rate results in higher material removal rates, which is desirable in many machining operations aiming for maximum productivity. However, the interactions between spindle speed and feed rate (V
f) and between spindle speed and depth of cut (Vd) were found to have lesser significance, suggesting that individual control of these parameters would yield more effective optimization results than focusing on interactions.
Model Summary for MRR in 1% ZnO:
| S |
R-sq |
R-sq(adj) |
R-sq(pred) |
| 39.9964 |
91.58% |
87.13% |
78.38% |
Regression Equation in Uncoded Units
| MRR |
= |
530.7 - 2.938 V + 2.384 f + 130 d + 0.004148 V*V - 0.00200 f*f + 50 d*d - 0.002402 V*f - 0.217 V*d - 0.102 f*d |
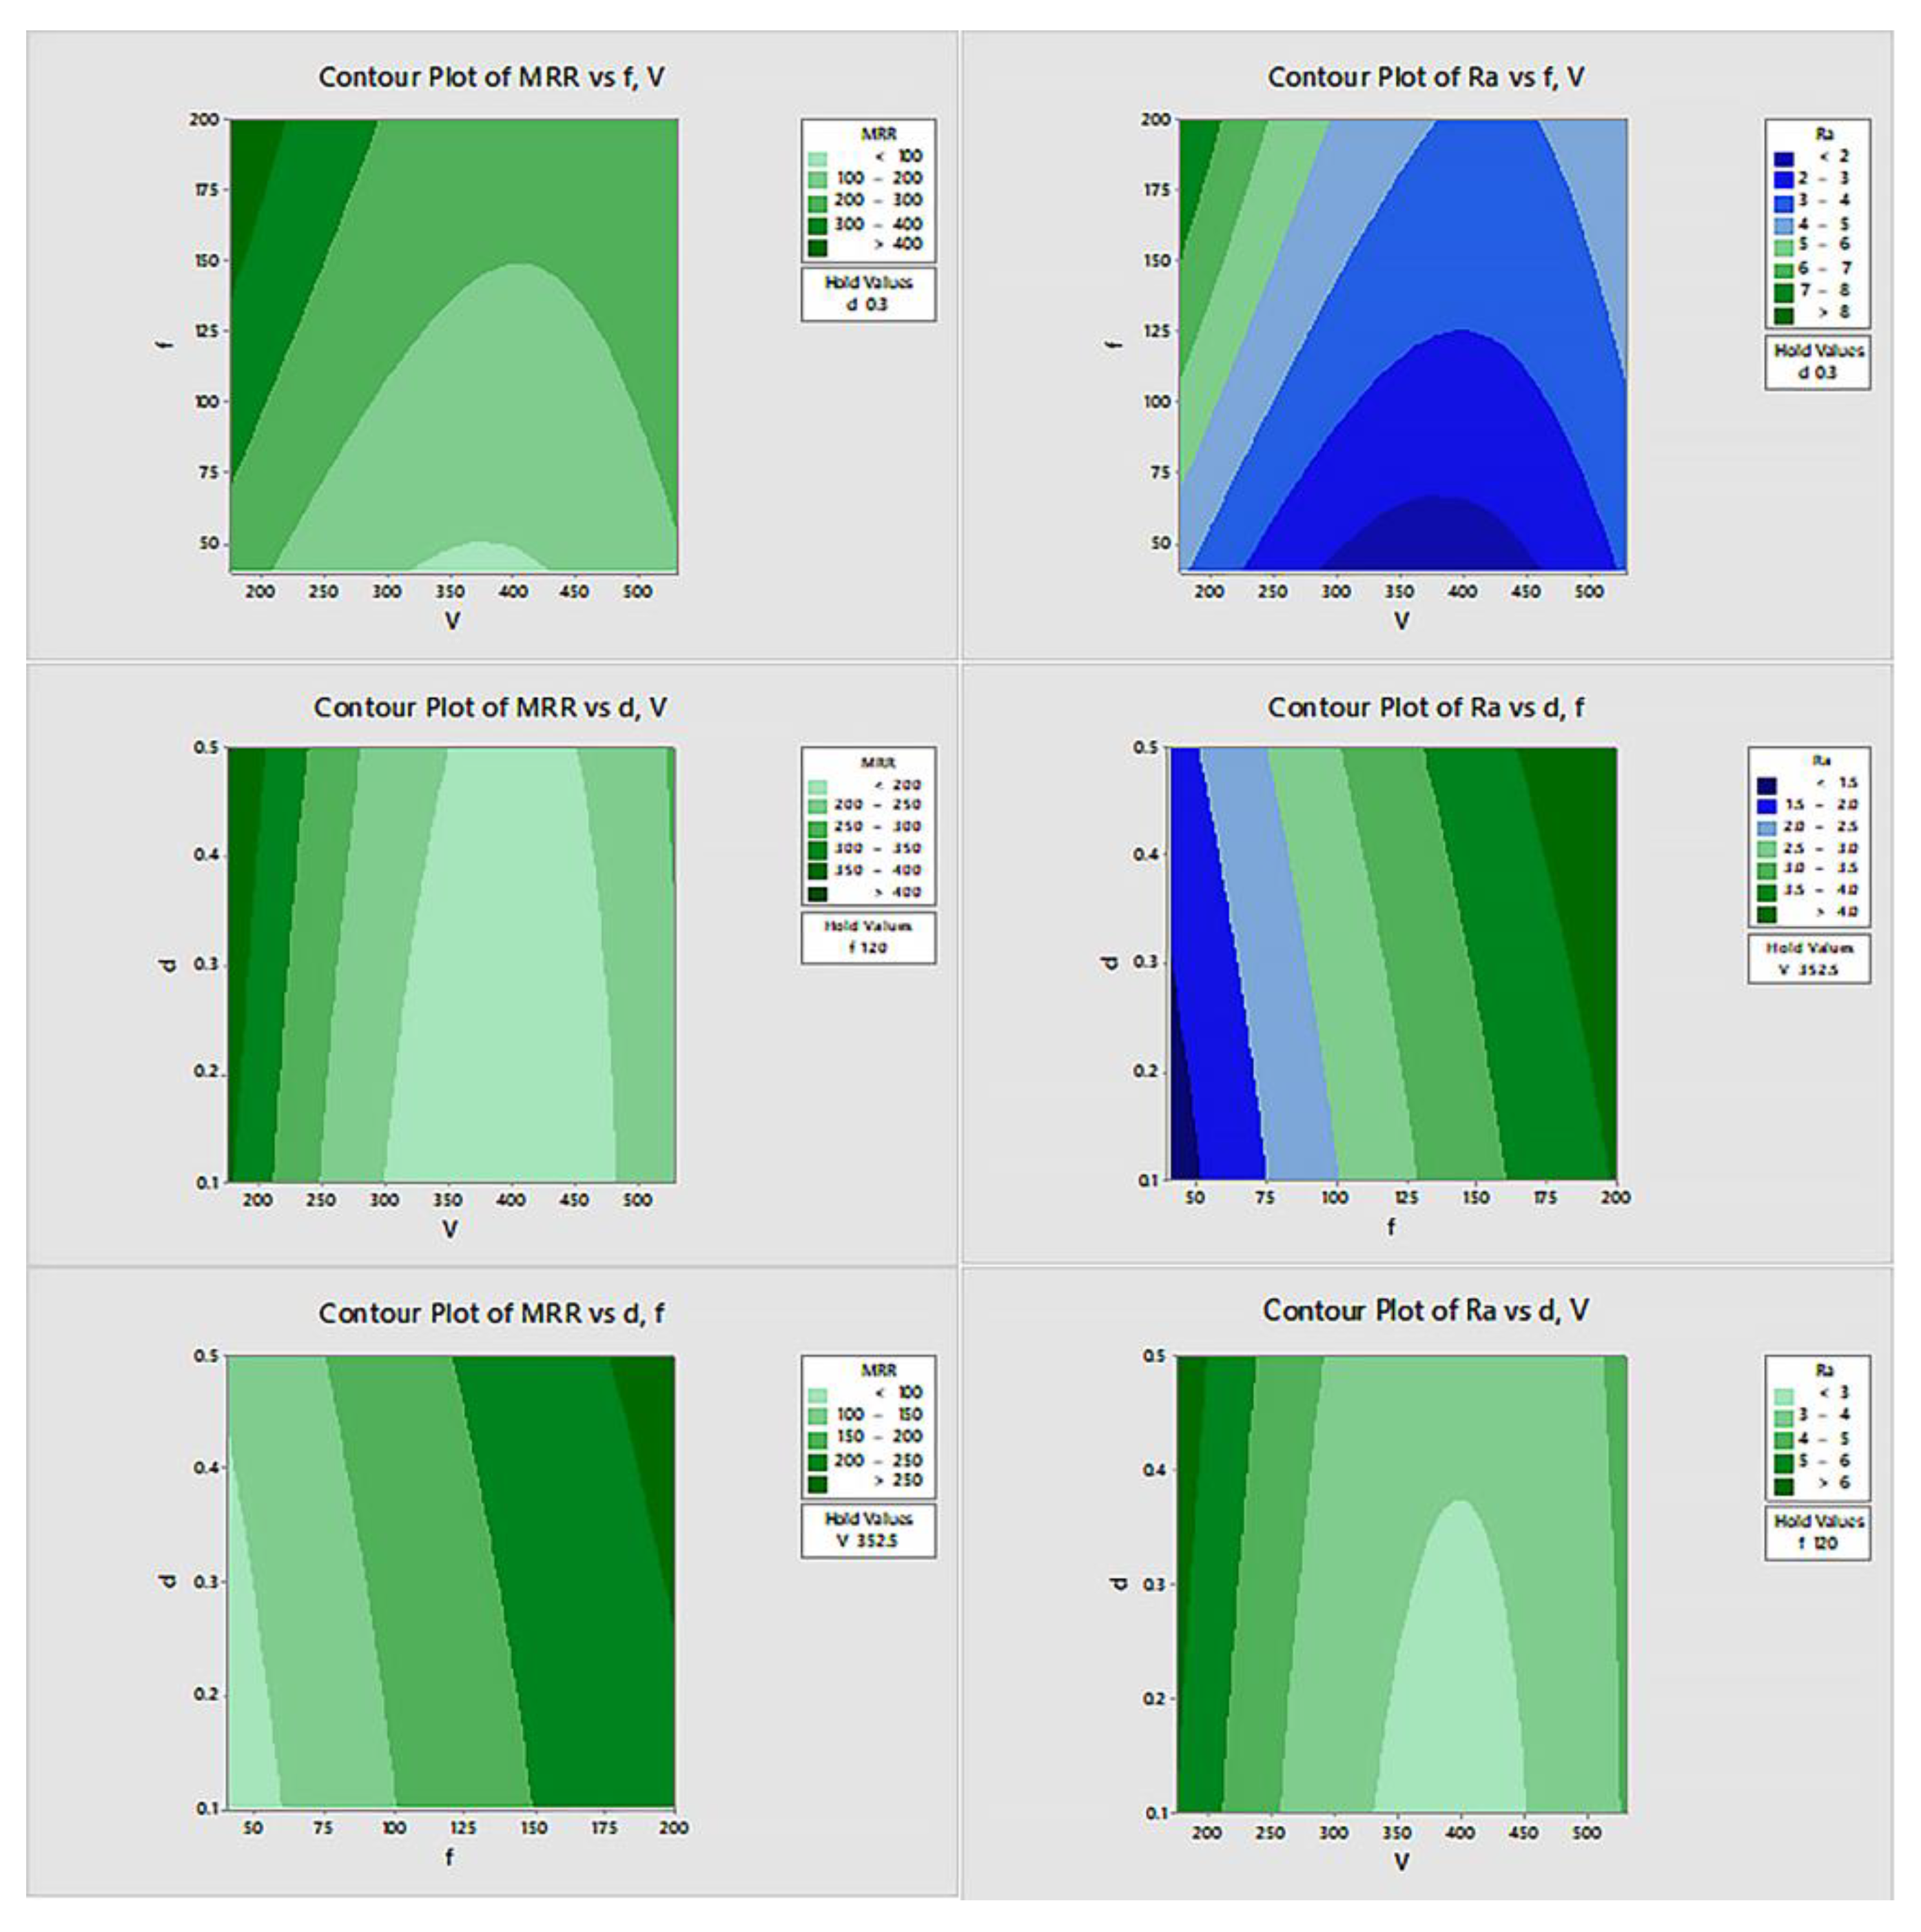
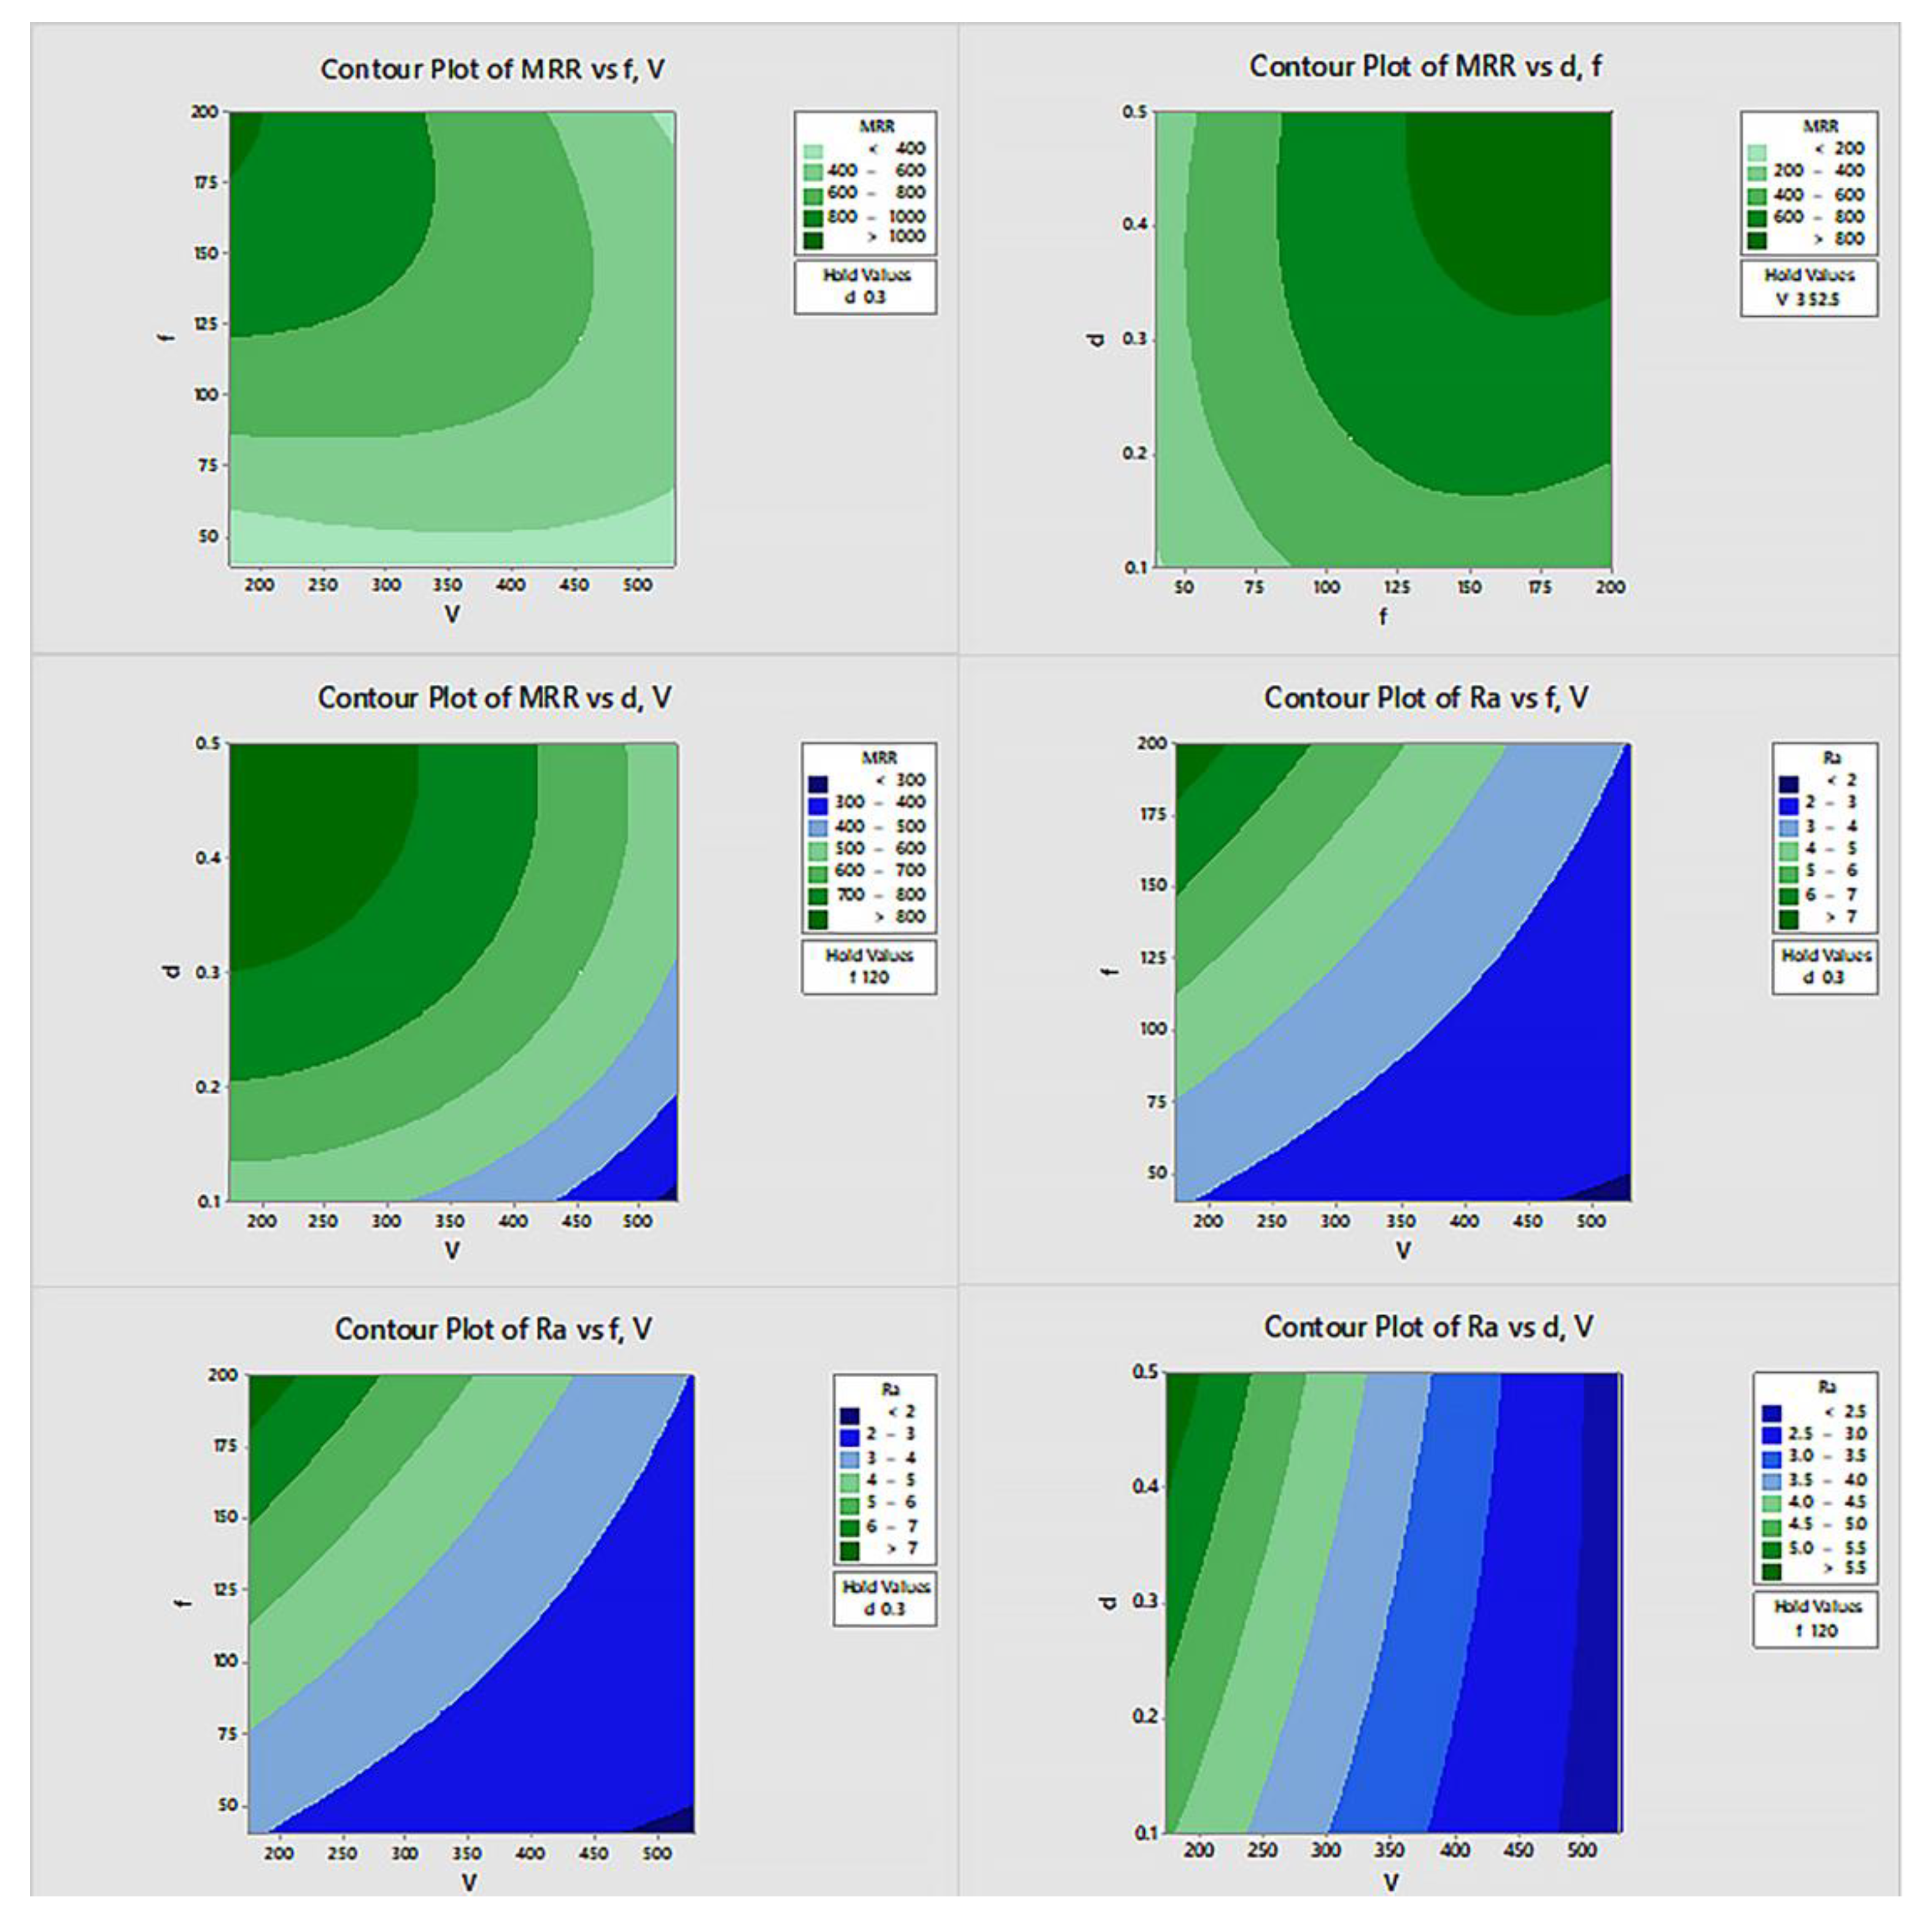
The contour plots (
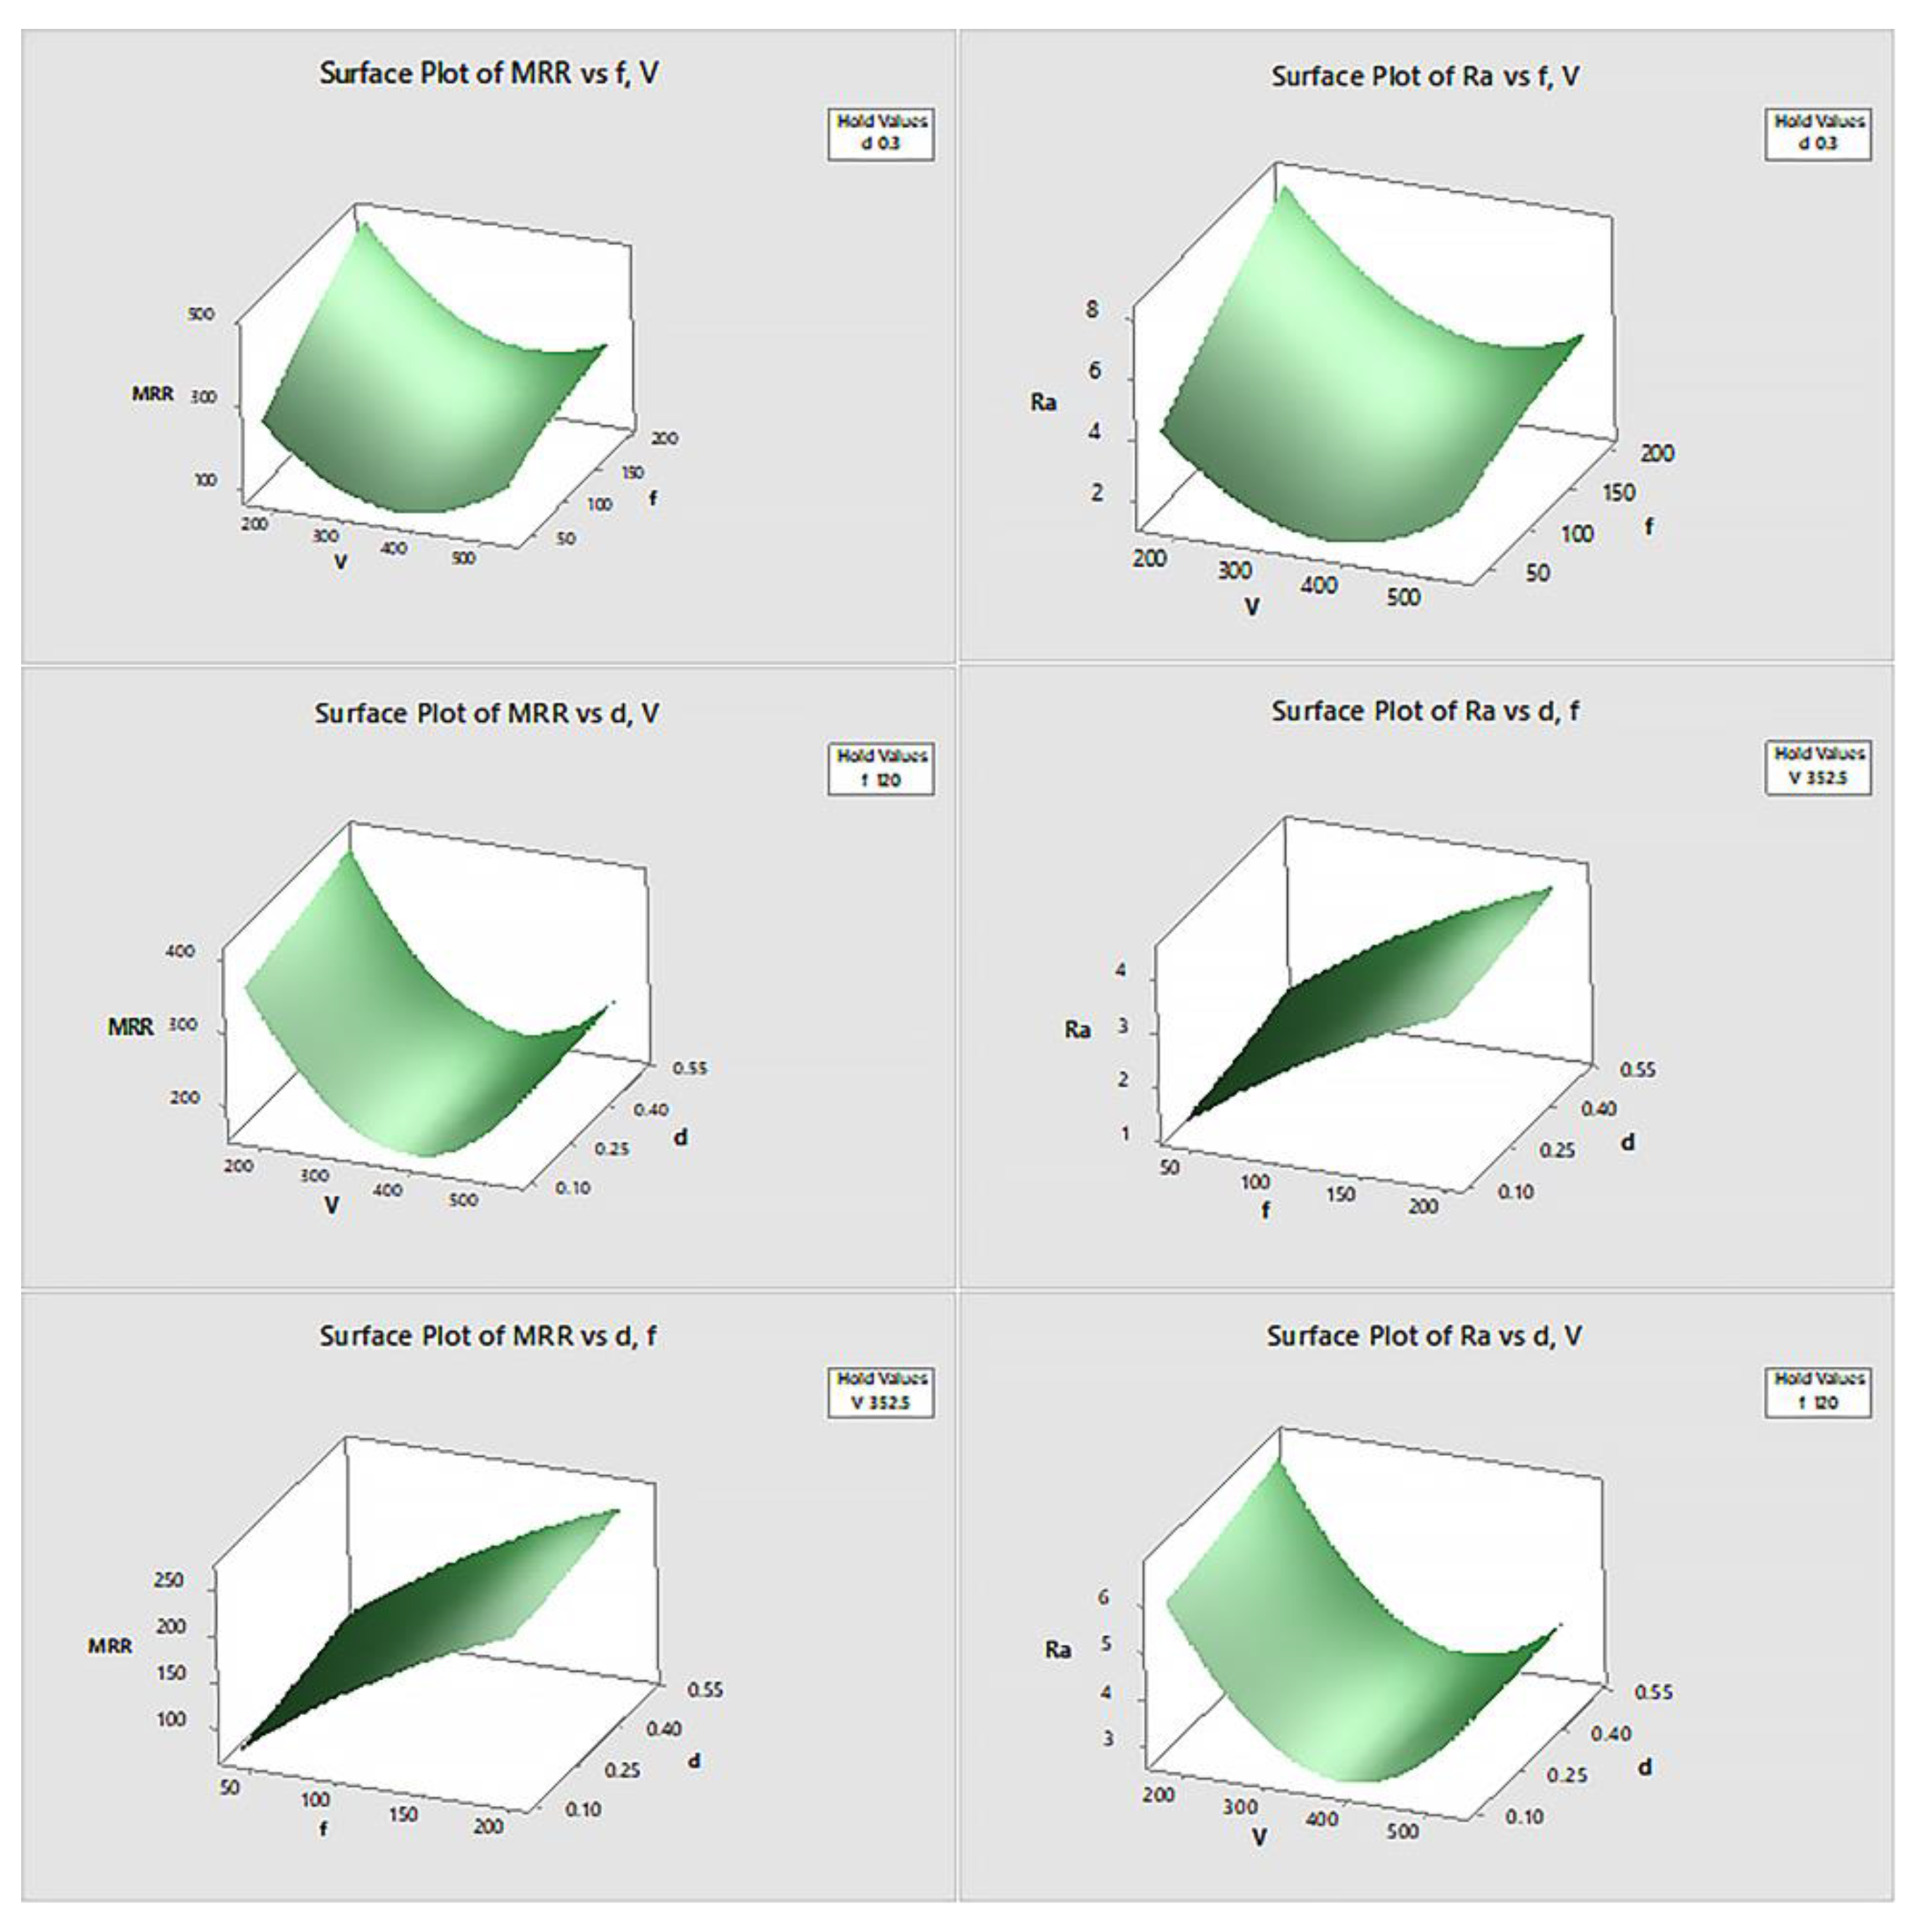
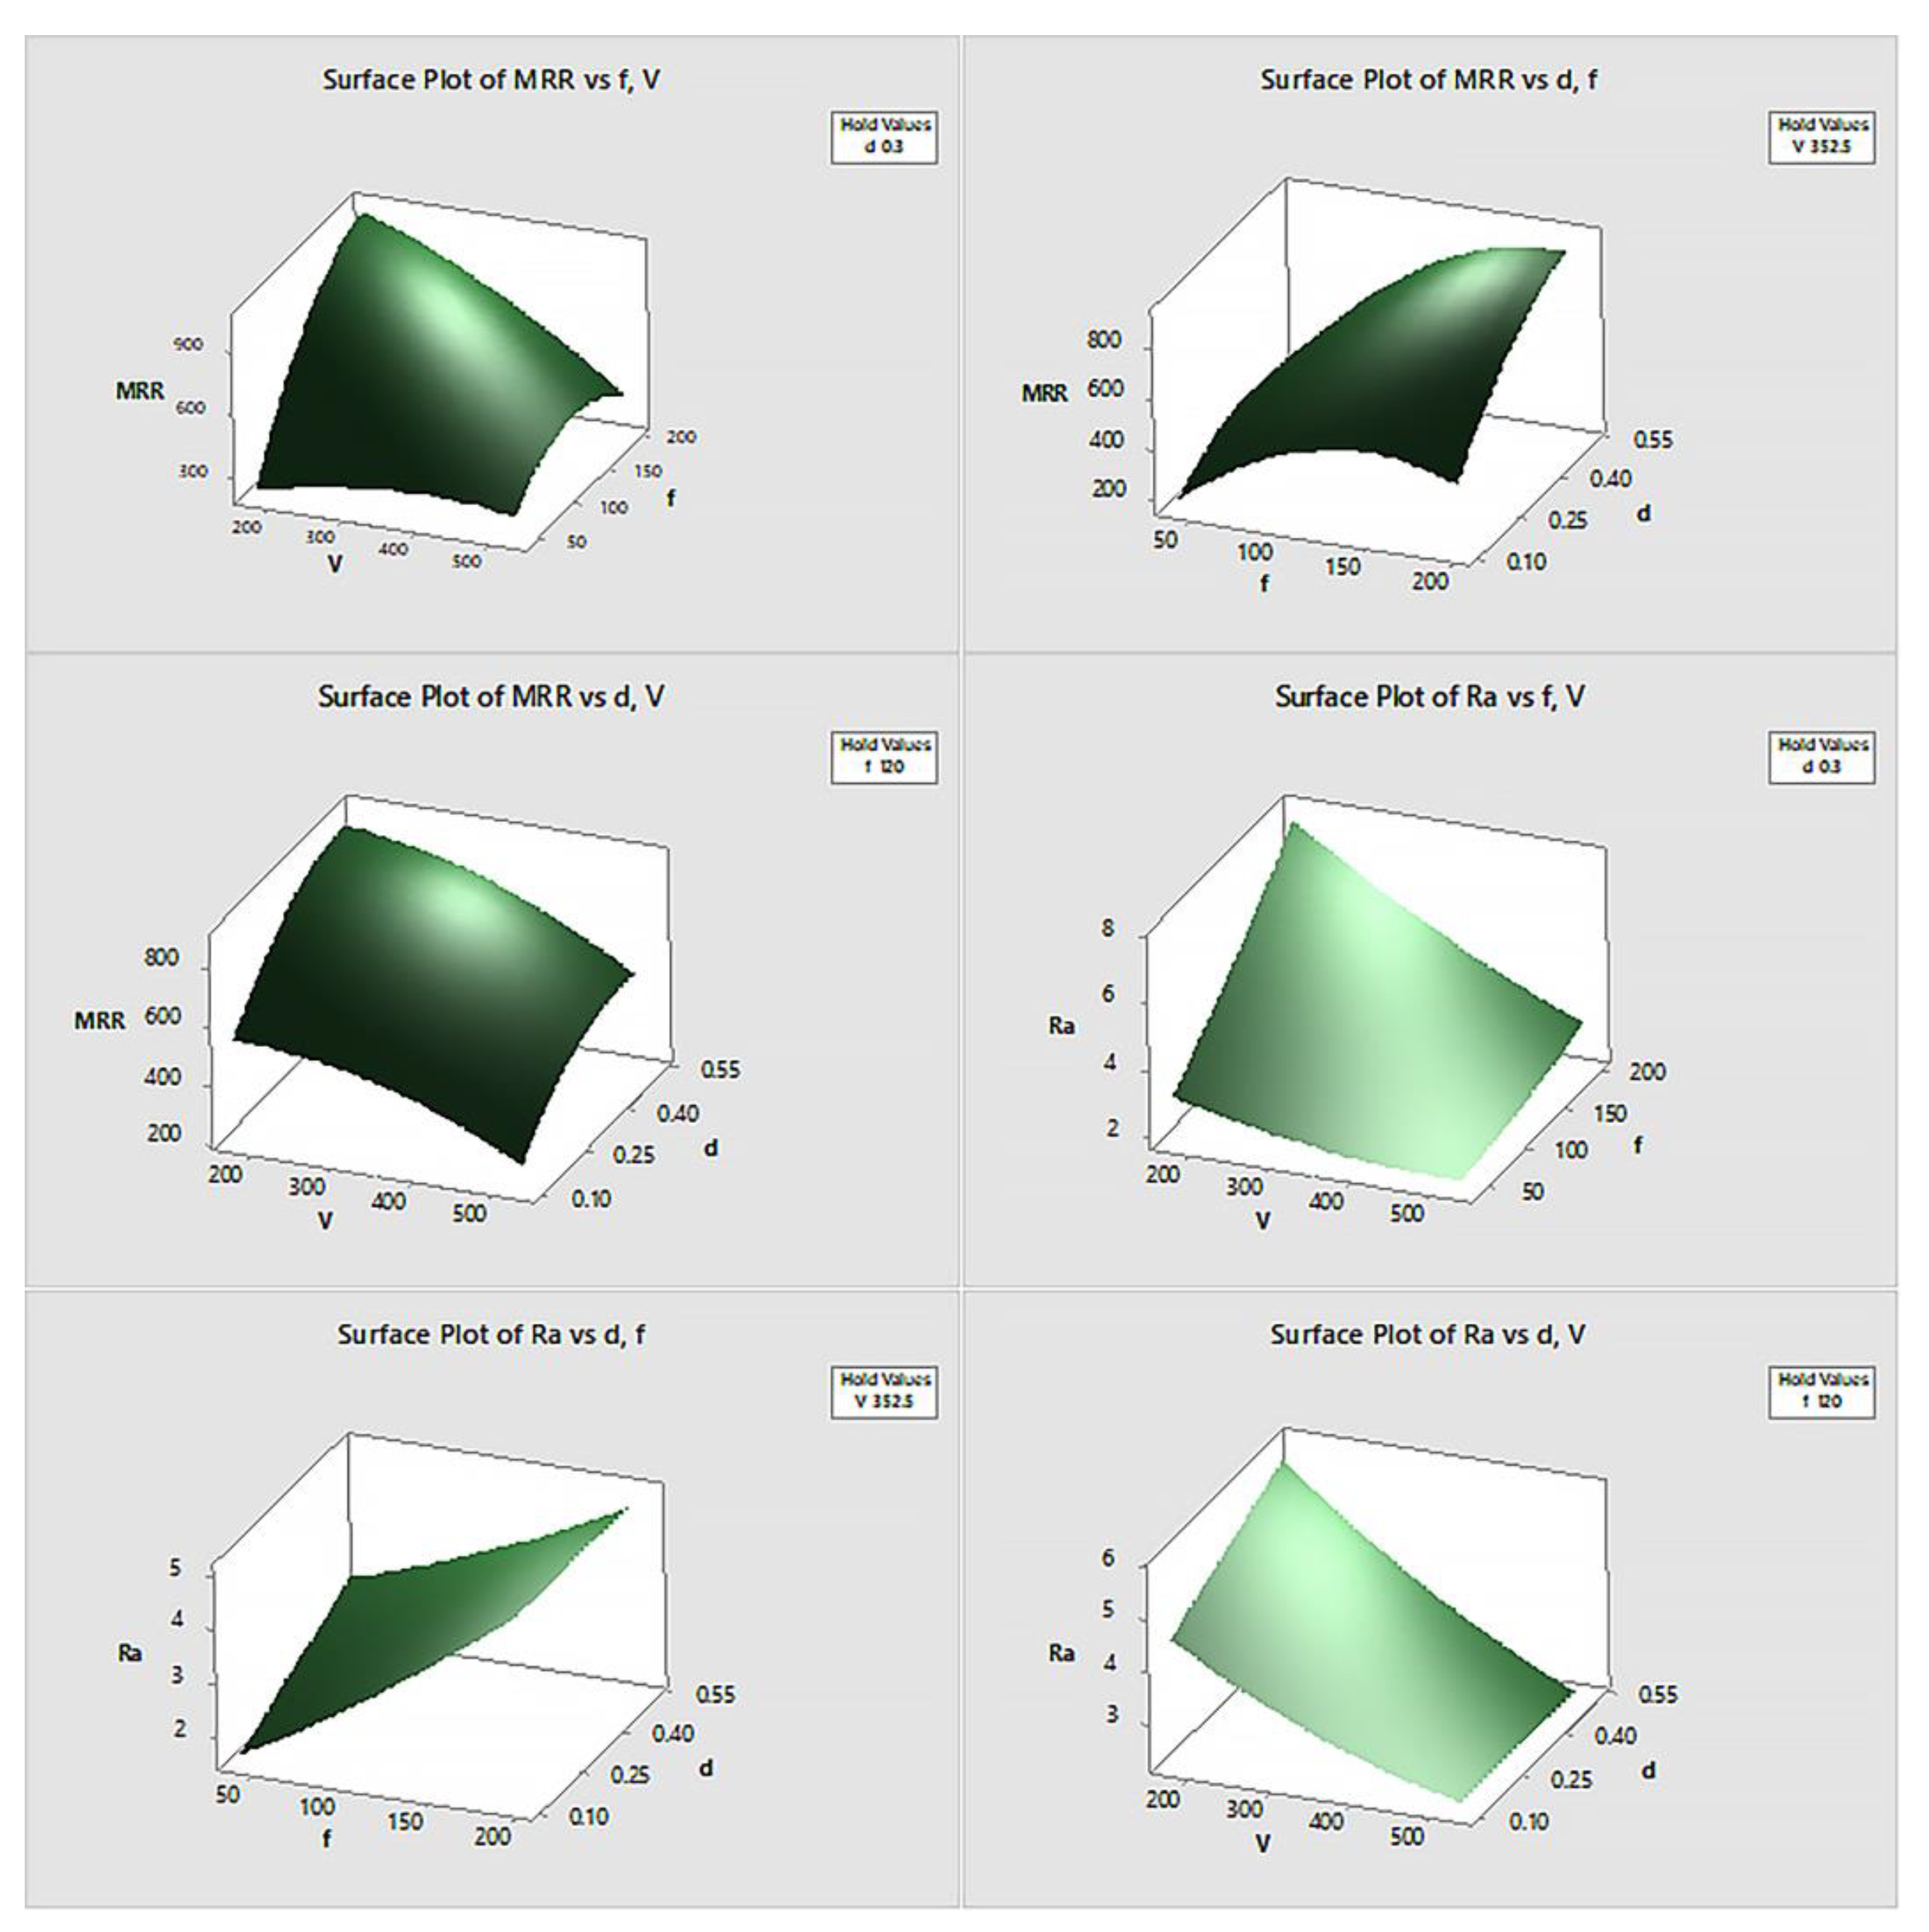
Figure 7) and surface plots (
Figure 8) generated for both Ra and MRR provide visual insights into the combined effects of the parameters on machining performance. These plots illustrate how optimal conditions for minimizing surface roughness and maximizing material removal rate can be achieved by adjusting spindle speed and feed rate while keeping the depth of cut at moderate levels. The investigation shows that the use of ZnO nanoparticle-enriched cutting fluid offers a viable solution for improving surface finish and machining efficiency. This finding is particularly valuable for industries seeking to enhance production quality and efficiency without compromising material integrity.
| Solution |
V |
f |
d |
MRR Fit |
Ra Fit |
Composite Desirability |
| 1 |
318.434 |
200 |
0.5 |
292.537 |
4.87562 |
0.499999 |
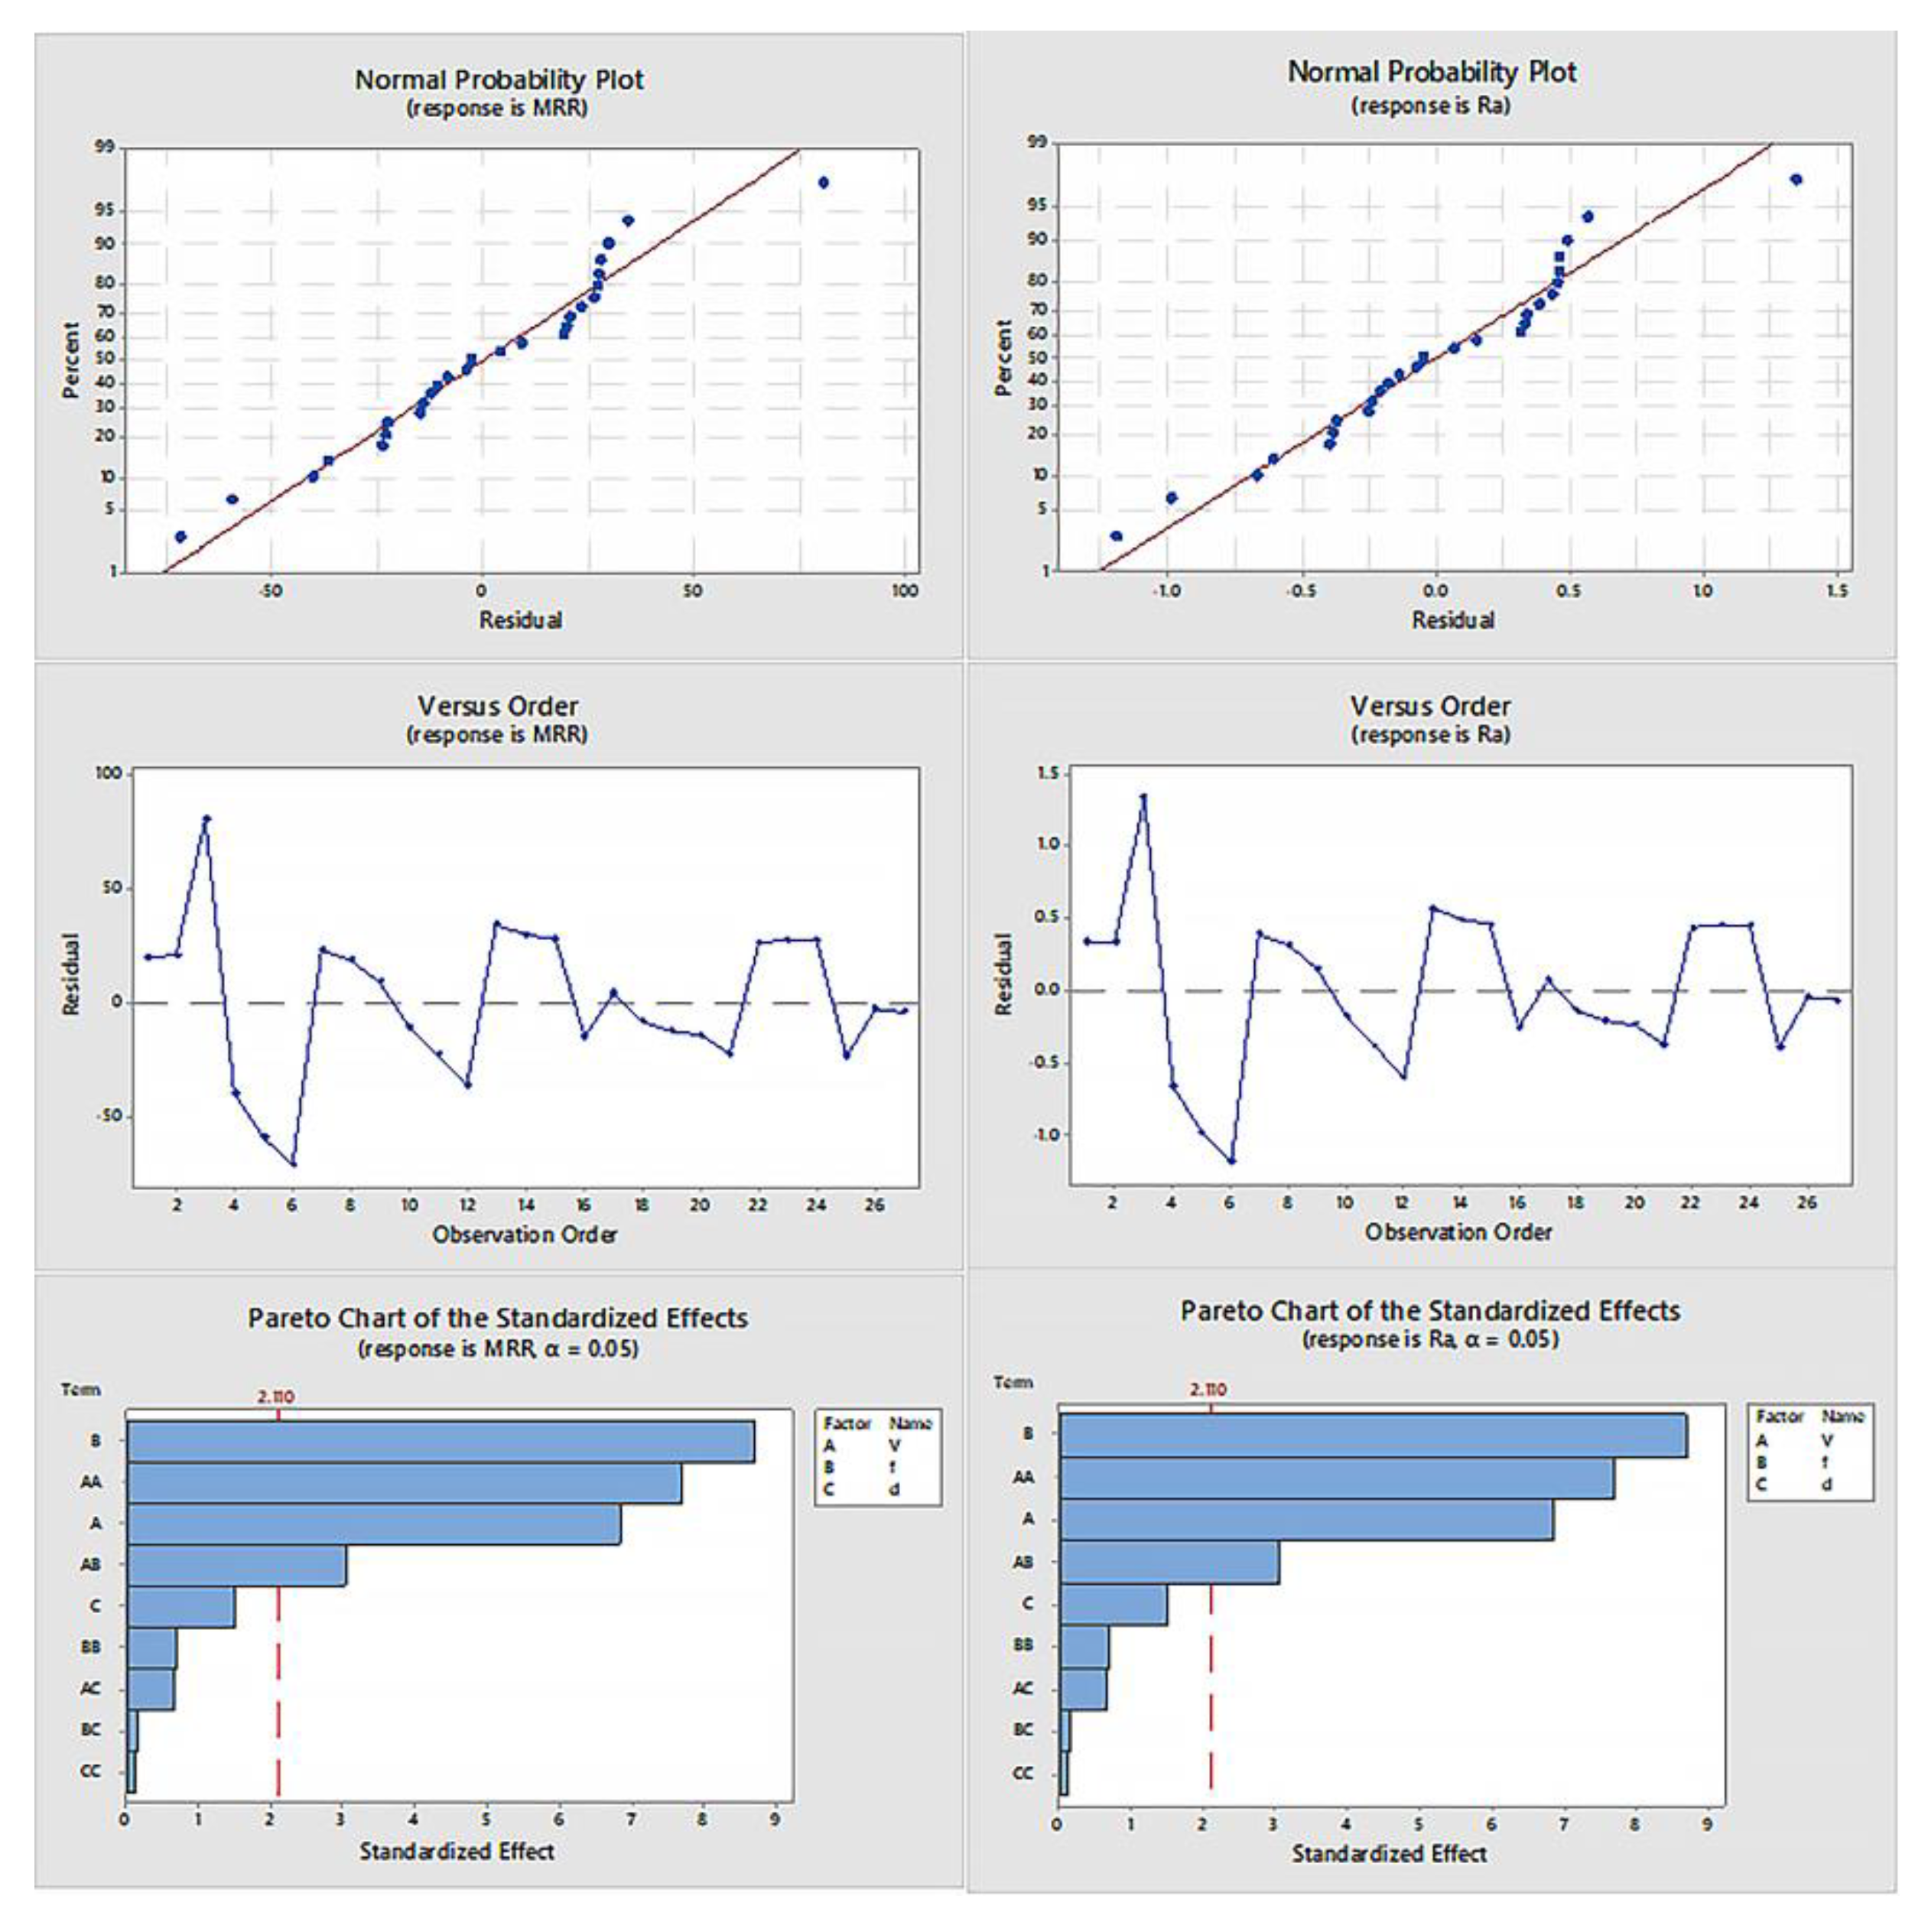
The residual plots for surface roughness (Ra) and material removal rate (MRR) in
Figure 9 indicate that the models adequately fit the data, as evidenced by the normal probability plots, where the residuals closely align with the straight line, signifying normal distribution. The versus-order plots show that residuals are randomly scattered without any clear patterns, suggesting no significant autocorrelation. In the Pareto charts, the standardized effects reveal that spindle speed (A) and feed rate (B) are the most significant factors influencing both Ra and MRR, with their interaction (AB) also playing a notable role, particularly in MRR optimization. These analyses confirm the model’s robustness for prediction and optimization purposes.
The regression equation yielded an R-squared value exceeding 80%, indicating a strong fit between the model and the experimental data. This high R-squared value signifies that the regression model accurately captures the relationship between the input parameters and the response variables.
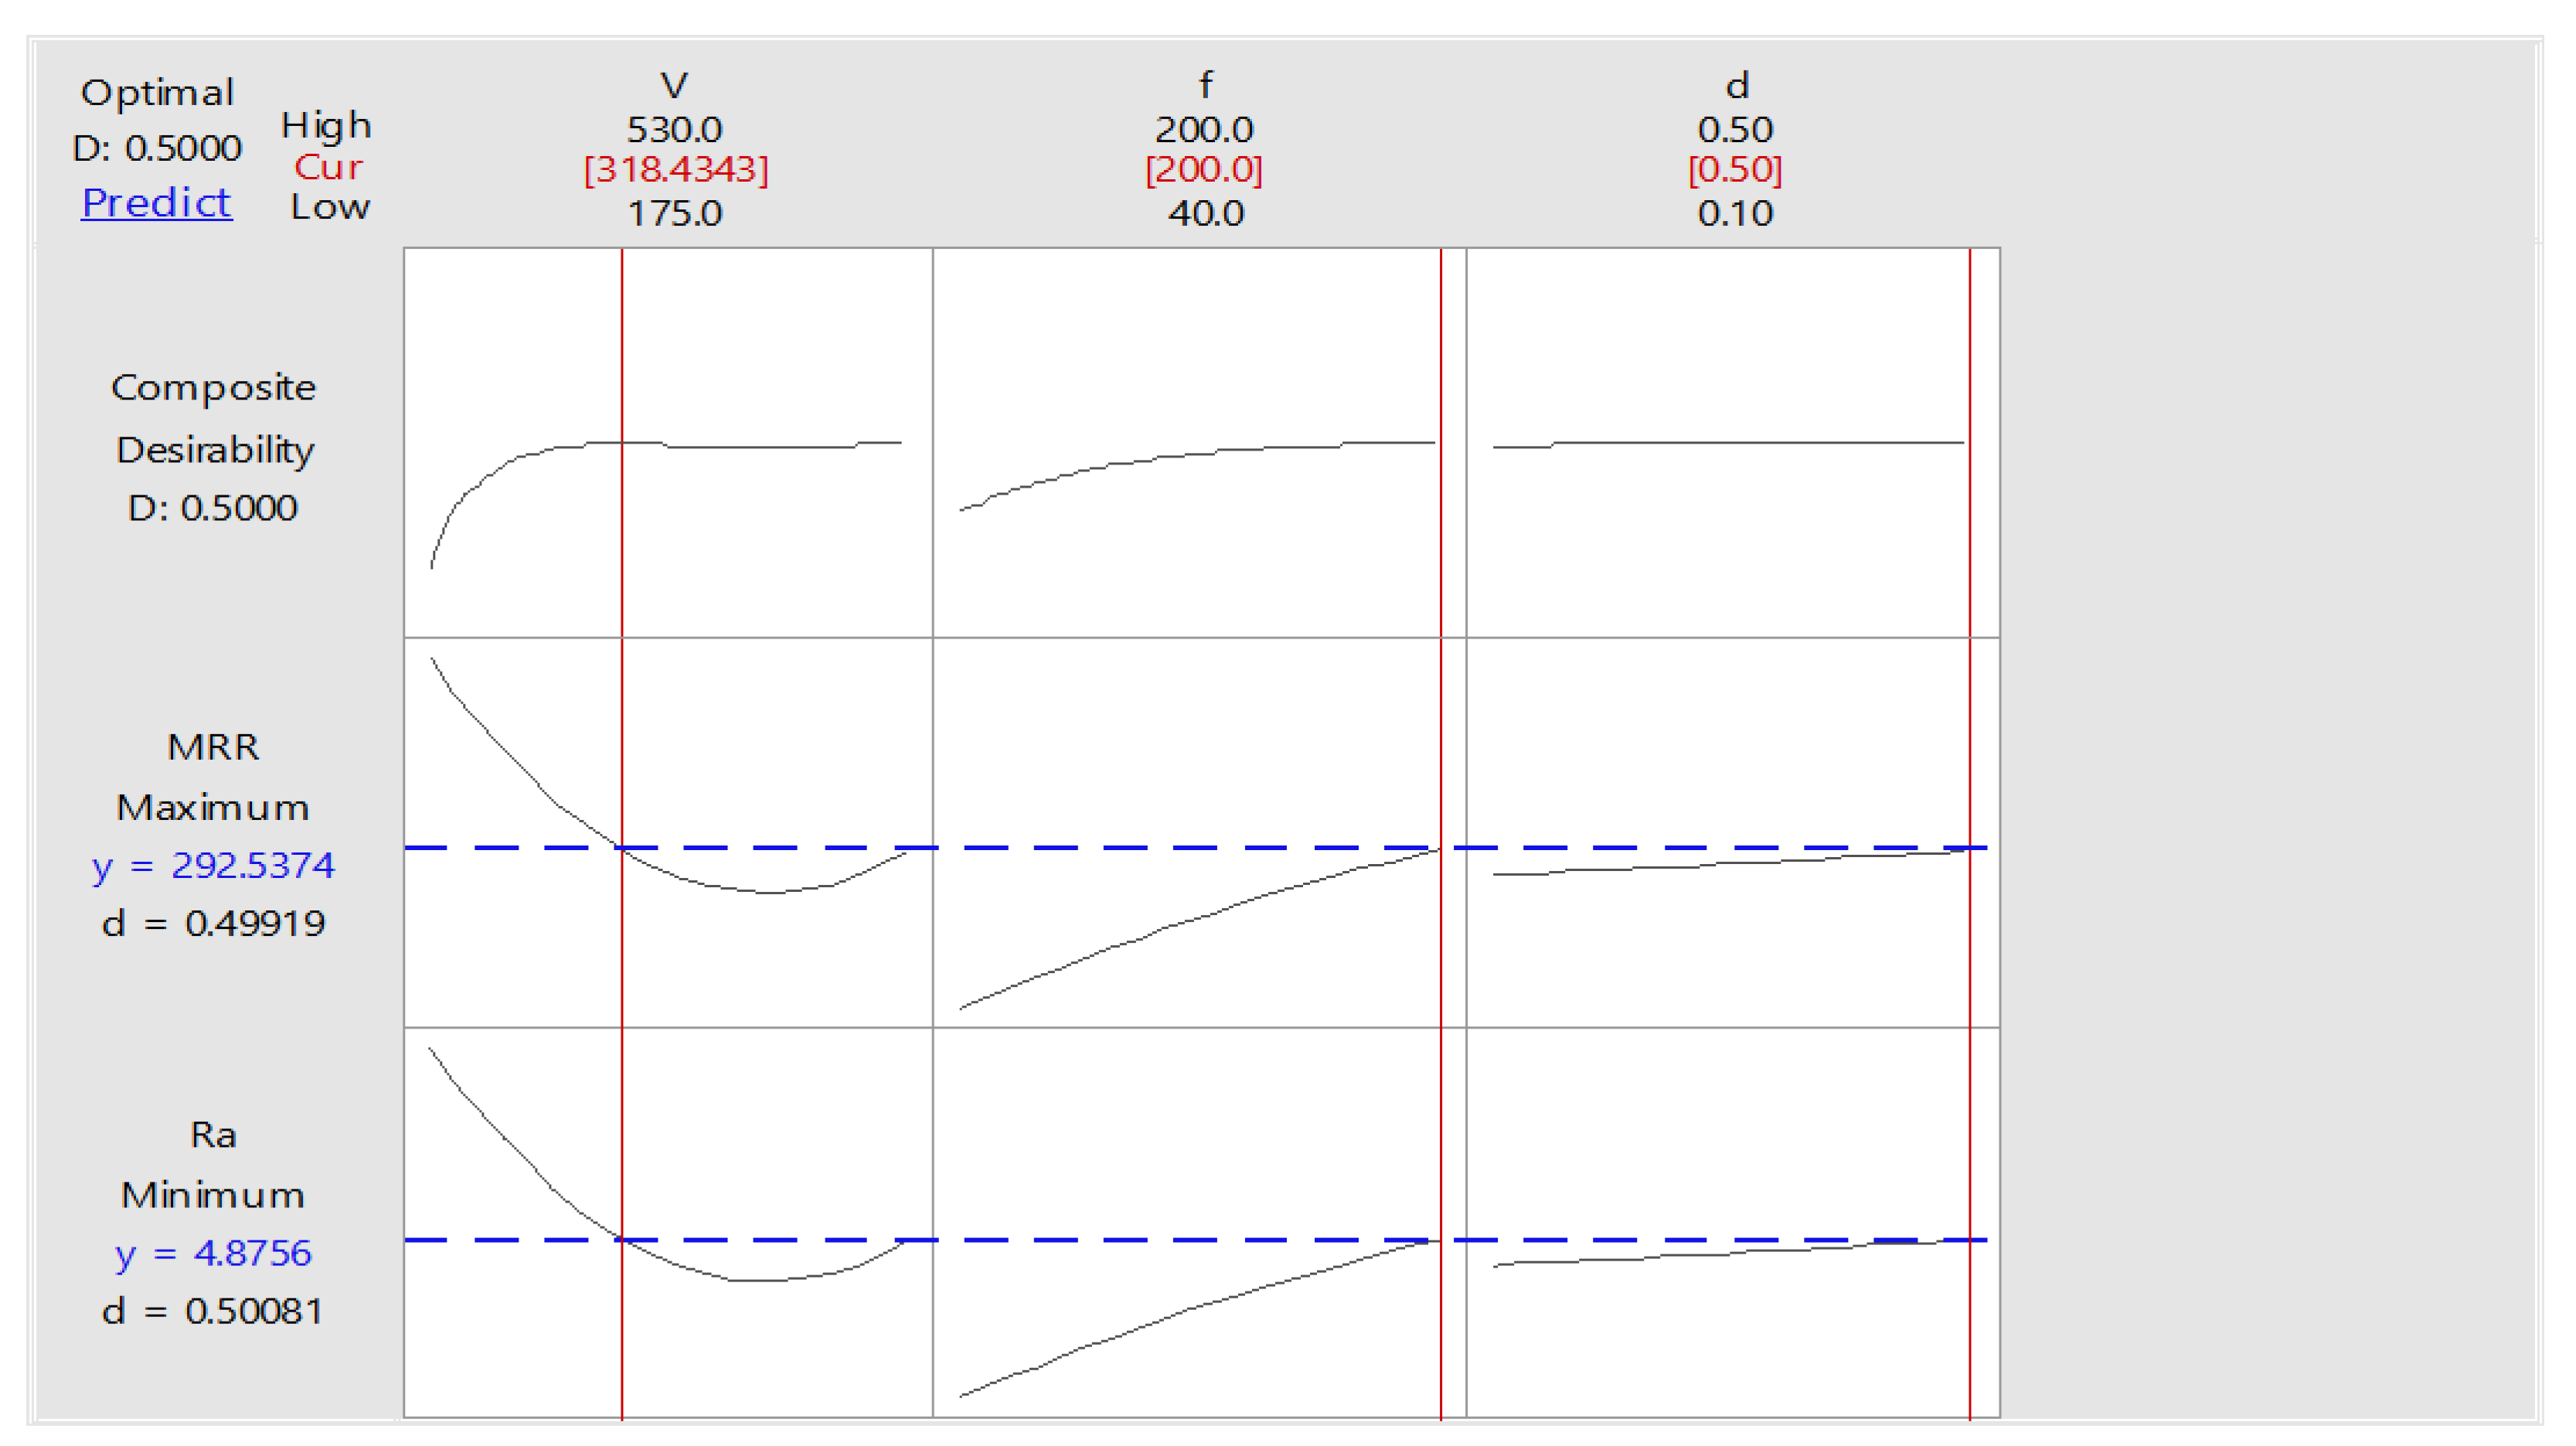
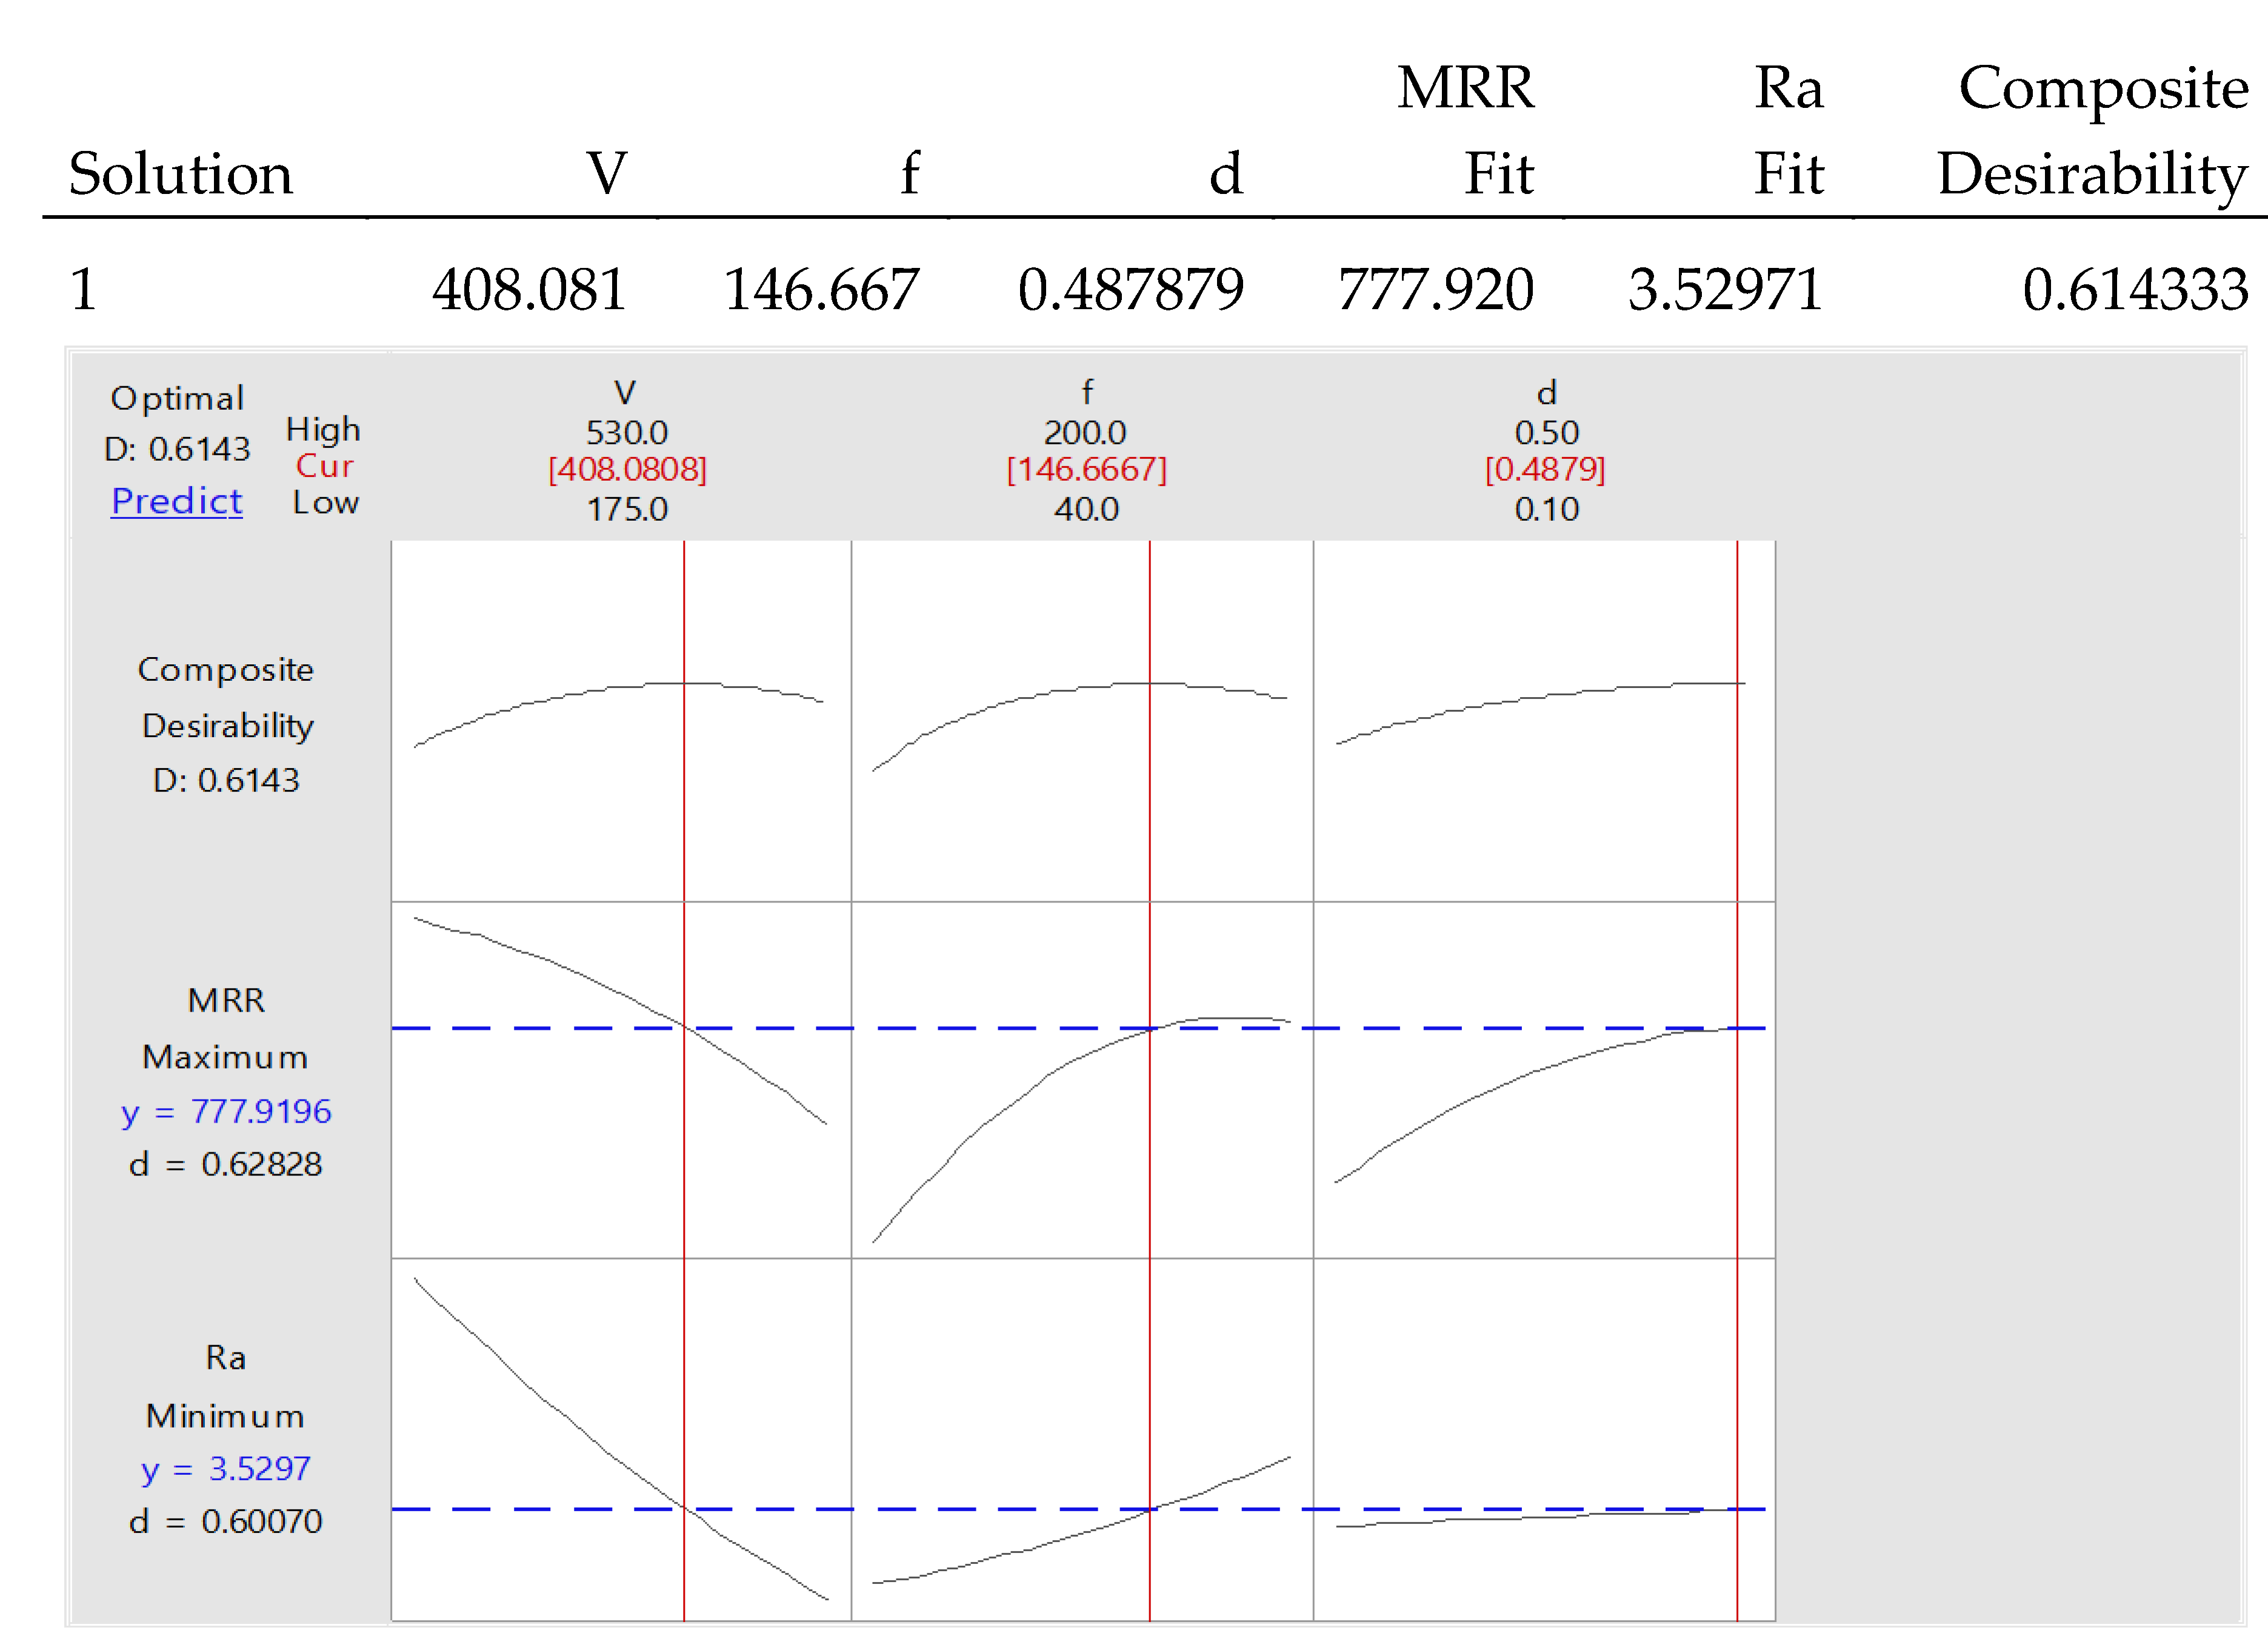
Figure 10 depicts the Optimization Plot for 1% ZnO nano cutting fluid condition. Consequently, this equation can be confidently utilized for future optimization purposes, enabling precise predictions of outcomes under various machining conditions. Additionally, the model serves as a reliable tool for assessing the effects of different factors on surface roughness and material removal rate, providing a solid foundation for further analysis and industrial applications.
4.2.2. Zinc Oxide Nano Particles (1% Weight) Cutting Oil Condition
The analysis of variance (ANOVA) for the 1.5% Zinc Oxide (ZnO) nanoparticle cutting oil condition reveals significant effects of process parameters such as spindle speed (V), feed rate (f), and depth of cut (d) on surface roughness (Ra) and material removal rate (MRR). The ANOVA results for Ra show that the model is highly significant, with an F-value of 24.19 and a p-value of 0.000. The linear terms of V, f, and d contribute most significantly, especially spindle speed and feed rate, with p-values far below 0.05. In contrast, the quadratic terms (V
V, ff, d
d) and some interactions are less significant, with the exception of Vf, which has a notable effect on Ra (p = 0.000).
Table 8 demonstrates an Analysis of Variance for Ra in 1.5% ZnO nano cutting fluid condition. The model has an R-squared value of 92.76%, indicating that the variation in surface roughness is well explained by the model.
Model Summary for Ra in 1.5% ZnO nano cutting fluid condition:
| S |
R-sq |
R-sq(adj) |
R-sq(pred) |
| 0.632450 |
92.76% |
88.92% |
77.33% |
Regression Equation for Ra in 1.5% ZnO nano cutting fluid condition :
| Ra |
= |
0.89 - 0.00424 V + 0.0398 f + 7.35 d + 0.000009 V*V + 0.000023 f*f - 0.27 d*d- 0.000063 V*f - 0.00918 V*d - 0.0199 f*d |
For MRR, the ANOVA shows similarly strong significance for the model, with an F-value of 10.07 and a p-value of 0.000. The linear terms again dominate especially feed rate and depth of cut, with very low p-values of 0.001 and 0.000, respectively.
Table 9 demonstrates an Analysis of Variance for MRR in 1.5% ZnO nano cutting fluid condition. However, the quadratic terms and most interaction terms are less influential, with only f
f and fd interactions showing moderate significance. The model explains 84.21% of the variance in MRR, with a lower adjusted R-squared of 75.85%, suggesting that while the model fits well, there is room for improvement in predicting MRR.
Model Summary for MRR in 1.5% ZnO nano cutting fluid condition
| S |
R-sq |
R-sq(adj) |
R-sq(pred) |
| 159.309 |
84.21% |
75.85% |
55.43% |
Regression Equation for MRR in 1.5% ZnO nano cutting fluid condition
| MRR |
= |
-768 + 2.34 V + 11.97 f + 1507 d - 0.00205 V*V - 0.0266 f*f - 2148 d*d - 0.01329 V*f - 0.56 V*d + 6.05 f*d |
The contour plots effectively in
Figure 11 demonstrate the importance of balancing spindle speed, feed rate, and depth of cut to optimize both MRR and surface roughness. They offer a clear visualization of the trade-offs involved: while higher spindle speeds and feed rates improve MRR, they may negatively impact surface roughness, especially if not carefully controlled.
The results indicate that optimizing spindle speed, feed rate, and depth of cut can significantly improve surface finish and material removal efficiency. The surface plots in
Figure 12 demonstrate that increasing spindle speed generally reduces surface roughness while increasing feed rate and depth of cut enhance MRR. The optimization plot for 1.5% ZnO cutting fluid in
Figure 13 shows a well-optimized Ra value of 3.5297, with residual plots indicating strong model adequacy for both Ra and MRR. This suggests that 1.5% ZnO nanoparticle-infused cutting fluid is effective in enhancing machining performance by improving surface quality and maximizing material removal, particularly through careful control of feed rate and spindle speed.
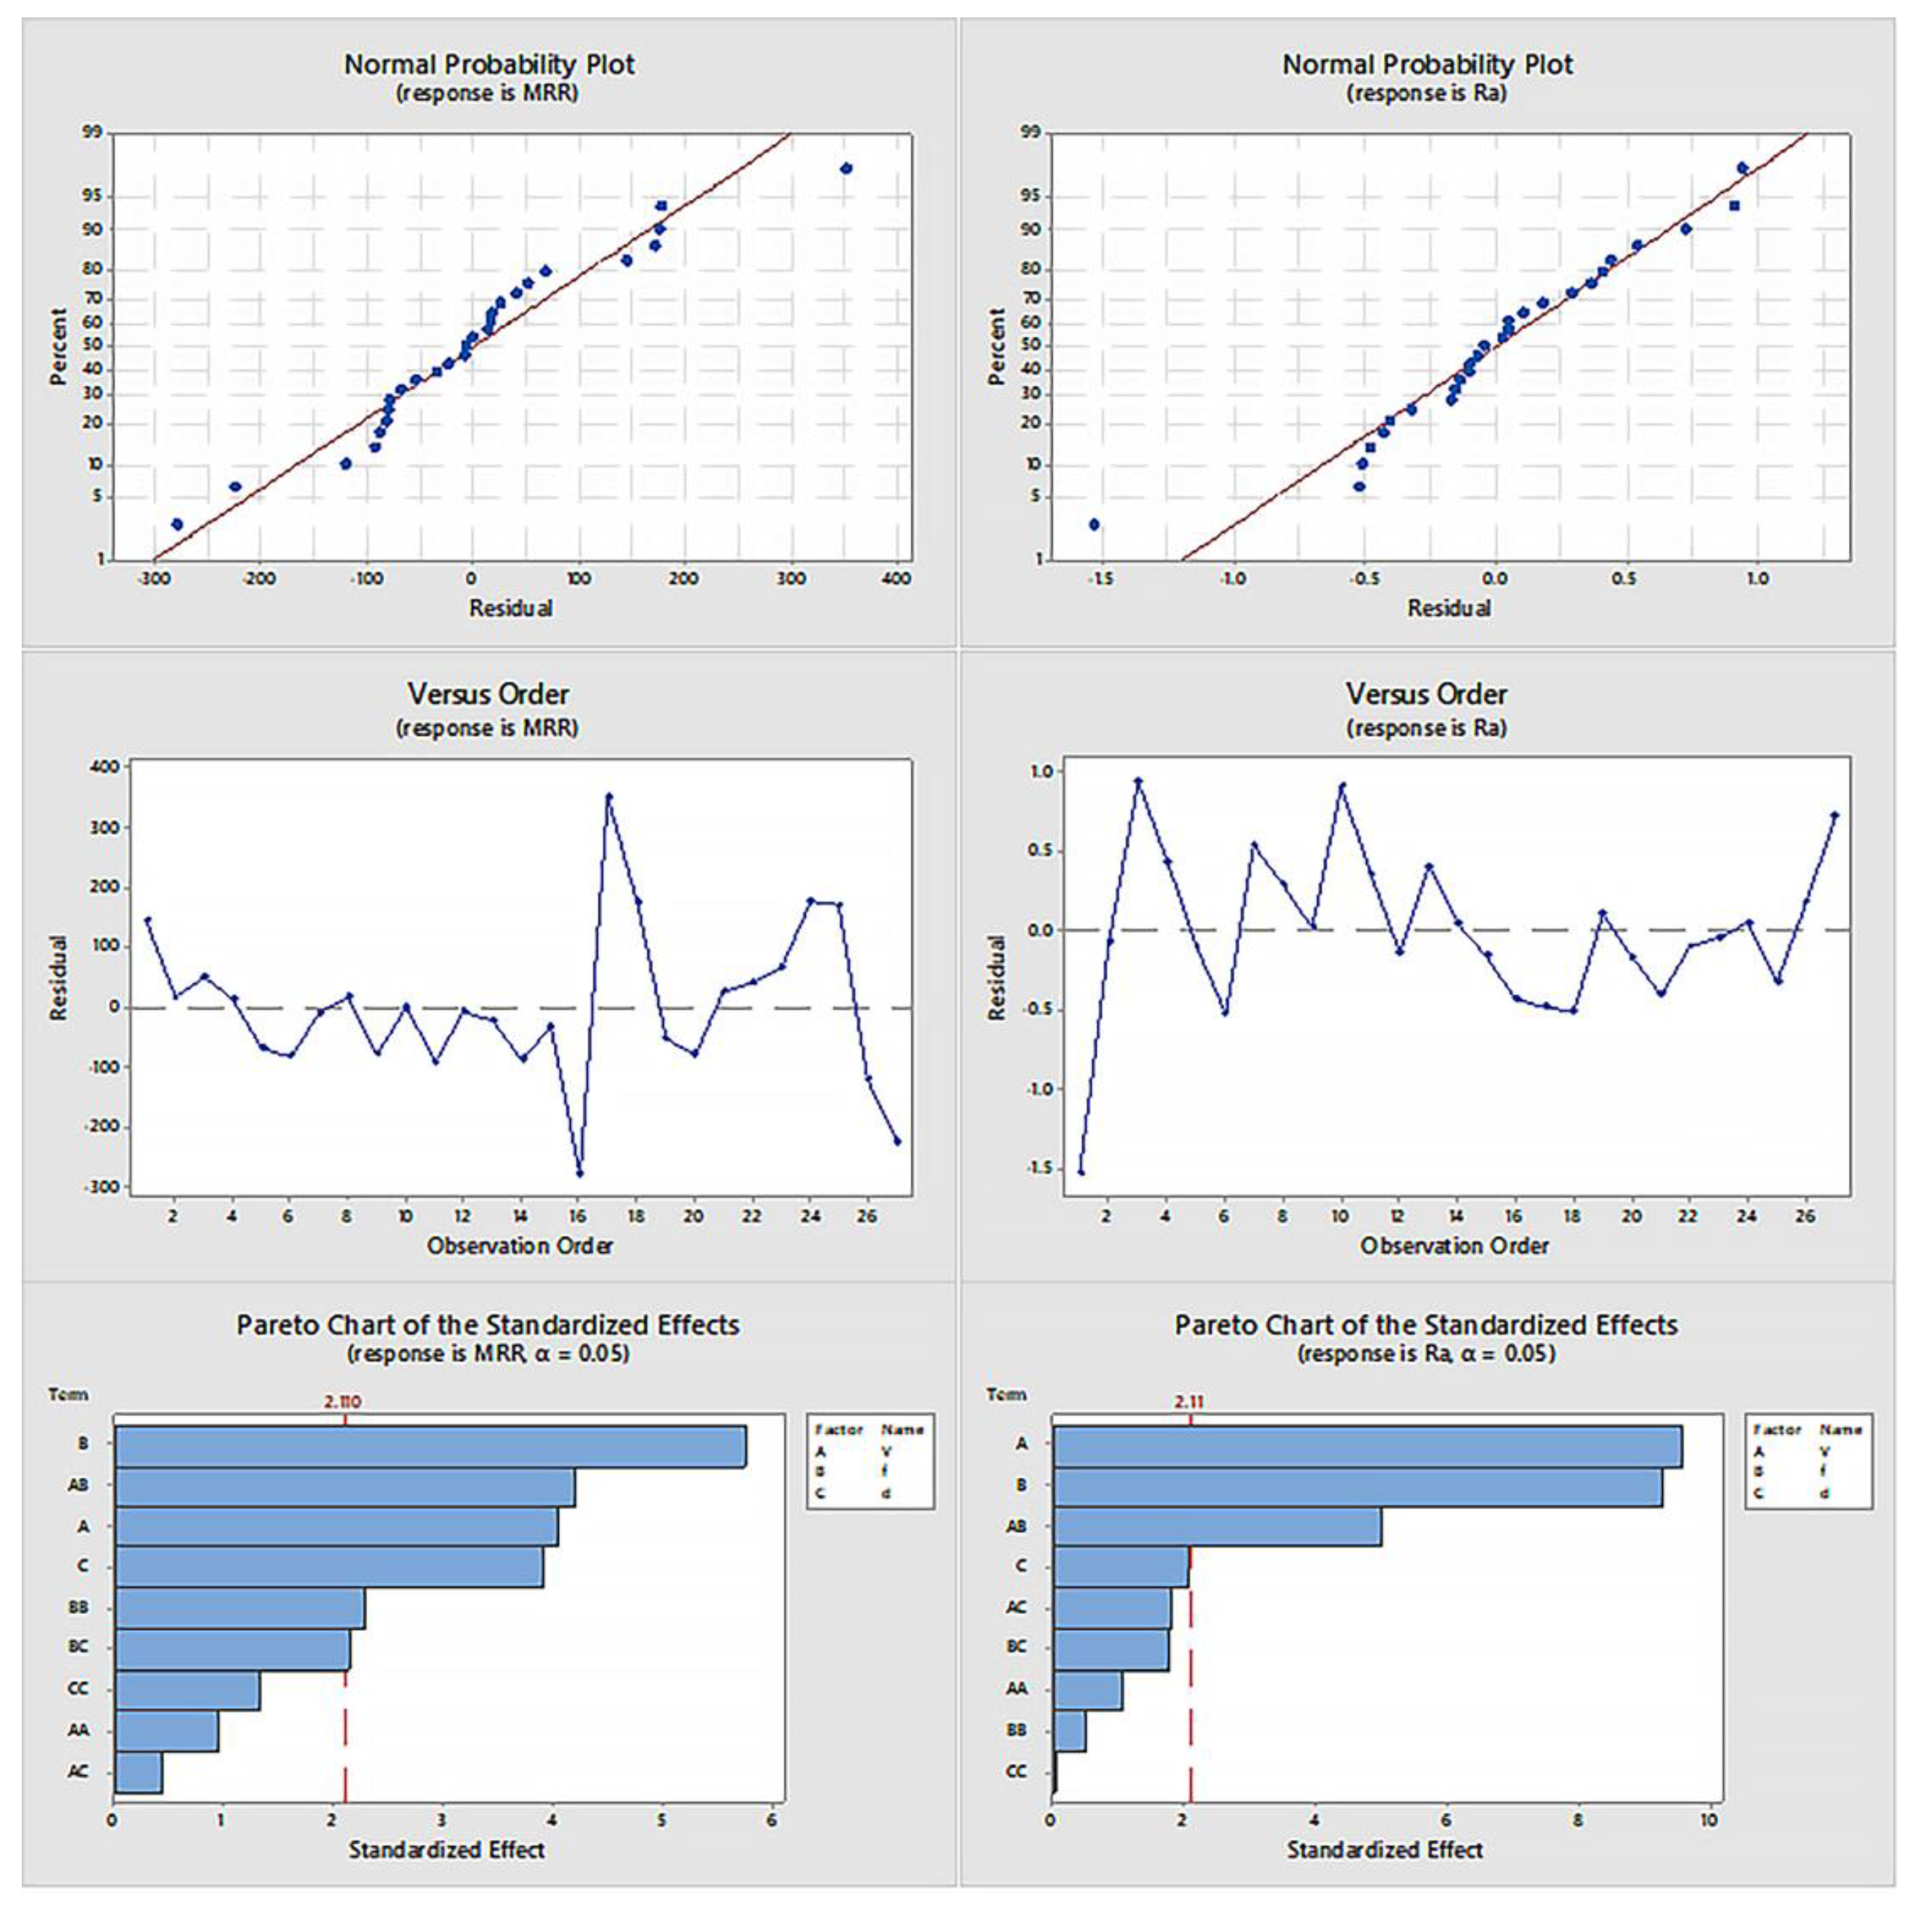
The residual plots for surface roughness (Ra) and material removal rate (MRR) at the 1.5% ZnO condition in
Figure 14 indicate a strong model fit. The
normal probability plots show that most residuals lie close to the straight line, suggesting that the errors are normally distributed. The
versus order plots display randomness in residual distribution, confirming the absence of patterns over time, which implies stability in the experimental setup. The
Pareto charts highlight the significant factors for both Ra and MRR. For MRR, the feed rate (B) and its interaction with spindle speed (AB) dominate, while for Ra, spindle speed (A) has the most substantial effect.
4.3. Prediction of Surface Roughness and Material Removal Rate Using Different Machine Learning Models
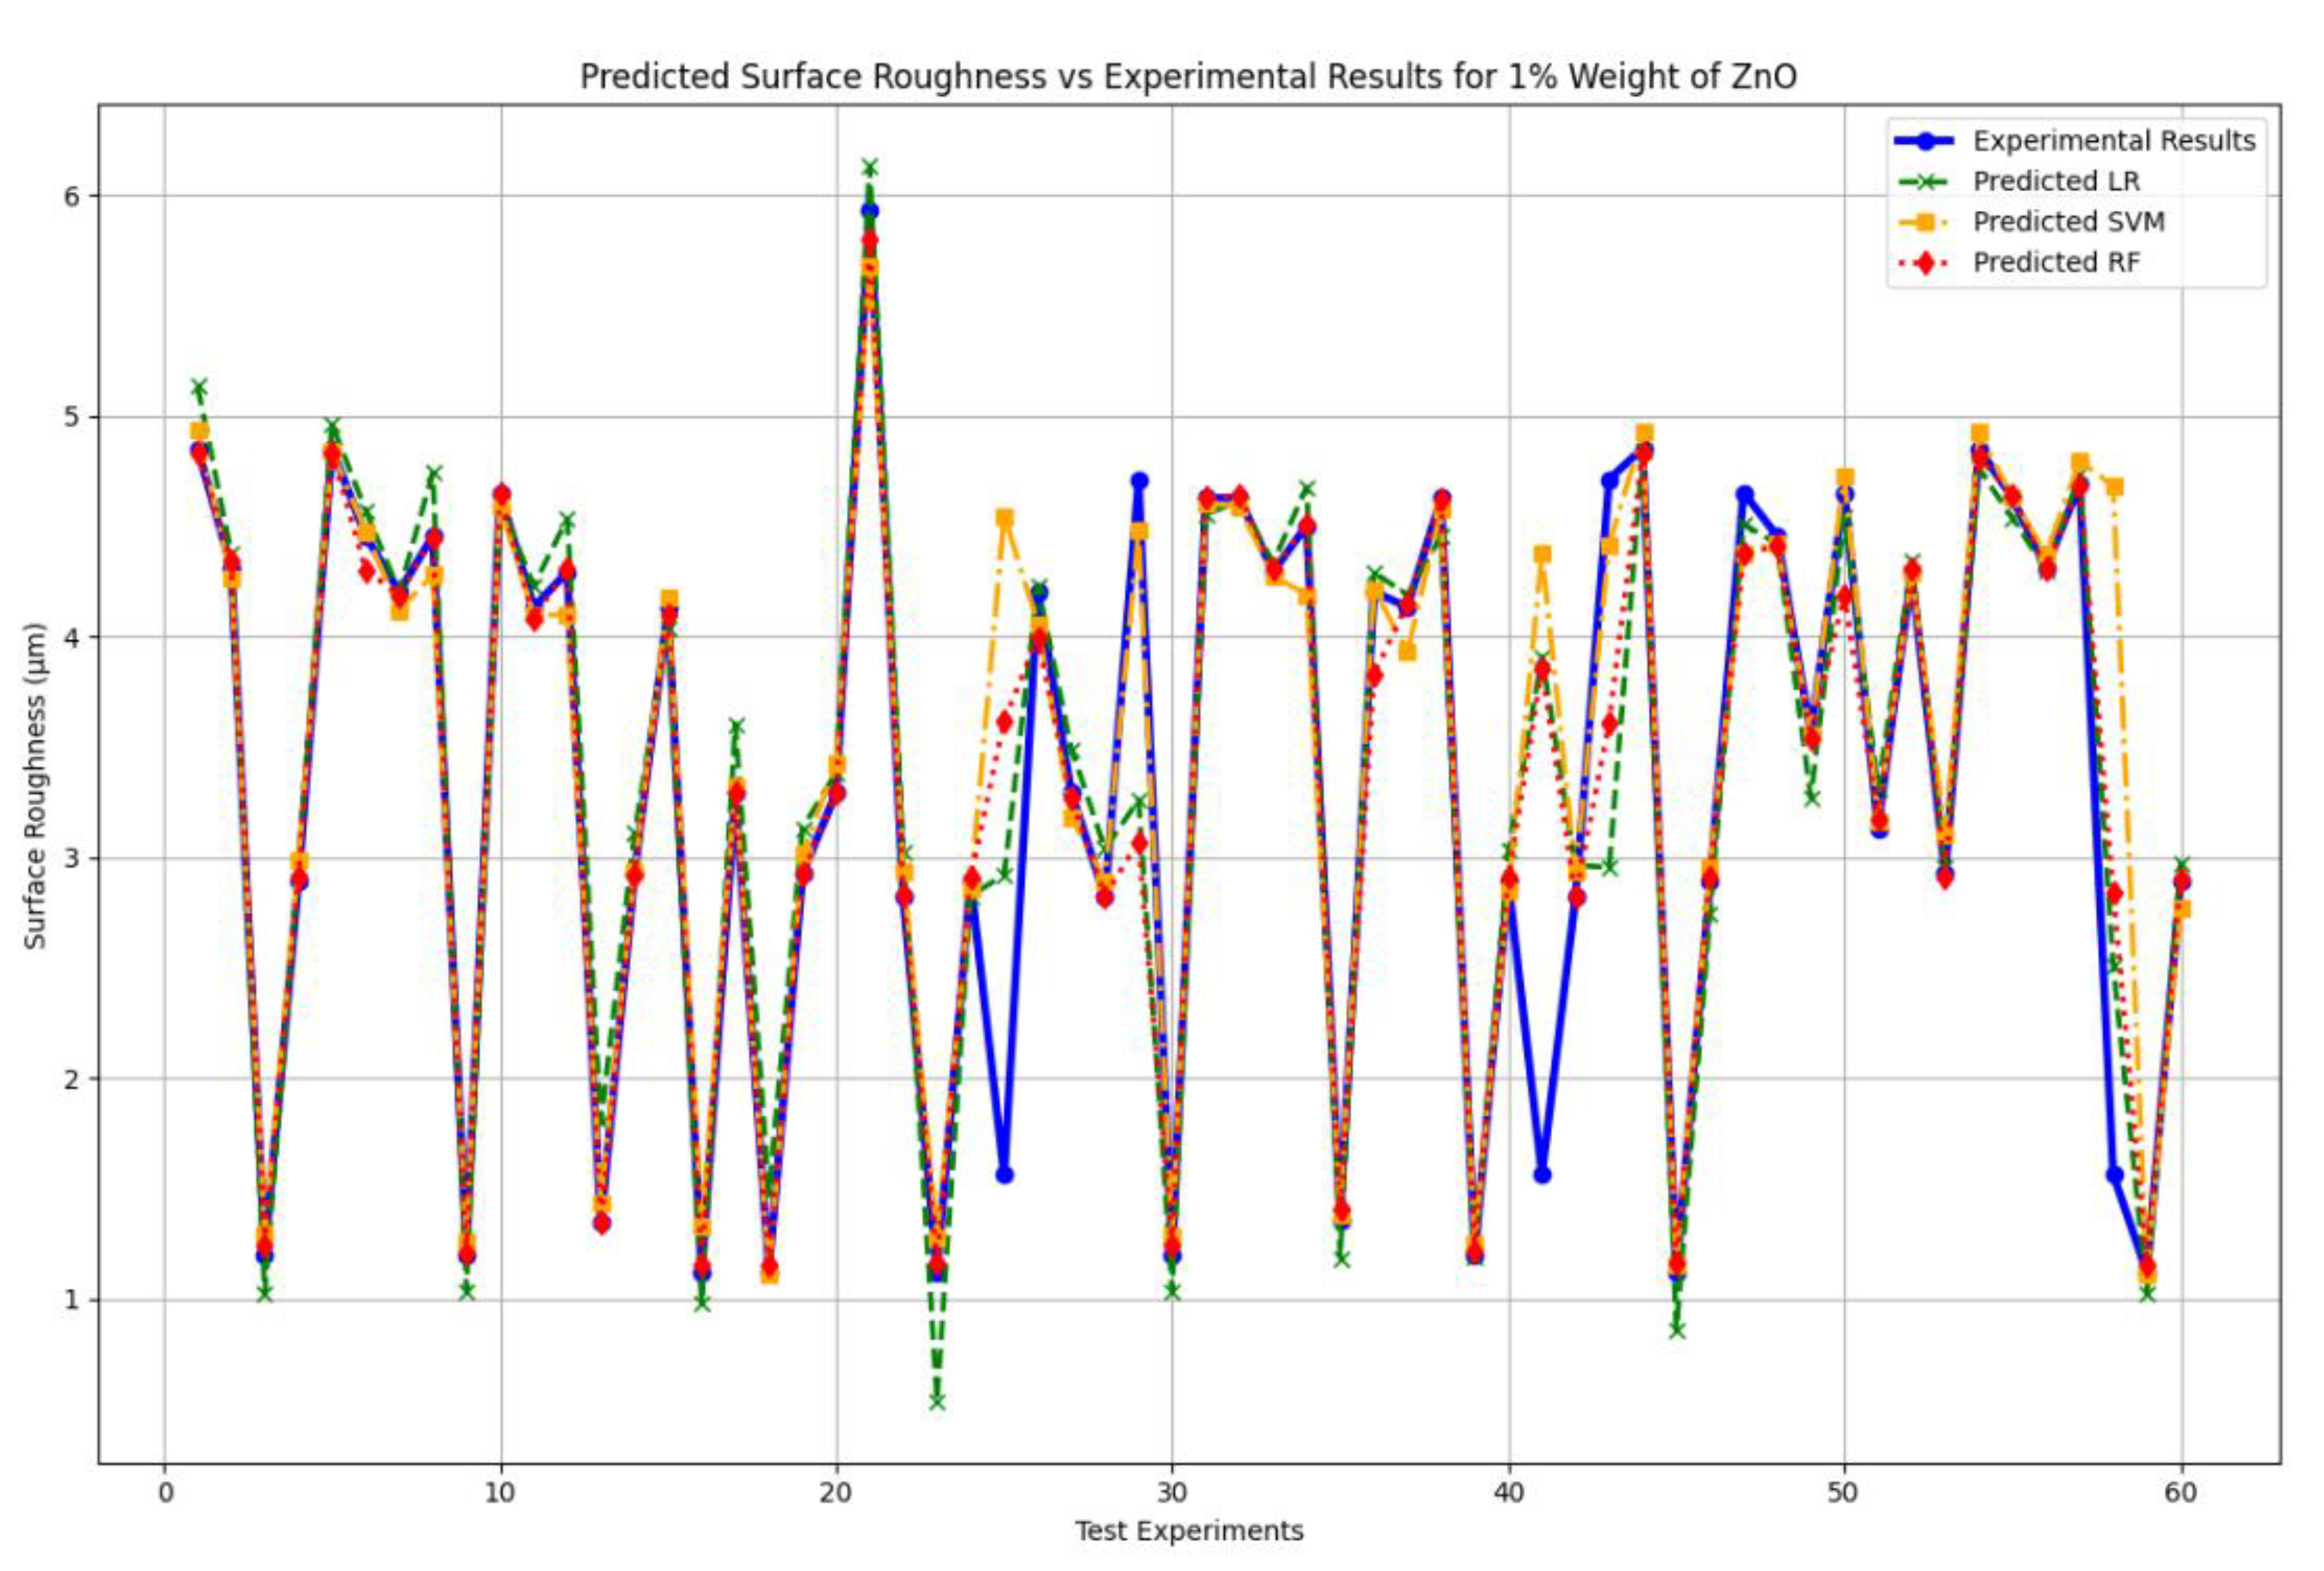
The surface roughness obtained from the milling operation was predicted using three different regression-based machine-learning models: Linear Regression, Support Vector Machine (SVM), and Random Forest (RF). The dataset consists of 27 data points, which were utilized for both model creation and evaluation. Two-thirds (2/3) of the data were randomly selected for model training, while the remaining one-third was reserved for model validation and testing. In predicting surface roughness, three input variables were used: feed rate, depth of cut and spindle speed. To minimize potential errors due to unit differences among the input parameters, scaling was applied to both the training and testing datasets using standard scaling. Cross-validation was performed using GridSearchCV to determine the best parameters for each model, ensuring optimal performance. To monitor and mitigate the risk of underfitting or overfitting, both training and test errors were evaluated throughout the process. This methodical approach enabled accurate and reliable predictions of surface roughness based on the experimental data.
4.3.1. Analysis of Surface Roughness Using 1% Zinc Oxide (ZnO) Cutting Fluid
The surface roughness values were obtained from 27 experiments for the testing and training process. The different values predicted by the three models are presented in
Table 10. To judge the accuracy of the predicted models, four performance indicators are used. The testing and training errors are shown in
Table 11. The significance of feed rate is encountered in the case of surface roughness as helicoid generation takes place and becomes broader and deeper when the feed rate is increased. The heat dissipation property is improved by using zinc oxide (ZnO) cutting fluid as it enhances lubrication as well as wetting characteristics on the rake face of the cutting tool.
Table 10 shows that there is a mixed deviation of prediction values from the experimental values. But RF is significantly slightly closer to experimental values than other models.
From the four evaluation measurements, RF is best over here. Because it has the highest R2 value, highest Cross-validated R-square, moderated MSE, lowest MAPE, and moderate EVS value.
4.3.2. Analysis of Material Removal Rate using 1% Zinc Oxide (ZnO) Cutting Fluid
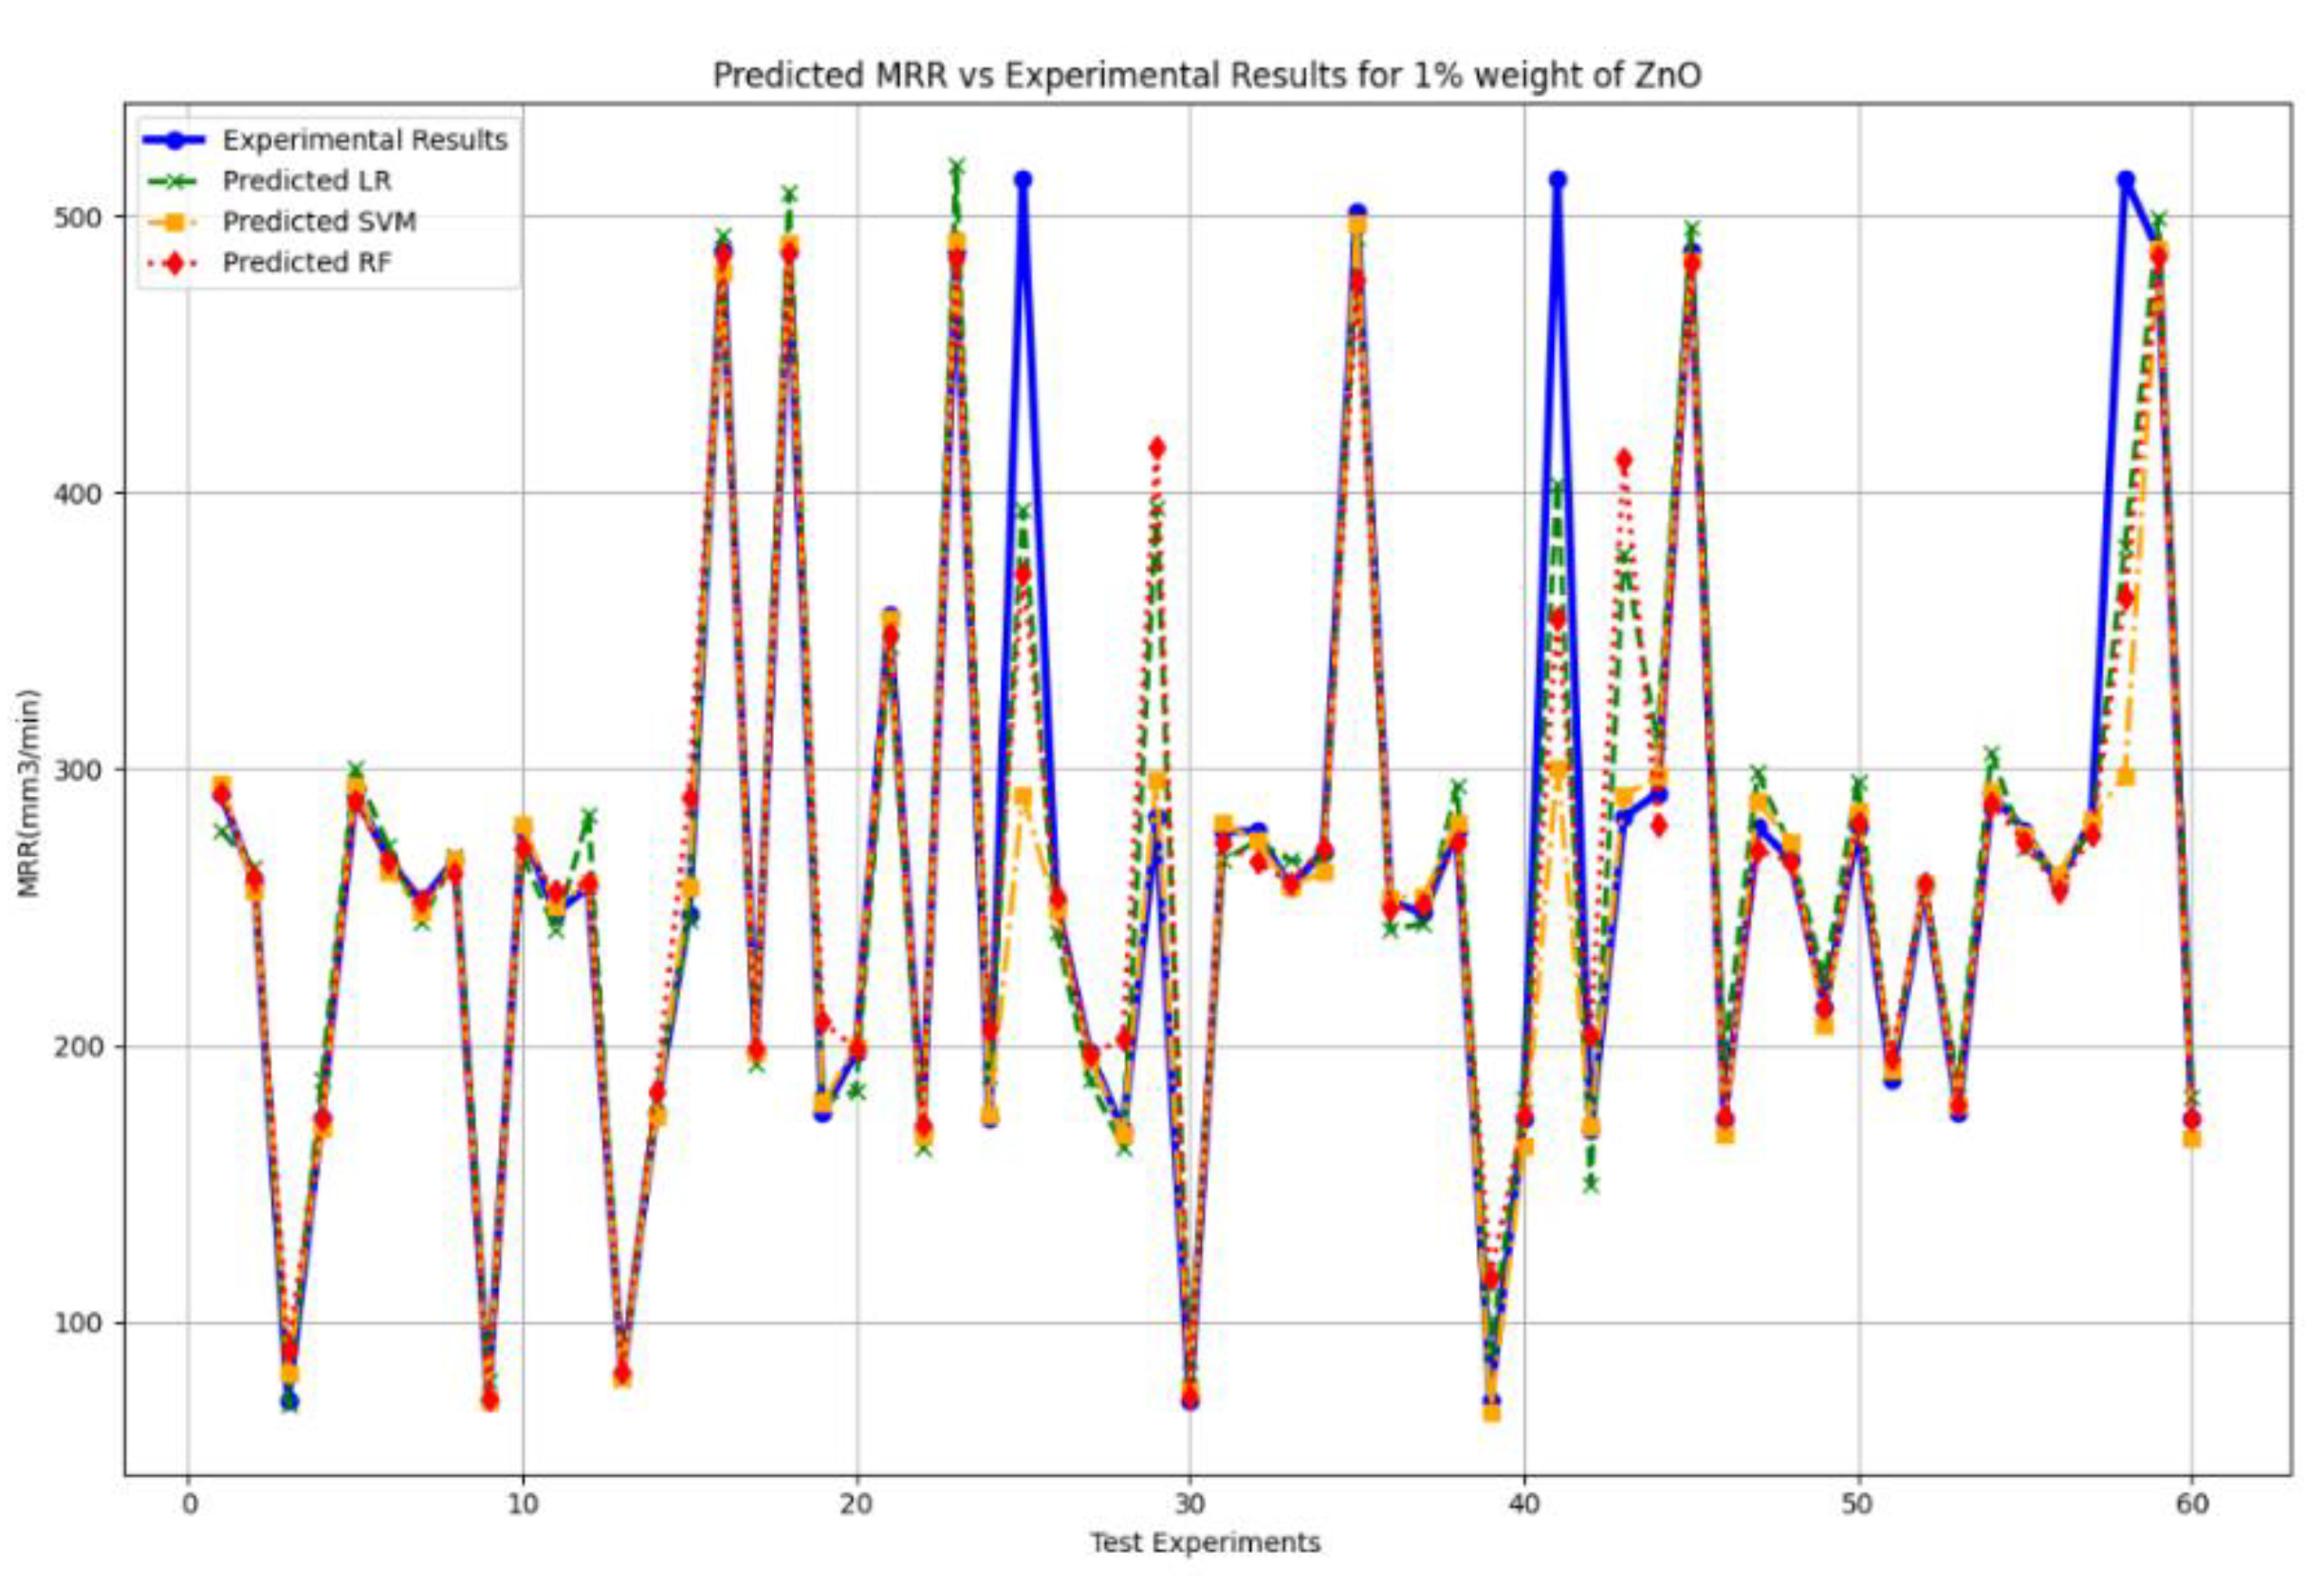
Table 12 shows that there is a mixed deviation of prediction values from the experimental values. But RF is significantly slightly closer to experimental values than other models. The testing and training errors are shown in
Table 13
From the four evaluation measurements, RF is also best over here. Because it has the highest R2 value, highest Cross-validated R-square, moderated MSE, lowest MAPE, and moderate EVS value.
Figure 16.
Material removal rate Predicted value from three machine learning models for at 1% (weight) zinc oxide (ZnO) cutting fluid.
Figure 16.
Material removal rate Predicted value from three machine learning models for at 1% (weight) zinc oxide (ZnO) cutting fluid.
4.3.3. Analysis of Surface Roughness Using 1.5% Zinc Oxide (ZnO) Cutting Fluid
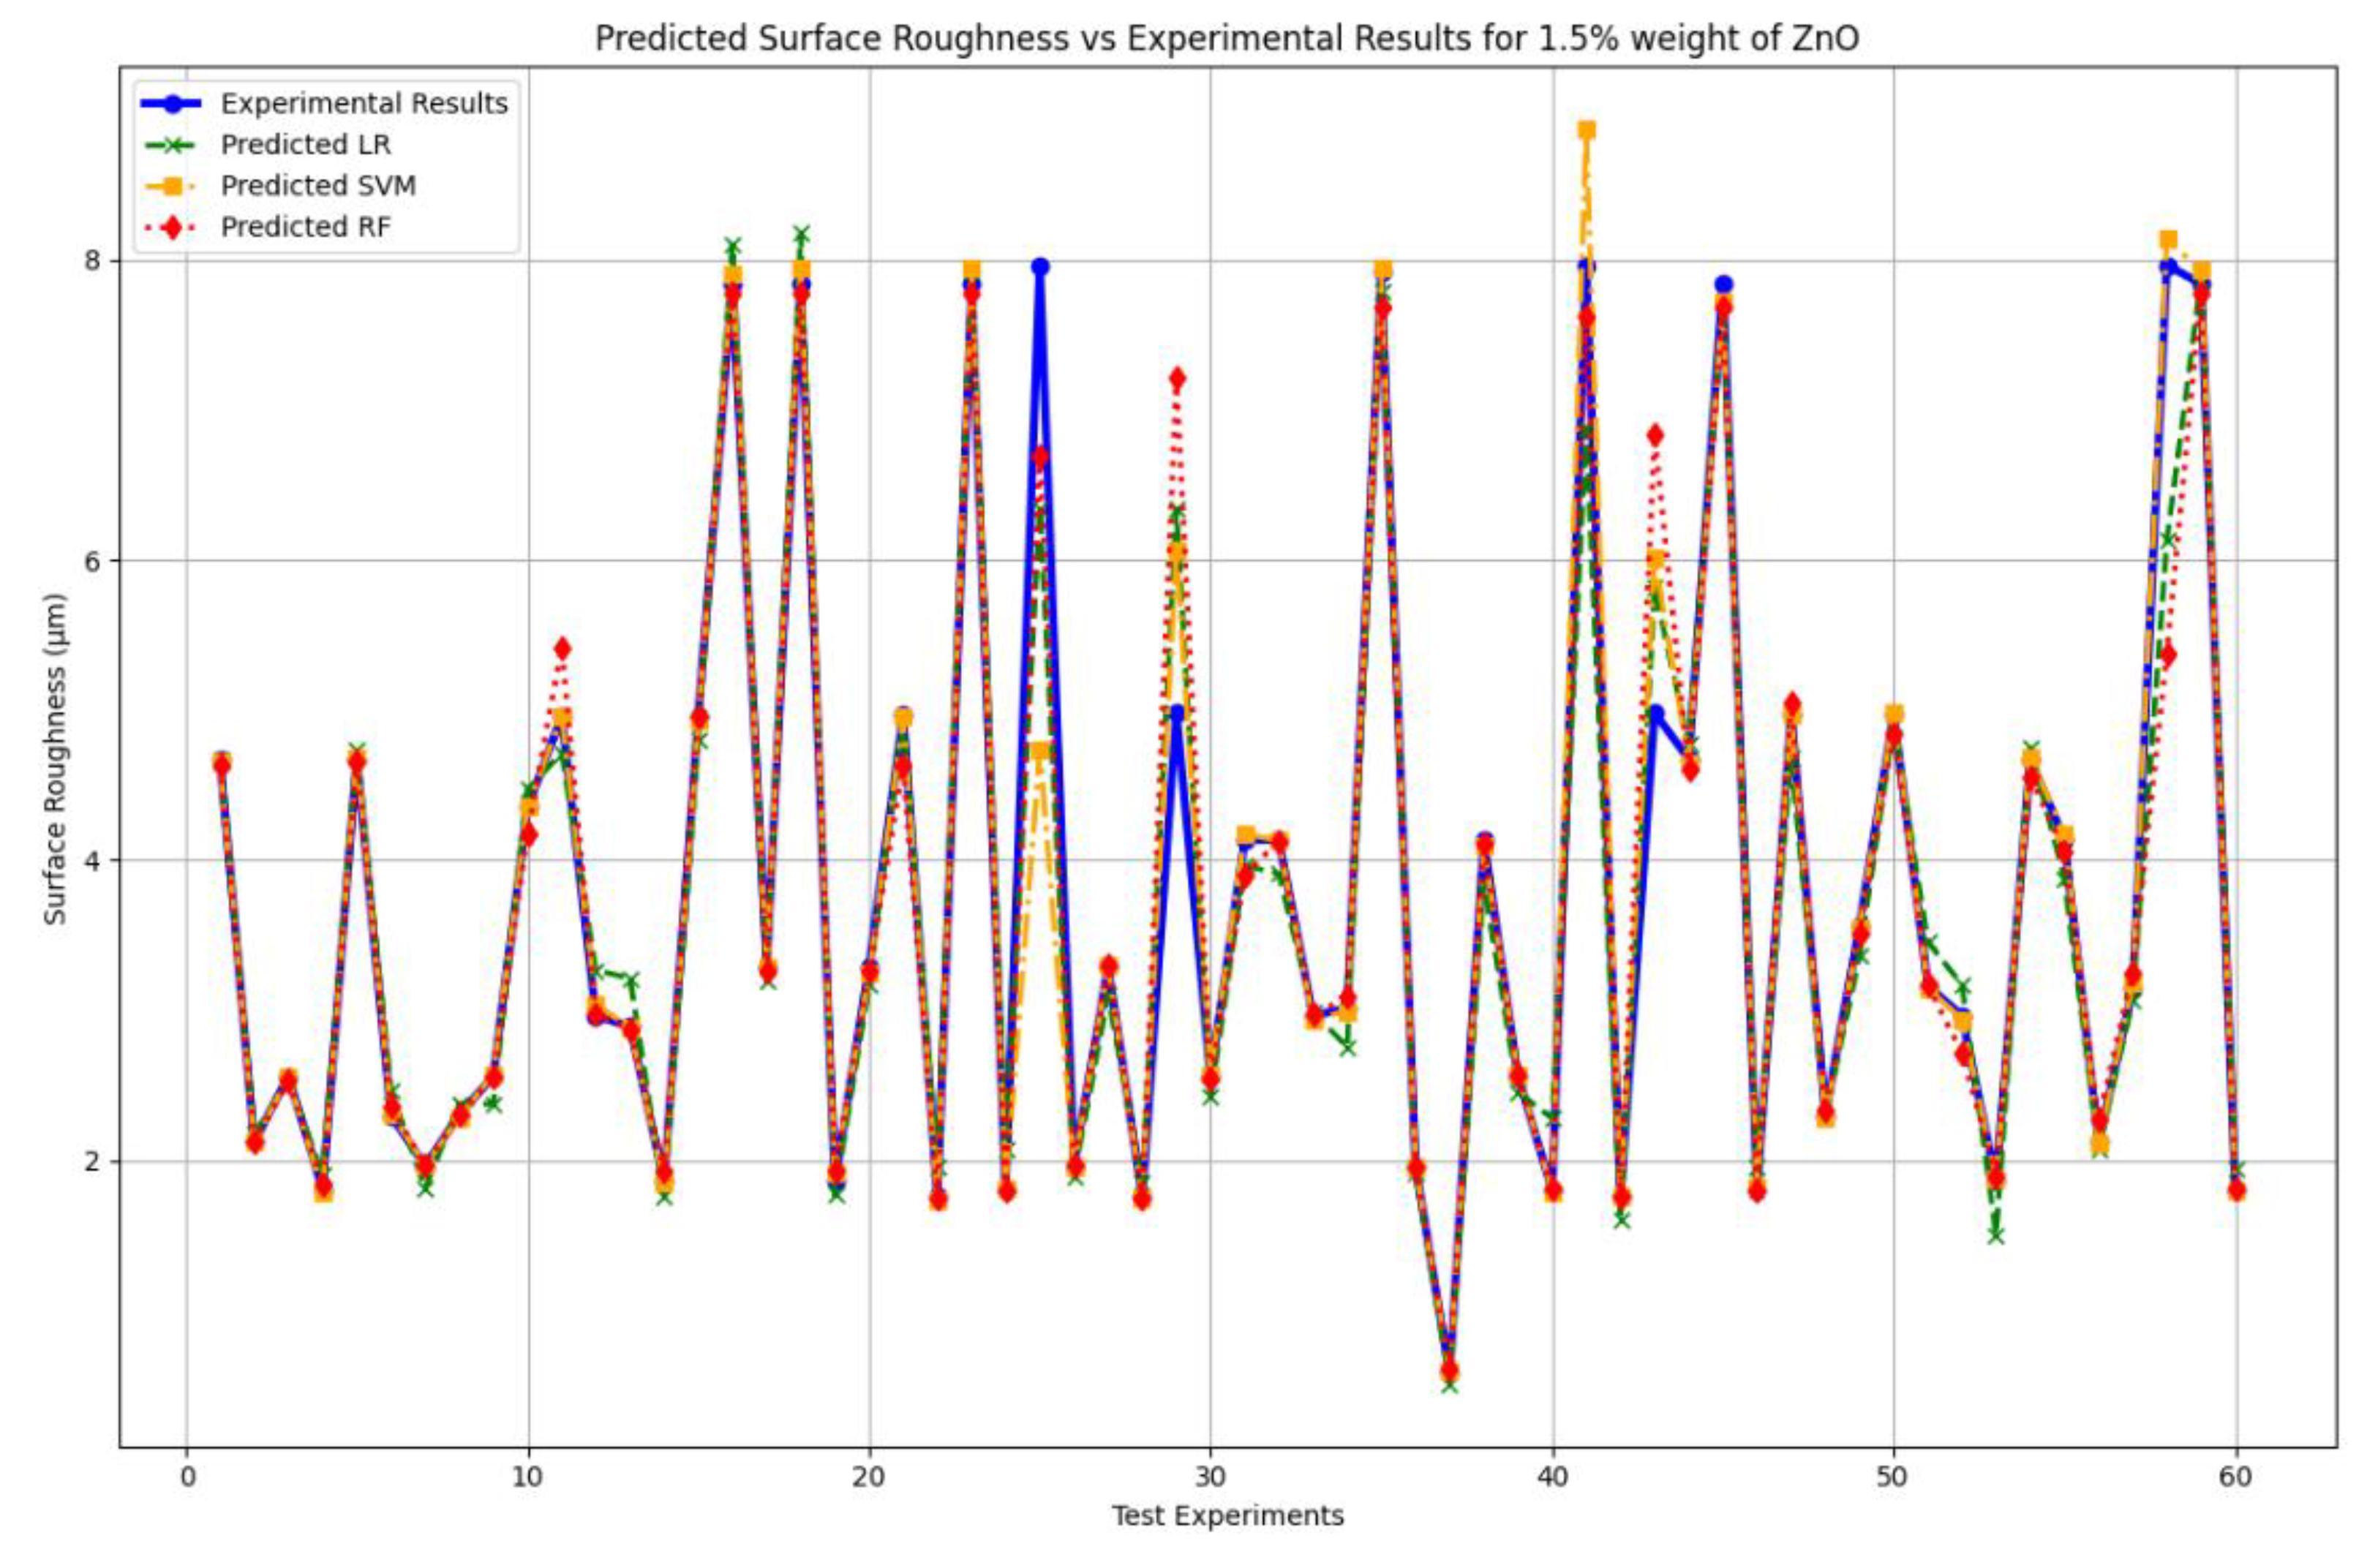
Table 14 shows that RF is closer to experimental values than other models.
Table 15 shows that RF is also best over here. Because it has the highest R2 value which is conjugated to the Cross-validated R-square, lowest MSE, lowest MAPE, and highest EVS value.
Figure 17.
Surface roughness Predicted value from three machine learning models for at 1.5 % (weight) zinc oxide (ZnO) cutting fluid.
Figure 17.
Surface roughness Predicted value from three machine learning models for at 1.5 % (weight) zinc oxide (ZnO) cutting fluid.
4.3.4. Analysis of Material Removal Rate Using 1.5% Zinc Oxide (ZnO) Cutting Fluid
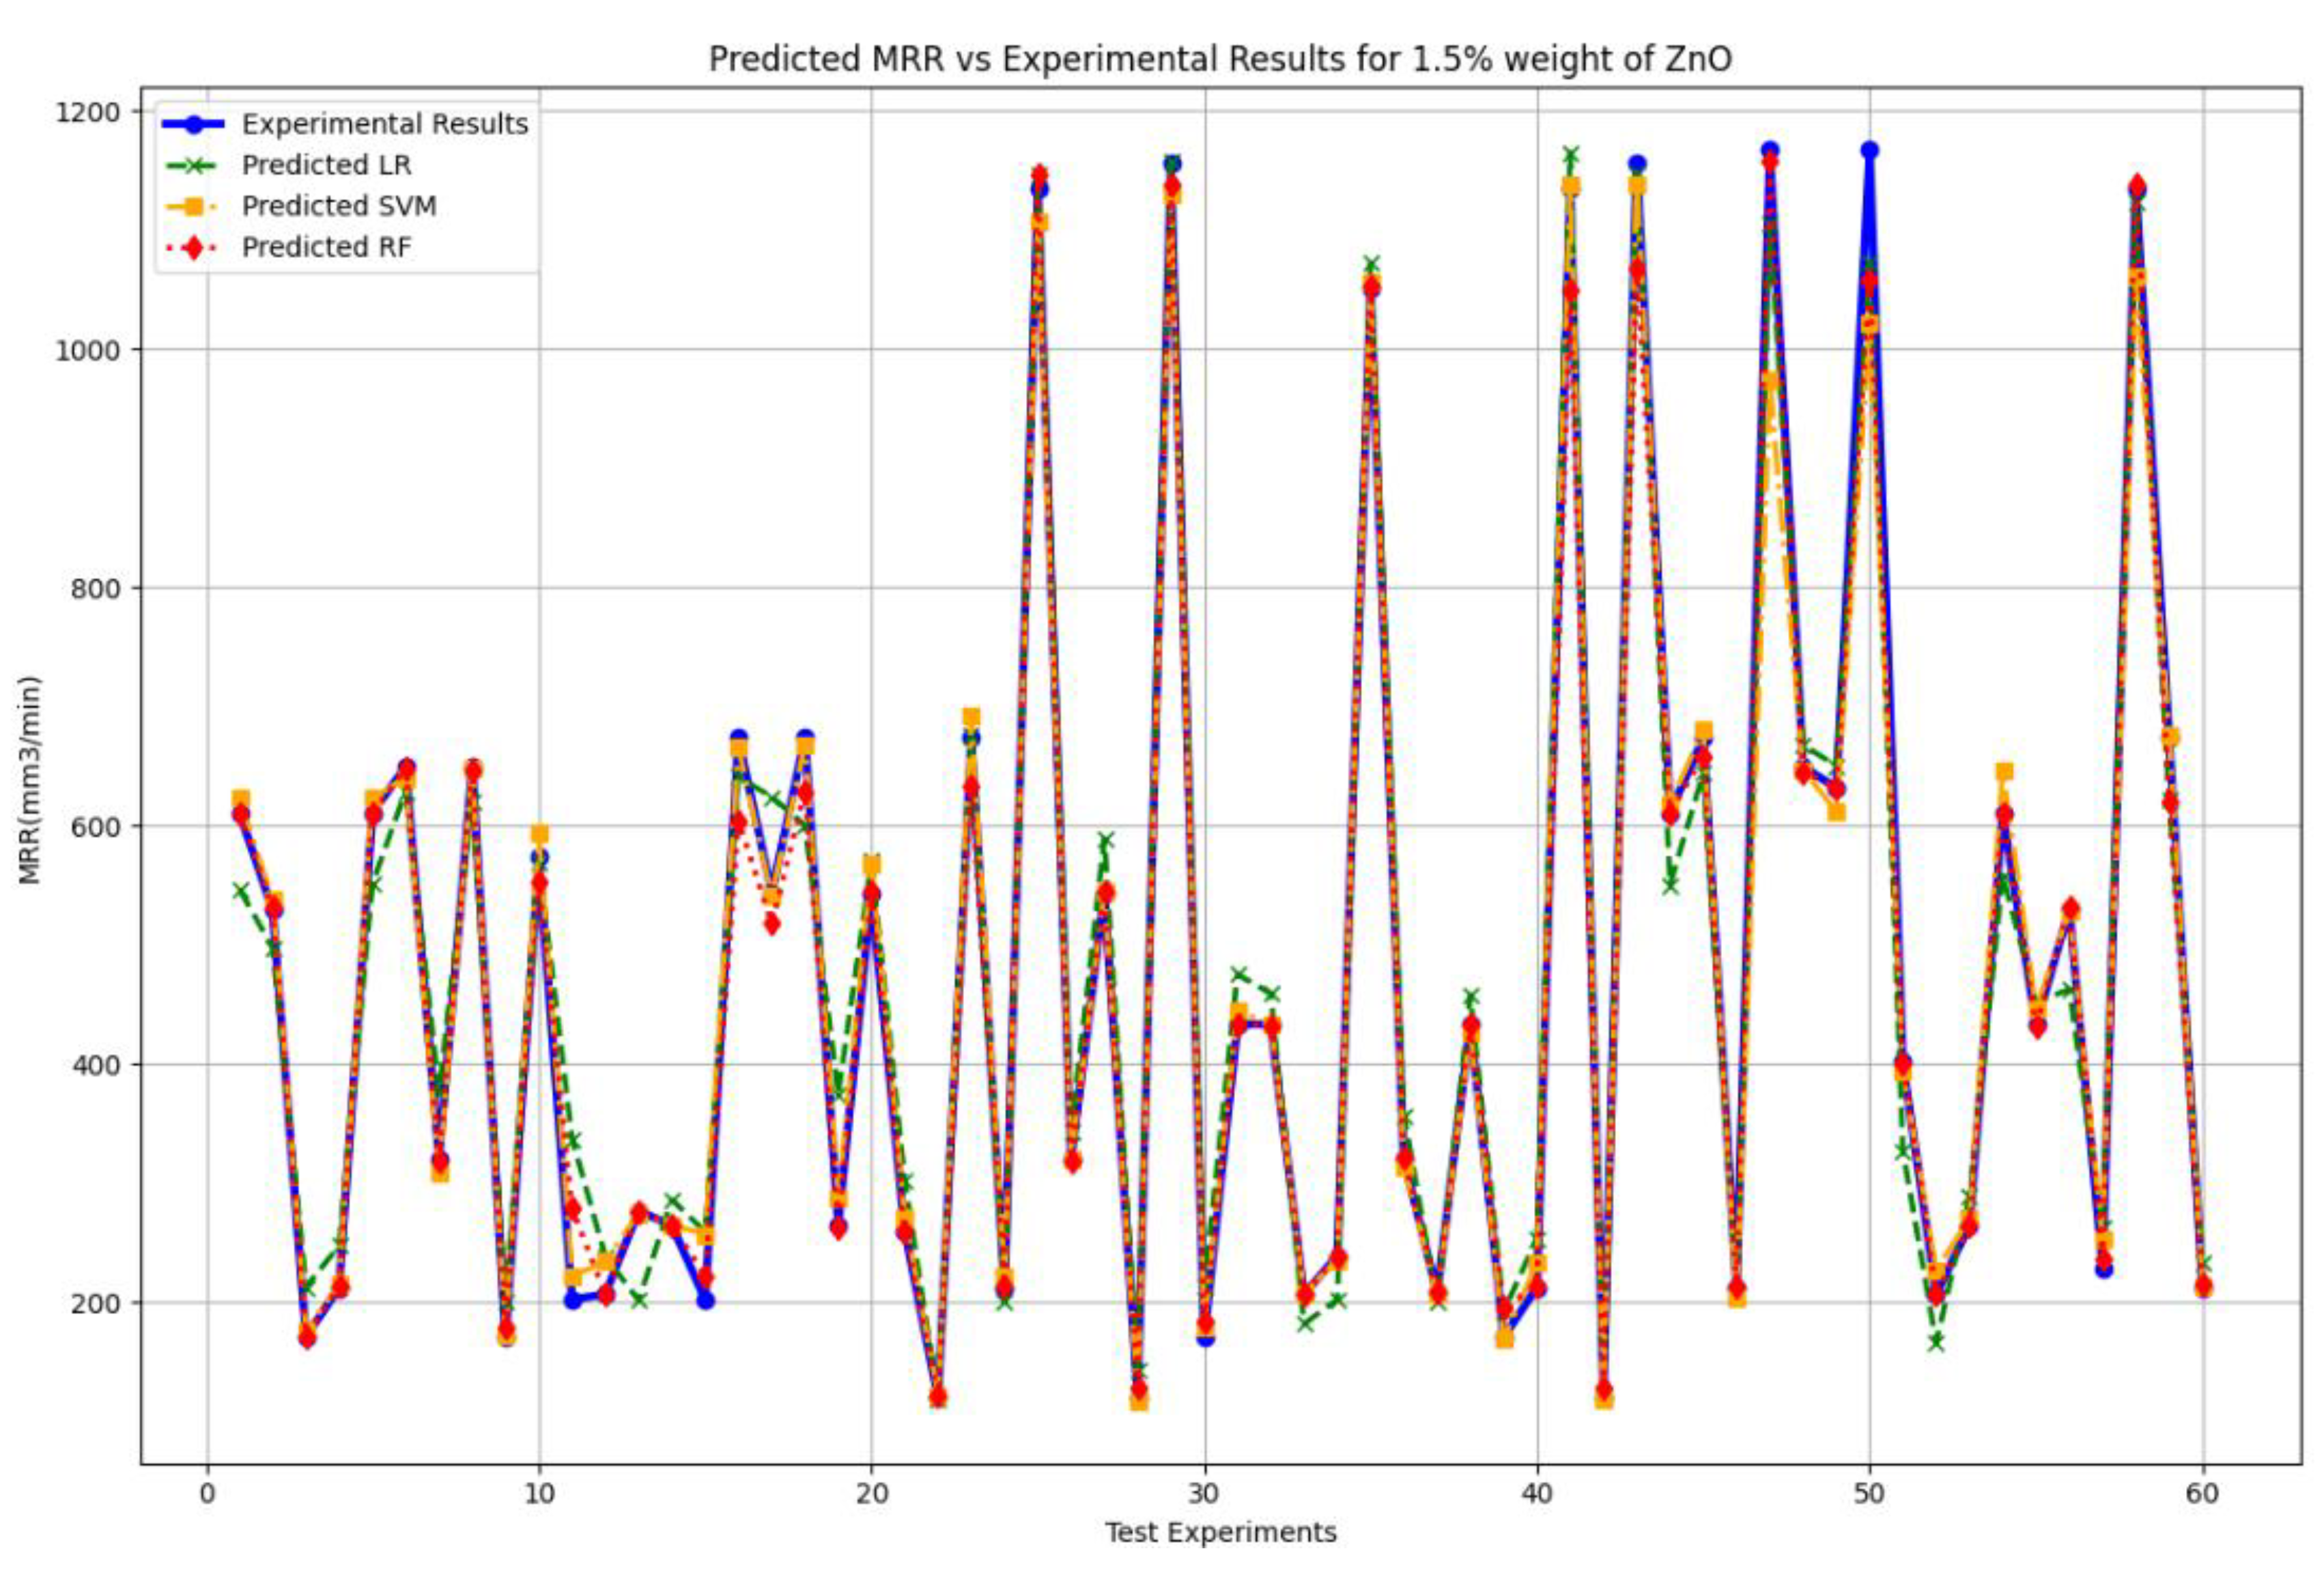
Table 16 shows that RF is significantly closer to experimental values than other models.
Table 17 shows that RF is also best over here. Because it has the highest R2 value, which is about the same as the Cross-validated R-square, moderate but acceptable MSE, lowest MAPE, and highest EVS value.
So, from the prediction value tables and evaluation metrics table, we can say that RF is best for predicting SR and MRR using 1.5% ZnO
Figure 18.
Material removal rate Predicted value from three machine learning models for at 1.5% (weight) zinc oxide (ZnO) cutting fluid.
Figure 18.
Material removal rate Predicted value from three machine learning models for at 1.5% (weight) zinc oxide (ZnO) cutting fluid.
5. Conclusions
The study focused on developing and analyzing a sunflower oil-based cutting fluid enhanced with zinc oxide (ZnO) nanoparticles for use in vertical milling. This innovative approach aimed at improving the sustainability of cutting fluids while enhancing machining performance. The experimental results showed that using ZnO nanoparticles at concentrations of 1% and 1.5% significantly improved both the material removal rate (MRR) and surface roughness (Ra). The statistical analysis using Response Surface Methodology (RSM) demonstrated that spindle speed and feed rate were the most influential factors on machining performance, with surface roughness being minimized at higher spindle speeds and MRR being maximized at higher feed rates. Specifically, a spindle speed of 408 rpm and a feed rate of 146 mm/min yielded optimal results, producing a well-optimized surface roughness of 3.53 µm with an MRR of 778 mm³/min in the 1.5% ZnO concentration. This demonstrates that higher nanoparticle concentrations further stabilize the cutting fluid and enhance its cooling and lubricating properties.
In addition to the RSM analysis, machine learning models such as Linear Regression (LR), Support Vector Machine (SVM), and Random Forest (RF) were employed to predict surface roughness and MRR. Among the models, the Random Forest model achieved the highest predictive accuracy, emphasizing its suitability for this application. The study’s regression models showed high R² values of over 90%, confirming the robustness of the models in capturing the relationships between the machining parameters and performance indicators. Residual plots and optimization charts further validated the adequacy of these models, showing normally distributed errors and confirming stability in the experimental setup. Overall, this research indicates that sunflower oil-based nano-cutting fluids are a viable, eco-friendly alternative to conventional fluids, offering significant improvements in machining efficiency and product quality without compromising environmental sustainability.
References
- Rajmohan, T. , et al. Eco friendly machining processes for sustainability-review. in IOP Conference Series: Materials Science and Engineering. 2020. IOP Publishing.
- Ngoc, T.B. , et al., Machinability assessment of hybrid nano cutting oil for minimum quantity lubrication (MQL) in hard turning of 90CrSi steel. Lubricants 2023, 11, 54. [Google Scholar] [CrossRef]
- Srinivas, M.S. , et al., Green lubricants in action: a comprehensive performance evaluation of groundnut oil-based cutting fluids in metal machining processes. Physica Scripta 2024, 99, 065008. [Google Scholar] [CrossRef]
- Hegab, H. , et al., Toward sustainable future: Strategies, indicators, and challenges for implementing sustainable production systems. Sustainable Materials and Technologies 2023, 36, e00617. [Google Scholar] [CrossRef]
- Afonso, I.S. , et al., Conventional and recent advances of vegetable oils as metalworking fluids (MWFs): a review. Lubricants 2023, 11, 160. [Google Scholar] [CrossRef]
- Mustafa, S.E. , et al., Formulation and analysis of cost-effective environment-friendly metal cutting nanofluids using zinc oxide on turning of AISI 52100 steel using MQL. Engineering Research Express 2021, 3, 015005. [Google Scholar] [CrossRef]
- Naim Shaikh, M.B. , et al., Improving the performance of cutting fluids by using ZnO and ZrO2 nanoparticles. Proceedings of the Institution of Mechanical Engineers, Part N: Journal of Nanomaterials, Nanoengineering and Nanosystems 2024, 23977914241263453. [Google Scholar] [CrossRef]
- Vignesh, S. and U.M. Iqbal, Preparation and characterization of bio-based nano cutting fluids for tribological applications. Journal of Dispersion Science and Technology 2023, 44, 1725–1737. [Google Scholar] [CrossRef]
- Ben Said, L. , et al., Application of nanofluids as cutting fluids in machining operations: A brief review. Applied Nanoscience 2023, 13, 4247–4278. [Google Scholar] [CrossRef]
- Machado, A.R. , et al., Comprehensive review of advanced methods for improving the parameters of machining steels. Journal of Manufacturing Processes 2024, 125, 111–142. [Google Scholar] [CrossRef]
- Ercetin, A. , et al., Optimization of machining parameters to minimize cutting forces and surface roughness in micro-milling of Mg13Sn alloy. Micromachines 2023, 14, 1590. [Google Scholar] [CrossRef]
- Veza, I. , et al., Response surface methodology (RSM) for optimizing engine performance and emissions fueled with biofuel: Review of RSM for sustainability energy transition. Results in Engineering 2023, 18, 101213. [Google Scholar] [CrossRef]
- Taye, M.M. , Understanding of machine learning with deep learning: architectures, workflow, applications and future directions. Computers 2023, 12, 91. [Google Scholar] [CrossRef]
- Rajasozhaperumal, G. and C. Kannan, Influence of fatty acid composition on the tribological performance of methyl esters under boundary lubrication regime. Arabian Journal for Science and Engineering 2023, 48, 3581–3597. [Google Scholar] [CrossRef]
- Darminesh, S.P. , et al., Recent development on biodegradable nanolubricant: A review. International Communications in Heat and Mass Transfer 2017, 86, 159–165. [Google Scholar] [CrossRef]
- HSE, Health risks from metalworking fluids—aspects of good machine design. Ind (G) 167 L 1994,.
- Zeman, A. , et al., Biodegradable lubricants—studies on thermo-oxidation of metal-working and hydraulic fluids by differential scanning calorimetry (DSC). Thermochimica Acta 1995, 268, 9–15. [Google Scholar] [CrossRef]
- Panchal, T.M. , et al., A methodological review on bio-lubricants from vegetable oil based resources. Renewable and Sustainable Energy Reviews 2017, 70, 65–70. [Google Scholar] [CrossRef]
- Jayadas, N. and K.P. Nair, Coconut oil as base oil for industrial lubricants—evaluation and modification of thermal, oxidative and low temperature properties. Tribology international 2006, 39, 873–878. [Google Scholar] [CrossRef]
- Zareh-Desari, B. and B. Davoodi, Assessing the lubrication performance of vegetable oil-based nano-lubricants for environmentally conscious metal forming processes. Journal of Cleaner Production 2016, 135, 1198–1209. [Google Scholar] [CrossRef]
- Pal, A., S. S. Chatha, and H.S. Sidhu, Tribological characteristics and drilling performance of nano-MoS2-enhanced vegetable oil-based cutting fluid using eco-friendly MQL technique in drilling of AISI 321 stainless steel. Journal of the Brazilian Society of Mechanical Sciences and Engineering 2021, 43, 189. [Google Scholar] [CrossRef]
- Cortes, V. , et al., The performance of SiO2 and TiO2 nanoparticles as lubricant additives in sunflower oil. Lubricants 2020, 8, 10. [Google Scholar] [CrossRef]
- Huda, Z. and Z. Huda, Materials in engineering. Mechanical Behavior of Materials: Fundamentals, Analysis, and Calculations 2022, 81–106. [Google Scholar]
- Janardhan, M. and A.G. Krishna, Multi-objective optimization of cutting parameters for surface roughness and metal removal rate in surface grinding using response surface methodology. International Journal of Advances in Engineering & Technology 2012, 3, 270. [Google Scholar]
- D’mello, G., P. S. Pai, and A. Prashanth, Surface roughness analysis in high speed turning of Ti-6Al-4V using coated carbide inserts: experimental and modeling studies. Tribology in Industry 2018, 40, 457. [Google Scholar] [CrossRef]
- Patil, S. , et al., Optimization of surface roughness in milling of EN 24 steel with WC-Coated inserts using response surface methodology: analysis using surface integrity microstructural characterizations. Frontiers in Materials 2024, 11, 1269608. [Google Scholar] [CrossRef]
- Phokobye, S.N. , et al., Comparative investigation and optimization of cutting tools performance during milling machining of titanium alloy (Ti6Al4V) using response surface methodology. The International Journal of Advanced Manufacturing Technology 2024, 131, 3565–3577. [Google Scholar] [CrossRef]
- Sana, M. , et al., Machine learning for multi-dimensional performance optimization and predictive modelling of nanopowder-mixed electric discharge machining (EDM). The International Journal of Advanced Manufacturing Technology 2024, 130, 5641–5664. [Google Scholar] [CrossRef]
- Pashankar, S.S., J. D. Shendage, and J. Pawar, Machine Learning Techniques For Stock Price Prediction-A Comparative Analysis Of Linear Regression, Random Forest, And Support Vector Regression. Journal of Advanced Zoology 2024, 45. [Google Scholar]
- Khuri, A.I. and S. Mukhopadhyay, Response surface methodology. WIREs Computational Statistics 2010, 2, 128–149. [Google Scholar] [CrossRef]
- Zheng Yang, K. , et al., Application of coolants during tool-based machining – A review. Ain Shams Engineering Journal 2023, 14, 101830. [Google Scholar] [CrossRef]
- Zeb, A. , A comprehensive review on different classes of polyphenolic compounds present in edible oils. Food Research International 2021, 143, 110312. [Google Scholar] [CrossRef]
- Ghosh, S. , et al., Synthesis of ZnO nanoparticles by co-precipitation technique and characterize the structural and optical properties of these nanoparticles. Journal of Physics: Conference Series 2022, 2349, 012014. [Google Scholar] [CrossRef]
- Castro, R.H. , et al. Experimental Investigation of the Viscosity and Stability of Scleroglucan-Based Nanofluids for Enhanced Oil Recovery. Nanomaterials 2024, 14. [Google Scholar] [CrossRef] [PubMed]
- Hafez, K.M. , et al., Microstructure and mechanical properties of laser welded dual phase and mild steel joints for automotive applications. Applied Mechanics and Materials 2017, 865, 81–87. [Google Scholar] [CrossRef]
- Shwetha, K. Praveen, and B.K. Devendra, A review on corrosion inhibitors: types, mechanisms, electrochemical analysis, corrosion rate and efficiency of corrosion inhibitors on mild steel in an acidic environment. Results in Surfaces and Interfaces 2024, 100258. [Google Scholar]
- Antony, J. , et al., Design of experiments in the service industry: a critical literature review and future research directions. The TQM Journal 2020, 32, 1159–1175. [Google Scholar] [CrossRef]
- Chelladurai, S.J.S. , et al., Optimization of process parameters using response surface methodology: A review. Materials Today: Proceedings 2021, 37, 1301–1304. [Google Scholar] [CrossRef]
- Kampezidou, S.I. , et al., Fundamental Components and Principles of Supervised Machine Learning Workflows with Numerical and Categorical Data. Eng 2024, 5, 384–416. [Google Scholar] [CrossRef]
- Kim, Y. , et al., A flexible empirical Bayes approach to multiple linear regression and connections with penalized regression. Journal of Machine Learning Research 2024, 25, 1–59. [Google Scholar]
- Mabrouk, B. , et al., A novel approach to enhance feature selection using linearity assessment with ordinary least squares regression for Alzheimer’s Disease stage classification. Multimedia Tools and Applications 2024, 1–20. [Google Scholar] [CrossRef]
- Szentesi, S.G. , et al. Standardization of Regression Equation Parameters in the Case of Multiple Linear Regression for an Econometric Model Development to Determine the Price of Apartments Standardization of Regression Equation Parameters in the Case of Multiple Linear Regression for an Econometric Model Development to Determine the Price of Apartments. in Proceedings of the International Conference on Business Excellence. 2024.
- Zhou, W., Z. Yan, and L. Zhang, A comparative study of 11 non-linear regression models highlighting autoencoder, DBN, and SVR, enhanced by SHAP importance analysis in soybean branching prediction. Scientific Reports 2024, 14, 5905. [Google Scholar] [CrossRef]
- Landuyt, D. , et al., A trait-based modelling approach towards dynamic predictions of understorey communities in temperate forests. Ecological Modelling 2024, 498, 110873. [Google Scholar] [CrossRef]
- Alghushairy, O. , et al., An Efficient Support Vector Machine Algorithm based Network Outlier Detection System. IEEE Access 2024. [Google Scholar] [CrossRef]
- Huang, S. and J. Zhou, Refined Approaches for Open Stope Stability Analysis in Mining Environments: Hybrid SVM Model with Multi-optimization Strategies and GP Technique. Rock Mechanics and Rock Engineering 2024, 1–24. [Google Scholar] [CrossRef]
- Kavitha, S. and N. Kaulgud, Quantum machine learning for support vector machine classification. Evolutionary Intelligence 2024, 17, 819–828. [Google Scholar] [CrossRef]
- Ke, T. , et al., A general maximal margin hyper-sphere SVM for multi-class classification. Expert Systems with Applications 2024, 237, 121647. [Google Scholar] [CrossRef]
- Negi, H.S. , et al., Support vector machine and classification, kernel trick for separating of data points. Mathematics in Engineering, Science & Aerospace (MESA) 2024, 15. [Google Scholar]
- Sun, H. and Y. Lu, A novel approach for solving linear Fredholm integro-differential equations via LS-SVM algorithm. Applied Mathematics and Computation 2024, 470, 128557. [Google Scholar] [CrossRef]
- Sharma, R., et al. Hybrid Radial Basis Function and Support Vector Machine Model for Precise Breast Cancer Diagnosis. in 2024 International Conference on Computational Intelligence and Computing Applications (ICCICA). 2024. IEEE.
- Sun, Z. , et al., An improved random forest based on the classification accuracy and correlation measurement of decision trees. Expert Systems with Applications 2024, 237, 121549. [Google Scholar] [CrossRef]
- Manafifard, M. , A new hyperparameter to random forest: application of remote sensing in yield prediction. Earth Science Informatics 2024, 17, 63–73. [Google Scholar] [CrossRef]
- Thanh, N.N. , et al., Integrating machine learning models with cross-validation and bootstrapping for evaluating groundwater quality in Kanchanaburi province, Thailand. Environmental Research 2024, 252, 118952. [Google Scholar] [CrossRef] [PubMed]
- Mienye, I.D. and N. Jere, A Survey of Decision Trees: Concepts, Algorithms, and Applications. IEEE Access 2024.
- Fadare, A.A. , Prediction of HR Employee Attrition with Machine Learning: Bagging and Random Forest Application. International Journal of Research and Scientific Innovation 2024, 11, 410–419. [Google Scholar] [CrossRef]
- Shivran, J.S. , et al., Correlation and Linear Regression of Physico-biochemical Attributes of Ber (Ziziphus mauritiana) cv. Umran During Ambient Storage. Journal of Scientific Research and Reports 2024, 30, 124–133. [Google Scholar] [CrossRef]
- Iida, T. , Identifying causes of errors between two wave-related data using performance metrics. Applied Ocean Research 2024, 148, 104024. [Google Scholar] [CrossRef]
- Gibson, J. , Minimum Mean Squared Error Estimation and Mutual Information Gain. Information 2024, 15, 497. [Google Scholar] [CrossRef]
- Lane, R.E. , et al., Defining the relationship between cellular and extracellular vesicle (EV) content in breast cancer via an integrative multi-omic analysis. Proteomics 2024, 2300089. [Google Scholar] [CrossRef]
Figure 1.
Synthesis of nanofluid applying the two-step approach.
Figure 1.
Synthesis of nanofluid applying the two-step approach.
Figure 2.
SEM micrograph of ZnO nanoparticles: (a)70,000x SEM micrograph (b) 50,000x SEM micrograph (c) EDS spectrum of Zn.
Figure 2.
SEM micrograph of ZnO nanoparticles: (a)70,000x SEM micrograph (b) 50,000x SEM micrograph (c) EDS spectrum of Zn.
Figure 3.
Stability analysis of ZnO dispersed Sunflower oil-based nanofluid.
Figure 3.
Stability analysis of ZnO dispersed Sunflower oil-based nanofluid.
Figure 3.
Response Surface Methodology (RSM) process.
Figure 3.
Response Surface Methodology (RSM) process.
Figure 4.
Flow diagram of Response Surface Methodology (RSM) method..
Figure 4.
Flow diagram of Response Surface Methodology (RSM) method..
Figure 5.
Facing operation process.
Figure 5.
Facing operation process.
Figure 6.
Facing operation process.
Figure 6.
Facing operation process.
Figure 7.
Contour plot of Ra and MRR for 1% ZnO nano cutting fluid condition.
Figure 7.
Contour plot of Ra and MRR for 1% ZnO nano cutting fluid condition.
Figure 8.
Surface plot of Ra and MRR for 1% ZnO nano cutting fluid condition;.
Figure 8.
Surface plot of Ra and MRR for 1% ZnO nano cutting fluid condition;.
Figure 9.
Residual plots of surface roughness (Ra) and MRR for 1% Condition.
Figure 9.
Residual plots of surface roughness (Ra) and MRR for 1% Condition.
Figure 10.
Optimization Plot for 1% ZnO nano cutting fluid condition.
Figure 10.
Optimization Plot for 1% ZnO nano cutting fluid condition.
Figure 11.
Contour plot of Ra and MRR for 1% ZnO nano cutting fluid condition.
Figure 11.
Contour plot of Ra and MRR for 1% ZnO nano cutting fluid condition.
Figure 12.
Surface plot of Ra and MRR for 1.5% ZnO nano cutting fluid condition.
Figure 12.
Surface plot of Ra and MRR for 1.5% ZnO nano cutting fluid condition.
Figure 13.
Optimization Plot for 1.5% ZnO nano cutting fluid condition.
Figure 13.
Optimization Plot for 1.5% ZnO nano cutting fluid condition.
Figure 14.
Residual plots of surface roughness (Ra) and MRR for 1.5% condition.
Figure 14.
Residual plots of surface roughness (Ra) and MRR for 1.5% condition.
Figure 15.
Surface roughness Predicted value from three machine learning models for at 1% (weight) zinc oxide (ZnO) cutting fluid.
Figure 15.
Surface roughness Predicted value from three machine learning models for at 1% (weight) zinc oxide (ZnO) cutting fluid.
Table 1.
Properties of Base Oil [
32].
Table 1.
Properties of Base Oil [
32].
| Property |
Sunflower Oil |
|
Density at 15°C (kg/m3)
|
920 |
|
Kinematic Viscosity at 40°C (cSt) |
37.8 |
| Calorific value (MJ/kg) |
39.6 |
|
Flash Point (°C) |
220 |
|
Auto-ignition temperature (°C) |
216 |
| Cetane number |
37 |
Table 2.
Properties of Zinc Oxide Nanoparticles [
33].
Table 2.
Properties of Zinc Oxide Nanoparticles [
33].
| Purity |
Color |
Size |
True density |
Specific surface area (SSA) |
Thermal conductivity |
Specific Heat |
| +99% |
milky white |
35-45 (nm) |
5.606 (g/cm3) |
~65 (m2/g) |
19 (W/m.°C) |
/kg.°C) |
Table 3.
Chemical Composition of Mild Steel [
36].
Table 3.
Chemical Composition of Mild Steel [
36].
| Current Element |
C |
Cu |
Fe |
Mn |
P |
Si |
S |
| Percentage level |
0.25-0.290% |
0.20% |
98.0% |
1.03% |
0.040% |
0.280% |
0.050% |
Table 4.
Machining parameters and their levels.
Table 4.
Machining parameters and their levels.
| SL. NO |
Vertical Milling Input Parameter |
Symbol |
Level 1 |
Level 2 |
Level 3 |
Level 4 |
| 1 |
Spindle speed (rpm) |
v |
175 |
320 |
530 |
- |
| 2 |
Depth of cut (mm) |
d |
0.1 |
0.3 |
0.5 |
- |
| 3 |
Feed Rate (mm/min) |
f |
40 |
93 |
200 |
- |
| 4 |
Cutting fluid Condition |
|
1% nanoparticle cutting fluid condition |
1.5% nanoparticle cutting fluid condition |
- |
- |
Table 5.
Experimental Measurement for 1% ZnO nano cutting fluid.
Table 5.
Experimental Measurement for 1% ZnO nano cutting fluid.
Experiment
No |
Spindle speed
(rpm) |
Feed Rate(mm/min) |
Depth of cut
(mm) |
Surface Roughness
(μm) |
MRR
(mm3/min) |
| 1A |
175 |
40 |
0.1 |
4.1331 |
247.986 |
| 2 A |
175 |
40 |
0.3 |
4.5021 |
270.126 |
| 3 A |
175 |
40 |
0.5 |
5.9296 |
355.776 |
| 4 A |
175 |
93 |
0.1 |
4.6265 |
277.590 |
| 5 A |
175 |
93 |
0.3 |
4.6471 |
278.826 |
| 6 A |
175 |
93 |
0.5 |
4.8521 |
291.126 |
| 7 A |
175 |
200 |
0.1 |
1.1196 |
487.176 |
| 8 A |
175 |
200 |
0.3 |
1.3529 |
501.174 |
| 9 A |
175 |
200 |
0.5 |
1.5613 |
513.678 |
| 10 A |
320 |
40 |
0.1 |
1.2019 |
72.1140 |
| 11 A |
320 |
40 |
0.3 |
1.2513 |
75.0780 |
| 12 A |
320 |
40 |
0.5 |
1.3469 |
80.8140 |
| 13 A |
320 |
93 |
0.1 |
3.1319 |
187.914 |
| 14 A |
320 |
93 |
0.3 |
3.2915 |
197.490 |
| 15 A |
320 |
93 |
0.5 |
3.5613 |
213.678 |
| 16 A |
320 |
200 |
0.1 |
4.1320 |
247.920 |
| 17 A |
320 |
200 |
0.3 |
4.6510 |
279.060 |
| 18 A |
320 |
200 |
0.5 |
4.7112 |
282.672 |
| 19 A |
530 |
40 |
0.1 |
2.8204 |
169.224 |
| 20 A |
530 |
40 |
0.3 |
2.8913 |
173.478 |
| 21 A |
530 |
40 |
0.5 |
2.9256 |
175.536 |
| 22 A |
530 |
93 |
0.1 |
4.2019 |
252.114 |
| 23 A |
530 |
93 |
0.3 |
4.3112 |
258.672 |
| 24 A |
530 |
93 |
0.5 |
4.4545 |
267.270 |
| 25 A |
530 |
200 |
0.1 |
4.2916 |
257.496 |
| 26 A |
530 |
200 |
0.3 |
4.6900 |
281.400 |
| 27 A |
530 |
200 |
0.5 |
4.7810 |
286.860 |
Table 6.
Experimental Measurement for 1.5% ZnO nano cutting fluid.
Table 6.
Experimental Measurement for 1.5% ZnO nano cutting fluid.
Experiment
No |
Spindle speed
(rpm) |
Feed Rate(mm/min) |
Depth of cut
(mm) |
Surface Roughness
(μm) |
MRR
(mm3/min) |
| 1B |
175 |
40 |
0.1 |
0.5831 |
208.6062 |
| 2 B |
175 |
40 |
0.3 |
3.0123 |
239.0742 |
| 3 B |
175 |
40 |
0.5 |
4.9675 |
260.1981 |
| 4 B |
175 |
93 |
0.1 |
4.1342 |
433.4958 |
| 5 B |
175 |
93 |
0.3 |
4.3519 |
574.1748 |
| 6 B |
175 |
93 |
0.5 |
4.6712 |
611.1158 |
| 7 B |
175 |
200 |
0.1 |
7.8371 |
673.7214 |
| 8 B |
175 |
200 |
0.3 |
7.9213 |
1051.881 |
| 9 B |
175 |
200 |
0.5 |
7.9625 |
1135.598 |
| 10 B |
320 |
40 |
0.1 |
2.5613 |
171.1419 |
| 11 B |
320 |
40 |
0.3 |
2.7123 |
221.3078 |
| 12 B |
320 |
40 |
0.5 |
2.8916 |
276.9305 |
| 13 B |
320 |
93 |
0.1 |
3.1619 |
401.5678 |
| 14 B |
320 |
93 |
0.3 |
3.2915 |
543.9771 |
| 15 B |
320 |
93 |
0.5 |
3.5611 |
631.8700 |
| 16 B |
320 |
200 |
0.1 |
4.9546 |
202.6529 |
| 17 B |
320 |
200 |
0.3 |
4.9713 |
1167.068 |
| 18 B |
320 |
200 |
0.5 |
4.9813 |
1156.262 |
| 19 B |
530 |
40 |
0.1 |
1.7610 |
120.1926 |
| 20 B |
530 |
40 |
0.3 |
1.8012 |
212.7085 |
| 21 B |
530 |
40 |
0.5 |
1.8615 |
264.5439 |
| 22 B |
530 |
93 |
0.1 |
1.9623 |
319.9841 |
| 23 B |
530 |
93 |
0.3 |
2.1218 |
529.4366 |
| 24 B |
530 |
93 |
0.5 |
2.3014 |
649.5387 |
| 25 B |
530 |
200 |
0.1 |
2.9617 |
207.1364 |
| 26 B |
530 |
200 |
0.3 |
3.1452 |
228.8349 |
| 27 B |
530 |
200 |
0.5 |
3.3471 |
265.6967 |
Table 7.
Analysis of Variance for MRR in 1% ZnO nano cutting fluid condition.
Table 7.
Analysis of Variance for MRR in 1% ZnO nano cutting fluid condition.
| Source |
DF |
Adj SS |
Adj MS |
F-Value |
P-Value |
| Model |
9 |
295972 |
32886 |
20.56 |
0.000 |
| Linear |
3 |
201200 |
67067 |
41.92 |
0.000 |
| V |
1 |
74759 |
74759 |
46.73 |
0.000 |
| f |
1 |
121018 |
121018 |
75.65 |
0.000 |
| d |
1 |
3559 |
3559 |
2.22 |
0.154 |
| Square |
3 |
95443 |
31814 |
19.89 |
0.000 |
| V*V |
1 |
94677 |
94677 |
59.18 |
0.000 |
| f*f |
1 |
742 |
742 |
0.46 |
0.505 |
| d*d |
1 |
24 |
24 |
0.02 |
0.903 |
| 2-Way Interaction |
3 |
15401 |
5134 |
3.21 |
0.049 |
| V*f |
1 |
14650 |
14650 |
9.16 |
0.008 |
| V*d |
1 |
718 |
718 |
0.45 |
0.512 |
| f*d |
1 |
33 |
33 |
0.02 |
0.887 |
| Error |
17 |
27195 |
1600 |
|
|
| Total |
26 |
323167 |
|
|
|
Table 8.
Analysis of Variance for Ra in 1.5% ZnO nano cutting fluid condition.
Table 8.
Analysis of Variance for Ra in 1.5% ZnO nano cutting fluid condition.
| Source |
DF |
Adj SS |
Adj MS |
F-Value |
P-Value |
| Model |
9 |
87.0773 |
9.6753 |
24.19 |
0.000 |
| Linear |
3 |
73.6521 |
24.5507 |
61.38 |
0.000 |
| V |
1 |
36.8279 |
36.8279 |
92.07 |
0.000 |
| f |
1 |
34.4095 |
34.4095 |
86.03 |
0.000 |
| d |
1 |
1.7173 |
1.7173 |
4.29 |
0.054 |
| Square |
3 |
0.5508 |
0.1836 |
0.46 |
0.714 |
| V*V |
1 |
0.4501 |
0.4501 |
1.13 |
0.304 |
| f*f |
1 |
0.1000 |
0.1000 |
0.25 |
0.623 |
| d*d |
1 |
0.0007 |
0.0007 |
0.00 |
0.967 |
| 2-Way Interaction |
3 |
12.5105 |
4.1702 |
10.43 |
0.000 |
| V*f |
1 |
9.9604 |
9.9604 |
24.90 |
0.000 |
| V*d |
1 |
1.2896 |
1.2896 |
3.22 |
0.090 |
| f*d |
1 |
1.2606 |
1.2606 |
3.15 |
0.094 |
| Error |
17 |
6.7999 |
0.4000 |
|
|
| Total |
26 |
93.8772 |
|
|
|
Table 9.
Analysis of Variance for MRR in 1.5% ZnO nano cutting fluid condition.
Table 9.
Analysis of Variance for MRR in 1.5% ZnO nano cutting fluid condition.
| Source |
DF |
Adj SS |
Adj MS |
F-Value |
P-Value |
| Model |
9 |
2300430 |
255603 |
10.07 |
0.000 |
| Linear |
3 |
1666330 |
555443 |
21.89 |
0.000 |
| V |
1 |
419260 |
419260 |
16.52 |
0.001 |
| f |
1 |
843491 |
843491 |
33.24 |
0.000 |
| d |
1 |
391923 |
391923 |
15.44 |
0.001 |
| Square |
3 |
198896 |
66299 |
2.61 |
0.085 |
| V*V |
1 |
23057 |
23057 |
0.91 |
0.354 |
| f*f |
1 |
131539 |
131539 |
5.18 |
0.036 |
| d*d |
1 |
44300 |
44300 |
1.75 |
0.204 |
| 2-Way Interaction |
3 |
569944 |
189981 |
7.49 |
0.002 |
| V*f |
1 |
448342 |
448342 |
17.67 |
0.001 |
| V*d |
1 |
4801 |
4801 |
0.19 |
0.669 |
| f*d |
1 |
116800 |
116800 |
4.60 |
0.047 |
| Error |
17 |
431451 |
25379 |
|
|
| Total |
26 |
2731881 |
|
|
|
Table 10.
Surface roughness predicted values from different machine learning algorithms when using 1% (weight) zinc oxide (ZnO) cutting fluid.
Table 10.
Surface roughness predicted values from different machine learning algorithms when using 1% (weight) zinc oxide (ZnO) cutting fluid.
| Experiment No. |
Experimented value |
Predicted LR |
Predicted SVR |
Predicted RF |
| 17A |
4.6510 |
4.6510 |
4.5504 |
4.5093 |
| 9A |
1.5613 |
2.9418 |
2.5724 |
3.0551 |
| 13A |
3.1319 |
3.2651 |
3.1569 |
3.1388 |
| 23A |
4.3112 |
4.3266 |
4.2701 |
4.3579 |
| 12A |
1.3469 |
1.4735 |
1.3892 |
1.3420 |
| 4A |
4.6265 |
4.5058 |
4.6331 |
4.6264 |
Table 11.
Evaluation Metrics for machine learning algorithms when using 1% (weight) zinc oxide (ZnO) cutting fluid for predicting surface roughness.
Table 11.
Evaluation Metrics for machine learning algorithms when using 1% (weight) zinc oxide (ZnO) cutting fluid for predicting surface roughness.
| Models |
R-Square Value |
Cross-validated R-square |
MSE Value |
MAPE Value |
EVS Value |
| LR |
0.8766 |
0.8693 |
0.2255 |
0.1168 |
0.8773 |
| SVM |
0.8655 |
0.8655 |
0.2458 |
0.1079 |
0.8671 |
| RF |
0.8711 |
0.8866 |
0.2356 |
0.0778 |
0.8720 |
Table 12.
Material removal rate predicted values from different machine learning algorithms when using 1% (weight) zinc oxide (ZnO) cutting fluid.
Table 12.
Material removal rate predicted values from different machine learning algorithms when using 1% (weight) zinc oxide (ZnO) cutting fluid.
| Experiment No. |
Experimented value |
Predicted LR |
Predicted SVR |
Predicted RF |
| 17A |
279.06 |
202.3802 |
273.9380 |
280.1847 |
| 9A |
513.678 |
208.8429 |
404.9231 |
446.3387 |
| 13A |
187.914 |
191.7853 |
189.6210 |
188.5299 |
| 23A |
258.672 |
270.1434 |
258.1717 |
258.7664 |
| 12A |
80.814 |
90.3664 |
79.6878 |
80.7791 |
| 4A |
277.59 |
279.8267 |
274.0898 |
277.5449 |
Table 13.
Evaluation Metrics for machine learning algorithms when using 1% (weight) zinc oxide
(ZnO) cutting fluid for predicting machine removal rate..
Table 13.
Evaluation Metrics for machine learning algorithms when using 1% (weight) zinc oxide
(ZnO) cutting fluid for predicting machine removal rate..
| Models |
R-Square Value |
Cross-validated R-square |
MSE Value |
MAPE Value |
EVS Value |
| LR |
0.8795 |
0.8914 |
1374.2752 |
0.0631 |
0.9198 |
| SVM |
0.8198 |
0.8626 |
2405.1849 |
0.0372 |
0.8271 |
| RF |
0.9015 |
0.8959 |
1315.3224 |
0.0458 |
0.9028 |
Table 14.
Surface roughness predicted values from different machine learning algorithms when using 1.5% (weight) zinc oxide (ZnO) cutting fluid.
Table 14.
Surface roughness predicted values from different machine learning algorithms when using 1.5% (weight) zinc oxide (ZnO) cutting fluid.
| Experiment No. |
Experimented value |
Predicted LR |
Predicted SVR |
Predicted RF |
| 19B |
1.761 |
1.8310 |
1.7922 |
1.7632 |
| 25B |
2.9617 |
3.0112 |
2.9675 |
3.0079 |
| 3B |
4.9675 |
4.8409 |
5.0524 |
4.9455 |
| 15B |
3.5611 |
3.4333 |
3.5526 |
3.5642 |
| 22B |
1.9623 |
1.8317 |
2.0090 |
1.9755 |
| 10B |
2.5613 |
2.3189 |
2.5217 |
2.5667 |
Table 15.
Evaluation Metrics for machine learning algorithms when using 1.5% (weight) zinc oxide (ZnO) cutting fluid for predicting surface roughness.
Table 15.
Evaluation Metrics for machine learning algorithms when using 1.5% (weight) zinc oxide (ZnO) cutting fluid for predicting surface roughness.
| Models |
R-Square Value |
Cross-validated R-square |
MSE Value |
MAPE Value |
EVS Value |
| LR |
0.9414 |
0.9358 |
0.2454 |
0.0589 |
0.9416 |
| SVM |
0.9405 |
0.9603 |
0.2492 |
0.0487 |
0.9418 |
| RF |
0.9474 |
0.9423 |
0.2206 |
0.0289 |
0.9474 |
Table 16.
Machine removal rate predicted values from different machine learning algorithms when using 1.5% (weight) zinc oxide (ZnO) cutting fluid.
Table 16.
Machine removal rate predicted values from different machine learning algorithms when using 1.5% (weight) zinc oxide (ZnO) cutting fluid.
| Experiment No. |
Experimented value |
Predicted LR |
Predicted SVR |
Predicted RF |
| 19B |
120.1926 |
101.2607 |
120.6928 |
120.1926 |
| 25B |
207.1364 |
184.9733 |
203.7071 |
207.1776 |
| 3B |
260.1981 |
315.3403 |
271.9362 |
260.1980 |
| 15B |
631.87 |
684.2962 |
635.9035 |
631.4549 |
| 22B |
319.9841 |
377.6203 |
321.4843 |
319.1864 |
| 10B |
171.1419 |
2.3189 |
2.5217 |
2.5667 |
Table 17.
Evaluation Metrics for machine learning algorithms when using 1.5% (weight) zinc oxide (ZnO) cutting fluid for predicting machine removal rate.
Table 17.
Evaluation Metrics for machine learning algorithms when using 1.5% (weight) zinc oxide (ZnO) cutting fluid for predicting machine removal rate.
| Models |
R-Square Value |
Cross-validated R-square |
MSE Value |
MAPE Value |
EVS Value |
| LR |
0.9758 |
0.9732 |
2367.7181 |
0.1186 |
0.9759 |
| SVM |
0.9899 |
0.9876 |
987.4150 |
0.0286 |
0.9904 |
| RF |
0.9964 |
0.9952 |
1329.7255 |
0.0257 |
0.9965 |
|
Disclaimer/Publisher’s Note: The statements, opinions and data contained in all publications are solely those of the individual author(s) and contributor(s) and not of MDPI and/or the editor(s). MDPI and/or the editor(s) disclaim responsibility for any injury to people or property resulting from any ideas, methods, instructions or products referred to in the content. |
© 2024 by the authors. Licensee MDPI, Basel, Switzerland. This article is an open access article distributed under the terms and conditions of the Creative Commons Attribution (CC BY) license (http://creativecommons.org/licenses/by/4.0/).
