1. Introduction
Lung cancer is the leading cause of cancer-related death worldwide, and non-small cell lung cancer (NSCLC) is the primary form of the disease, accounting for approximately 85% of cases. Lung cancer is often diagnosed at an advanced stage, making it challenging to provide curative therapy [
1,
2,
3]. The treatments available for cancer patients before personalized medicine have shown a wide range of patient responses and relatively low survival [
4]. In contrast, the implementation of tyrosine kinase inhibitors has decreased NSCLC mortality since 2013 [
5]. Nowadays, the American Society of Clinical Oncology (ASCO) and the European Society for Medical Oncology (ESMO) recommend the sequencing of the actionable NSCLC genes, which means those genes with target therapy response, including
EGFR, ALK, ROS1, ERBB2, MET, MAP2K1, BRAF, KRAS,
RET, and NTRK1/2/3. The identification of actionable genes has contributed to the molecular characterization of NSCLC [
6,
7]; however, due to the limited implementation of personalized medicine, some populations, such as Latin American NSCLC patients, have been poorly characterized [
6].
Among all NSCLC actionable genes,
MET represents a critical oncogene that belongs to the transmembrane receptor tyrosine kinase family (RTK). The c-Met receptor is activated by the specific ligand hepatocyte growth factor (HGF) [
7,
8]. It induces the receptor dimerization, followed by the c-Met autophosphorylation of three tyrosine residues (Y1230, Y1234, and Y1235), and the consequent increase of the c-Met tyrosine kinase activity [
9,
10]. The canonical c-Met signaling pathways include RAS/MAPK, which promotes a proliferative and survival phenotype [
11], and the PI3K/Akt/mTOR signaling, promoting survival, likewise a migratory phenotype [
11,
12].
The juxtamembrane domain encoded by exon 14 acts as a binding site for the c-Cbl E3 ubiquitin ligase for protein degradation [
13]. However, the c-Met receptor is constitutively expressed when exon 14 is missing due to different mutational events [
14]. The MET exon 14 skipping variant (METex14) is the only MET actionable variant recognized in NSCLC [
15] and occurs in 2-3% of NSCLC patients, conferring clinical sensitivity to c-Met inhibitors such as crizotinib [
16], capmatinib [
17], tepotinib [
18], and savolitinib [
19]. These c-Met inhibitors are currently considered the first line of therapy or a subsequent therapy option in patients with advanced or metastatic NSCLC [
20,
21].
The METex14 variants affecting the splicing region represent a challenging diagnosis since the MET tumor’s DNA sequencing has shown a low sensitivity [
22,
23]. Thus, sequencing of tumor RNA is the current gold standard diagnosis since it directly detects the fusion of exon 13 to exon 15, independent of the DNA variants that promote the exon 14 skipping [
24]. The variants that induce METex14 represent a group of alterations at the region of the 3′ splice site in intron 13 or the 5′ end splice site of intron 14 involving donor or receptor sites and include single nucleotide variants (SNVs) as well as insertions and deletions (INDELs) of different lengths in the splicing regions at the beginning and the end of the exon 14 [
15,
25].
Diverse next-generation sequencing (NGS) based protocols have proposed a threshold number of RNA reads necessary to diagnose the METex14. For example, according to the user guide, the threshold for identifying METex14 by Oncomine® assay is at least 120 fusion reads [
26]. However, a study suggested a threshold of 800 reads to mitigate potential difficulties in interpretation [
27]. However, the clinically relevant question that remains unaddressed beyond the bioinformatic threshold is how many RNA reads (or other appropriate metrics) are necessary to achieve a successful therapeutic response to MET inhibitors? [
27,
28].
In addition to the canonical actionable METex14 variant, there is an increasing rate of conflicts reporting variants of unknown clinical significance (VUS) in the tumor profile of NSCLC patients, which are excluded from the target therapy prescription. However, with the advent of new bioinformatic algorithms, the reclassification of these VUS has benefited to assertively distinguish if those protein changes could be an actionable variant. For instance, the Cancer Genome Interpreter (CGI) platform’s prediction algorithm helps identify driver variants that could potentially be treated with targeted therapies using BoostDM and OncodriveMut [
29,
30]. The Combined Annotation-Dependent Depletion (CADD) value is a pathogenicity predictor that integrates several genomic features and functional predictions [
31]. The SIFT algorithm predicts whether an amino acid substitution is likely to affect protein function [
32,
33], and Polyphen-2 is another variant effect predictor that divided the analysis into three categories: benign, possibly damaging, and probably damaging to the protein function [
34]. Johnson et al., recently demonstrated that at least 24% (106/438) of the VUS analyzed were oncogenic, and, most importantly, they identified 44% (204/438) as potentially actionable variants [
35]. Certain
MET mutagenic events, such as variants affecting the juxtamembrane or the tyrosine kinase domains, can transform the c-Met into an oncogenic protein. Thus, the study and identification of novel MET actionable variants that impact these domains is essential to broaden the prescription of already approved target drugs [
13,
36].
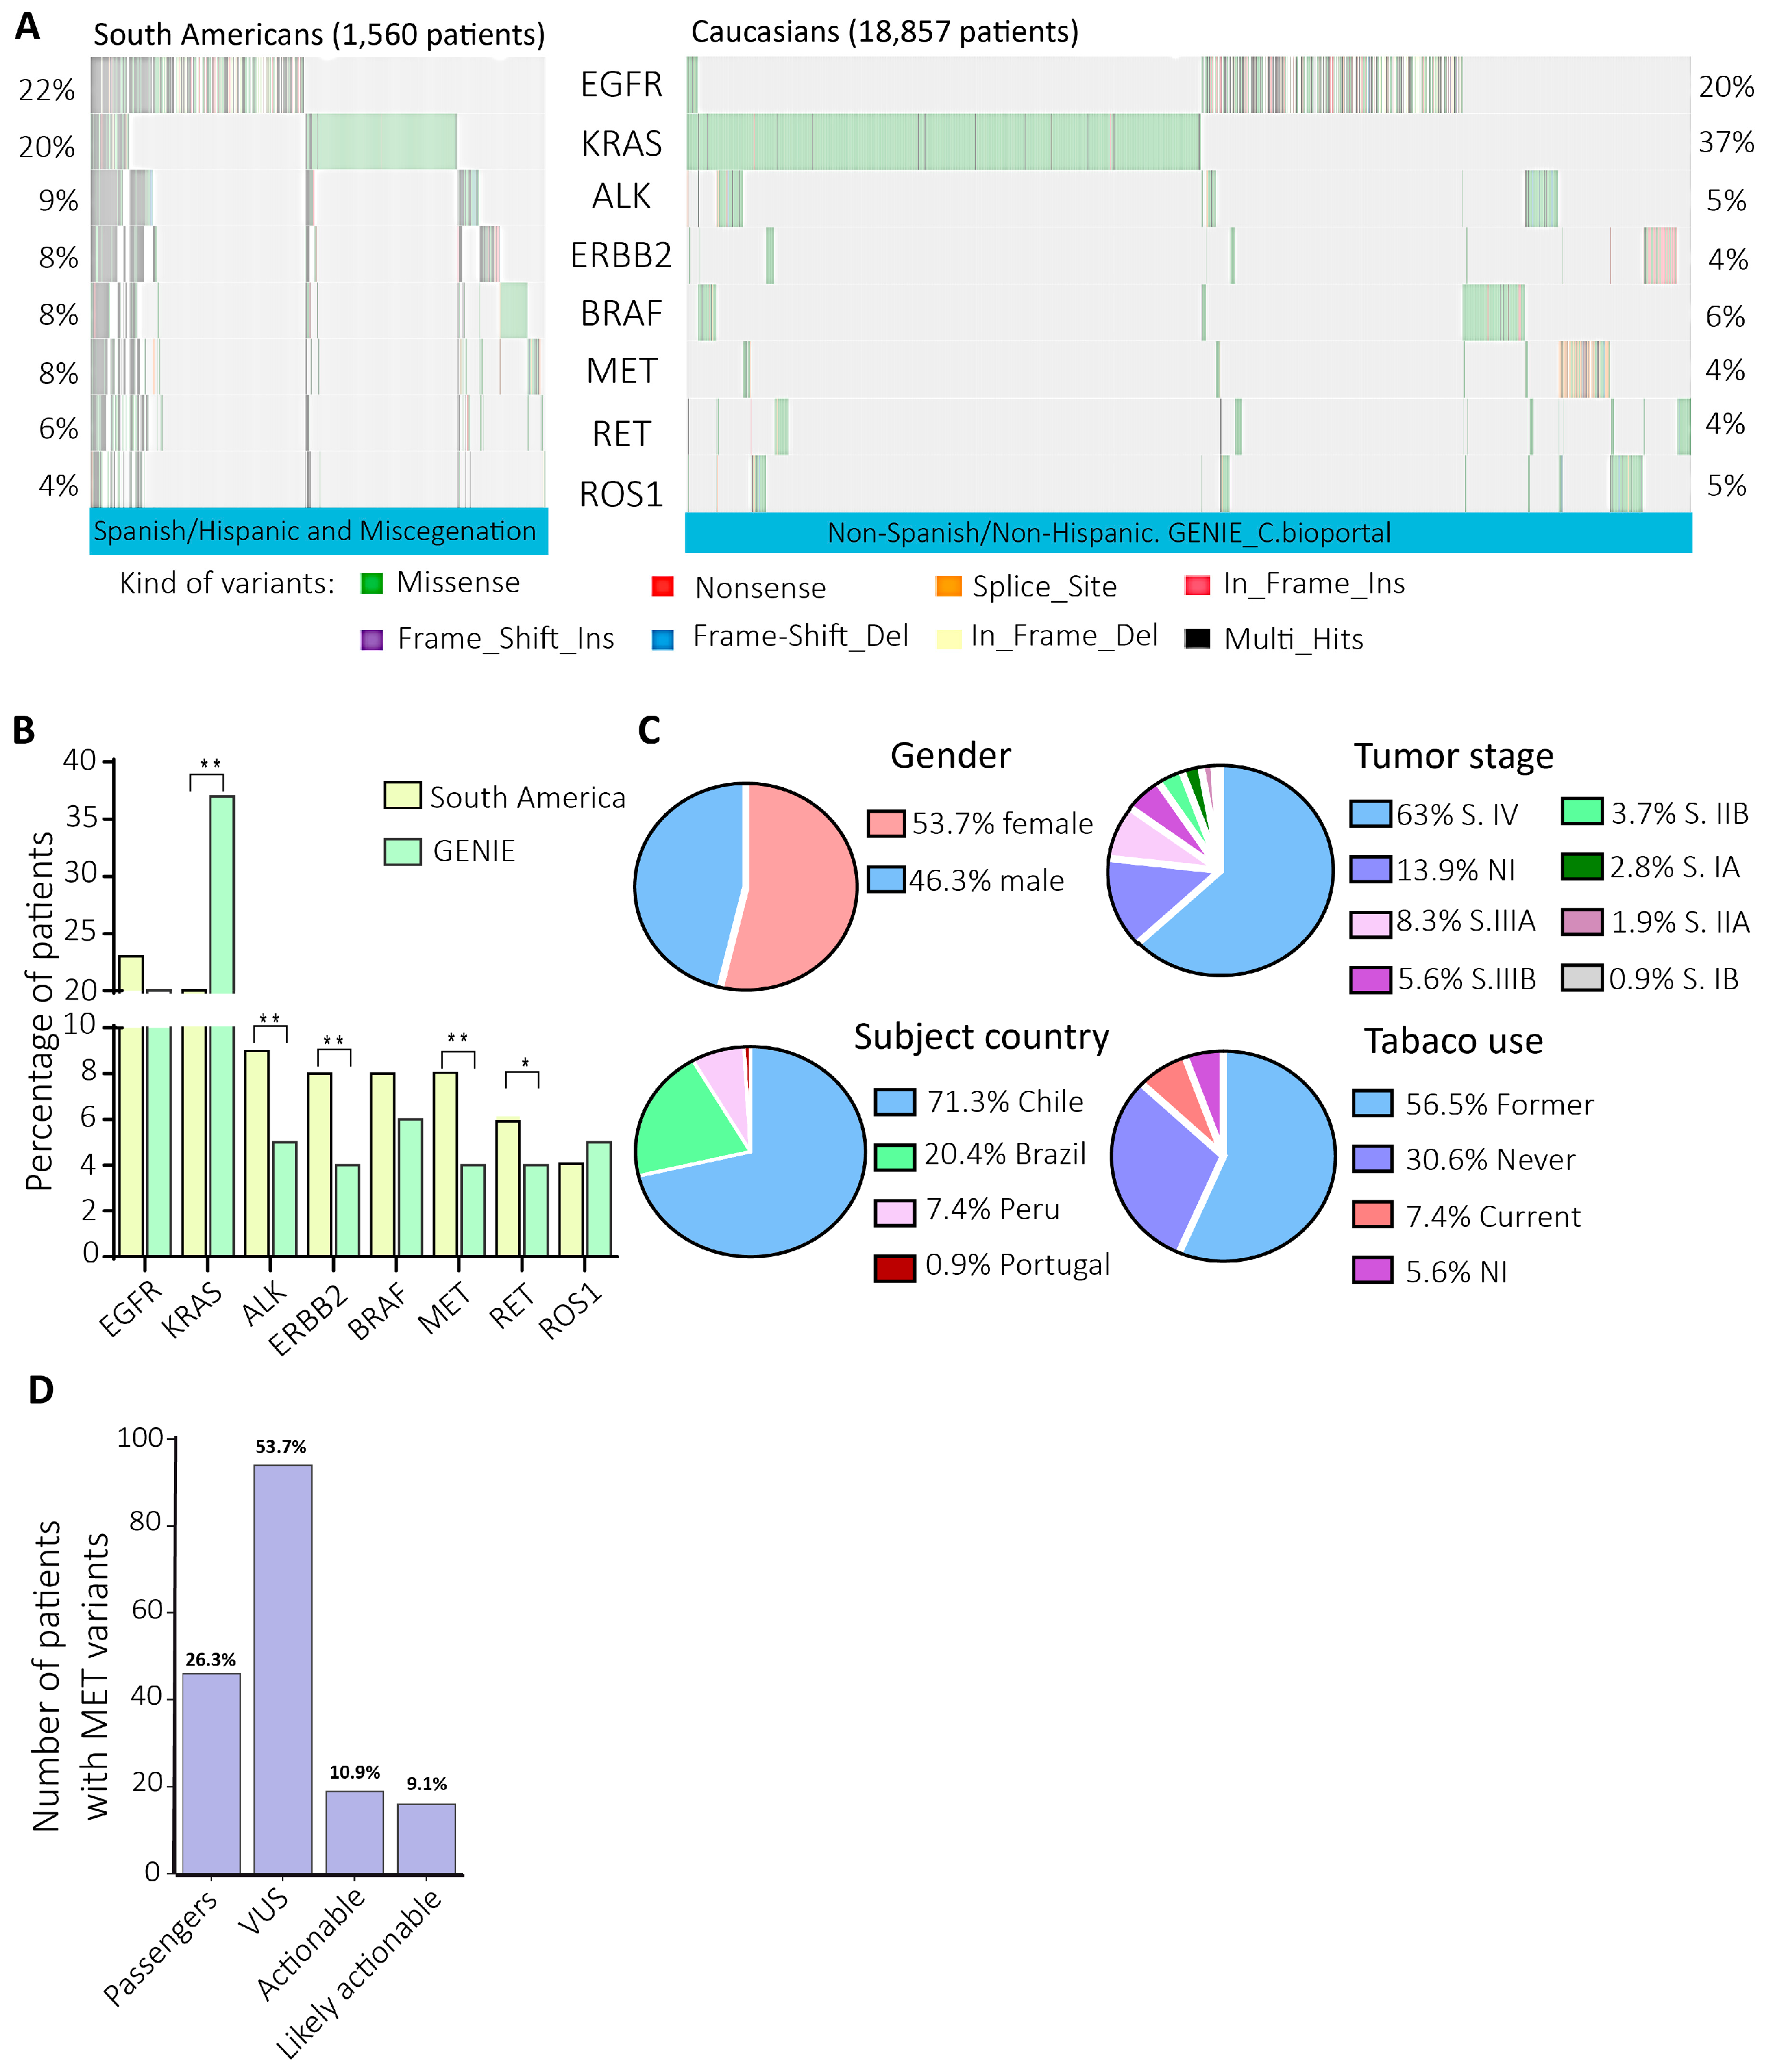
In this study, the analysis of the next-generation sequencing data of actionable genes from NSCLC South American patients evidenced 8% of MET variants versus 4% in the GENIE cohort. So, then we focused on the most prevalent MET variants, the METex14 (DNA versus RNA diagnosis), and the in vitro validation of two novel actionable variants categorized as VUS. Identifying actionable and potentially actionable variants in underrepresented populations is essential since current, actionable variants have been identified primarily in Caucasian and non-Hispanic patients. Thus, identifying novel actionable variants in South American patients reduces disparities in diagnosing actionable variants, opening the benefits of available targeted therapies to a broader patient population.
3. Discussion
Previously, 1,881 DNA and RNA from South American NSCLC patients’ tumors were sequenced using the Oncomine focus assay [NCT03220230] [
37]. Considering patients with DNA and RNA sequencing QC pass, the data analysis of 1,560 patients showed a prevalence of 8% of DNA MET variants, twice what is reported in the Caucasian/Non-Spanish/Hispanic patients from the GENIE cohort (
Figure 1B) [
39]
. This finding is supported by data from the Caucasian and Asian NSCLC cohorts, which have evidenced a range from 0.9% to 4.0% of MET variants [
42,
43]. This high percentage of MET variants in the South American cohort was principally from Chile (71.3%), where MET inhibitors have not been approved yet [
44]. On the other hand, Brazil has already approved the prescription of crizotinib, campatinib, and tepotinib [
45], the same as in Argentina [
46].
The METex14 variant was the most prevalent diagnosis, and at the RNA level, 72 TBx from NSCLC patients presented an extensive range of RNA reads for this variant (25 to 67.000 RNA reads). However, of these 72 patients, 35 had more than 120 RNA reads, which is the number required for diagnosing METex14, according to the user guide of the Oncomine Focus Assay [
26]. Interestingly, 53.9% of these RNA diagnoses were negative at the DNA sequencing, evidencing the high sensitivity of the METex14 RNA diagnosis, as reported before [
23].
In addition, 37/72 patients evidenced less than the 120 RNA reads for the METex14 detection; however, 20% of them evidenced pathogenic DNA variants in the splicing region of MET with diverse allele frequencies (
Figure 2A, G). The splicing is a region often disrupted when a variant is present [
47], confirming the possibility of false negatives METex14 diagnoses with less than 120 RNA reads. As the RNA sample from tumor biopsies is the gold standard for the METex14 diagnosis, in those cases with less than the RNA reads indicated in the user guide of the NGS kit, it would be necessary to suggest such as undetermined until the DNA sequencing or RT-PCR [
48] brings some new evidence.
While how many METex14 RNA reads are indicative of a successful therapy with MET inhibitors continues to be unknown, it is essential to gather all the clinical and molecular evidence as possible on those cases with low RNA reads whose tumor profiles did not evidence actionable nor driver variants, as the 57% of the patients with low RNA reads for METex14 analyzed here. Until now, the sole evidence about how many reads are required for a successful therapy with c-Met inhibitors is a case report informing the highest sensitivity of the OFA, which detected 46 reads for METex14 in an NSCLC patient without known actionable variants, who was previously treated with various chemotherapeutic agents without positive effects. The patient evidenced an immediate therapy response after administering tepotinib, a c-Met inhibitor [
28].
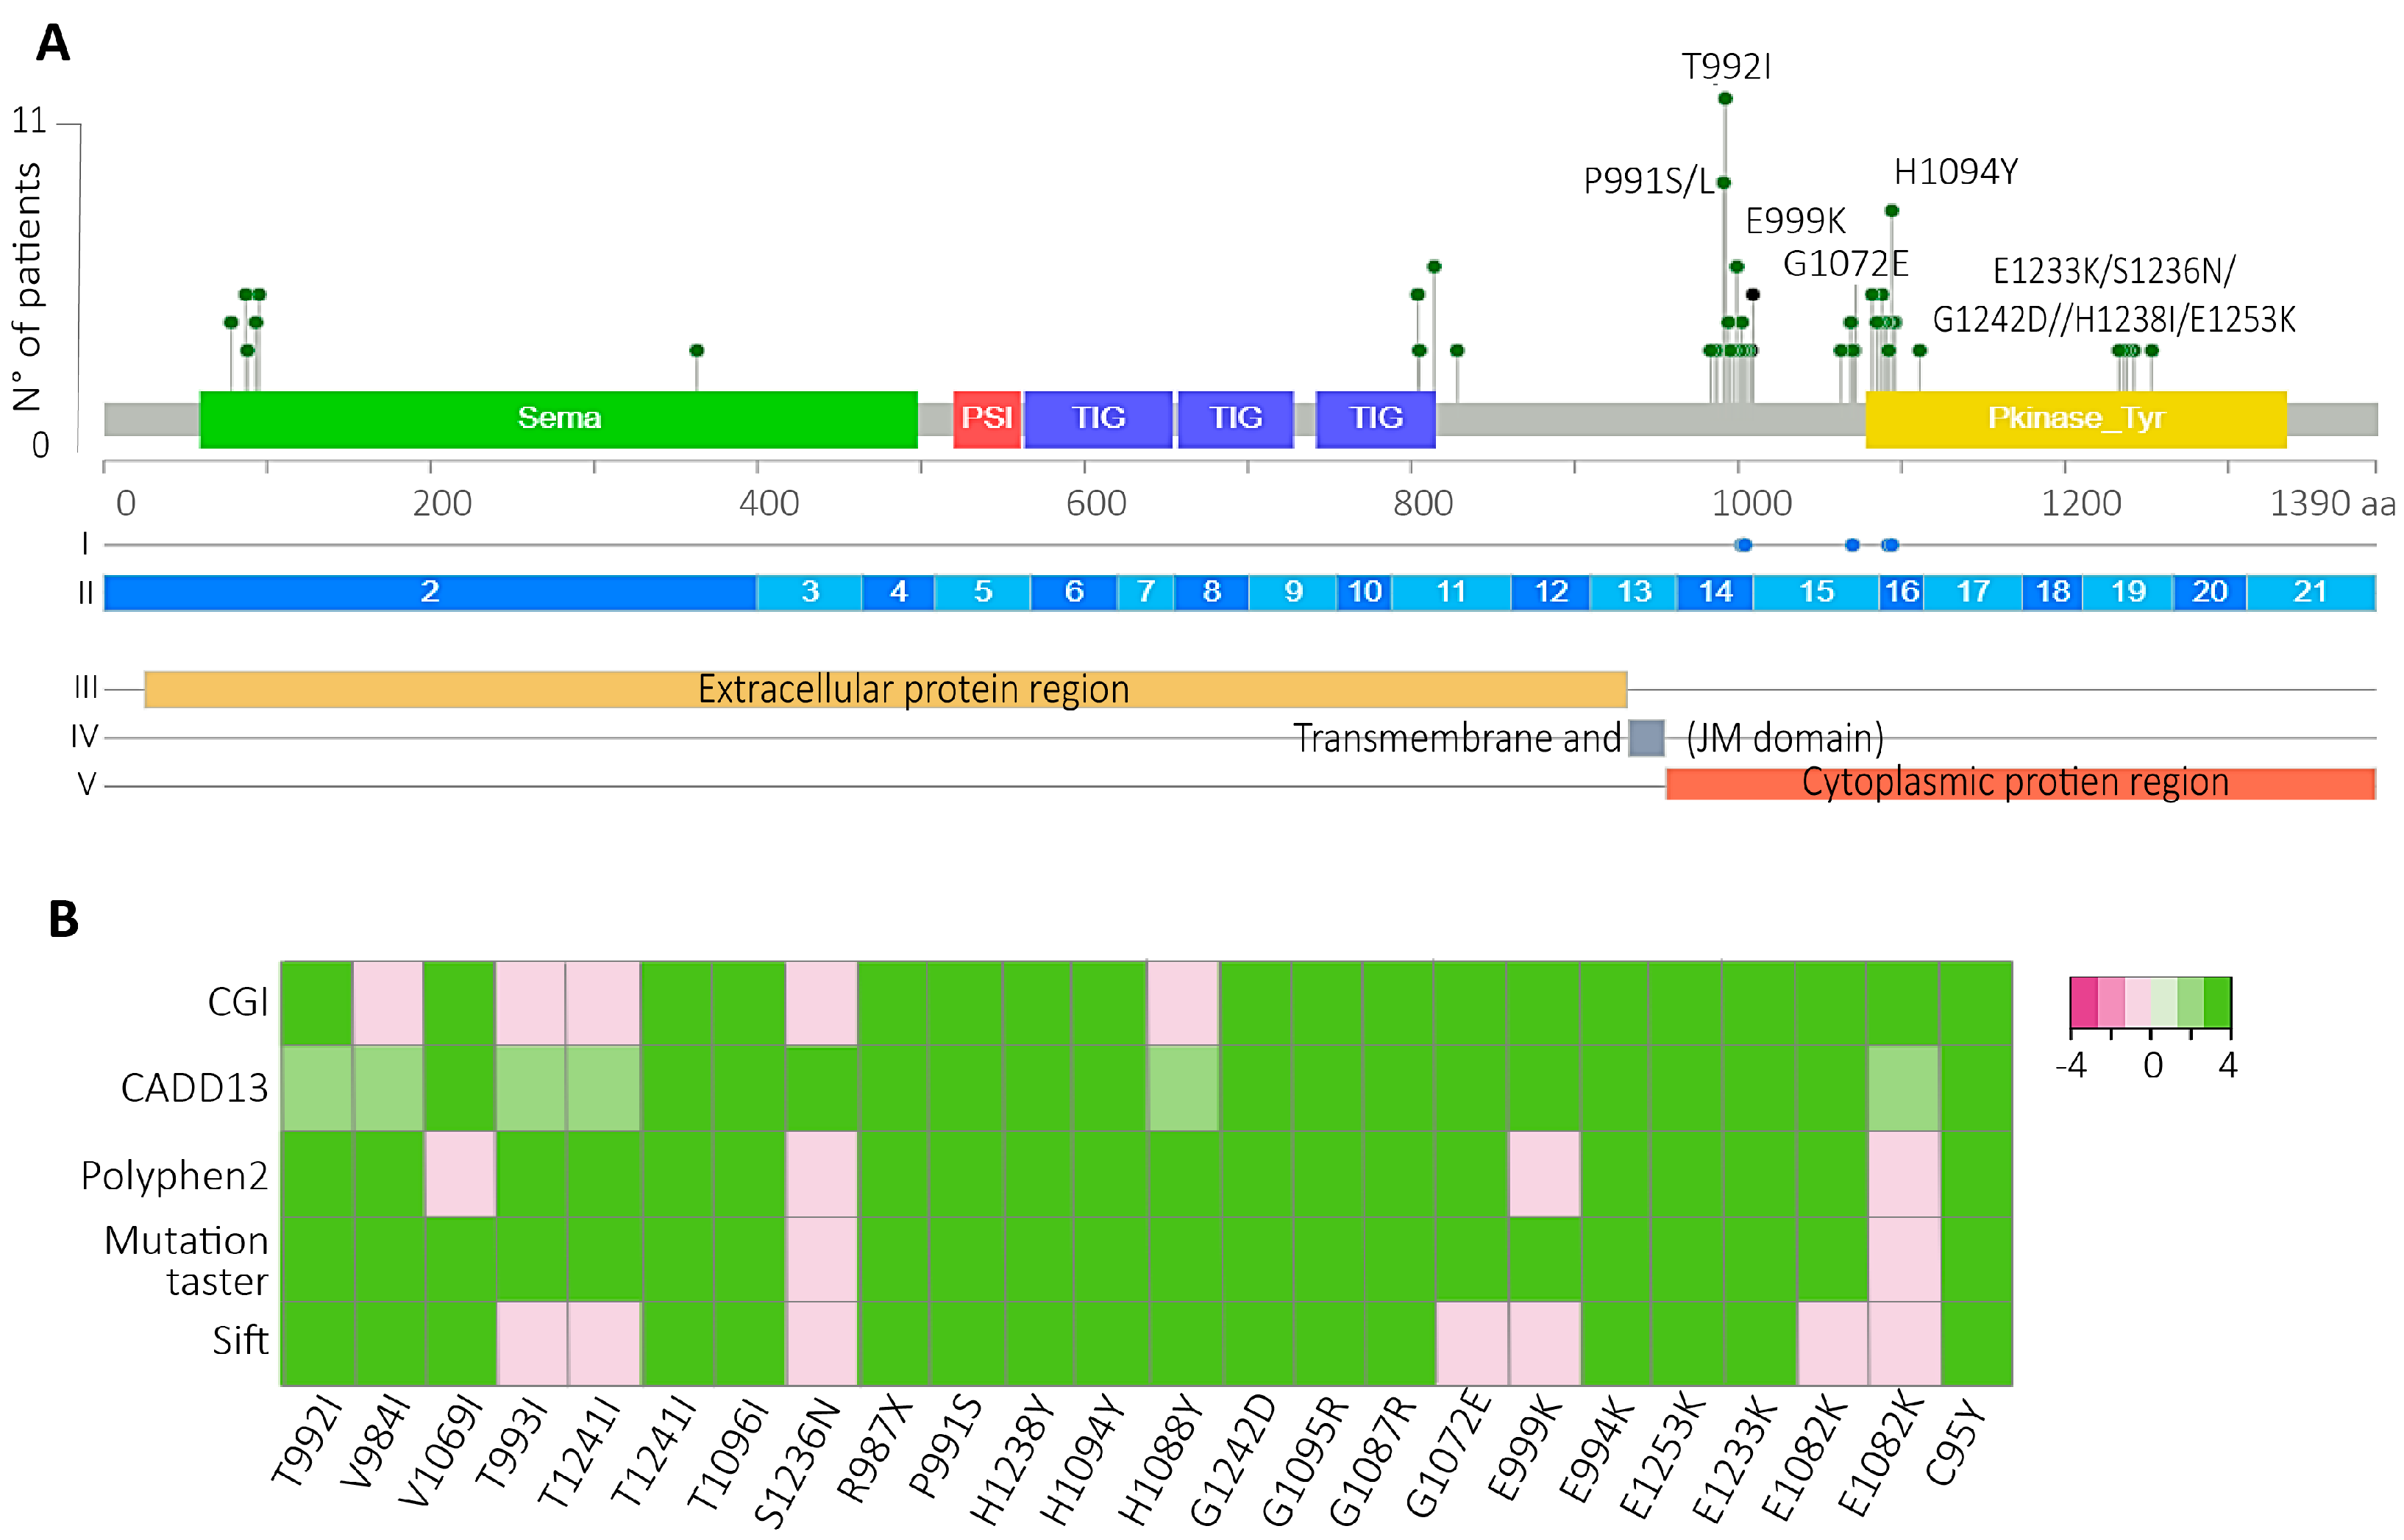
Another interesting finding was the high percentage of VUS-predicted drivers impacted the JM and TK c-Met domains (
Figure 3A), with the H1094Y and the T992I the most prevalent, which affected 14.41% of the patients with Met variants in the South American cohort. The H1094Y variant was first identified in renal cell carcinoma [
49,
50], and it has been detected as a resistance variant after glesatinib treatment in NSCLC positives for METex14 [
51]. Also, this variant has been related to an oncogenic role in NSCLC conferring acquired resistance to EGFR-TKIs [
52,
53]. Although savolitinib has not been indicated by FDA yet, the combination of savolitinib plus osimertinib for NSCLC patients with MET-amplified or mutated with EGFR mutation-positive has been successful (NCT03778229) [
54,
55]. In NSCLC, the H1094Y variant has just been reported as a secondary resistance variant; however, the Chilean NSCLC patients studied here exhibited this variant before any therapy indication (
Figure 1E), so here it is possible the H1094Y was the initial driver variant involved in the carcinogenesis in these patients.
The other novel actionable variant that evidenced the highest increase of c-Met activity through the proliferation and migration was the T992I, which has been previously reported as germinal in 4.5% of colon cancers, being considered an inherited risk factor for familial colorectal cancer [
56], however, other studies described the T992I as a rare single nucleotide polymorphism not relevant to oncogenesis [
57], however, this variant could be relevant in NSCLC progression, since here we found this variant reported the highest increase the Met activity, proliferation in non-tumor cells, and migration in tumor cells, in comparison to METex14 and H1094Y.
The study of these variants in South American patients also demonstrates the necessity of implementing the NGS for NSCLC patients in Chile as a universal health policy because until now, the clinical guides (Health Problem AUGE N°81) from Chile mention that this diagnosis and treatment are highly recommended, however, due to their high cost and lack of financing, constitute a barrier for patients [
58]. Nonetheless, in the Chilean private health system, some hospitals offer sequencing analysis for the diagnosis of lung cancer.
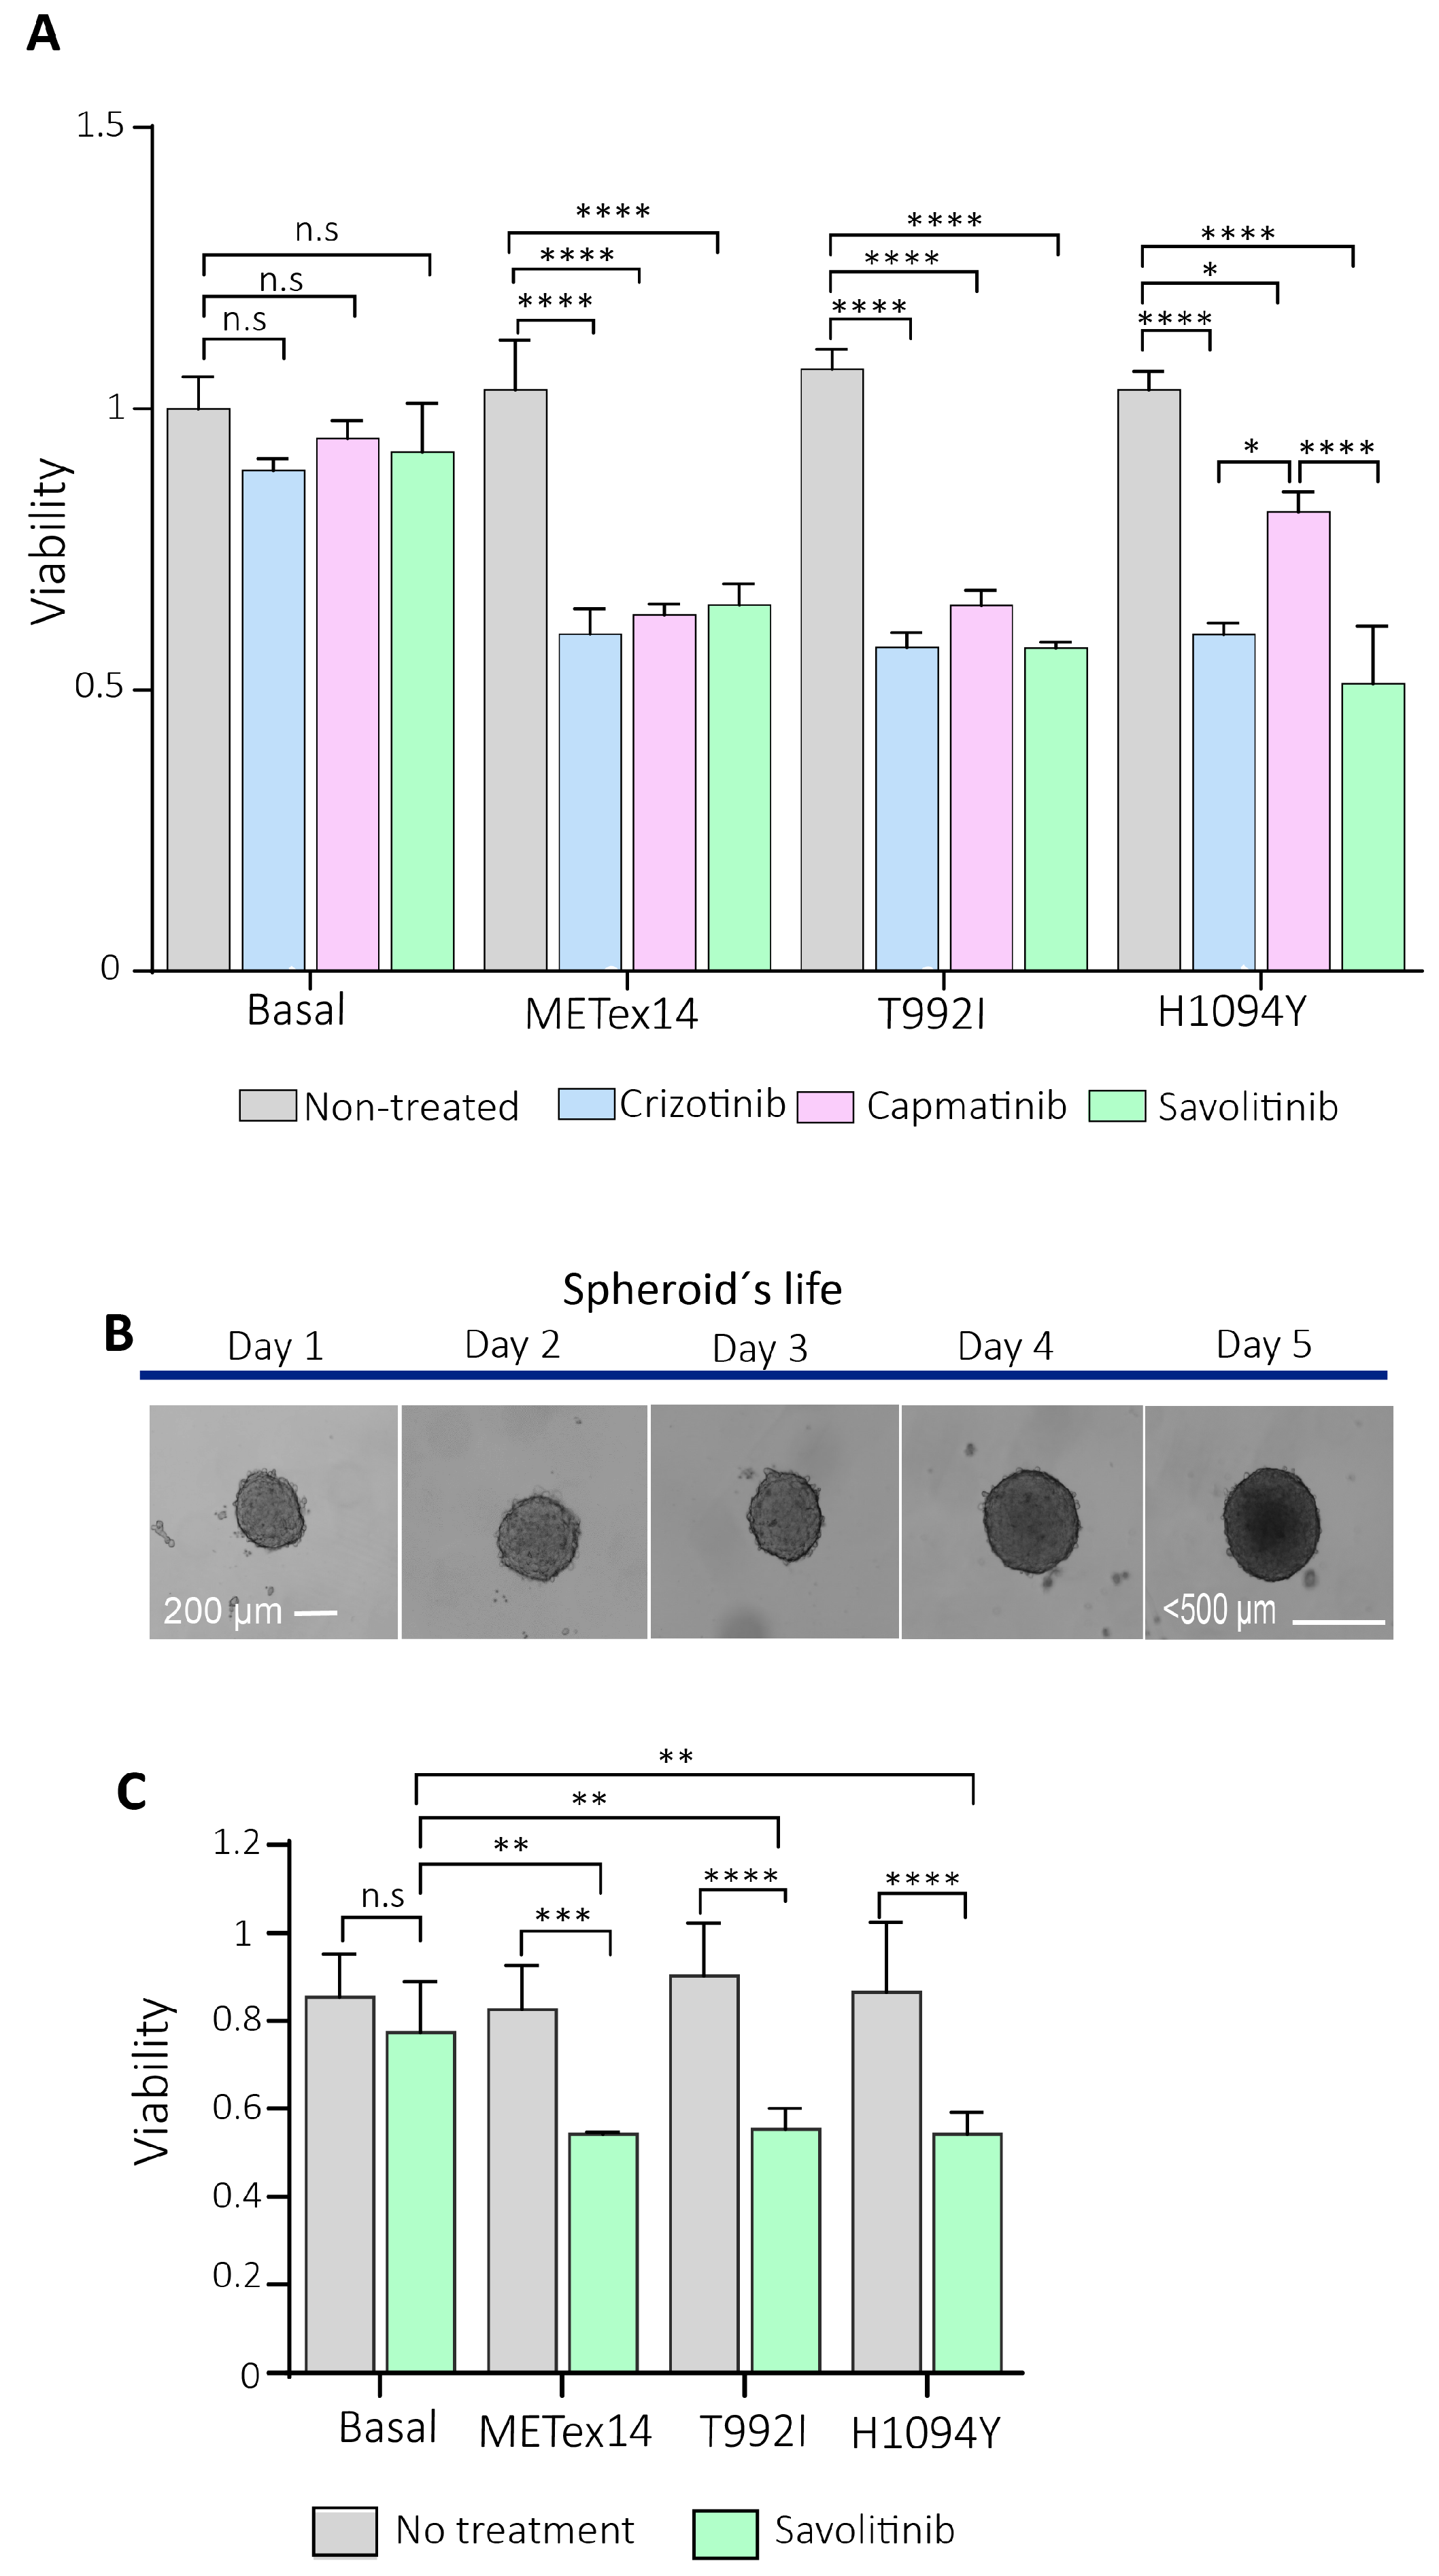
As the already approved drugs such as savolitinib, capmatinib, and crizotinib evidenced a decrease in the viability of cells in culture cells, the next step would be to assess the efficacy of c-Met inhibitors in patients with these variants and without other known actionable, as recently tested in a patient with Met H1094Y [
59]. An example of the NGS diagnosis and target therapy indication for patients with predicted actionable variants is the DRUP project (Drug Rediscovery Protocol), a nationwide Dutch program that considered patients with any advanced solid cancer to treat them with off-label precision drugs, considering the diagnosis the actionable and the bioinformatic predicted actionable variants as biomarkers for those patients excluded of target therapies indication due to the absence of known actionable variants [
60]. So, to expand the use of already approved target drugs, validating c-MET inhibitors against novel actionable variants is a must.
4. Materials and Methods
South American NSCLC cohort. The cohort was selected from the study Characterization and Validation of Molecular Diagnostic Technologies for LC Patients from Chile, Brazil, and Peru (NCT03220230). The recruitment period was between July 2015 and October 2018, encompassing 37 health centers from three countries. A complete description of the study protocol has been provided previously [
37,
38].
Sequencing and quality control. Two to four Tbx FFPE sections of 5 μm with at least 5% tumor tissue were included. The RecoverAll extraction kit (Thermo Fisher Scientific) was used to isolate RNA and DNA. The Oncomine Focus Assay (OFA, Thermo Fisher Scientific) was used to prepare libraries and sequenced in the Ion Personal Genome Machine System to perform the NGS. The QC metric thresholds were at least 240 median reads per amplicon, 60% of aligned reads for DNA libraries, 20,000 correctly mapped reads, and three out of five expression control amplicons detected for RNA.
Alignment and calling of variants. A minimum allele frequency of 5% (SNV) and 7% (Indel) was determined, and the minimum coverage that admits a variant was 10x (SNV and Indels). In addition, the minimum coverage of the variant location is 50x, with minimum variant scores in phred-scaled values set at 6 for SNV and 20 for Indels. All remaining reference/reference sites, variants with allelic frequency <5%, and observed alternative alleles <10 reads were removed from the DNA VCFs. For RNA VCFs, only fusions with more than 20 reads were maintained. Oncomine variants were selected as those located in positions within the predefined hotspot list of Oncomine Focus DNA Hotspots v1.4.
VUS-driver variants prediction. The clinical significance of the variants was obtained through the categorization made by Annovar [
61], Cancer Genome Interpreter [
30], and OncoKB[
40]. Then, to annotate functional consequences of genetic variation of VUS, we used diverse predictor algorithms such as the Cancer Genome Interpreter (CGI) platform’s prediction algorithm to identify driver variants that could potentially be treated with targeted therapies using BoostDM and OncodriveMut [
29,
30]. The Combined Annotation-Dependent Depletion (CADD) value is a pathogenicity predictor that integrates several genomic features and functional predictions [
31]. The SIFT algorithm predicts whether an amino acid substitution will likely affect protein function [
32,
33]. Polyphen-2 is another variant effect predictor that divided the analysis into three categories: benign, possibly damaging, and probably damaging to the protein function [
34], and Mutation Taster [
62]. After obtaining all the algorithm’s responses, the predicted driver variants were those confirmed as predicted drivers for all algorithms (
Table S.3).
Culture cells. The H1993, HEK293T, and the BEAS-2B were maintained in RPMI 1640 (Gibco # 22400089) supplemented with 15% fetal bovine serum (SBF, Sigma #12103C), DMEM high glucose (Gibco # 12430054) supplemented with 10% SBF and the BEGM bronchial epithelial cell growth medium Bullet Kit (Lonza #CC-3170), respectively, all with 1% of penicillin/streptomycin (Thermo Fisher Scientific #15140122) in a CO2 incubator at 37°C. Cells are routinely tested for mycoplasm.
Plasmids expression. The METex14 (pLV[Exp]-Puro-CMV (hMET[NM_001127500.3]*(delete exon 14)) (VB210712-1387jhm), T992I (pLV[Exp]-Puro-CMV (hMET[NM_000245.4]*(T992I)) (VB210720-1190man), H1094Y (pLV[Exp]-Puro-CMV (hMET[NM_000245.4]*(H1094Y)) (VB210720-1189kqp) were designed by Vector Builder, and the pLentiCMV MET GFP Puro (Addgene #37560) was acquired in Addgene. Dr. Marcelo Ezquer gently donated the transfection control GFP (pSIH1-H1-copGFP) vector. Lipofectamine 3000 was used in a proportion of 1:3 (DNA/lipofectamine) with the Opti-MEM™ I Reduced Serum Medium (Gibco # 31985070) as a vehicle, and after 48 hours, the cells were microphotographed in a Cytation3 and incubated with puromycin (1ug/ml) for 16 hours. The cells were allowed to expand for 2 to 5 days before carrying out the experiments.
Drugs. The Crizotinib (Cayman #12087), Capmatinib (Cayman, #INCB 28060), and Savolitinib (Cayman #33332) were used at 140nM, 130 nM and 40 nM, respectively, for 48 hours, and after a total of 72h, the MTS assay was carried out to measure the cell viability.
Western blot. The total proteins were extracted with lysis buffer 4x Laemmle buffer (#1610747, BIO-RAD), including a cocktail of protease and phosphatase inhibitors and 0.5 M dithiothreitol (DTT). Proteins were resolved by SDS-PAGE, transferred to the PDVF membranes, blocked with 5% bovine serum albumin (BSA, Sigma #A9418) in 0.1% TBS-Tween20, and blotted with specific antibodies MET total (Anti-Rabbit, #ab5662, ABCAM), Anti-Metp (phosphorylated on Y1230 + Y1234 + Y1235) antibody, #ab137654), anti-AKT (#4691, Thermo Fisher Scientific) and phosphorylated anti-AKT (#9271, Thermo Fisher Scientific) and β-actin (#A3853, Merck). Primary antibodies were prepared in a blocking solution, and membranes were incubated all night at 4 °C. Then, they were washed in TBS-Tween20 and further incubated with HRP-conjugated secondary antibodies. Samples were detected with EZ-ECL and visualized in an Amersham Imager 600 (GE Healthcare).
Survival of proliferative cells assay. The colorimetric assay CellTiter 96® AQueous One Solution Cell (Promega #G3582) was used to determine the number of viable cells in proliferation using 20 ul of tetrazolium compound for 4000-5000 cells [3-(4,5-dimethylthiazol-2-yl)-5-(3-carboxymethoxyphenyl)-2-(4-sulfophenyl)-2H-tetrazolium, inner salt; MTS in 200ul of final solution incubated for 2 h protected from the dark to then record the absorbance at 490 nm in the Citation3 absorbance reader. Then to graph the results, the absorbances were normalized.
Wound healing assay. Twenty-four hours after seeding the already transfected cells (empty GFP, METex14, T992I, and H1094Y) in 12-well plates with reduced fetal bovine serum, the cells were treated with and without 50 ng of recombinant human HGF (R&D #294-HG), and the wound was immediately made with a pipette tip of 200 µl. Using the Cytation3 microscope mode, ten measures were taken for each wound, and the percentage of wound closure was calculated relative to the wound distance average at time zero for each experimental condition.
Spheroid formation: First, the spheres were performed individually in a 96-well round plate previously precoated with the anti-adherent Poly(2-hydroxyethyl methacrylate) (pHEMA) stock solution at 120 mg/ml diluted in 95% ethanol PA, allowing it to homogenize while stirring overnight at room temperature, protected from light, to subsequently, on the same day of use, create a working solution at a concentration of 5 mg/ml to incubate the 96-well round bottom plates. Then, the plates were incubated for 72 hours at 37°C or until the polymer was dry and translucent. Once dry, the plates were sterilized under UV light for 15 minutes and sealed with Parafilm to keep them at 4°C upside down. Next, once stabilized at room temperature, the seeding of 3,500 H1993 cells was chosen, which was the optimal number of cells so that the sphere did not exceed 500 µm in diameter using the cell homogenate technique with 100 µl of RPMI. The spheroid’s size was measured with the Cytation3 software, taking the mean of three different diameters per sphere. The 3 independent experiments were performed using five spheres (15 spheres in total) for each experimental condition.
Statistical analysis: All statistical analyses were performed with at least three independent experiments. Statistical differences between the two conditions were assessed with a non-parametric t-test (Mann–Whitney correction). Comparisons between more than two conditions were analyzed with parametric one-way or two-way ANOVA (Tukey correction for multiple comparisons). Analyzes were performed with the GraphPad Prism 6 Software (San Diego, CA).
Molecular docking and simulations. Molecular docking was utilized to investigate the molecular foundation and potential biological effects of MET and Savolitinib (SLB). We chose to examine the segment of MET tyrosine kinase that is involved in drug interactions based on the documented functioning MET tyrosine kinase structures found in PDBid: 8AU3, 8AU5 (Grädler, Ulrich, et al. 2023). We developed five separate systems for this method: a) WT, b) WT:SLB, c) T992I:SLB, d) H1094Y:SLB, and e) METex14:SLB.
The protein structures for systems a), b), c), and d) were modeled in 3D by extracting amino acid residues 963 to 1345 from the entire MET sequence using AlphaFold [
63]. These structures closely matched the secondary structure of PDBid: 8AU3 and 8AU5 [
64]. We extracted the sequence segment corresponding to the original MET tyrosine kinase (1010-1345) in the case of Metexon14 and appended the preceding 70 amino acids to create a model of similar size. Savolitinib (SLB) structure was obtained from Drugbank (DB12048) and used as a ligand in the docking simulation process. The grid was positioned at residue H1094 to serve as a reference point for other medicines in experimental structures, resulting in a final size of 12 x 12 x 12 Å3. The Glide tool from the Schrodinger program was utilized for conducting docking simulations in the Extra Precision (XP) mode, as described by Friesner et al. in 2006. After identifying the possible starting location of SLB, the structure was evaluated to establish 5 molecular systems. The Protein Preparation Wizard in Schrödinger Suite 2023-4 was utilized to create the first configuration of the kinase enzyme structures. This involved incorporating hydrogen atoms, determining bond ordering, constructing rotamers, and assigning protonation states. Epik was utilized to predict the ionization and tautomeric states. The systems were hydrated using the TIP3P water model and subsequently balanced with a 0.15 mol/L NaCl solution, resulting in a final size of approximately 70 x 70 x 90Å3. An isothermal-isobaric ensemble was established at 300 K. Each system underwent production simulations lasting 500 nanoseconds. Molecular dynamics simulations were performed utilizing the DESMOND software with the OPLS 2005 force field model.
Figure 1.
The mutational profiles of NSCLC actionable genes in South America evidenced a high prevalence of MET exon 14 skipping and uncertain significance MET variants. A) Each column of the oncoplots represents a patient and the rows show the prevalence of variants in the eight NSCLC actionable genes. B) Variant prevalences´ comparison in eight actionable NSCLC genes. P-values= 0.008**. C) Gender, subject country, tumor stage, and tobacco use information of the patients with variants in the MET gene. D) MET variant categorization according to the clinical significance, the number, and the percentage of patients.
Figure 2.
RNA and DNA MET sequencing analysis evidenced differences in diagnosing the MET exon 14 skipping variant. A) DNA regions of exons 13, 14, 15, and the introns 14 and 15 of the MET gene (GRCh37.p13). Below are the DNA variants’ locations that affect the coding sequence of exon 14 and the splicing donor region of the MET gene (variants located in red in rows) of each patient with a DNA variant in the SD region.
B) The broad spectrum of RNA reads for the METex14 variant is shown in the x-axis. Each column represents a patient; the pink line defines the threshold (120 reads) for the positive MEtex14 diagnosis [
26].
C) Number of patients categorized as negative and positive for METex14 according to the numbers of RNA reads.
D) The conceptual map represents all TBx from NSCLC patients with a pair of RNA- and DNA-sequenced QC pass data.
E) Pearson correlation between the RNA reads and the lectures from DNA.
F) Pearson correlation analysis between the allele frequency of positive METex14 DNA variant (X-axis) with the number of RNA reads (Y-axis).
G) Altered genes in the tumor profile of patients with low RNA reads for METex14.
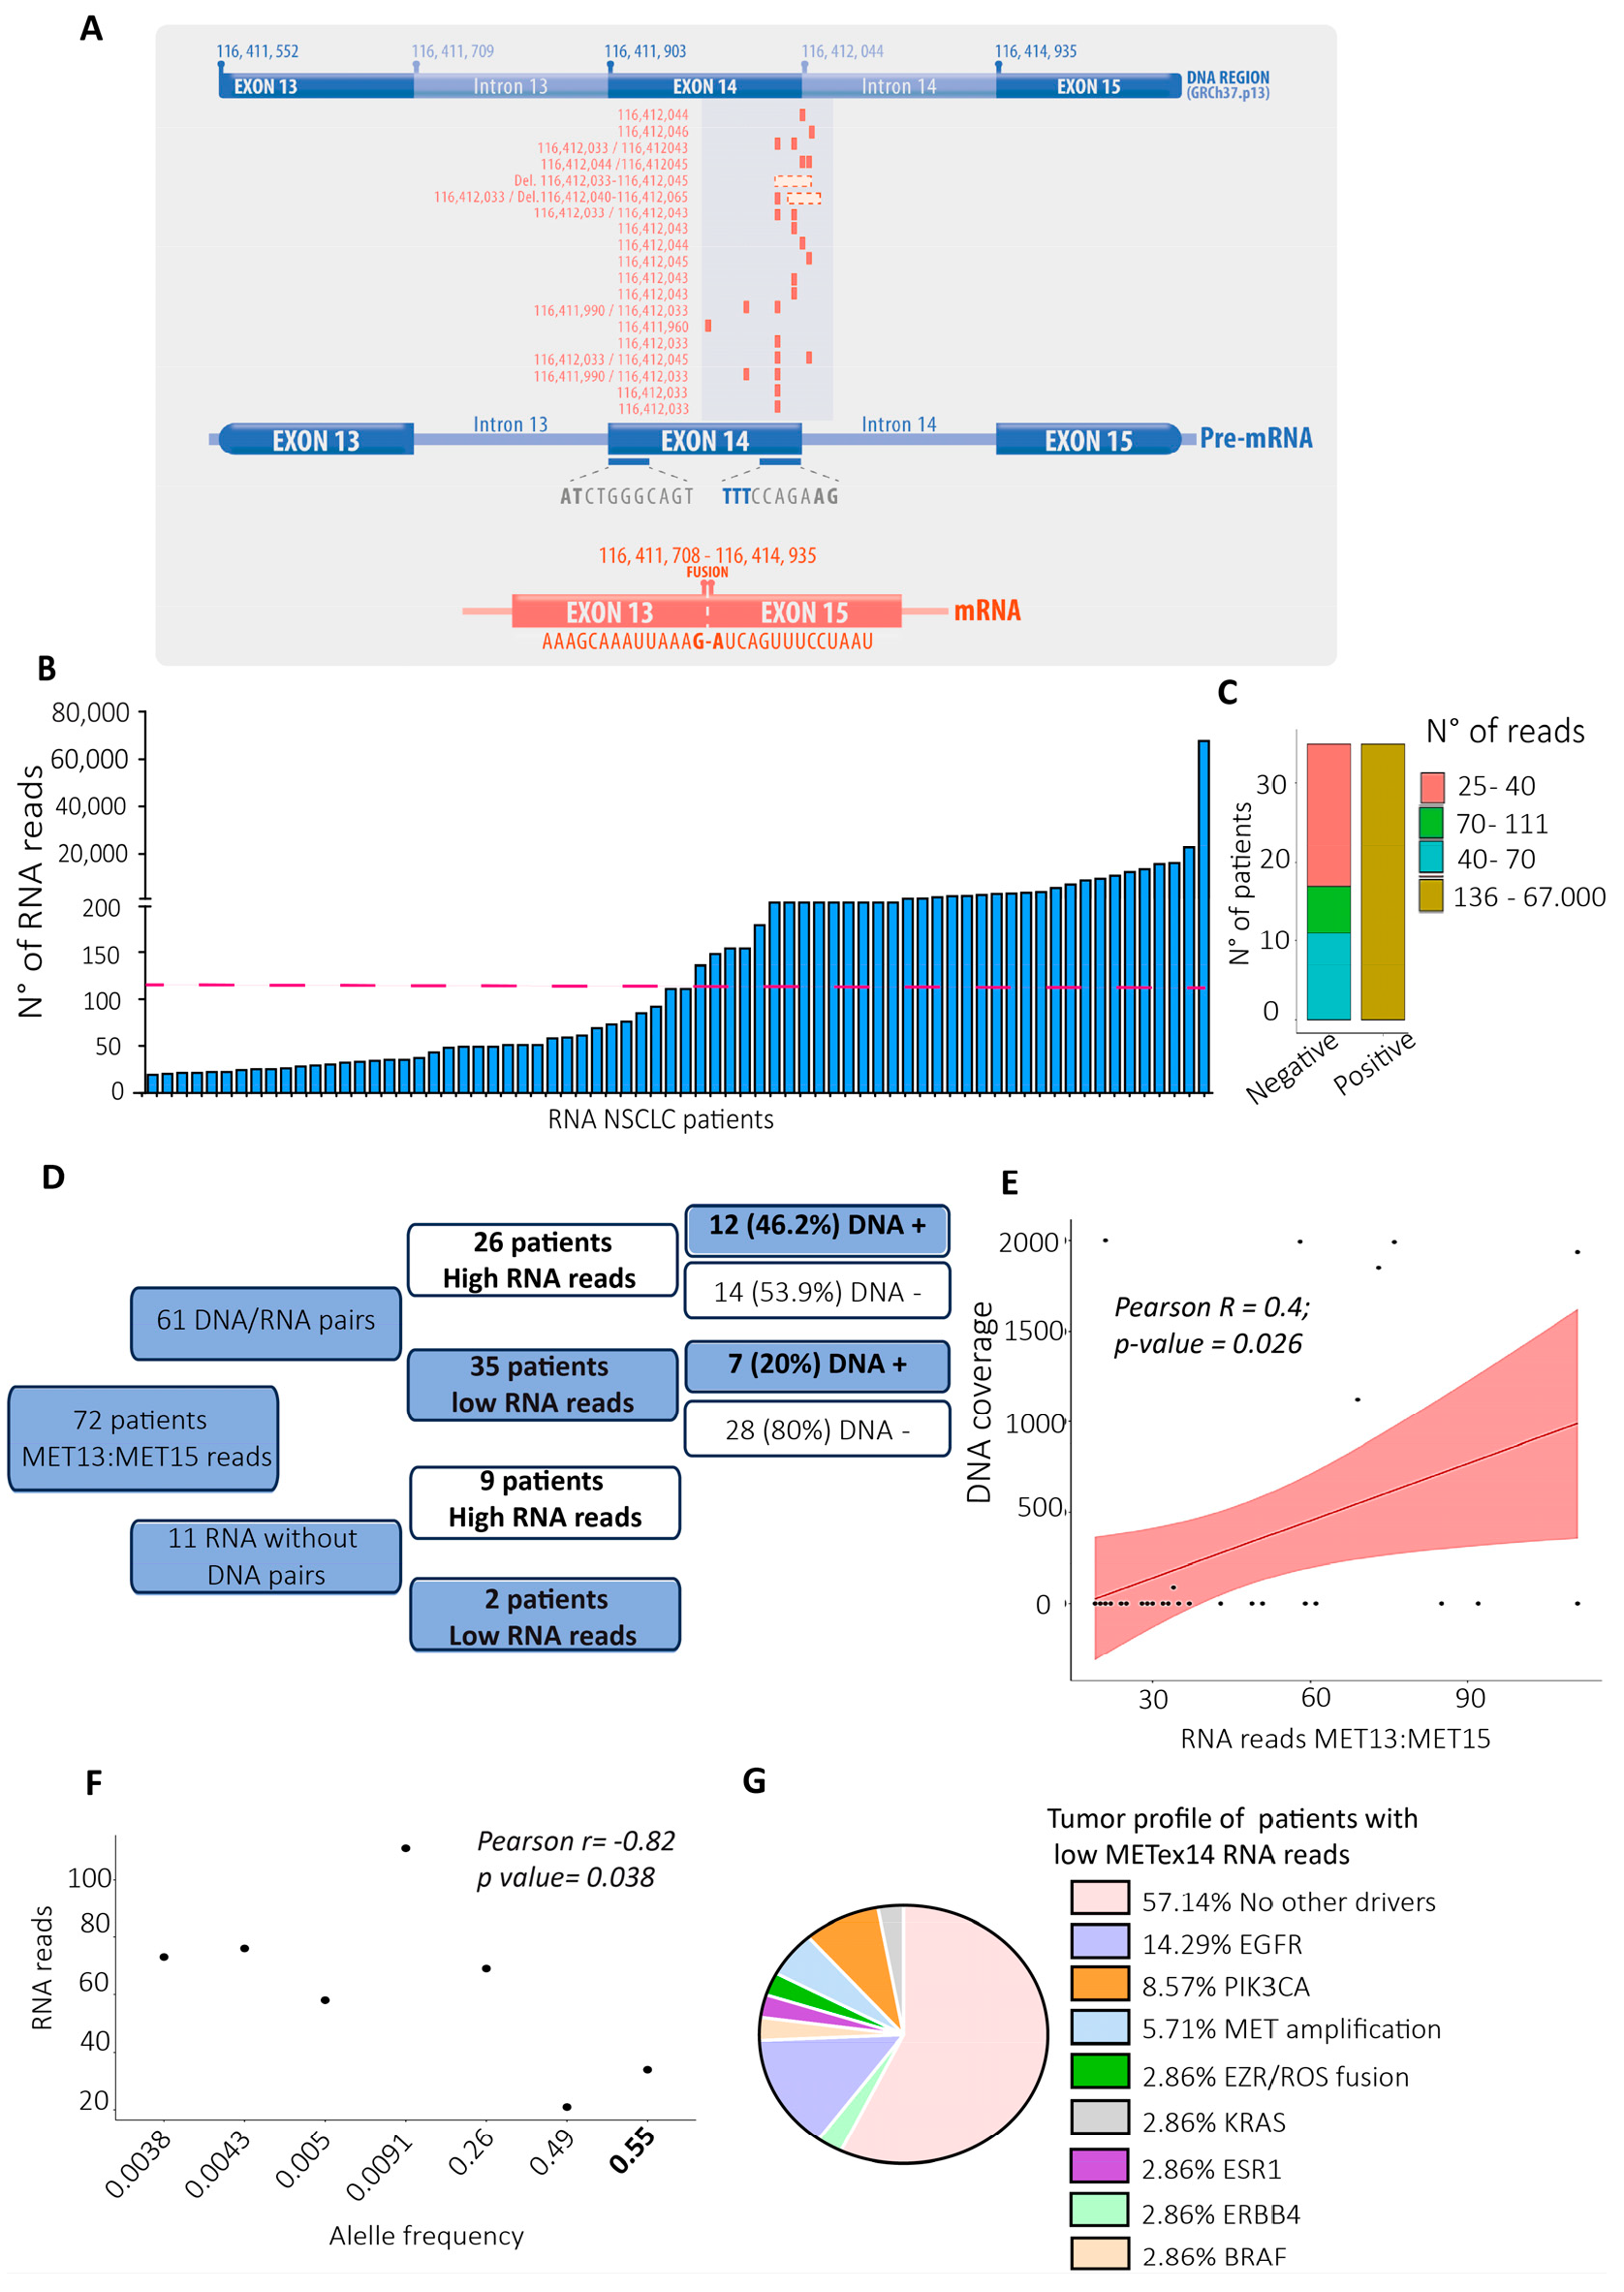
Figure 3.
T992I and H1094Y were the most prevalent and bioinformatically predicted drivers and actionable. A) All VUS were localized in the Met protein domains. The green, red, blue, and yellow rectangles represent the location of the Sema, PSI, TIG, and kinase protein domains, respectively. Above the lolliplot, (I) Dots blue represent sensitive regions to target therapies, according to Oncokb. (II) The exons are represented in blue and light blue boxes. (III-IV-V) subcellular location of the mature protein. B) Driver prediction of the VUS located at the JM and TK domains (x-axis) by the bioinformatic algorithms CGI, Cadd13, polyphen2, mutation taster, and sift. Light pink and white color evidence predicted passengers and tolerated variants; green colors refer to those variants’ predicted drivers.
Figure 4.
The VUS predicted driver T992I and H1094Y promote survival of proliferative non-tumor cells and migration in tumor cells. A) Representative western blots of total Met and β-actin expression evaluated for the H1993 GFP (basal), METex14, T992I, and H1094Y cells. B) Densitometry levels of total Met/β-actin normalized (+SEM). The graph represents the normalized average from 3 independent experiments ±SEM. C) Representative western blots of total Met and β-actin expression evaluated for the HEK293T GFP (basal), METex14, T992I, and H1094Y cells. D) Densitometry levels of total Met/β-actin normalized (+SEM). The graph represents the normalized average from 3 independent experiments ±SEM. E) The absorbance averages of HEK293T and H1993 cells expressing GFP, METex14, T992I, and H1094Y, the cells incubated with and without HGF. F) Representative images of the wound healing assay at 0 and 24 hours of H1993 cells expressing METex14, T992I, and H1094Y treated with and without HGF. G) The wound closure percentage was calculated for each experimental condition. Finally, three independent experiments averaging ±SEM are shown. Two-way ANOVA with Tukey correction was applied, and the p-values were adjusted for multiple comparisons *p<0.05; **p<0.01; ***p<0.001; n.s., non-significant.
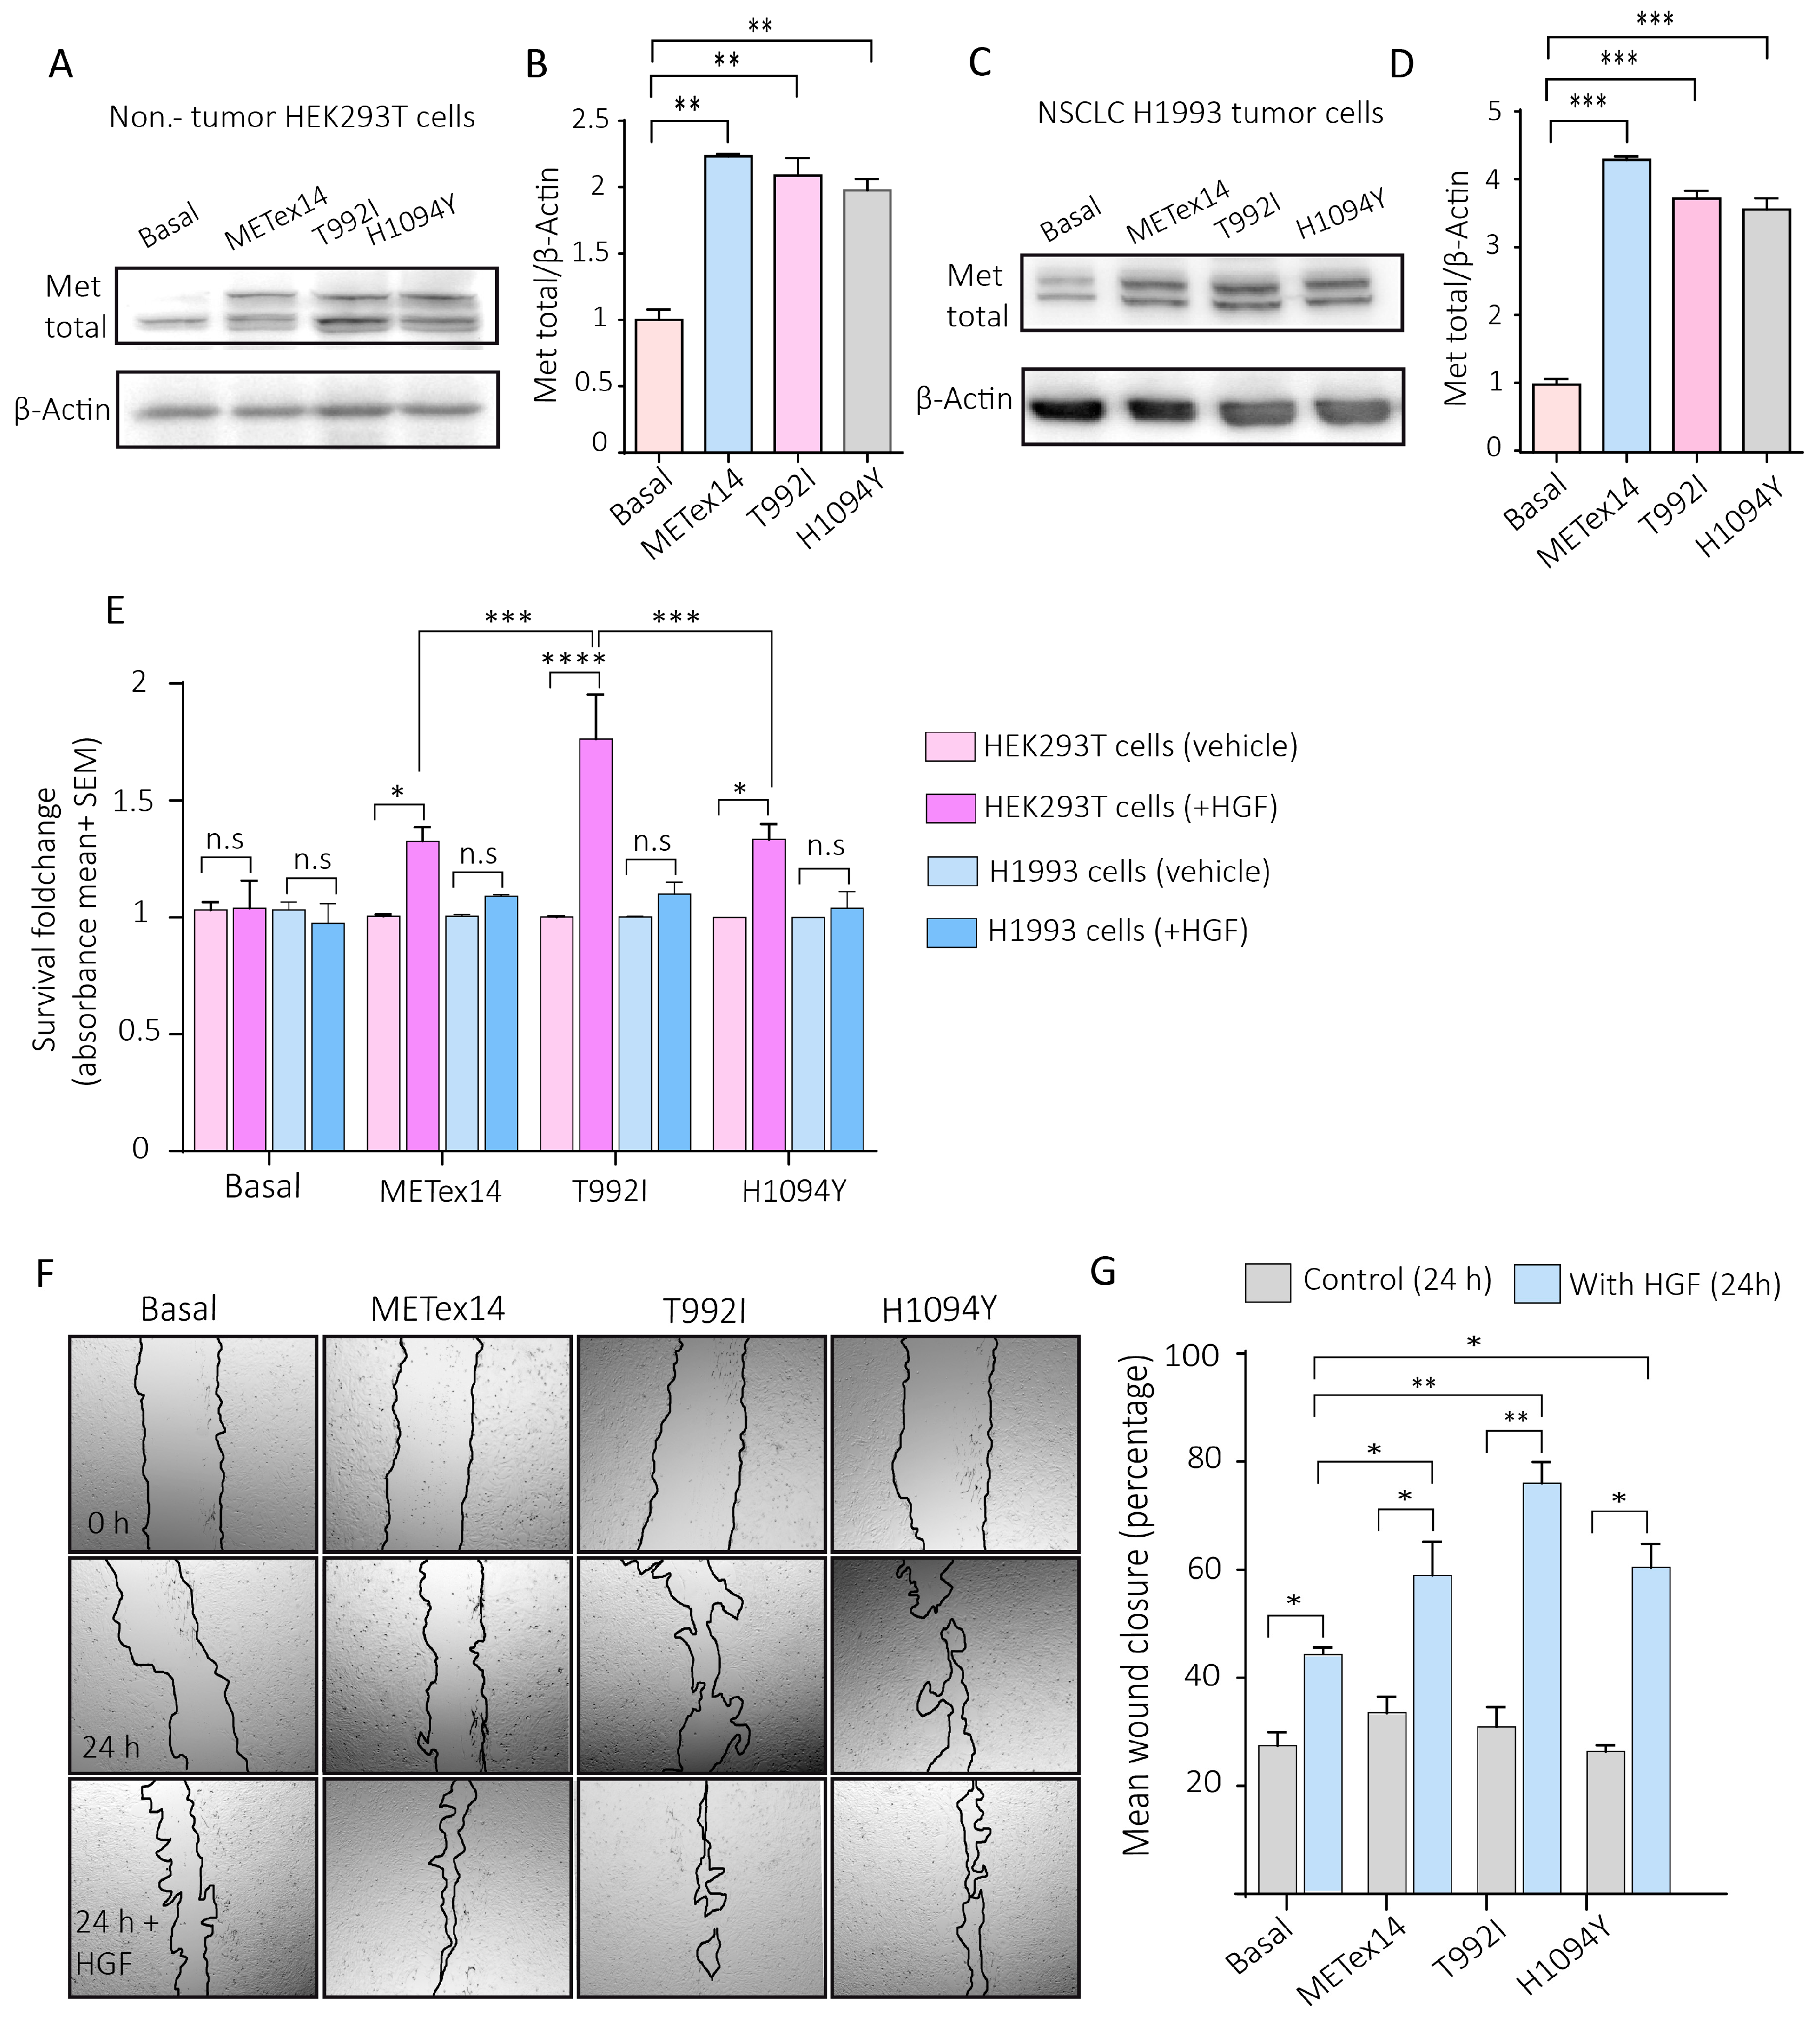
Figure 5.
The VUS predicted driver T992I and the H1094Y increase the Met activating phosphorylation and the downstream Akt signaling pathway. A) Representative western blot images of total Met, total Akt , β-actin, Met p(Y1230-1234-1235), and Akt p(S473) proteins expression of HEK293T cells. B-C) Densitometry levels of Met phosphorylation, Akt phosphorylation, and β-actin were normalized relative to the total Met and Akt. D) Representative western blots of total Met , total Akt , β-actin, Met p(Y1230-1234-1235), and Akt p(S473) protein expression of H1993 cells. E-F) Densitometry levels of Met phosphorylation, Akt phosphorylation, and β-actin normalized relative to the total Met and Akt for H1993 cells. Graphs represent the normalized average from 3 independent experiments ±SEM. G) Densitometry levels of Metp relative to β-actin levels. H) Pearson correlation between the Metp and Met total relative to β-actin levels. One-way ANOVA with Tukey correction was applied, and the p-values were adjusted for multiple comparisons *p<0.05; **p<0.01; ***p<0.001; n.s., non-significant.
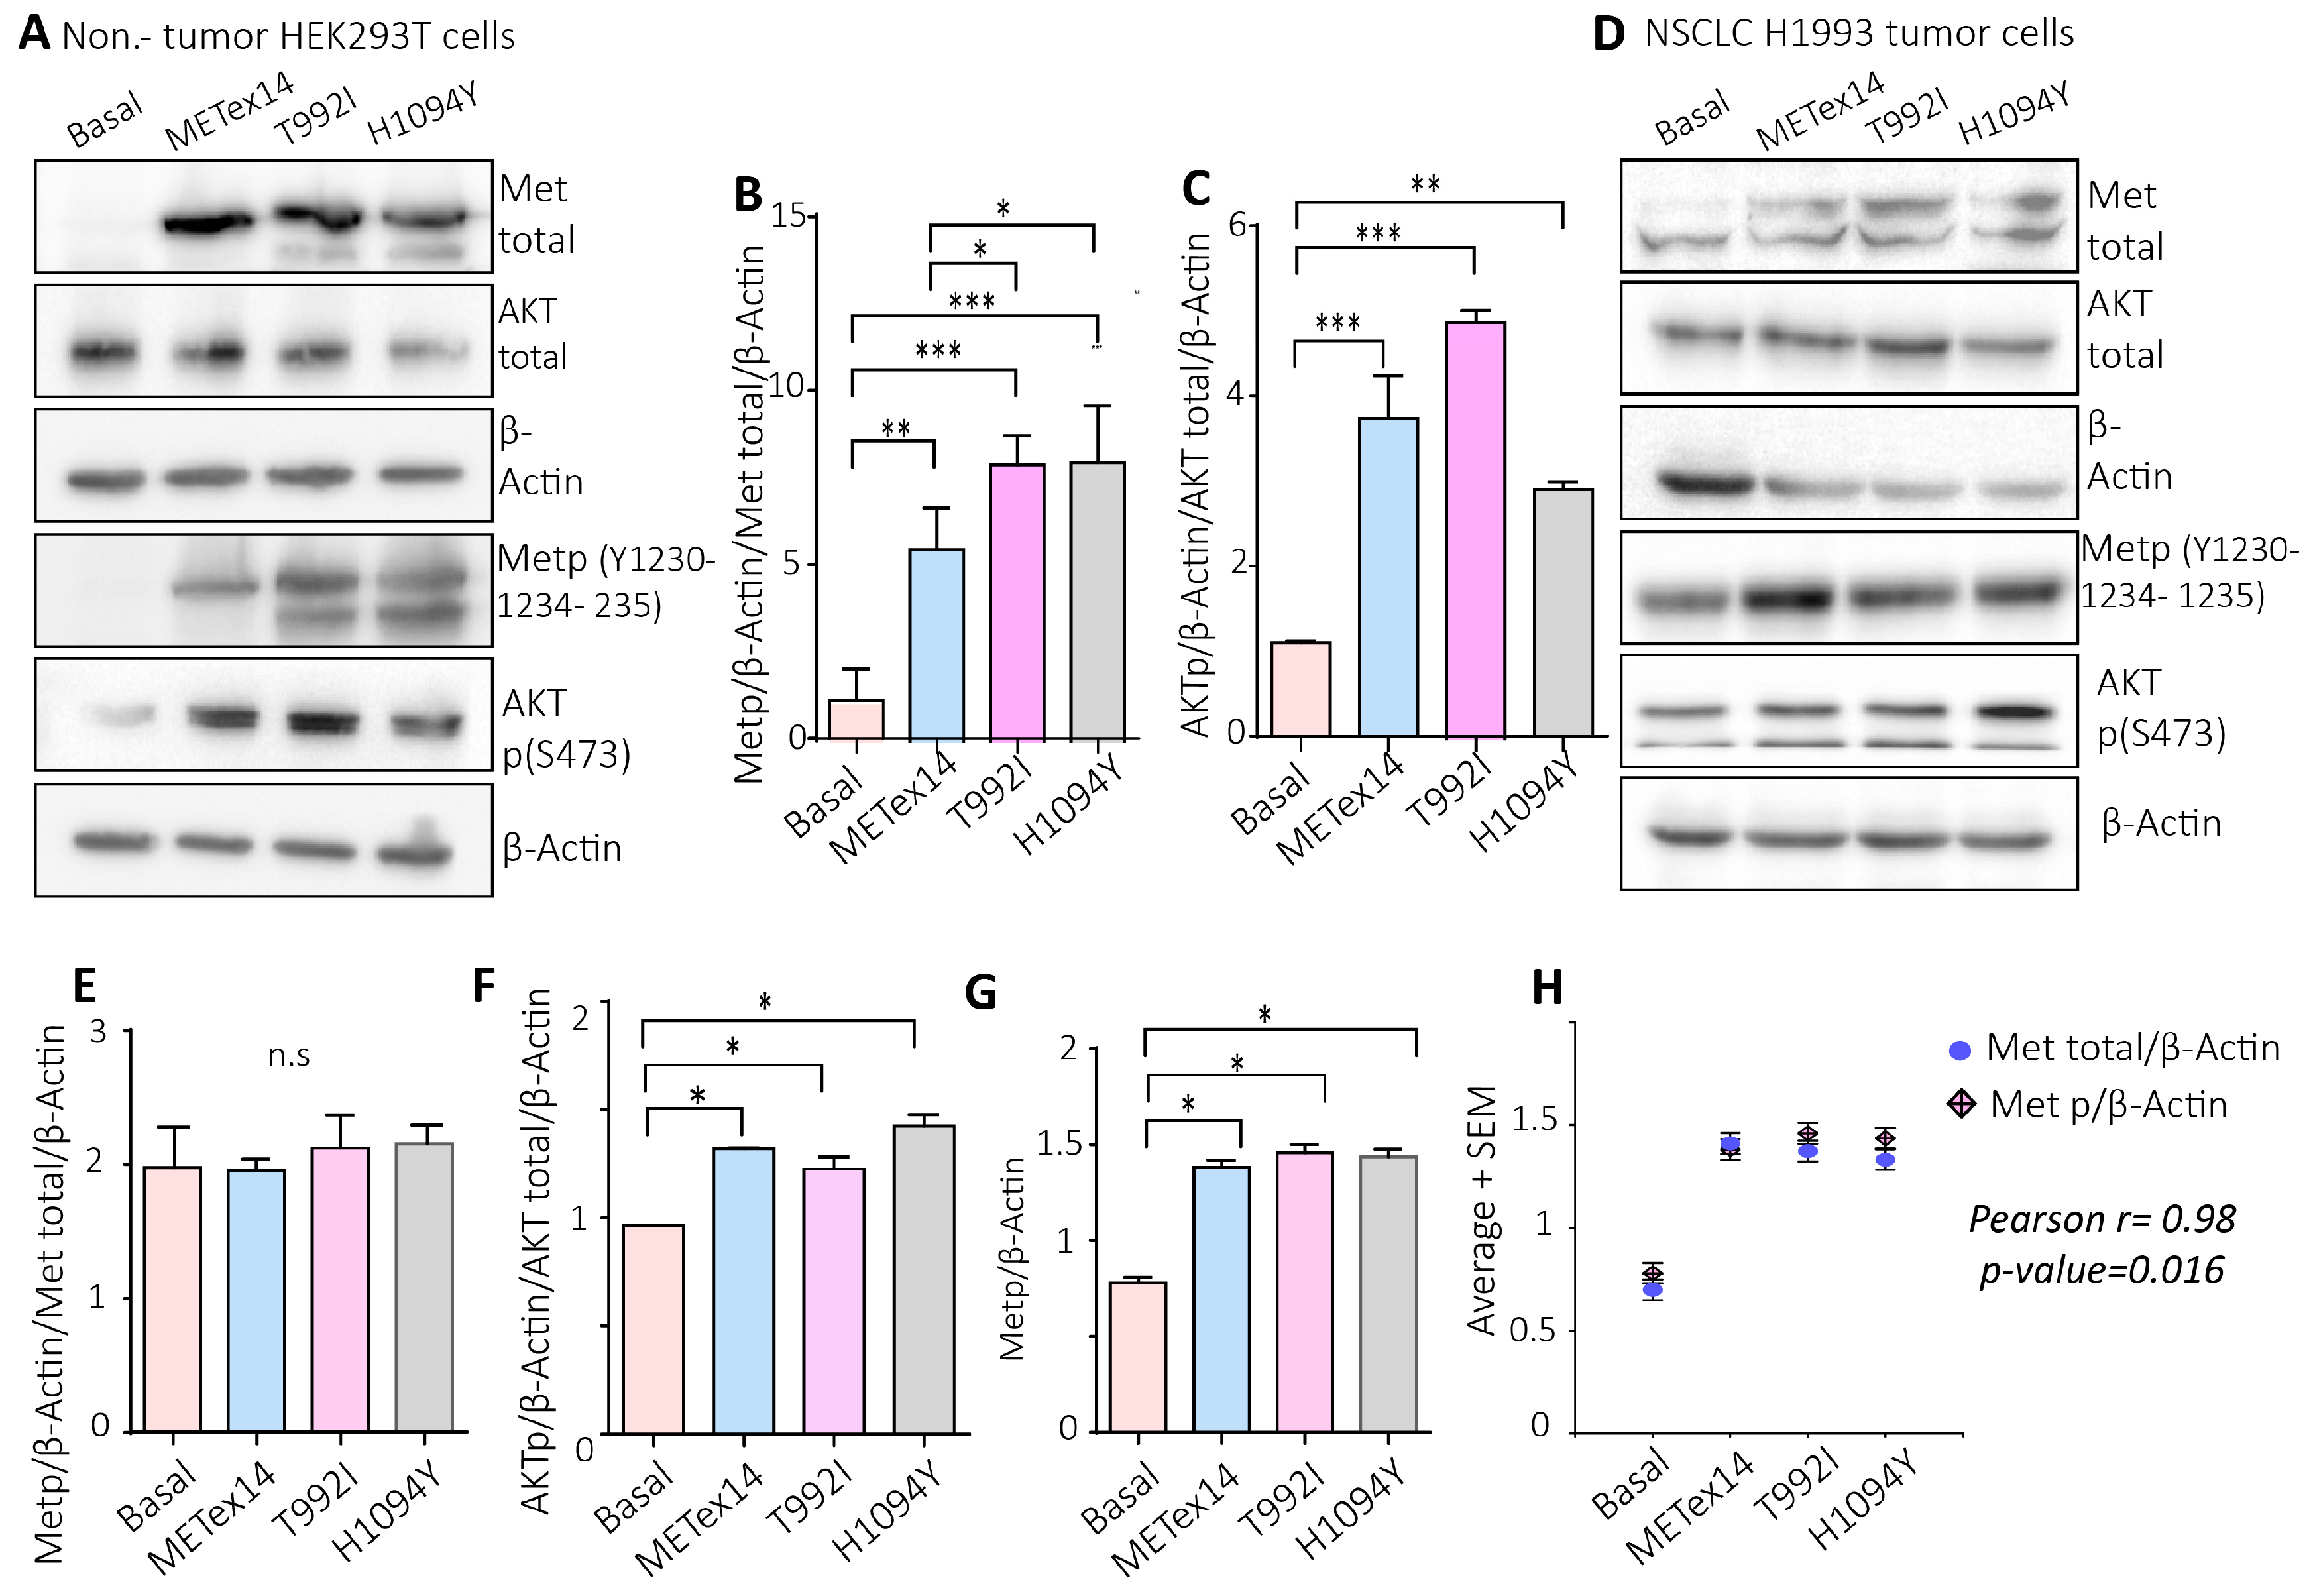
Figure 6.
The 2D and 3D cell cultures expressing the Met-predicted driver variants were sensitive to c-Met inhibitors. A) 2,000 HEK293T expressing variants were seeded in 2D and incubated for 24 h with crizotinib, capatinib, and savolitinib. The absorbance was calculated from three independent experiments and normalized relative to the non-treatment culture cells. B). Representative microphotographs were captured with a Cytation3 imaging reader of the 3D H1993 cells (spheroid) each day of their life. At day 2 of spheroid formation (~200µm of sphere diameter), the drugs were incubated, and then the cells were released from the treatment until day 5. C) The spheroids were treated with savolitinib for 24h. Each experimental condition consisted of triplicates, averaged for each experimental condition. Finally, three independent experiments were averaged ±SEM. *p<0.05; **p<0.01; ***p<0.001.
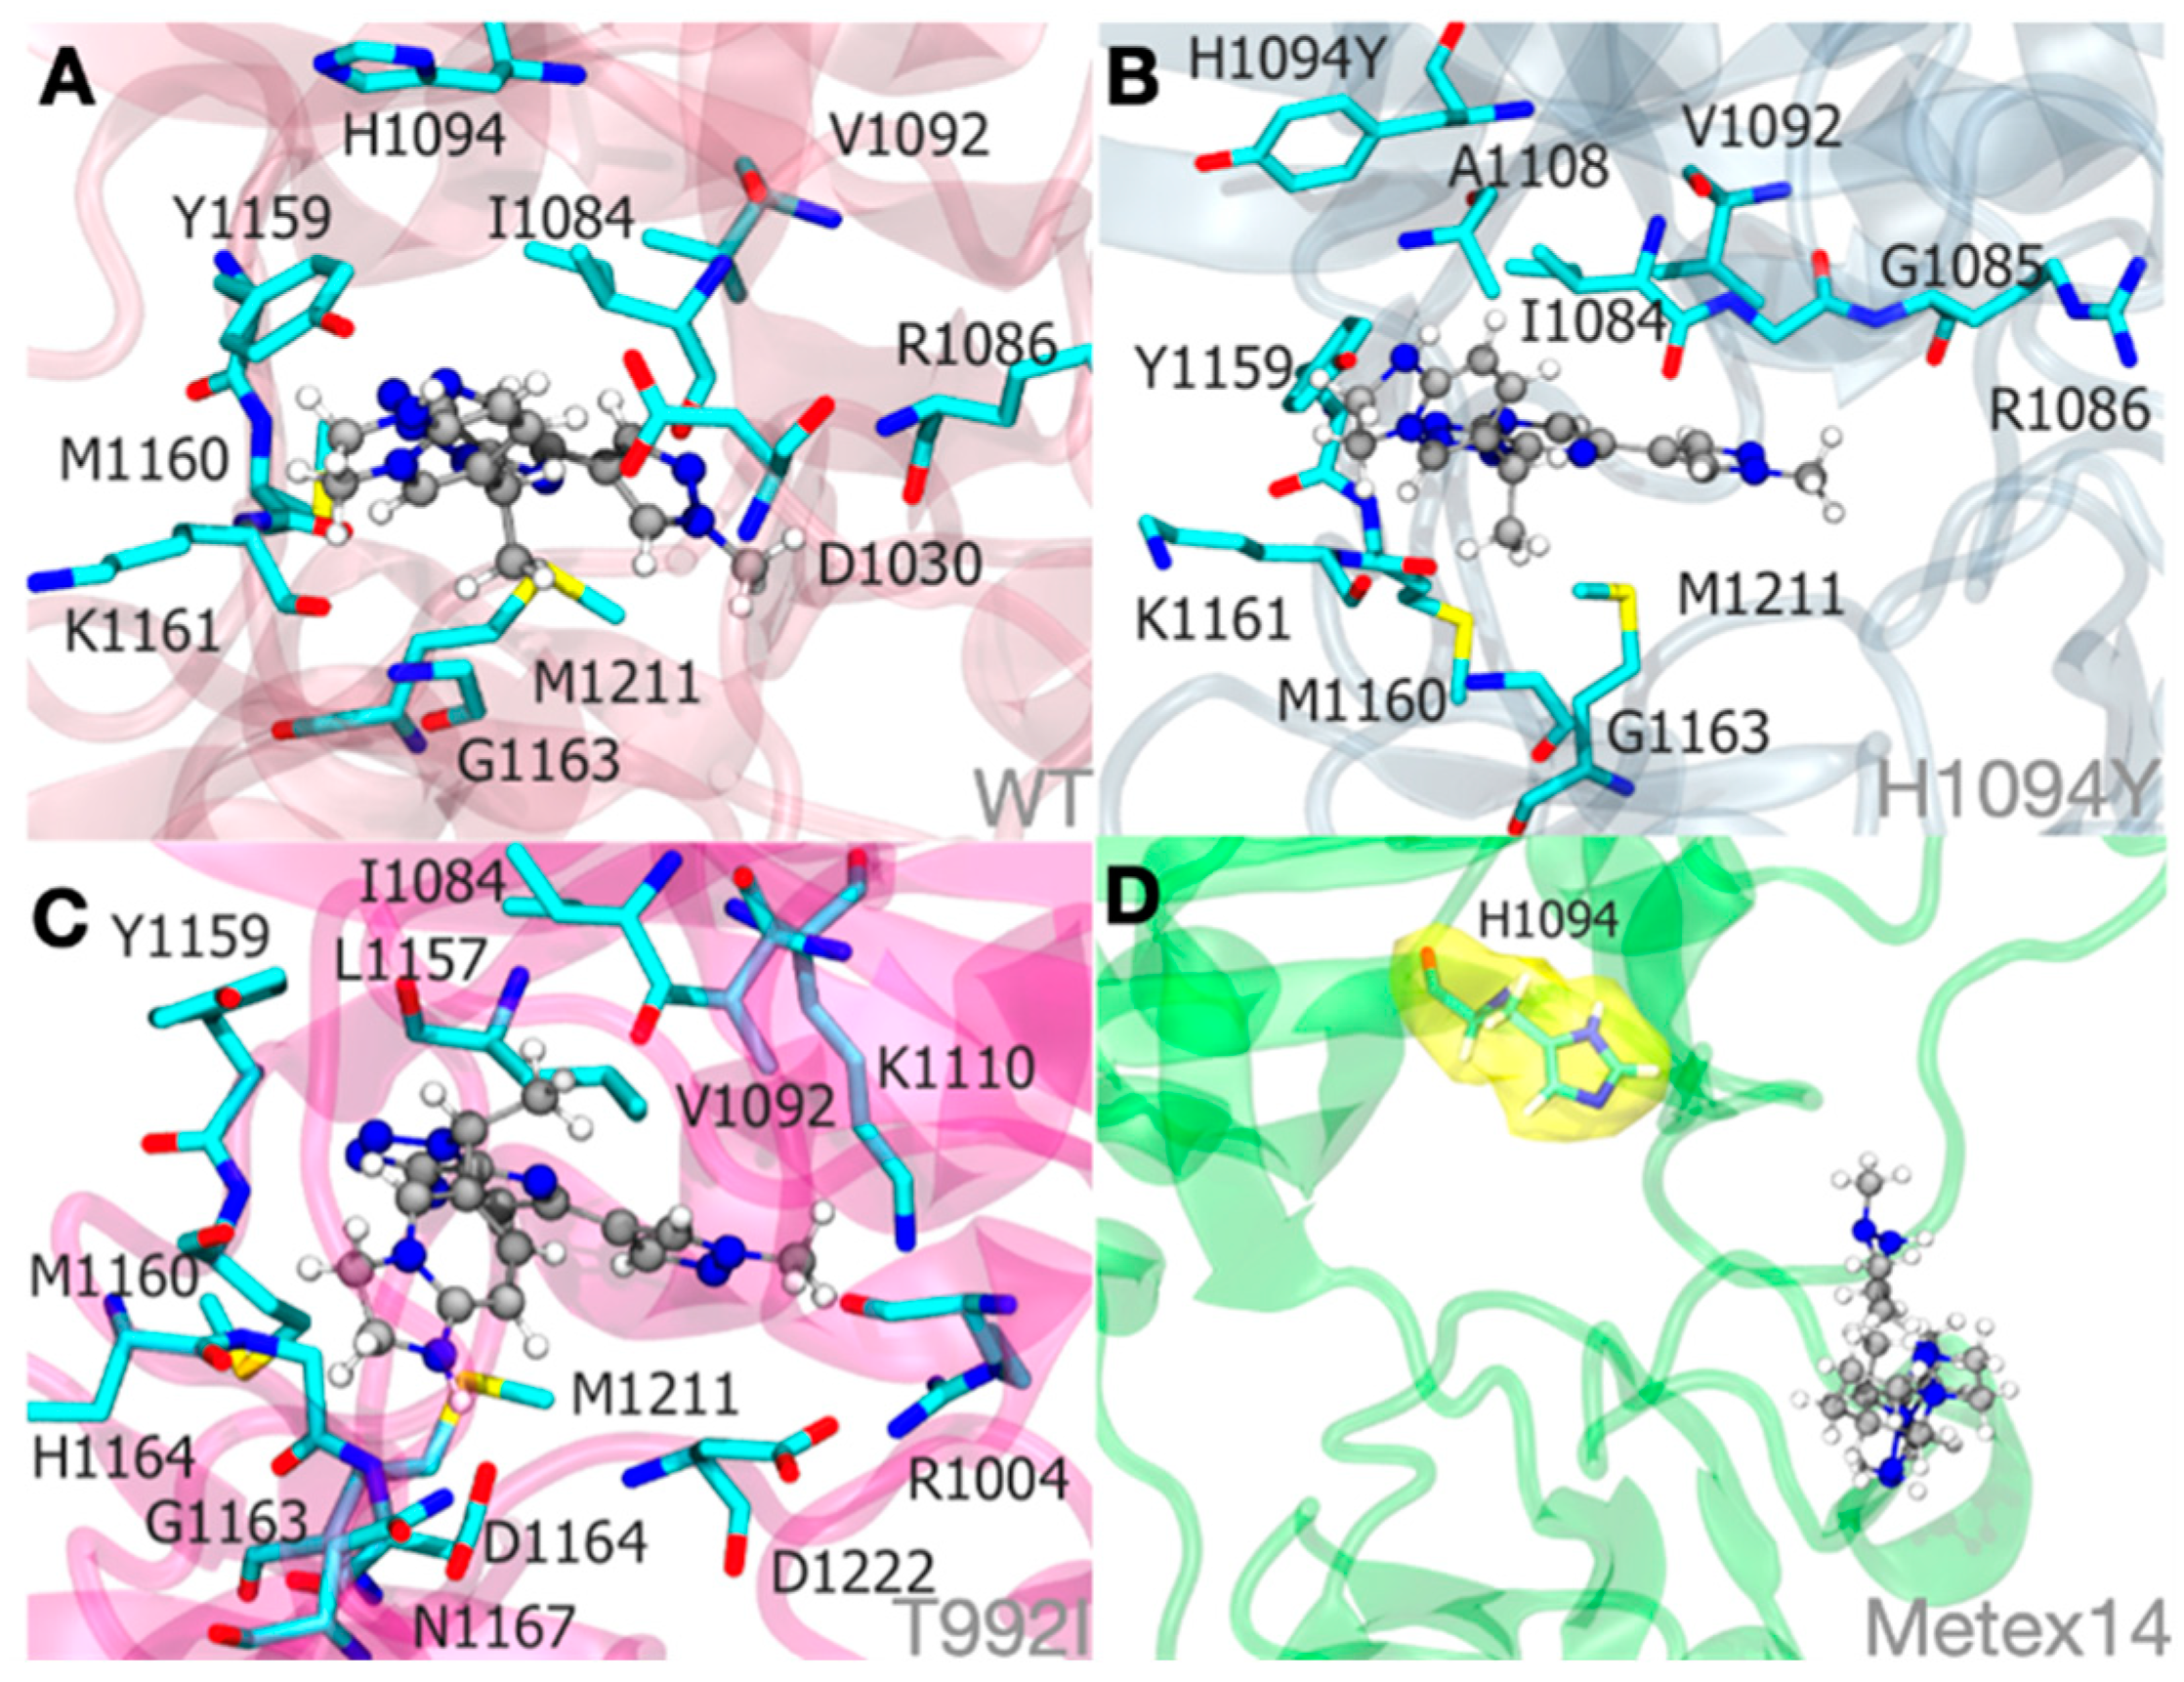
Figure 7.
Molecular dynamics simulations illustrate the Savolitinib-MET protein system binding at an approximate mean distance of 3.0. The stability of the pyridazinone ring of savolitinib within the binding site of MET WT:SLB (A), MET H1094Y:SLB (B), and MET T992I:SLB (C) complexes is largely determined by hydrophobic interactions. Significantly, within the METex14:SLB complex (D), savolitinib is incapable of achieving a stable conformation due to substantial modifications in the initial loop that precedes the tyrosine kinase domain. Therefore, an unstable pocket site is produced. To clarify its proximity to savolitinib, the H1094 residue in the METex14:SLB complex (D) is highlighted in yellow in this context.
