Submitted:
07 November 2024
Posted:
07 November 2024
You are already at the latest version
Abstract
Keywords:
1. Introduction
2. Materials and Methods
2.1. Detection Principles
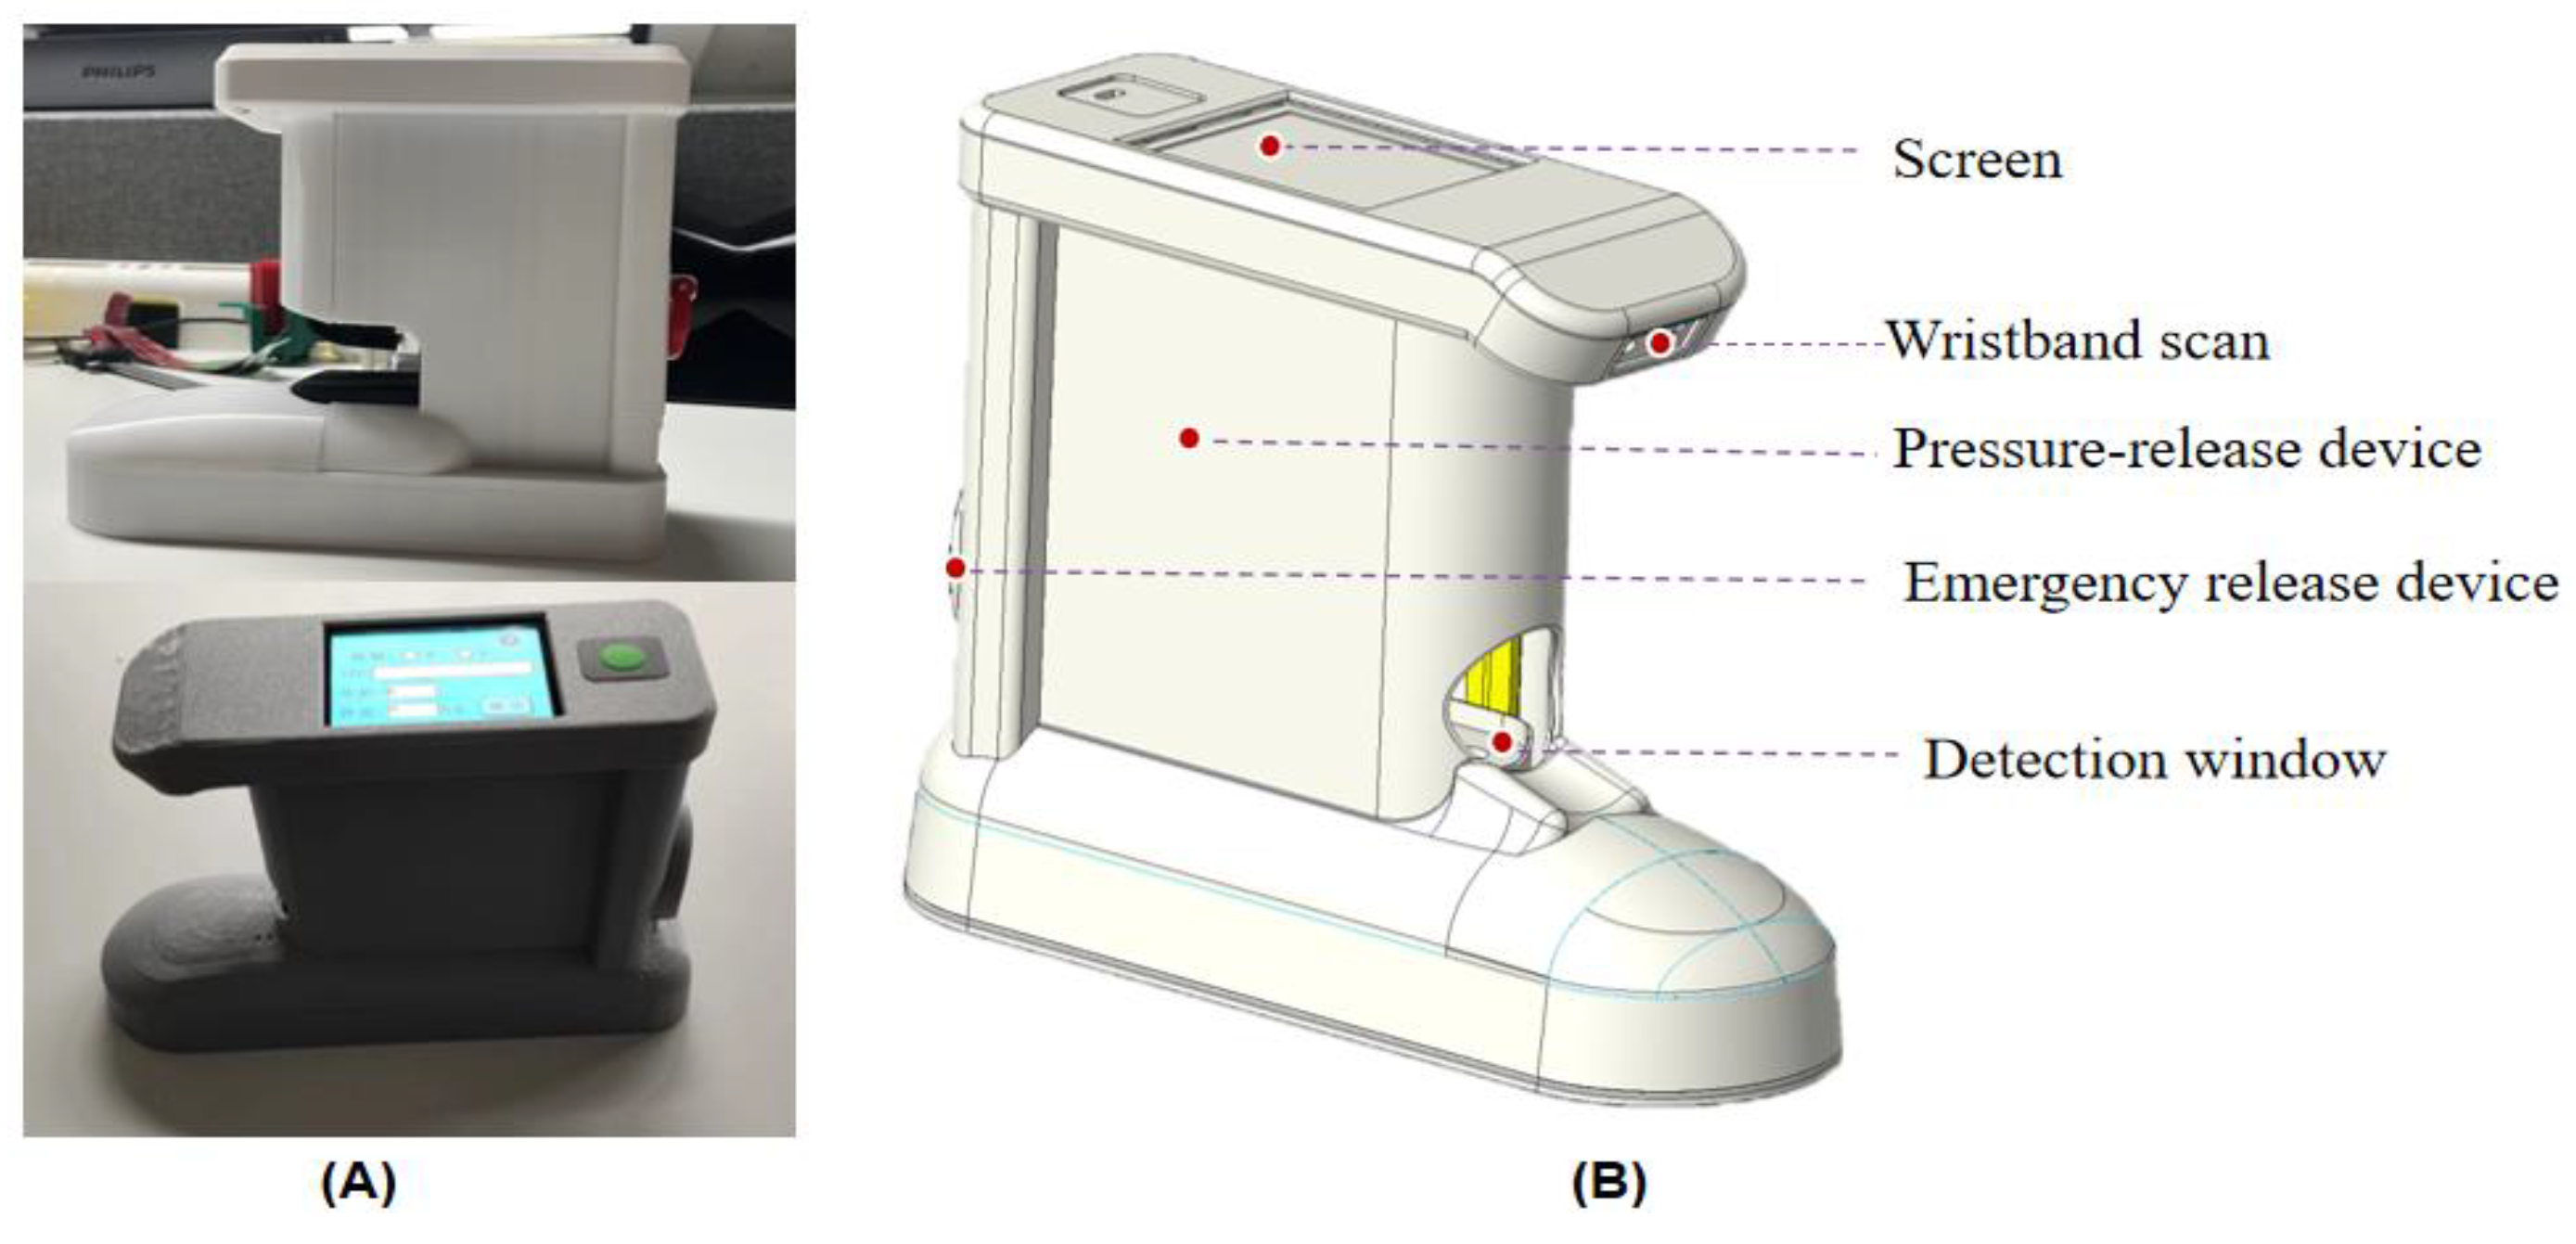
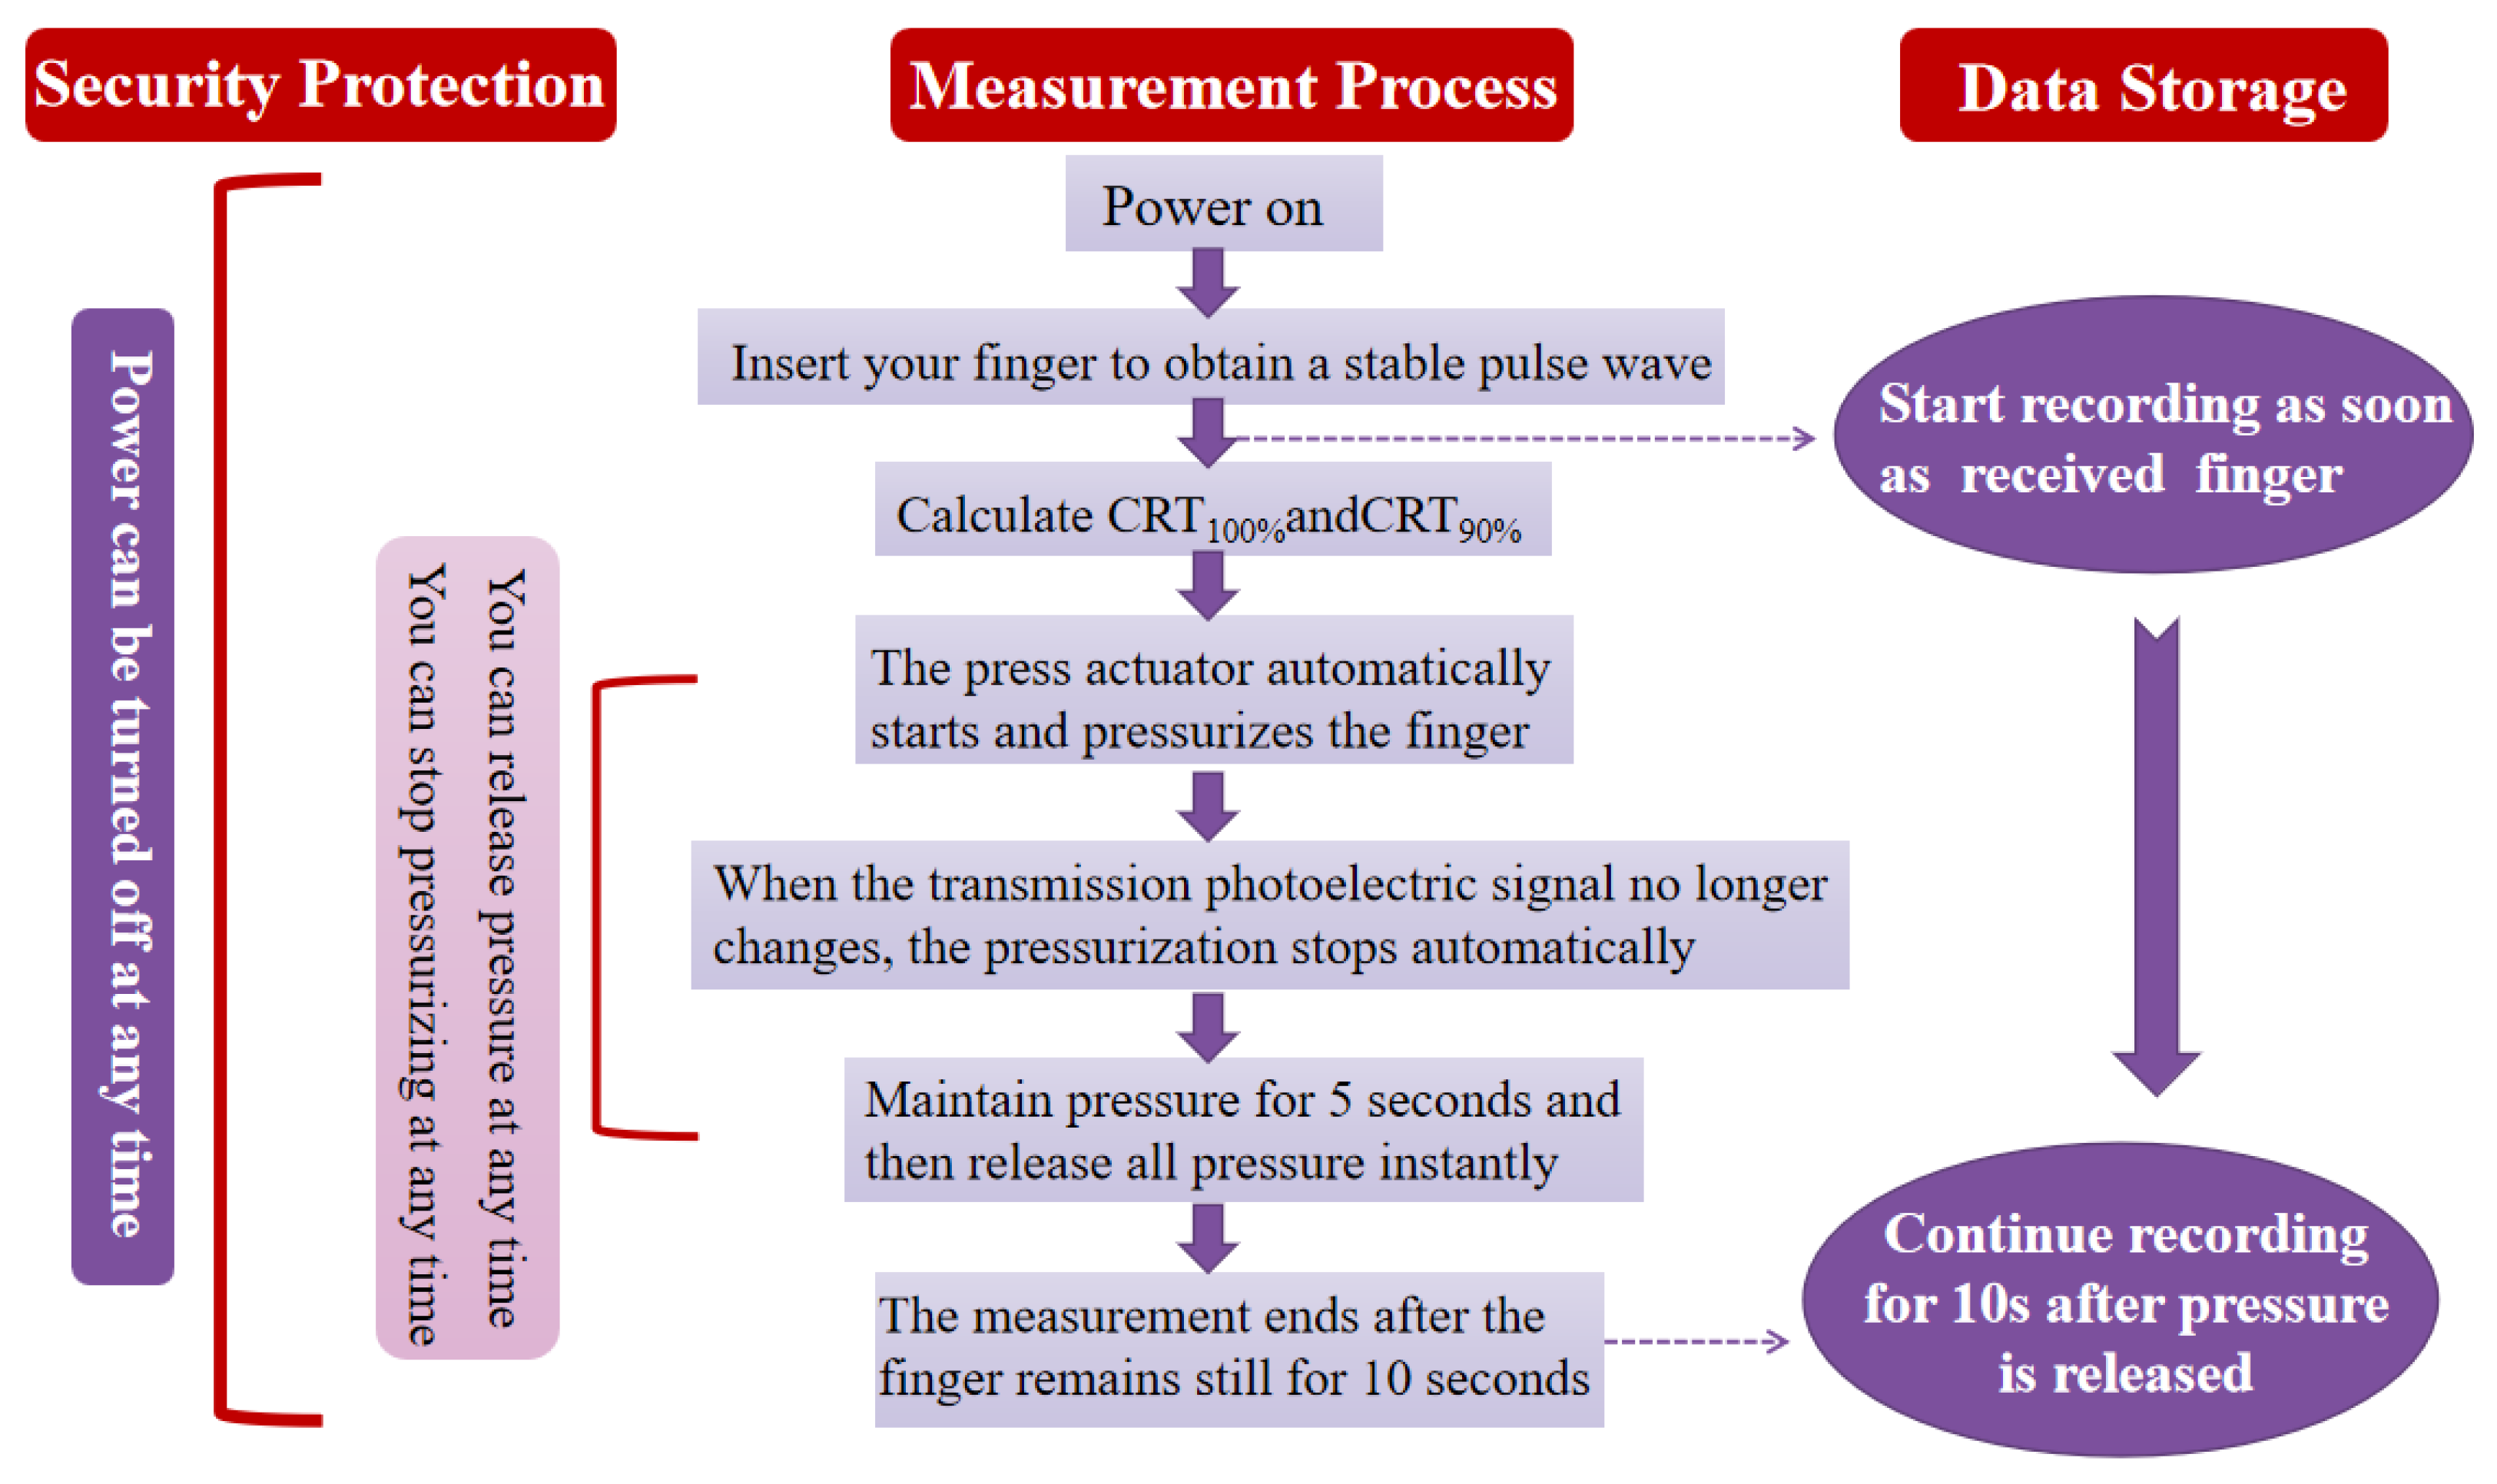
2.2. Design and Implementation of Instrumented Measurement of Capillary Refill Time
2.3. Design and Realisation of an Automated Processing System for Blood Oxygen Measurement Data
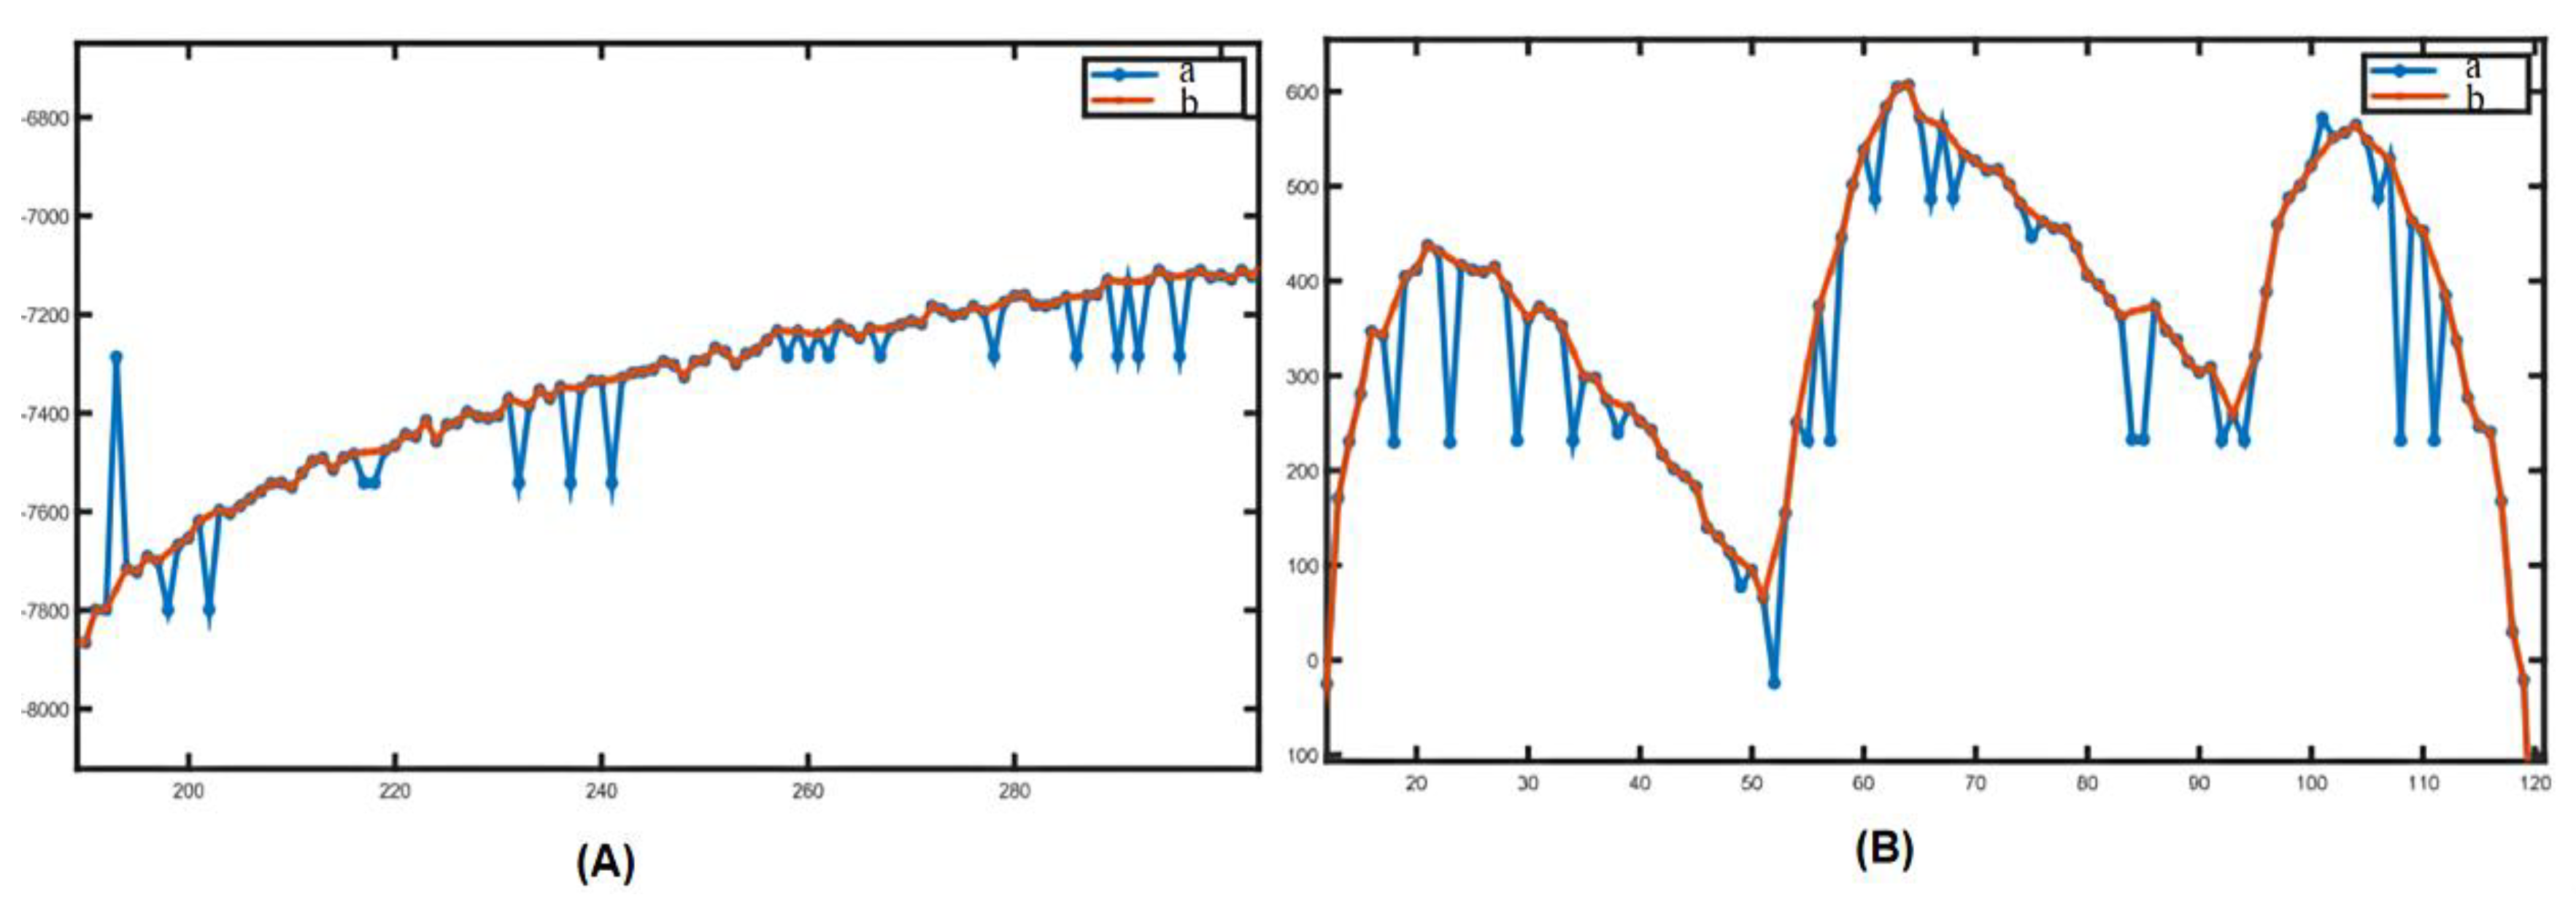
2.3.1. Removal of Mutant Noise
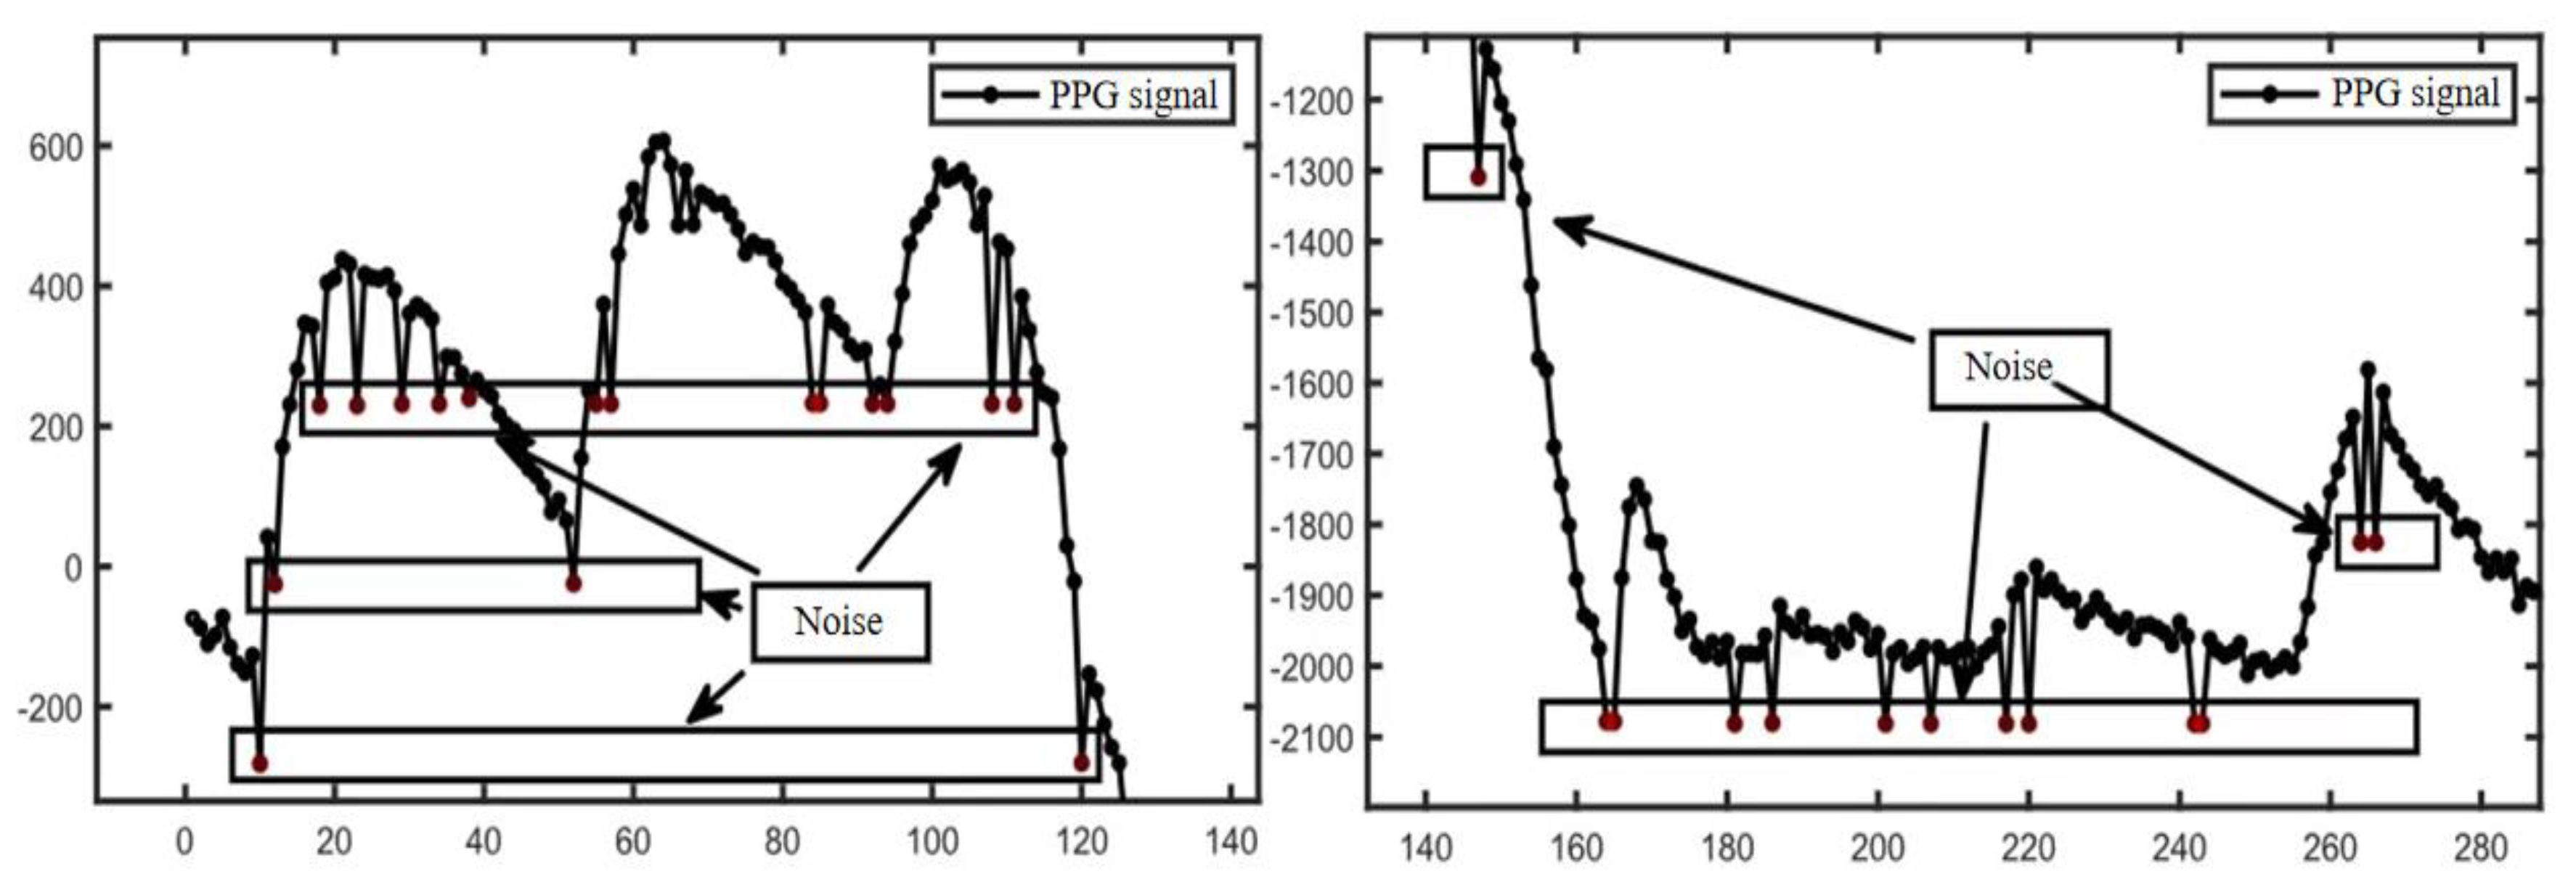
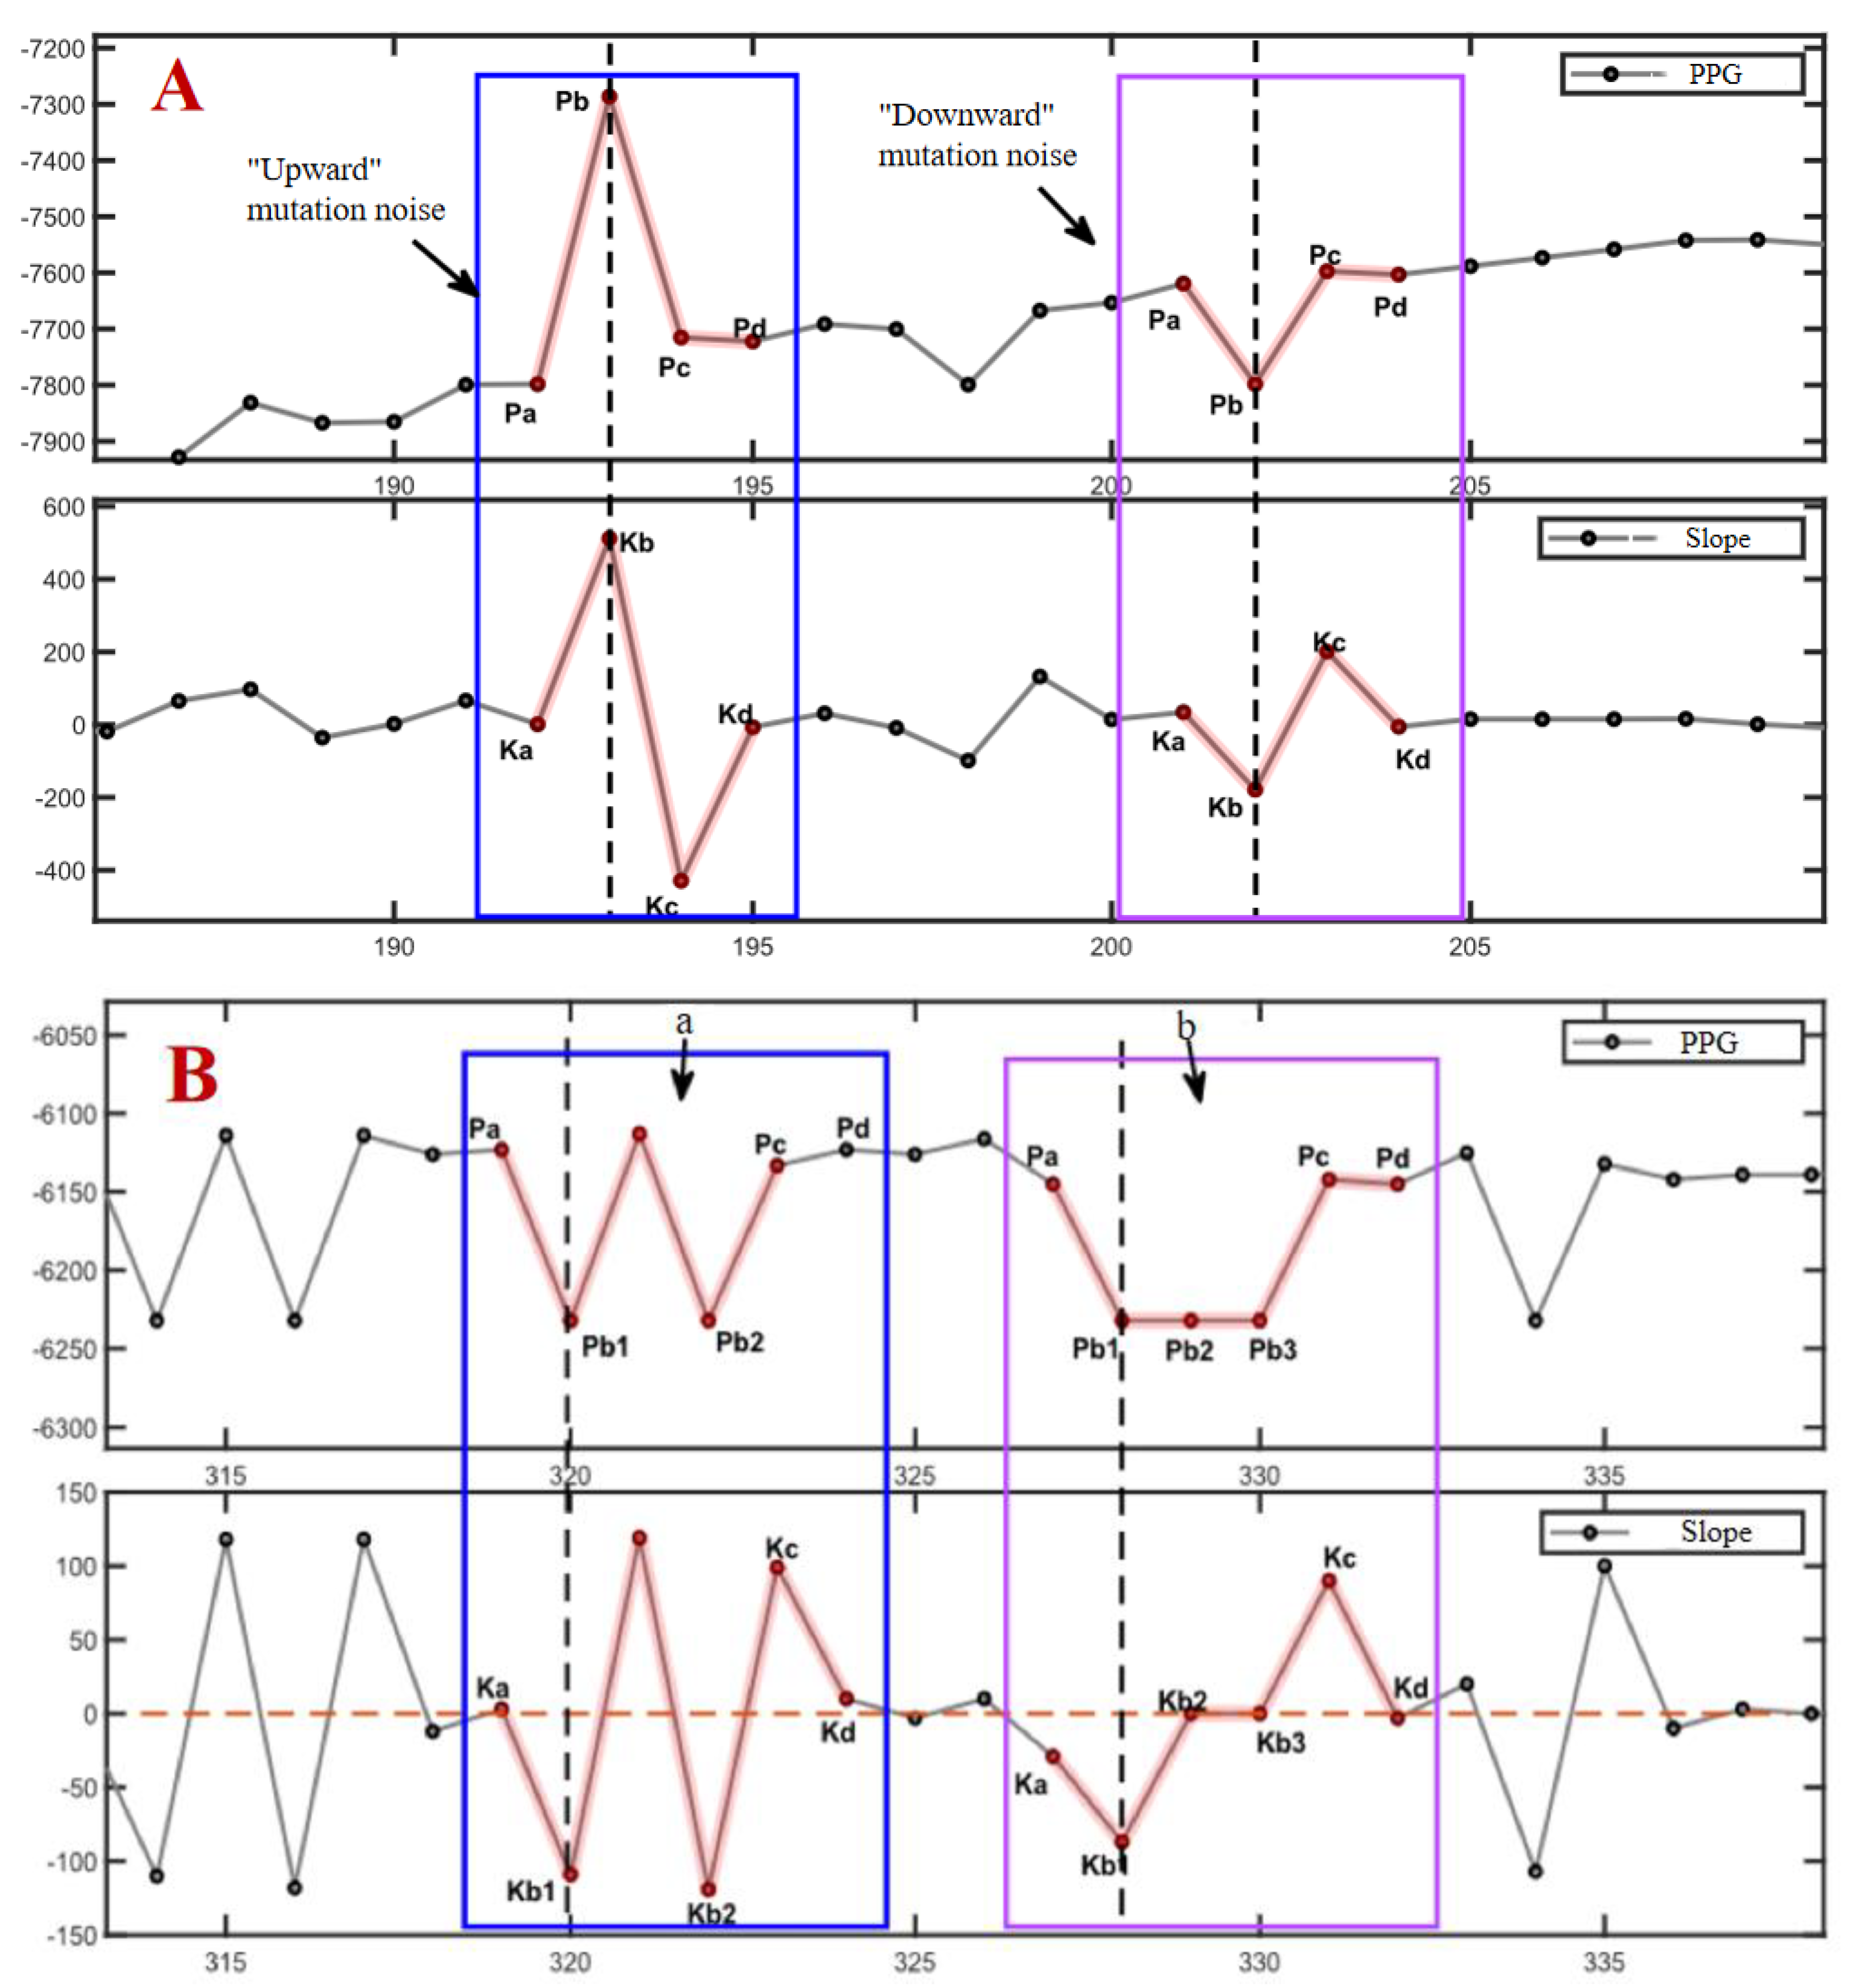
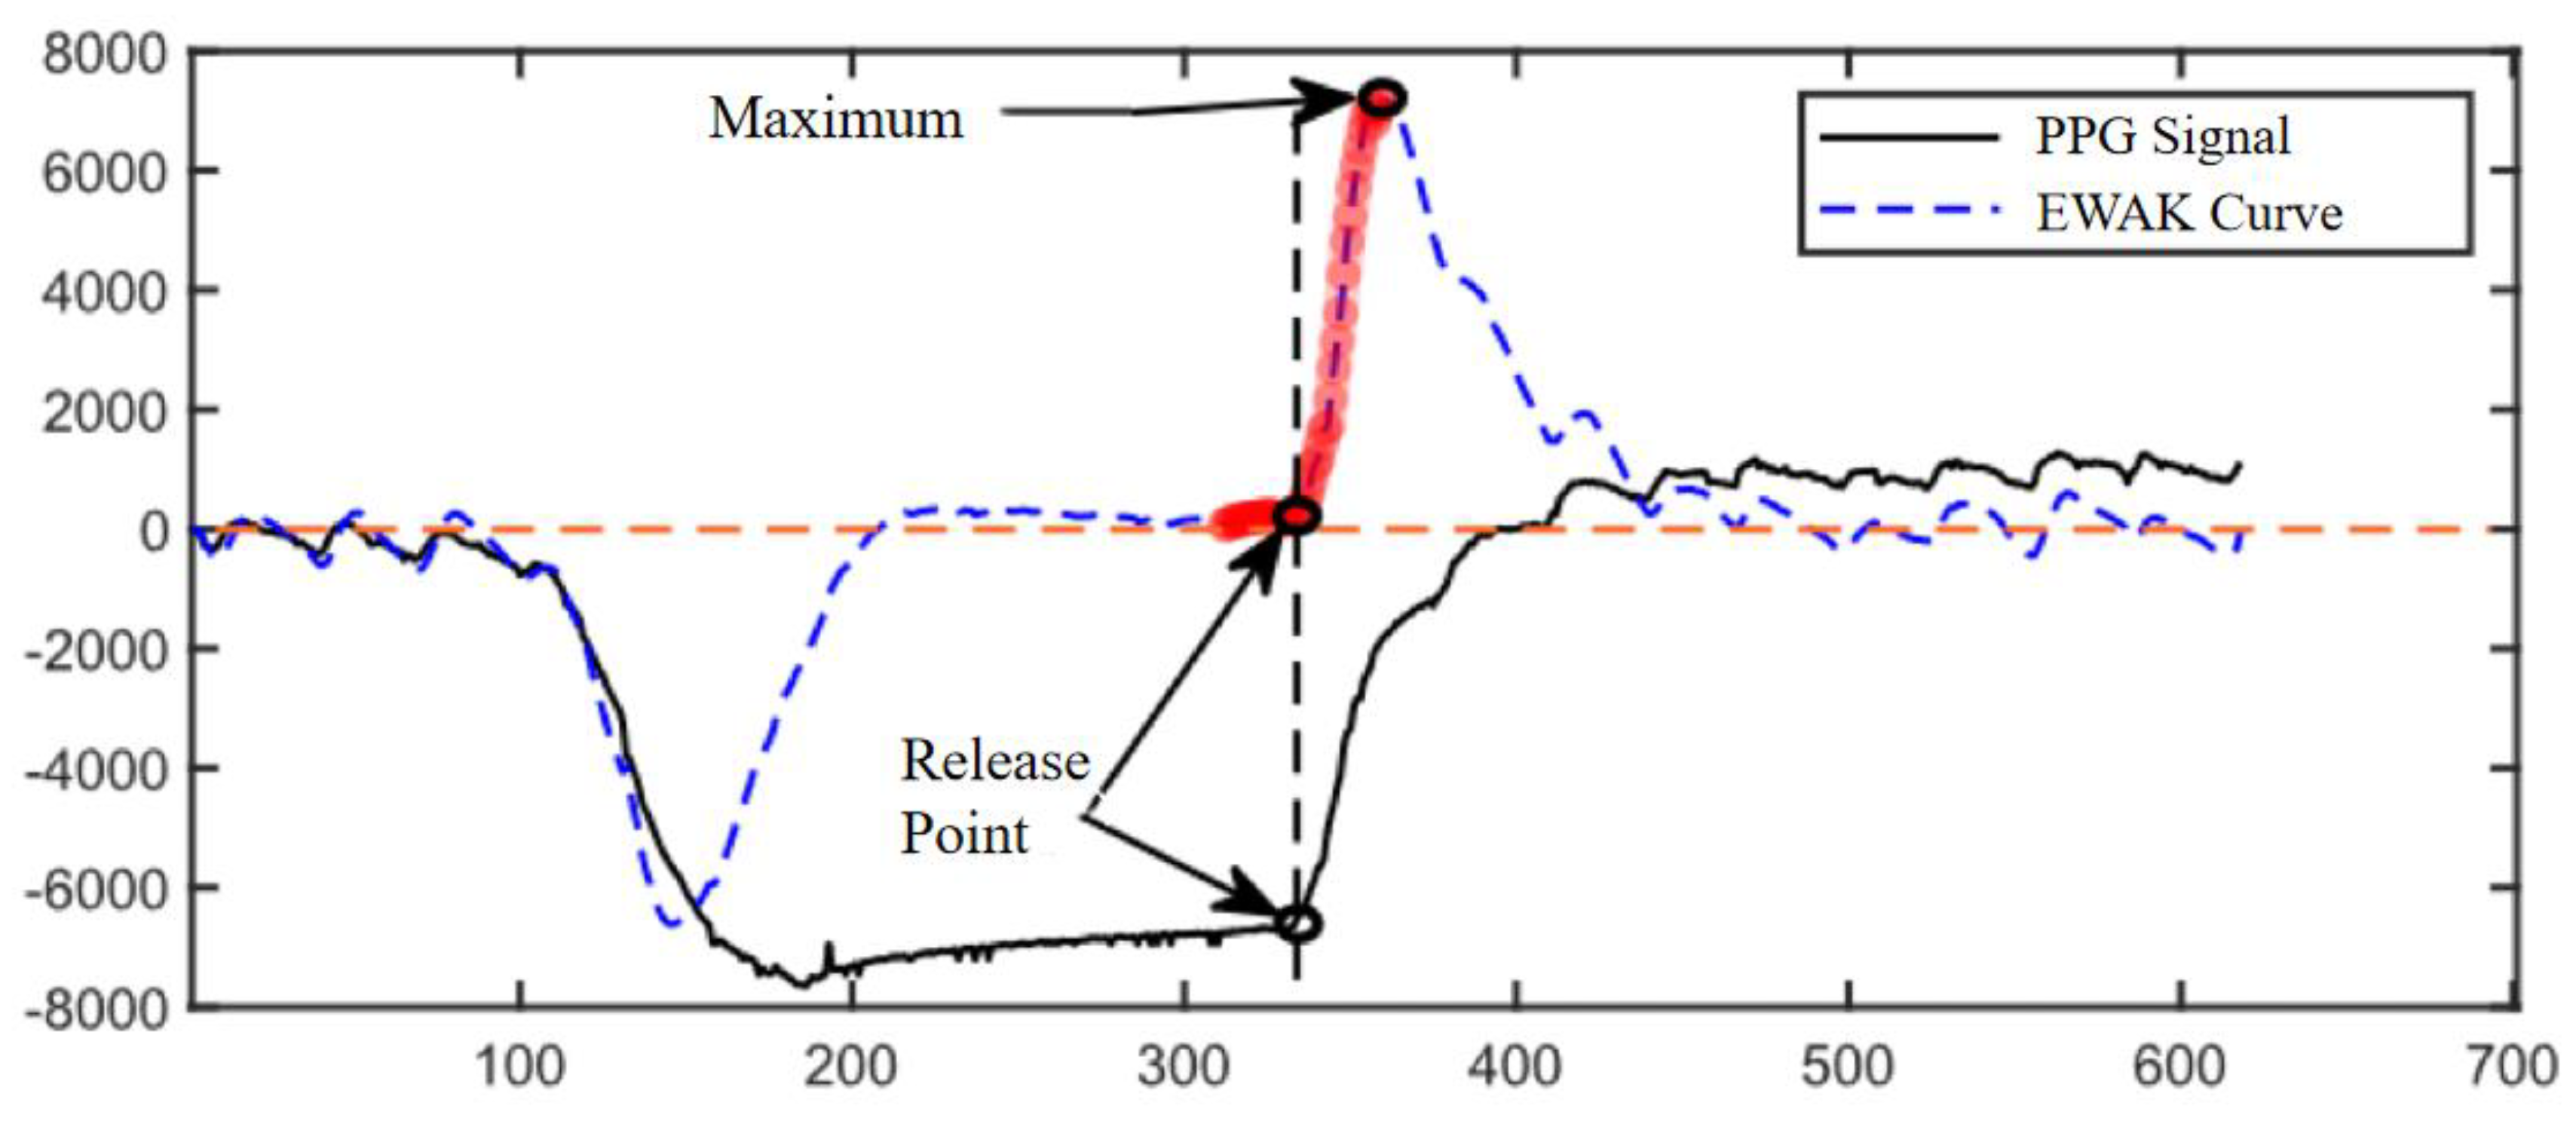
2.3.2. Calculation of Pressure Release Recognition Points
2.4. Reliability and Reproducibility of This Device for Assessing Capillary Refill Time
3. Results and Discussion
3.1. Testing of Automated Systems for Processing Oximetry Data
3.2. Reliability and Reproducibility of This Device to Assess Capillary Refill Time
4. Conclusions
5. Patents
Author Contributions
Funding
Institutional Review Board Statement
Informed Consent Statement
Data Availability Statement
Conflicts of Interest
References
- Bakker J, Ince C. Monitoring coherence between the macro and microcirculation in septic shock. Curr Opin Crit Care 2020, 26, 267–272. [Google Scholar] [CrossRef] [PubMed]
- Ince, C. Hemodynamic coherence and the rationale for monitoring the microcirculation. Crit Care 2015, 19 (Suppl 3), S8. [Google Scholar] [CrossRef] [PubMed]
- Merdji H, Curtiaud A, Aheto A, et al. Performance of Early Capillary Refill Time Measurement on Outcomes in Cardiogenic Shock: An Observational, Prospective Multicentric Study. Am J Respir Crit Care Med. 2022, 206, 1230–1238. [Google Scholar] [CrossRef] [PubMed]
- Bodolea, C. The Role of Microcirculation in Haemodynamics: A Journey from Atlas to Sisyphus. J Crit Care Med (Targu Mures). 2024, 10, 115-118. Published 2024 Apr 30. [CrossRef]
- Kattan E, Ibarra-Estrada M, Ospina-Tascón G, Hernández G Perspectives on peripheral perfusion assessment. Curr Opin Crit Care 2023, 29, 208–214. [CrossRef] [PubMed]
- Hariri G, Joffre J, Leblanc G et al Narrative review: clinical assessment of peripheral tissue perfusion in septic shock. Ann Intensive Care 2019, 9, 37. [CrossRef] [PubMed]
- Contreras R, Hernández G, Valenzuela ED et al Exploring the relationship between capillary refill time, skin blood flow and microcirculatory reactivity during early resuscitation of patients with septic shock: a pilot study. J Clin Monit Comput. 2022.
- Brunauer A, Koköfer A, Bataar O et al Changes in peripheral perfusion relate to visceral organ perfusion in early septic shock: A pilot study. J Crit Care 2016, 35, 105–109. [CrossRef] [PubMed]
- Lara B, Enberg L, Ortega M et al Capillary refill time during fluid resuscitation in patients with sepsis-related hyperlactatemia at the emergency department is related to mortality. PLoS ONE 2017, 12, e0188548.
- Zampieri FG, Damiani LP, Bakker J et al Effects of a resuscitation strategy targeting peripheral perfusion status versus serum lactate levels among patients with septic shock. A Bayesian reanalysis of the ANDROMEDA-SHOCK trial. Am J Respir Crit Care Med 2020, 201, 423–429. [Google Scholar]
- Hernandez G, Ospina-Tascon G, Damiani LP et al Effect of a resuscitation strategy targeting peripheral perfusion status vs serum lactate levels on 28-day mortality among patients with septic shock. Andromeda-Shock Randomiz Clin Trial JAMA 2019, 321, 654–664.
- Kattan E, Hernández G, Tascón GO et al A lactate - targeted resuscitation strategy may be associated with higher mortality in patients with septic shock and normal capillary refill time : a post hoc analysis of the ANDROMEDA - SHOCK study. Ann Intensive Care 2020, 10, 114. [CrossRef] [PubMed]
- Hernandez G, Carmona P, Ait-Oufella H. Monitoring capillary refill time in septic shock. Intensive Care Med. 2024, 50, 580–582. [Google Scholar] [CrossRef] [PubMed]
- Kleinman ME, Chameides L, Schexnayder SM, et al. Pediatric advanced life support: 2010 American Heart Association Guidelines for Cardiopulmonary Resuscitation and Emergency Cardiovascular Care. Pediatrics. 2010, 126, e1361–e1399. [Google Scholar] [CrossRef] [PubMed]
- Reinhart, K.; Daniels, R.; Kissoon, N.; Machado, F.R.; Schachter, R.D.; Finfer, S. Recognizing Sepsis as a Global Health Priority - A WHO Resolution[J]. N Engl J Med. 2017, 377, 414–417. [Google Scholar] [CrossRef] [PubMed]
- Fernández-Sarmiento J, De Souza D, Jabornisky R,et al. Paediatric inflammatory multisystem syndrome temporally associated with COVID-19 (PIMS-TS): a narrative review and the viewpoint of the Latin American Society of Pediatric Intensive Care (SLACIP) Sepsis Committee[J]. BMJ Paediatr Open. 2021, 5, e000894. [Google Scholar] [CrossRef] [PubMed]
- Huber W, Zanner R, Schneider G, et al. . Assessment of Regional Perfusion and Organ Function: Less and Non-invasive Techniques[J]. Front Med (Lausanne). 2019, 6, 50. [Google Scholar]
- Mosorov, V. The Lambert-Beer law in time domain form and its application[J]. Appl Radiat Isot 2017, 10, 1–5. [Google Scholar] [CrossRef] [PubMed]
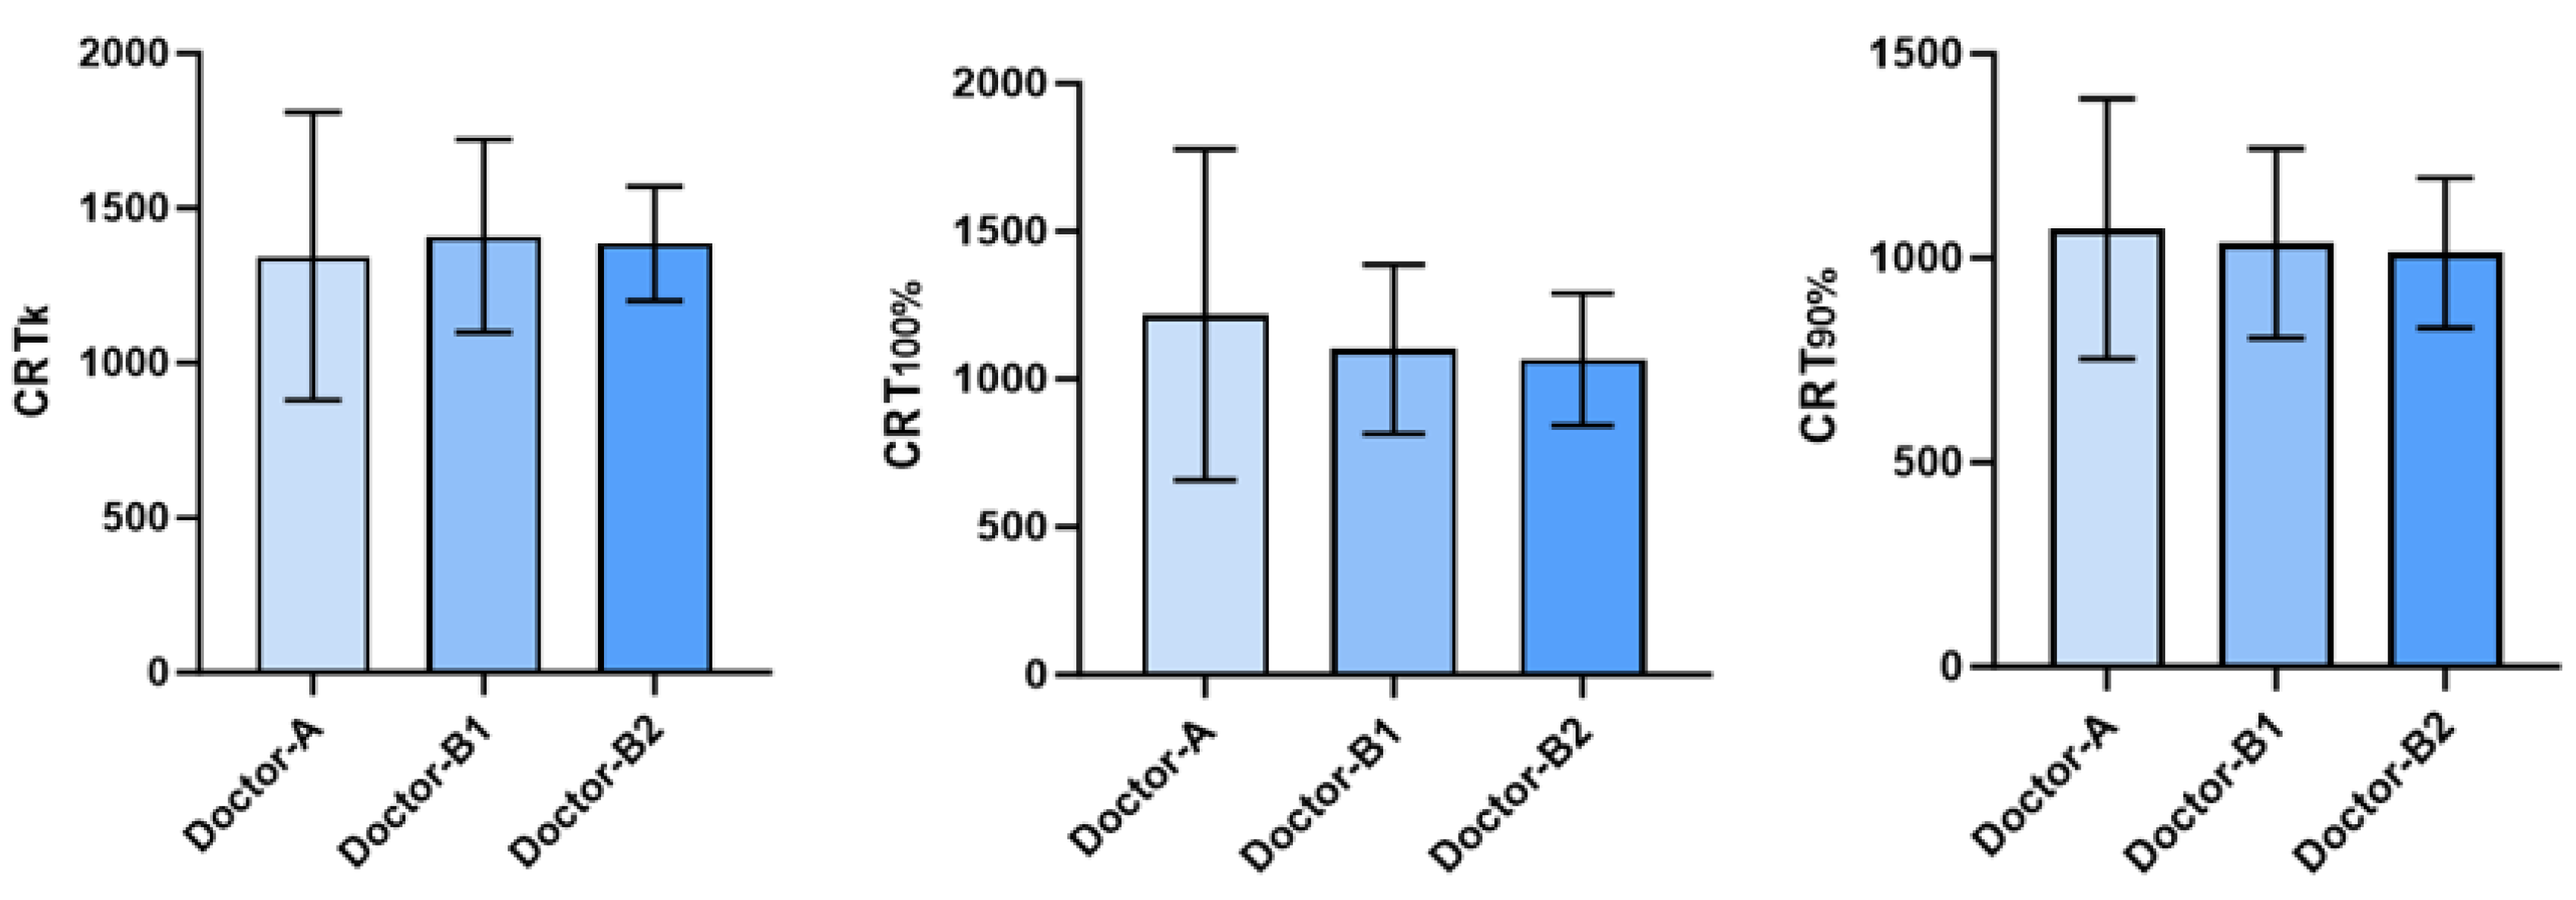
| Doctors | |||
|---|---|---|---|
| Doctor-A | 1344.5±464.92 | 1217.3±560.3 | 1071.8±318.7 |
| Doctor-B | |||
| First measurement | 1410.0±311.54 | 1100.9±286.7 | 1036.4±231.8 |
| Second measurement | 1385.5±185.06 | 1066.4±224.2 | 1011.8±183.7 |
Disclaimer/Publisher’s Note: The statements, opinions and data contained in all publications are solely those of the individual author(s) and contributor(s) and not of MDPI and/or the editor(s). MDPI and/or the editor(s) disclaim responsibility for any injury to people or property resulting from any ideas, methods, instructions or products referred to in the content. |
© 2024 by the authors. Licensee MDPI, Basel, Switzerland. This article is an open access article distributed under the terms and conditions of the Creative Commons Attribution (CC BY) license (http://creativecommons.org/licenses/by/4.0/).


