1. Introduction
Plant diseases pose a significant threat to agricultural productivity and food security around the world. Crops such as wheat, rice, maize, and potatoes are staple foods for a large portion of the world’s population, and their yield and quality are heavily affected by various plant diseases [
1,
2,
3]. Plant diseases are responsible for an estimated 20-40% reduction in yields for major food and cash crops, causing significant economic and social consequences. Globally, the annual loss due to plant diseases is valued at approximately
$220 billion [
3]. Accurate and timely detection of these diseases is crucial for implementing effective management strategies and minimising crop losses. However, these losses often leave farmers with low incomes, making it difficult to afford high-end equipment for crop management contributing to suicides. According to the National Crime Record Bureau’s (NCRB) Accidental Deaths and Suicides in India (ADSI) 2022 report, India recorded over 170,000 suicides in 2022, with about 33% of the cases involving daily wage earners, agricultural workers, and farmers [
4].
The Food and Agriculture Organization (FAO) reports that nearly 690 million people faced hunger worldwide in 2019, a figure expected to increase due to the impact of the COVID-19 pandemic
1. In India, where agriculture employs more than 50% of the workforce, pests and diseases cause annual crop losses of 15-25%. These losses not only devastate farmers’ livelihoods but also have serious implications for the country’s food security and economy [
5]. Furthermore, smallholder farmers in developing nations often lack access to advanced technologies and resources for effective plant disease management, relying instead on traditional methods like visual inspections and experience-based decision-making, which are often inefficient and unreliable [
4,
5,
6].
The development of affordable and accessible plant disease detection tools can empower farmers to make informed decisions, reduce crop losses, and improve their livelihoods. Motivated by the need to enhance the agricultural sector and support farmers, this project aims to develop an accurate and accessible plant disease detection tool using deep learning. Traditionally, plant disease detection has relied on manual inspection by trained experts, a process that is time-consuming, labour-intensive, and prone to human error. However, with the advancement of digital technologies, there is growing interest in developing autonomous systems for detecting plant diseases using computer vision and machine learning techniques. These systems offer rapid, reliable, and cost-effective solutions for identifying and monitoring plant diseases at scale [
6,
7,
8].
In recent years, deep learning techniques have become highly effective for image-based plant disease detection. CNN architectures have demonstrated remarkable success in various computer vision tasks, including object detection, image classification, and segmentation. CNNs can automatically learn hierarchical features from raw image data, making them particularly suited to capturing the complex patterns and characteristics of plant diseases [
7,
9,
10]. Furthermore, integrating plant disease detection systems with other precision agriculture technologies—such as weather forecasting, soil monitoring, and crop yield prediction—can provide farmers with more comprehensive and actionable information [
11,
12]. This integration enables data-driven decision-making and helps optimise resource allocation, leading to more sustainable and profitable farming practices.
The development of deep learning-based plant disease detection systems offers a transformative opportunity for agriculture, significantly contributing to global food security. These systems can empower farmers to make informed decisions, reduce crop losses, and enhance their livelihoods by delivering accurate, timely, and affordable disease diagnoses. However, to realise this, it is essential to address the various challenges that may impede their adoption and effectiveness. This includes overcoming technical obstacles related to data diversity, developing and embracing technology-driven solutions, precision farming, addressing socio-economic factors that limit access to these technologies, and navigating cultural perceptions that may influence the willingness of farmers to integrate these advanced systems into their practices. To explore these critical challenges, this paper addresses several key research questions: What factors influence the accuracy of deep learning models for plant disease detection? How can these technologies be effectively integrated into existing agricultural practices? What barriers exist that may hinder widespread adoption among smallholder farmers? Furthermore, this paper discusses the required accuracy thresholds for practical implementation in real-world farming contexts. As part of this, the article presents a comprehensive approach to the development and evaluation of deep learning models tailored for plant disease detection. The proposed approach includes the utilisation of diverse datasets, the implementation of advanced CNN architectures, and the introduction of innovative strategies to enhance model robustness and overall performance. Specifically, the contributions of this paper are as follows:
A new approach to augmenting datasets by using web-sourced data from platforms like Google, enhancing the diversity and realism of plant disease images.
An evaluation of various strategies for fusing existing datasets with online-sourced data, aimed at improving the generalisation and robustness of disease detection models.
A comprehensive assessment of several advanced CNN architectures, including EfficientNet-B0, EfficientNet-B3, ResNet50, and DenseNet201, using the newly built dataset.
The introduction of a constructed dataset, combining PlantDoc and web-sourced data, made publicly available to foster further research and development in plant disease detection.
This article is organised into several sections.
Section 2 provides an overview of related work, followed by
Section 3, which outlines the Proposed Methodology.
Section 4 presents the Experiments and offers a discussion of the results, and finally,
Section 5 concludes the paper.
2. Related Works
Plant leaf diseases have traditionally been detected and analysed manually in agricultural practices. While effective in certain cases, these methods are often expensive, labour-intensive, time-consuming, and highly subjective, leading to inconsistent results and inefficiencies [
13,
14]. With technological advances, researchers have increasingly turned to automated solutions to improve the accuracy and speed of plant disease detection. Recently, numerous techniques have emerged leveraging computer vision, image processing, pattern recognition, and machine learning to classify and identify plant diseases more effectively [
3,
6,
14]. These techniques analyse key image features such as texture, colour, shape, and size to detect anomalies associated with specific plant diseases. Researchers have developed various models that automatically assess plant health, greatly reducing the limitations posed by manual techniques [
3,
6,
8,
14,
15]. The use of automatic disease detection systems has shown great promise in overcoming the challenges of traditional methods, offering more consistent, objective, and scalable solutions.
ML and DL techniques have gained significant traction in plant disease detection, offering a more efficient and accurate alternative to traditional manual methods [
3,
6,
8,
15,
16]. Several studies have demonstrated the potential of ML techniques in the classification and segmentation of plant lesions from digital images. For example, traditional ML algorithms including C4.5 classifier, tree bagger, and Support Vector Machines (SVMs) have been applied to a wide range of tasks, including identifying plant lesions, predicting crop yields, and optimising plant growth [
17,
18,
19,
20]. Akbar et al. [
19] proposed how these algorithms can detect disease patterns at early stages, making them particularly effective in preventing outbreaks. Similarly, Yoosefzadeh-Najafabadi et al. [
20] and Cedric et al. [
21] demonstrated the application of tree bagger and C4.5 classifiers in disease identification and pest detection, proving their utility in maximising agricultural yield.
Jeny et al. [
22] developed an SVM-based model to identify two types of diseases in cucumber leaves using a statistical pattern recognition approach to segment healthy and infected areas. A related SVM-based model for rice plants was presented by Yao et al. [
23] in a different study. The authors applied a colour transformation technique to differentiate between infected and healthy regions. Accurate classification was made possible by the model’s extraction of important characteristics from the sick patches, including colour, texture, and form. Sharma et al. [
24] introduced a model for plant disease detection based on image processing that enhanced image quality by combining a multi-layer perception technique with a pre-processing step after segmentation of the sick leaf portions using K-means clustering. The authors were able to provide a more thorough examination of plant health by the extraction of colour and texture data from each cluster. The effectiveness of the ML algorithms in plant disease detection further is reflected in their reported accuracy rates. For instance, support vector machines achieved an accuracy of 87.6% when trained on colour, texture, and shape features [
25]. Other models, such as K-nearest neighbours (KNN) and decision trees, have similarly demonstrated high accuracy, with KNN achieving 97.00% [
26] and decision trees reaching 95.26% [
27], further showcasing the robustness of these techniques. Naive Bayes classifiers, when applied to colour and texture features, have also proven effective, achieving a 97% accuracy rate [
28]. While traditional ML methods have shown promising results, they have limitations in terms of feature representation and scalability. Handcrafted features may not capture the complex patterns and variations present in leaf images, leading to suboptimal performance [
29]. Moreover, these methods often require extensive feature engineering and domain expertise, making them less adaptable to new diseases or plant species [
30].
DL approaches have become effective in the detection of plant diseases, offering significant advantages over traditional ML methods. CNN have consistently outperformed traditional ML methods in terms of accuracy and generalisation ability largely due to their ability to automatically extract discriminative features directly from raw pixel data. The performance of CNN can be attributed to their ability to learn discriminative features directly from raw pixel data, capturing both local and global patterns in leaf images [
7,
13,
15,
16,
31]. DL methods have proven particularly effective in handling high-dimensional and complex datasets, such as large-scale image datasets, making them well-suited for tasks like plant disease detection [
7,
13]. Unlike traditional manual classification techniques, which struggle to extract deep and intricate features from images, DL approaches excel by automatically identifying and learning abstract patterns and subtle details from the data [
32]. As such, DL models are capable of handling complex plant images more efficiently, delivering more accurate and reliable results. For instance, Deep Belief Networks (DBNs), a type of unsupervised DL model composed of stacked Restricted Boltzmann Machines (RBMs), have been successfully applied to detecting plant lesions and pest infestations [
33,
34,
35,
36]. DBNs can extract essential features from plant leaf images and have achieved accuracy rates between 96% and 97.5% for classifying diseases and pests [
36]. Furthermore, Recurrent Neural Networks (RNN) have also demonstrated good performance in achieving high accuracy in identifying plant lesions across various species [
16]. DL models are a reliable option for large-scale plant lesion identification since they do not require manual feature engineering and can efficiently identify and categorise various disease signs from photos [
37,
38]. Mohanty, Hughes, and Salathé [
39] conducted one of the earliest AlexNet CNN-based work to analyse a dataset containing 54,306 images of healthy and diseased plant leaves. The model achieved 99.27% accuracy in the detection of 14 different crop species and 26 distinct diseases, demonstrating the potential of DL methods in the detection of plant diseases. Too et al. [
40] conducted an in-depth comparison of various deep-learning architectures for plant disease classification. The authors evaluated AlexNet, VGGNet, Inception, ResNet, and DenseNet on the widely used PlantVillage dataset, consisting of 54,309 images of healthy and diseased leaves from 14 crop species [
41]. DenseNet121 outperformed all other models, achieving a remarkable accuracy of 99.75%, further establishing the superiority of deep learning models over traditional ML approaches in plant disease detection. Furthermore, recent advances in CNN architectures have led to improved plant disease detection approaches. Karthik et al. [
42] proposed a custom CNN architecture utilising residual connections and attention mechanisms to enhance feature learning and disease localisation. The CNN model was trained on the PlantVillage dataset and achieved an accuracy of 98% demonstrating the potential of hybrid CNN architectures for plant health monitoring. Similarly, Arsenovic et al. [
43] designed a custom CNN architecture based on AlexNet to classify 18 different plant diseases using a custom dataset. Despite achieving a lower accuracy of 93.67%, this study emphasised the critical role of data quality and diversity in improving DL model performance for plant disease classification. Atila et al. [
44] proposed EfficientNet-B3 - a lightweight CNN architecture optimised for computational efficiency. EfficientNet-B3 demonstrated both great accuracy and lower processing needs than previous CNN models when trained on the PlantVillage dataset, achieving a remarkable accuracy of 99.97%. Transfer learning, a technique where a model developed for one task is reused as the starting point for a model on a different but related task, has also been successfully applied to plant disease detection. In the study by Elhassouny and Smarandache [
45], they utilised MobileNet, a lightweight CNN architecture, pre-trained on a large dataset, and fine-tuned it on a custom dataset of 10 distinct plant diseases. By leveraging the knowledge from the pre-trained model, the proposed MobileNet was able to achieve an accuracy of 89%, demonstrating the effectiveness of transfer learning in adapting models to new tasks, even when data availability is limited.
While significant progress has been made in using DL techniques for plant disease detection, several challenges remain. The challenges include the need for high-quality, diverse datasets, and improving model generalisation and scalability. Furthermore, issues related to symptom variability, image background noise, and practical deployment in agricultural settings also warrant further exploration.
3. Proposed Methodology
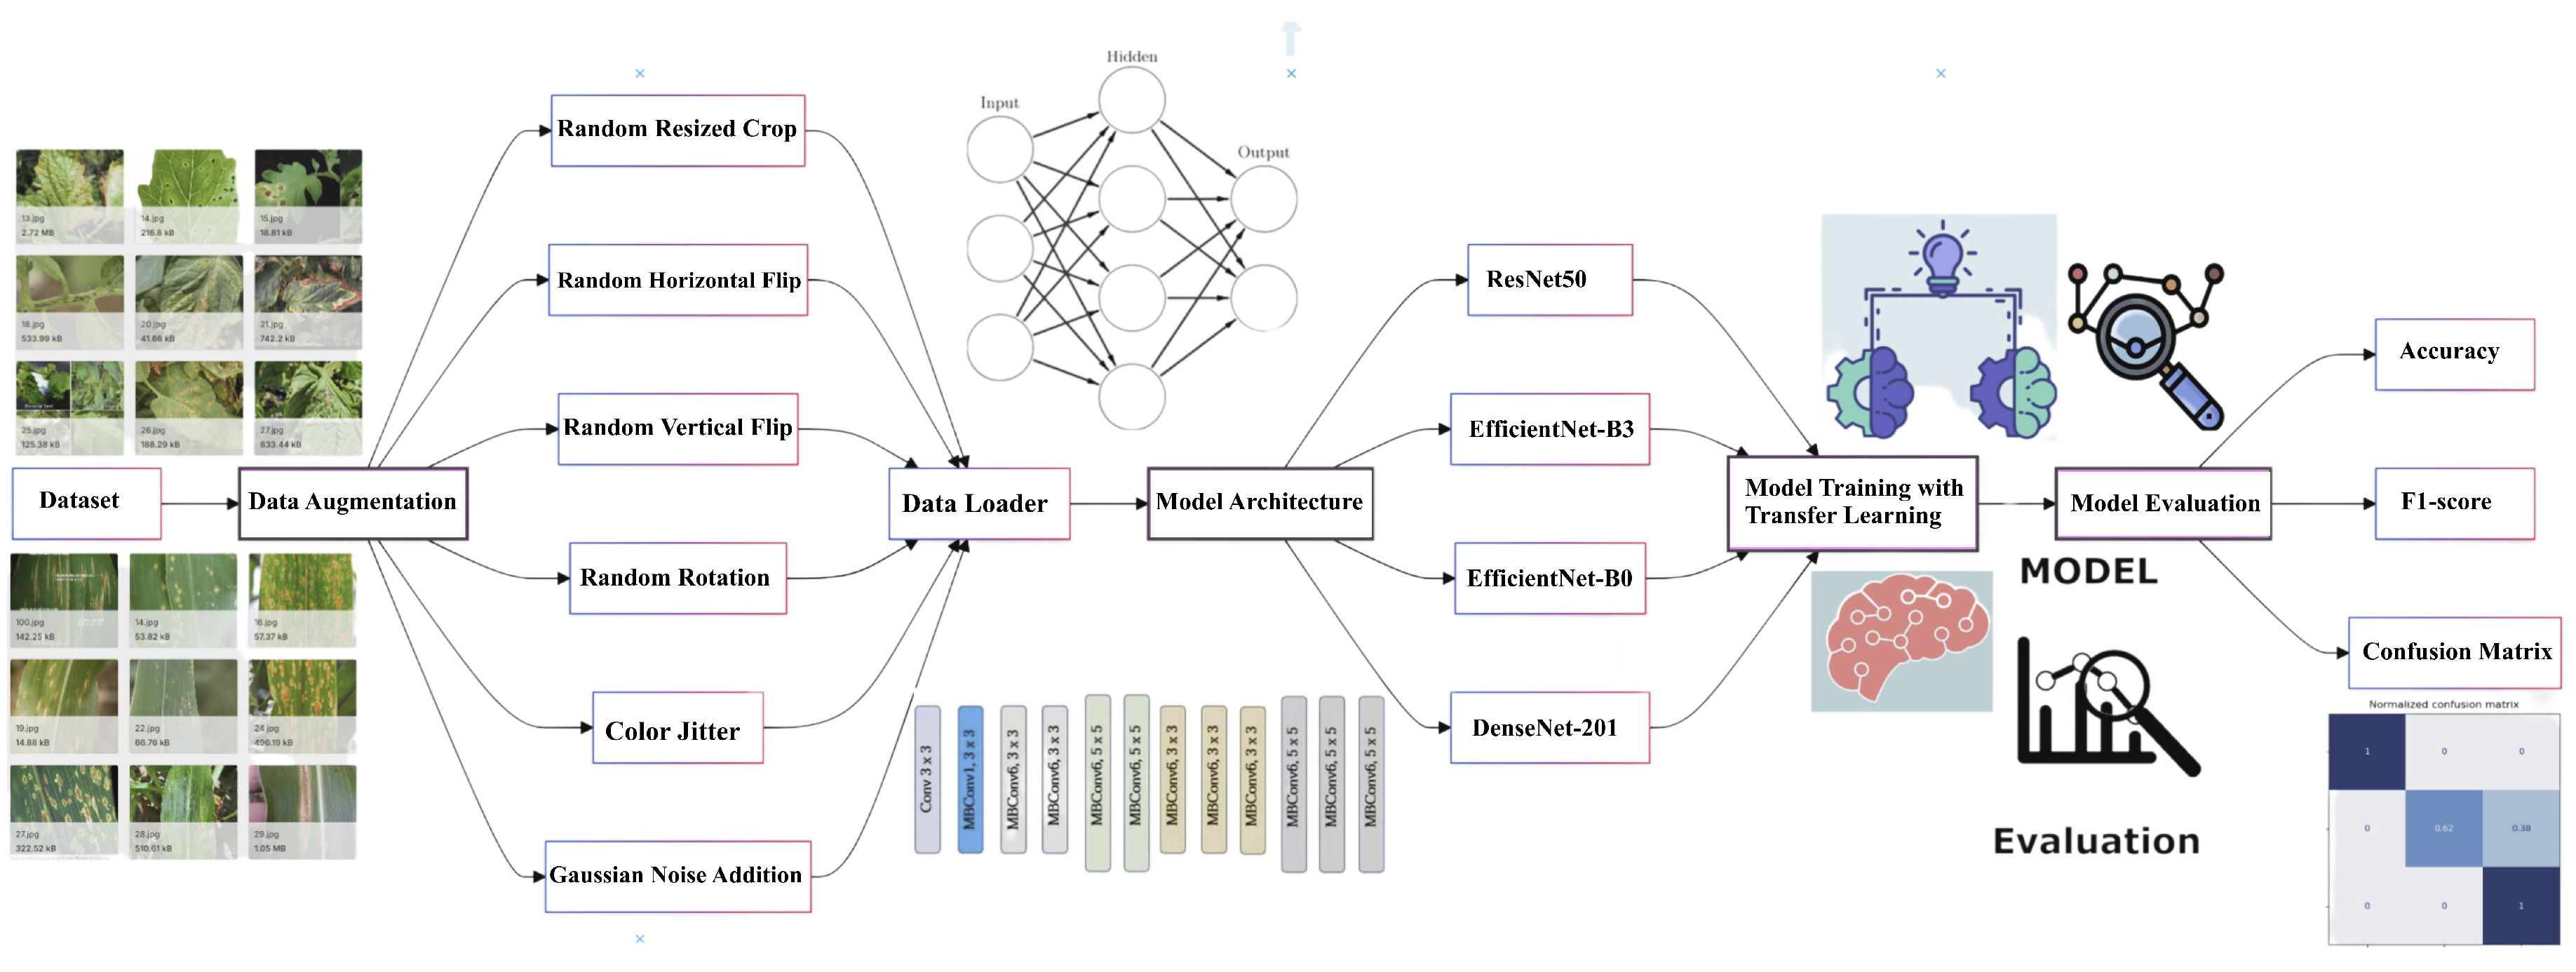
This article proposes advanced CNN architectures to accurately detect plant diseases in diverse and uncontrolled image environments, overcoming the limitations of existing methods that predominantly rely on images captured in controlled laboratory settings. The proposed system architecture depicted in
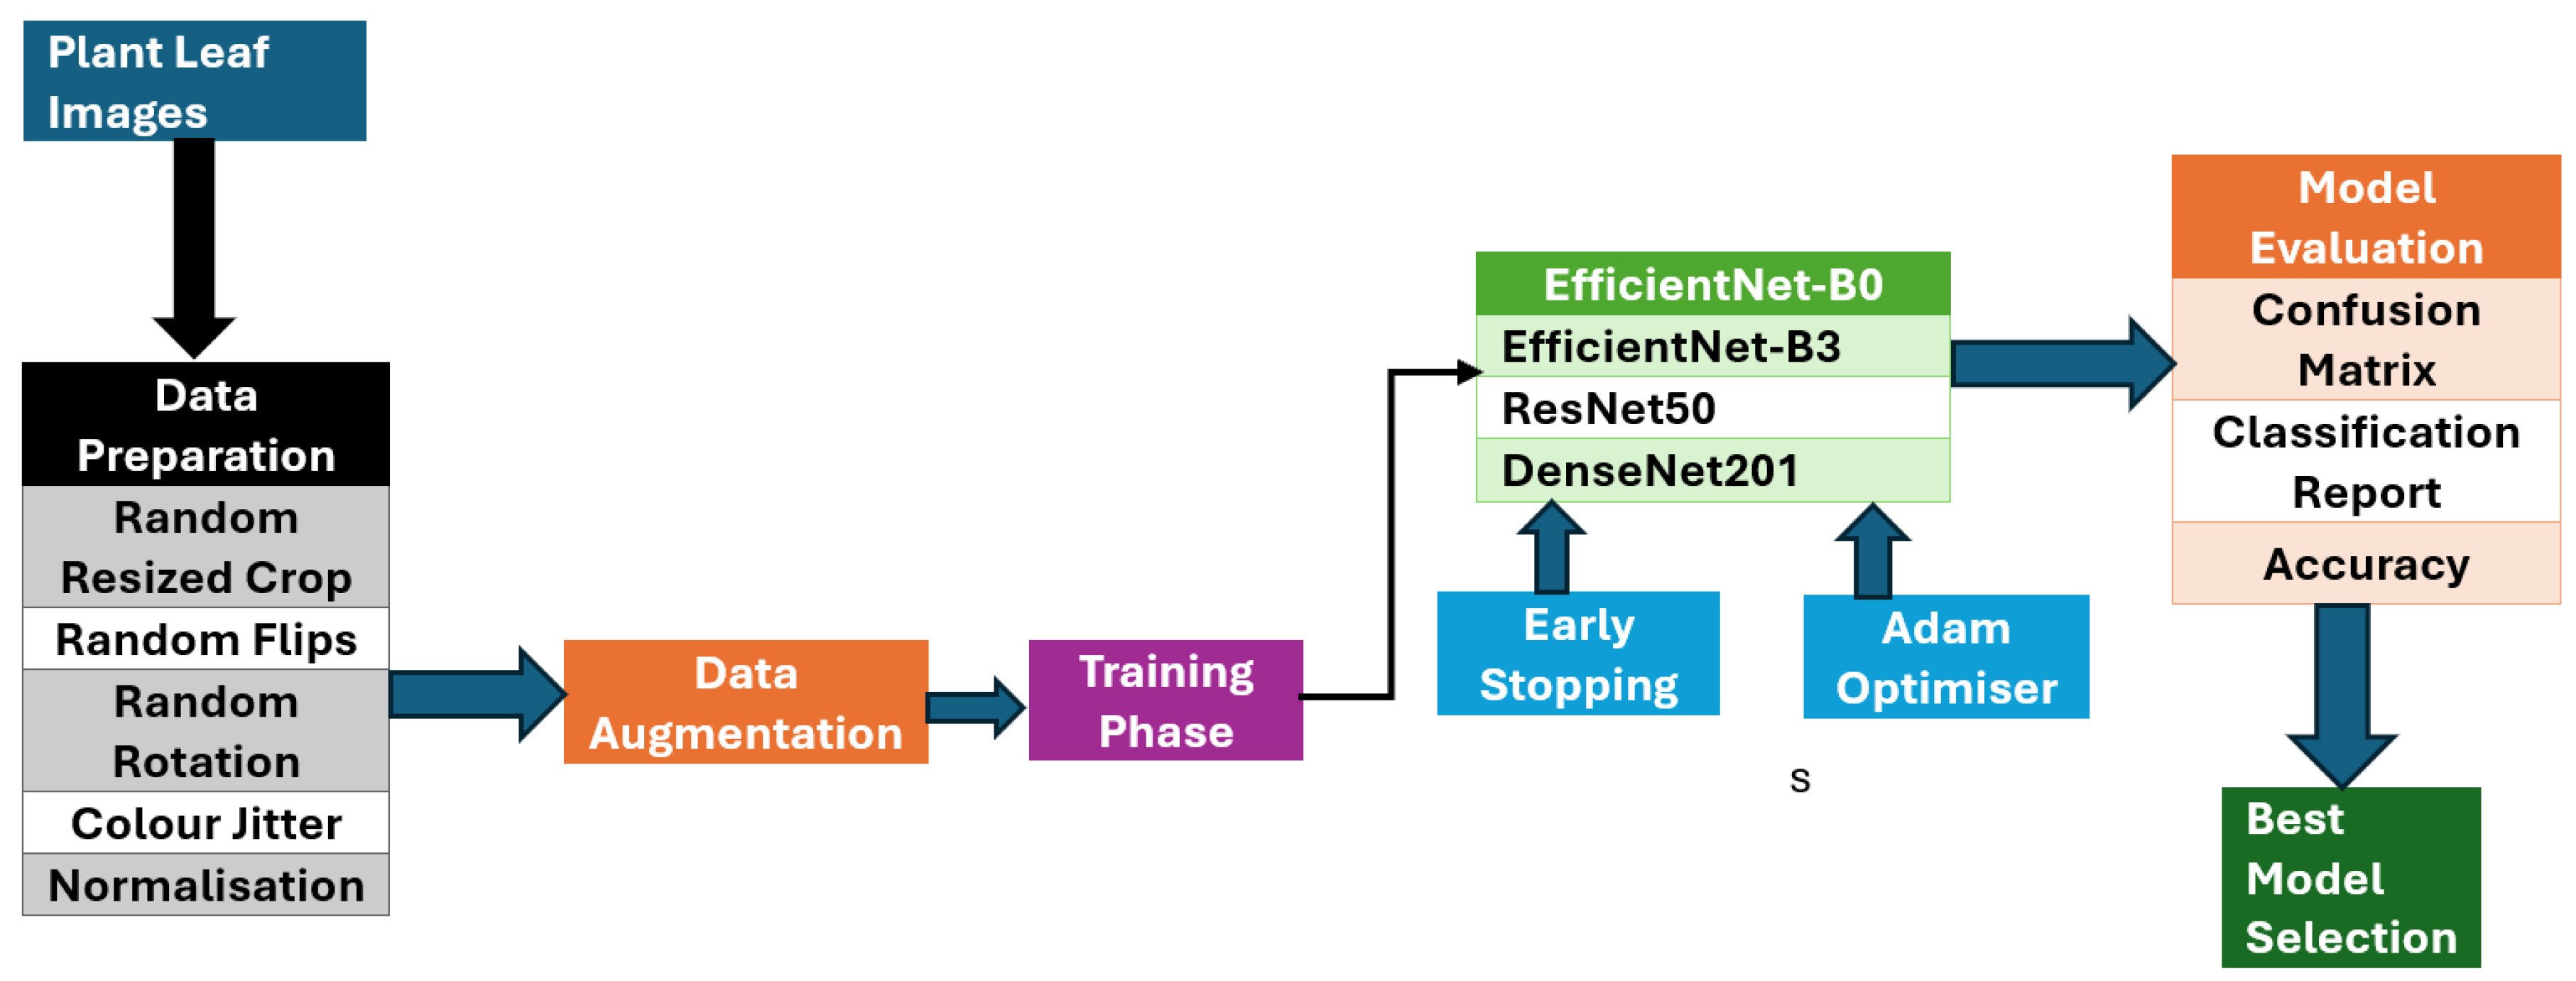
Figure 1 has a modular and scalable architecture, utilising cutting-edge deep learning techniques. This modular design allows for the flexible integration of new datasets, models, and techniques as advancements in the field emerge. The system is structured into four essential modules, each playing a vital role in the detection pipeline. The first module focuses on data preprocessing, which involves preparing and cleaning the input data. This is followed by the deep learning module, where the models are trained and fine-tuned. The training module handles the process of training these models on both pre-existing and custom datasets. The evaluation module assesses the model’s accuracy and performance using various metrics, ensuring both robustness and generalisability.
3.1. Dataset and Data Collection Process
To enhance model generalisation and improve performance, the authors propose a novel approach to dataset creation by combining multiple sources. The primary datasets include the PlantDoc dataset
2, and a new web-sourced dataset [
46]. This approach provides broader coverage of plant disease scenarios, balancing controlled and real-world conditions, which is essential for building robust ML models for plant disease detection.
3.1.1. PlantDoc Dataset
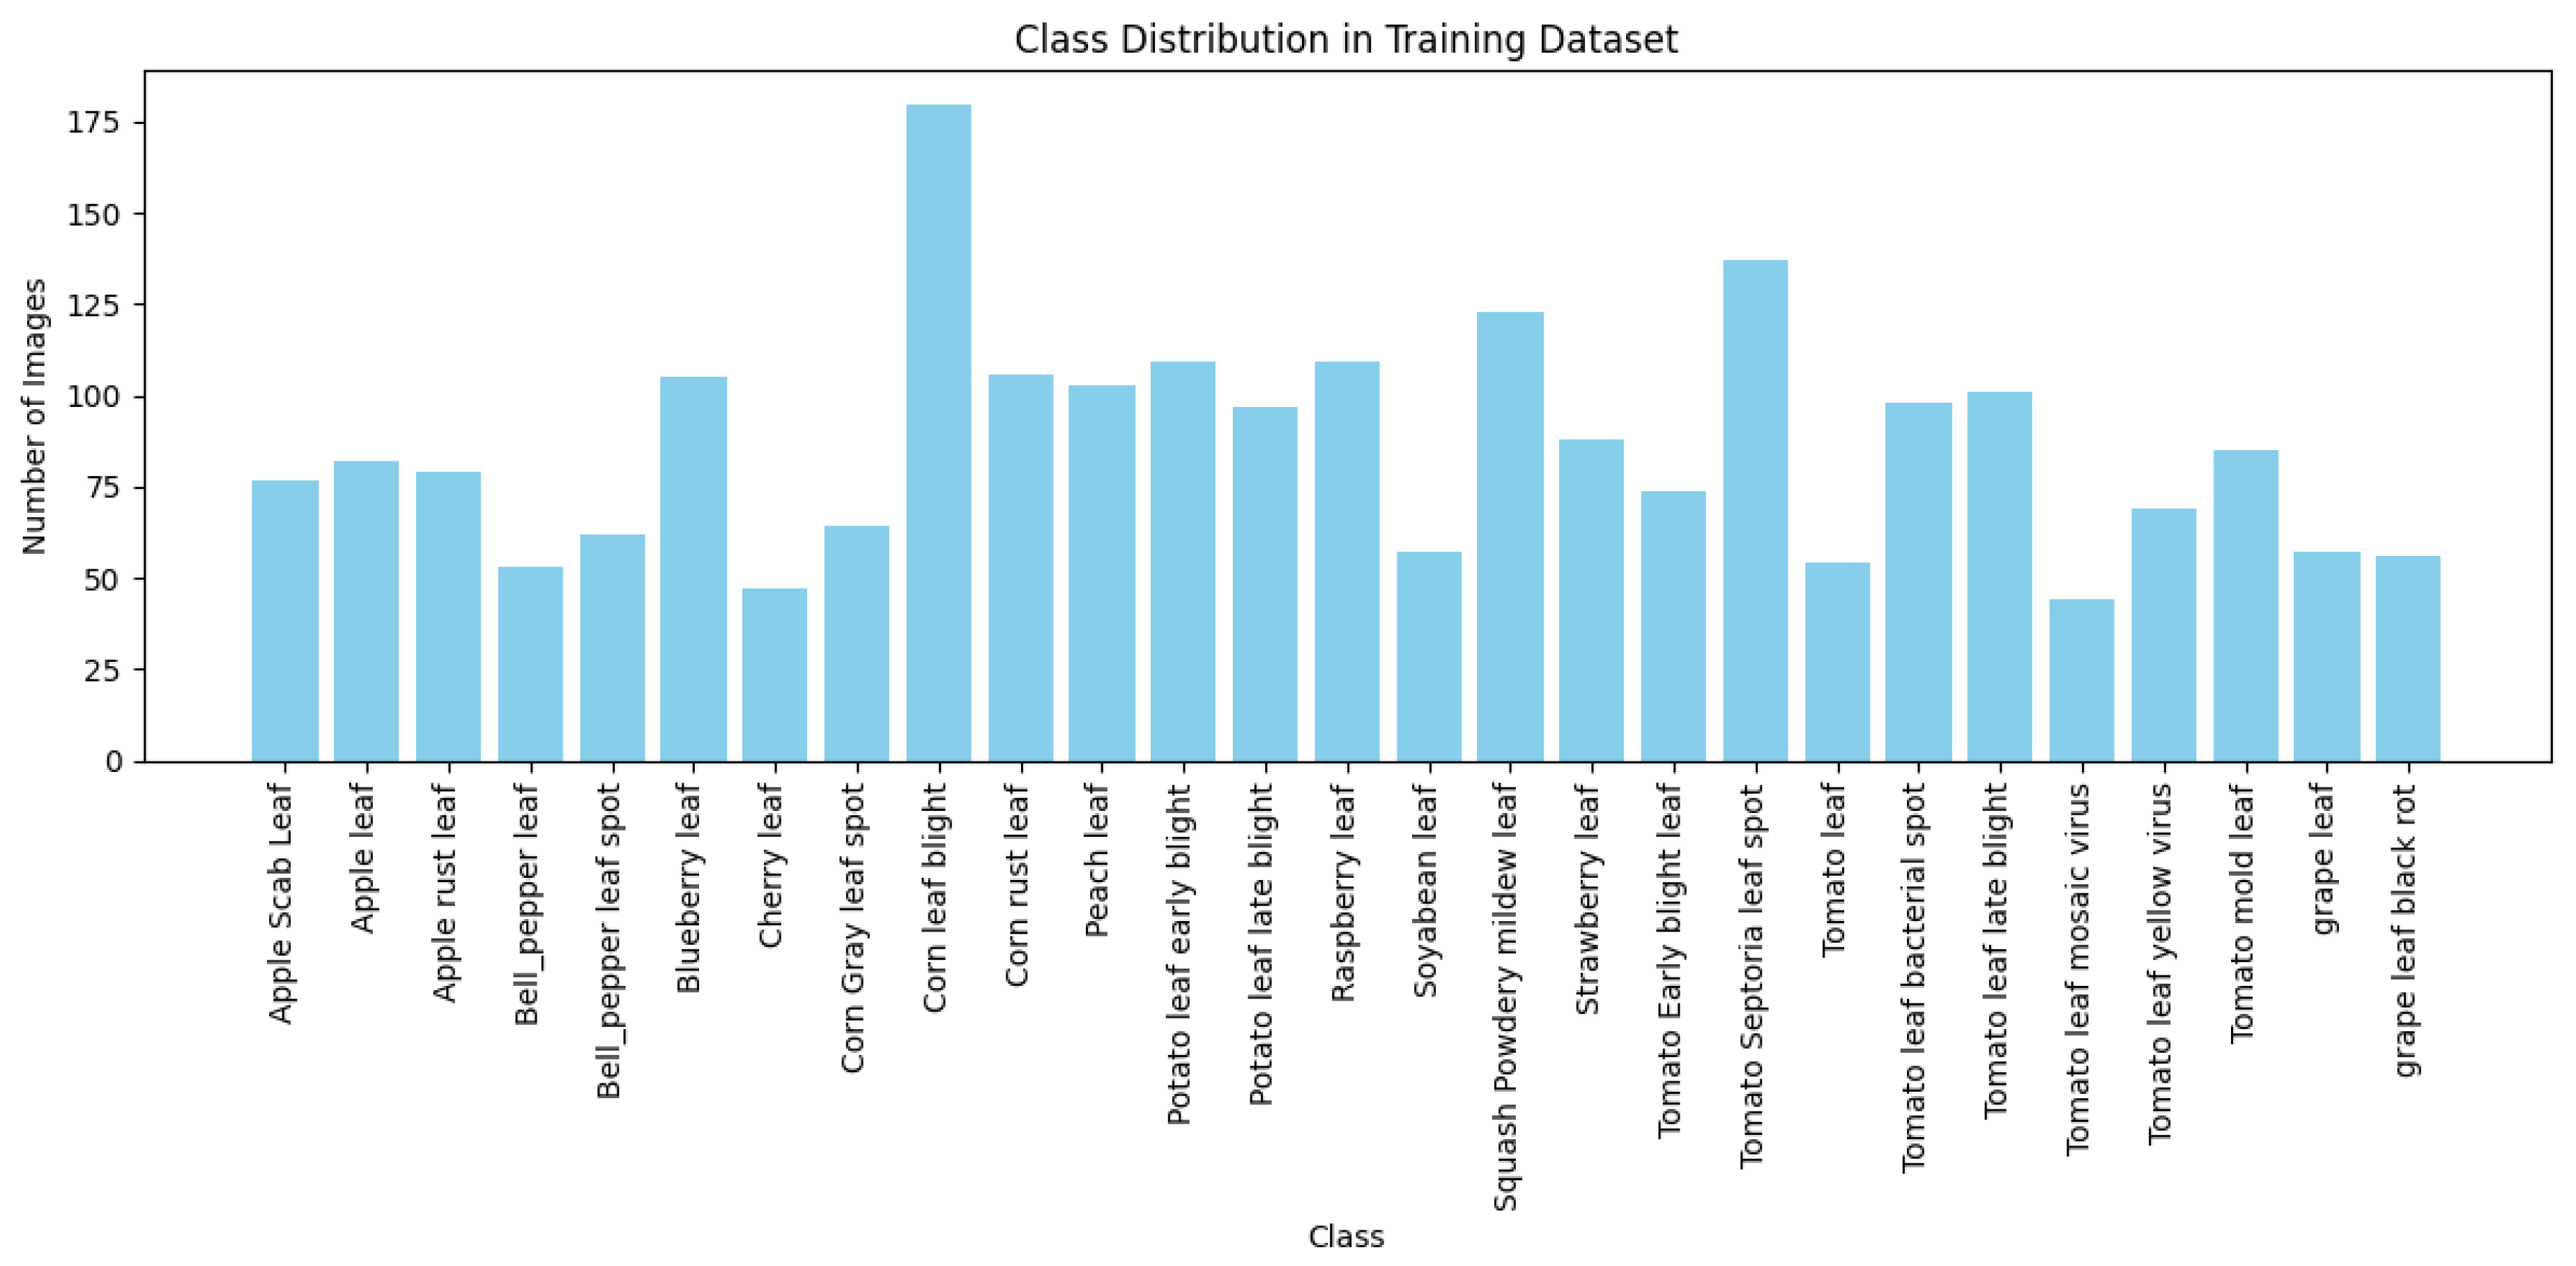
The PlantDoc dataset consists of high-quality images from 27 plant disease classes - see
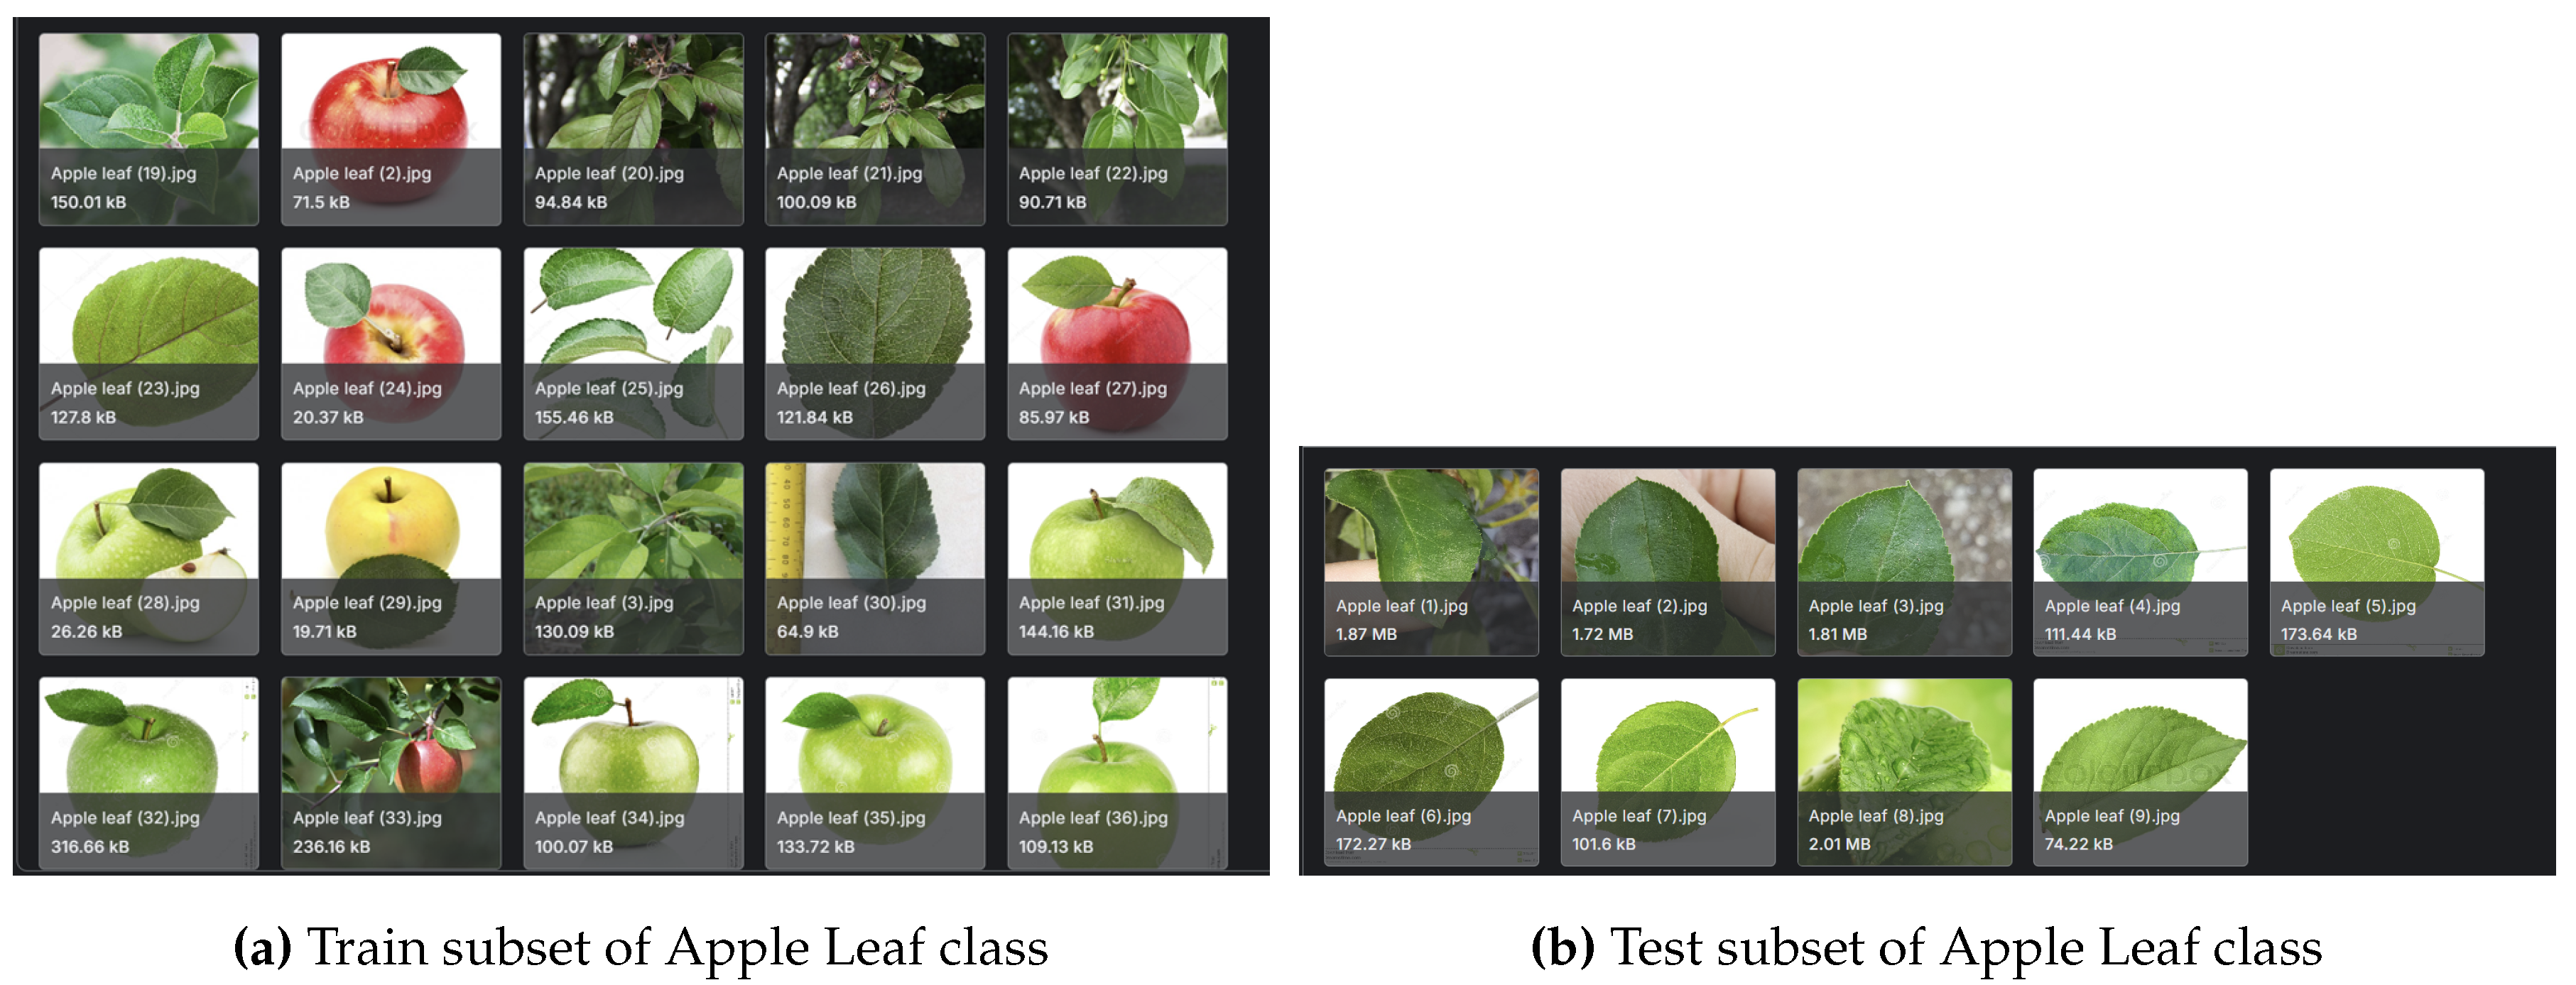
Figure 2 for the distribution and make-up of the dataset. This dataset is widely used in plant disease detection research due to its well-curated and consistently labelled images - also see
Figure 3a,b for sample images of the dataset.
However, most of the images in PlantDoc are captured in relatively controlled environments, which may limit the model’s ability to generalise to field conditions where plant diseases manifest in more varied and complex ways.
3.1.2. Web-Sourced Dataset
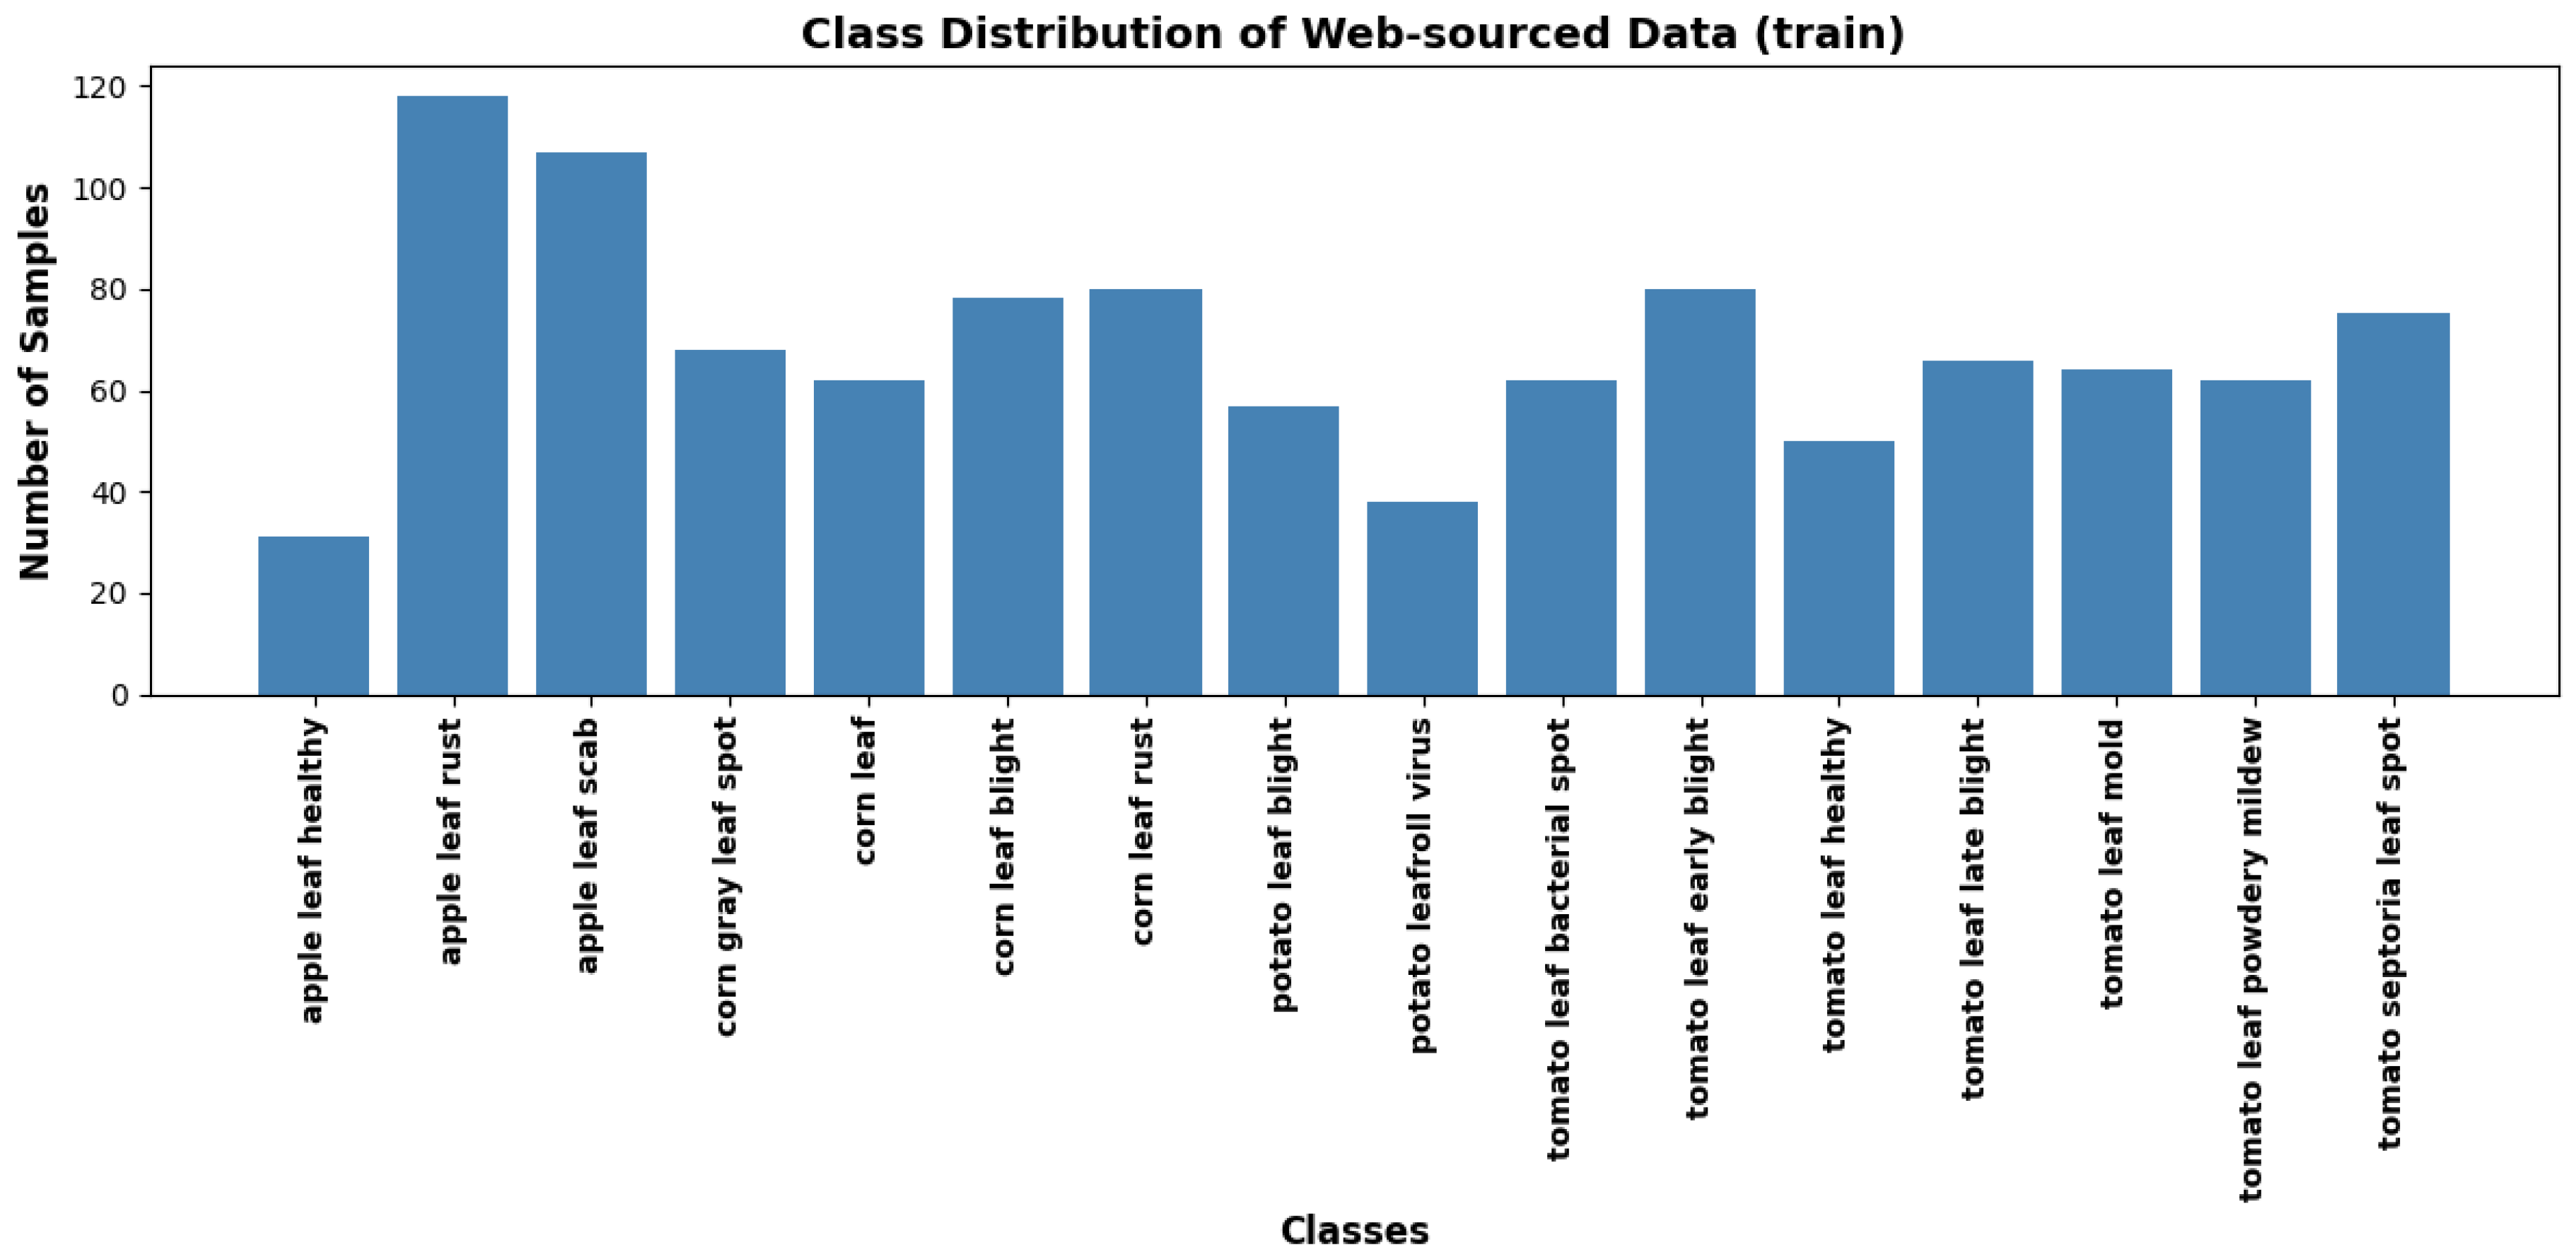
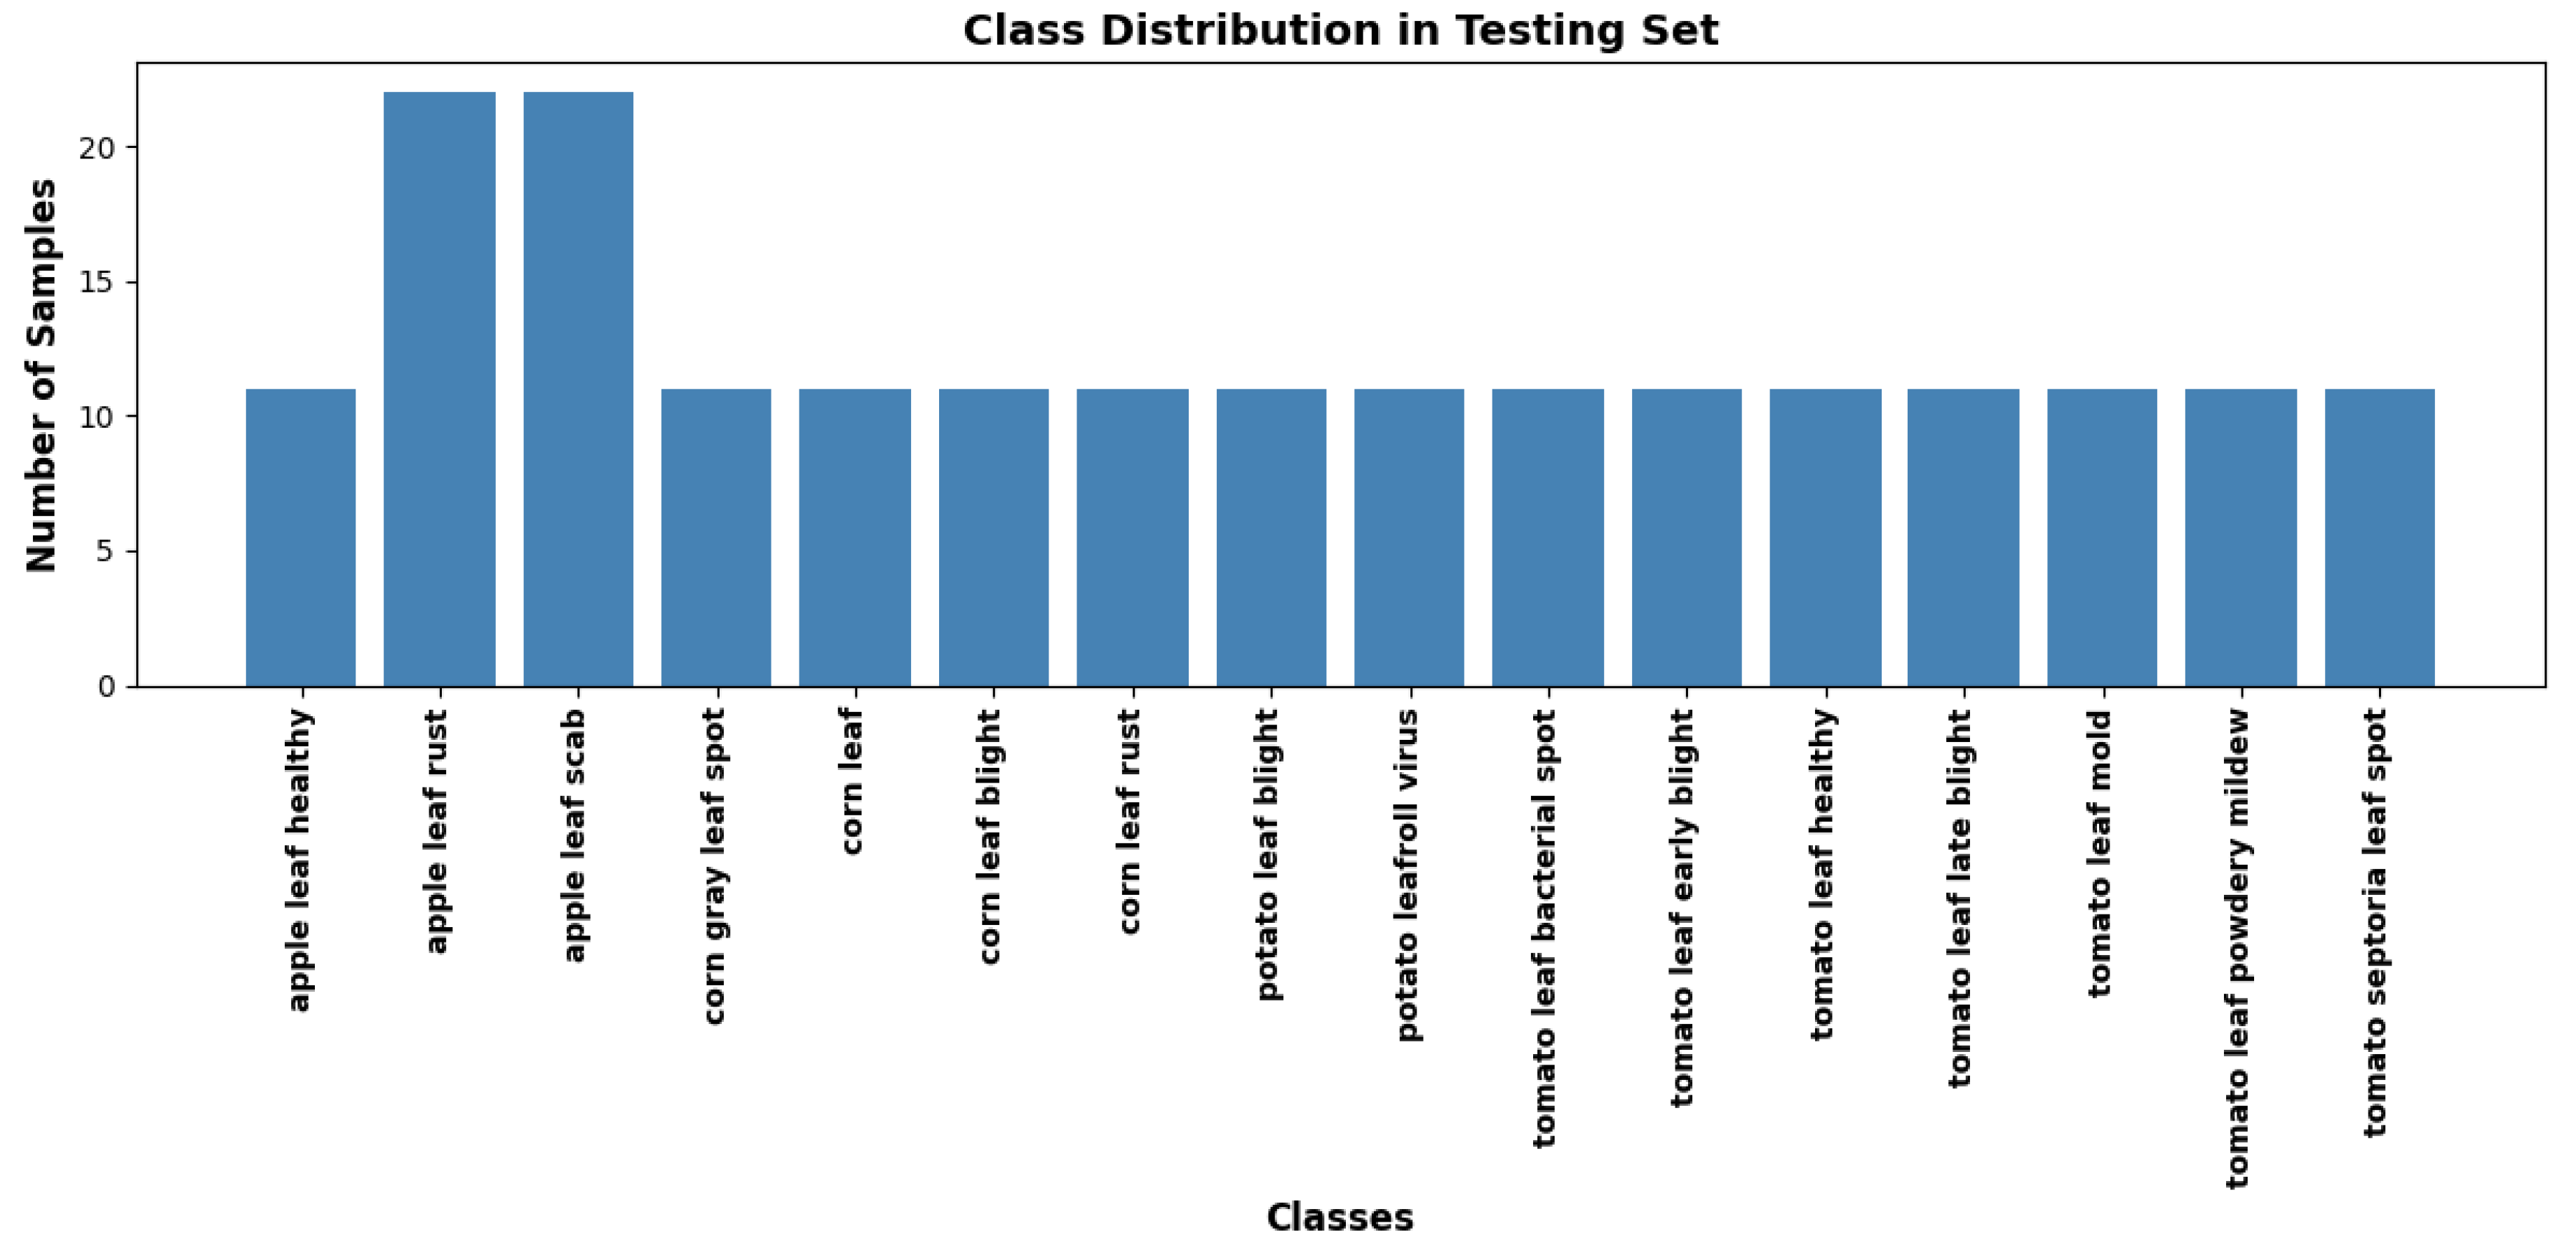
To overcome the limitations of existing datasets, a new dataset was compiled by scraping images from various online platforms, including Google Images, using a custom API. A custom file scraper was developed to utilise Google’s Custom Search API for scraping images of plant leaves exhibiting various disease symptoms. The file scraper collected a large diverse set of leaf images from multiple websites. The initial output from the scraping process contained a mixture of relevant and irrelevant content. As a result, it was essential to filter out images that were faulty, irrelevant, or of low quality. The rigorous cleaning process ensured that only high-quality, relevant images remained in the dataset. The final web-sourced dataset comprises approximately 3,000 images representing 16 plant disease classes, as illustrated in
Figure 4 and
Figure 5. The figures illustrate the instances from the training and test subsets, capturing a broad spectrum of real-world conditions. The dataset includes variations in lighting, background complexity, plant growth stages, and environmental factors.
3.1.3. The Combined Dataset for a Comprehensive Approach
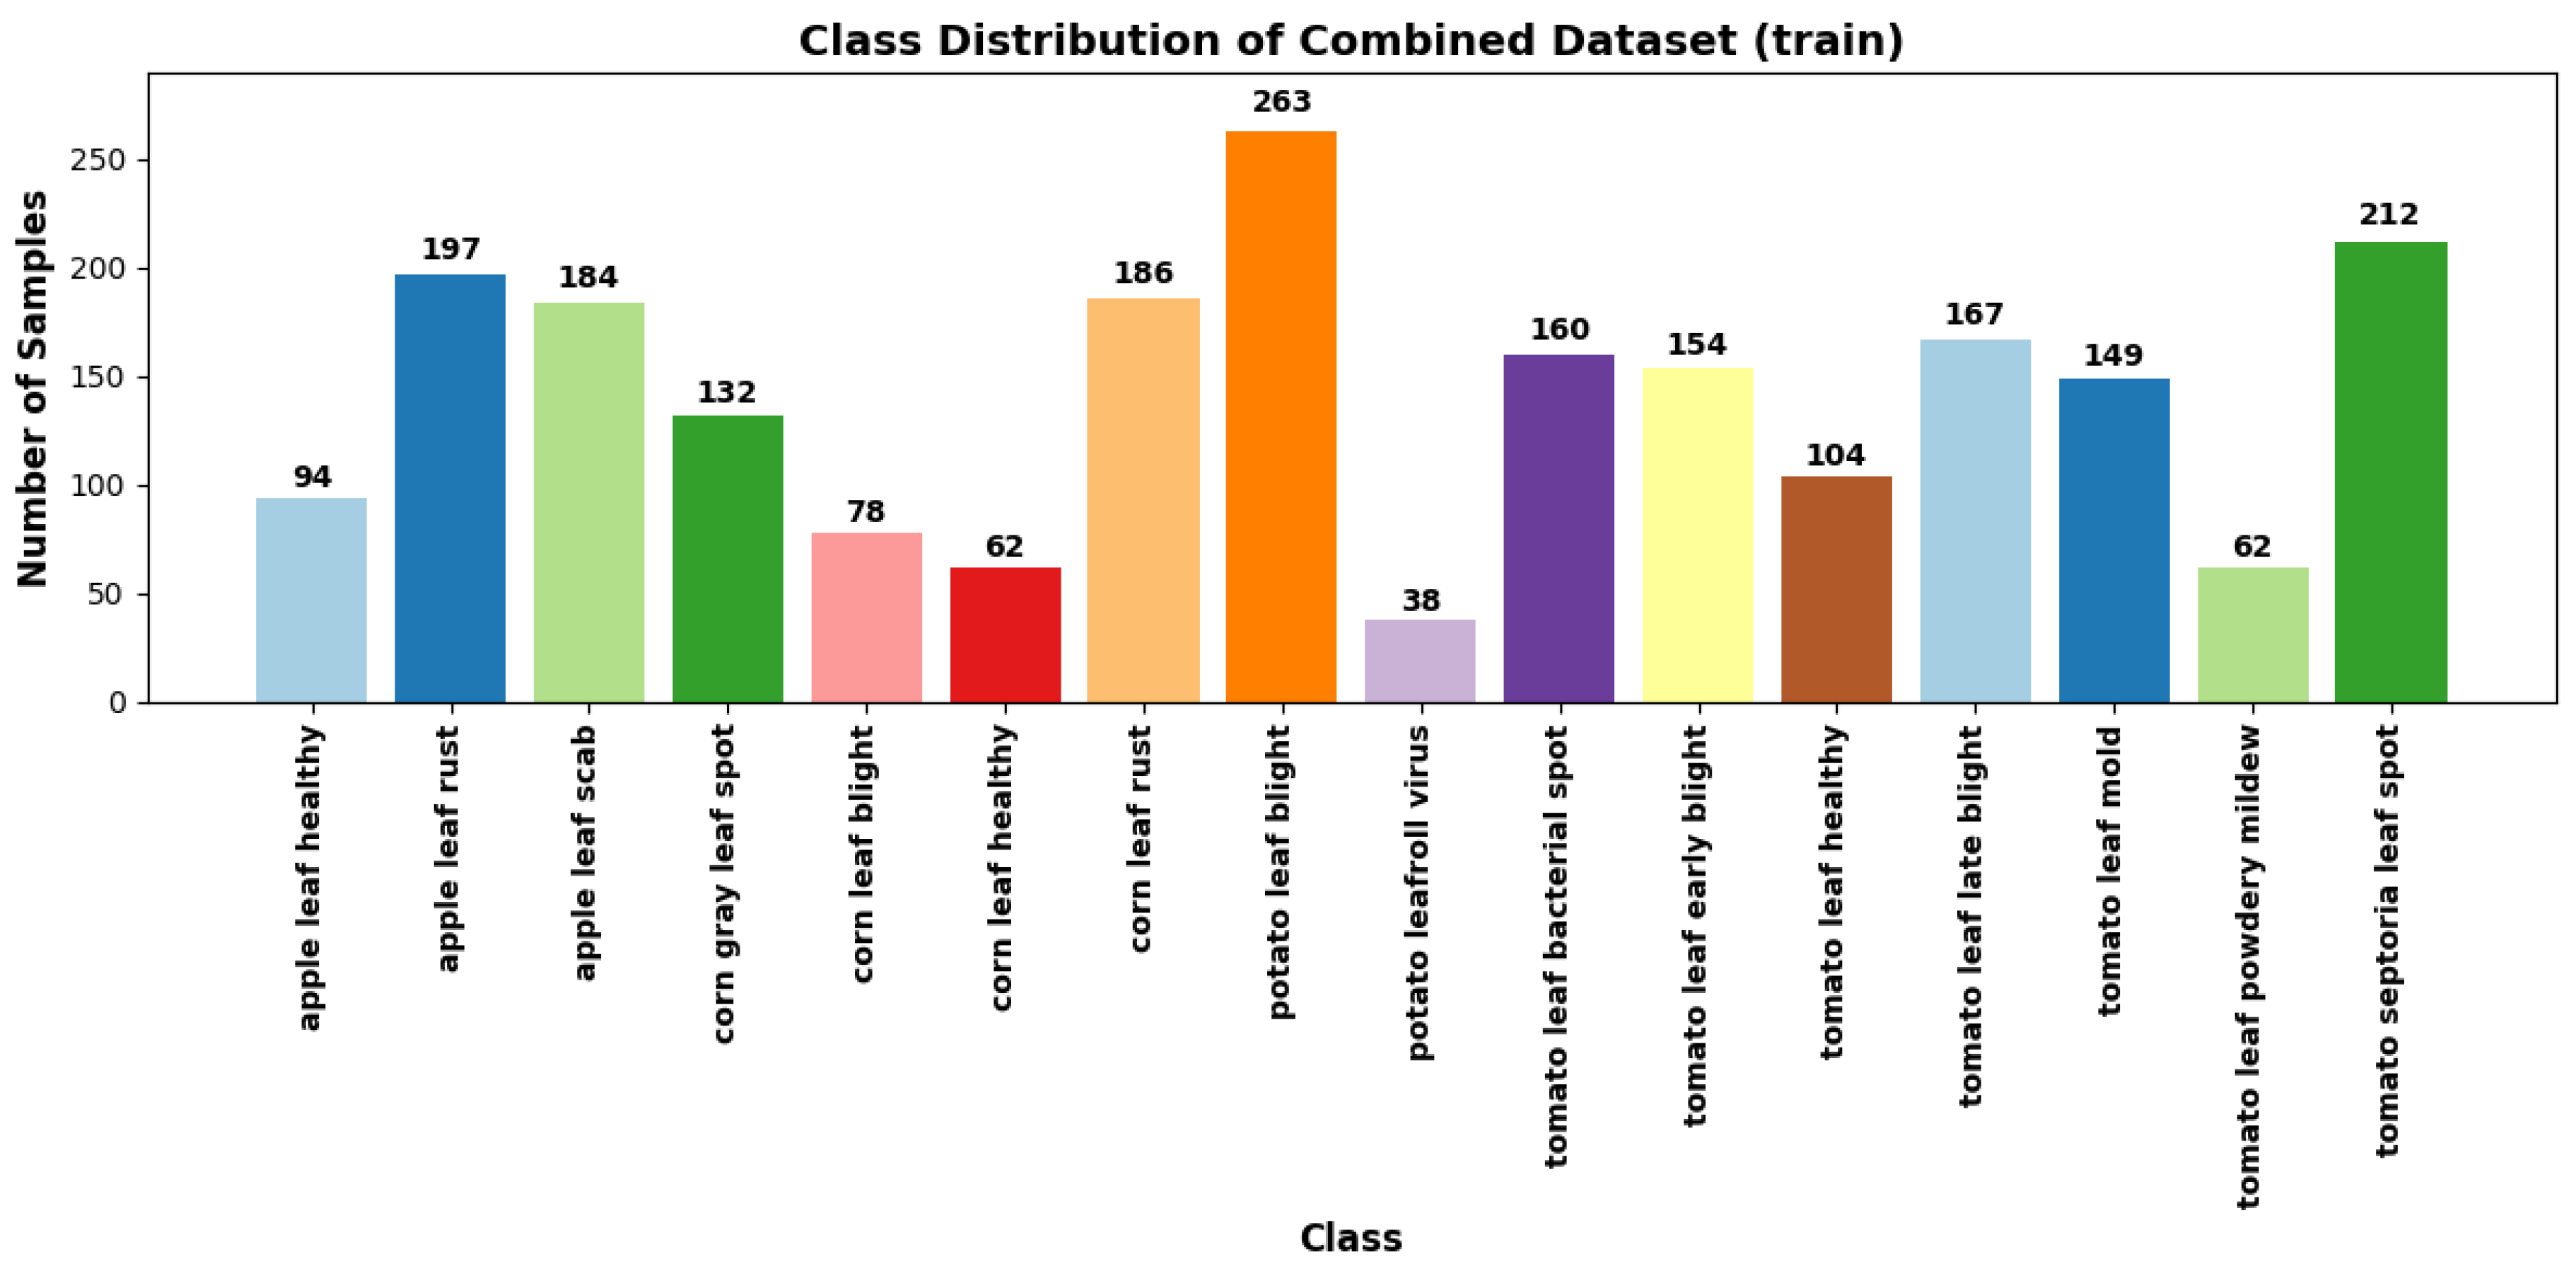
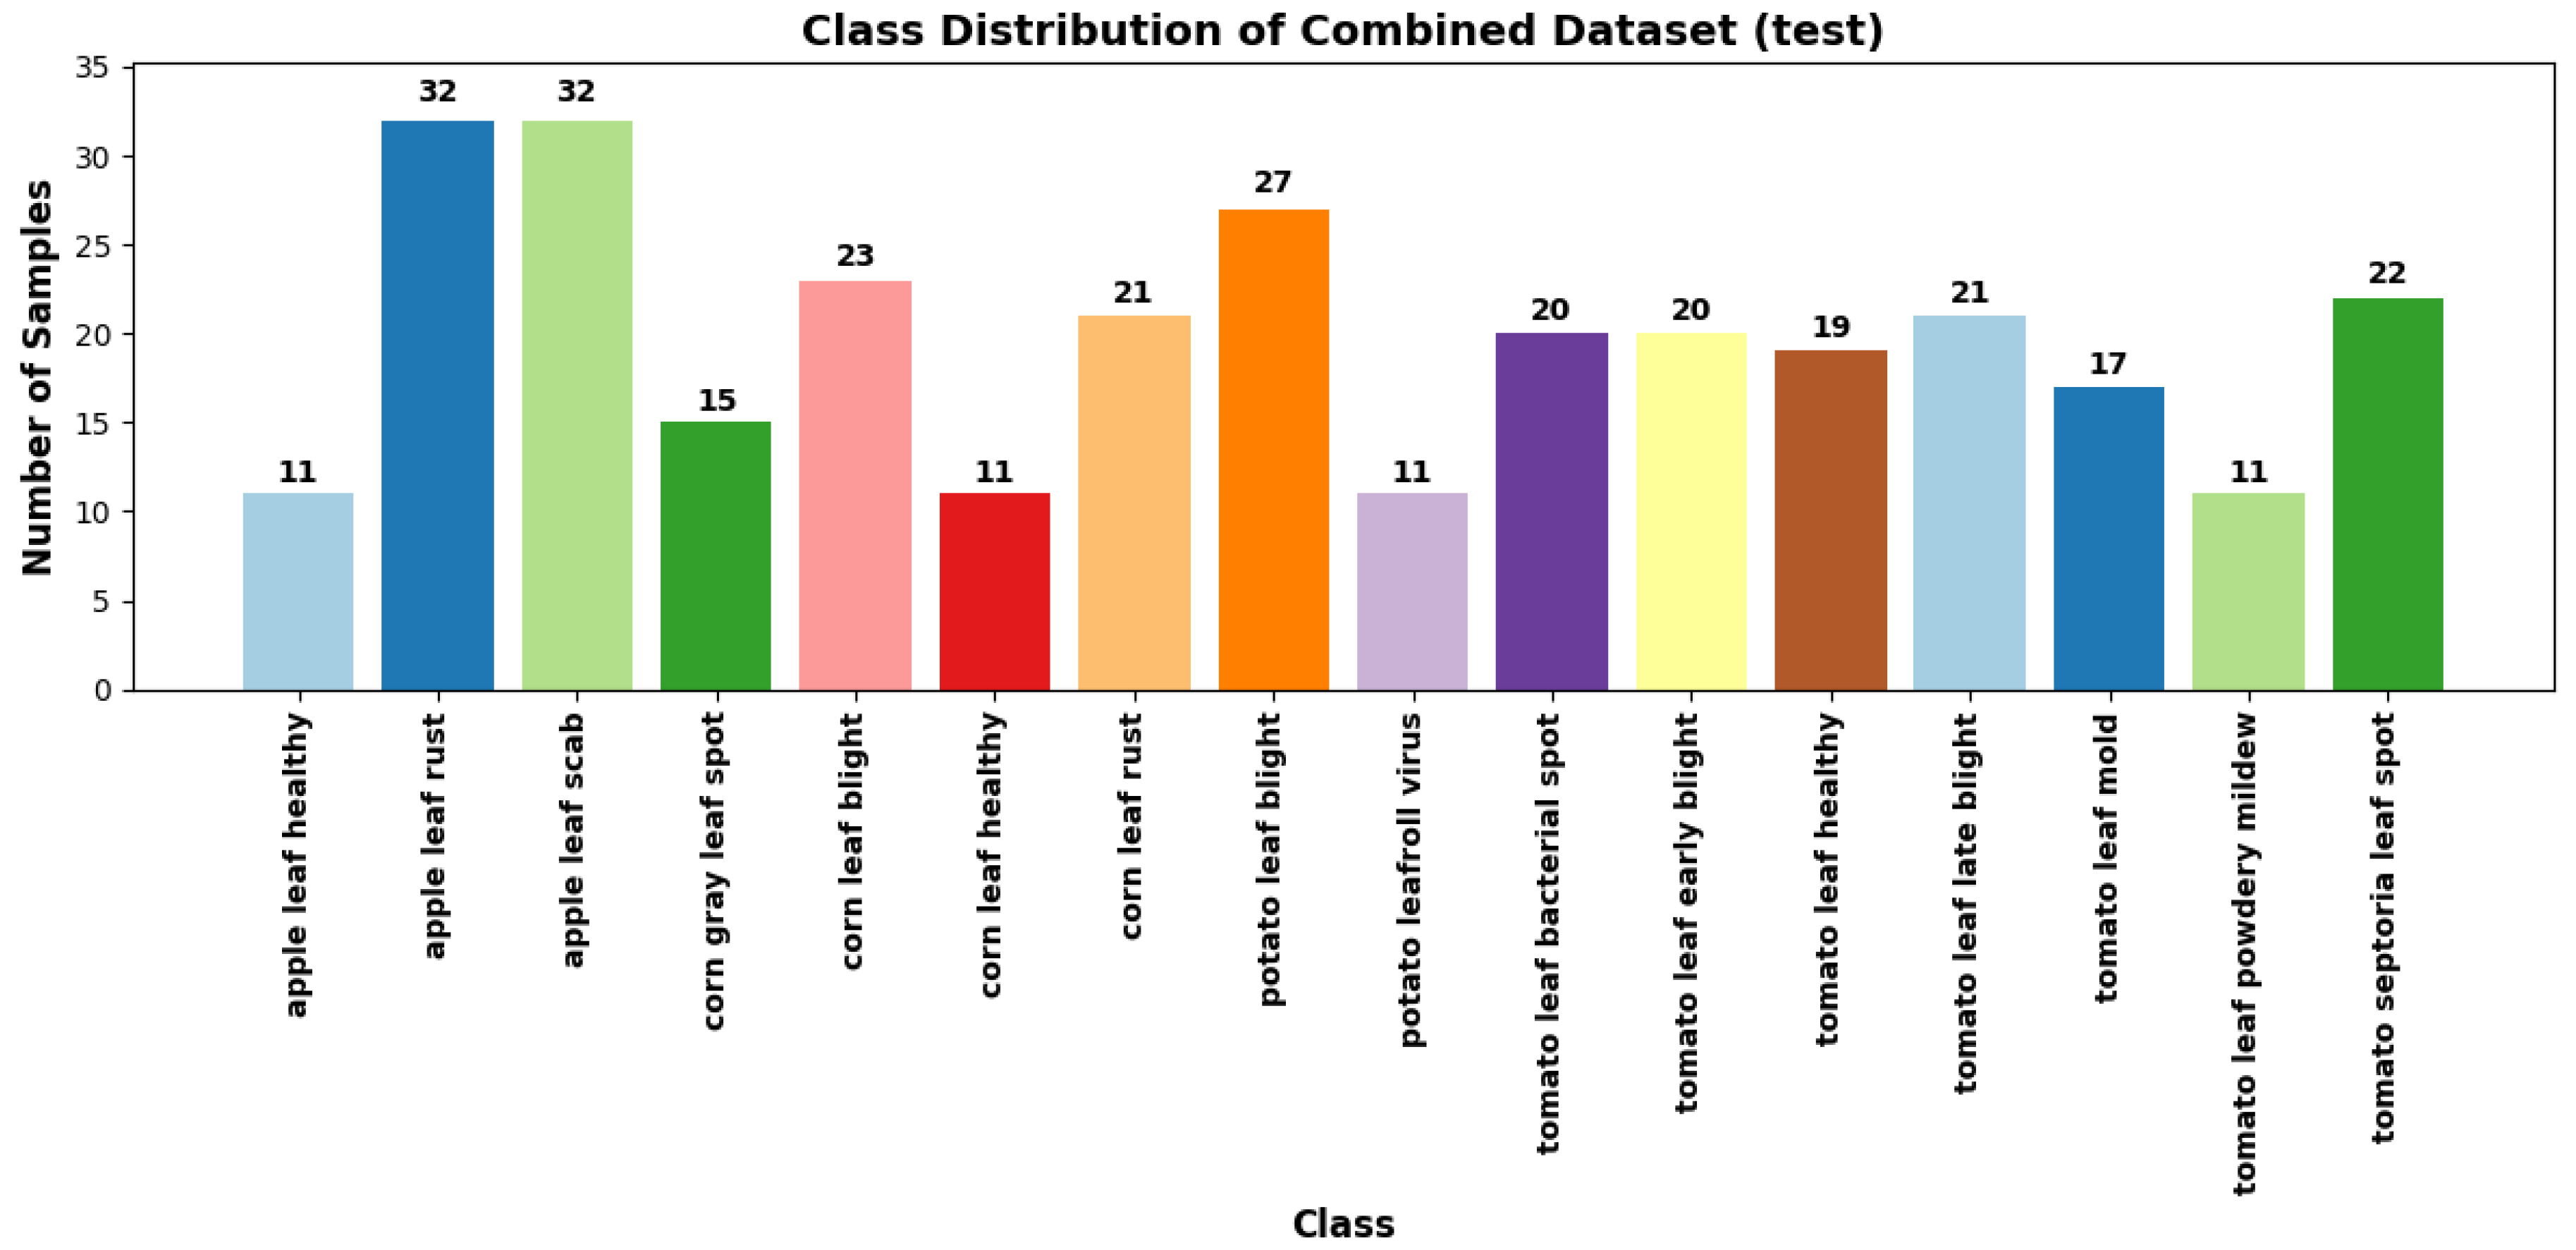
The PlantDoc and web-sourced datasets were merged to create a comprehensive dataset to achieve a more representative diversity of real-world agricultural environments. This combined dataset exposes the model to a broader range of image characteristics, disease manifestations, and background variations, enhancing its ability to generalise to unseen data. It comprises approximately 5,600 images across 27 distinct plant disease classes as illustrated in
Figure 6 and
Figure 7, providing a more realistic and diverse training set for model development.
While established datasets like PlantDoc and PlantVillage have significantly advanced plant disease detection research, they present several limitations that necessitate a more refined approach. A notable issue in the PlantDoc dataset is the inconsistency in image content across the training and testing sets. For example, the "Apple leaf" class features numerous images of whole apples in the training set, while the test set contains only close-up images of leaves. The inconsistency can hinder the model’s ability to accurately detect diseases. A refined dataset must maintain a consistent focus on relevant plant parts for effective disease detection. Datasets such as PlantVillage typically consist of images captured in controlled environments, characterised by uniform backgrounds and optimal lighting conditions. The settings limit the model’s ability to generalise to field conditions, where plants may display disease symptoms influenced by various environmental factors. The dataset generated for this study is available for public download
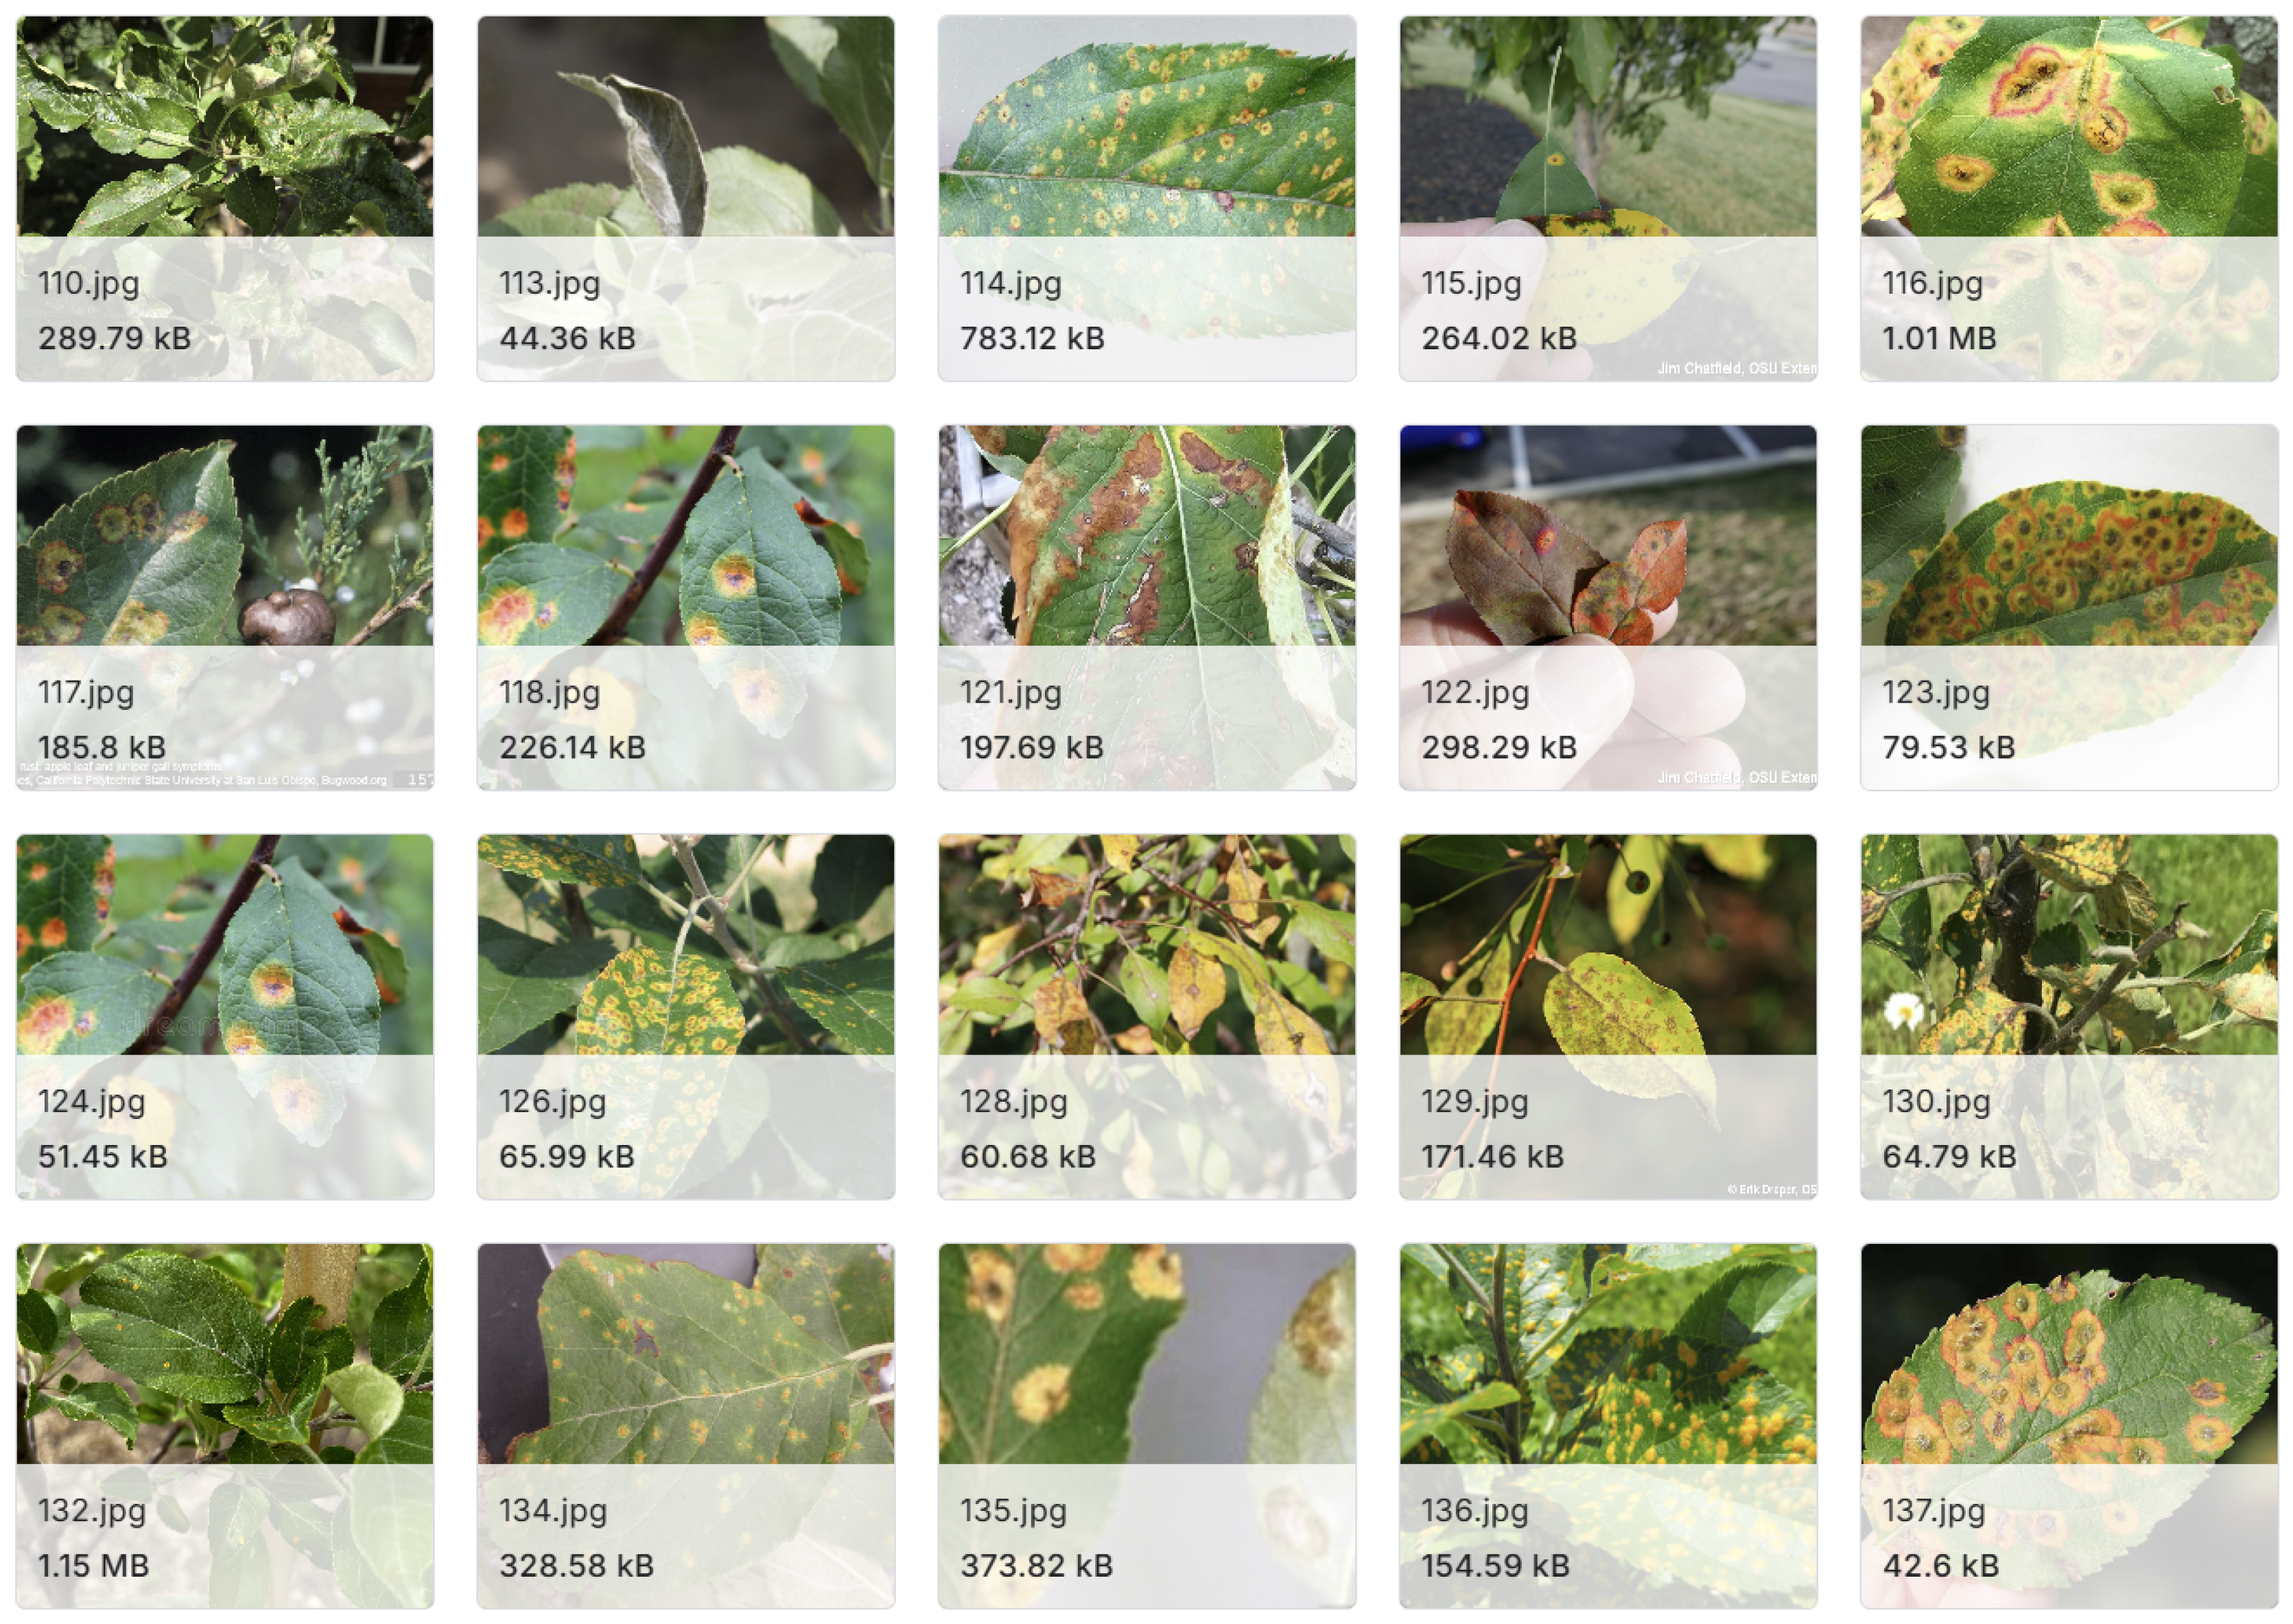
The final combined dataset features high-quality images from the PlantDoc dataset, which are curated and consistently labelled under controlled conditions, alongside real-world images from the web-sourced data that introduce variations in background complexity, lighting conditions, and image quality. Images from the combined dataset can be seen in
Figure 8.
3.2. Data Processing
The authors apply a data processing strategy integrating both the PlantDoc and web-sourced datasets. The images were resized to 224x224 pixels to ensure consistent input dimensions while preserving sufficient detail for disease detection. The standard size is compatible with many pre-trained models, such as ResNet and EfficientNet, streamlining the learning process. Subsequently, normalisation was performed using ImageNet statistics, capitalising on the pre-training of these models to improve performance and accelerate convergence during training. Data augmentation techniques played a crucial role in enhancing model robustness. Random resized cropping was applied to simulate variability in leaf positioning and camera distance, thereby increasing the model’s adaptability. Random horizontal and vertical flips were included as plant diseases are generally invariant to orientation, further diversifying the dataset without compromising realism. Random rotations of up to 20 degrees were applied to mimic natural variations, ensuring disease features remained discernible. Colour jitter was implemented to account for fluctuations in lighting conditions, with modest adjustment values preventing unrealistic colour shifts. Furthermore, a noise augmentation technique was introduced to simulate real-world image degradation. Specifically, Gaussian noise was added to the images with a mean of 0 and a standard deviation of 0.05, striking a balance between image degradation and the preservation of critical features.
3.3. Models Architecture
This work proposes a pipeline, illustrated in
Figure 9, which includes image processing techniques, data augmentation, model training, testing, and evaluation. Within this pipeline, four distinct CNN architectures from PyTorch’s torchvision models are employed.
Figure 9 provides a detailed depiction of each stage, highlighting the image processing steps used to prepare the data, the augmentation strategies to enhance model robustness, and the training and evaluation processes to assess model performance.
ResNet50 is a 50-layer deep network from the Residual Network family, introduced by He et al. [
47]. It effectively addresses the vanishing gradient problem in very deep networks through skip connections. Key features include identity shortcut connections that allow the network to learn residual functions, batch normalisation after each convolutional layer to enhance training stability and speed, and global average pooling in place of fully connected layers, which reduces the number of parameters.
EfficientNet-B3 was introduced by Tan and Le [
48], and is designed to scale network depth, width, and resolution in a balanced manner, providing high accuracy with improved efficiency. Its notable features include a compound scaling method that adjusts model depth, width, and resolution, Mobile Inverted Bottleneck Convolution (MBConv) as the foundational building block, and Squeeze-and-Excitation blocks that recalibrate channel-wise features.
DenseNet201 is part of the Densely Connected Convolutional Network family introduced by Huang and Liu [
49], is characterised by dense connections between layers, where each layer receives inputs from all preceding layers. Its key features consist of dense blocks that connect each layer to every other layer in a feed-forward manner, transition layers between dense blocks for downsampling, and improved gradient and information flow throughout the network.
EfficientNet-B0 the baseline model within the EfficientNet models, is smaller and more computationally efficient than EfficientNet-B3, making it suitable for environments with limited computational resources. While its features closely resemble those of EfficientNet-B3, it operates with a reduced network size.
Experiments were conducted in parallel, comparing model performance using original images and images with added Gaussian noise. This setup facilitated direct assessments of the models under varying conditions. A batch size of 64 was utilised to balance memory constraints and the stability of gradient estimates during training. To address the class imbalance in the web-sourced dataset, inverse frequency weighting was applied, enhancing the loss function’s sensitivity to underrepresented classes and promoting equitable model performance across all classes. A custom function, create_model, was developed to instantiate the models with an appropriate output layer corresponding to the number of plant disease classes. The final fully connected layer was replaced to ensure alignment with the specific classification task.
4. Experiments and Results
The experiments and results are structured around three key evaluations, each aimed at testing different dimensions of the model’s performance and its ability to generalise across diverse datasets. These experiments were designed to evaluate the robustness of the model across diverse datasets, including both controlled and real-world image variations. The overall objective was to measure the effectiveness of the noise augmentation technique, the impact of data augmentation strategies, and the model’s ability to generalise across different datasets.
The first experiment involves within-dataset evaluation, where the model is trained and tested separately on the PlantDoc dataset. The experiment provides a baseline measure of performance on controlled (PlantDoc) and real-world (web-sourced) image collections, helping to assess how well the model handles variability in image quality and background conditions. In the second experiment, a cross-dataset evaluation is conducted. The model is trained on the PlantDoc and tested on the other web-sourced dataset, and vice versa. This experiment is expected to demonstrate the model’s generalisation ability when exposed to data from a different source, which simulates real-world deployment scenarios where the model may encounter unseen variations in image characteristics. In the third experiment, the combined dataset is evaluated by training the model on the merged dataset (PlantDoc + web-sourced) and testing it on the web-sourced dataset alone. The approach was designed to explore whether the increased diversity of training data enhances the model’s performance on real-world images by providing exposure to both controlled and uncontrolled conditions during training.
Detailed performance metrics such as accuracy, precision, recall, and F1-score are calculated for each experiment to comprehensively evaluate the model’s performance. However, for the sake of clarity and consistency, the experimental results presented in this paper primarily focus on accuracy as the key performance metric, supplemented by the confusion matrix. Accuracy has been chosen as the primary metric because it provides a clear and straightforward measure of the model’s overall effectiveness in correctly classifying images, making it suitable for comparing performance across different datasets and scenarios. The confusion matrix further supports this by offering insights into specific misclassification patterns, highlighting the model’s strengths and weaknesses across different classes.
4.1. Experiment 1: Training and Testing with PlantDoc Dataset
The performance of four pre-trained models, ResNet50, EfficientNet-B3, DenseNet201, and EfficientNet-B0 was evaluated on the PlantDoc dataset in this experiment. The evaluation was conducted under two conditions: without noise augmentation and with the addition of Gaussian noise to the input images. This approach enabled an assessment of both the baseline performance of the models and their robustness to image perturbations.
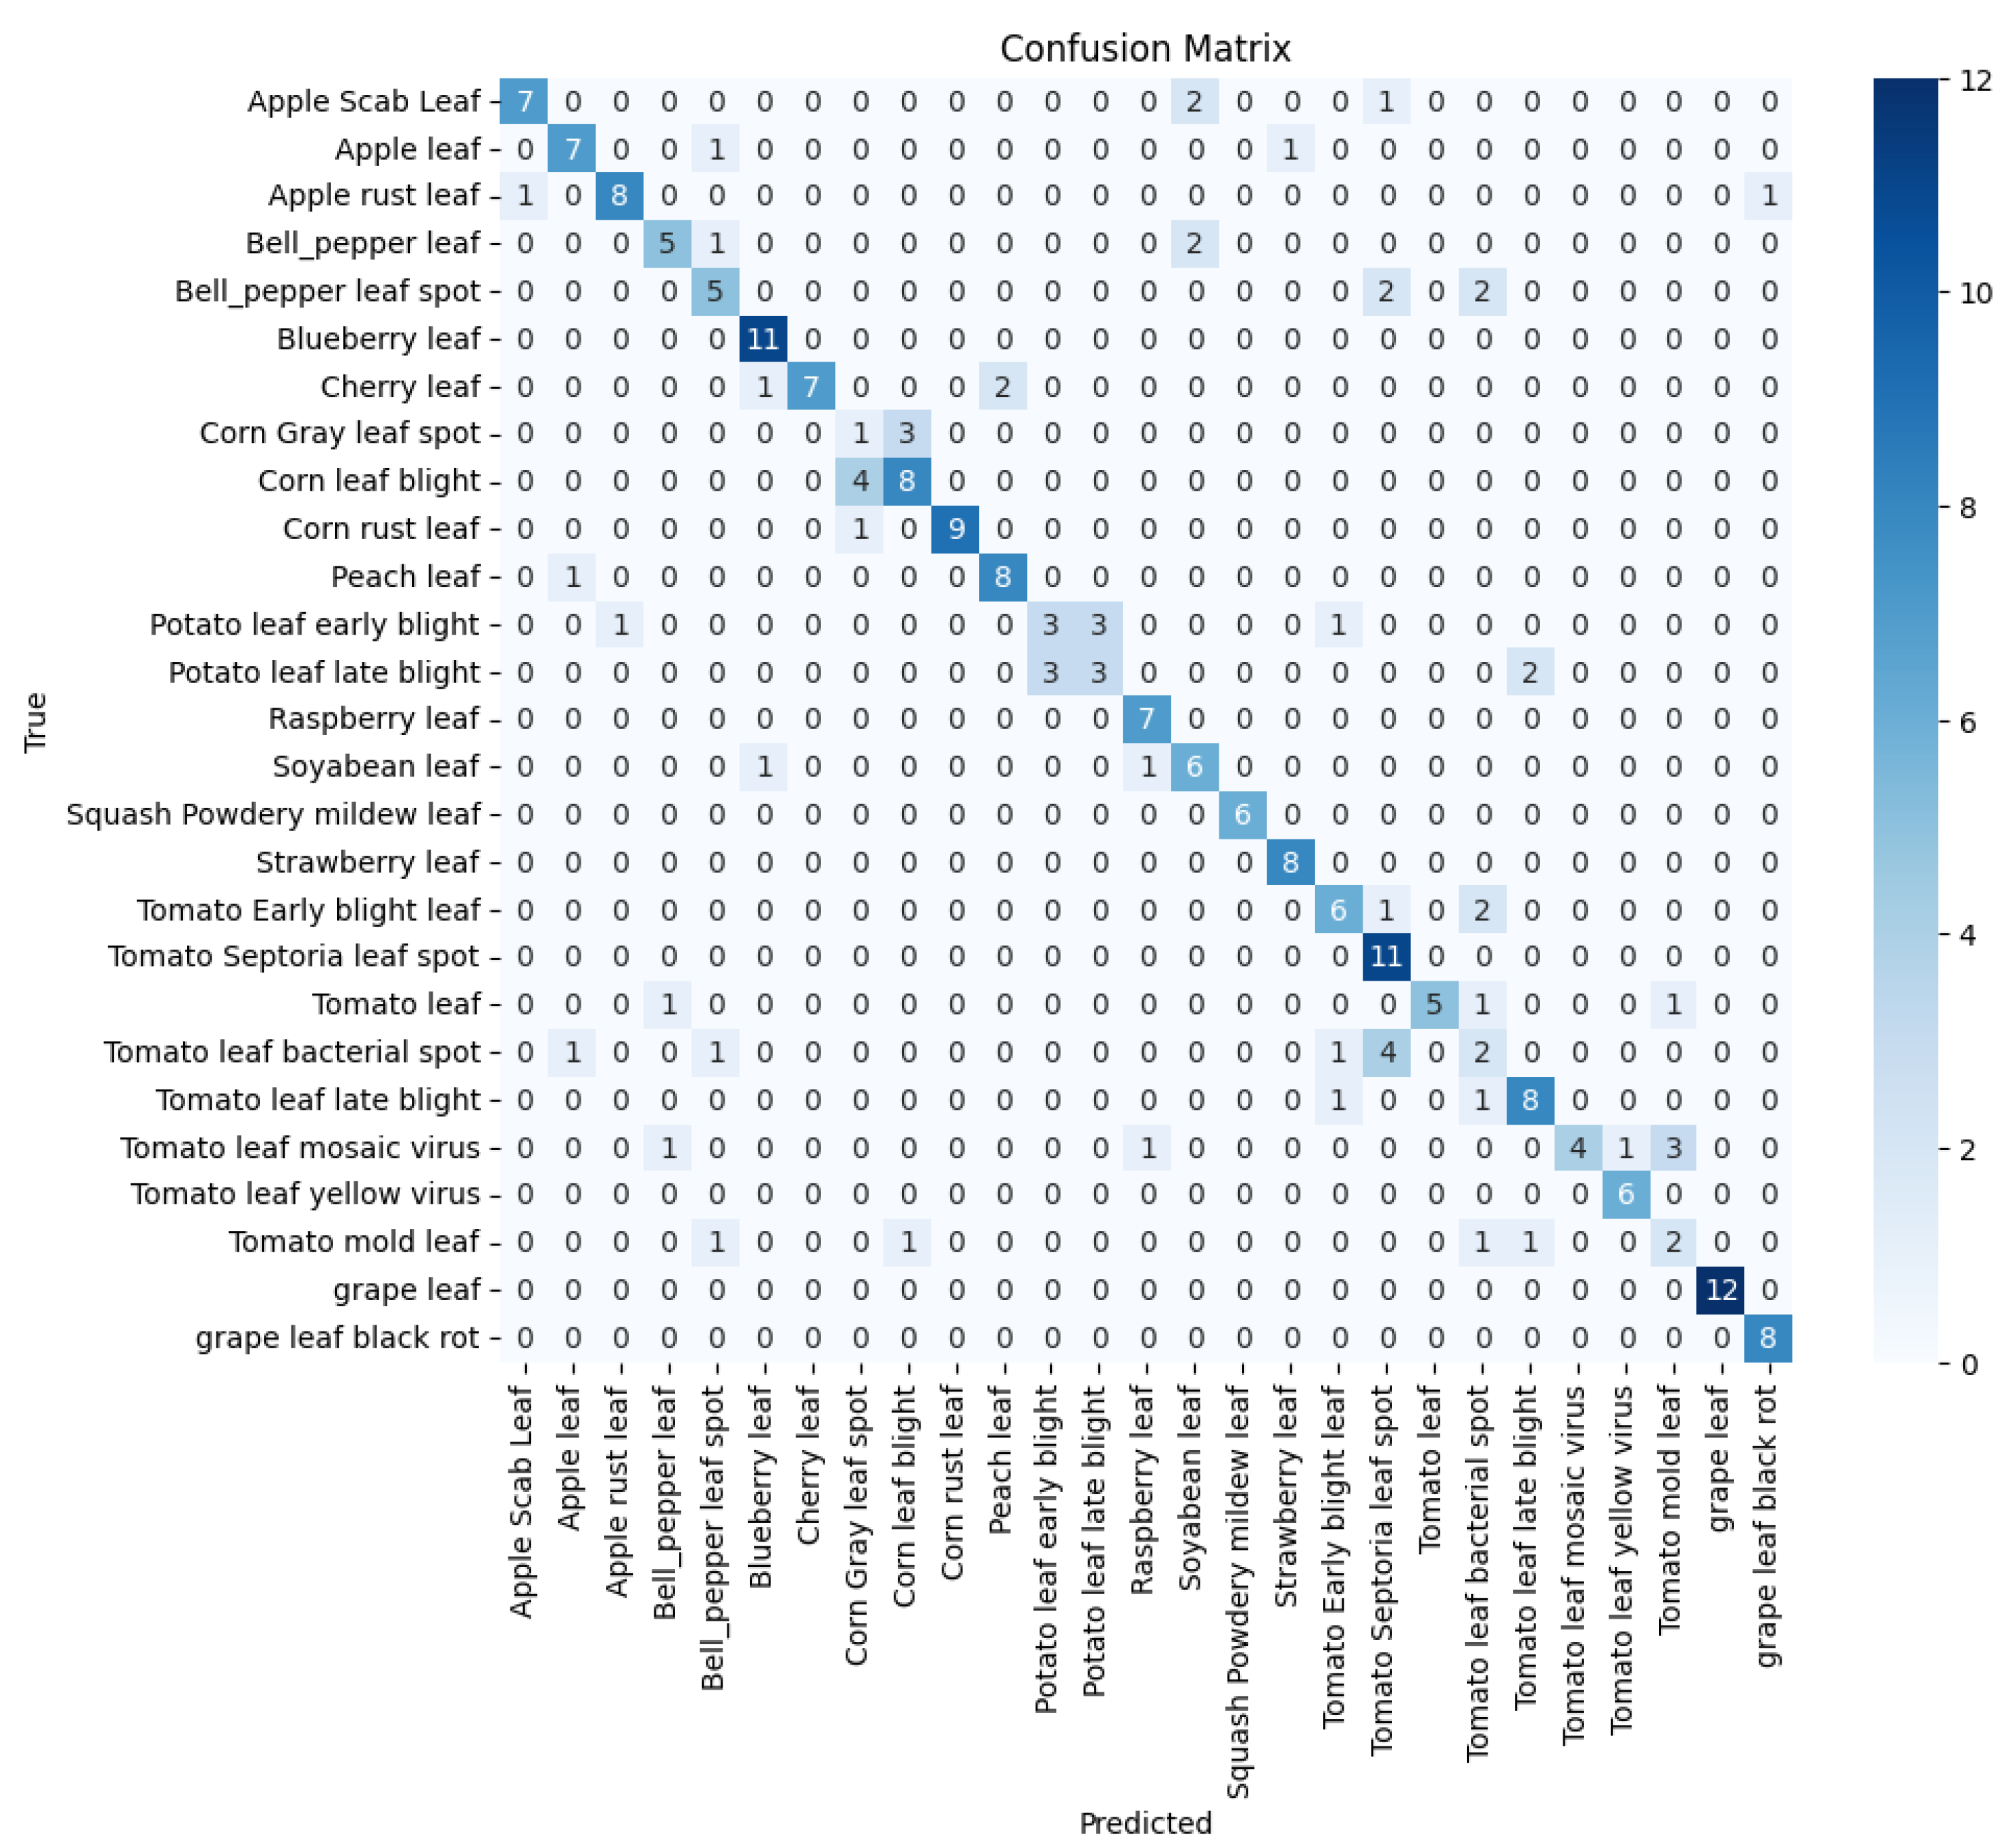
As shown in
Table 1 and
Figure 10 EfficientNet-B0, model performed best which can be attributed to their compound scaling method. This method uniformly scales network width, depth, and resolution, allowing EfficientNet to maintain an optimal balance between model size and accuracy, outperforming the traditional scaling approaches employed by ResNet and DenseNet architectures. ResNet50, despite its deep architecture, showed the lowest performance among the models. The relatively smaller and less complex PlantDoc dataset may not have been sufficient to fully leverage ResNet50’s large capacity, potentially leading to overfitting. DenseNet201, with its dense connectivity pattern, performed well, although not as effectively as the EfficientNet models. While its dense connections promote feature reuse and mitigate the vanishing gradient problem, they might have introduced redundancy in feature maps for this specific task, which limited its performance compared to EfficientNet.
4.2. Experiment 2: Training with PlantDoc Dataset and Testing with Web-Sourced Dataset
In experiment 2, the generalisation capability of the models was assessed by training them on the PlantDoc dataset and testing them on the web-sourced data. This evaluation aimed to determine how well the models could transfer knowledge from one dataset to another and how robust this transfer was to image perturbations.
As presented in
Table 2 and depicted in
Figure 11a,b, EfficientNet-B3 demonstrated superior performance in noise-free conditions, highlighting the effectiveness of its compound scaling method and architecture in learning generalisable features. However, its performance dropped slightly when noise was introduced, indicating some sensitivity to image perturbations in a cross-dataset scenario.
EfficientNet-B0, despite being a smaller model, performed nearly as well as EfficientNet-B3 in the absence of noise. Remarkably, it showed the best performance when noise was added, underscoring the robustness of the EfficientNet architecture, even at smaller scales, and its ability to generalise well, particularly in the presence of image perturbations. DenseNet201 achieved an accuracy of 73.23% without noise, demonstrating strong generalisation capability. However, it experienced the largest performance drop when noise was introduced, suggesting that its dense connectivity pattern might be more susceptible to image perturbations in this context. ResNet50, while achieving an accuracy of 65.15% without noise, performed worse compared to other models. The results showed the smallest decrease in performance when noise was added, indicating a certain level of robustness, though at a lower overall accuracy compared to the other models.
4.3. Experiment 3: Training with Combined Dataset and PlantDoc, Test with Web-Sourced dataset.
The performance of the models was evaluated after training on a combined dataset from PlantDoc and a web-sourced dataset, and tested on a sample of web-sourced dataset. See
Table 3 and
Figure 12a,b for the experimental result for model performance with training with combined PlantDoc and web-sourced datasets and testing with Web-sourced data.
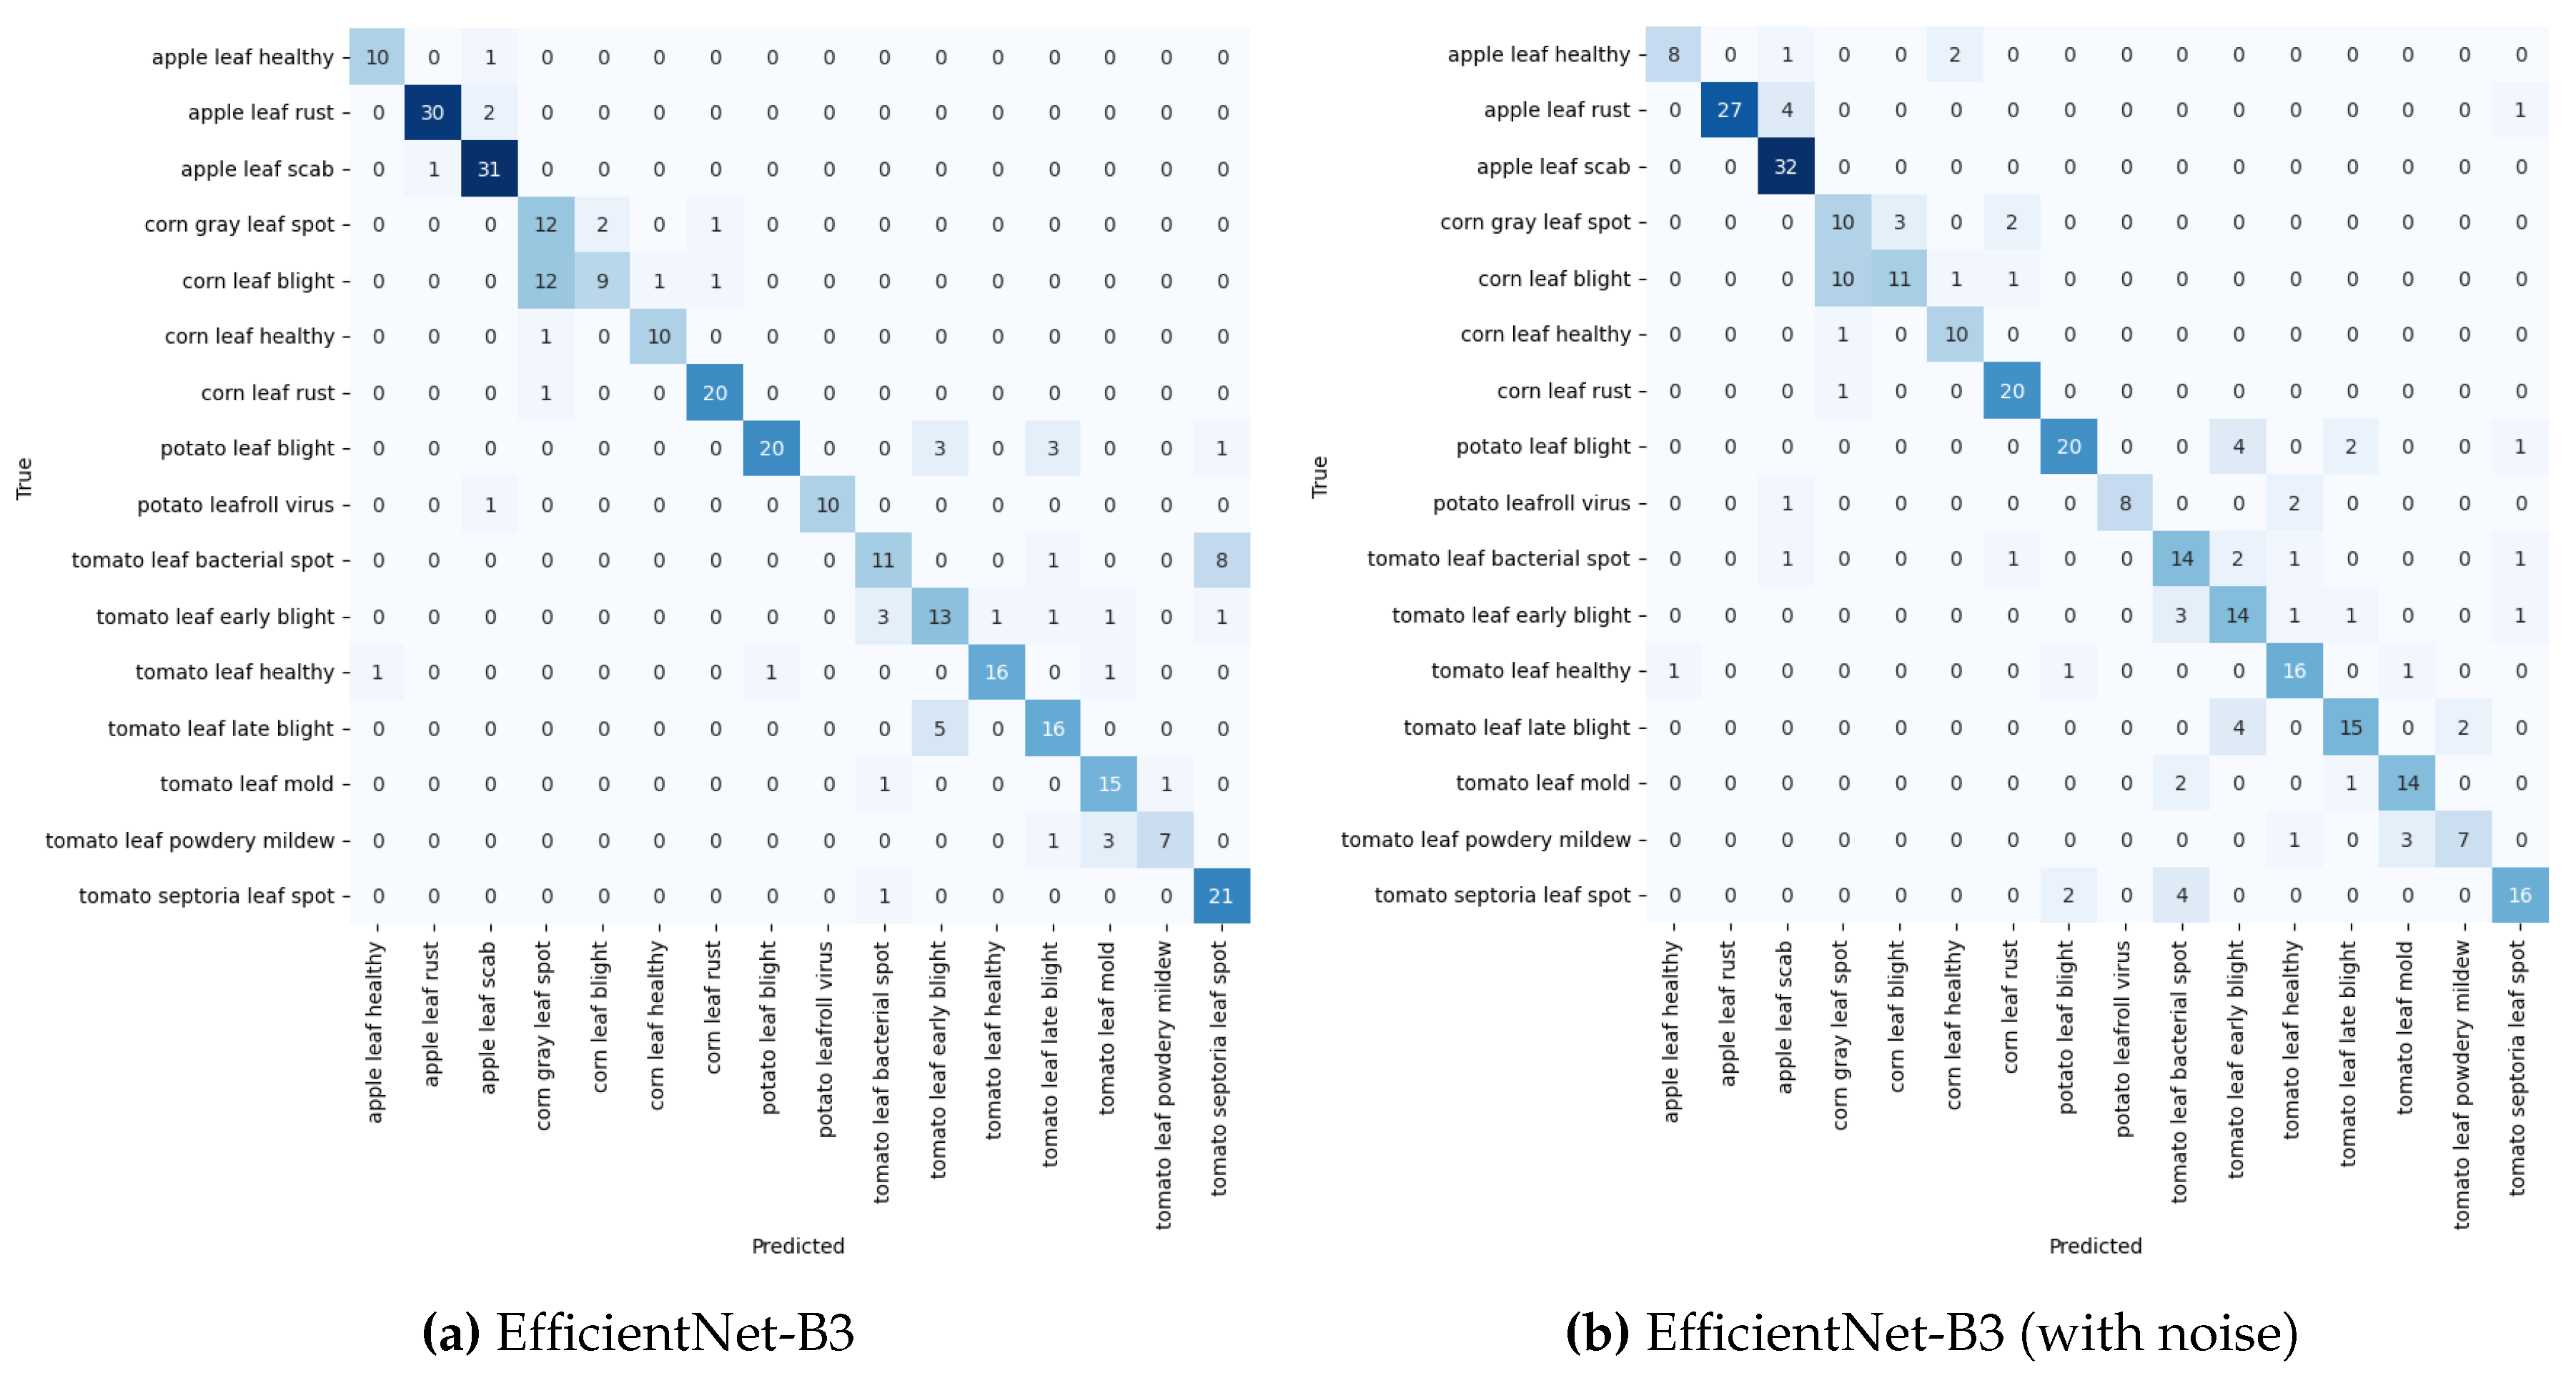
EfficientNet-B3 performed exceptionally well in both noise-free and noisy conditions, demonstrating effective feature learning and moderate robustness to noise. EfficientNet-B0 followed closely, particularly in the noise-free scenario, highlighting the model’s efficiency even at a smaller scale. DenseNet201 achieved a strong accuracy of 77.00% without noise, indicating solid performance and good resilience to noise. ResNet50, while improving to 67.41% accuracy without noise due to more training data, performed worse than the other models in overall performance.
The impact of noise on model performance showed that all models experienced a decrease in accuracy when noise was introduced, but the drop was less pronounced compared to previous experiments. The improvement suggests that the combined dataset helped the models learn more robust features, contributing to greater resilience to noise. EfficientNet-B3 continued to perform the best under noisy conditions, showcasing its ability to maintain strong feature learning even in the presence of perturbations. However, ResNet50 displayed the largest relative performance drop, indicating that it remains more sensitive to noise compared to the other models.
4.3.1. Class-Wise Performance Analysis
A class-wise performance analysis as shown in
Table 4 shows that certain disease classes were consistently well-classified by all models, including apple diseases (healthy, rust, scab), corn leaf healthy, and corn leaf rust, which yielded high F1-scores across both noise conditions. The results suggest that these diseases have distinctive features that are well captured by the combined dataset. Furthermore, challenging classes, such as corn grey leaf spot and corn leaf blight, saw performance improvements but continued to pose classification difficulties, even with the enhanced dataset.
EfficientNet-B3 demonstrated consistently high performance for most classes, both with and without noise. EfficientNet-B0 excelled in particular classes, such as tomato leaf powdery mildew, where it achieved perfect F1 scores. DenseNet201 showed robust performance, particularly on several tomato diseases in the absence of noise. ResNet50, while generally underperforming in comparison to the other models, showed marked improvements from earlier experiments, especially for classes like apple leaf healthy and corn leaf healthy.
4.3.2. Performance on Different Plant Types
The performance of the models across different plant types, as presented in
Table 5, highlights notable trends in classification accuracy. Apple diseases consistently exhibited strong results across all models in both noise-free and noisy conditions, suggesting that the combined dataset provided rich and generalisable features for detecting apple-related diseases. Corn diseases, which had been more challenging in previous experiments, showed improvement, particularly with the EfficientNet models, where EfficientNet-B3 delivered the most reliable performance under both conditions.
For potato diseases, there was a marked improvement, with both EfficientNet and DenseNet models achieving high F1 scores and demonstrating strong robustness to noise. These results indicate the models’ effectiveness in handling potato disease detection under varying conditions. Tomato diseases were classified with moderate to high accuracy across the models, with EfficientNet-B0 standing out as the best performer. Performance on tomato diseases remained consistent across noise conditions for all models, except for ResNet50, which showed some sensitivity to noise. The results suggest that the models are capable of maintaining their classification capabilities for tomato diseases, regardless of the presence of noise.
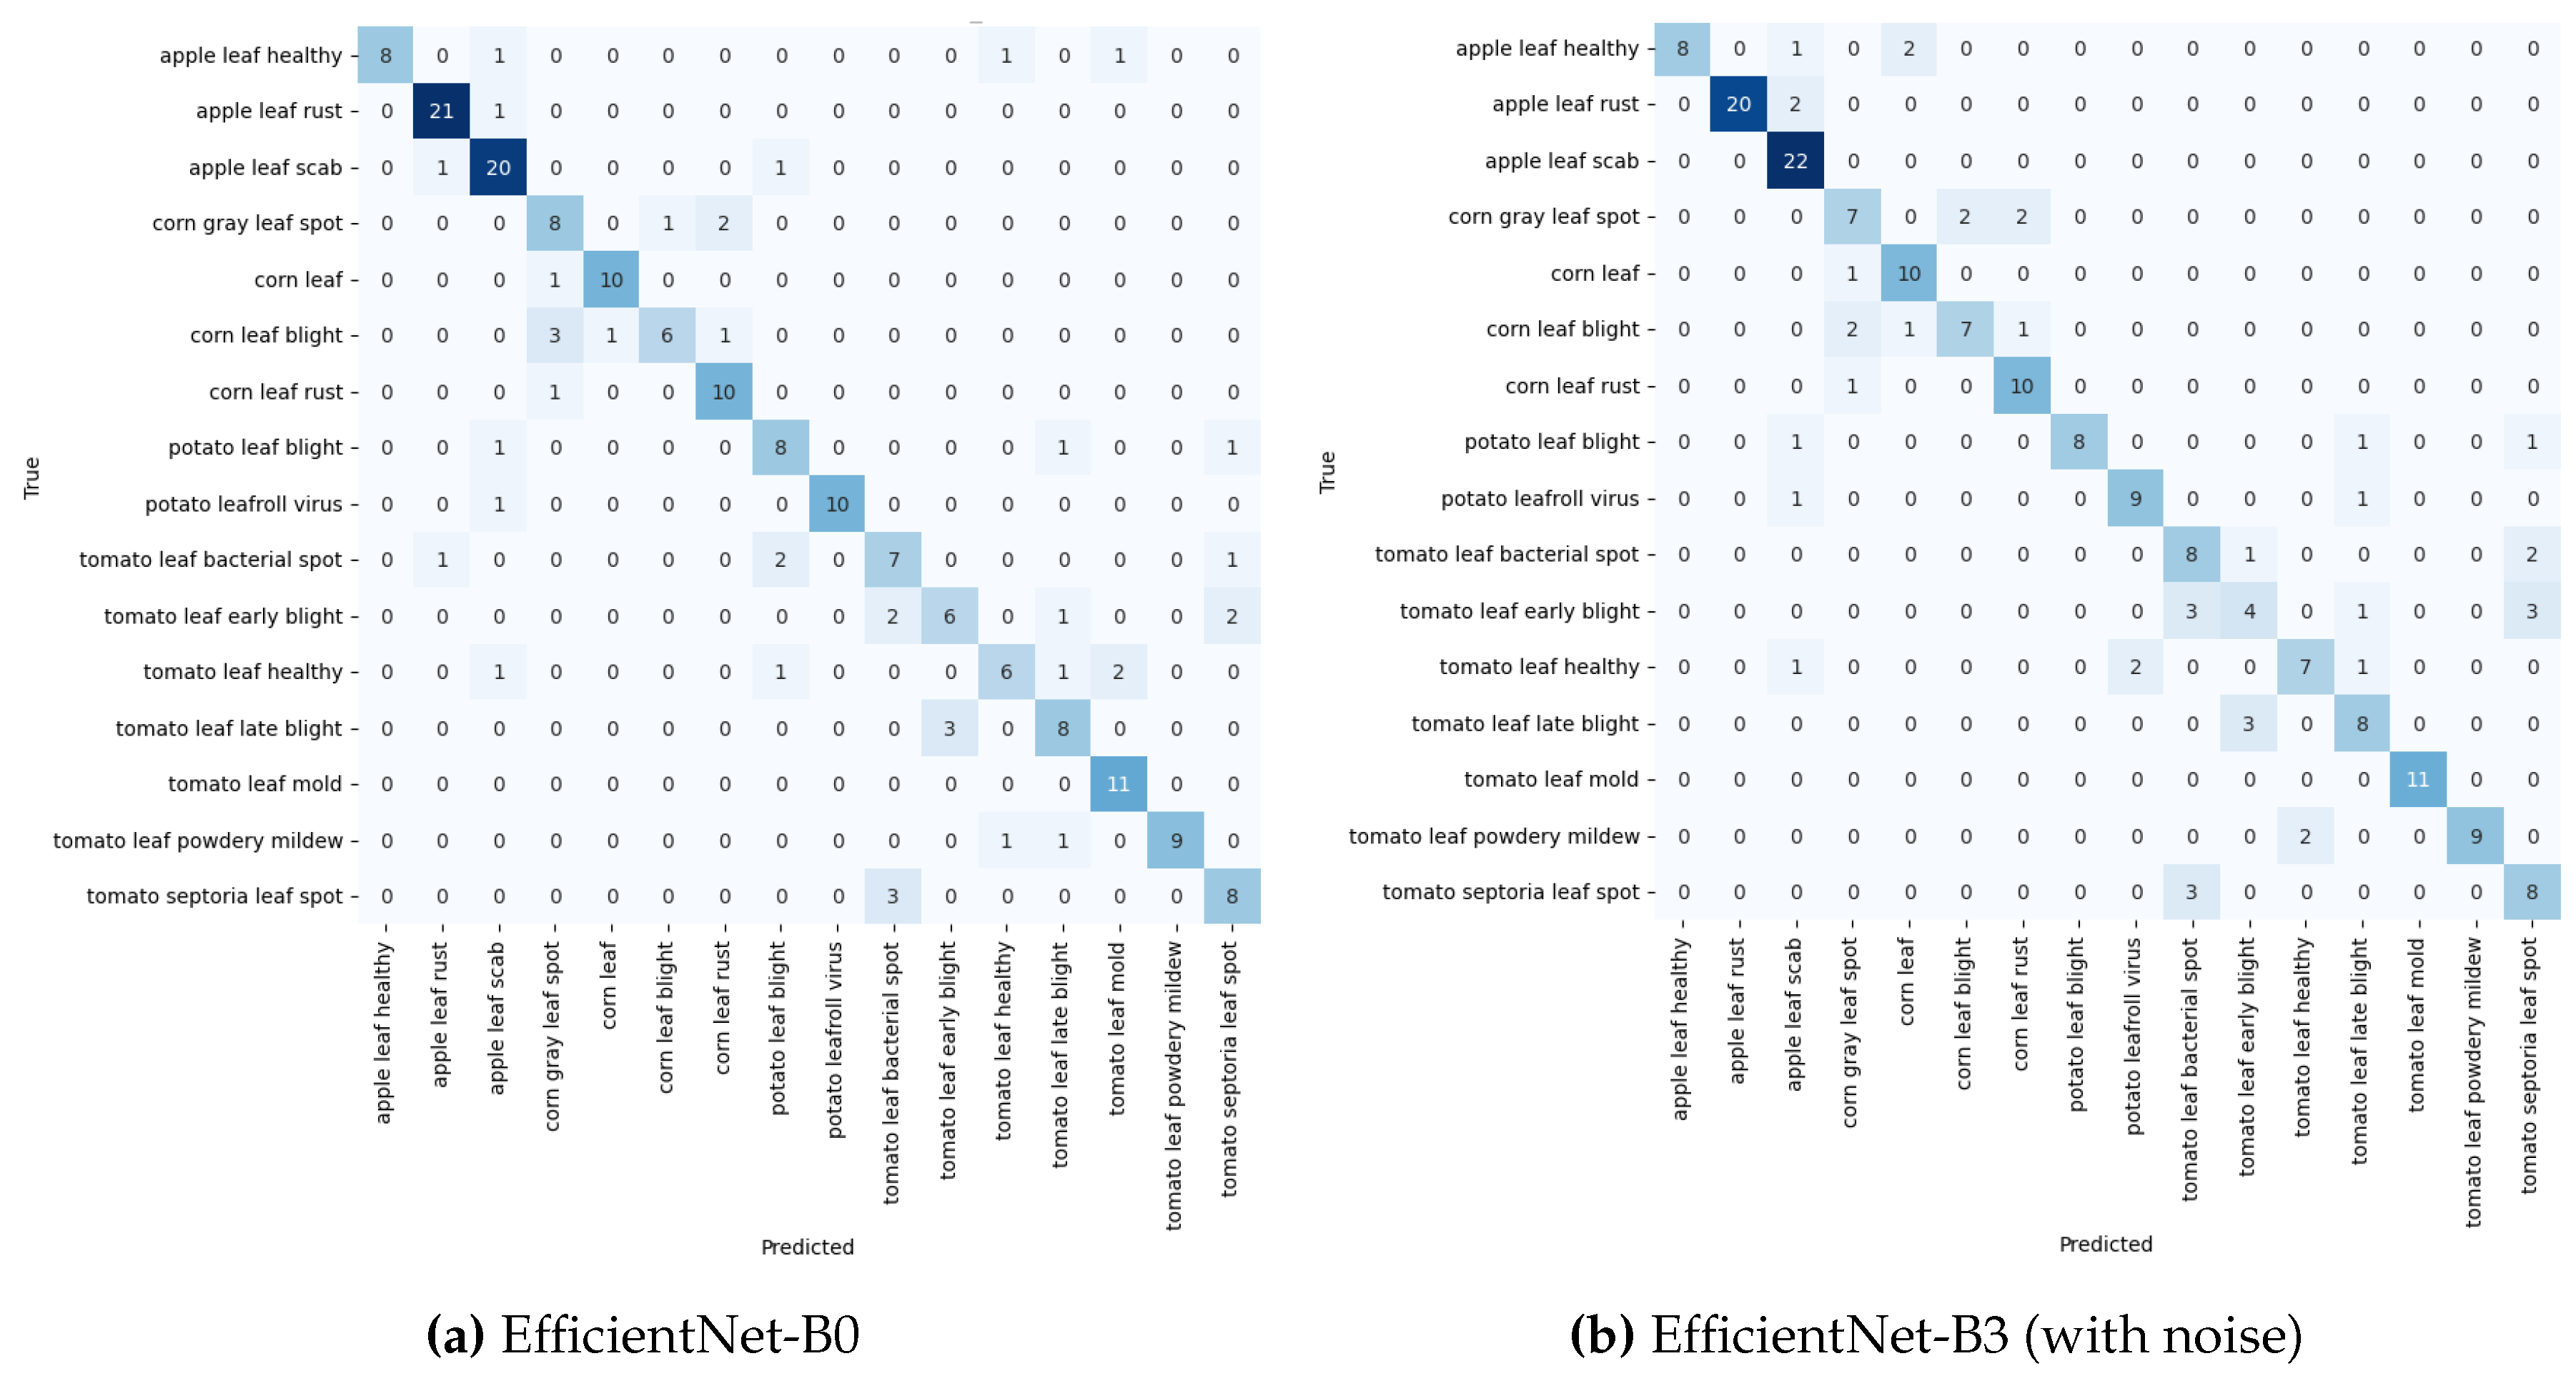
4.4. Experiment 4: Training and Testing with Web-Sourced Dataset
The evaluation of model performance, when both trained and tested on the web-sourced dataset, revealed distinct patterns, as shown in
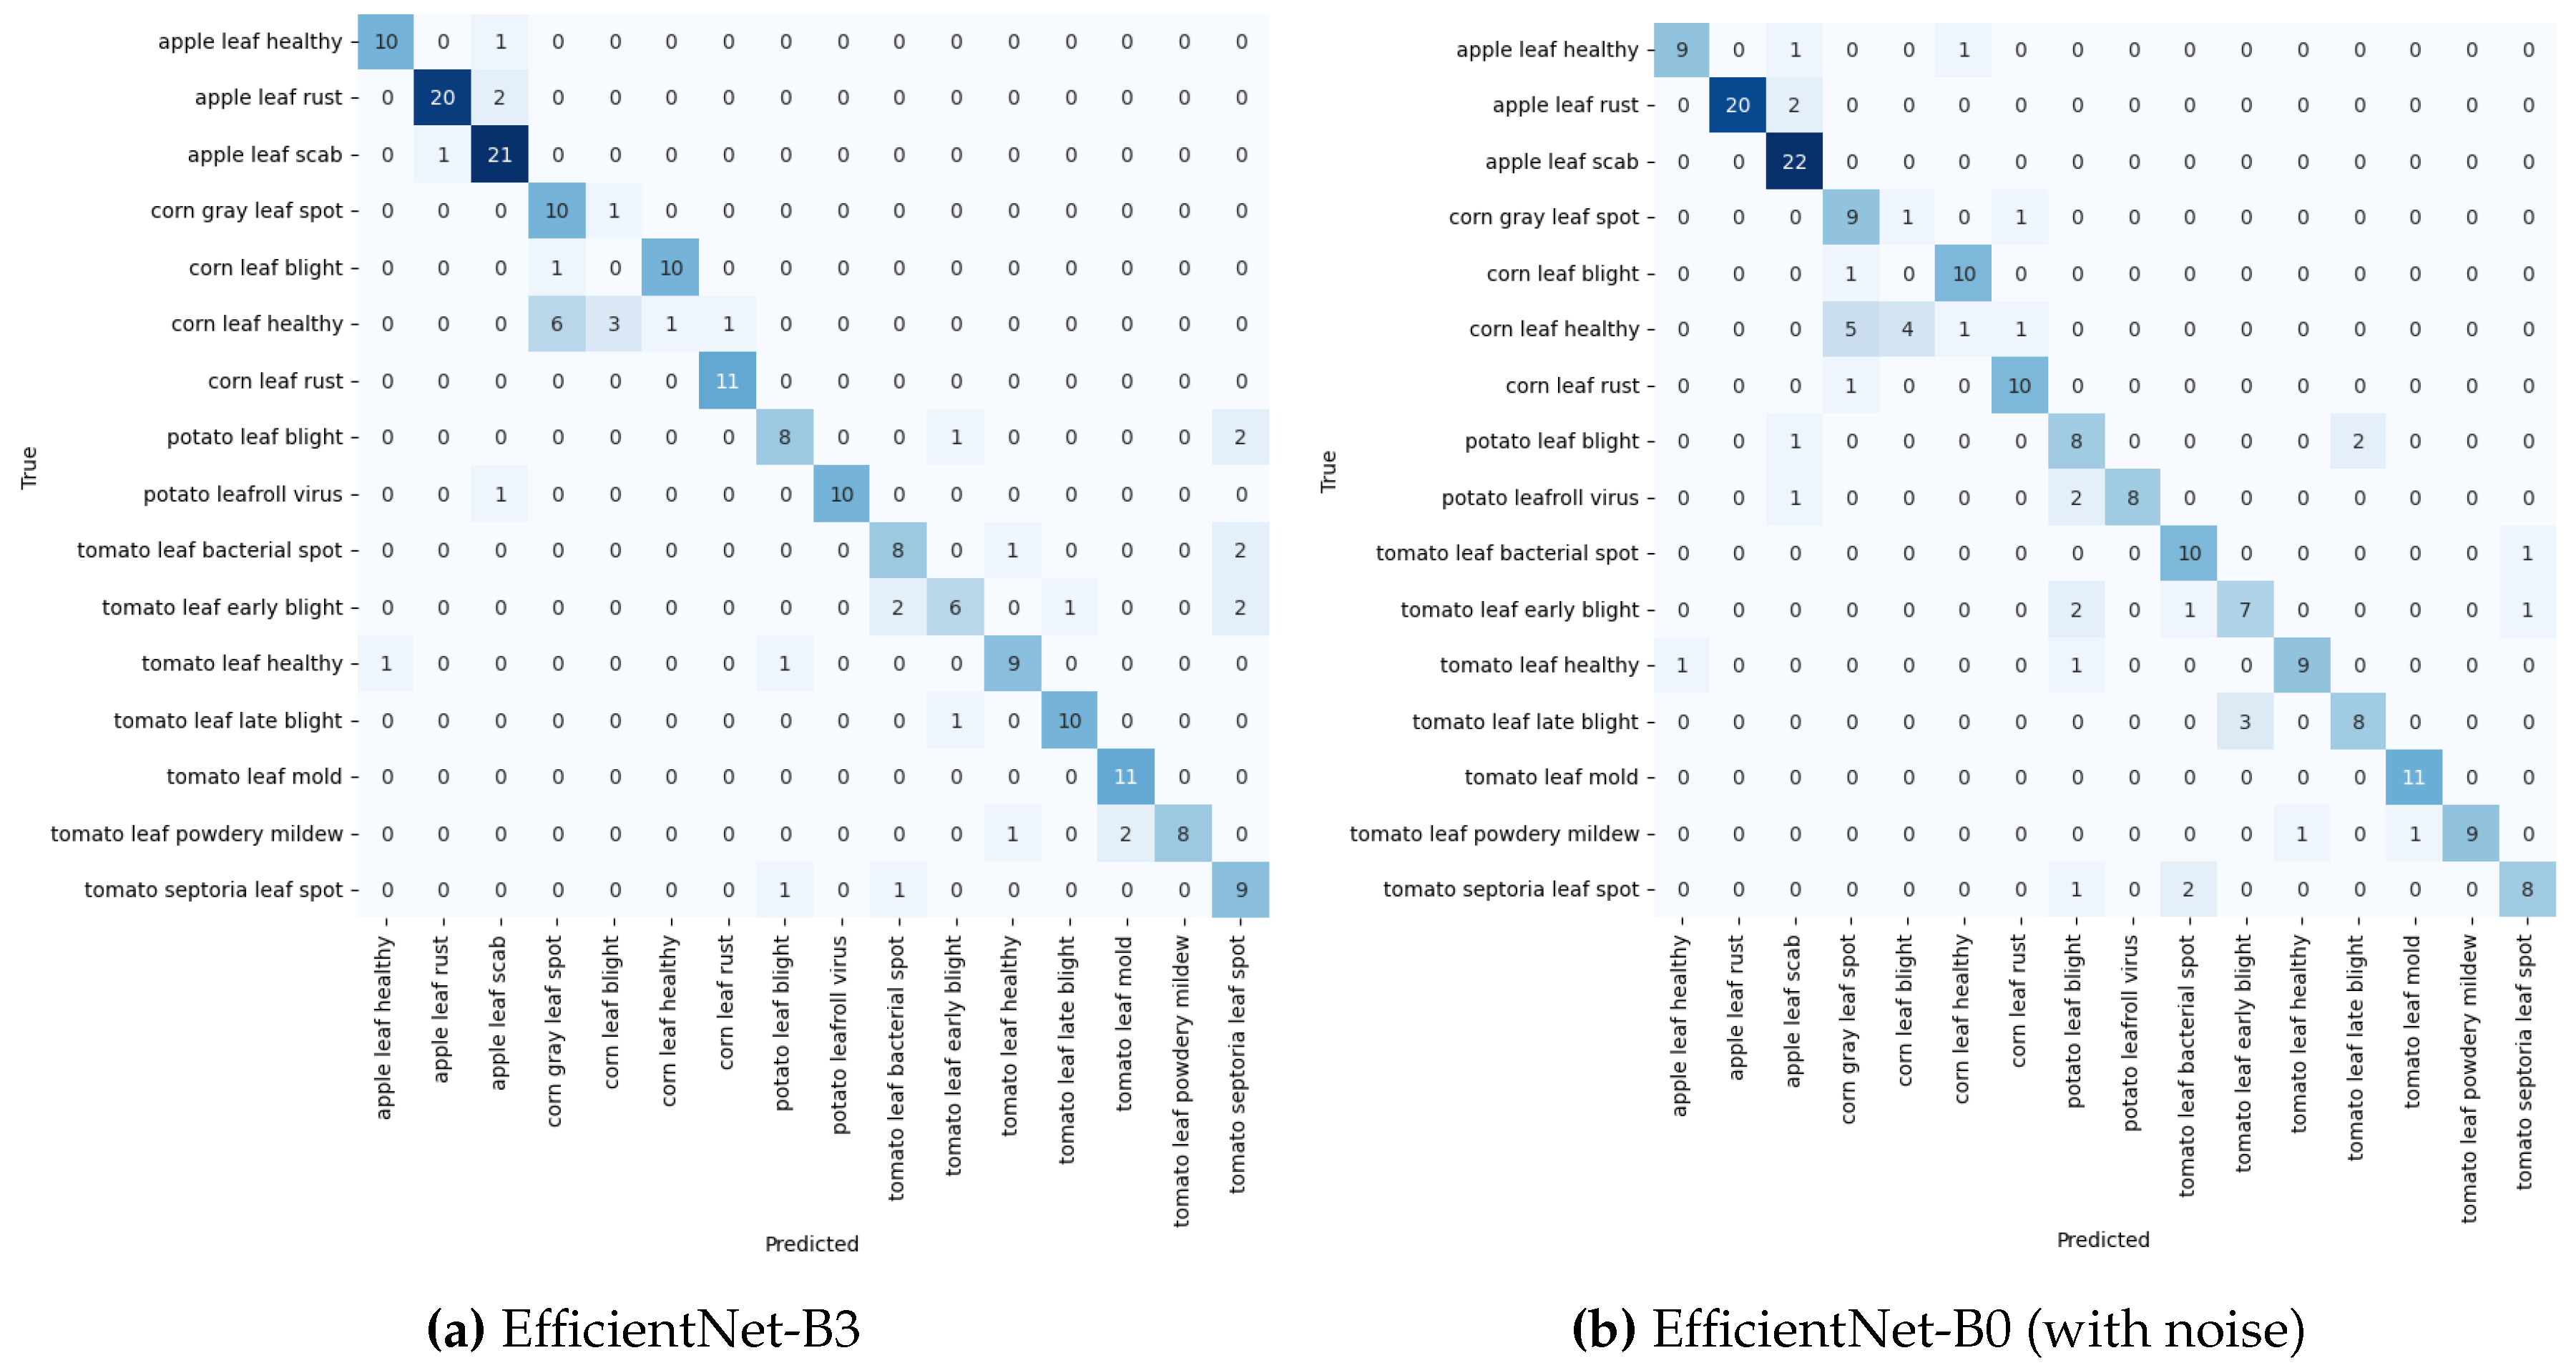
Table 6. EfficientNet-B0 emerged as the top performer under noise-free conditions, though it exhibited some sensitivity to image perturbations. The Confusion Matrices in
Figure 13a,b provide a detailed breakdown, with EfficientNet-B0’s performance compared to EfficientNet-B3 under noisy conditions. EfficientNet-B3 displayed remarkable robustness to noise, indicating its ability to learn noise-invariant features more effectively.
DenseNet201 showed improved results with noise, suggesting that its architecture may benefit from the regularising effect of noise. In contrast, ResNet50, while still trailing the other models, demonstrated better performance in noisy conditions, indicating that it gains from the added dataset diversity and perturbations. This trend suggests that ResNet50’s ability to generalise improves when faced with varied input data, despite its overall lower accuracy.
4.5. Experiment 5: Training with Web-Sourced Data and Testing with PlantDoc Dataset
The models’ generalisation capabilities were evaluated by training them on the web-sourced dataset and testing on the PlantDoc dataset, as presented in
Table 7. DenseNet201 exhibited consistent performance across both noise-free and noisy conditions, indicating its ability to learn robust features from the web-sourced dataset that generalises well to the PlantDoc dataset.
EfficientNet-B3, while performing well, showed reduced superiority compared to previous experiments, along with slight sensitivity to noise in the cross-dataset scenario. EfficientNet-B0, though initially performing lower without noise, showed marginal improvement when noise was introduced, reflecting its adaptability. ResNet50 faced the most significant challenges in this experiment, with the lowest accuracy overall and a further decline in performance when noise was added, suggesting difficulties in learning transferable features from the web-sourced dataset to the PlantDoc dataset.
5. Conclusions
The authors present key findings on developing effective and generalisable deep learning models for plant disease detection, aimed at advancing sustainable agricultural practices. Through a series of carefully designed experiments, the performance of state-of-the-art CNN architectures was evaluated across different datasets and conditions, revealing both challenges and opportunities in this field. The results significantly contribute to the ongoing research in agricultural technology and offer valuable directions for further advancements and real-world applications. A comparison of accuracies from recent studies utilising the PlantDoc dataset, presented in
Table 8, highlights the superior performance of the EfficientNet-B3 model.
The EfficientNet-B3 model was trained on PlantDoc and tested on the same dataset achieving 73.31% accuracy, outperforming the other recent studies using PlantDoc. The cross-dataset and combined dataset experiments show even higher accuracies, demonstrating the potential of this approach for real-world applications. Furthermore, the experiments involving cross-dataset and combined dataset evaluations demonstrated even higher accuracies, indicating the potential of these approaches to enhance real-world plant disease detection and support more resilient agricultural practices.
Key Findings and Their Implications
Model Performance Across Datasets: The experimental results reveal notable variations in model performance across different dataset combinations. When trained and tested on the PlantDoc dataset, EfficientNet-B3 showed the best results with an accuracy of 72.46%, followed closely by EfficientNet-B0 at 69.49%. The architectures are highly effective for plant disease detection in controlled, curated datasets. However, cross-dataset experiments highlighted challenges in generalising to real-world conditions. Models trained on PlantDoc and tested on the web-sourced data demonstrated a slight drop in performance, with EfficientNet-B3 achieving 76.77% accuracy. More strikingly, when models trained on the web-sourced dataset were tested on PlantDoc, performance dropped significantly, with DenseNet201 achieving the highest accuracy at only 59.13%.
The results emphasise the critical role of diverse and representative datasets in training models capable of generalisation. The observed gap in performance between within-dataset and cross-dataset evaluations suggests that current models may be overfitting specific dataset features rather than learning generalised characteristics of plant diseases. This has important implications for deploying these models in real-world agricultural environments, where images may differ significantly from training data conditions.
Impact of Dataset Combination: The results from Experiment 4.3, where models were trained on a combined dataset (PlantDoc and web-sourced images) and tested on the web-sourced data, offer important insights into the benefits of data augmentation. In this scenario, EfficientNet-B3 achieved the highest accuracy at 80.19%, demonstrating that increased dataset diversity enhances the robustness and generalisation of the models. These findings underscore the importance of developing large, diverse datasets that capture a wide range of real-world conditions for plant disease detection. Such datasets would allow models to learn more generalisable features, helping to close the gap between controlled laboratory performance and real-world agricultural applications.
Architecture-Specific Insights: The experiments revealed consistent patterns in the performance of different architectures. EfficientNet models, particularly EfficientNet-B3 and EfficientNet-B0, consistently performed well under various conditions. Their success is attributed to the compound scaling method, which optimises the balance between network depth, width, and resolution, making them highly effective for plant disease detection tasks. DenseNet201 exhibited notable stability, especially in cross-dataset scenarios, with its dense connectivity aiding in learning robust features that generalise well across diverse datasets. DenseNet201 as a strong candidate for real-world applications where image conditions can vary. Although ResNet50 generally performed compared to other architectures, it demonstrated competency in specific disease classifications. Its relatively weaker performance in cross-dataset scenarios suggests its feature learning may be more sensitive to dataset-specific characteristics.
Impact of Noise Augmentation: The introduction of Gaussian noise to the input images provided important insights into the models’ robustness. The effects of noise exhibited considerable variation across different models and experiments. For instance, EfficientNet-B0 in Experiment 4.4 showed improved performance with the addition of noise, increasing from 78.78% to 76.77% precision. Conversely, ResNet50 in Experiment 4.5 experienced a decline in performance, with precision dropping from 52.17% to 49.57%. The varied responses to noise underscore the intricate relationship between data augmentation, model architecture, and the characteristics of the features being learned. The enhanced performance observed in some scenarios suggests that noise augmentation may function as a form of regularisation, enabling models to develop more robust and generalisable features.
Based on our findings, several promising avenues for future research emerge. One significant area of exploration involves domain adaptation techniques, which could help bridge the gap between different datasets and enhance model performance across diverse real-world conditions. Another avenue is the integration of image data with various types of sensor data, such as spectral and environmental information, which could improve the accuracy and robustness of plant disease detection systems. Furthermore, the development of continuous learning systems that can adapt to new data and changing conditions may effectively address the challenges of model generalisation in dynamic agricultural environments.
Figure 1.
Proposed architecture of the plant disease detection system, illustrating the modular design with four key components: data preprocessing, model architecture, training, and evaluation modules. This scalable and flexible framework leverages deep learning techniques, allowing the integration of diverse datasets to enhance model accuracy and generalisation.
Figure 2.
Class distribution of Plantdoc dataset.
Figure 2.
Class distribution of Plantdoc dataset.
Figure 3.
PlantDoc Apple Leaf class.
Figure 3.
PlantDoc Apple Leaf class.
Figure 4.
Class distribution of web-sourced data (train).
Figure 4.
Class distribution of web-sourced data (train).
Figure 5.
Class distribution of web-sourced dataset (test).
Figure 5.
Class distribution of web-sourced dataset (test).
Figure 6.
Class distribution of Combined dataset (train).
Figure 6.
Class distribution of Combined dataset (train).
Figure 7.
Class distribution of Combined dataset (test).
Figure 7.
Class distribution of Combined dataset (test).
Figure 8.
Apple Leaf Rust (Combined dataset).
Figure 8.
Apple Leaf Rust (Combined dataset).
Figure 9.
Pipeline illustrating the image processing techniques, data augmentation, model training, testing, and evaluation steps.
Figure 9.
Pipeline illustrating the image processing techniques, data augmentation, model training, testing, and evaluation steps.
Figure 10.
Confusion Matrix for EfficientNet-B0 (PlantDoc).
Figure 10.
Confusion Matrix for EfficientNet-B0 (PlantDoc).
Figure 11.
Confusion Matrix for PlantDoc → web-Sourced dataset.
Figure 11.
Confusion Matrix for PlantDoc → web-Sourced dataset.
Figure 12.
Confusion Matrix (Trained on Combined, Tested on web-Sourced).
Figure 12.
Confusion Matrix (Trained on Combined, Tested on web-Sourced).
Figure 13.
Confusion Matrix web-Sourced data.
Figure 13.
Confusion Matrix web-Sourced data.
Table 1.
Model Performance on PlantDoc Dataset.
Table 1.
Model Performance on PlantDoc Dataset.
| Model |
Accuracy (Without Noise) |
Accuracy (With Noise) |
| ResNet50 |
0.5508 |
0.6229 |
| EfficientNet-B3 |
0.7163 |
0.7119 |
| DenseNet201 |
0.7034 |
0.6695 |
| EfficientNet-B0 |
0.7203 |
0.6737 |
Table 2.
Model Performance on web-sourced data (Trained on PlantDoc).
Table 2.
Model Performance on web-sourced data (Trained on PlantDoc).
| Model |
Accuracy (Without Noise) |
Accuracy (With Noise) |
| ResNet50 |
0.6515 |
0.6364 |
| EfficientNet-B3 |
0.7677 |
0.7424 |
| DenseNet201 |
0.7323 |
0.7020 |
| EfficientNet-B0 |
0.7374 |
0.7525 |
Table 3.
Model Performance on Combined (PlantDoc and Web sourced) test on Web sourced data.
Table 3.
Model Performance on Combined (PlantDoc and Web sourced) test on Web sourced data.
| Model |
Accuracy (Without Noise) |
Accuracy (With Noise) |
| ResNet50 |
0.6741 |
0.6486 |
| EfficientNet-B3 |
0.8019 |
0.7732 |
| DenseNet201 |
0.7700 |
0.7636 |
| EfficientNet-B0 |
0.7987 |
0.7677 |
Table 4.
Class-wise F1- scores for each model (without noise).
Table 4.
Class-wise F1- scores for each model (without noise).
| Class |
ResNet50 |
EfficientNet-B0 |
EfficientNet-B3 |
DenseNet201 |
| apple leaf healthy |
0.8182 |
0.9091 |
0.9091 |
0.8421 |
| apple leaf rust |
0.9032 |
0.9355 |
0.9524 |
0.9032 |
| apple leaf scab |
0.8438 |
0.9254 |
0.9254 |
0.8657 |
| corn gray leaf spot |
0.5854 |
0.5778 |
0.5854 |
0.5238 |
| corn leaf blight |
0.4848 |
0.4242 |
0.5294 |
0.4706 |
| corn leaf healthy |
0.9000 |
0.8571 |
0.9091 |
0.8696 |
| corn leaf rust |
0.8889 |
0.9268 |
0.9302 |
0.9048 |
| potato leaf blight |
0.7742 |
0.8077 |
0.8333 |
0.8148 |
| potato leafroll virus |
0.4286 |
0.8571 |
0.9524 |
0.9524 |
| tomato leaf bacterial spot |
0.1935 |
0.6316 |
0.6111 |
0.3125 |
| tomato leaf early blight |
0.4571 |
0.7556 |
0.6341 |
0.7179 |
| tomato leaf healthy |
0.6842 |
0.8125 |
0.8889 |
0.8649 |
| tomato leaf late blight |
0.5641 |
0.7179 |
0.7442 |
0.8095 |
| tomato leaf mold |
0.6667 |
0.8571 |
0.8108 |
0.8485 |
| tomato leaf powdery mildew |
0.7059 |
1.0000 |
0.7368 |
0.9524 |
| tomato septoria leaf spot |
0.5373 |
0.7843 |
0.7925 |
0.6897 |
Table 5.
Average F1-score by Plant Type (Without Noise/With Noise).
Table 5.
Average F1-score by Plant Type (Without Noise/With Noise).
| Plant Type |
ResNet50 |
EfficientNet-B3 |
DenseNet201 |
EfficientNet-B0 |
| Apple |
0.8551 / 0.8043 |
0.9290 / 0.9290 |
0.9230 / 0.8703 |
0.9233 / 0.8881 |
| Corn |
0.7148 / 0.5799 |
0.7385 / 0.7436 |
0.6922 / 0.6913 |
0.6965 / 0.7293 |
| Potato |
0.6014 / 0.6863 |
0.8929 / 0.8633 |
0.8836 / 0.8836 |
0.8324 / 0.8324 |
| Tomato |
0.5584 / 0.5829 |
0.7455 / 0.7455 |
0.7422 / 0.7422 |
0.7942 / 0.7942 |
Table 6.
Model Performance on web-sourced dataset (Trained and Tested on the web-sourced dataset).
Table 6.
Model Performance on web-sourced dataset (Trained and Tested on the web-sourced dataset).
| Model |
Accuracy (Without Noise) |
Accuracy (With Noise) |
| ResNet50 |
0.6616 |
0.6515 |
| EfficientNet-B3 |
0.7777 |
0.7878 |
| DenseNet201 |
0.7424 |
0.7828 |
| EfficientNet-B0 |
0.7878 |
0.7727 |
Table 7.
Model Performance on PlantDoc Dataset (Trained on the web-sourced dataset).
Table 7.
Model Performance on PlantDoc Dataset (Trained on the web-sourced dataset).
| Model |
Accuracy (Without Noise) |
Accuracy (With Noise) |
| ResNet50 |
0.5217 |
0.4957 |
| EfficientNet-B3 |
0.5826 |
0.5739 |
| DenseNet201 |
0.5913 |
0.5913 |
| EfficientNet-B0 |
0.5478 |
0.5652 |
Table 8.
Comparision of results from other studies.
Table 8.
Comparision of results from other studies.
| Study |
Method |
Dataset |
Accuracy (%) |
| This Study |
EfficientNet-B3 |
PlantDoc |
73.31 |
| This Study |
EfficientNet-B3 |
PlantDoc (train) + web-sourced (test) |
76.77 |
| This Study |
EfficientNet-B3 |
Combined (train) + web-sourced (test) |
80.19 |
| Chandra et al. (2020) |
SVM with twin network of siamese |
PlantDoc |
62.76 |
| Moupojou et al., (2023) |
MobileNet |
PlantDoc |
60.14 |
| Menon et al. (2021) |
MobileNet-V2 |
PlantDoc |
69.80 |