
Submitted:
12 November 2024
Posted:
12 November 2024
You are already at the latest version
Abstract
The construction industry is responsible for around 27% of carbon emissions. Concrete raw materials consist of cement, Coarse Aggregates, Fine Aggregates, and admixtures. In this study, Oyster shell powder produced by Taiwan Sugar Company replaced fine aggregates in different proportions to test the strength of concrete. The proportion of concrete used is 16.67% of cement, 33.33% of coarse Aggregates, and 50% of 10-20 mm aggregates. The replacement rate of Fine Aggregates of Oyster Shell powder includes 0%, 10%, 20%, 30%, and 40%. The test results show that the increase in Oyster Shell content in concrete reduces its strength. When the replacement rate reaches 40%, the 56-day compressive strength still reaches 30MPa, which meets the building strength requirements. The Oyster Shell powder has lower specific gravity than sand. When the substitution reaches 40%, the unit weight of concrete is reduced by about 10% compared to the 0% substitution rate. This could help solve the problem of oyster shell waste, which is one of the substitutes for fine aggregates in concrete.
Keywords:
Oyster Shell
; Concrete
; Compressive strength
; Specific Gravity
1. Introduction
Concrete is a highly consumed material in construction, composed mainly of fine aggregate, coarse aggregate, and cement. Aggregates are inert materials like sand, gravel, or crushed rock, which combine to form a fluid mass that hardens into concrete. Due to its durability and versatility, the global demand for concrete continues to grow. The United Nations Environment Program reports that the industry uses 1.6 billion tonnes of Portland cement annually, producing 12 billion tonnes of concrete. On average, 4.7 tons of concrete per person are produced globally each year (Strategic-Business-Plan-ISO/TC-071, 2016). Natural resources are heavily consumed in this process, with fine and coarse aggregates accounting for 60% to 85% of the concrete’s volume. Their composition, size, and quality affect the concrete’s durability and strength.
Cement is the most expensive component, while aggregates provide strength and occupy the largest volume. Quarrying and transport of aggregates lead to environmental issues such as noise, dust, and biodiversity loss (Scibilia, 2014). To mitigate resource depletion, researchers are exploring alternative materials like seashells as potential aggregate replacements. Sand mining, another environmental concern, leads to riverbed erosion, water quality degradation, and loss of groundwater. Alternatives to sand, like crushed sands and byproducts such as fly ash, blast furnace slag, and quarry dust, are being explored to minimize environmental impacts (Griffiths et al., 2023).
Industrial byproducts are gaining attention in concrete. Blast furnace slag and coal ash (fly ash and bottom ash) are promising substitutes. Glass powder, construction waste, and quarry dust also show potential. Seashells, rich in calcium carbonate, are being researched for partial replacement of cement in concrete due to their similarity to limestone (Hosseinpanahi et al., 2023). The use of recycled aggregate with a coating of recycled cement paste is another promising technique to enhance concrete’s mechanical behavior and sustainability (Wenzel et al., 2023).
2. Current State of Knowledge Concerning the Utilization of Oyster Shells
The use of oyster shells in the construction industry has been explored for a long time, with multiple studies conducted to assess their potential. Researchers have investigated the effect of oyster shells on concrete, studying their application as both a binding agent substitute and an aggregate substitute. This section reviews findings from various studies to provide an understanding of the current knowledge surrounding the use of oyster shells.
2.1. Fine Aggregate in Concrete
Concrete consists of cementitious material, aggregate, and water. Aggregate typically serves as an inert filler, making up 60 to 80 percent of the volume of concrete. Despite being considered an inert filler, aggregate plays a crucial role in defining the elastic characteristics, dimensional stability, and thermal properties of concrete. Aggregates are classified into two types: Fine aggregates and coarse aggregate. The quality of aggregate is a key factor in concrete performance, as most aggregates used in concrete are much stronger than other ingredients. The compressive strength of the particles significantly influences the properties of lightweight aggregate concrete.
Before mixing, it is essential to understand the aggregate’s physical properties to achieve a desirable concrete mixture. Important properties include shape and texture, size gradation, moisture content, specific gravity, reactivity, soundness, and bulk unit weight. These properties, along with the water-to-cement ratio, determine concrete’s strength, workability, and durability. Fresh concrete, in particular, is highly influenced by the aggregate’s shape and texture. Smooth, rounded aggregates tend to increase workability compared to rough, angular, or elongated aggregates (Halim, 2014).
According to ASTM-C33-18 (2018), the fine aggregates must have no more than 45% passing through any sieve while being retained on the next consecutive sieve, with a fineness modulus between 2.3 and 3.1. For continuous shipments from a given source, the fineness modulus should not vary by more than 0.20 from the base fineness modulus. These size limits are illustrated in Table 1 and Figure 1, which shows the upper and lower limits of grain size for fine aggregate as per ASTM-C33-18.
2.2. Oyster Shell Characteristics and Chemical Composition
Oyster Shells vary in color depending on their geographic origin and nature. The inner surface of an oyster shell is typically white or pearl-colored, while the outer shell exhibits a range of colors. Most oyster shell are dark gray, although some, like cornish native oysters, are blue, and pacific oysters may have traces of purple, brown, or white. Fresh oysters can exhibit red, green, brown, and pale yellow hues, with color changes resulting from environmental factors such as nutrition, temperature, and mineral deposits in seawater. The presence of algae on the shells can give oysters a spotted appearance. The main chemical component of oyster shell is calcium carbonate (CaCO3), with over 90% of the shell composed of CaCO3, making it similar to the calcium carbonate used in portland cement production. Table 2 provides a detailed breakdown of the chemical composition of oyster shells, showing that all studies indicate CaCO3 constitutes more than 95% of the shell. According to the results in Table 2, all studies show that CaCO3 constitutes more than 95% of the oyster shell. Oyster shell ash refers to the powdery residue obtained after burning or calcining oyster shells at high temperatures.
Taiwan generates approximately 168,000 metric tons of oyster shell waste annually (Corporation, 2019). he Taiwan Sugar Corporation, in collaboration with the Industrial Technology Research Institute, has found a more profitable application: extracting calcium carbonate from the shells to use as a non-active ingredient in pharmaceuticals (Sah & Hong, 2024).
2.3. The Use of Waste Shells in Concrete
Falade (1995) explored the use of periwinkle shells in concrete, both partially and entirely, using five different design mixes. It was concluded that periwinkle shells can be used to produce medium-strength lightweight concrete. However, strength and workability decreased as the shell content increased, with a more significant effect in high aggregate/cement ratio mixes. Eo SH (2001) examined partial and full substitution of fine and coarse aggregates with oyster shells, finding that compressive and flexural strength decreased as the oyster shell content rose. Yoon. et al. (2004) evaluated oyster shell ash as a mortar aggregate substitute. Tests showed compressive strength remained stable, while organic compounds’ influence on hardening and long-term strength enhancement via fly ash were also studied. Yang et al. (2005) assessed the interaction between oyster shell and cement paste. No significant interaction was found, though the elastic modulus decreased by 10% with 20% oyster shell substitution. Ikponmwoyster & Ojediran (2010) studied periwinkle shell lightweight concrete’s performance under elevated temperatures. As the water-to-cement ratio and temperature royster shelle, compressive strength decreased, while density also fell. The shells were only suitable for temperatures below 300°C. Yang et al. (2010) found that increasing oyster shell substitution negatively impacted long-term strength, elastic modulus, and freeze-thaw resistance, although creep and chemical attack tests showed no significant changes. Etuk et al. (2012) tested calcined periwinkle, oyster, and snail shells as admixtures in mortar, finding optimal compressive strength at 10% periwinkle, 15% oyster shell, and 20% snail shell ash replacement. Lertwattanaruk et al.(2012) investigated the use of various seashells as partial cement replacements, finding that ground seashells reduced water consumption and improved workability in hot conditions. Ekop et al. (2013) replaced coarse aggregate with Pachymelania aurita shells in varying amounts, showing that compressive and flexural strength decreased as shell content royster shelle. Ettu et al. (2013) replaced granitic chippings with periwinkle shells in concrete, finding a decrease in density and strength, but concluding that periwinkle shells can be used for reinforced concrete, especially in riverine areas. Soneye et al. (2016) studied fine and coarse aggregate replacements with periwinkle shells, concluding that 30% substitution produced satisfactory results without significantly reducing compressive strength. Binag (2018) examined mussel and oyster shell ash as partial Portland cement replacements, finding that compressive strength decreased with increased shell content, but mussel ash performed better than oyster shell ash.
2.4. Impact of Shell Substitution on Concrete Workability
Concrete workability refers to how easily freshly mixed concrete can be mixed, poured, solidified, and finished with minimal loss of homogeneity. Workability affects the strength, quality, appearance, and even labor costs during installation and finishing processes (Tattersall, 1991). Eo SH (2001) studied the partial and full use of oyster shells as an aggregate in concrete. The study tested water-cement ratios of 0.45 and 0.55 and used an air-entraining superplasticizer to enhance workability. The results showed that coarse aggregate replacement reduced the workability of wet concrete as Oyster Shell content increased. For 50% and 100% aggregate replacement, there was no change in slump height, recording a slump reading of 0mm. For fine aggregate, the workability increased at 30% replacement. Eo & Yi (2015) further investigated the substitution of coarse and fine aggregates with Oyster Shell. The study tested water-cement ratios of 0.40, 0.45, 0.50, 0.55, and 0.60 for coarse aggregate replacement, and 30% and 50% Oyster Shell replacement for fine aggregate. The slump value for coarse aggregate rapidly decreased as Oyster Shell content increased. When Oyster Shell replacement exceeded 50%, the slump values approached zero. However, for fine aggregate, the slump value increased as Oyster Shell content increased at the same water-cement ratio. The increase in slump value was attributed to poor natural fine aggregate availability, which resulted in a lack of coherence between the cement paste and aggregates, causing segregation and poor workability. At 50% Oyster Shell replacement, the slump remained constant, indicating poor grain structure and friction between Oyster Shell particles, which reduced cohesion with the cement paste, leading to liquidity issues. Falade(1995) used periwinkle shells, a freshwater snail, as an alternative aggregate in concrete. The study showed that as the percentage of periwinkle shells in the mix increased, the concrete’s compressive and tensile strengths, as well as its workability, decreased. Yang et al., (2005) studied concrete properties with partial substitution of fine aggregate with OS. The study tested 5%, 10%, and 20% Oyster Shell replacement using two types of Oyster Shell powder with different fineness moduli. Crushed Oyster Shell reduced the workability of concrete due to its dried, thin plate structure. The use of water-reducing admixtures helped to improve workability, but for 20% replacement, the improvement was minimal. The slump results from the study are shown in Figure 2.
Lertwattanaruk et al. (2012) investigated the effects of using various seashells as a cement replacement in mortar for masonry and plastering. They found that increasing the percentage of ground seashells in Portland cement reduced the water requirement and improved setting times, thereby enhancing workability. The replacement of cement with ground seashells also reduced the amount of cementitious material and increased the free water content in the mix. The study noted that Oyster Shell powder had a higher water requirement compared to other seashells, which was attributed to the larger surface area of the Oyster Shell particles, necessitating more water to coat the surface. Ekop et al.(2013) examined the effects of partially and completely substituting coarse aggregate with Pachymelania aurita shells. The results from five sets of specimens (0%, 25%, 50%, 75%, and 100% coarse aggregate replacement) showed that increasing the content of Pachymelania aurita shells decreased the workability of the concrete. The study recommended using a plasticizer to counteract the reduction in workability.
2.5. Impact of Oyster Shells on Concrete Strength
Eo SH (2001) observed that both compressive and flexural strengths decreased as the percentage of OS replacement increased. Compressive strength dropped by as much as 60% as the OS. content increased. Flexural strength also declined, although at a slower rate compared to compressive strength. Yang et al. (2005) studied the partial replacement of fine aggregate with OS. and found no significant change in compressive strength as Oyster Shell substitution increased. The authors concluded that the 28-day compressive strength was either equivalent to or greater than that of the control concrete. However, the elastic modulus decreased as the Oyster Shell substitution ratio increased, due to the lower elastic modulus of Oyster Shell compared to fine aggregate. The reduction in elastic modulus was approximately 10% for a 20% substitution of fine aggregate with Oyster Shell. Figure 3 shows the Compressive Strength vs. Percentage Replacement of fine aggregate with Oyster Shell. Yang et al. (2010) found that higher levels of Oyster Shell substitution negatively affected the long-term strength of concrete. For 10% Oyster Shell replacement, the long-term strength was nearly identical to that of regular concrete, but at 20% substitution, the rate of strength development slowed, and the overall strength was lower than that of normal concrete. Figure 4 shows the Compressive Strength vs. Curing Age for fine aggregate replacement.
Eo & Yi (2015) investigated the effects of substituting fine and coarse aggregates with Oyster Shell in concrete. The study observed a decrease in compressive strength as the percentage of Oyster Shell substitution increased. However, despite this reduction, the results indicated that the concrete still met the necessary standards and could be used for lightweight concrete production. The findings from the study are presented in Figure 5.
3. Research Methodology
This section outlines the test procedures and methodologies used to evaluate the fresh and cured properties of concrete containing varying percentages of Oyster Shell powder as a partial replacement for fine aggregate. Detailed testing procedures for the raw materials used in concrete production, along with the corresponding specifications, are presented. Additionally, the methods employed for mixing, casting, and curing the concrete are discussed comprehensively, including the various tests performed on the cured concrete to determine its mechanical and durability properties. The experimental procedure is illustrated in Figure 6.
3.1. Mix Design and Sample Preparation
To mix and prepare the concrete, a tilting drum mixer was used. This mechanical device rotates to blend the raw materials into a homogeneous mixture. All ingredients were measured with an accuracy of 1 gram. First, the coarse and fine aggregates were placed in the mixer and thoroughly combined. Then, the cement was added until a uniform mixture was achieved. The required amount of water was carefully measured and added, along with a precise dose of water retarder to improve the concrete’s workability. The concrete was mixed in the drum until a fully homogeneous mixture was formed. The tilting drum mixer is shown in Figure 7.
The mix proportions used in this study are presented in Table 4. A total of five concrete mixes were prepared, with oyster shell substitutions varying from 0% to 40%, while maintaining a constant water-to-cement ratio of 0.5. The design mix ratio for this study was 1:2:3, meaning 1 part cement, 2 parts fine aggregate, and 3 parts coarse aggregate. The water-to-cement ratio of 0.5 indicates that for every 1 part of cement, 0.5 parts water were added. Weigh batching was conducted to ensure the mix was proportionate and uniform. The materials were mixed in accordance with ASTM-C192/C192M-19 (2019). For each design mix, 12 cylinders with a diameter of 120 mm and height of 240 mm were cast to determine the compressive strength of the concrete. Reusable cast iron molds, compliant with ASTM-C470/C470M-15 (2015), were used. Once a homogeneous mixture was achieved, the concrete was poured into the molds in three layers and compacted using a tamping rod.
The mix design used in this study is compared with previous studies on replacing oyster shells with fine aggregate (Figure 8). While the percentage of materials used in previous studies is similar to those in this study, the key factor affecting the differences in results is the water-to-cement ratio. The water-to-cement ratio in Yang et al. (2005) and Yang et al. (2010) was 0.45, while in Eo & Yi (2015) it was 0.55.
3.2. Material Experiment
To understand the physical characteristics of the raw material used and the characteristics of the concrete a series of tests were conducted.
- (1)
- Specific Gravity
Specific gravity is the ratio of the density of a substance to the density of a standard material. It is also known as relative density, as it compares the density of a material to that of a reference material. The most common reference material for this comparison is water. In this study, water was used as the standard material for density comparison. The procedure followed the guidelines of ASTM-C127-15 (2015) and ASTM-C128-15 (2015). Density (ρ) is the mass per unit volume of the material under consideration, with the dimensional formula expressed as ML⁻³, where M represents mass, L represents length, and L³ represents volume. The equation for Specitice gravity (SG) can be written as:
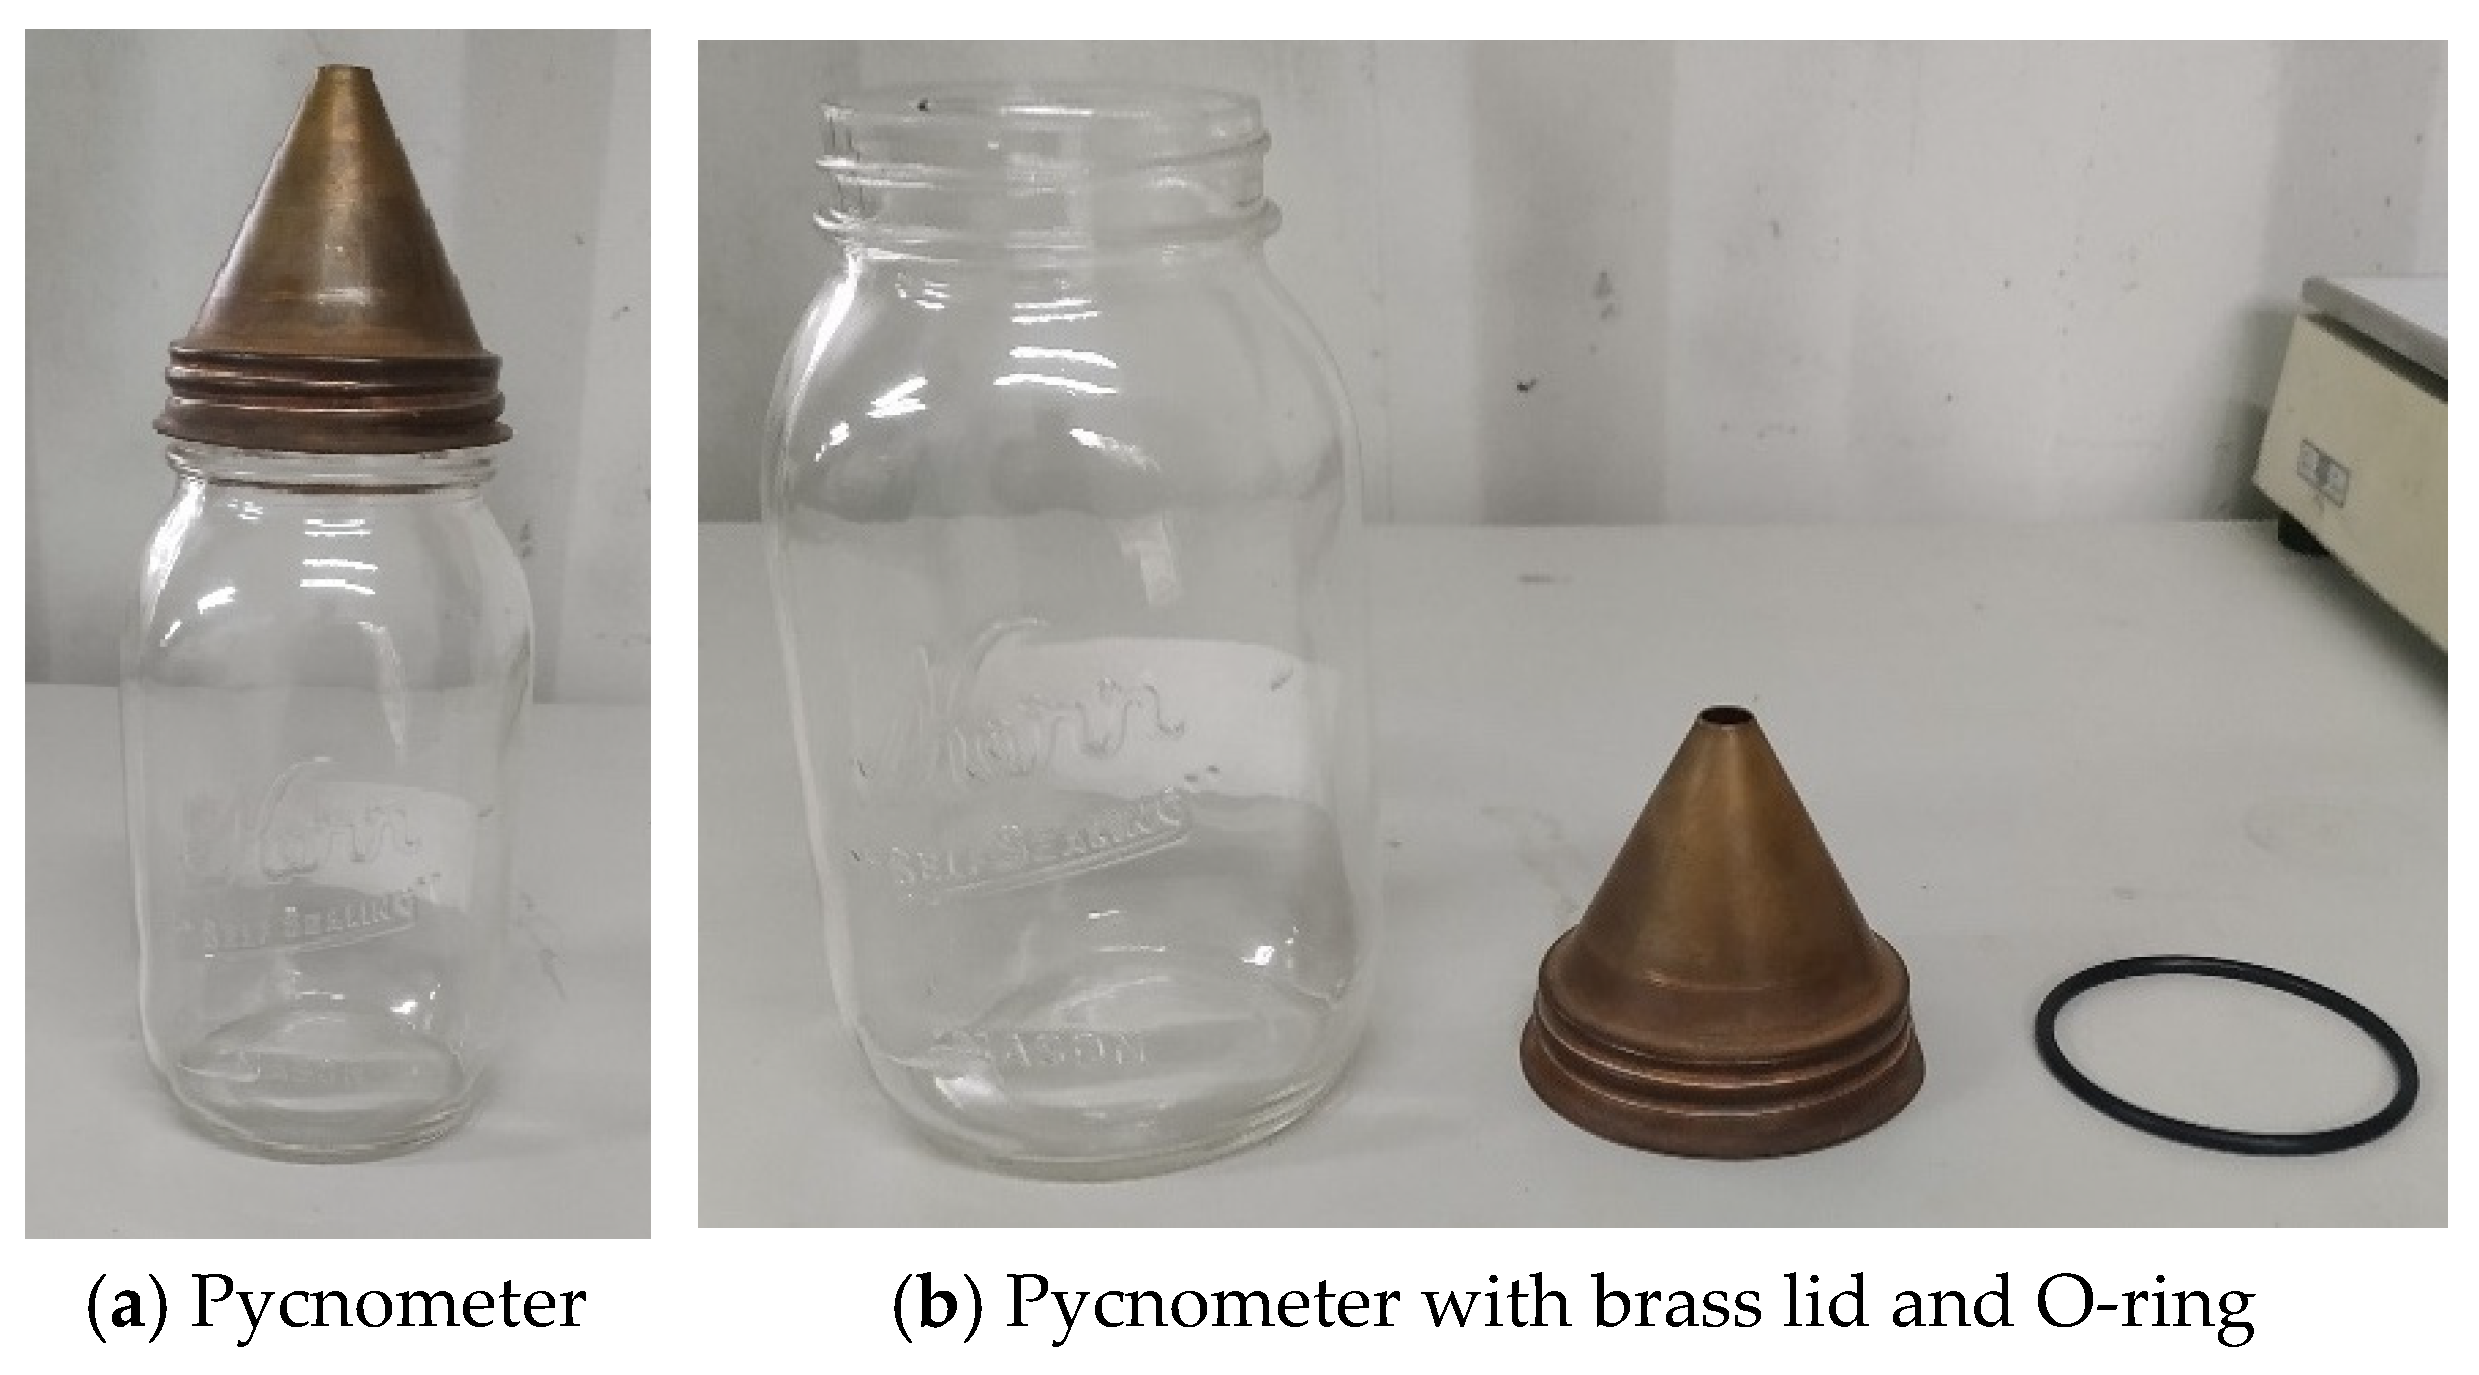
This study used a pycnometer (Figure 9) to measure the sample’s specific gravity. The procedure is as follows:
- 1)
- Before measurements, the sample was dried in an oven at a temperature of 105°C - 110°C for 24 hours.
- 2)
- The weight of the empty pycnometer was measured and recorded as A1.
- 3)
- The oven-dried sample was placed in the pycnometer, and the weight reading was noted as A2.
- 4)
- The pycnometer was then closed with a conical brass top, and distilled water was added through the hole until the pycnometer was filled. This weight was recorded as A3.
- 5)
- The weight of the pycnometer containing only water was measured and noted as A4.
The weight of the sample can be calculated as:
Weight of sample=A2−A1
The weight of an equal volume of water can be calculated as:
Weight of equal volume of water=(A4−A1)−(A3−A2)
Figure 10.
Pycnometer structure.
Therefore, Equation (1) can be rewrited as
- (2)
- Absorption of Aggregate
Aggregates consist of solid materials with a small number of voids. The absorption of an aggregate indicates its porosity and the amount of free void space available. Aggregates with higher absorption rates are more porous, making them less durable and weaker. In contrast, aggregates with lower porosity are considered superior, as they have higher strength-bearing capacity. The ASTM standards (ASTM-C127-15, 2015; ASTM-C128-15, 2015) were followed to test the oyster shell, sand, and coarse aggregate samples.
Absorption is expressed as the percentage of water absorbed by the sample’s pores relative to its dried weight, calculated using the following formula:
where:
W1 = Saturated Surface Dry (SSD) mass
W2 = Oven-dry mass.
For coarse aggregates, samples were soaked in water for 24 hours, then surface dried using a cloth towel to remove excess moisture while leaving inner voids saturated. The SSD mass was recorded as W1. Next, the samples were oven-dried at 105°C - 110°C for 24 hours, and the dry mass was recorded as W2.
For fine aggregates, the sample was soaked in water for 24 hours, placed on a flat surface, and blow-dried. To verify if the sample achieved surface dry conditions, an inverted cone was used. The sample was poured into the cone and tamped 25 times to ensure compaction and fill the cone to the top. The cone was then carefully lifted. If the sample achieved surface dry conditions, it would slump slightly. If it was too dry, the sample would slump within the cone. In cases where the fine aggregate slumped, water was added, and the cone test repeated. If no slump occurred, the sample had not yet reached surface dry conditions and required further drying. Once the surface dry condition was achieved, the sample was weighed (noted as W1). Finally, the sample was oven-dried at 105°C - 110°C for 24 hours to reach complete dryness, then weighed and recorded as W2.
- (3)
- Sieve Analysis
The particle size distribution and fineness modulus of fine aggregate were determined according to ASTM-C136/C136M-19 (2019). A 500g sample of fine aggregate was used for sieve analysis, and the results were compared with the concrete aggregate specifications outlined in ASTM-C33-18 (2018). Multiple sieve analyses were performed on fine aggregate and oyster shells from different batches, with the results averaged. From each batch, a 500g sample was obtained, and sieves were stacked in sequence: collector pan, 150 μm (No. 100), 300 μm (No. 50), 600 μm (No. 30), 1.18 mm (No. 16), 2.36 mm (No. 8), and 4.75 mm (No. 4), with the collector pan at the bottom and the No. 4 sieve at the top, as shown in Figure 11.
The sample was placed at the top of the sieve stack, covered with a lid, and thoroughly sieved using a mechanical sieve shaker. After sieving, the sample retained on each sieve was carefully weighed and recorded. To understand the particle size distribution, a logarithmic graph of percentage passing versus sieve size was plotted. For calculating the fineness modulus, the cumulative percentage retained on the sieves (150 μm, 300 μm, 600 μm, 1.18 mm, 2.36 mm, and 4.75 mm) was summed and divided by 100. The test results were compared with concrete aggregate specifications (ASTM-C33-18, 2018) to ensure compliance.
The uniformity coefficient (Cu) is the ratio of the particle size at 60% finer to the size at 10% finer and is used to measure grain size uniformity. A Cu range of 4 to 6 indicates well-graded material, while a Cu less than 4 suggests poorly graded or uniformly graded material.
The coefficient of curvature (Cc) is calculated by squaring the particle size at 30% finer and dividing by the product of the particle sizes at 10% and 60% finer. For a sample to be classified as well-graded, Cu should fall between 4 and 6, and Cc should be within the range of 1 to 3, while meeting the criteria for Cu. The formulas for Cu and Cc are as follows:
Where:-
D60=Particle Size at 60% fineness
D30= Particle Size at 30% fineness
D10= Particle Size at 10% fineness
- (4)
- Workability
The workability of concrete refers to how easily it can be mixed, transported, compacted, and finished. While there are several tests to assess concrete flow, the slump test is the most widely used method for measuring workability. The equipment for this test includes a cone, a 500mm × 500mm base plate, a 16mm diameter tamping rod, and a measuring tape. The cone itself has a top diameter of 100mm, a bottom diameter of 200mm, and a total height of 300mm.
To conduct the test, the base plate is placed on a level surface, and the slump cone is positioned in its center. The cone is filled with concrete in three layers, with each layer being tamped 25 times to ensure full compaction. Once the cone is filled with fresh concrete, the top surface is leveled, and the cone is gently lifted to allow the concrete to slump.
The method of measuring slump varies depending on the type of concrete. For normal cement concrete, the procedure follows ASTM-C143/C143M-20 (2020). In this case, the slump height is measured, and workability is indicated by the reduction in height after the cone is removed. For self-compacting concrete, ASTM-C1611/C1611M-21 (2021) is used. Since self-compacting concrete has high fluidity and low shear strength, it spreads out upon removal of the cone. The workability of self-compacting concrete is assessed by measuring the diameter of the slump flow.
The slump flow measurement is obtained by averaging two perpendicular diameters across the spread concrete. The first measurement, d1, is the largest diameter, while the second measurement, d2, is taken perpendicular to d1. The average of d1 and d2 represents the slump flow, indicating the workability of the concrete mix.
Slump Flow= (d1+d2)/2
- (5)
- Density of Concrete
The deadweight of a structure is determined by the density of the concrete, making density an essential property of concrete. Immediately after demolding, each sample was weighed to an accuracy of 0.5g.
The density was calculated as the ratio of the sample’s mass to its volume, using the following formula:
Density of concrete = Mass of sample / Volume of cylinder
The mass of the sample was measured in kilograms, and the volume in cubic meters. The density is denoted in kg/m3.
- (6)
- Compressive Strength
To determine the hardness of concrete, a compressive strength test is conducted using a compression testing machine. This test is performed on cylindrical concrete specimens with a diameter of 120 mm and a height of 240 mm, following the standards outlined in ASTM-C39 (2021). The compressive strength of each sample is measured at 3, 7, 28, and 56 days of curing.
During the test, the specimen is centrally positioned between the bearing plates, and a continuous load is applied without any dynamic loading. The load is increased at a constant rate until the specimen fails. The load at the point of failure is recorded as the compressive strength of the test sample.
4. Results and Discussion
4.1. Material Properties
The materials used in this study were Ordinary Portland Cement (OPC), fine aggregate, coarse aggregate, and oyster shell. OPC served as the primary binding agent for the concrete. The oyster shell aggregate was sourced from Taiwan Sugar Corp. Waste oyster shells were collected, thoroughly cleaned of organic matter, and crushed to create fine aggregates with an average particle size of 2.55 mm.
All materials for the mix were weighed using a batching scale to measure the precise weights of each component. The test results and properties of all materials are listed below.
- (1)
- Cement
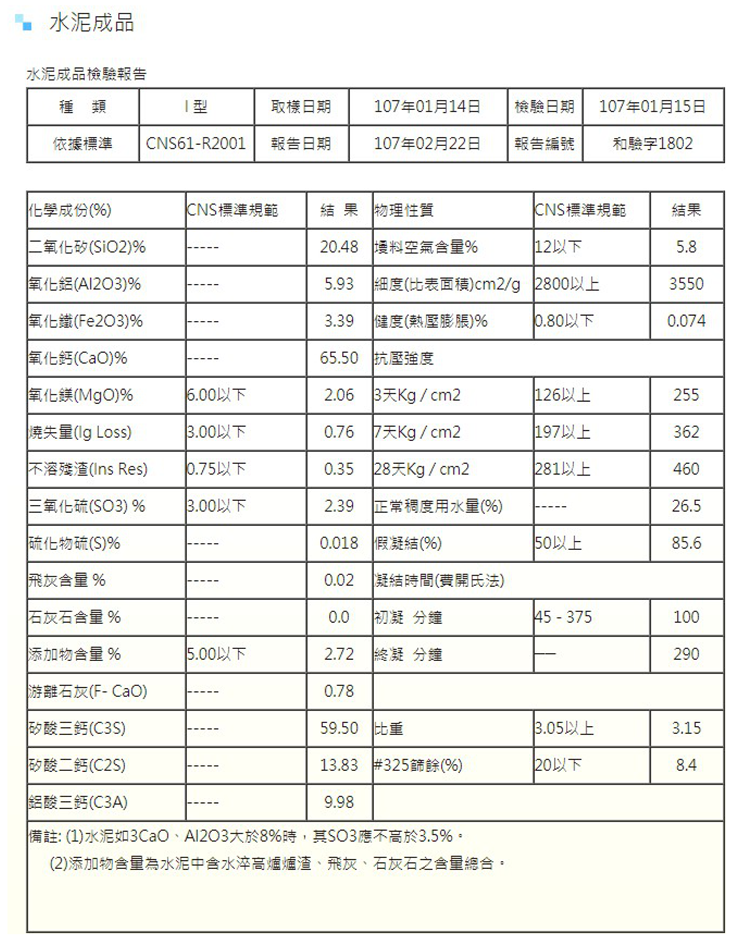
Ordinary Portland cement confirming to (CNS-61-R2001, 2011) was used for the study. The cement used was manufactured by HT Chunghwa Cement. The test results of the cement have been attached in the appendix for reference. The specific gravity of the OPC was 3.15 and the initial and final setting time was 100 minutes and 290 minutes. The 28-day compressive strength attained by the cement was 45.11 N/mm2 .shown in Table 5. The chemical compositions of the cement as per the lab reports are as follows:
Percentage of CaO =65.50%
Percentage of SiO2 =20.48%
Percentage of MgO =2.06%
Percentage of Al2O3 =5.93%
Percentage of SO3 =2.39%
Percentage of Fe2O3 =3.39%
Percentage of Ignition Loss =0.76%
- (2)
- Oyster Shell
Table 6 presents the specific gravity (S.G.) of oyster shell used in various studies. The oyster shell powder, utilized as a substitute for fine aggregate, has a specific gravity of 2.17 and an absorption rate of 8.71%, as shown in Table 7. Table 8 details the grain size distribution of the oyster shell, confirming its compliance with ASTM C33-18 (2018). Notably, the specific gravity of the oyster shell in this study is lower than previously reported values, which may be advantageous for achieving a reduced dead weight in the concrete.
Particle diameter of Oyster shell powder at 10% finer (D10) =0.195mm
Particle diameter Oyster shell powder at 30% finer (D30) =0.39mm
Particle diameter Oyster shell powder at 60% finer (D60) =0.74mm
Fineness Modulus = (0.00% +0.23% + 20.28% + 50.06% + 80.18% + 93.72%)/100 =2.445
Particle diameter Oyster shell powder at 30% finer (D30) =0.39mm
Particle diameter Oyster shell powder at 60% finer (D60) =0.74mm
Fineness Modulus = (0.00% +0.23% + 20.28% + 50.06% + 80.18% + 93.72%)/100 =2.445
Figure 12 illustrates the grain size analysis of the oyster shell. According to ASTM C33-18 (2018), the fineness modulus of fine aggregate should range between 2.3 and 3.1. The fineness modulus of the oyster shell sample falls within this permissible range.
- (3)
- Aggregate
River sand, with a specific gravity of 2.654 and an absorption rate of 2.18%, was utilized as the fine aggregate, as shown in Table 9. The coarse aggregates used in this study were of sizes 10 mm and 20 mm. The specific gravity and absorption for the 10 mm aggregate were estimated to be 2.695 and 1.08%, respectively (Table 10). For the 20 mm aggregate, the specific gravity and absorption were estimated at 2.683 and 0.90%, respectively (Table 11).
Table 12 and Figure 13 shows the grain size distribution of the Fine Aggregate. employed, as well as its conformance to (ASTM-C33-18, 2018).
Particle diameter of OS. powder at 10% finer (D10) =0.222mm
Particle diameter OS. powder at 30% finer (D30) =0.411mm
Particle diameter OS. powder at 60% finer (D60) =0.725mm
Fineness Modulus = (0.23% + 5.82% + 20.32% + 50.66% + 82.67% + 95.91%)/100 =2.556
The fineness modulus of the fine aggregate (ASTM-C33-18, 2018) is between 2.3 and 3.1.
(4) Admixture
A water-reducing, high-range admixture was used to enhance the concrete’s workability. This product meets the ASTM-C494/C494M-19 (2019) standard. Using an admixture at 1.2% to 2.4% of the cementitious material content resulted in a 15% to 30% reduction in water requirement while maintaining the same workability. For this study, 2% of the admixture, based on the weight of the cement, was incorporated to improve the concrete’s workability.
4.2. Workability
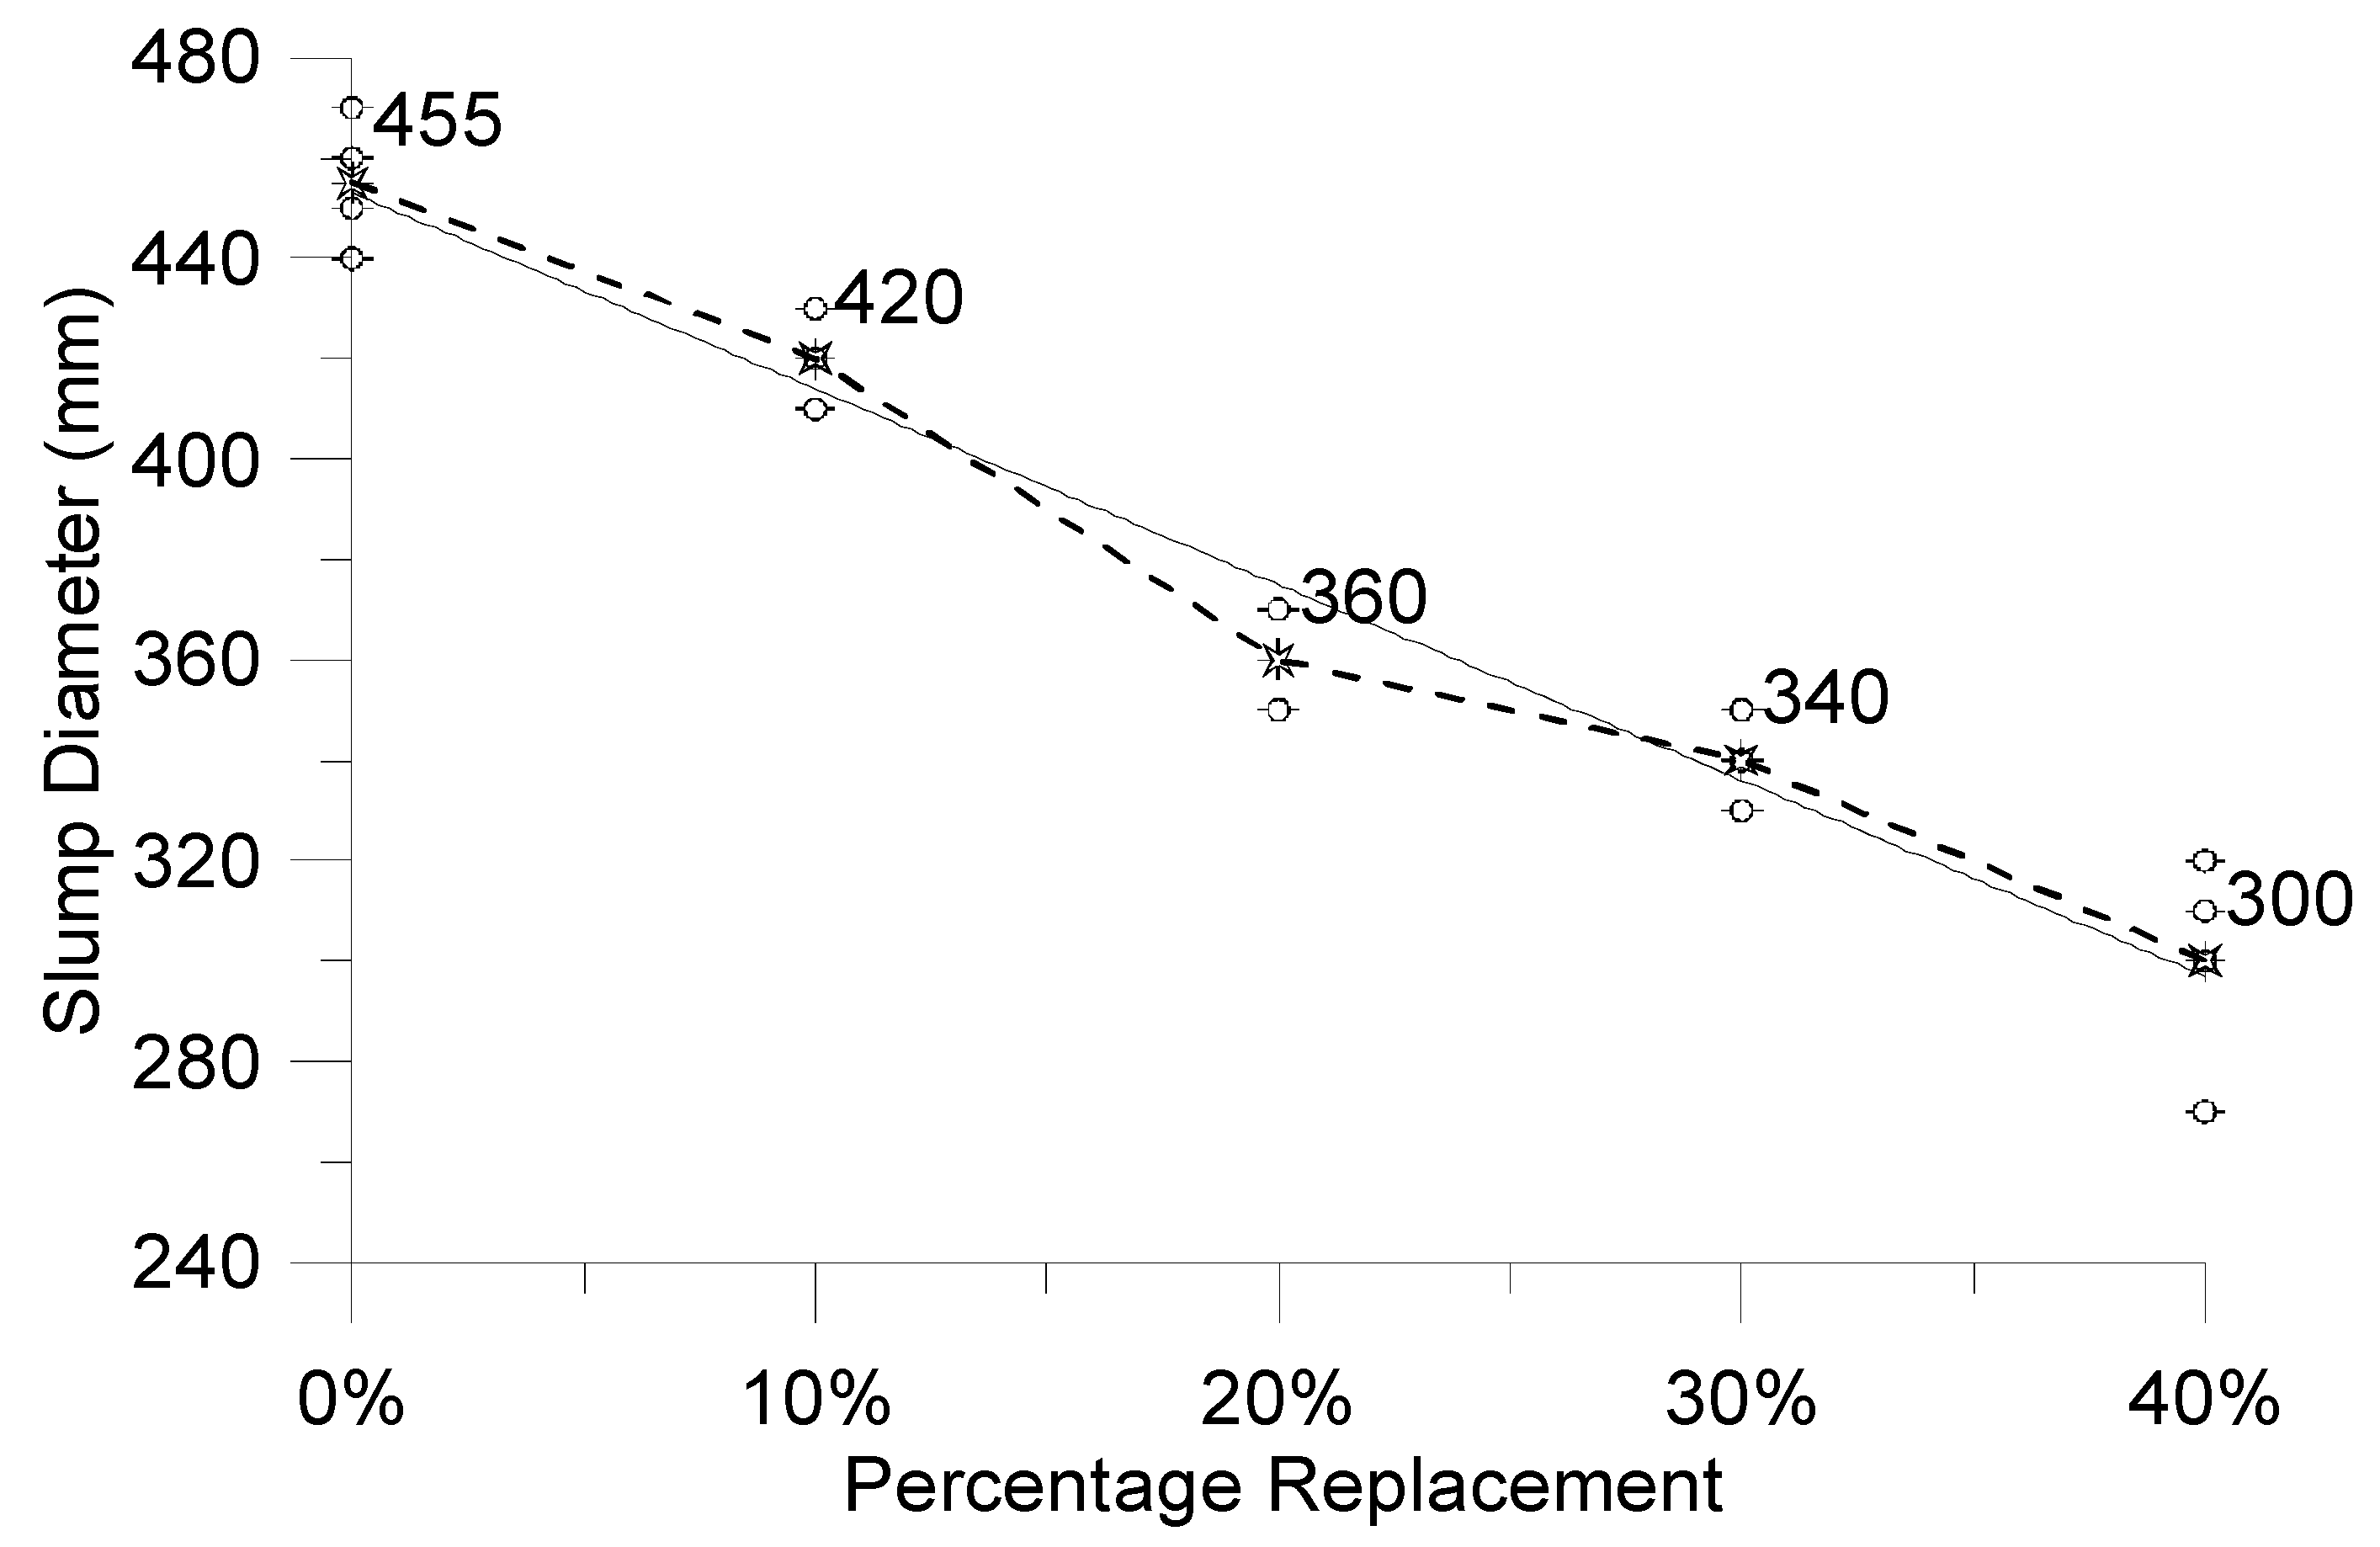
Each concrete batch’s workability was assessed prior to casting. Observations show that as the proportion of Oyster Shell replacement increases, workability decreases, which aligns with findings by Eo and Yi (2015). The slump test results, conducted in accordance with ASTM-C1611/C1611M-21 (2021), for mixtures incorporating Oyster Shell substitution are displayed in Table 12 and Figure 13. Analysis of the physical properties of Oyster Shell powder indicates a higher absorption rate compared to fine aggregate. This higher porosity in Oyster Shell aggregate leads to reduced workability as its content increases in the mix. According to ASTM-C1611/C1611M-21 (2021), self-consolidating concrete should have a slump diameter between 480 mm and 680 mm. Given that aggregates (both fine and coarse) constitute 83.33% of the mix, the concrete demonstrates low workability. The recommended slump height for pumped concrete ranges from 50 mm to 100 mm, and in this study, the concrete mix is pumpable due to the inclusion of a high-range water-reducing admixture.

Table 12.
Slump Diameter Of Fresh Concrete.
| Fine Aggregate Replacement | S.D(d1) | S.D(d2) | S.D(d1) | S.D(d2) | Mean |
|---|---|---|---|---|---|
| 0% Replacement | 470 | 460 | 450 | 440 | 455 |
| 10% Replacement | 430 | 420 | 420 | 410 | 420 |
| 20% Replacement | 370 | 350 | 370 | 350 | 360 |
| 30% Replacement | 350 | 340 | 340 | 330 | 340 |
| 40% Replacement | 320 | 310 | 300 | 270 | 300 |
*S.D.=Slump Diameter.
Figure 13.
The effect of oyster shell on the concrete slump.
4.3. Density Of Concrete
The density of the concrete decreases as the percentage of Oyster Shell (OS) in the mix increases. With 10%, 20%, 30%, and 40% replacement of fine aggregate with Oyster Shell, the concrete density decreases by 3.91%, 5.96%, 7.56%, and 9.75%, respectively. Table 13 and Figure 14 provide a visual representation of the density versus percentage of Oyster Shell replacement.
4.4. Compressive Strength
The prepared samples were tested for compressive strength after 3, 7, 28, and 56 days of curing, following ASTM-C39 (2021) standards. Each specimen was subjected to a stress rate of 0.25 MPa/s. Table 14 displays a summary of the compressive strength results.
The decline in compressive strength accelerates exponentially with the substitution of fine aggregate. For samples tested on the 28th day, the strength decreased by 22.6%, 31.1%, 26.6%, and 26.7% with 10%, 20%, 30%, and 40% replacement of Oyster S, respectively. On the 56th day, the strength decreased by 20.4%, 32.1%, 26.2%, and 34.1% for the same replacement levels. The development of compressive strength over 3, 7, 28, and 56 days is shown in Figure 15. Table 15 displays the Compressive Strength of Concrete with Standard deviation.
For 0%, 10%, and 20% Oyster Shell replacement, the decrease in compressive strength is linear. However, for 30% and 40% replacement, a similar pattern in strength development is not observed. Notably, the compressive strength of samples with 30% replacement on the 28th and 56th days is higher than that of samples with 20% replacement, even though the 30% replacement samples have a lower density.
In the short term, samples with 40% replacement show exponential strength development, reaching full maturity by the 28th day, with no further strength gain afterward. Despite being lighter than concrete with 20% replacement, the final compressive strength attained by samples with 40% replacement is similar to that of samples with 20% replacement.
5. Conclusions
Oyster shells, primarily composed of calcium compounds, can be crushed to achieve a grain size distribution similar to that of conventional sand aggregates used in concrete mixes. Comparing the physical characteristics of oyster shells and sand, it is evident that oyster shells are more porous and have a lower specific gravity due to internal voids. This increased porosity in oyster shells is confirmed by the absorption test, showing that oyster shells absorb about four times more water than the fine aggregate used in this study.
The findings of the study are as follows:
- a)
- Oyster shell aggregate has higher absorption compared to the fine aggregate used in this study. This high absorption increases the water demand of concrete, as oyster shell aggregate has more internal structural pores than sand. Consequently, the workability of the wet concrete decreases, and the slump value decreases as the oyster shell content in the concrete increases.
- b)
- There is a linear decrease in concrete density with increasing oyster shell content. Because oyster shell aggregate has a lower specific gravity than fine aggregate, the percentage of oyster shell in concrete has an inverse relationship with the concrete’s density.
- c)
- At a 40% replacement of fine aggregate with oyster shells, a 9.75% decrease in concrete density is observed. The rate of decrease in concrete density is 5.62 kg/cm³ per percentage of replacement.
- d)
- Due to the higher absorption and lower specific gravity of oyster shells compared to the fine aggregates used in this study, oyster shell aggregates are less durable than sand, which contributes to a decrease in compressive strength as oyster shell content increases. However, it is noted that a 30% replacement of fine aggregate performs better in terms of strength than a 20% replacement.
- e)
- While the durability of concrete decreases with oyster shell content, oyster shells can be effective in developing lightweight concrete and aiding in waste management by repurposing oyster shell powder.
Appendix A
 |
References
- ASTM-C33-18. Standard Specification for Concrete Aggregates. American Society for Testing and Materials: West Conshohocken, PA, USA, 2018.
- ASTM-C39. Standard test method for compressive strength of cylindrical concrete specimens; ASTM C39. 2021.
- ASTM-C127-15. Standard Test Method for Relative Density (Specific Gravity) and Absorption of Coarse Aggregate. American Society for Testing and Materials: West Conshohocken, PA, USA, 2015.
- ASTM-C128-15. Standard test method for relative density (specific gravity) and absorption of fine aggregate. American Society for Testing and Materials: West Conshohocken, PA, USA, 2015.
- ASTM-C136/C136M-19. Standard Test Method for Sieve Analysis of Fine and Coarse Aggregates. American Society for Testing and Materials: West Conshohocken, PA, USA, 2019. [CrossRef]
- ASTM-C143/C143M-20. Standard Test Method for Slump of Hydraulic-Cement Concrete. ASTM International. Annual book of ASTM Standards. ASTM International: West Conshohocken, 2020.
- ASTM-C192/C192M-19. Standard practice for making and curing concrete test specimens in the laboratory. ASTM Standard Book, 2019.
- ASTM-C470/C470M-15. Standard Specification for Molds for Forming Concrete Test Cylinders Vertically. American Society for Testing and Materials: West Conshohocken, PA, USA, 2015.
- ASTM-C494/C494M-19. Standard Specifications for Chemical Admixtures for Concrete. ASTM International. Annual book of ASTM Standards. West Conshohocken: ASTM International, 2019.
- ASTM-C1611/C1611M-21. Standard test method for compressive Standard Test Method for Slump Flow of Self-Consolidating Concrete. ASTM C1611, 2021.
- Binag, N.D. Powdered shell wastes as partial substitute for masonry cement mortar in binder, tiles and bricks production. Int. J. Eng. Res. Technol. 2016, 5, 70–77. [Google Scholar]
- Binag, N.H.D. Utilization of Shell Wastes for Locally Based Cement Mortar and Bricks Production: Its Impact to the Community. KnE Social Sciences 2018, 985–1004–1985–1004. [Google Scholar] [CrossRef]
- Bunyamin, B.; Mukhlis, A. Utilization of Oyster shells as a substitute part of cement and fine aggregate in the compressive strength of concrete. Aceh International Journal of Science and Technology 2020, 9, 150–156. [Google Scholar] [CrossRef]
- Carson, K. Color of Oysters. Retrieved from. Available online: https://www.ehow.com/facts_7447420_color-oysters.html.
- CNS-61-R2001. Chinese National Standards, Portland cement. 2011. Retrieved from. Available online: http://www.cnsonline.com.tw/?node=detail&generalno=61&locale=zh_TW.
- Corporation, T.S. Sustainable Development of Taiwan Sugar Corporation. 2019. Retrieved from. 1230. Available online: https://www.taisugar.com.tw/CSR/en/CP2.aspx?n=12300.
- Ekop, I.; Adenuga, O.; Umoh, A. Strength characteristics of granite–pachimalania aurita shell concrete. Nigerian journal of Agriculture, Food and Environment. 2013, 9, pp. 9–14. Available online: https://www.researchgate.net/profile/Ifiok_Ekop3/publication/348064883_STRENGTH_CHARACTERISTICS_OF_GRANITE-Pachymelania_aurita_SHELL_CONCRETE/links/5fee1a3e45851553a00d0c9f/STRENGTH-CHARACTERISTICS-OF-GRANITE-Pachymelania-aurita-SHELL-CONCRETE.pdf.
- Eo, S.-H.; Yi, S.-T. Effect of oyster shell as an aggregate replacement on the characteristics of concrete. Magazine of Concrete Research 2015, 67, 833–842. [Google Scholar] [CrossRef]
- Eo, S.H.; Choi, D.J.; Park, Y.K.; Hong, K.H.; HK. An experimental study on the use of oyster shells as aggregate in concrete. Proceedings of the Korea Concrete Institute, 2001.05. 2001. Available online: http://www.koreascience.or.kr/article/CFKO200111921190396.pdf.
- Ettu, L.; Ibearugbulem, O.; Ezeh, J.; Anya, C. A reinvestigation of the prospects of using periwinkle shell as partial replacement for granite in concrete. 2013, 2, 54–59. Available online: http://www.ijesi.org/papers/Vol(2)3%20(Version-3)/I235459.pdf.
- Etuk, B.R.; Etuk, I.F.; Asuquo, L.O. Feasibility of using sea shells ash as admixtures for concrete. Journal of Environmental Science and Engineering 2012, A, 1. [Google Scholar]
- F; F; Ikponmwosa, E.; Ojediran, N. Behaviour of lightweight concrete containing periwinkle shells at elevated temperature. Journal of Engineering Science and Technology. 2010, 5. Available online: https://www.researchgate.net/publication/49596224_Behaviour_of_lightweight_concrete_containing_periwinkle_shells_at_elevated_temperature.
- Falade, F. An investigation of periwinkle shells as coarse aggregate in concrete. Building and Environment 1995, 30, 573–577. [Google Scholar] [CrossRef]
- Gallagher, L.; Peduzzi, P. Sand and sustainability: Finding new solutions for environmental governance of global sand resources. 2019. [Google Scholar]
- Griffiths, S.; Sovacool, B.K.; Furszyfer Del Rio, D.D.; Foley, A.M.; Bazilian, M.D.; Kim, J. Decarbonizing the cement and concrete industry: a systematic review of socio-technical systems, technological innovations, and policy options. Renewable and Sustainable Energy Reviews 2023, 180, 113291. [Google Scholar] [CrossRef]
- Halim, A. B. A. Workability and Compressive Strength of Concrete Containing Crushed Cockle Shell as Partial Fine Aggregate Replacement Material; UMP, 2014. [Google Scholar]
- Hosseinpanahi, A.; Shen, L.; Dera, P.; Mirmoghtadaei, R. Properties and microstructure of concrete and cementitious paste with liquid carbon dioxide additives. Journal of Cleaner Production 2023, 414, 137293. [Google Scholar] [CrossRef]
- Lee, C.H.; Lee, D.K.; Ali, M.A.; Kim, P.J. Effects of oyster shell on soil chemical and biological properties and cabbage productivity as a liming materials. Waste Management 2008, 28, 2702–2708. [Google Scholar] [CrossRef] [PubMed]
- Lertwattanaruk, P.; Makul, N.; Siripattarapravat, C. Utilization of ground waste seashells in cement mortars for masonry and plastering. Journal of Environmental Management 2012, 111, 133–141. [Google Scholar] [CrossRef] [PubMed]
- Meyer, C. The greening of the concrete industry. Cement and Concrete Composites 2009, 31, 601–605. [Google Scholar] [CrossRef]
- Olivia, M. , Oktaviani, R., & Ismeddiyanto. Properties of Concrete Containing Ground Waste Cockle and Clam Seashells. Procedia Engineering 2017, 171, 658–663. [Google Scholar] [CrossRef]
- ProStar SP10. Retrieved from. Available online: http://www.hicon.com.tw/newproducts/sp100.html.
- Reports-and-Data. Aggregates Market To Reach USD 723.28 Billion By 2027|Reports and Data. GlobeNewswire News Room. 2020. Available online: https://www.globenewswire.com/news-release/2020/06/24/2052902/0/en/Aggregates-Market-To-Reach-USD-723-28-Billion-By-2027-Reports-and-Data.html.
- Sah, A.K.; Hong, Y.-M. Circular Economy Implementation in an Organization: A Case Study of the Taiwan Sugar Corporation. Sustainability 2024, 16, 7865. [Google Scholar] [CrossRef]
- Scibilia, E. Environmental Impact and Sustainability in Aggregate Production and Use. 2014, 41–44. [Google Scholar]
- Soneye, T.; Ede, A.; Bamigboye, G.; Olukanni, D. The Study of Periwinkle Shells as Fine and Coarse Aggregate in Concrete Works; 2016. [Google Scholar]
- Strategic-Business-Plan-ISO/TC-071. STRATEGIC BUSINESS PLAN ISO/TC 071. 2016. Retrieved from. Available online: https://isotc.iso.org/livelink/livelink/fetch/2000/2122/687806/ISO_TC_071__Concrete__reinforced_concrete_and_pre-stressed_concrete_.pdf?nodeid=1162199&vernum=0.
- Taiwan Introduces Aggregates Management System. Aggregates Business. 2020. Available online: https://www.aggbusiness.com/ab10/feature/taiwan-introduces-aggregates-management-system.
- Tattersall, G. H. Workability and quality control of concrete; CRC Press, 1991. [Google Scholar]
- Wenzel, B.; Bustamante, M.; Muñoz, P.; Ortega, J.M.; Loyola, E.; Letelier, V. Physical and mechanical behavior of concrete specimens using recycled aggregate coated with recycled cement paste. Construction and Building Materials 2023, 393, 132015. [Google Scholar] [CrossRef]
- Yang, E.I.; Kim, M.-Y.; Park, H.-G.; Yi, S.-T. Effect of partial replacement of sand with dry oyster shell on the long-term performance of concrete. Construction and Building Materials - CONSTR BUILD MATER 2010, 24, 758–765. [Google Scholar] [CrossRef]
- Yang, E.I.; Yi, S.-T.; Leem, Y.-M. Effect of oyster shell substituted for fine aggregate on concrete characteristics: Part I. Fundamental properties. Cement and Concrete Research 2005, 2175–2182. [Google Scholar] [CrossRef]
- Yoon, G.-L.; Kim, B.-T.; Kim, B.-O.; Han, S.-H. Chemical-mechanical characteristics of crushed oyster-shell. Waste management (New York, N.Y.) 2003, 23, 825–834. [Google Scholar] [CrossRef]
- Yoon, G.-L.; Kim, B.-T.; Kim, B.-O.; Han, S.-H. Chemical–mechanical characteristics of crushed oyster-shell. Waste Management 2003, 23, 825–834. [Google Scholar] [CrossRef] [PubMed]
- Yoon, H.; Park, S.; Lee, K.; Park, J. Oyster Shell as Substitute for Aggregate in Mortar. Waste Management & Research 2004, 22, 158–170. [Google Scholar] [CrossRef]
Figure 1.
Upper & Lower Limit Of Grain Size For FINE AGGREGATES (ASTM-C33-18, 2018).
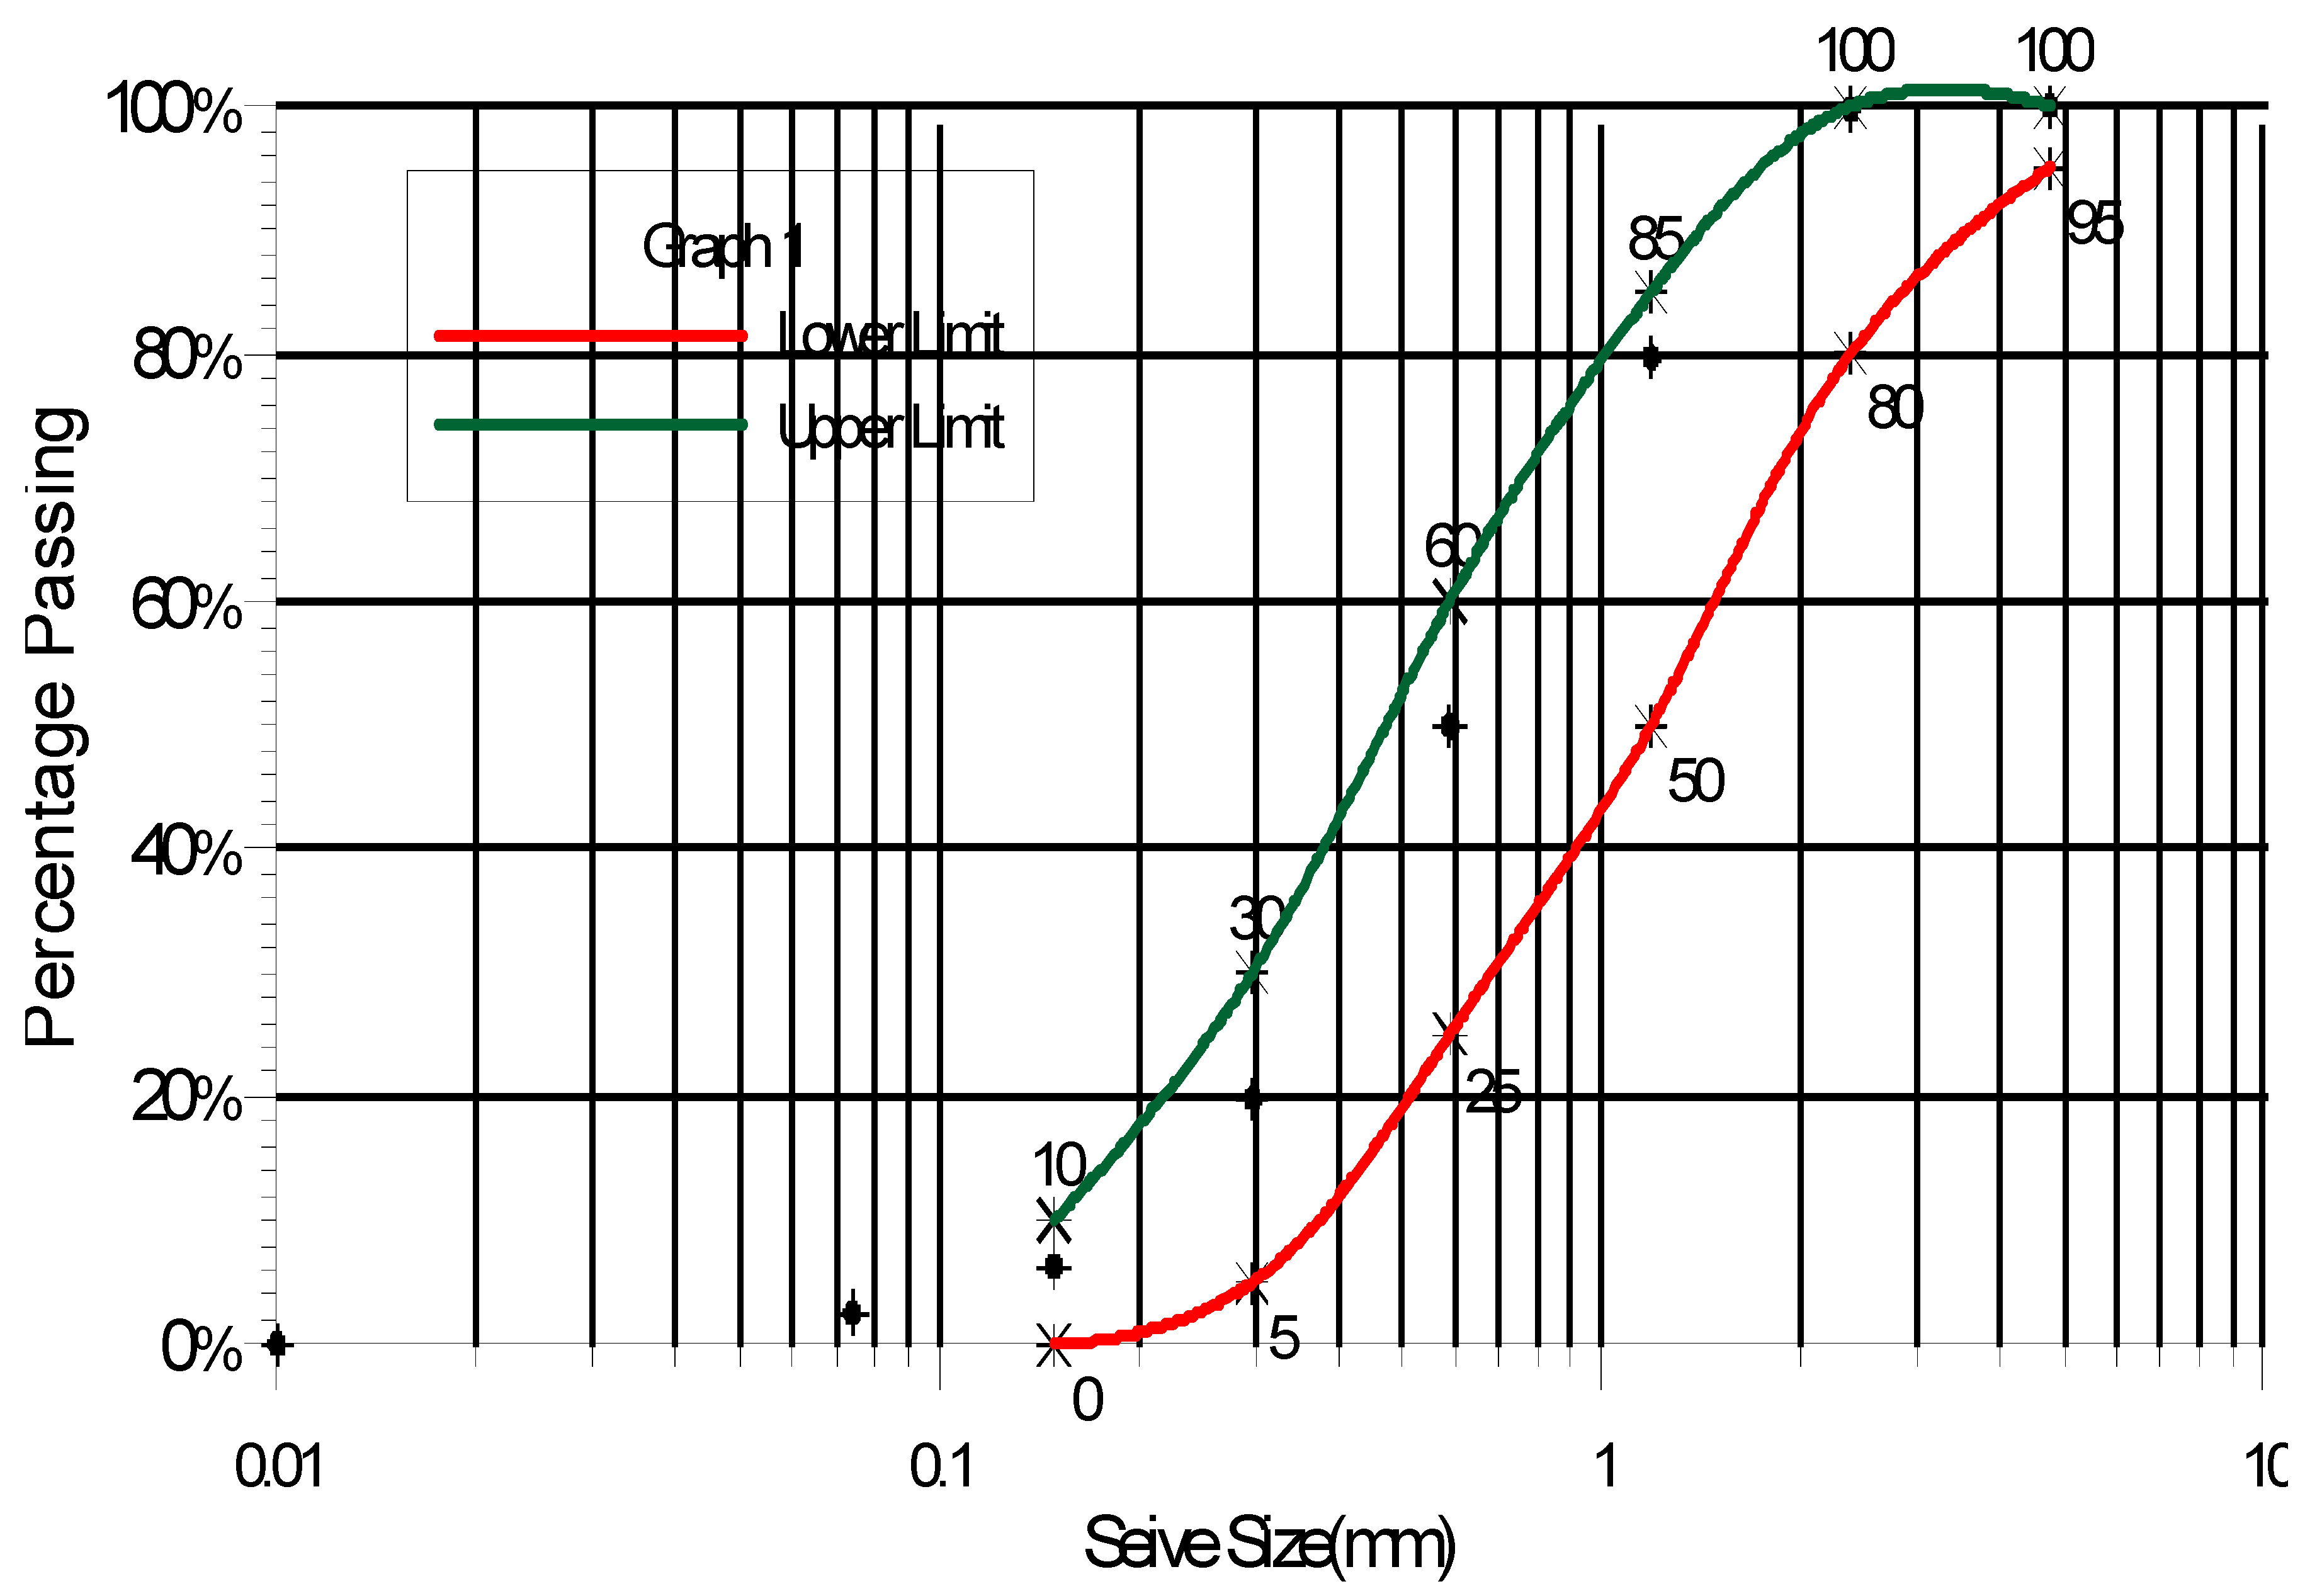
Figure 2.
Slump variation vs substitution with Oyster Shell(Yang et al., 2005).
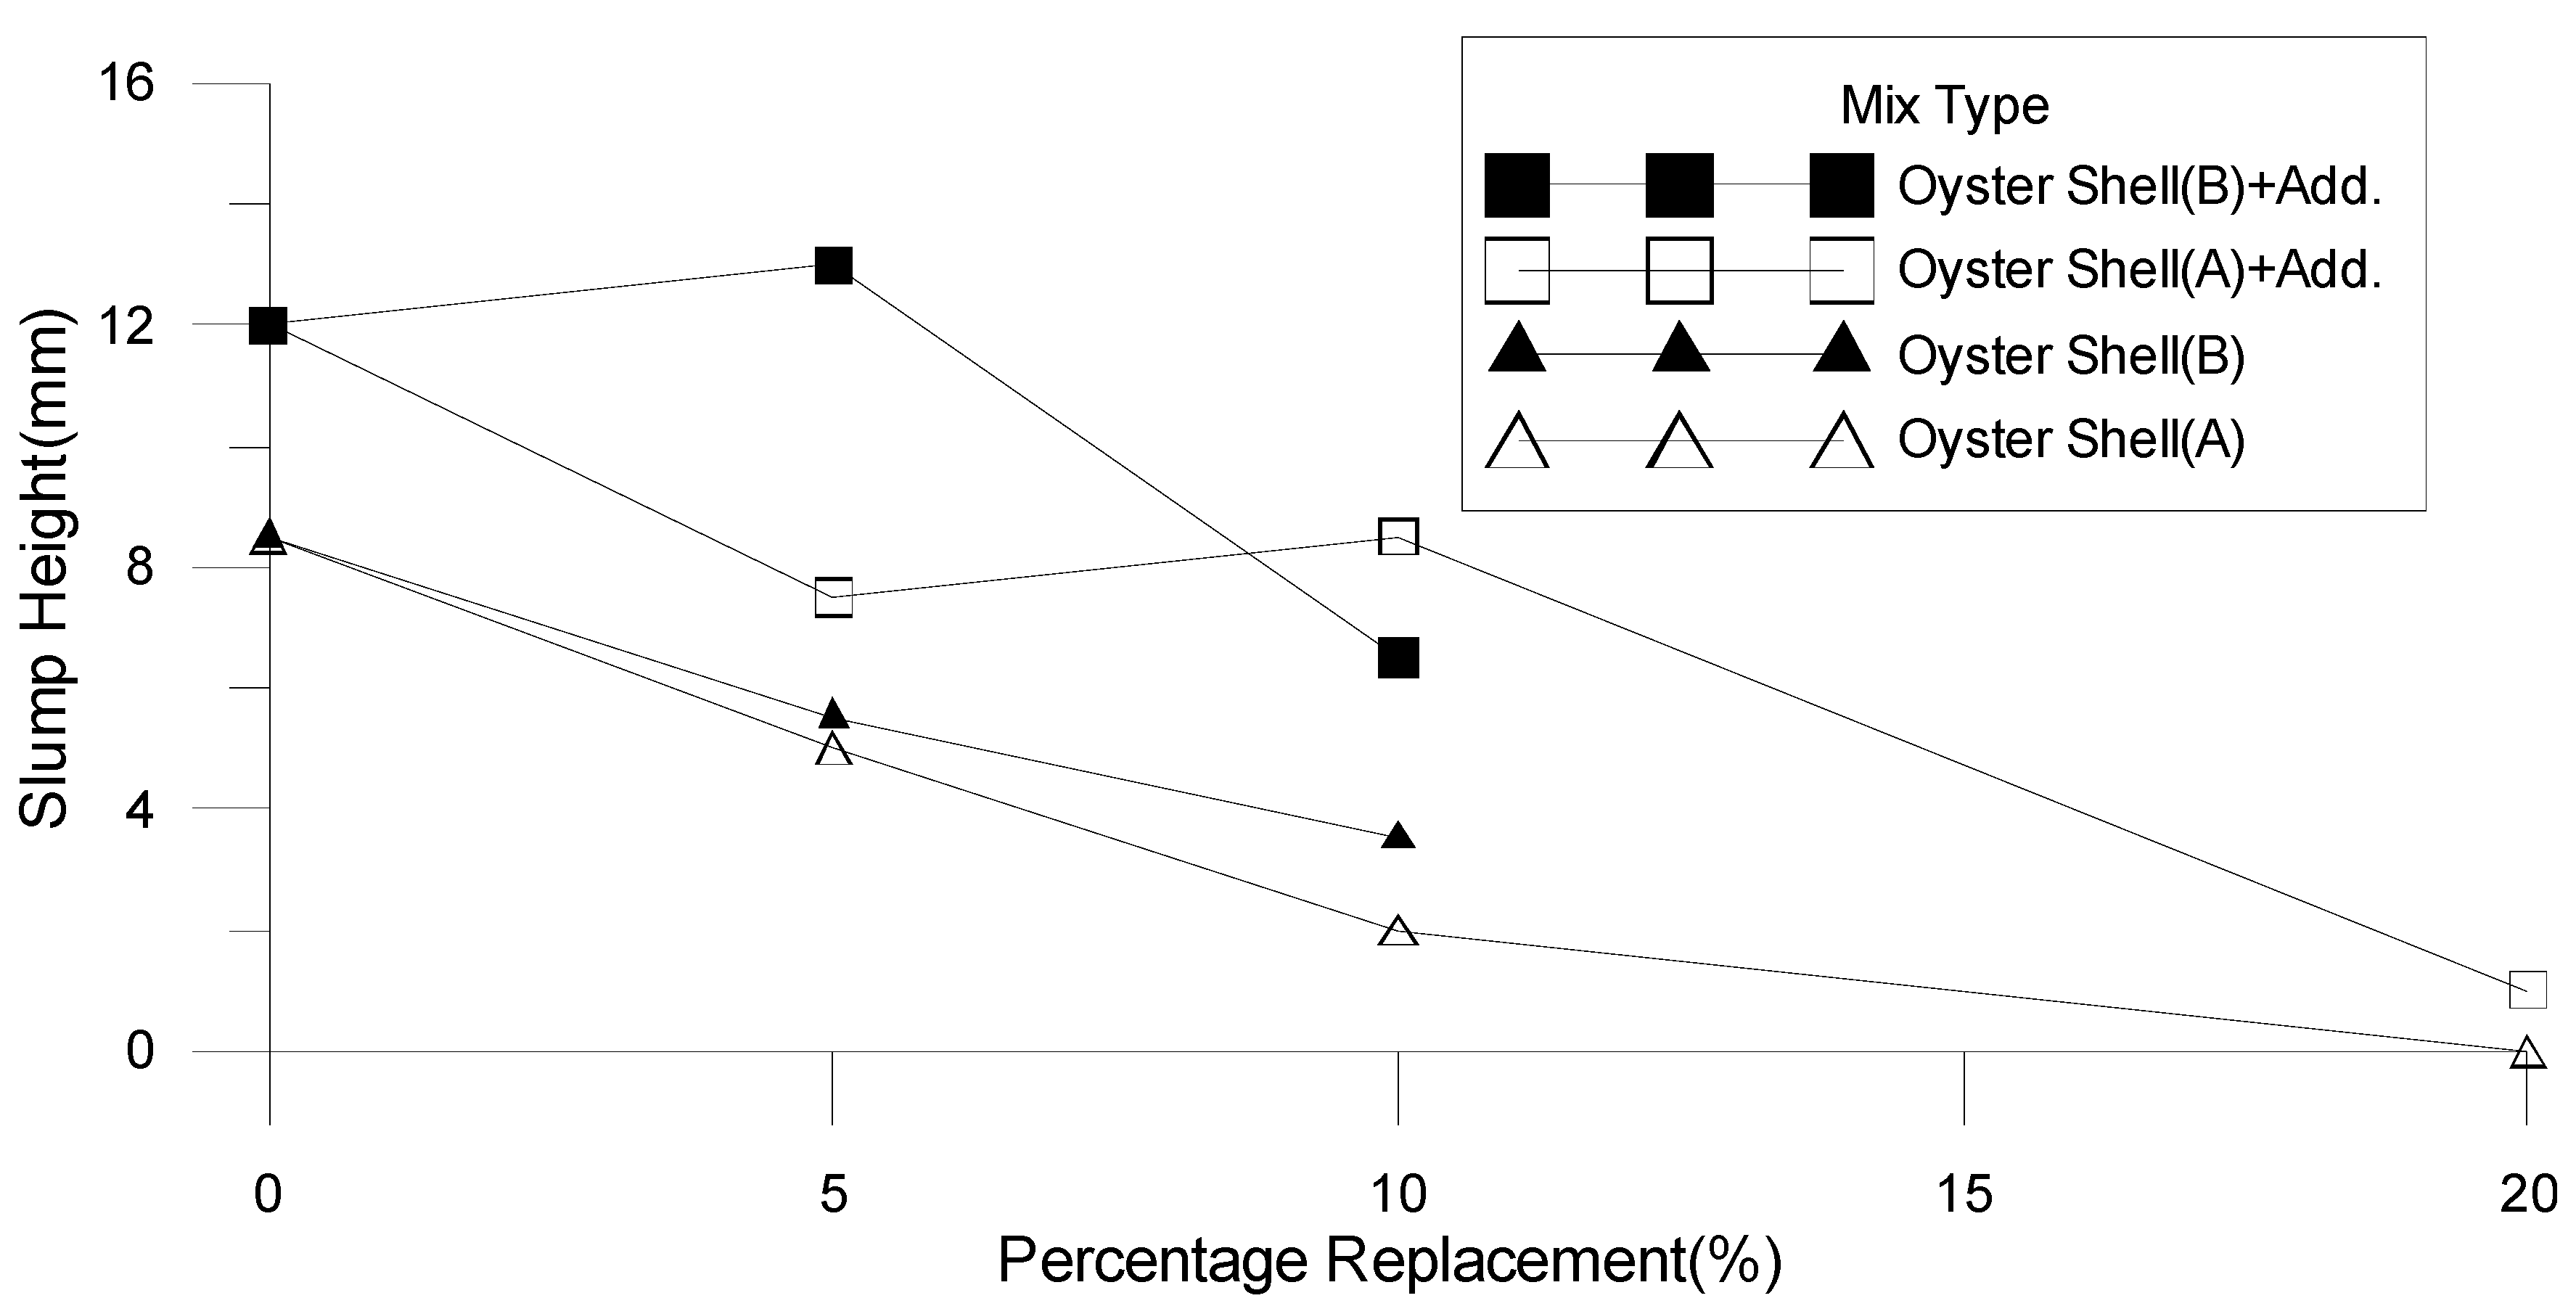
Figure 3.
Compressive Strength Vs Percentage Replacement Of fine aggregate With Oyster Shell. (Yang et al., 2005).
Figure 3.
Compressive Strength Vs Percentage Replacement Of fine aggregate With Oyster Shell. (Yang et al., 2005).
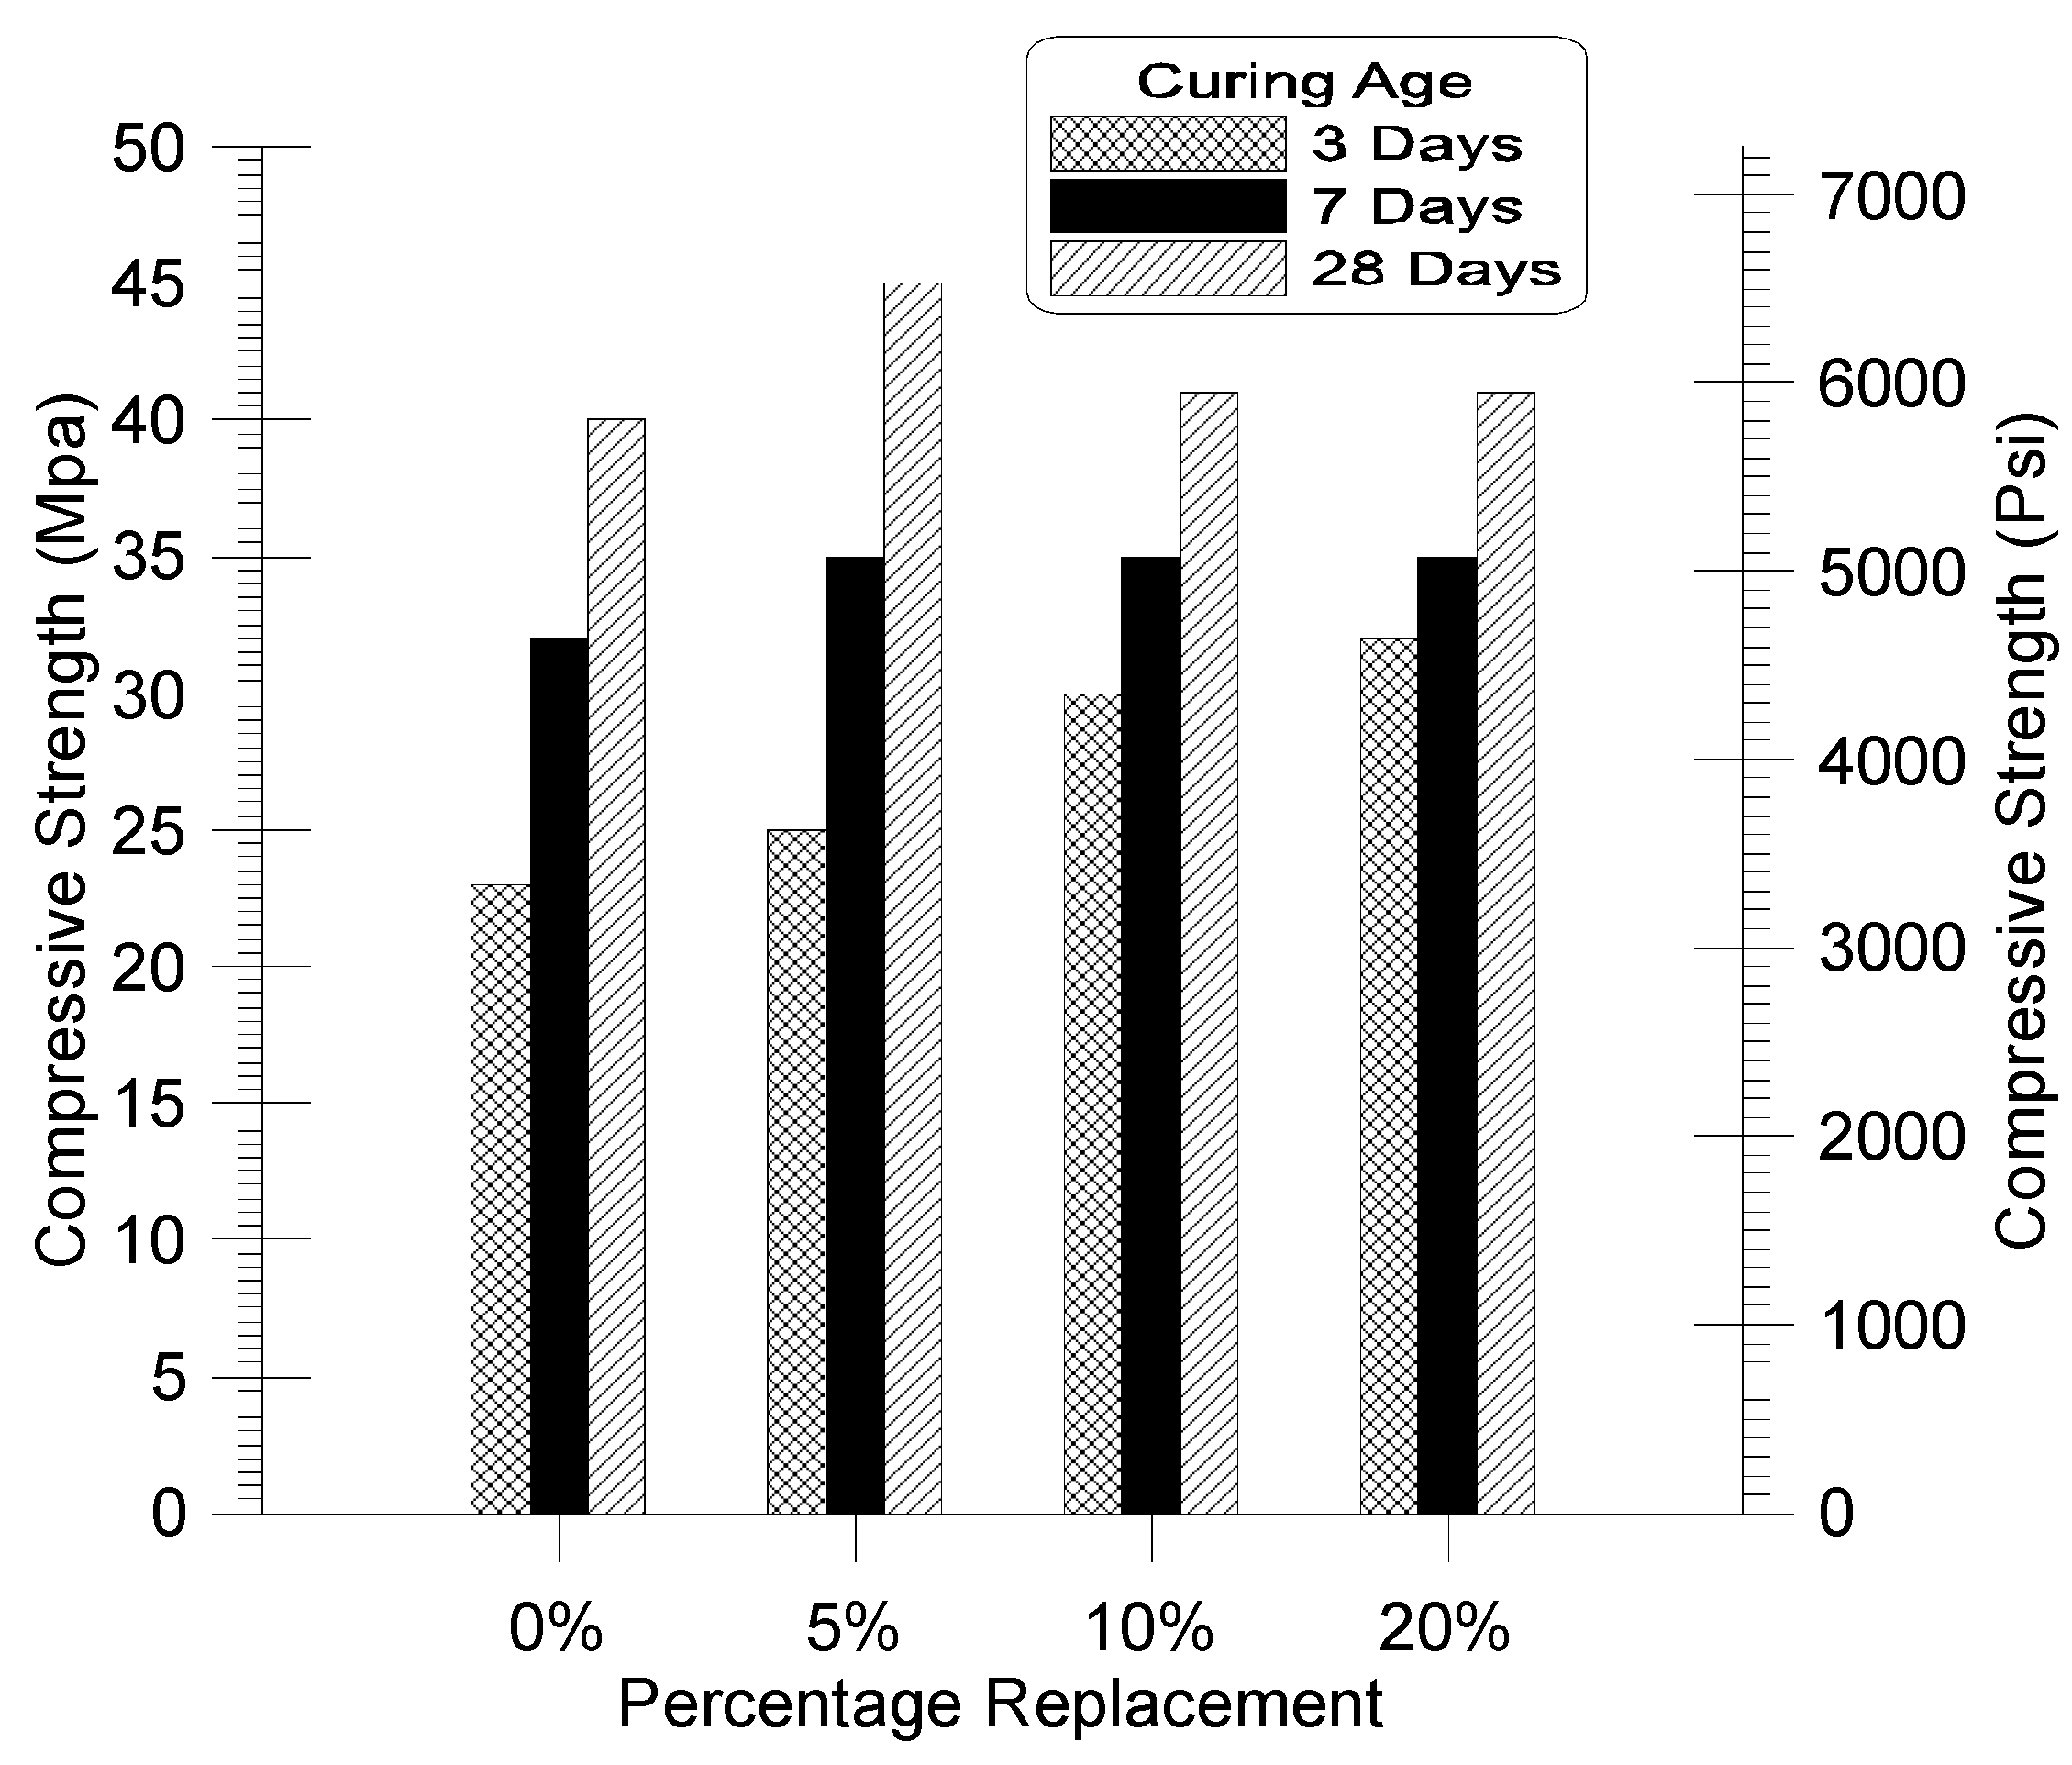
Figure 4.
Compressive Strength Vs Curing Age For Replacement Of fine aggregate (Long-Term) (Yang et al., 2010).
Figure 4.
Compressive Strength Vs Curing Age For Replacement Of fine aggregate (Long-Term) (Yang et al., 2010).
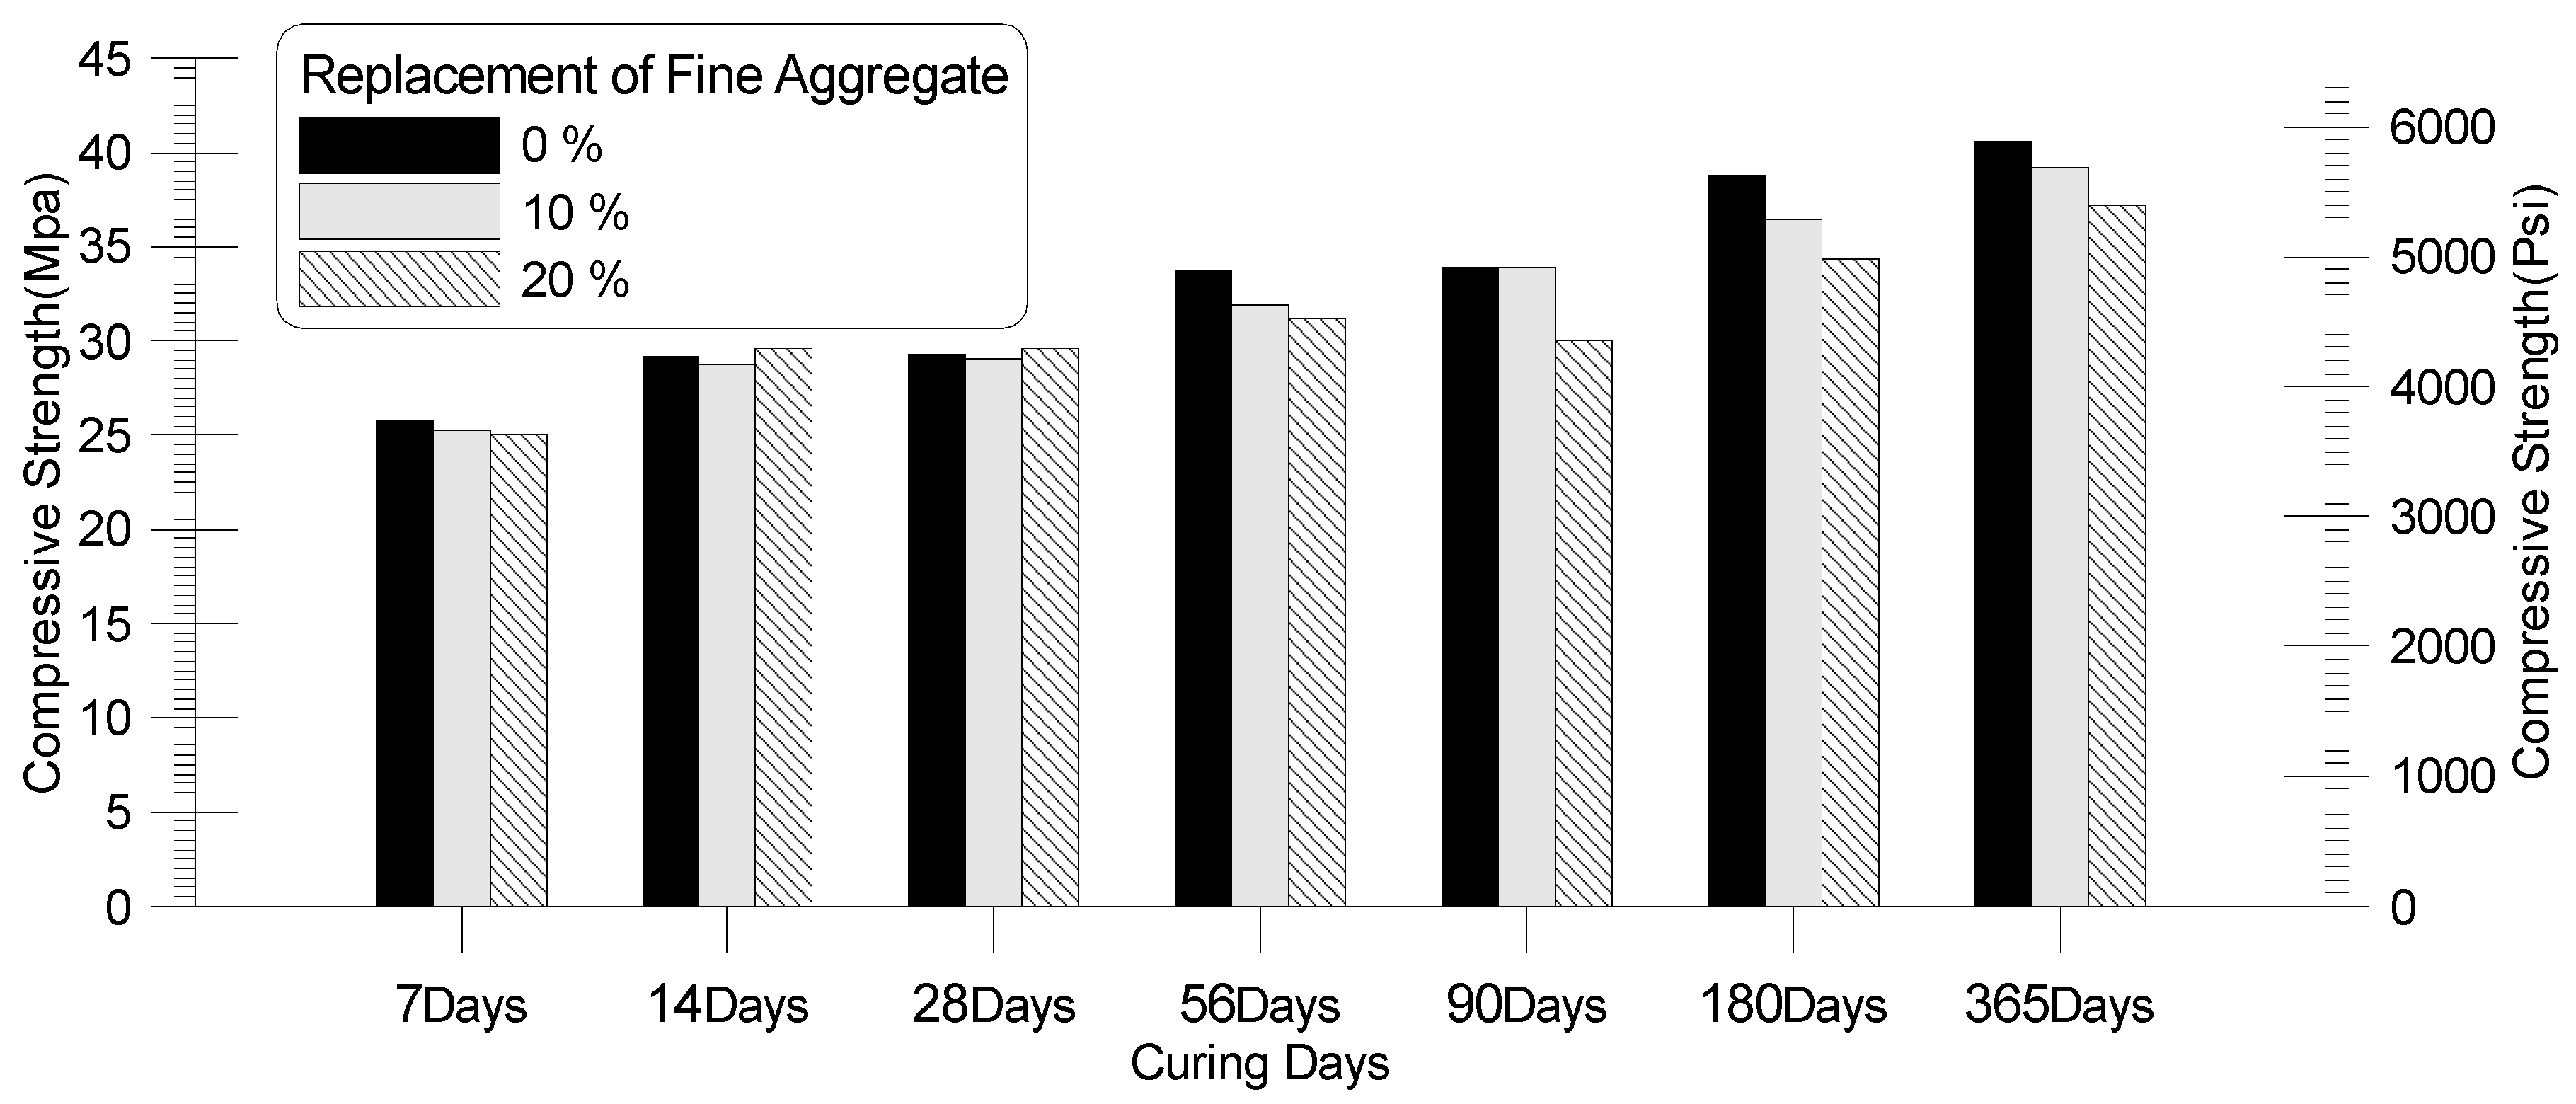
Figure 5.
Compressive Strength Vs Curing Age for the replacement rate of Fine aggregate (Eo & Yi, 2015).
Figure 5.
Compressive Strength Vs Curing Age for the replacement rate of Fine aggregate (Eo & Yi, 2015).
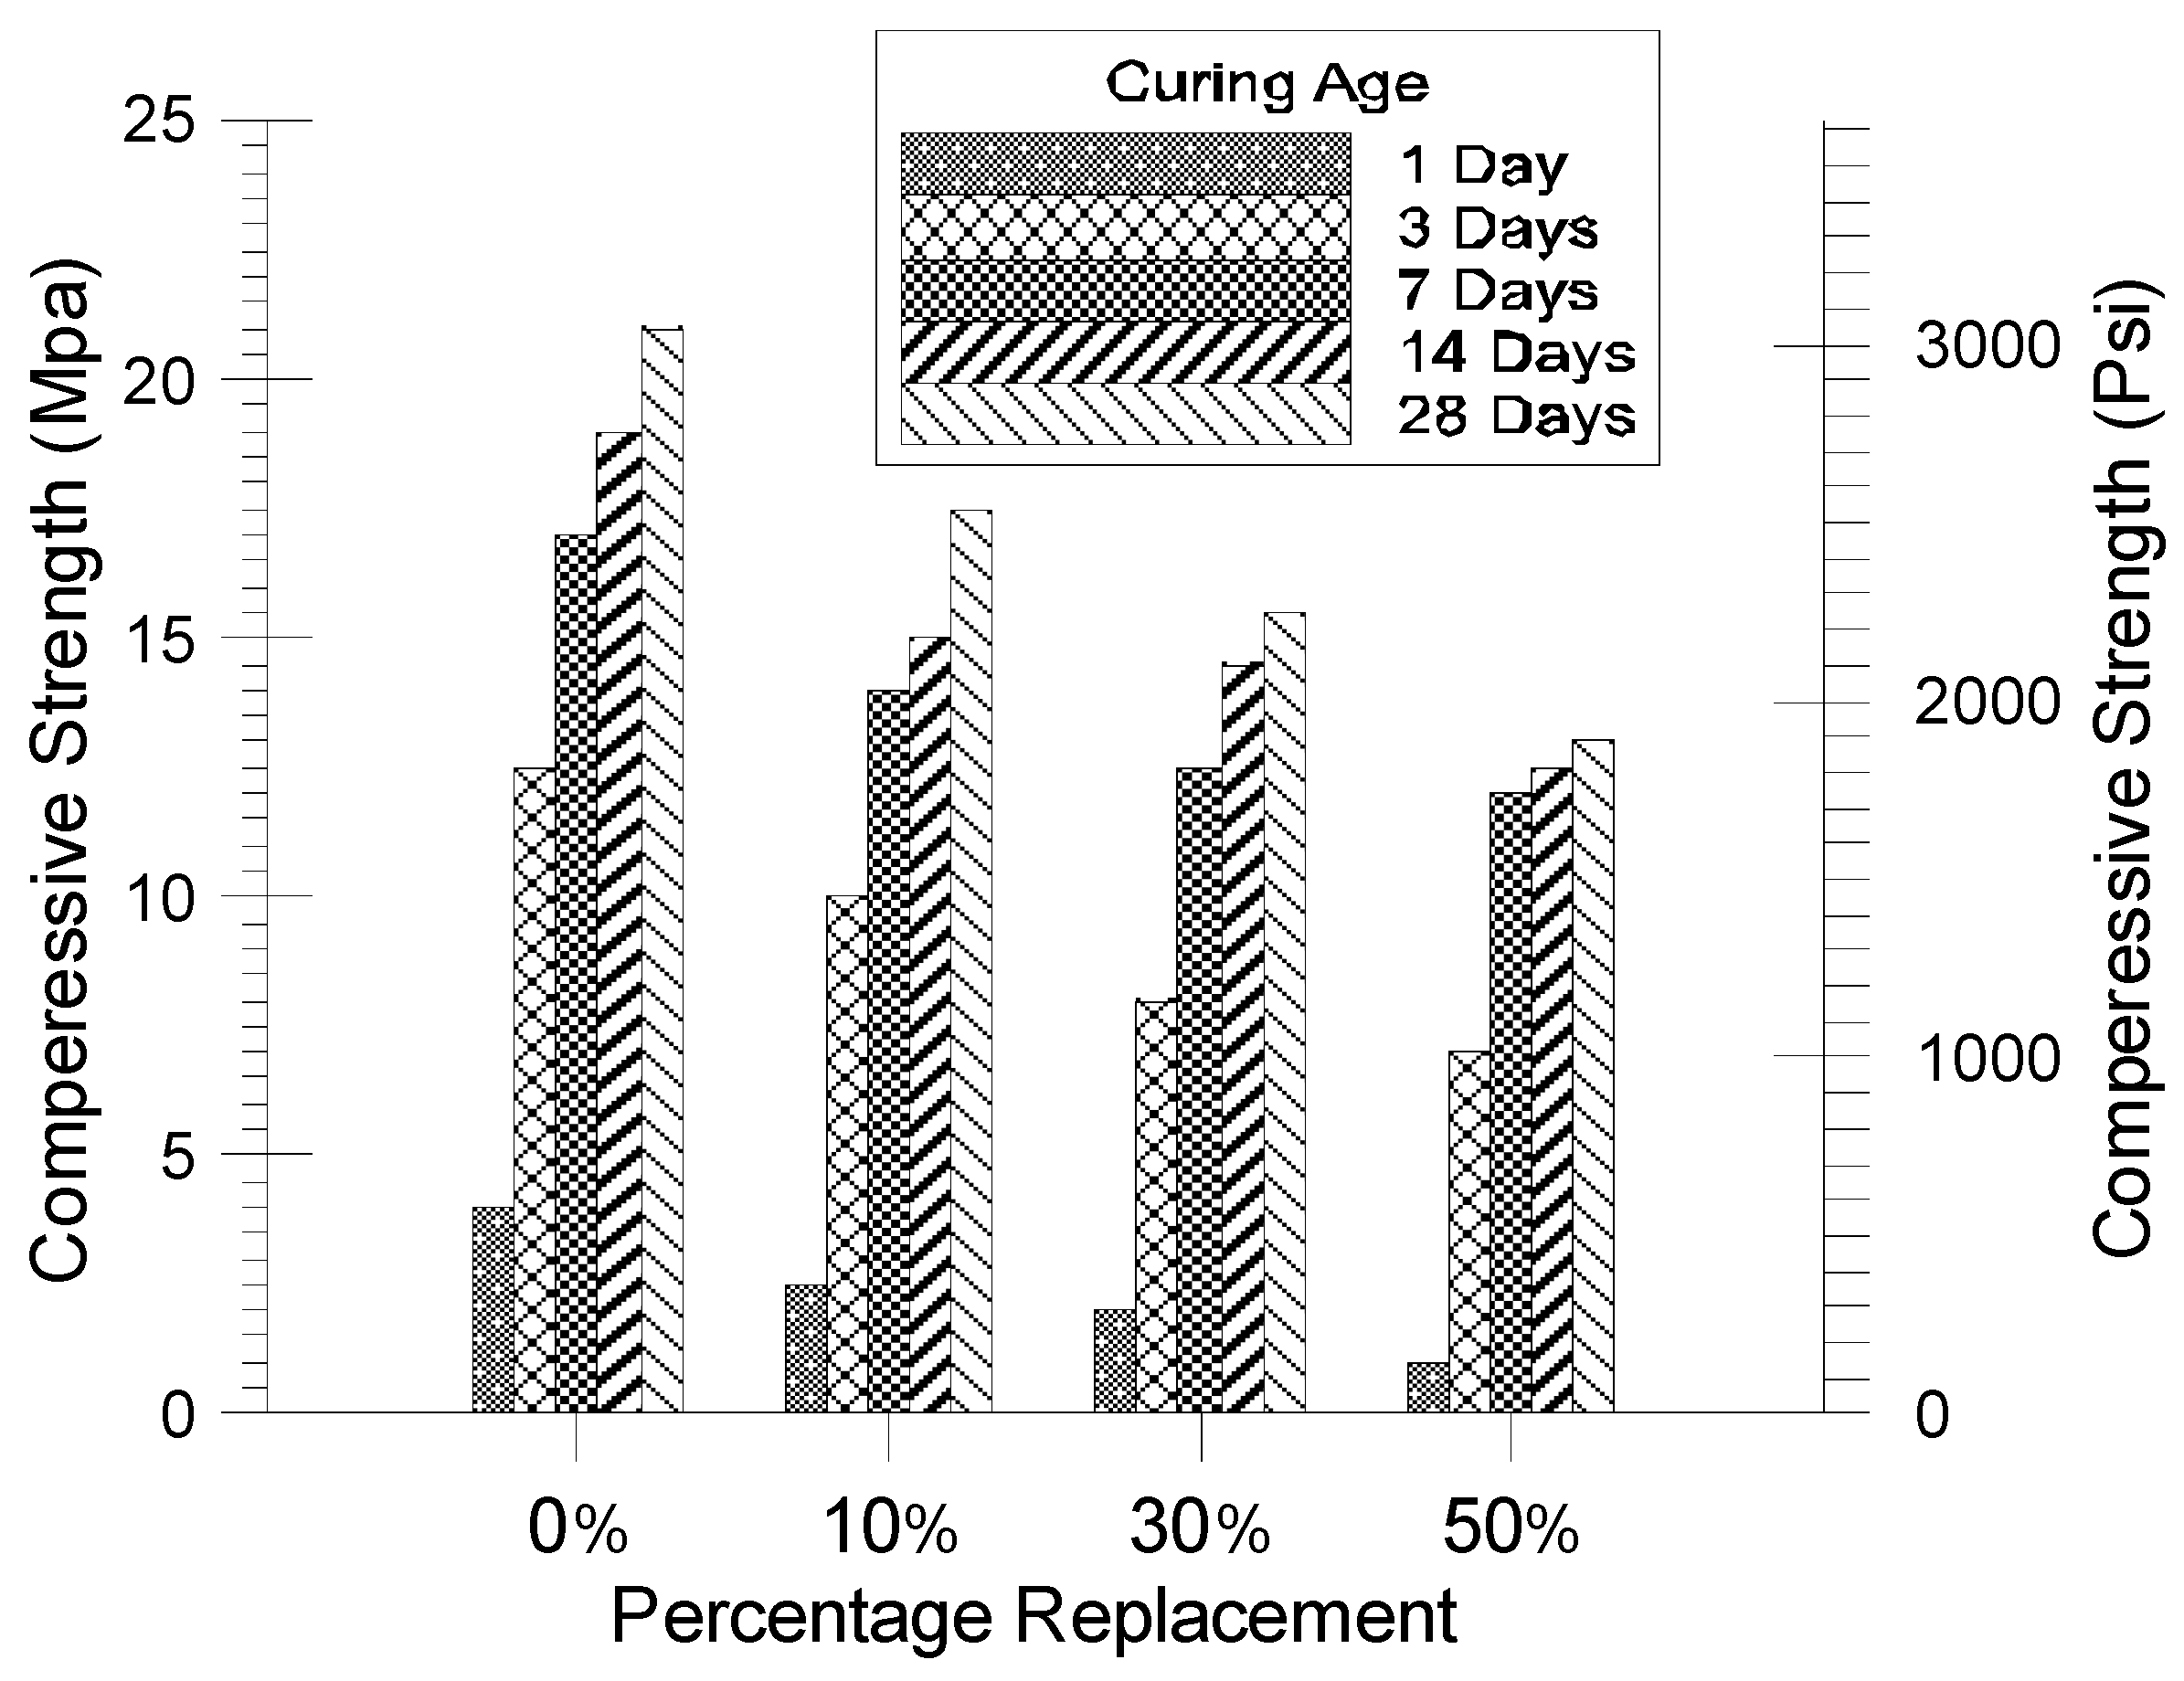
Figure 6.
Experimental Prodecure.
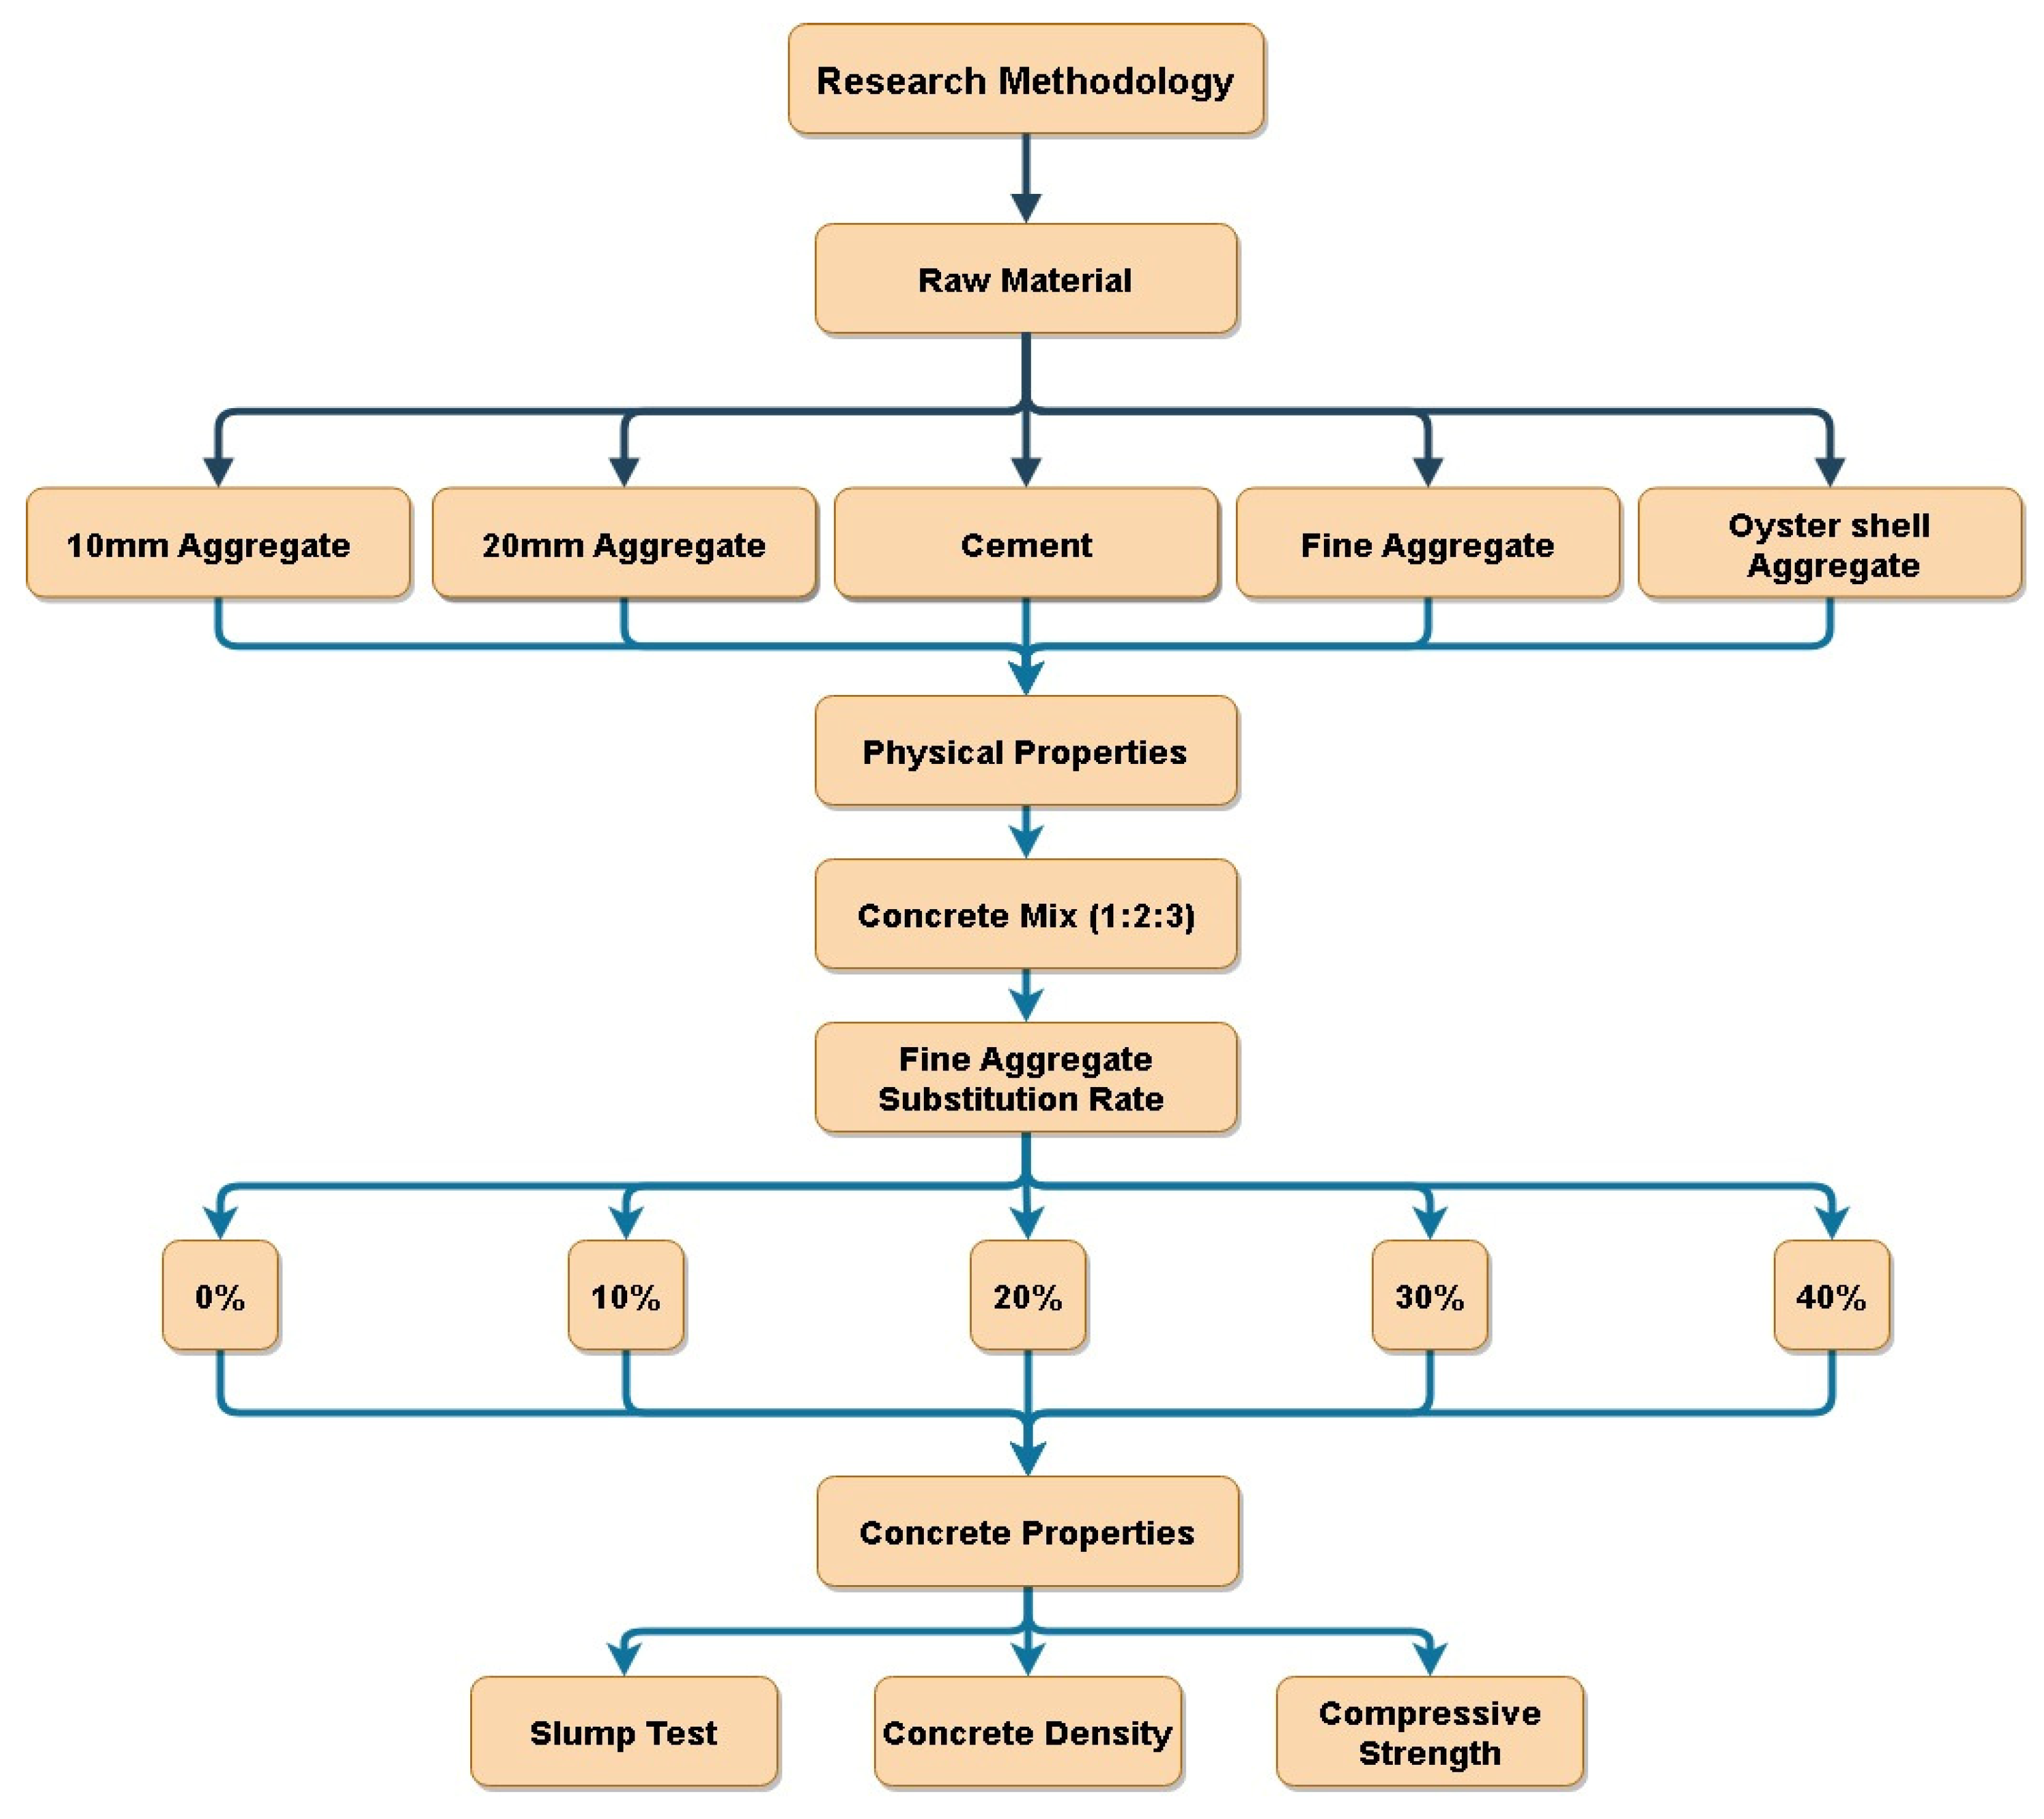
Figure 7.
Tilting Drum Mixer.
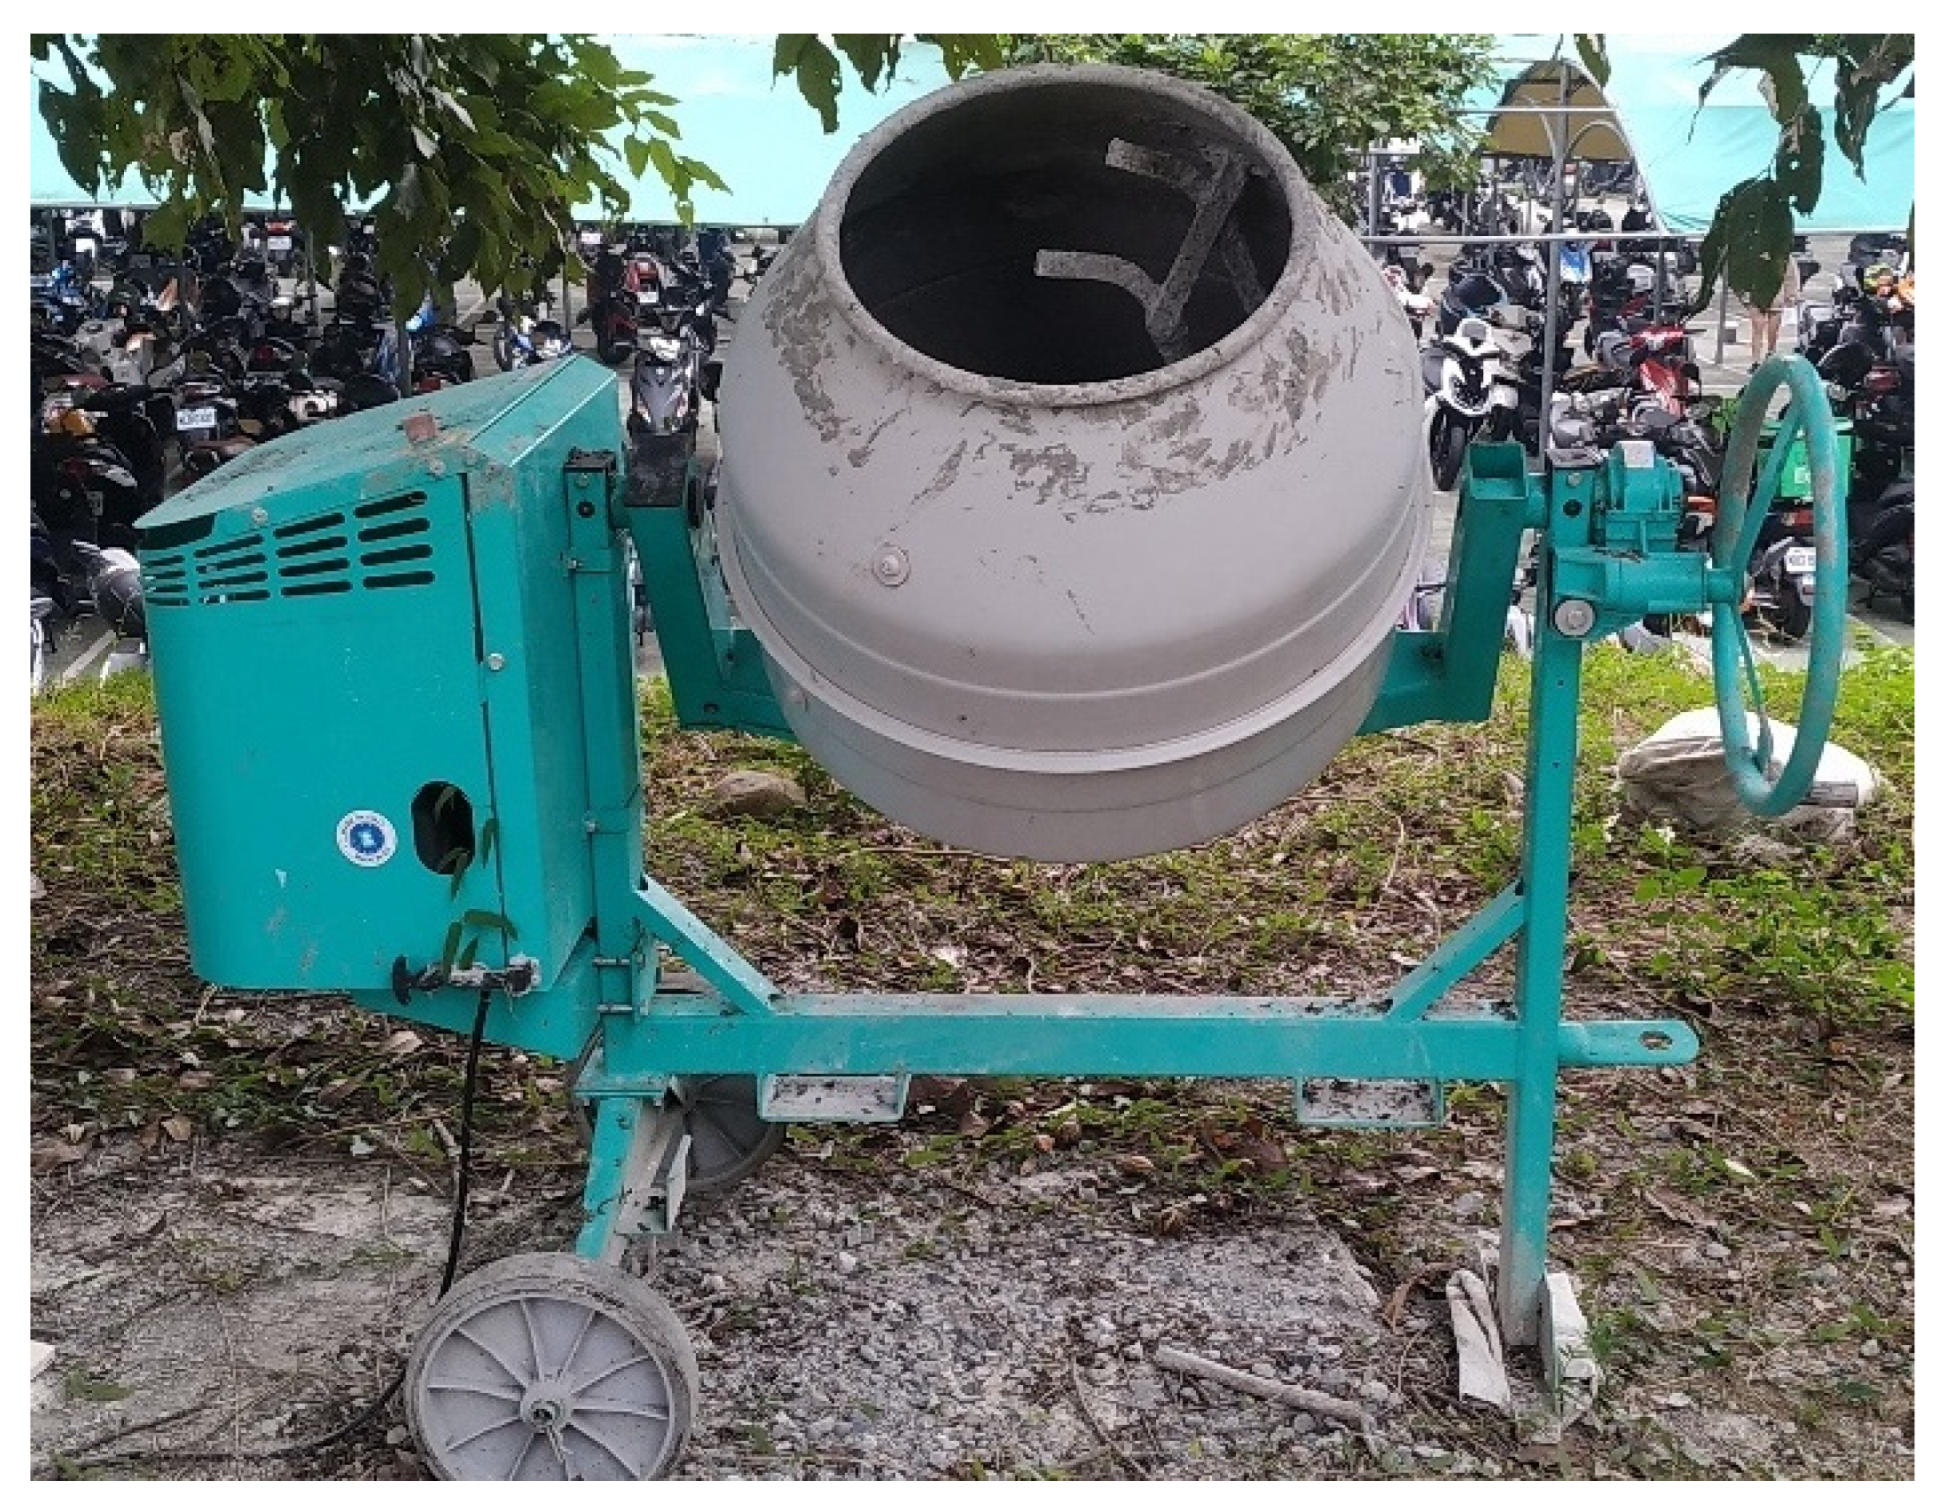
Figure 8.
Design Mix Comparison.
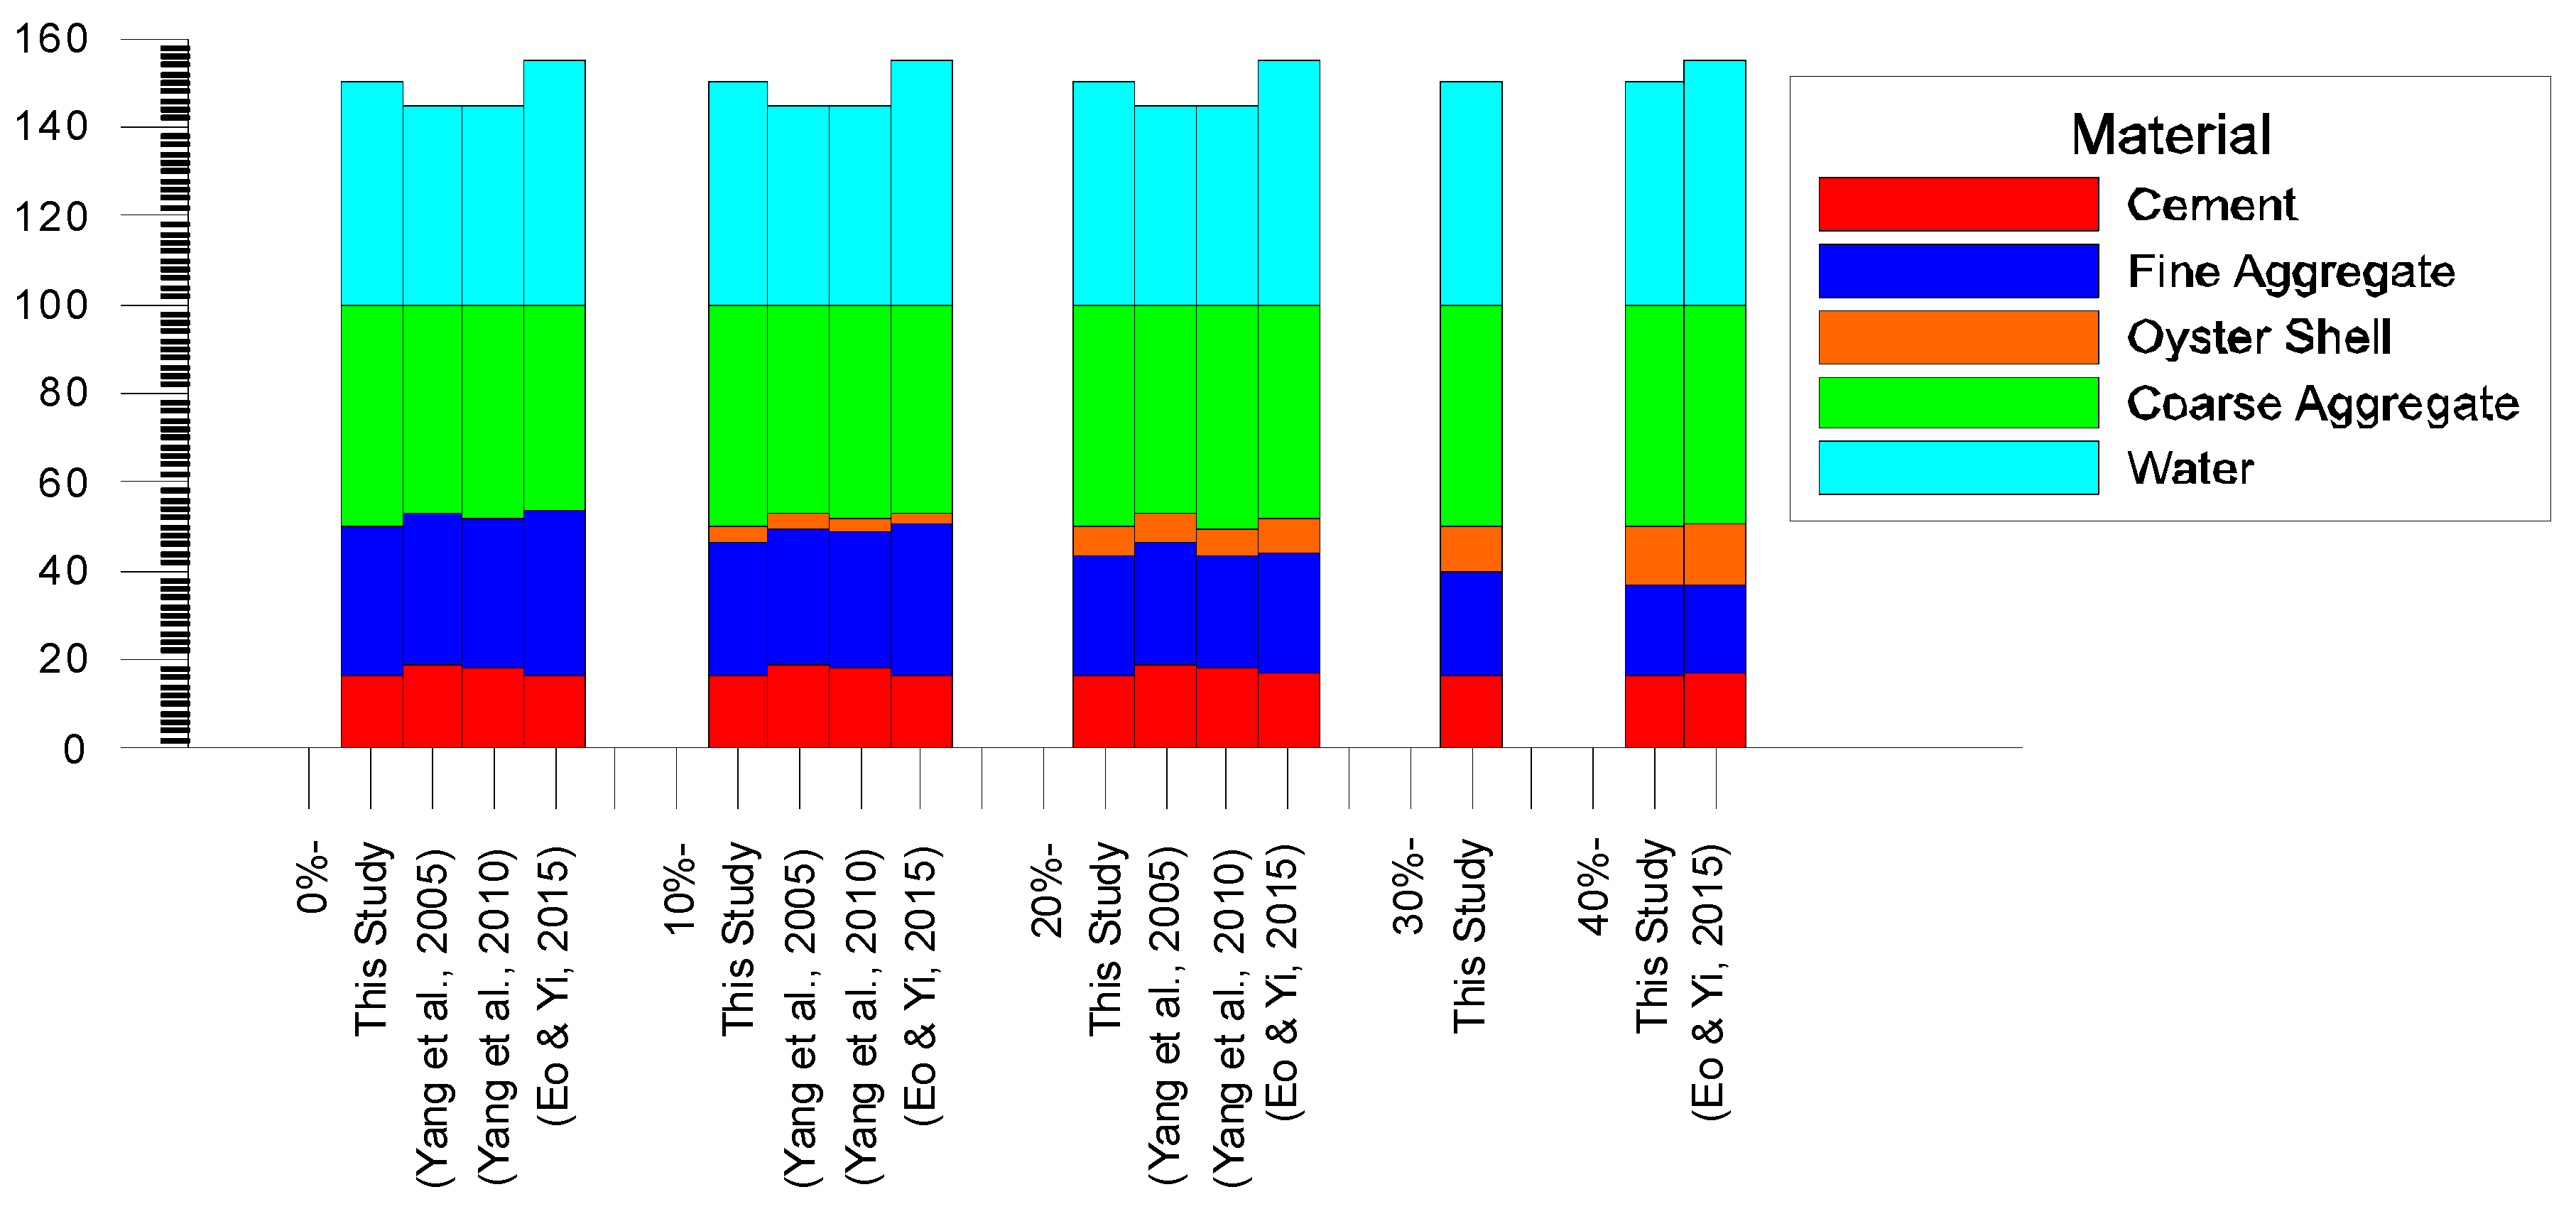
Figure 11.
Sieve With Sieve Shaker.
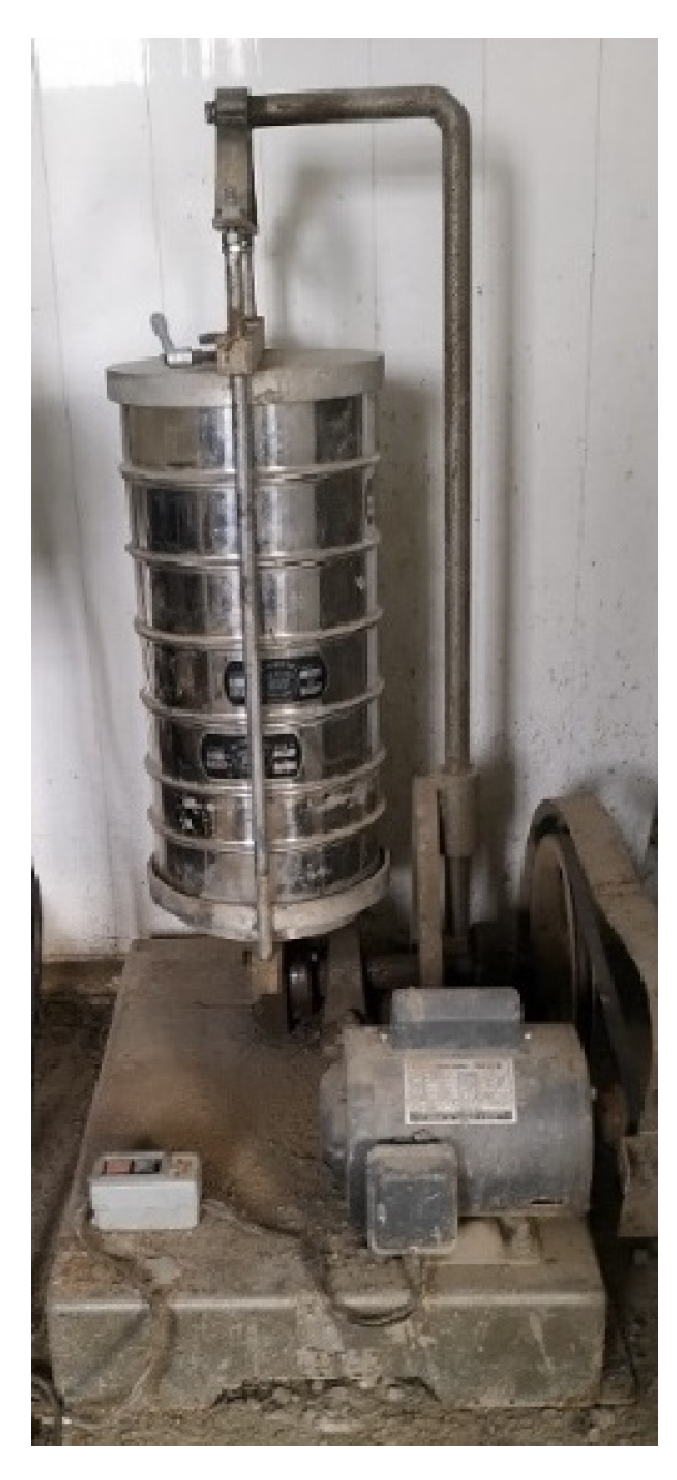
Figure 12.
Oyster Shell Grain Size Analysis.
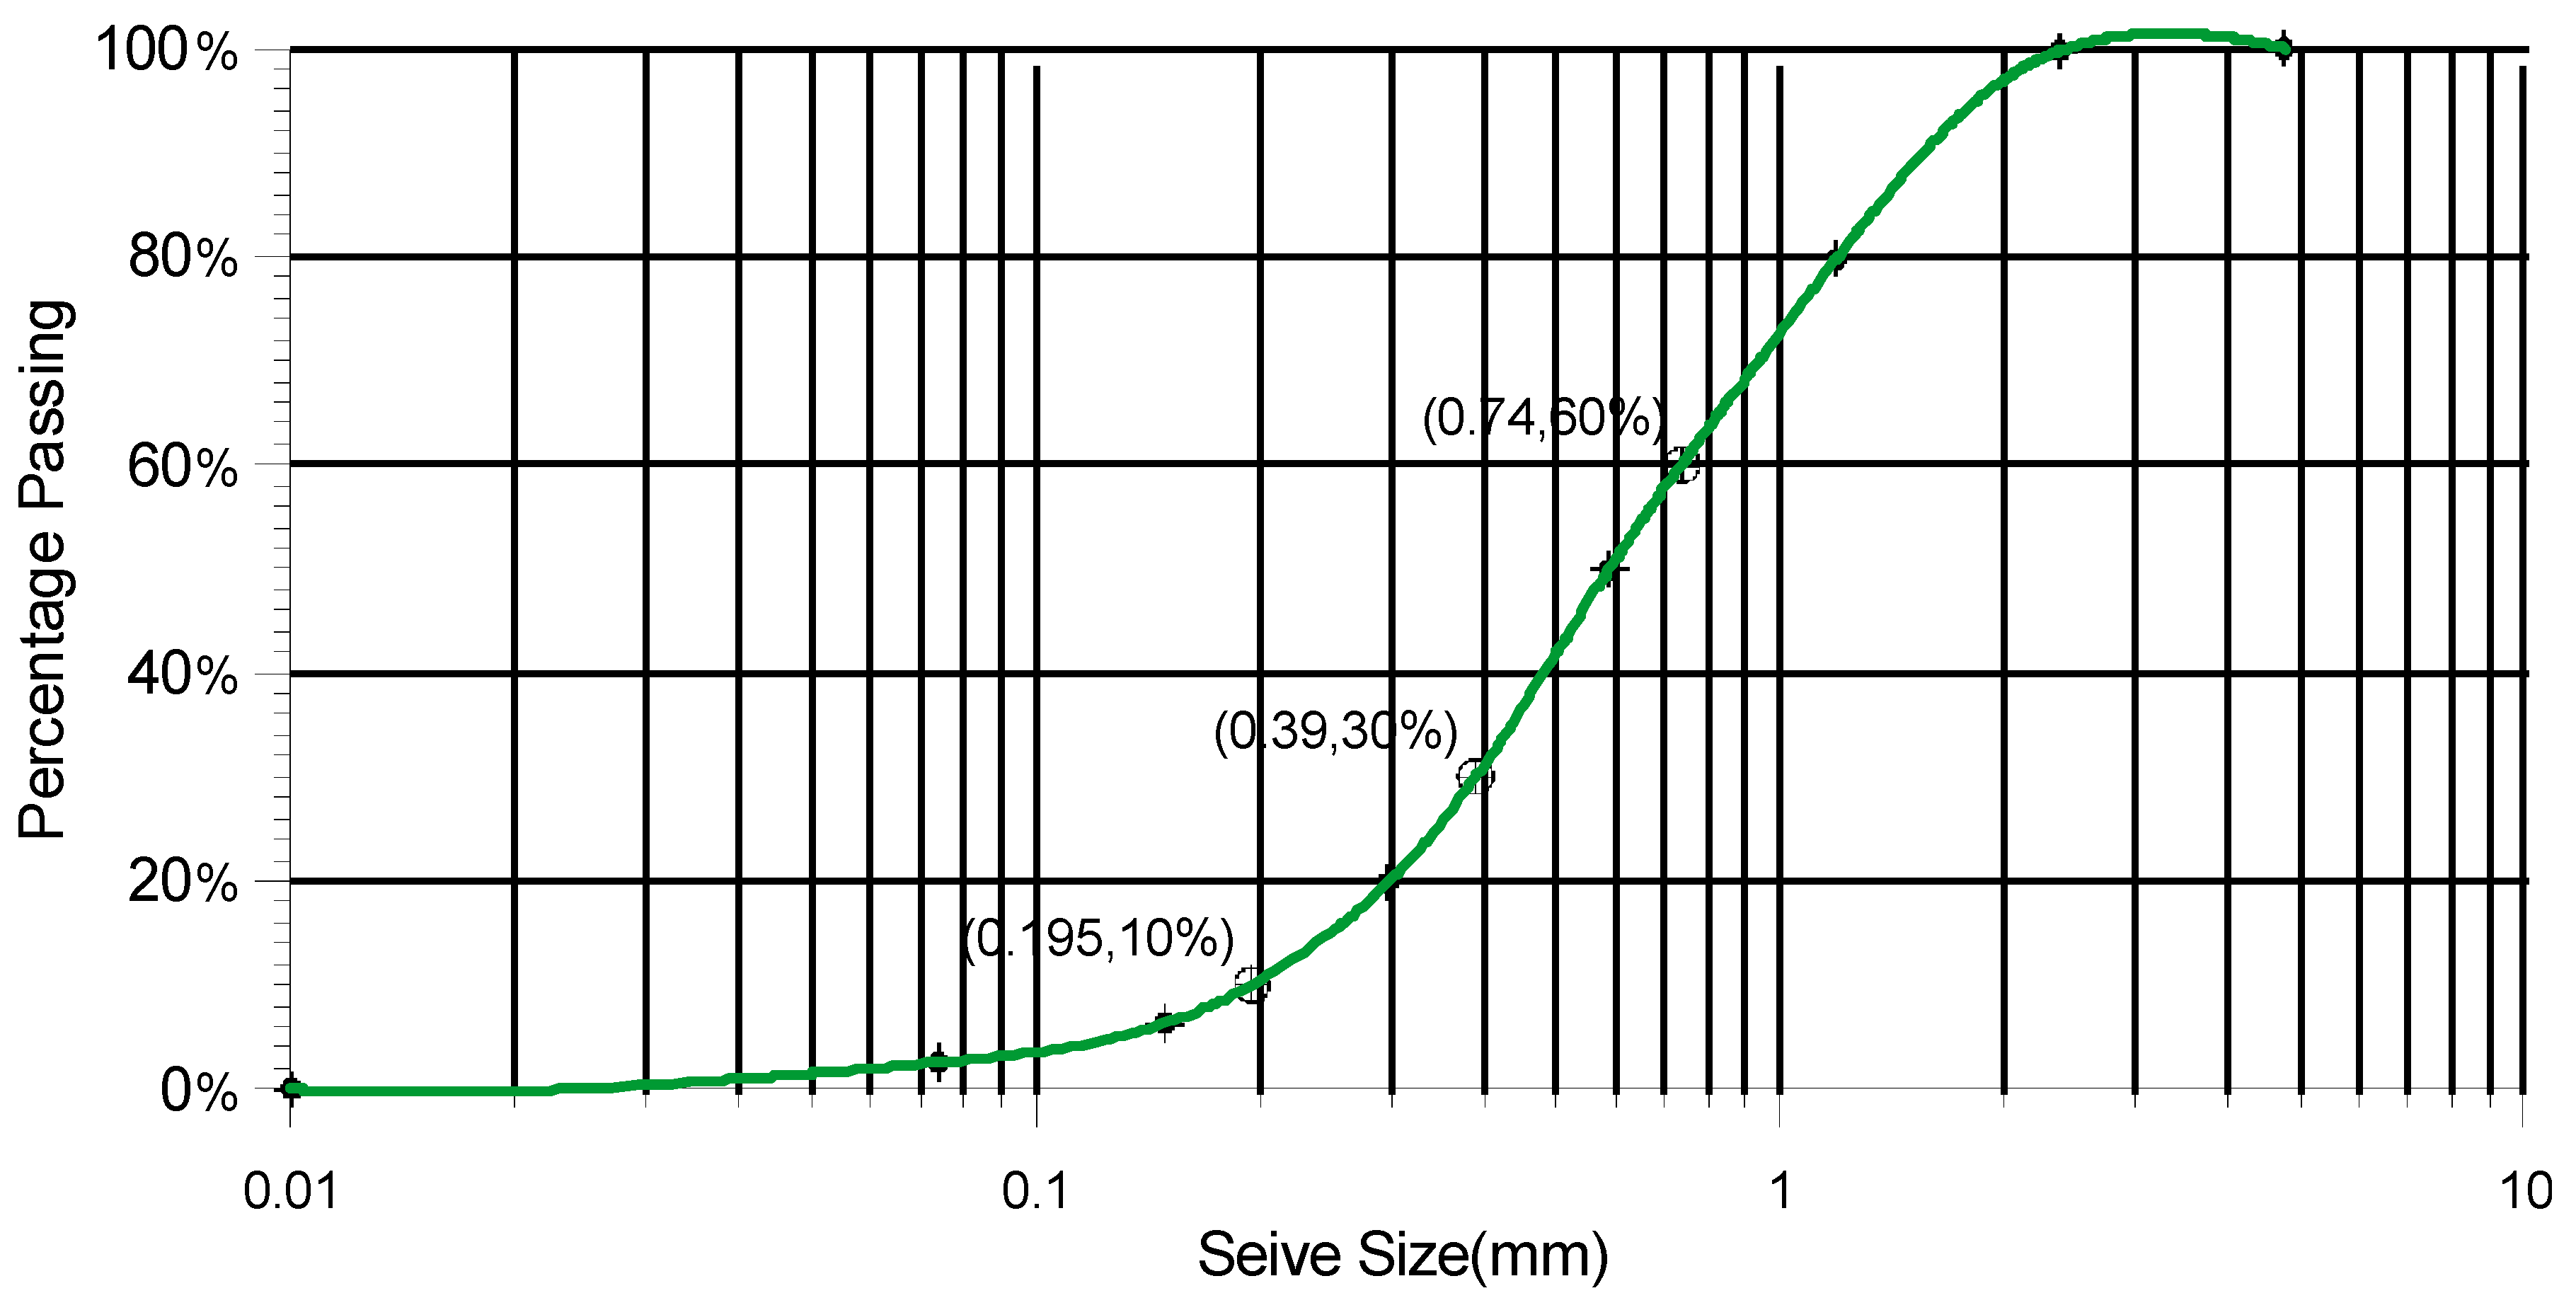
Figure 13.
Fine Aggregate grain size analysis.
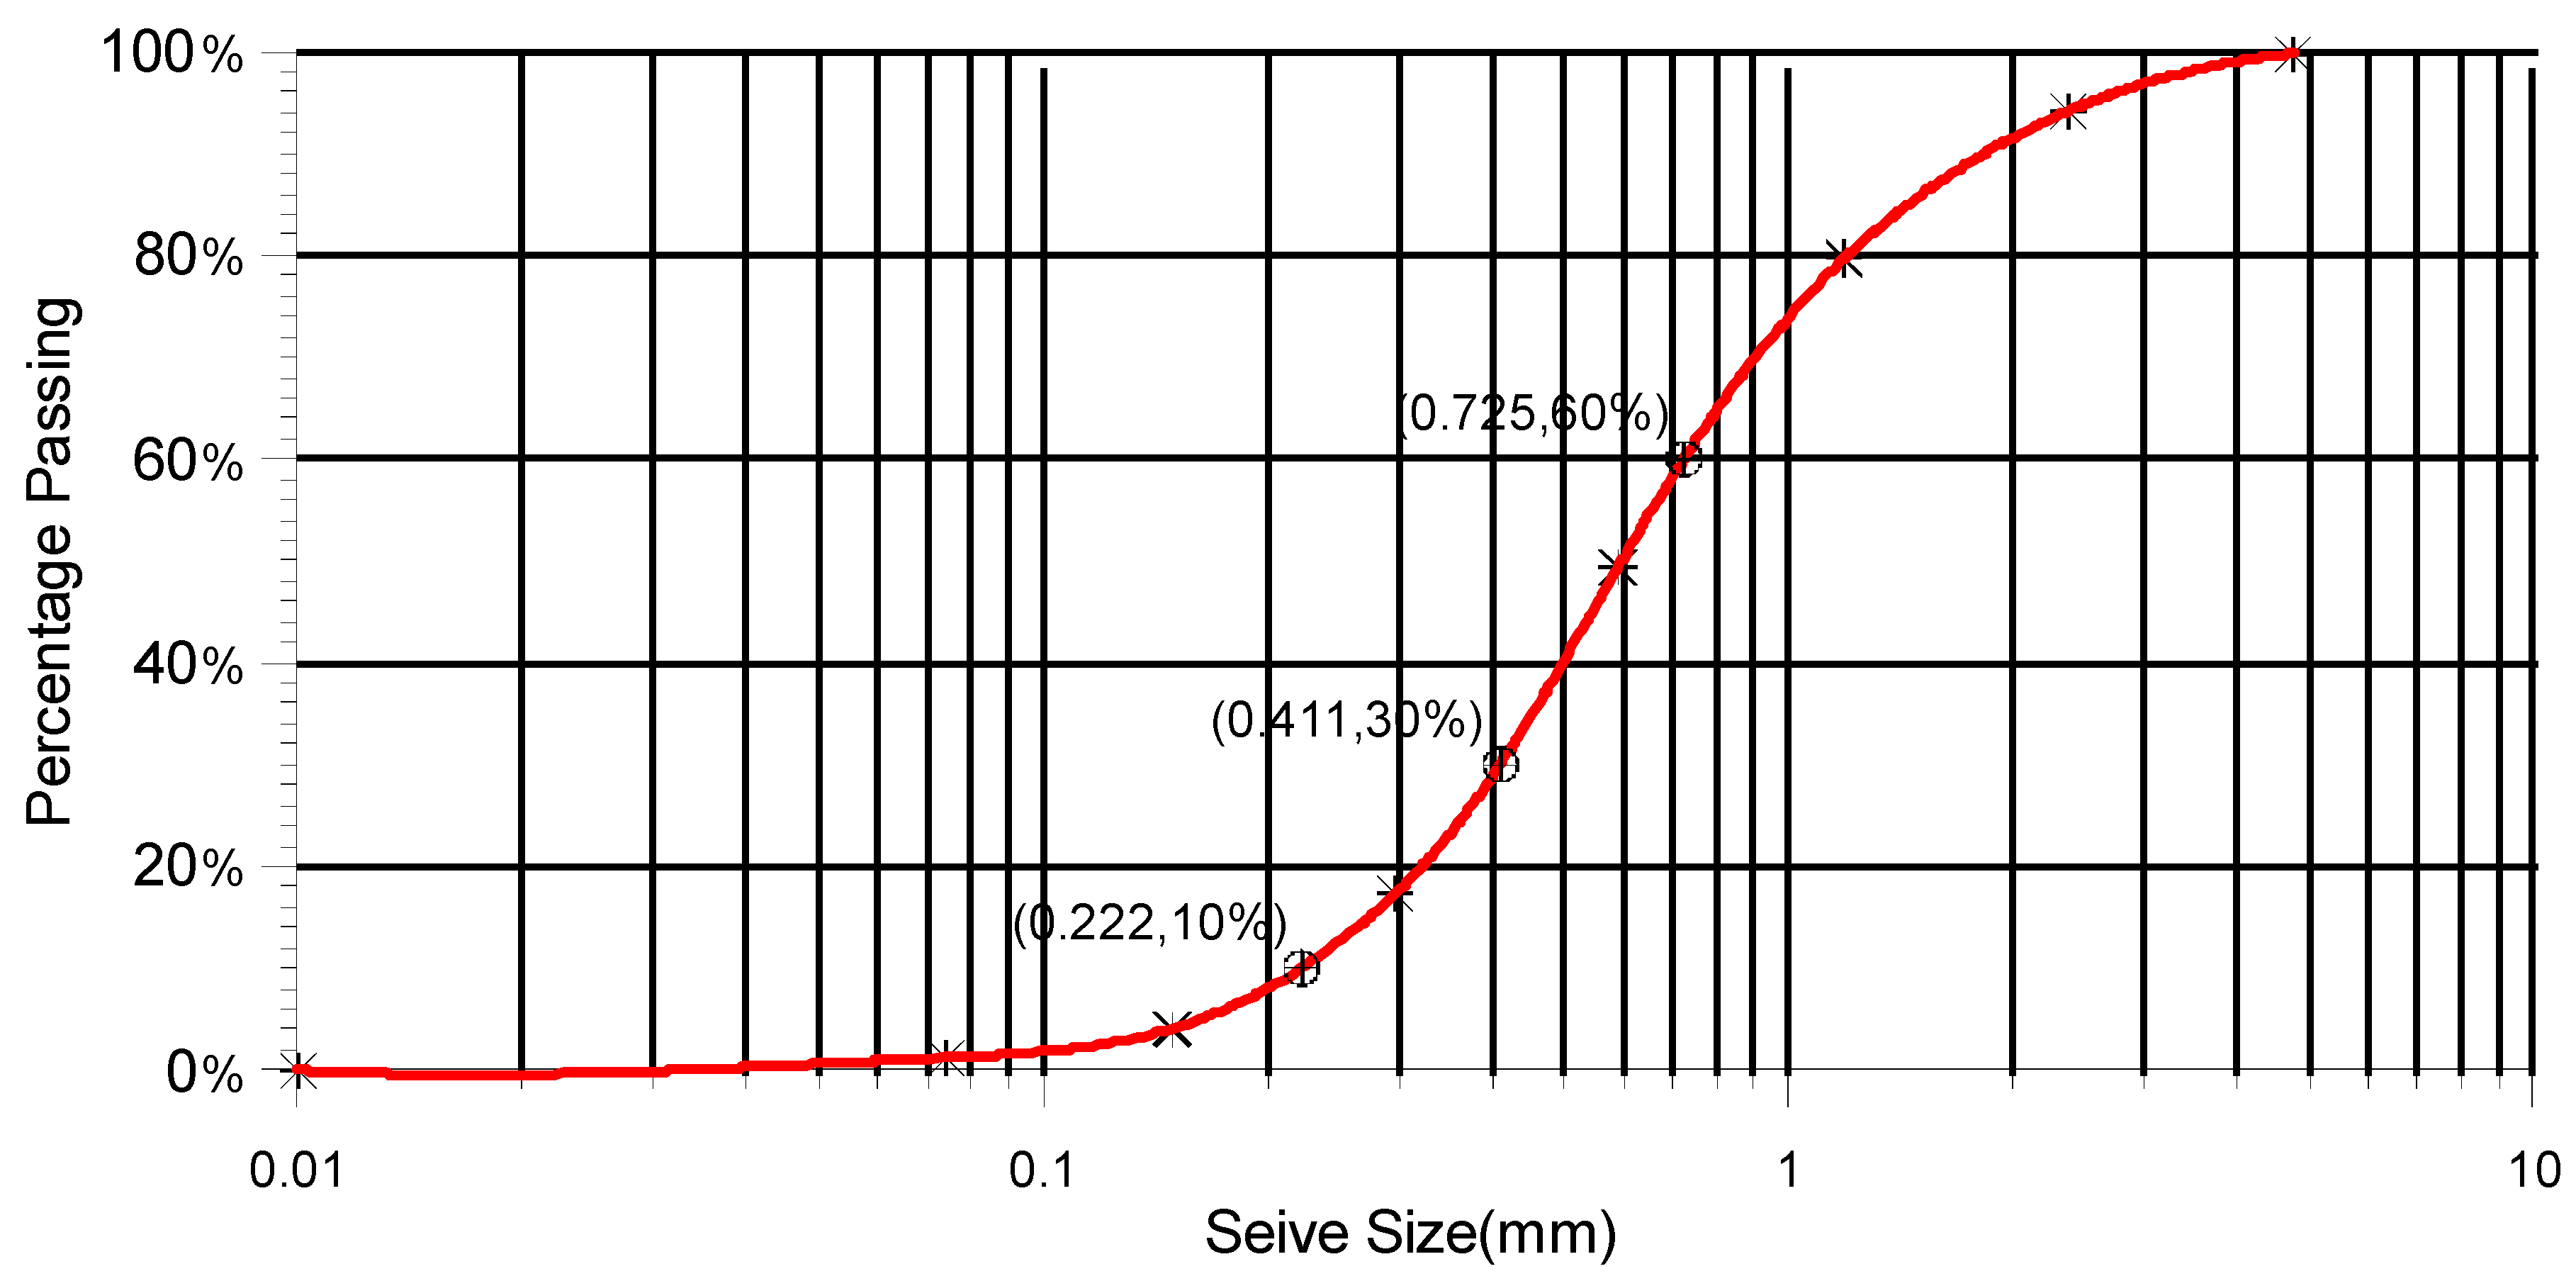
Figure 14.
Effect of OS. Replacement on Density of Concrete.
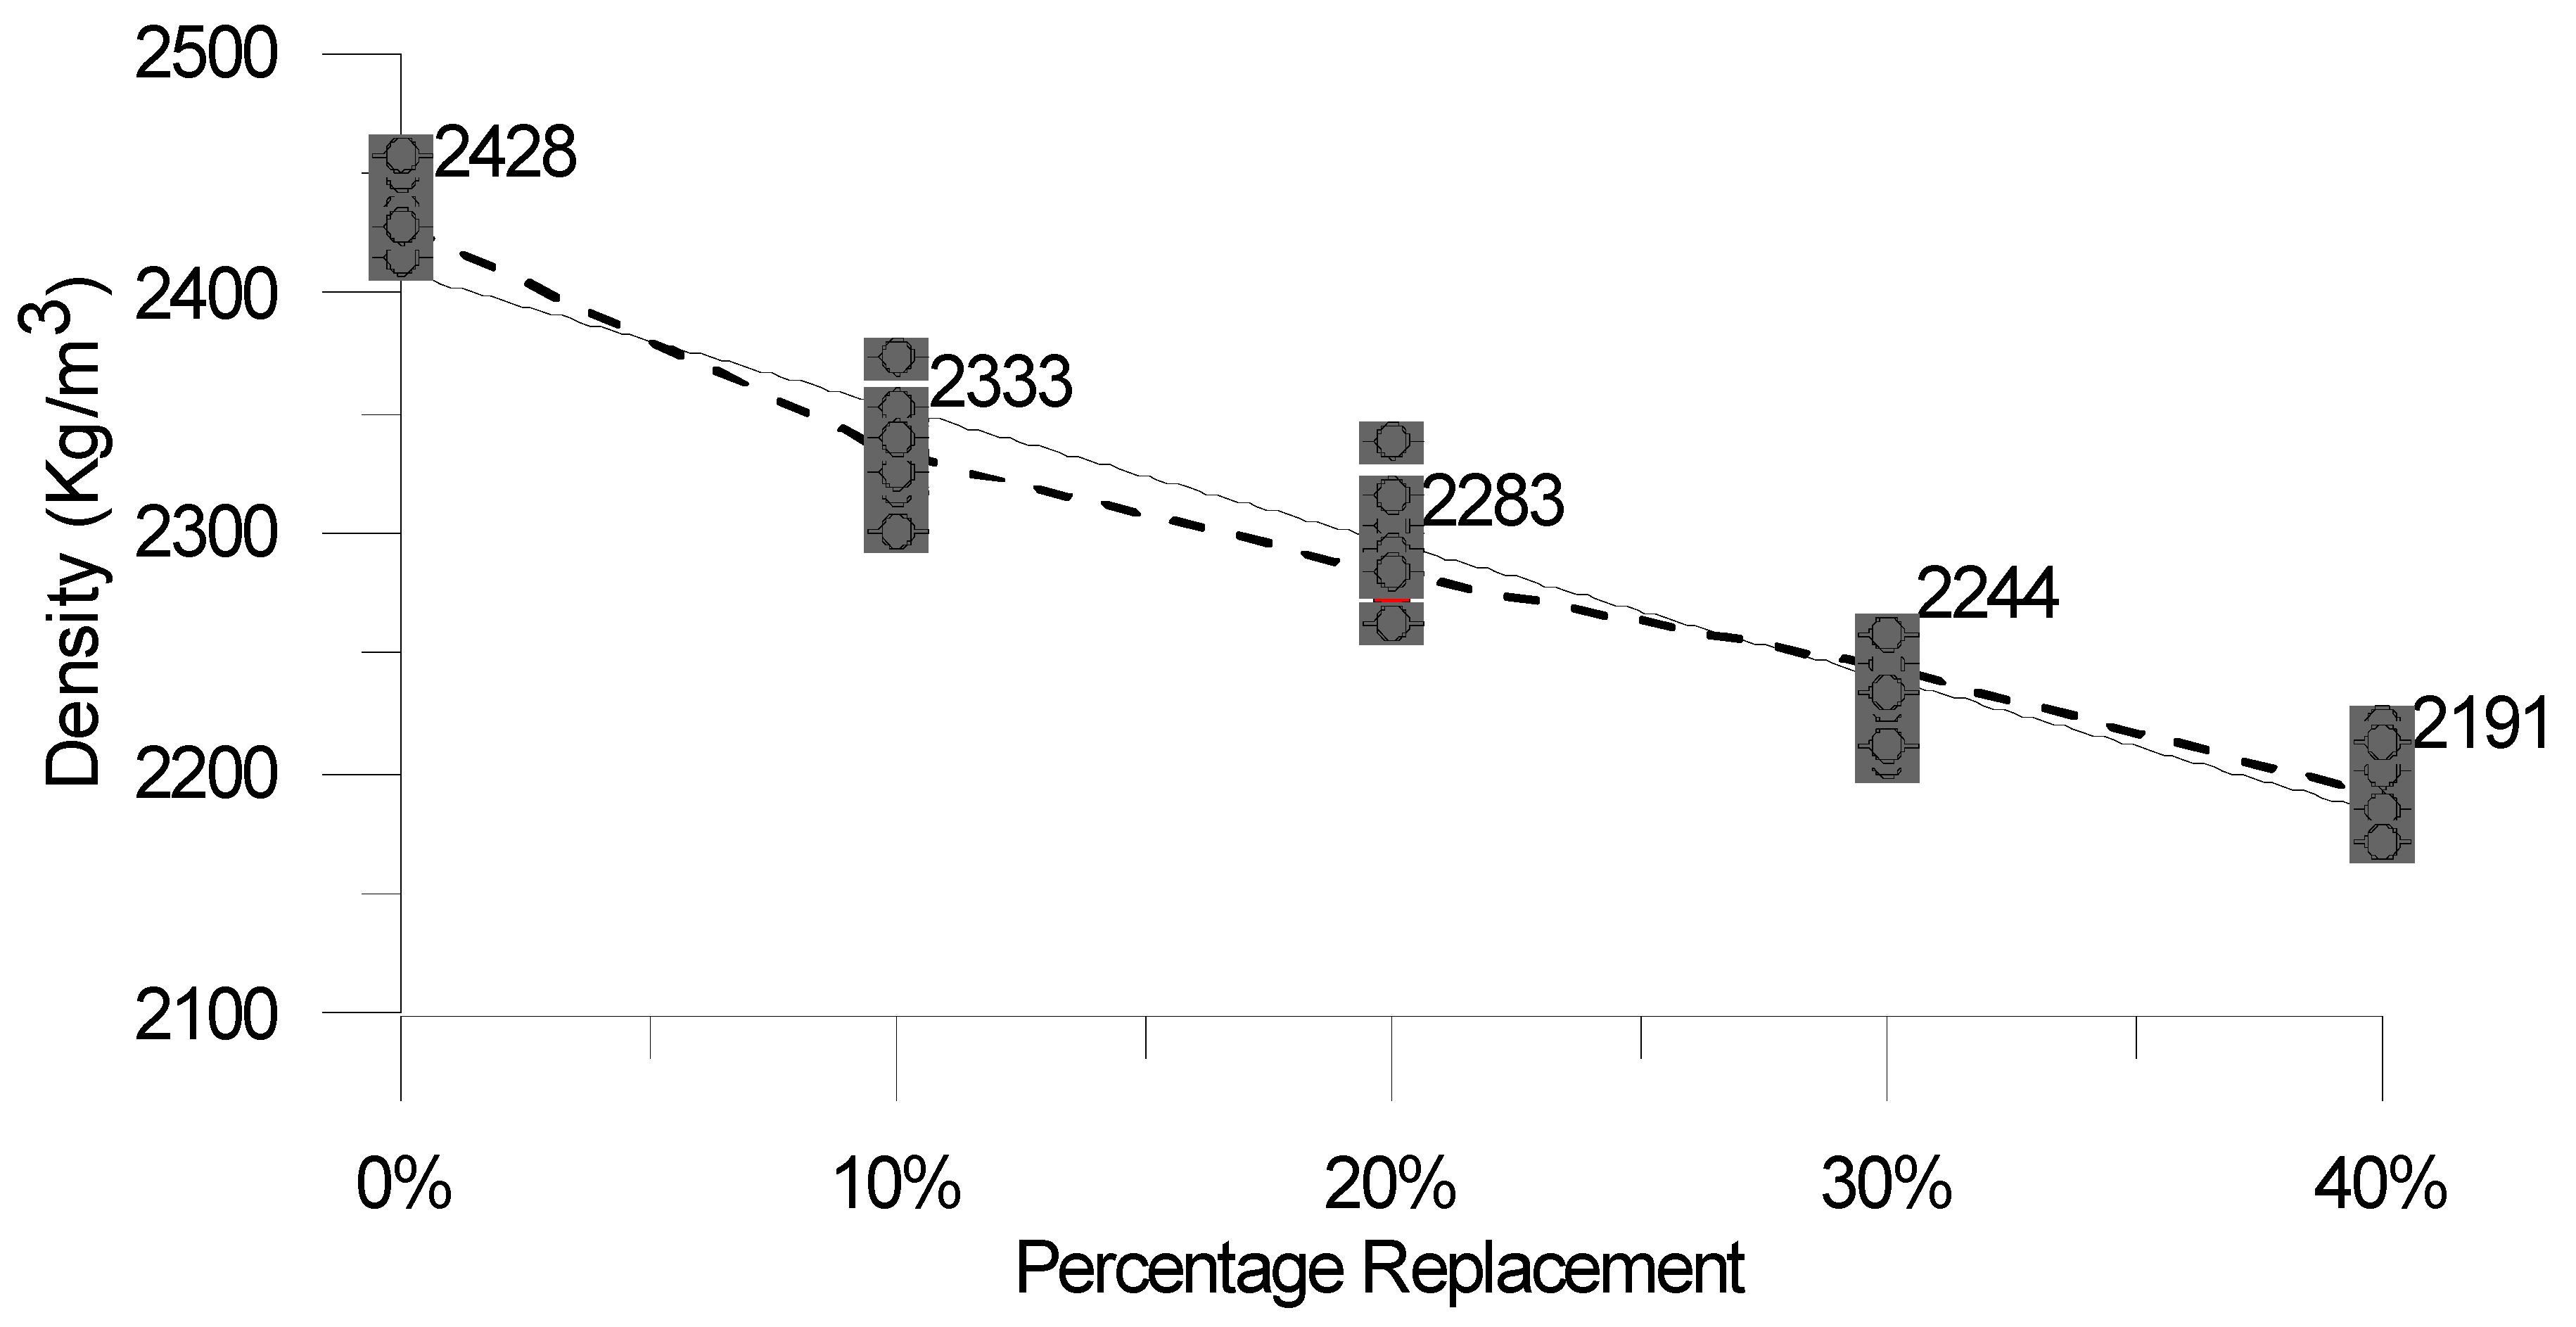
Figure 15.
Effect of Oyster Shell Replacement on Compressive Strength of Concrete.
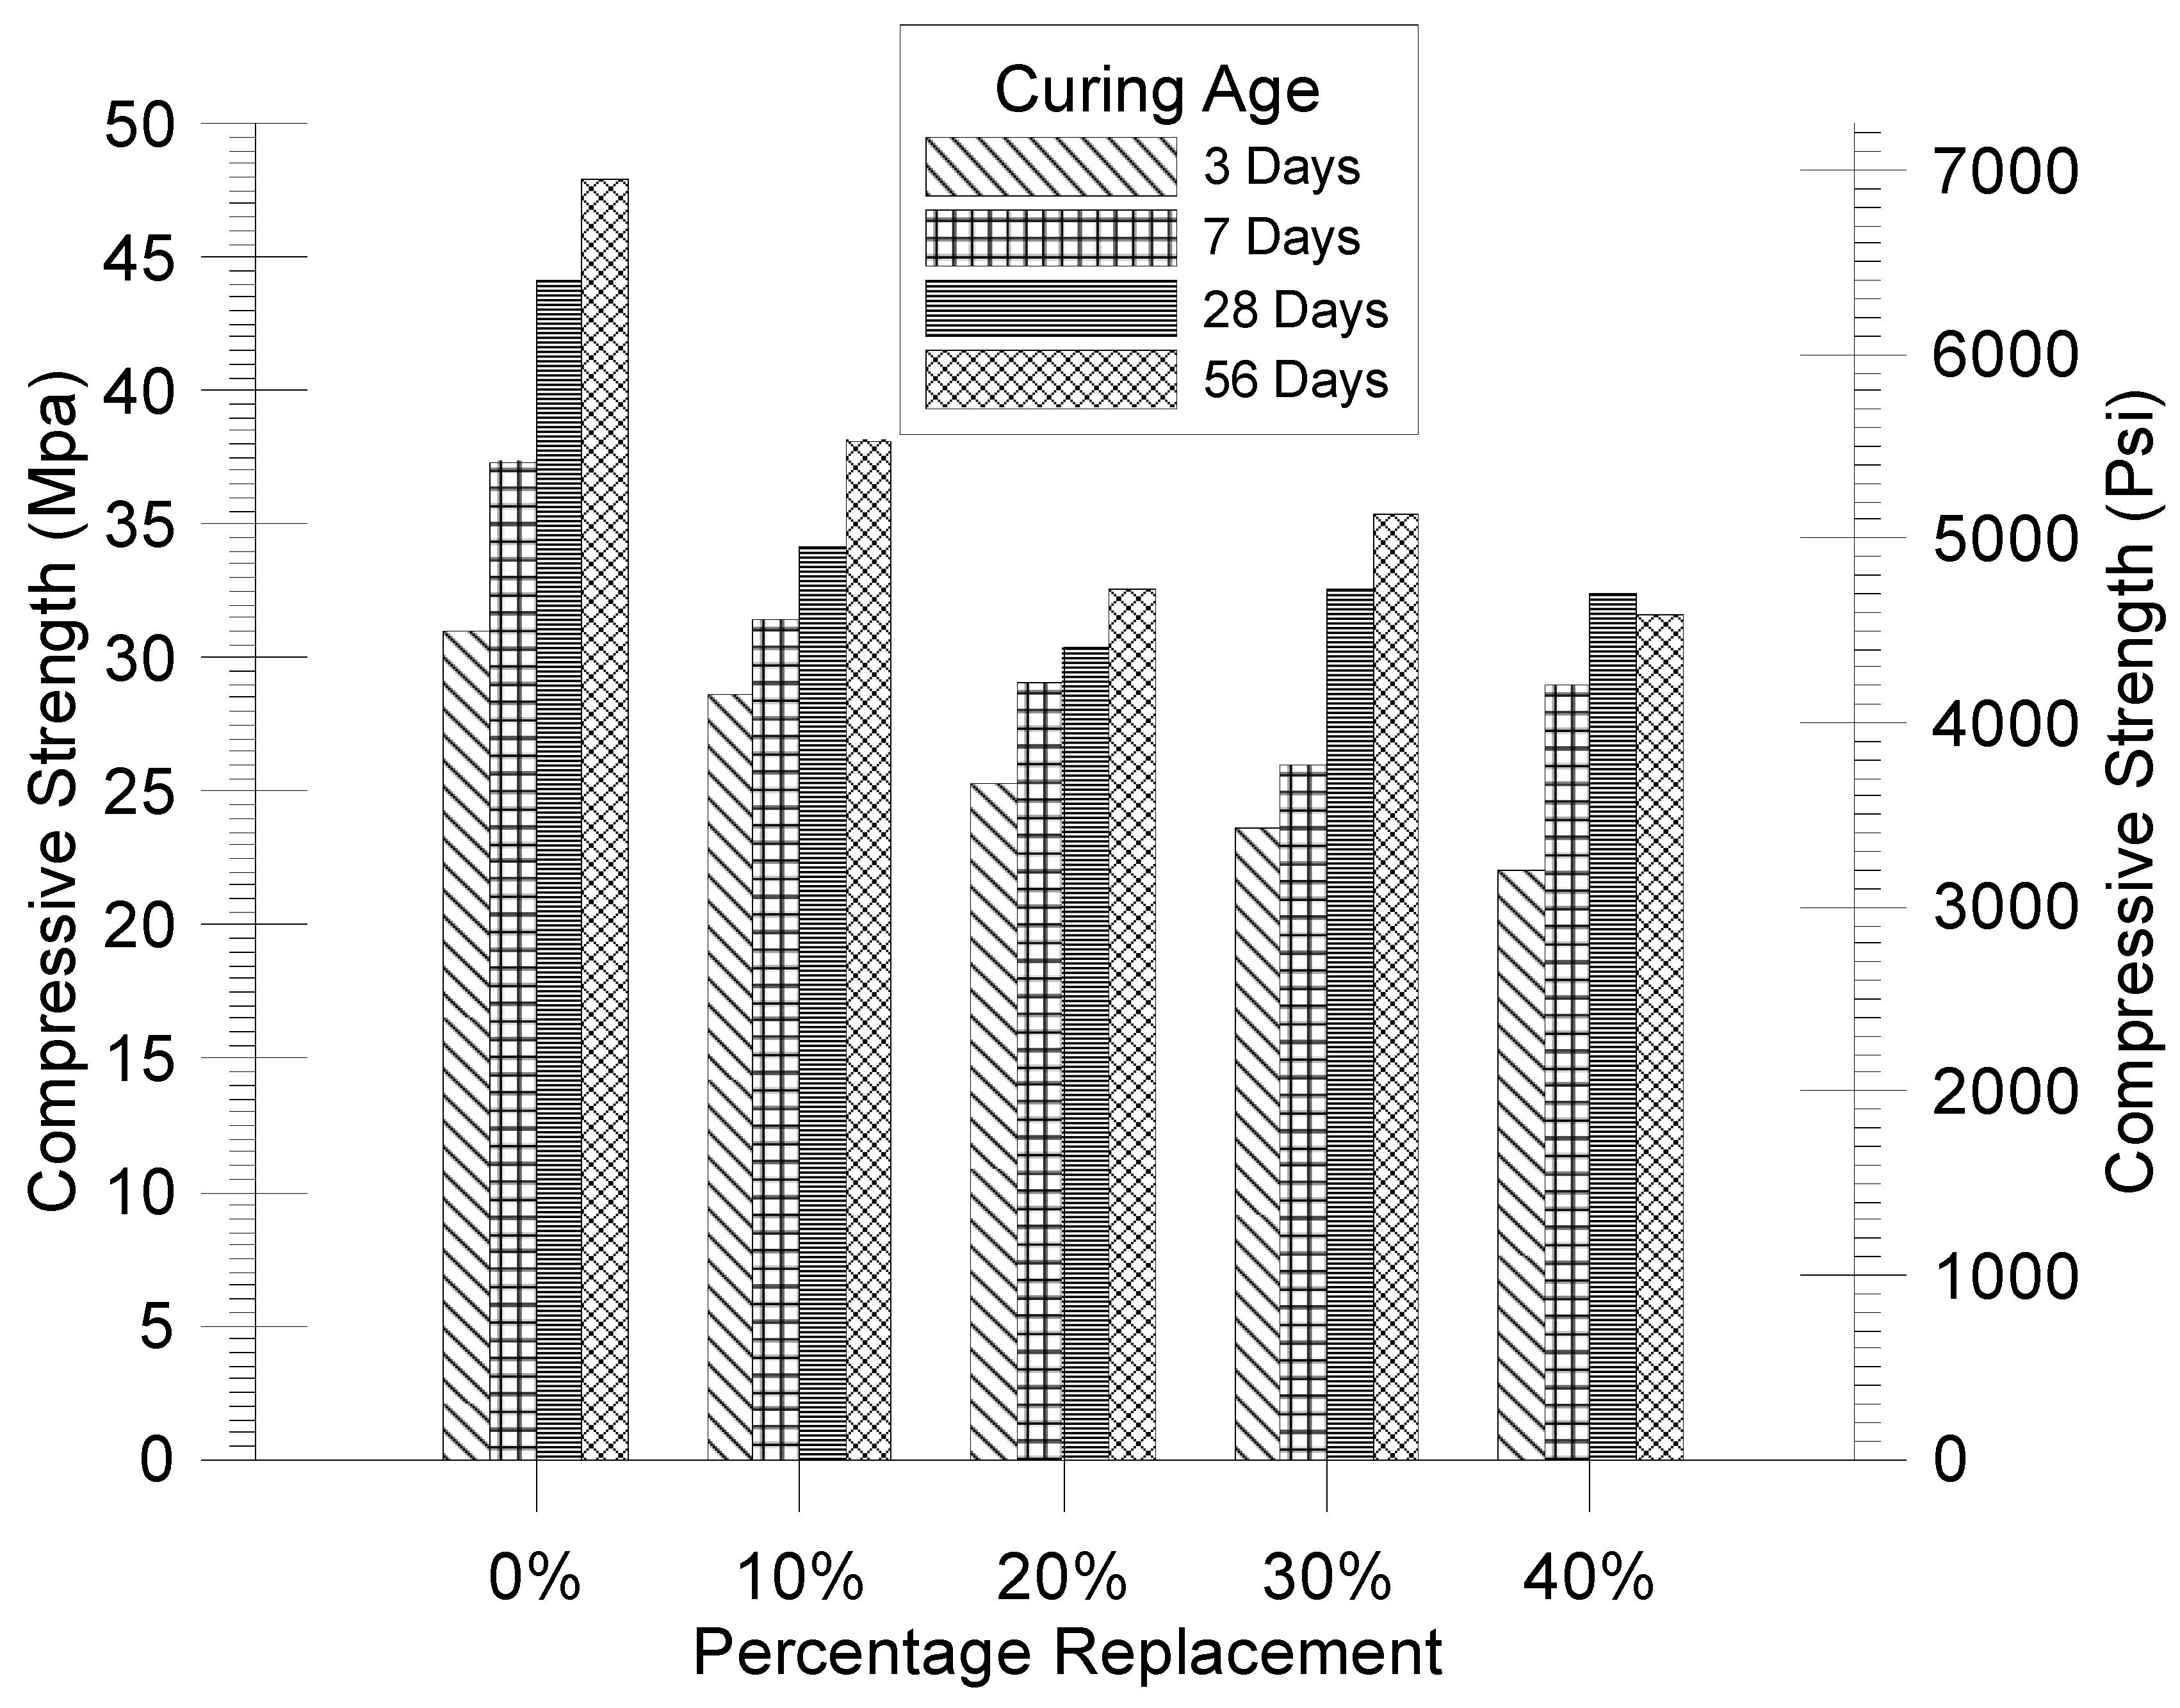
Table 1.
FINE AGGREGATES Grain Size Limit (ASTM-C33-18, 2018).
| Sieve | % Passing |
|---|---|
| 9.5-mm (3 ⁄ 8-in.) | 100 |
| 4.75-mm (No. 4) | 95 to 100 |
| 2.36-mm (No.8) | 80 to 100 |
| 1.18-mm (No.16) | 50 to 85 |
| 600-μm (No.30) | 25 to 60 |
| 300-μm (No.50) | 5 to 30 |
| 150-μm (No.100) | 0 to 10 |
Table 2.
Chemical Ingredient Results of oyster shell (%).
| Reference | Components(%) | |||||||
|---|---|---|---|---|---|---|---|---|
| CaCO3 | SiO2 | MgO | Al2O3 | SrO | P2O5 | Na2O | SO3 | |
| Yoon et al. (2003a) | 95.994 | 0.696 | 0.649 | 0.419 | 0.33 | 0.204 | 0.984 | 0.724 |
| Lee et al. (2008) | 95.9 | 0.69 | 0.65 | 0.42 | - | 0.2 | 0.98 | - |
| Eo & Yi (2015) | 97.244 | 0.428 | 0.482 | 0.449 | 0.198 | 0.179 | 0.539 | 0.479 |
Table 3.
Chemical Ingredient Results of oyster shell Ash (%).
| Reference | Component (%) | ||||||||||||
|---|---|---|---|---|---|---|---|---|---|---|---|---|---|
| CaO | SiO2 | MgO | Al2O3 | SrO | P2O5 | Na2O | SO3 | Fe2O3 | K2O | TiO2 | Mn2O3 | *Ig. Loss | |
| Yang et al. (2005) | 51.06 | 2 | 0.51 | 0.50 | 0.09 | 0.18 | 0.58 | 0.60 | 0.20 | 0.06 | 0.02 | 0.02 | 44.16 |
| Yoon, et al. (2004) | 52.94 | 0.62 | 0.78 | - | - | 0.17 | 0.93 | - | 0.32 | 0.03 | 0.01 | - | 44.02 |
| Etuk et al. (2012) | 57.95 | 13.41 | 0.19 | 4.95 | - | 0.01 | 0.22 | 0.12 | 3.80 | 0.02 | 0.01 | 0.01 | 18.60 |
| Bunyamin & Mukhlis (2020) | 51.56 | 1.60 | 1.43 | 0.92 | - | - | 0.08 | 0.06 | - | 42.15 | |||
* includes CO2, H2O and organic materials lost due to heating.
Table 4.
Concrete Design Mix.
| OS. Replacement with Sand | W/C Ratio | Mix Percentage | ||||
|---|---|---|---|---|---|---|
| Cement | FINE AGGREGATE | 10 mm Aggregate | 20 mm Aggregate | OS. | ||
| 0% | 0.5 | 16.67% | 33.33% | 25.00% | 25.00% | 0.00% |
| 10% | 0.5 | 16.67% | 30.00% | 25.00% | 25.00% | 3.33% |
| 20% | 0.5 | 16.67% | 26.67% | 25.00% | 25.00% | 6.67% |
| 30% | 0.5 | 16.67% | 23.33% | 25.00% | 25.00% | 10.00% |
| 40% | 0.5 | 16.67% | 20.00% | 25.00% | 25.00% | 13.33% |
Table 5.
Cement Compressive strength.
| Age Of Mortar | Compressive Strength (Kg/cm2) | Compressive Strength (Mpa) |
|---|---|---|
| 3 Days | 255 | 25.01 |
| 7 Days | 362 | 35.50 |
| 28 Days | 460 | 45.11 |
Table 6.
Specific gravity (S.G) of Oyster Shell used in different studies.
| Author | S. G | Country | Remark |
|---|---|---|---|
| (Eo & Yi, 2015) | 2.66 | South Korea | Substitution In Concrete |
| (Yang et al., 2010) | 2.48 | South Korea | |
| (Yang et al., 2005) | 2.39 | South Korea | |
| (Lertwattanaruk et al., 2012) | 2.65 | Thailand | Substitution In Mortar |
| (N. D. Binag, 2016) | 3.09 | Philippines | |
| (G.-L. Yoon, Kim, Kim, & Han, 2003b) | 2.568 | South Korea | |
| (H. Yoon et al., 2004) | 2.41 | South Korea |
Table 7.
Pycnometer reading for OS. aggregate.
| Description | Sample 1 | Sample 2 | Sample 3 |
|---|---|---|---|
| Weight Of Empty Pycnometer (A1) | 435.5 g | 435.5 g | 435.5 g |
| Weight Of Pycnometer + Sample (A2) | 523.5 g | 463.5 g | 471.5 g |
| Weight Of Pycnometer + Sample + Water(A3) | 1503 g | 1470.5 g | 1475 g |
| Weight Of Pycnometer + Water (A4) | 1455.5 g | 1455.5 g | 1455.5 g |
| Specific Gravity | 2.173 | 2.154 | 2.182 |
| Average Specific Gravity | 2.17 | ||
Table 8.
Oyster shell Grain Size Distribution.
| Sieve No. | Sieve Size (mm) | Percentage Passing | (ASTM-C33-18, 2018) | Percentage Retained |
|---|---|---|---|---|
| No. 4 | 4.75 | 100.00% | 95 – 100 % | 0.00% |
| No. 8 | 2.36 | 99.77% | 80 – 100 % | 0.23% |
| No. 16 | 1.18 | 79.72% | 50 – 85 % | 20.28% |
| No. 30 | 0.600 | 49.94% | 25 – 60 % | 50.06% |
| No. 50 | 0.300 | 19.82% | 5 – 30 % | 80.18% |
| No. 100 | 0.150 | 6.28% | 0 – 10% | 93.72% |
| No. 200 | 0.074 | 2.54% | 97.46% | |
| Collector | Collector | 0.00% | 100.00% |
Table 9.
Pycnometer Reading For Fine Aggregate.
| Description | Sample 1 | Sample 2 | Sample 3 |
|---|---|---|---|
| Weight Of Empty Pycnometer (A1) | 435.50 g | 435.50 g | 435.50 g |
| Weight Of Pycnometer + Sample (A2) | 638.50 g | 611.00 g | 541.50 g |
| Weight Of Pycnometer+Sample+Water(A3) | 1582.00 g | 1565.00 g | 1521.50 g |
| Weight Of Pycnometer + Water (A4) | 1455.50 g | 1455.50 g | 1455.50 g |
| Specific Gravity | 2.654 | 2.659 | 2.650 |
| Average Specific Gravity | 2.654 | ||
Table 10.
Pycnometer Reading For 10mm Aggregate.
| Description | Sample 1 | Sample 2 | Sample 3 |
|---|---|---|---|
| Weight Of Empty Pycnometer (A1) | 435.5g | 435.5g | 435.5g |
| Weight Of Pycnometer + Sample (A2) | 599.0g | 612.0g | 639.5g |
| Weight Of Pycnometer + Sample+Water(A3) | 1559.0g | 1566.5g | 1583.0g |
| Weight Of Pycnometer + Water (A4) | 1455.5g | 1455.5g | 1455.5g |
| Specific Gravity | 2.726 | 2.695 | 2.666 |
| Average Specific Gravity | 2.695 | ||
Table 11.
Pycnometer Reading For 20mm Aggregate.
| Description | Sample 1 | Sample 2 | Sample 3 |
|---|---|---|---|
| Weight Of Empty Pycnometer (A1) | 435.50 g | 435.50 g | 435.50 g |
| Weight Of Pycnometer + Sample (A2) | 638.50 g | 611.00 g | 541.50 g |
| Weight Of Pycnometer+Sample+ Water(A3) | 1582.00 g | 1566.00 g | 1522.16 g |
| Weight Of Pycnometer + Water (A4) | 1455.50 g | 1455.50 g | 1455.50 g |
| Specific Gravity | 2.654 | 2.700 | 2.694 |
| Average Specific Gravity | 2.683 | ||
Table 12.
Fine Aggregate Grain Size Distribution.
| Sieve No. | Sieve Size (mm) | Percentage Passing | (ASTM-C33-18, 2018) | Percentage Retained |
|---|---|---|---|---|
| No. 4 | 4.75 | 99.77% | 95 – 100 % | 0.23% |
| No. 8 | 2.36 | 94.18% | 80 – 100 % | 5.82% |
| No. 16 | 1.18 | 79.68% | 50 – 85 % | 20.32% |
| No. 30 | 0.600 | 49.34% | 25 – 60 % | 50.66% |
| No. 50 | 0.300 | 17.33% | 5 – 30 % | 82.67% |
| No. 100 | 0.150 | 4.09% | 0 – 10% | 95.91% |
| No. 200 | 0.074 | 1.23% | 98.77% | |
| Collector | Collector | 0.00% | 100.00% |
Table 13.
Density of Concrete.
| S.No | 0% | 10% | 20% | 30% | 40% |
|---|---|---|---|---|---|
| 1 | 2448.11 | 2333.72 | 2300.01 | 2241.43 | 2214.17 |
| 2 | 2435.22 | 2300.93 | 2284.35 | 2205.88 | 2174.38 |
| 3 | 2416.80 | 2344.77 | 2303.33 | 2253.77 | 2184.88 |
| 4 | 2420.48 | 2373.69 | 2315.85 | 2211.96 | 2214.17 |
| 5 | 2449.59 | 2318.98 | 2292.46 | 2239.96 | 2174.38 |
| 6 | 2426.01 | 2325.61 | 2338.51 | 2245.48 | 2184.88 |
| 7 | 2414.96 | 2347.35 | 2282.51 | 2258.19 | 2171.62 |
| 8 | 2457.32 | 2352.32 | 2284.17 | 2228.91 | 2220.43 |
| 9 | 2427.85 | 2339.61 | 2262.80 | 2233.88 | 2213.25 |
| 10 | 2450.18 | 2316.96 | 2283.62 | 2250.09 | 2201.46 |
| 11 | 2411.27 | 2317.88 | 2236.46 | 2282.69 | 2141.22 |
| 12 | 2376.27 | 2322.67 | 2213.80 | 2279.01 | 2197.22 |
| Mean | 2427.84 | 2332.88 | 2283.16 | 2244.27 | 2191.01 |
Table 14.
Summary of compressive strength.
| FINE AGGREGATE Replacement with Oyster Shell | Compressive Strength (Mpa) | |||
|---|---|---|---|---|
| 3 Days | 7 Days | 28 Days | 56 Days | |
| 0% | 31.00 | 37.34 | 44.12 | 47.93 |
| 10% | 28.63 | 31.42 | 34.16 | 38.14 |
| 20% | 25.31 | 29.03 | 30.40 | 32.56 |
| 30% | 23.59 | 26.02 | 32.54 | 35.35 |
| 40% | 22.08 | 28.97 | 32.36 | 31.58 |
Table 15.
Compressive Strength of Concrete with Standard deviation.
| FINE AGGREGATE Replacement | Age | Sample 1 | Sample 2 | Sample 3 | Standard Deviation(σ) | Mean | σ/Mean |
|---|---|---|---|---|---|---|---|
| 0% | 3 Days | 32.30 Mpa | 32.41 Mpa | 28.28 Mpa | 2.4 | 31.00 Mpa | 0.076 |
| 4684.73 Psi | 4700.68 Psi | 4101.67 Psi | 341.3 | 4495.69 Psi | 0.076 | ||
| 7 Days | 37.63 Mpa | 37.76 Mpa | 36.64 Mpa | 0.6 | 37.34 Mpa | 0.016 | |
| 5457.78 Psi | 5476.63 Psi | 5314.19 Psi | 88.8 | 5416.20 Psi | 0.016 | ||
| 28 Days | 43.64 Mpa | 46.23 Mpa | 42.49 Mpa | 1.9 | 44.12 Mpa | 0.043 | |
| 6329.46 Psi | 6705.11 Psi | 6162.66 Psi | 277.8 | 6399.08 Psi | 0.043 | ||
| 56 Days | 49.89 Mpa | 46.61 Mpa | 47.29 Mpa | 1.7 | 47.93 Mpa | 0.036 | |
| 7235.95 Psi | 6760.22 Psi | 6858.85 Psi | 251.1 | 6951.67 Psi | 0.036 | ||
| 10% | 3 Days | 29.46 Mpa | 27.79 Mpa | 28.64 Mpa | 0.8 | 28.63 Mpa | 0.029 |
| 4272.82 Psi | 4030.61 Psi | 4153.89 Psi | 121.1 | 4152.44 Psi | 0.029 | ||
| 7 Days | 32.03 Mpa | 31.21 Mpa | 31.03 Mpa | 0.5 | 31.42 Mpa | 0.017 | |
| 4645.57 Psi | 4526.64 Psi | 4500.53 Psi | 77.3 | 4557.58 Psi | 0.017 | ||
| 28 Days | 31.08 Mpa | 35.67 Mpa | 35.75 Mpa | 2.7 | 34.17 Mpa | 0.078 | |
| 4507.78 Psi | 5173.51 Psi | 5185.11 Psi | 387.7 | 4955.47 Psi | 0.078 | ||
| 56 Days | 35.30 Mpa | 38.93 Mpa | 40.18 Mpa | 2.5 | 38.14 Mpa | 0.066 | |
| 5119.84 Psi | 5646.33 Psi | 5827.63 Psi | 367.7 | 5531.27 Psi | 0.066 | ||
| 20% | 3 Days | 27.92 Mpa | 25.35 Mpa | 22.66 Mpa | 2.6 | 25.31 Mpa | 0.104 |
| 4049.46 Psi | 3676.71 Psi | 3286.56 Psi | 381.5 | 3670.91 Psi | 0.104 | ||
| 7 Days | 29.60 Mpa | 31.14 Mpa | 26.36 Mpa | 2.4 | 29.03 Mpa | 0.084 | |
| 4293.12 Psi | 4516.48 Psi | 3823.20 Psi | 353.9 | 4210.94 Psi | 0.084 | ||
| 28 Days | 33.88 Mpa | 29.62 Mpa | 27.69 Mpa | 3.2 | 30.40 Mpa | 0.104 | |
| 4913.89 Psi | 4296.03 Psi | 4016.10 Psi | 459.4 | 4408.67 Psi | 0.104 | ||
| 56 Days | 31.14 Mpa | 32.90 Mpa | 33.66 Mpa | 1.3 | 32.57 Mpa | 0.040 | |
| 4516.48 Psi | 4771.75 Psi | 4881.98 Psi | 187.5 | 4723.40 Psi | 0.040 | ||
| 30% | 3 Days | 24.58 Mpa | 23.92 Mpa | 22.27 Mpa | 1.2 | 23.59 Mpa | 0.050 |
| 3565.03 Psi | 3469.31 Psi | 3230.00 Psi | 172.6 | 3421.45 Psi | 0.050 | ||
| 7 Days | 28.22 Mpa | 25.09 Mpa | 24.74 Mpa | 1.9 | 26.02 Mpa | 0.074 | |
| 4092.97 Psi | 3639.00 Psi | 3588.24 Psi | 277.9 | 3773.41 Psi | 0.074 | ||
| 28 Days | 33.93 Mpa | 32.54 Mpa | 31.17 Mpa | 1.4 | 32.55 Mpa | 0.042 | |
| 4921.14 Psi | 4719.54 Psi | 4520.83 Psi | 200.2 | 4720.50 Psi | 0.042 | ||
| 56 Days | 35.72 Mpa | 35.45 Mpa | 34.90 Mpa | 0.4 | 35.36 Mpa | 0.012 | |
| 5180.76 Psi | 5141.60 Psi | 5061.83 Psi | 60.6 | 5128.06 Psi | 0.012 | ||
| 40% | 3 Days | 22.41 Mpa | 21.80 Mpa | 22.02 Mpa | 0.3 | 22.08 Mpa | 0.014 |
| 3250.30 Psi | 3161.83 Psi | 3193.74 Psi | 44.8 | 3201.96 Psi | 0.014 | ||
| 7 Days | 29.07 Mpa | 28.32 Mpa | 29.52 Mpa | 0.6 | 28.97 Mpa | 0.021 | |
| 4216.25 Psi | 4107.48 Psi | 4281.52 Psi | 87.9 | 4201.75 Psi | 0.021 | ||
| 28 Days | 30.14 Mpa | 34.00 Mpa | 32.95 Mpa | 2.0 | 32.36 Mpa | 0.062 | |
| 4371.45 Psi | 4931.29 Psi | 4779.00 Psi | 289.5 | 4693.91 Psi | 0.062 | ||
| 56 Days | 32.84 Mpa | 31.73 Mpa | 30.18 Mpa | 1.3 | 31.58 Mpa | 0.042 | |
| 4763.05 Psi | 4602.06 Psi | 4377.25 Psi | 193.8 | 4580.78 Psi | 0.042 |
Disclaimer/Publisher’s Note: The statements, opinions and data contained in all publications are solely those of the individual author(s) and contributor(s) and not of MDPI and/or the editor(s). MDPI and/or the editor(s) disclaim responsibility for any injury to people or property resulting from any ideas, methods, instructions or products referred to in the content. |
© 2024 by the authors. Licensee MDPI, Basel, Switzerland. This article is an open access article distributed under the terms and conditions of the Creative Commons Attribution (CC BY) license (http://creativecommons.org/licenses/by/4.0/).
Copyright: This open access article is published under a Creative Commons CC BY 4.0 license, which permit the free download, distribution, and reuse, provided that the author and preprint are cited in any reuse.


