1. Introduction
The continuous spread of the novel coronavirus over the past four years has been driven by successive waves of SARS-CoV-2 mutations. Predicting the generation of new strains and the emergence of multiple macro-lineages remains a significant challenge. A network-based inference approach has been proposed for short- to mid-term predictions [
1]. Given the crucial role of spike protein mutations in the rapid evolution of SARS-CoV-2, deep learning methodologies have been suggested to predict future protein sequences, leveraging Large Language Models [
2,
3,
4,
5]. These models have shown promise in training protein language models for forecasting pandemic-related protein mutations. However, ensuring the continuous incorporation of new experimental data and accurately predicting the future trajectory of macro-lineages remains a critical challenge.
We previously introduced a mathematical model to analyze the dynamics of COVID-19 spread [
6]. Using a reconstructed phylogenetic tree and the A-X model, a statistical approach for generating new strains, we combined a set of existing mutation sites (A) with a set of randomly generated sites (X) to model the emergence of new strains on the phylogenetic tree and explain the patterns of multiple SARS-CoV-2 macro-lineages [
7,
8]. By expanding the stochastic sampling to a larger scale, we uncovered the statistical principles governing the emergence of new strains. Our findings show that the probability of a macro-lineage's emergence is related to the number
x of randomly generated sites within the X set. As
x increases, the proportions of macro-lineages change: lineage O surpasses lineage N, followed by lineage P surpassing lineage O, and ultimately, lineage Q surpassing lineage P. We initially predicted the emergence of macro-lineage P, which has since been observed. Furthermore, we forecasted the emergence of macro-lineage Q when
x reaches a sufficiently large value. These results provide a crucial theoretical framework for understanding the evolution of SARS-CoV-2.
However, the precise timeline of SARS-CoV-2 evolution remains unknown. To predict the future trajectory of macro-lineage P and the emergence of macro-lineage Q, it is essential to understand how the number of mutated sites (NMS) for selected SARS-CoV-2 variants and the accumulated number of mutated sites (ANMS) on the spike protein evolve over time. This is the primary motivation for the present study. Despite the complexity of the various factors influencing viral evolution, we identified an approximate linear relationship between the number of mutated sites for a given variant (i.e., x) and its worldwide first sample collection date (i.e., physical time t). Consequently, this enables us to predict the timeline of macro-lineage transformations. To further enhance our understanding of SARS-CoV-2 evolution, the conditions for establishing this linear relationship and its connection to the A-X model are also discussed in this manuscript.
2. Materials and Methods
2.1. Materials
The SARS-CoV-2 mutants are listed in
Table 1 in chronological order of their worldwide first sample collection dates. The number of mutated sites and the total number of accumulated mutations on the spike protein are also provided. Characteristic mutations for a lineage are defined as nonsynonymous substitutions or deletions occurring in more than 75% of sequences within that lineage. The data are sourced from outbreak.info [
9].
2.2. Methods
The least squares regression analysis is conducted to examine the relationship between the number of mutated sites and the first sample collection date of the variants. In general, for a dependent variable
y and an independent variable
x, with observed values
yi at
x=
xi, the linear regression equation is given by
where
is the predicted value from the model, and
and
are the regression coefficients. The standard error of the prediction
is calculated as
where
is the mean of the
xi values, and
n is the number of samples. The standard error of the slope
is
The standard error of the intercept
is
In equations (2)-(4), the term
s refers to the Residual Standard Error (RSE), also known as the model's sigma, which is defined as
The 95% confidence interval is also used to define a range of parameter estimates that includes the true value with 95% probability. The confidence interval is calculated as
where
, and
t(
α/2,
df) is the critical value from the
t-distribution with a confidence level of
α and degrees of freedom
df. For a 95% confidence interval,
α=5%.
The method is assessed using the R-squared (R2) and the Residual Standard Error (RSE). The model's goodness of fit is indicated by a high R2 (close to 1) and a low RSE.
3. Results
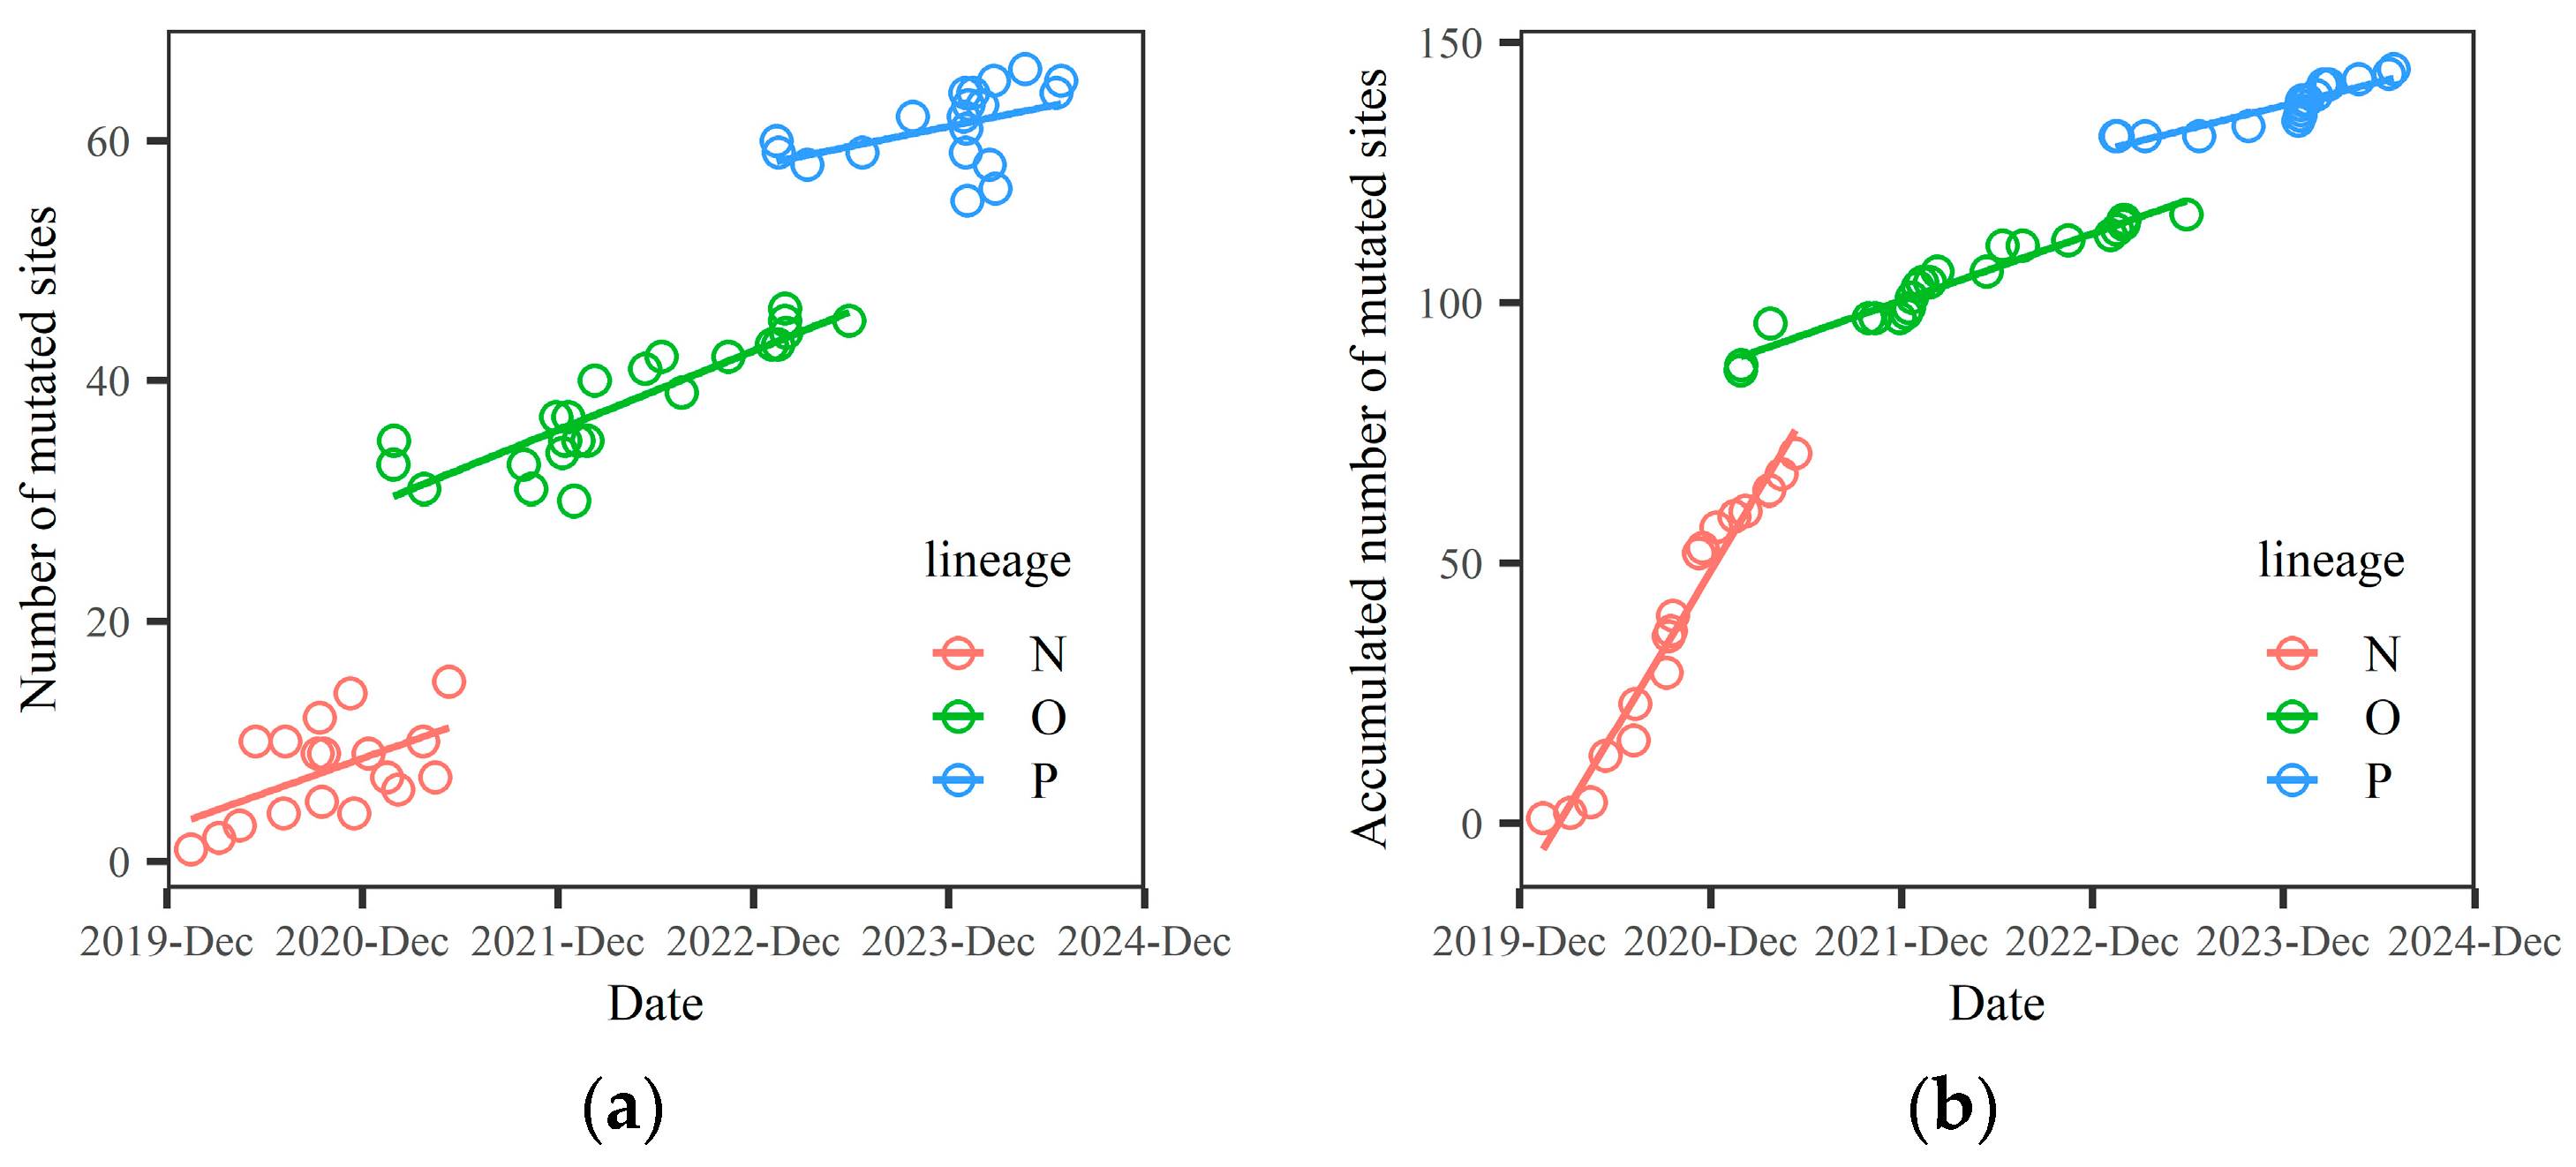
3.1. Each Macro-Lineage Has a Specific Survival Time. The Relationship Between the Number of Mutated Sites and Time t Is a Discontinuous Function
Let the number of mutated sites on the spike protein (NMS) for selected SARS-CoV-2 variants be denoted as
x, where
x is a function of time,
x=
x(
t). The accumulated number of mutated sites on the spike protein (ANMS) at time
t is represented as
s(
t). We found that both
x(
t) and
s(
t) are discontinuous functions of time, corresponding to three macro-lineages, as shown in
Figure 1.
Figure 1 is based on the data presented in
Table 1.
3.2. Linear Regression of the Number of Mutated Sites in a Variant Versus Sample Collection Date as a Good Approximation
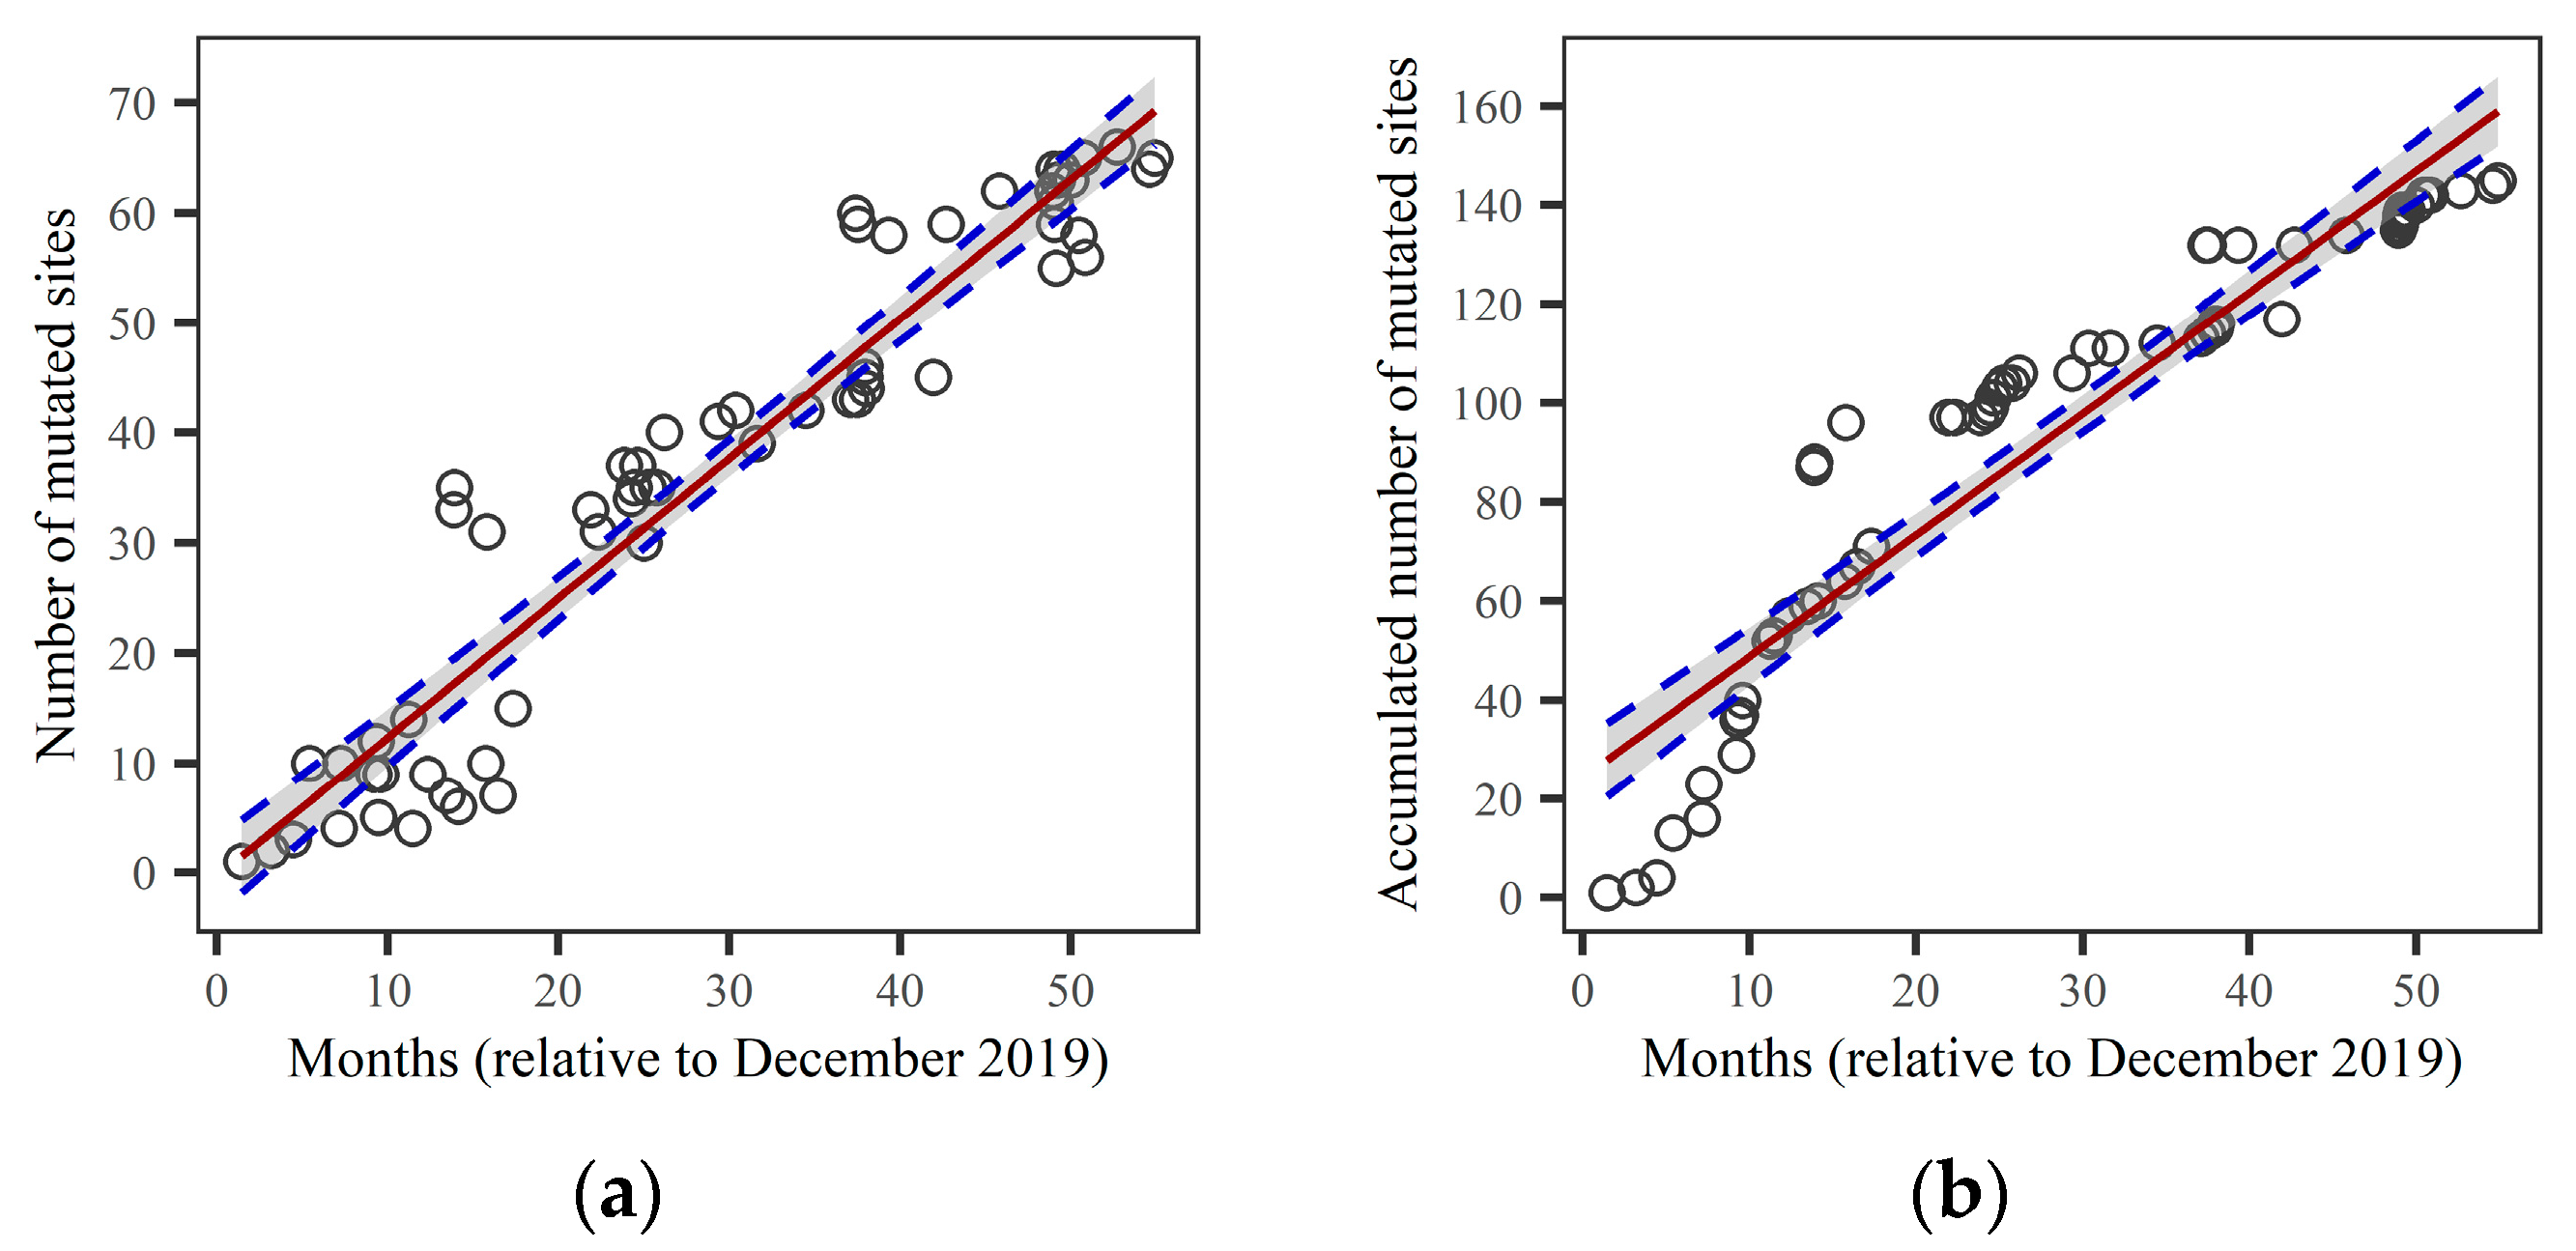
The linear regression of the relationship between the number of mutated sites and the first sample collection date was performed, and the results are shown in
Figure 2. The left panel (
Figure 2a) depicts the evolution of the number of mutated sites (NMS), while the right panel (
Figure 2b) shows the evolution of the accumulated number of mutated sites (ANMS). We found that the linear regression of the number of mutated sites in the variant provides a good approximation of the increasing trend in the number of mutated sites during viral evolution. The R-squared (
R2) and the Residual Standard Error (RSE) for the linear regression of NMS are
R2=0.91 and RSE=6.51, respectively. Furthermore, using Equations (3) and (6), we obtain a slope of the regression line d
x/d
t=1.268 per month, with a 95% confidence interval of ±0.103. For the linear regression of ANMS, the estimate yields
R2=0.88 and RSE=14.66. The slope of the regression line for ANMS is d
s/d
t=2.452 per month, with a 95% confidence interval of ±0.232. Therefore, the linear regression for NMS provides a better fit than for ANMS, and we will use the linear relationship between the number of mutated sites
x and collection time
t to predict the emergence of new lineages.
3.3. Prediction of the Emergence of the Q Macro-Lineage
Building on the studies above, we are able to predict the emergence of the new macro-lineage Q. The emergence of Q was initially forecasted in references [
7,
8], where the A-X model was proposed to generate new strains on the phylogenetic tree. The core concept of the model involves combining set A (existing mutated sites) with set X, which contains
x randomly generated sites, to predict how a novel strain is generated on the tree. By expanding stochastic sampling to a larger scale, statistical laws governing new strain production and the probability of macro-lineage (PML) versus
x can be derived. These analyses were based on data from 36 to 40 mutants. To improve statistical accuracy, we now apply the enlarged dataset of 61 mutants (
Table 1) and the same stochastic sampling method as described in reference [
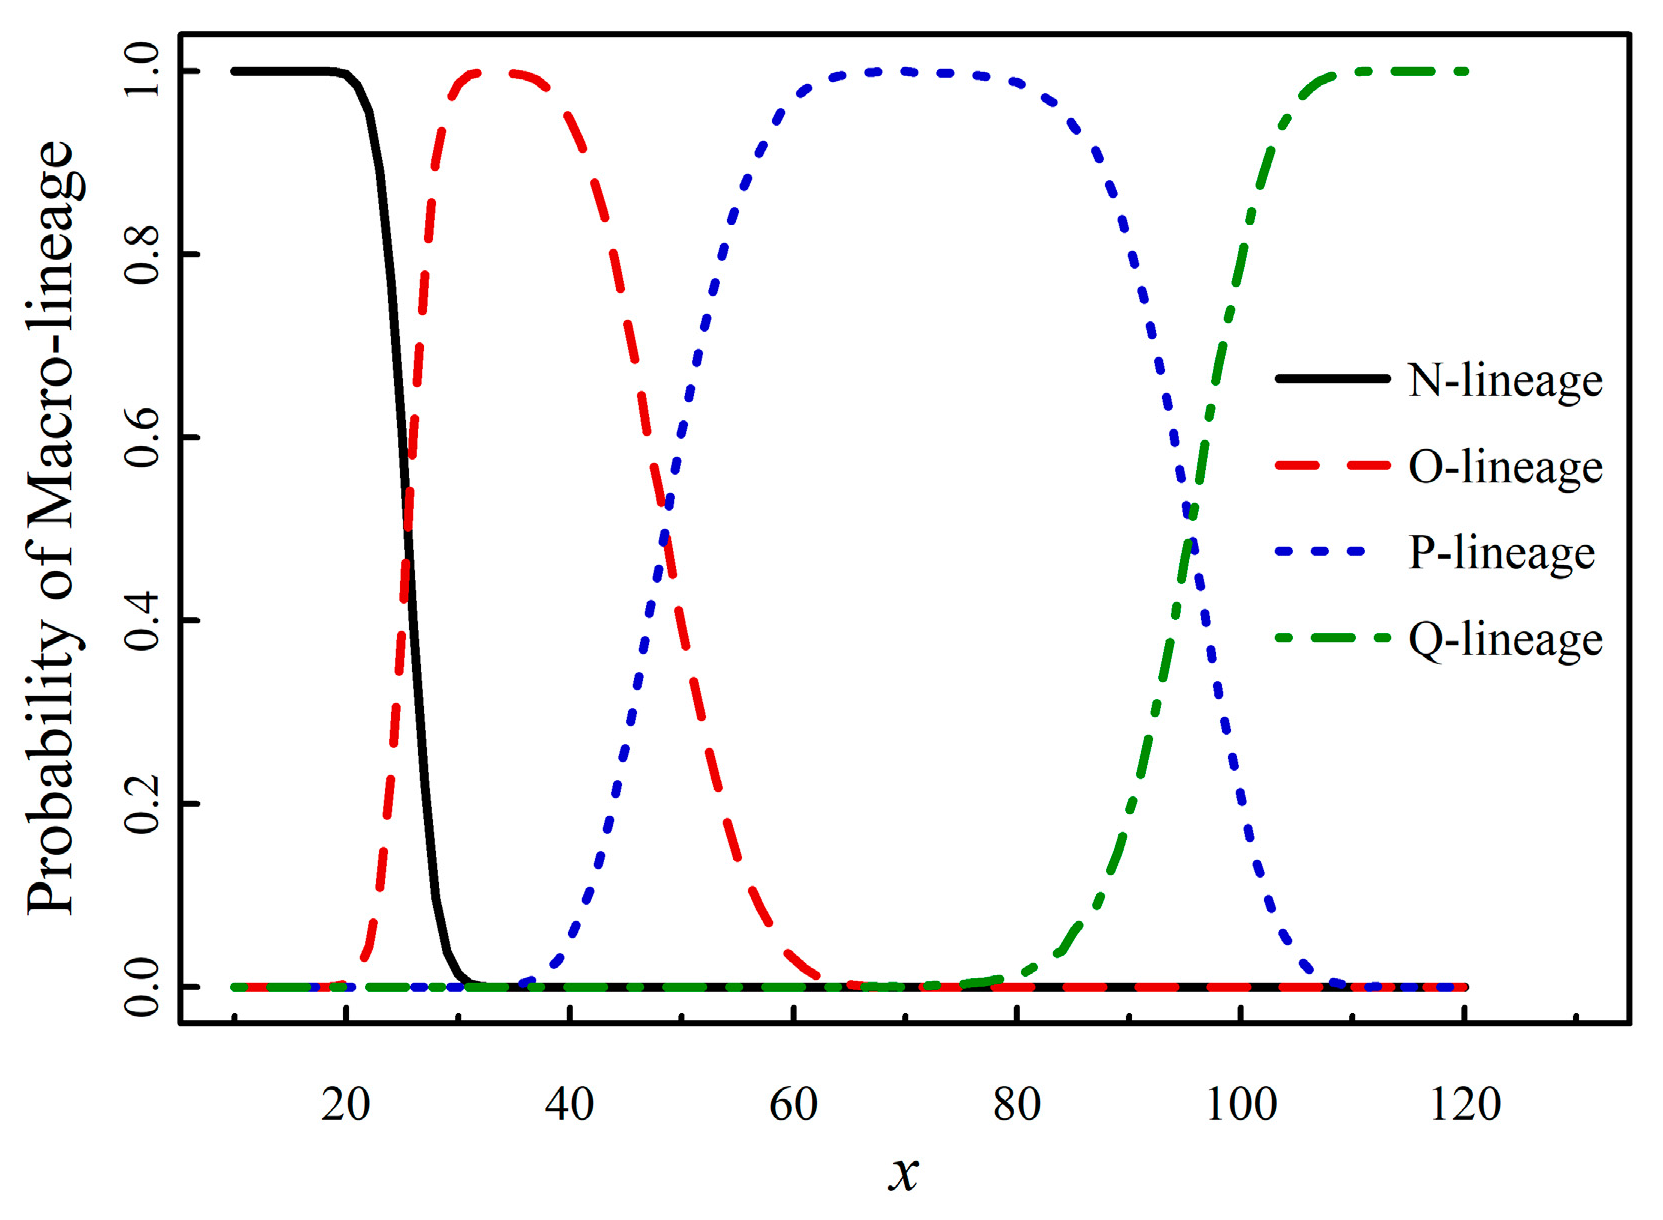
8]. The results of PML versus
x are presented in
Figure 3.
From
Figure 3, the demarcation values (99% percentile) are as follows:
New-mutant N when x ≤ 20; New-mutant N or O when 21 ≤ x ≤ 30; New-mutant O when 31 ≤ x ≤ 37; New-mutant O or P when 38 ≤ x ≤ 62; New-mutant P when 63 ≤ x ≤ 78; New-mutant P or Q when 79 ≤ x ≤ 107; New-mutant Q when x ≥ 108.
Based on Equations (1) (2) and (6), we predict that the number of mutated sites will reach
x=78.25±3.76 to 79.52±3.85 at the 62
nd to 63
rd month, and
x=108.69±6.07 at the 86
th month, starting from December 2019. Combining these data with the demarcation values
x1=79 (for Q's initial emergence) and
x2=108 (for a strong outbreak of Q) from
Figure 3, we forecast that the macro-lineage Q will emerge around February 2025 (
x~79) and, after approximately 23 months, will reach the stage of a strong outbreak (
x~108).
4. Discussion
4.1. Why Is the Increase in the Number of Mutated Sites of a Variant Approximately Linear with Respect to Its Emergence Time?
Figure 1 illustrates that the relationship between the number of mutated sites (NMS) and time
t is discontinuous, with a stepwise change occurring at the point of lineage transformation. However, the slope of the NMS increase between two neighboring lineages also varies. Generally, the new lineage exhibits a lower slope of increase compared to the older lineage, which compensates for the stepwise change at the lineage transformation. This explains why the relationship between NMS and the emergence time of a variant is approximately linear. Our prediction for the Q lineage is based on this linear relationship, which can be extended to longer time periods.
4.2. What Is the Relationship Between the Time Prediction for the Emergence of a Macro-Lineage and the Mutant Prediction in the A-X Model?
In this article, we forecast the timeline for mutant evolution, while the A-X model primarily focuses on the stochastic generation of mutants on the phylogenetic tree. The time required for the emergence of a mutant and the number of randomly generated sites within a mutant are intrinsically linked. Therefore, in section 3.3, the prediction for the Q lineage is derived using the A-X model. In fact, the emergence of any new lineage can be independently predicted, provided there is sufficient data on the survival time of macro-lineages.
5. Conclusions
This manuscript extends the work presented in the articles "An Evolutionary Theory on Virus Mutation in COVID-19" [
7] and "Prediction on the Emergence of SARS-CoV-2 Based on Evolutionary Theory of Virus Mutation" [
8]. The main arguments and conclusions are summarized as follows:
The n-distance algorithm, applied in UPGMA, generates a phylogenetic tree of viral evolution based on amino acid mutations in the spike protein. The reconstructed tree aligns closely with established evolutionary data;
The A-X model is introduced to simulate the generation of new strains on the phylogenetic tree. By combining set A (existing mutated sites) with set X (which includes x randomly generated sites), we can predict the emergence of novel strains. Expanding stochastic sampling to a larger scale reveals statistical patterns governing new strain production. As x increases, the proportions of the four macro-lineages change: lineage O surpasses N first, followed by lineage P surpassing O, and finally, lineage Q emerges;
A linear regression between the number of mutated sites (NMS) for a variant (i.e., x) and its worldwide first sample collection time (i.e., t) provides a good approximation. This linearity arises from the combined effects of stepwise changes in NMS at lineage transformations and varying slopes of NMS versus time in neighboring lineages;
By integrating the information on novel strain production at a given x from the A-X model and the linear relationship between x and t, we forecast that macro-lineage Q will emerge around February 2025 (when x≈79), and will reach a stage of strong outbreak approximately 23 months later (when x≈108).
Author Contributions
Conceptualization, L.L.; validation, J.L., and L.L.; investigation, J.L.; writing—original draft preparation, L.L.; writing—review and editing, J.L.; visualization, J.L.; supervision, L.L. All authors have read and agreed to the published version of the manuscript.
Funding
This research received no external funding.
Acknowledgements
We sincerely appreciate Dr. Ying Zhang for her assistance with data collection, insightful discussions, and valuable suggestions.
Conflicts of Interest
The authors declare no conflicts of interest.
References
- Rahnsch, B.; Taghizadeh, L. Network-based uncertainty quantification for mathematical models in epidemiology. J. Theor. Biol. 2024, 577, 111671. [Google Scholar] [CrossRef]
- Ramachandran, A.; Lumetta, S.S.; Chen, D. PandoGen: generating complete instances of future SARS-CoV-2 sequences using deep learning. PLoS Comput. Biol. 2024, 20, e1011790. [Google Scholar] [CrossRef] [PubMed]
- Fowler, D.; Fields, S. Deep mutational scanning: a new style of protein science. Nat. Methods 2014, 11, 801–807. [Google Scholar] [CrossRef] [PubMed]
- Elnaggar, A.; Heinzinger, M.; Dallago, C.; Rehawi, G.; Wang, Y.; Jones, L.; Gibbs, T.; Feher, T.; Angerer, C.; Steinegger, M.; et al. ProtTrans: toward understanding the language of life through self-supervised learning. IEEE Trans. Pattern Anal. Mach. Intell. 2022, 44, 7112–7127. [Google Scholar] [CrossRef] [PubMed]
- Ferruz, N.; Schmidt, S.; Höcker, B. ProtGPT2 is a deep unsupervised language model for protein design. Nat. Commun. 2022, 13, 4348. [Google Scholar] [CrossRef] [PubMed]
- Luo, L.; Lv, J. Mathematical modelling of virus spreading in COVID-19. Viruses 2023, 15, 1788. [Google Scholar] [CrossRef] [PubMed]
- Luo, L.; Lv, J. An evolutionary theory on virus mutation in COVID-19. Virus Res. 2024, 344, 199358. [Google Scholar] [CrossRef] [PubMed]
- Luo, L.; Lv, J. Prediction on emergence of SARS-CoV-2 based on evolutionary theory of virus mutation. Available online: https://ssrn.com/abstract=4938698 (accessed on 31 August 2024).
- Gangavarapu, K.; Latif, A.A.; Mullen, J.L.; Alkuzweny, M.; Hufbauer, E.; Tsueng, G.; Haag, E.; Zeller, M.; Aceves, C.M.; Zaiets, K.; et al. Outbreak.info genomic reports: scalable and dynamic surveillance of SARS-CoV-2 variants and mutations. Nat Methods 2023, 20, 512–522. [Google Scholar] [CrossRef] [PubMed]
|
Disclaimer/Publisher’s Note: The statements, opinions and data contained in all publications are solely those of the individual author(s) and contributor(s) and not of MDPI and/or the editor(s). MDPI and/or the editor(s) disclaim responsibility for any injury to people or property resulting from any ideas, methods, instructions or products referred to in the content. |
© 2024 by the authors. Licensee MDPI, Basel, Switzerland. This article is an open access article distributed under the terms and conditions of the Creative Commons Attribution (CC BY) license (http://creativecommons.org/licenses/by/4.0/).


