Submitted:
13 November 2024
Posted:
13 November 2024
You are already at the latest version
Abstract
Data-driven deep learning models are widely employed for semantic segmentation in remote sensing images. However, the scarcity of large, labeled remote sensing datasets limits these models' ability to fully utilize available information. To address this, generative model-based data augmentation has shown great potential. While existing generative models perform well in natural scene domains (e.g., faces and street scenes), they encounter challenges in remote sensing due to high data imbalance and the semantic similarity of land cover classes. To tackle these challenges, we propose a Multi-Task Generative Adversarial Network (MTGAN) for generating remote sensing images from semantic labels. Our model features a dual-branch architecture with a global generator that captures the overall image structure and land cover class-specific generators that improve the quality and differentiation of land cover types. To integrate these multi-task generators, we design a shared parameter encoder for consistent feature encoding across two branches, and a spatial decoder that synthesizes outputs from the class-specific generators, preventing overlap and confusion. Additionally, we employ perceptual loss (LVGG) to assess perceptual similarity between generated and real images, and texture matching loss (LT) to capture fine texture details. To evaluate the quality of image generation, we tested multiple models on two datasets from Chongzhou, Sichuan Province, and Wuzhen, Zhejiang Province, China. The results show that our model improves LPIPS by 0.0297 and FID by 52.86 compared to Pix2Pix. We also conducted comparative experiments to assess the semantic segmentation accuracy of the U-Net before and after incorporating the generated images. The results show that data augmentation with the generated images leads to an improvement of 4.47% in FWIoU and 3.23% in OA across the two datasets.
Keywords:
remote sensing images
; generative adversarial networks
; image synthesis
; data augmentation
1. Introduction
Currently, deep learning technology is rapidly advancing, achieving significant results across various fields through data-driven methods. High-quality training samples are fundamental to achieving outstanding performance, thus the demand for sufficient and high-quality datasets is becoming increasingly urgent. However, in the field of remote sensing, especially in image segmentation tasks, obtaining high-quality remote sensing images and their semantic labels through manual annotation still faces many challenges, such as the time-consuming and labor-intensive nature of labeling, which hinders the full realization of the advantages of data-driven approaches [1,2]. In this context, data augmentation serves as an effective method that can significantly expand the data size by transforming the original images or generating new images from existing data [3,4].
Transformation-based augmentation includes color space transformations that modify pixel intensity values (e.g., brightness, contrast adjustment) and geometric transformations that update the spatial locations of pixels (e.g., affine transformations), while synthetic-based augmentation resorts to generative methods (e.g., neural style transfer [5]) and mixing augmentations (e.g., MixUp [6], CutMix [7]) [8]. Although these approaches increase the dataset size, they primarily focus on individual images or image pairs, utilizing only intrinsic image information or the mutual information between pairs. As a result, the augmented data introduces limited prior knowledge, producing new samples that closely mimic existing patterns with minimal informational novelty. This lack of diversity in the generated data reduces the effectiveness of these methods in enhancing model performance [9].
In recent years, GAN-based synthetic methods have introduced innovative approaches to data augmentation [10]. The model generates high-quality new images by learning the overall distribution of the data. In the field of remote sensing, numerous studies have utilized GANs to generate samples for data augmentation. CSEBGAN generates realistic remote sensing images based on semantic labels by decoupling different semantic classes into independent embeddings [11], achieving finer-grained diversity. Kuang et al. proposes a semantic-layout-guided collaborative framework for SAR sample generation to enhance sample diversity and improve detection performance [12]. Remusati et al. explores the use of GANs to enhance the explainability and performance of SAR Automatic Target Recognition (ATR) and classification models, addressing both the generation of synthetic data and the development of methods for better understanding model decisions [13]. Fu et al. presents a novel denoising GAN for colorizing satellite remote sensing grayscale images, which outperforms existing techniques and improves building detection performance [14]. Rui et al. introduces DisasterGAN to synthesize diverse remote sensing disaster images with multiple types of disasters and varying building damage, addressing the challenges of class imbalance and limited training data in existing datasets [15]. Simonyan and Zisserman enhanced the WGAN [16] to generate remote sensing images of construction waste, ensuring realistic edge and texture representation [17]. Kong et al. utilized Pix2Pix [18] and PS-GAN [19] to generate pedestrian samples along railroad perimeters [20], improving safety monitoring by providing additional training data for detection algorithms. Similarly, Yang applied GANs to create water flow images across natural and artificial environments, augmenting datasets and improving the accuracy of flow rate estimation for classification networks [21]. Wang Y et al. refined a conditional GAN (cGAN) by incorporating perceptual loss and structural similarity metrics with masks, enhancing the quality of aircraft region generation and resolving sample scarcity in aircraft recognition tasks [22]. Jiang Y et al. improved StyleGAN2 [23] and integrated the generated images into the YOLOv3 [24] training dataset, ultimately boosting the accuracy of object detection and recognition [25].
Our research aims to generate remote sensing satellite images from semantic labels to enhance deep learning datasets. Initially, Generative Adversarial Networks (GANs) could only generate samples from noise. However, with the rapid development of GANs, the emergence of Conditional Generative Adversarial Networks (cGANs) has enabled the generation of images using category labels, text descriptions, and other images as conditions. Based on this, numerous advancements in GAN-based label-to-image translation techniques have emerged, providing strong technical support for generating satellite images from labels, thus offering effective methods for expanding remote sensing datasets using semantic maps. Pix2Pix [26] employs the U-Net [27] architecture for the generator and the PatchGAN discriminator, improving the quality of image synthesis. Pix2PixHD [28] further refines Pix2Pix by optimizing the model structure, loss function, and semantic processing, enabling the generation of high-resolution images. GauGAN addresses the limitations of conventional approaches—where semantic label maps are processed through convolution-normalization-nonlinear layers [29], leading to information loss—by introducing Spatially Adaptive Normalization (SPADE), which preserves semantic information and improves image quality. DAGAN [30] and DPGAN [31] enhance image-level synthesis by adding functional modules, but these methods still struggle to capture category-specific characteristics, limiting the generation of detailed remote sensing images. To address this, LGGAN [32] and CollageGAN [33] employ distinct models for different semantic categories. However, LGGAN’s class-specific generators, built with basic convolutional layers, are insufficient for generating intricate geographic objects, while CollageGAN is unsuitable for remote sensing images that lack clear foreground-background segmentation. SEAN [34] and CLADE [35] improve image synthesis by designing normalization methods that leverage semantic constraints, enhancing both image quality and model performance. DP-SIMS [36] integrates a pre-trained backbone network as the encoder in the discriminator and employs cross-attention mechanisms for noise injection, significantly enhancing image quality and consistency while reducing computational costs.
Currently, GAN-based label-to-image translation methods have achieved outstanding results on scene datasets such as COCO-Stuff [37], Cityscapes [38], and ADE-20K [39]. However, generating satellite images from remote sensing semantic labels still faces several challenges on remote sensing datasets:
1. Existing image synthesis methods often rely on datasets with simple image forms and low data complexity. These methods may not be suitable when confronted with challenges such as high data imbalance and high semantic similarity among land cover classes, which are prevalent in remote sensing images. Specifically, in remote sensing datasets, the spatial distributions of different land cover types exhibit diverse patterns and regularities. Moreover, certain land cover types, such as vegetation and background, exhibit high semantic similarity. These challenges can lead to poor quality of generated samples for underrepresented land cover classes and make it difficult to differentiate between land cover types with high semantic similarity. As a result, a single generator structure struggles to effectively capture and generate the diverse characteristics of these land cover types.
2. Existing multi-task generators face challenges in effectively balancing the generation of samples for different land cover types, leading to significant interference between generators. This interference complicates the training process and results in confusion or overlap in the generated images, such as distorted building structures and unrealistic texture details.
To address these challenges, we employ a Multi-task GAN (MTGAN) to augment the dataset of remote sensing images, specifically focusing on five typical land cover classes: water, buildings, vegetation, roads, and others. Our primary goal is to tackle the complexities involved in generating samples for these land cover categories, particularly the challenges associated with creating intricate building structures and addressing the limited representation of certain land cover types. Our key contribution is the development of a generation model that leverages the existing dataset to ensure the diversity and richness of samples necessary for effective semantic segmentation of remote sensing images, thereby enhancing segmentation accuracy. The contributions of this paper are summarized as follows.
1. Our proposed model adopts a dual-branch multi-task generator architecture, where the land cover class-specific generators focus on targeted generation for individual categories. This design overcomes the limitations of the global generator in capturing detailed features across diverse land cover types, enabling the model to effectively generate objects for underrepresented classes and distinguish between land cover types with high semantic similarity.
2. To integrate these multi-task generators, we design a shared parameter encoder for consistent feature encoding across both the global and class-specific branches, and a spatial decoder that synthesizes outputs from the class-specific generators, preventing overlap and confusion. This design mitigates the mutual influence among generators, ensuring more consistent outputs.
3. We employ perceptual loss () to compute the perceptual similarity of images and use texture matching loss ( to assess the differences in texture details between generated and real images via the Gram matrix. By combining these two loss functions, we enhance the color, texture, and perceptual authenticity of the generated images, ensuring higher output quality.
4. The effectiveness of the generated images is assessed by analyzing how varying quantities of generated data impact the accuracy of the U-Net segmentation network across datasets of different sizes.
2. Methods
2.1. MTGAN Model Structure
We focus on addressing key challenges in high data imbalance and high semantic similarity among land cover classes. To overcome these issues, we propose the MTGAN (Multi-task GAN). The MTGAN generator adopts a dual-branch architecture. The global generator learns global contextual information to produce coherent global results. The land-cover class generator deploys class-specific generators to handle different features, synthesizing local outputs using the intermediate features from each class-specific generator. The outputs from the global and the land-cover class generator and are combined through a fusion network to produce the final generated image . Additionally, MTGAN leverages the PatchGAN discriminator and improves the generated images by applying perceptual loss and texture matching loss constraints, ensuring enhanced color consistency, texture quality, and perceptual realism.
As shown in Figure 1, the MTGAN generator consists of four main parts: the shared parameter encoder E, the global generator , the land-cover class generator and the fusion network .
2.2. MTGAN Generator
The structure of the MTGAN generator consists of two branches: a global generator and the land-cover class generator. The global generator adopts a 9-layer U-Net architecture, featuring a simple design, a low parameter count, and high training efficiency, allowing it to generate complete remote sensing images quickly. The land-cover class generator, on the other hand, focus on generating local images for specific land-cover types. When fusing images generated by different class-specific generators, significant differences in the spatial distribution and characteristics of these categories may lead to conflicts. To address this, we designed a spatial decoder, which extracts features from the intermediate layers of each class-specific generator and decodes them through a unified decoder. This design effectively prevents interference between generators, ensuring smooth integration of features and avoiding confusion in the merged images.
Both global and local images contain rich information about land-cover features. To further refine the output, we introduce a pixel-level fusion network to combine the two. This network generates two pixel-level weight maps, which are used to perform weighted fusion of the global and local images. Additionally, to improve the generation quality and maintain balance between the global generator and the land-cover class generator, we introduce a shared parameter encoder. This encoder encodes the label maps and feeds the extracted feature maps to both the global and local branches, ensuring coordination and equilibrium between the two branches during the generation process.
2.2.1. Shared Parameter Encoder
The shared parameter encoder serves two critical functions in this framework. First, it maintains the balance between the global and land-cover class generators during training, promoting consistent feature alignment. Second, it extracts comprehensive semantic information from the semantic label, ensuring optimal utilization of semantic information. The structure of encoder E is illustrated in Figure 2, comprising three core sub-modules: the convolutional module, residual module, and inverse convolutional module.
The convolutional module contains three convolutional layers, each configured with a kernel size of 3, a stride of 2, and an output channel size that doubles the input channel size. As a result, the spatial dimensions of the feature maps are halved, while the channel dimensions are progressively doubled through the layers. The features processed by the convolutional module are then passed into the residual module, which consists of six ResNet blocks. This deeper architecture enhances the encoder’s feature extraction capability while only introducing a marginal increase in parameters. Notably, the size and channel dimensions of the features remain unchanged throughout the residual module. Following this, the processed features are fed into the inverse convolutional module. This module mirrors the structure of the convolutional module, consisting of three inverse convolutional layers. With each inverse convolution, the spatial dimensions of the feature maps are doubled. Except for the final layer, where the output channel matches the input, the intermediate layers output half the number of input channels.
2.2.2. Land-Cover Class Generator
Considering that the spatial distributions of land cover types follow diverse patterns and regularities, and that certain types exhibit high semantic similarity. A single generator may result in poor quality of generated samples for underrepresented land cover classes and make it difficult to distinguish between types with high semantic similarity.
The structure of the land-cover class generator is shown in Figure 3. It consists of multiple class-specific generators and a spatial decoder. The class-specific generators target specific land cover types, improving both the quality and differentiation of these types. The spatial decoder synthesizes outputs from the class-specific generators, minimizing overlap and confusion.
In the MTGAN framework, five dedicated class-specific generators are designed for key feature classes: the background generator , the water generator , vegetation generator , road generator and building generator ,. Each class-specific generator , targets the generation of its corresponding feature class, enhancing the synthesis quality of those classes and improving the overall generation of complex multi-class samples.
Each class-specific generator in the land-cover class generator adopts a 4-layer U-Net structure. The input for each generator is generated by element-wise multiplying the corresponding semantic label , with the feature matrix . Specifically, the multiplication is performed along the channel dimension, producing a feature tensor with dimensions 512×512×64. This tensor serves as the input to the class-specific generator to extract class-relevant features, generating the output image .
In the land-cover class generator, each class-specific generator is optimized using an L1 loss to ensure the generated images resemble their corresponding real class images. The L1 loss, defined as:
ensures that the synthesized class-specific image approximates the real image as closely as possible, enhancing the quality and fidelity of the generated outputs.
Figure 3.
The module structure of the land-cover class generator.
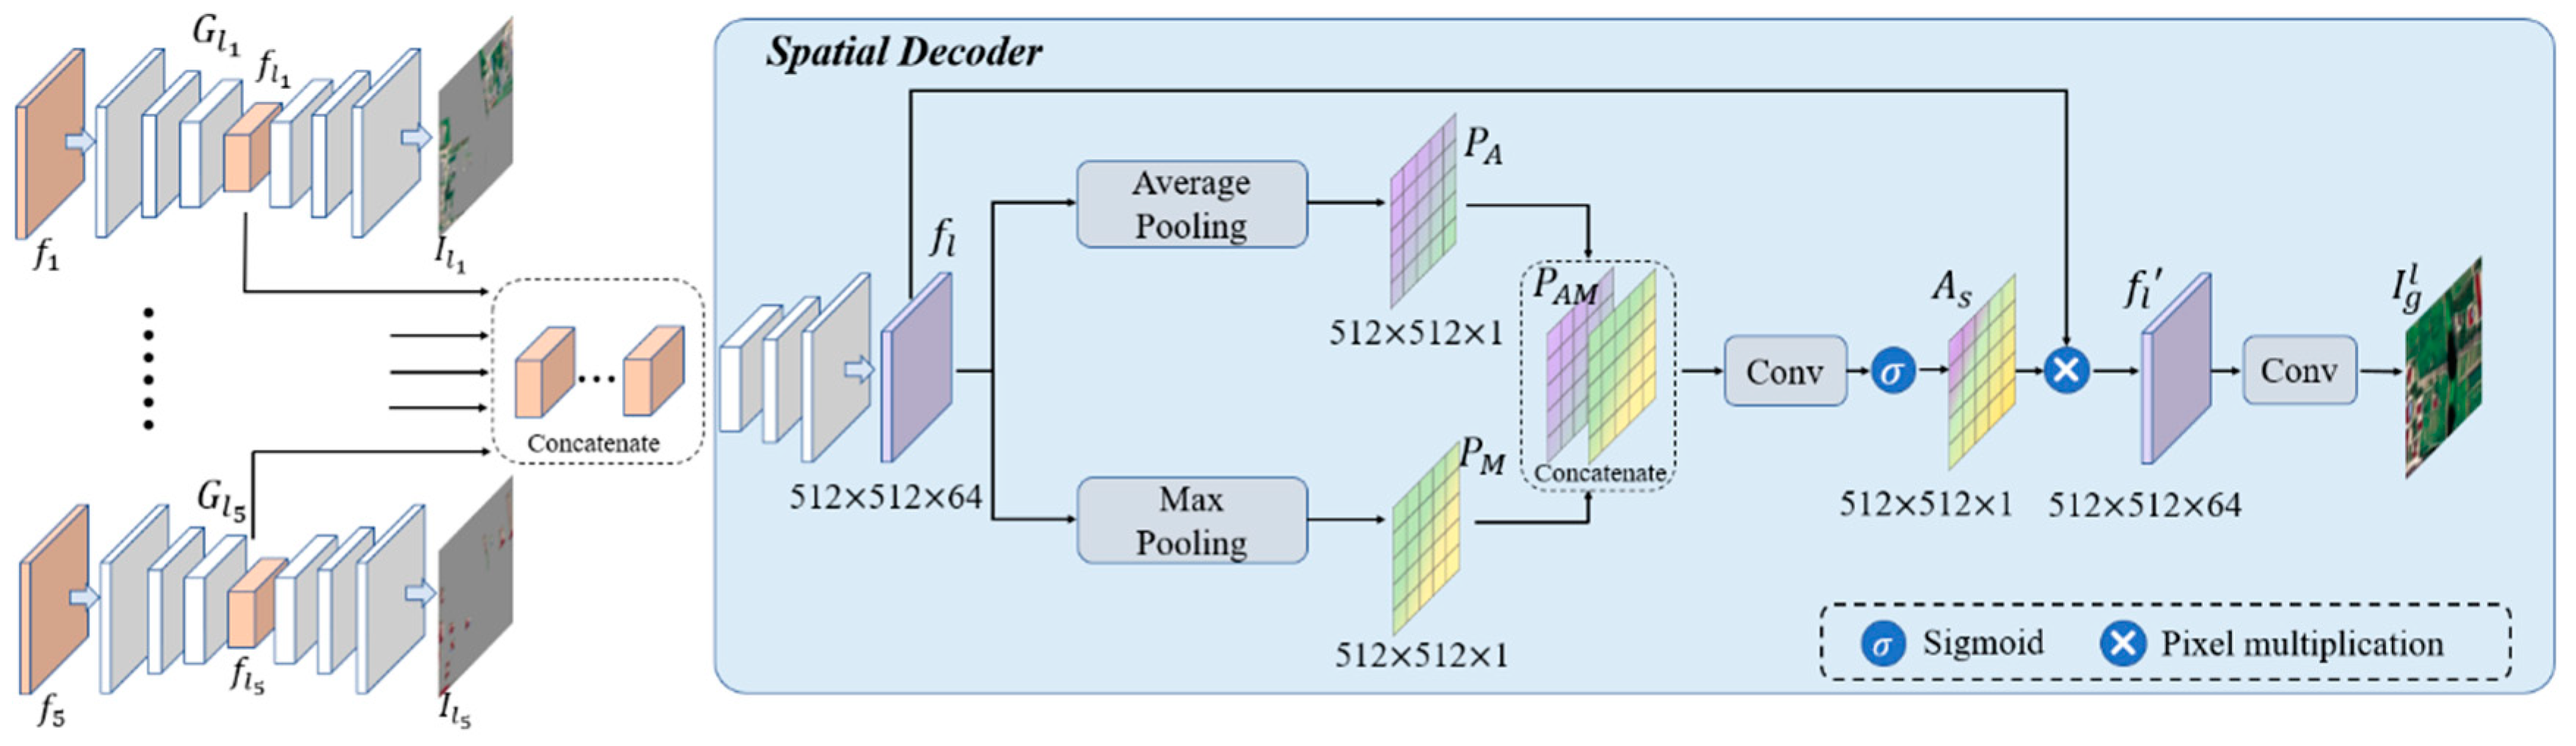
Although the shared parameter encoder extracts information from the global semantic image, the element-wise multiplication with class-specific semantic channels filters out information unrelated to the target class. However, the convolution operations within the shared parameter encoder introduce interference, complicating the task for the class-specific generators to accurately synthesize specific features. Furthermore, since the class-specific generators follow an encoder-decoder architecture, some extracted information is inevitably lost during the decoding process. Combined with the shallow depth of these generators, the capacity to effectively capture and utilize class-specific semantic information is weakened. To address these, intermediate features from each class-specific generator are incorporated into the local image synthesis. This strategy strengthens the land-cover class generator's capability to better capture class-specific characteristics, ultimately enhancing the quality of both the individual class images and the final composite output.
The specific network structure of the land-cover class generator in the MTGAN is illustrated in Figure 3. The generation result is synthesized using intermediate features from each class-specific generator. Specifically, intermediate features , are extracted from both the encoder and decoder of the U-Net-based generator and concatenated along the channel dimension. These concatenated features are then processed through a spatial decoder, ultimately producing the locally generated image . Extracting these intermediate features is essential, as they originate from the deeper layers of the encoder and encapsulate the richest semantic information. In the spatial decoder, the features are first upsampled to recover spatial resolution. The upsampling module comprises three inverse convolutional layers, with each layer expanding the feature dimensions to twice the original size. This computational process can be succinctly expressed as Equation (2):
where denotes the upsampling operation.
In the spatial decoder, the upsampled features are further refined using a spatial attention module. The feature is computed by applying both average pooling and maximum pooling to obtain the feature maps and , respectively. The pooled feature maps and are spliced in channel dimension to obtain a feature map . The spatial attention map is generated by passing through a convolutional layer with a 3×3 kernel and a single output channel, followed by the sigmoid activation function. The resulting spatial attention map is then matrix-multiplied with the feature to produce the processed feature .
By incorporating the spatial attention mechanism, the feature gains global contextual information in the spatial dimension. This allows pixels sharing the same semantic label to mutually reinforce each other, thereby enhancing the quality of image generation for multi-class features.
The introduction of the spatial decoder not only aims to extract features from the intermediate layers of each class-specific generator to enhance generation quality but also serves to balance the differences in generation capacity between various class-specific generators through a unified decoder. This unified approach prevents interference between generators, ensuring that features from different categories are harmoniously integrated, thus avoiding confusion or overlap in the generated images.
2.2.3. Pixel-Level Fusion Network
Both the global generation result and the local generation result are passed through the fusion network to obtain the final generation result . The pixel-level fusion network consists of a fusion map generator. The outputs of the fusion map generator are computed using the Softmax function to generate the pixel-level weight maps and , as shown in Equation (4):
The final fusion process is expressed in Equation (5):
2.3. MTGAN Discriminator
MTGAN employs PatchGAN as its discriminator. In a standard GAN, the discriminator outputs a scalar value representing the probability that the input belongs to the real data distribution, ranging from 0 to 1. While this scalar output classifies realness or fakeness at the image level, it fails to effectively capture fine-grained image details. PatchGAN improves upon this by dividing the input image into N×N blocks and performing real or fake classification on each block, producing an N×N matrix of probabilities. The overall classification probability of the image is then obtained by averaging the values in this matrix. This block-based approach enables PatchGAN to focus more on local details, enhancing image quality while also improving computational efficiency compared to the original GAN.
2.4. Loss Function
During the training process of the generative adversarial network, the generator G aims to produce images that closely resemble real images, while the discriminator D strives to accurately distinguish whether the output image originates from the generator or the real dataset. The optimization objective for the adversarial loss in MTGAN is grounded in the CGAN architecture, with the adversarial loss function defined as shown in Equation (6):
To recover the low-frequency components of the image and minimize the influence of outliers, the L1 loss is employed to constrain the global generation result, as expressed in Equation (7):
Using the distance between images in feature space as a loss function enables the model to concentrate on important object features, achieving invariance to irrelevant transformations while remaining sensitive to local image statistical information. In this study, image features are extracted using a deep neural network based on the ImageNet-pretrained VGG19 architecture [40]. The distance between real images and generated images is measured in the image feature space as a loss function. Both images are sequentially input into the VGG19 network, and the output featuresand are selected after the ReLU layers from different modules of the network. To enhance perceptual similarity between generated images, features from the 2nd, 4th, 8th, 12th, and 16th convolutional modules of the VGG19 network are chosen. The distances between these selected features are then calculated as part of the VGG loss, which constrains the network during the image generation process. This relationship is expressed in Equation (8):
where represents the module serial number, and represents the selected set of VGG19 module serial number.
Additionally, the Gram matrix serves as a texture synthesis method, constructed from feature vectors extracted from the input image features. It enables the measurement of correlations between features while disregarding spatial information within the feature maps. By comparing the differences between the features of generated images and real images, it aids the model in learning how to effectively generate image textures. To simultaneously capture both low-level and high-level image features, this study selects the output features after the ReLU layers following the 2nd and 16th convolutional modules of the VGG19 network to compute the Gram matrix. The difference in Gram matrices between real and generated images is then used to optimize the training process of the generator. The texture matching loss function is defined in Equation (9):
To summarize, the loss function of MTGAN includes the adversarial loss , the loss of the generated image , the loss of the category-generated image , the perceptual loss of the generated image , and the texture matching loss . The synthesized expression is shown in Equation (10):
、、 and are the weight coefficients.
3. Results
3.1. Experimental Dataset
We utilize two remote sensing image datasets with distinct styles: the Chongzhou area in Sichuan Province of China, covering longitudes 103°37′ to 103°45′E and latitudes 30°35′ to 30°40′N, and the Wuzhen area in Zhejiang Province of China, covering longitudes 120°26′ to 120°33′E and latitudes 30°43′ to 30°47′N. The original images are satellite optical orthorectified images captured over two time periods, with each image measuring 5826×3884 pixels and a spatial resolution of 0.51 meters. The Chongzhou dataset features complex land characteristics, including large factories, intricate residential structures, rural clusters, agricultural fields with vegetation, and extensive rivers and highways. In contrast, the Wuzhen dataset primarily consists of water bodies surrounded by villages, with a landscape dominated by vegetation and rural buildings, and fewer factories and major highways.
In total, we focus on generating five typical remote sensing land features: background, water, vegetation, buildings, and roads. To facilitate this, we annotate the remote sensing data with the corresponding categories to create semantic labels. The images are cropped into smaller 512×512. Following cropping, both datasets are randomly divided into training and testing sets in a 4:1 ratio. The final Chongzhou dataset comprises 845 training samples and 211 testing samples, while the Wuzhen dataset contains 704 training samples and 176 testing samples.
3.2. Evaluation Metrics
To assess the perceptual similarity between generated images and real images, we employ two representative metrics: Fre´chet Inception Distance (FID) [41,42] and Learned Perceptual Image Patch Similarity (LPIPS) [43], tailored to the characteristics of remote sensing images.
FID is used to measure the distribution differences between generated images and real images in feature space. The process begins by extracting features using the Inception network, followed by modeling the feature space with a Gaussian model, and finally calculating the distance between the two feature distributions. A lower FID indicates higher image quality and diversity. The formula is as follows:
where , , , and represent the mean and covariance matrices of the image features. (·) represents the trace of a matrix.
LPIPS is a metric used to assess the perceptual similarity between images. Unlike traditional metrics such as PSNR and SSIM, which primarily focus on pixel-level differences, LPIPS aligns more closely with human visual perception. The formula is as follows:
where denotes different layers in the network (e.g., convolutional layers), and are the feature maps of images and at layer l, is the number of elements in the feature map at layer , and represents the L2 norm (Euclidean distance).
The ultimate goal of generating these images is to augment the dataset for deep learning tasks. To evaluate the quality of the generated images, we utilize a U-Net network trained on the Chongzhou and Wuzhen datasets for semantic segmentation. The model's accuracy is quantified using two metrics: Frequency-Weighted Intersection over Union (FWIoU) and Overall Accuracy (OA). If the generated images are highly realistic and closely resemble real images, a segmentation network trained on real images should accurately segment the generated outputs.
3.3. Implementation Details
We train and test the model using PyTorch on the Chongzhou and Wuzhen datasets, respectively, employing an NVIDIA RTX 4090 GPU as the training tool. For model training parameters, the batch size is set to 4, with a total of 200 iterations. The learning rate is initially set to 0.0002 for the first 100 iterations and decays linearly to 0 over the subsequent 100 iterations. The optimization algorithm used for network parameters is Adam.
3.4. Ablation Experiments
Ablation experiments are conducted to decompose the generator model and evaluate how various structures influence image quality. This approach allows us to verify the contribution of each functional module within the MTGAN generator to the enhancement of generated image quality.

Table 1.
The ablation experiment plan.
| Model | Description |
| Pix2Pix | Baseline model |
| Pix2Pix++ | and are added on Pix2Pix model |
| DBGAN | Dual-branch generative model |
| DBGAN++ | A shared parameter encoder is added on DBGAN |
| MTGAN | A spatial decoder is added on DBGAN++ |
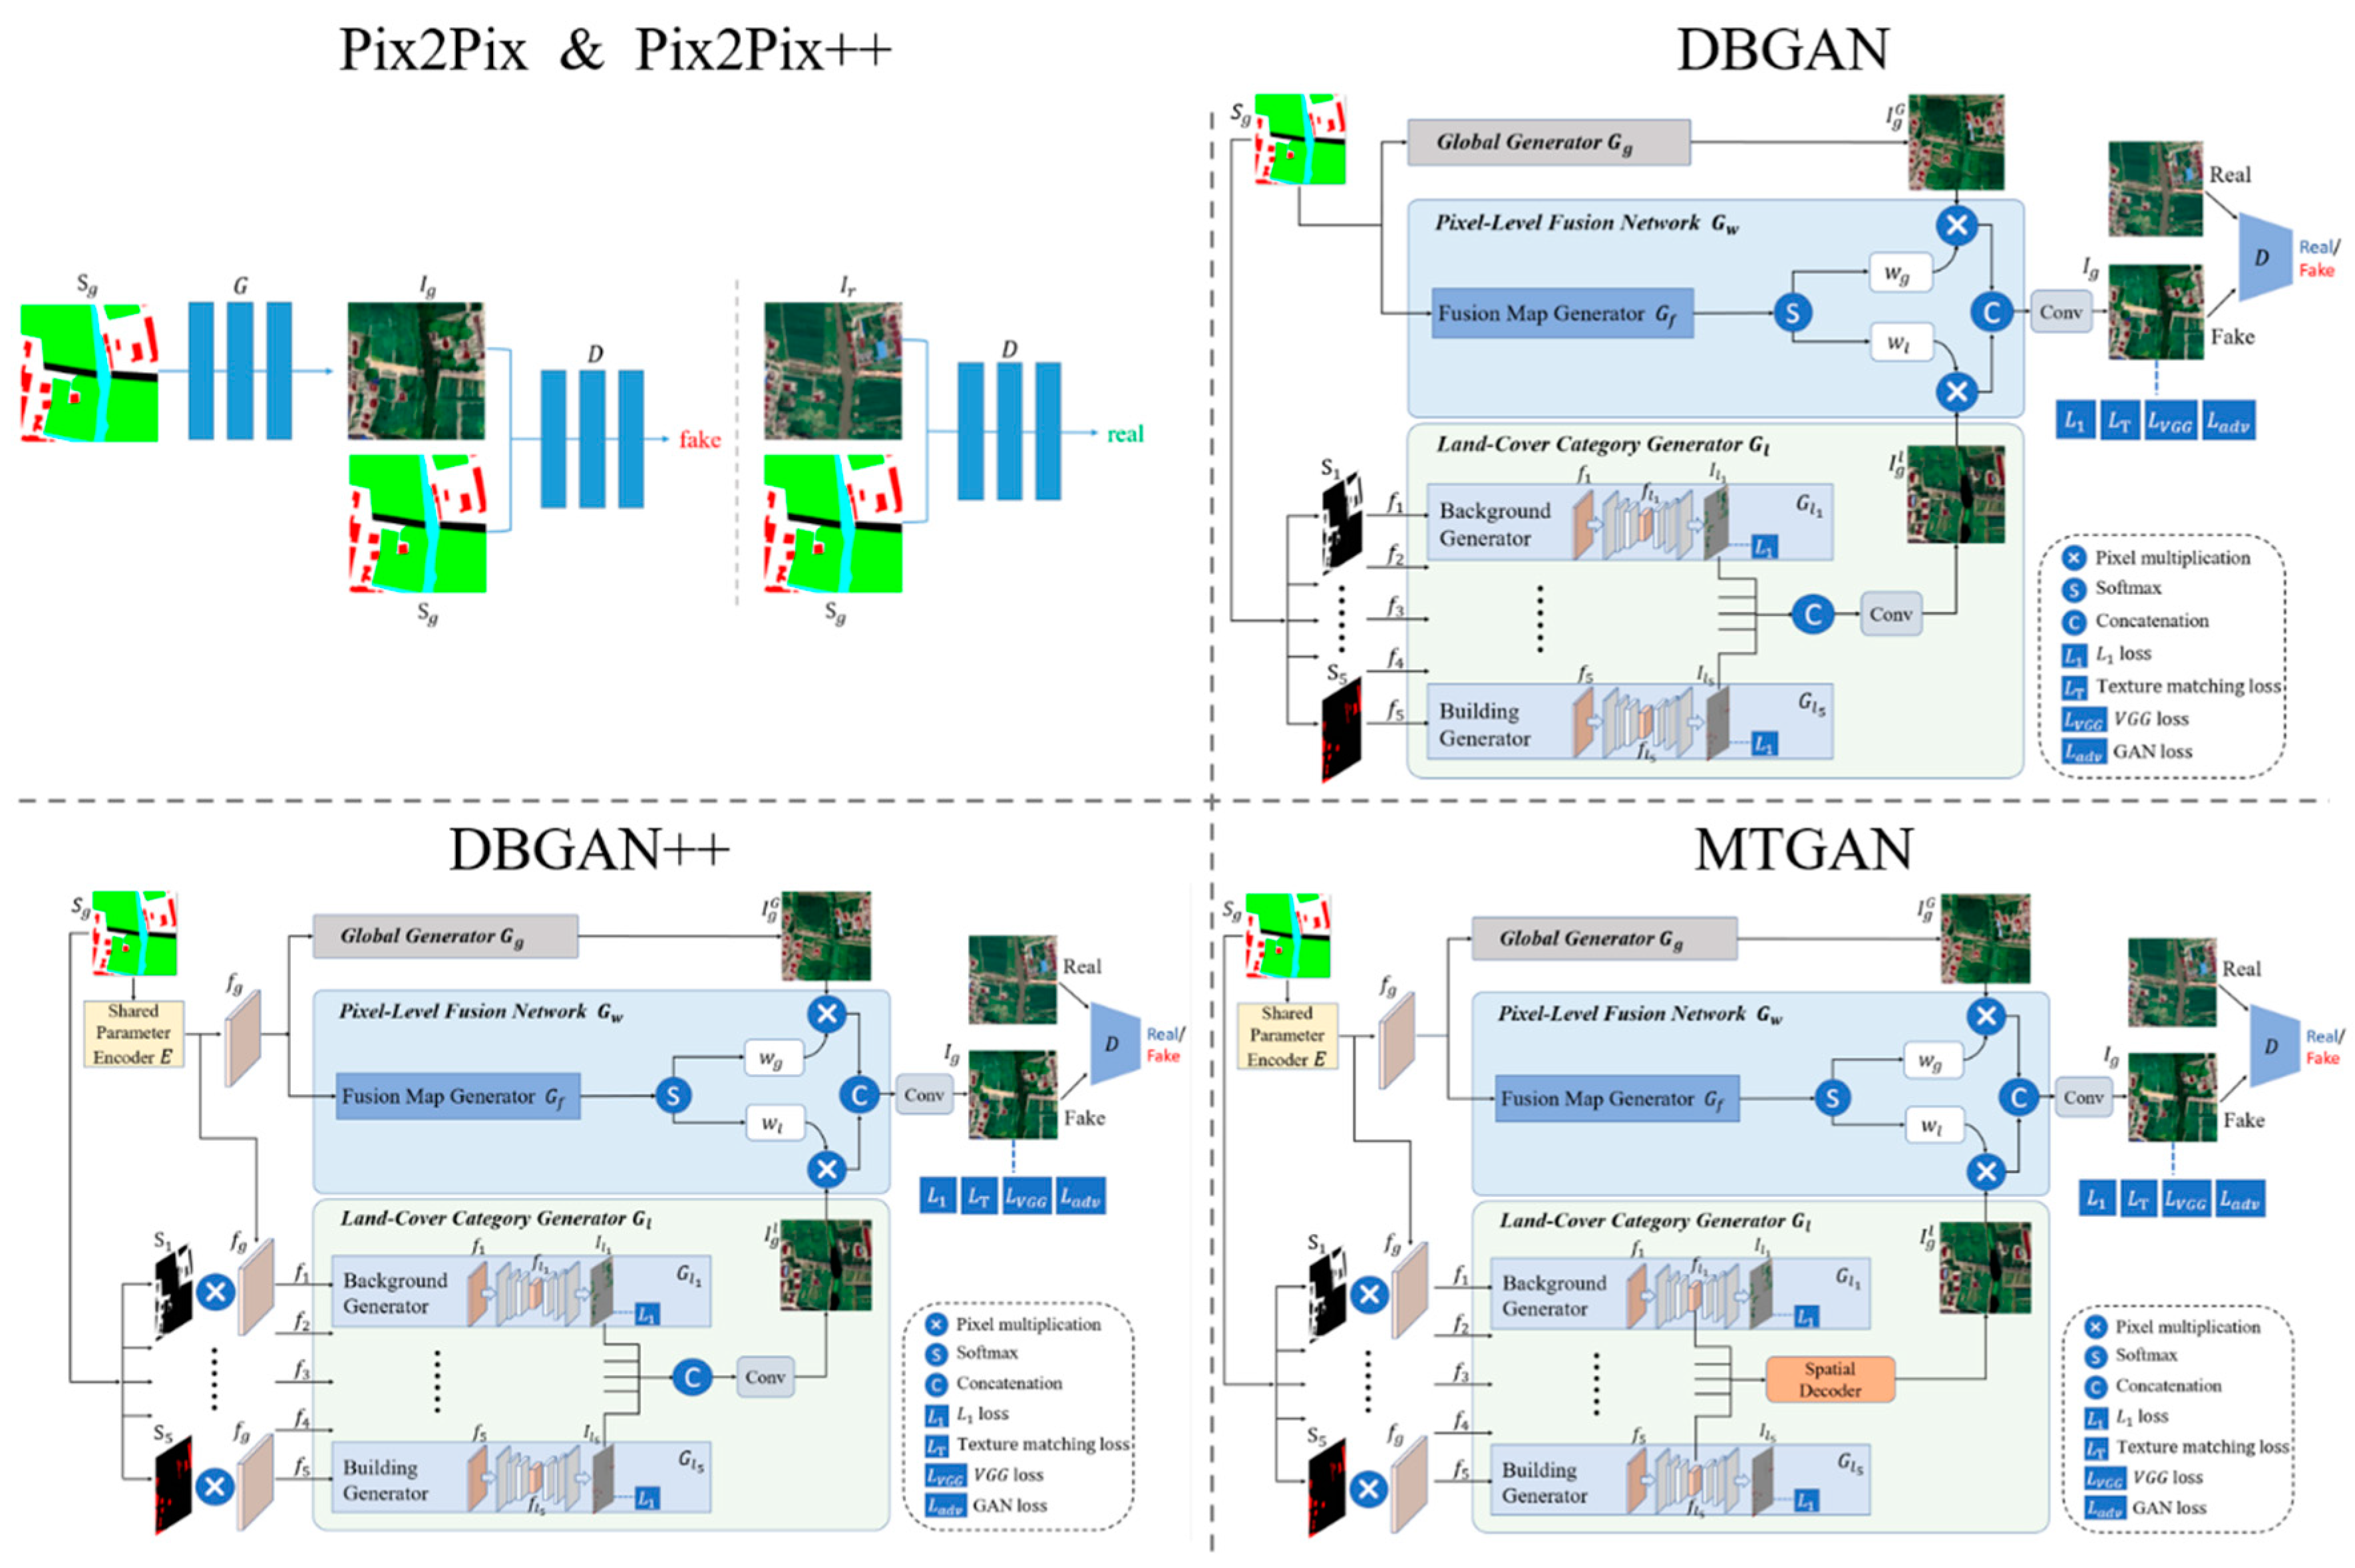
The ablation experiments are structured around five schemes: Pix2Pix serves as the baseline model. Pix2Pix++ incorporates perceptual loss and texture matching loss into Pix2Pix, resulting in the loss function . DBGAN employs Pix2Pix as the global generator and includes land-cover class generators for different features within the dual-branch generative model. DBGAN++ builds upon DBGAN by introducing the shared parameter encoder, thereby balancing the training process. MTGAN enhances the local generators by introducing the spatial decoder to form the final proposed model. In this context, the loss functions for DBGAN, DBGAN++, and MTGAN are all defined as .
Figure 5.
The schematic diagram of ablation experiment plan.
Ablation experiments are conducted on the Chongzhou and Wuzhen datasets. Table 2 presents the evaluation metrics for each program on the respective datasets.
Table 2 indicates that compared to the baseline model Pix2Pix, Pix2Pix++ shows significant improvements in the Chongzhou dataset, achieving a 3.61% increase in FWIoU, a 3.52% increase in OA, a 0.0072 increase in LPIPS, and a remarkable 17.05% improvement in FID. Similarly, for the Wuzhen dataset, FWIoU and OA increase by 2.12% and 1.39%, respectively, with LPIPS rising by 0.0183 and FID by 12.27. Figure 7(c), Figure 7(b), and Figure 8(c) illustrate that the incorporation of VGG loss and texture matching loss effectively mitigates issues in water generation. Additionally, this enhancement improves the model's capacity to learn color textures, particularly evident in the extraction of urban building colors in the Wuzhen dataset.
When comparing the DBGAN model to Pix2Pix++ on the Chongzhou dataset, DBGAN demonstrates improvements with a 1.60% increase in FWIoU and a 1.67% increase in OA. However, LPIPS decreases by 0.0124, and FID decreases by 10.43. Figure 7(d) and Figure 7(c) visually illustrate that DBGAN produces architecture with clearer outlines compared to Pix2Pix++. Moreover, DBGAN's road generation results feature contours and textures that more closely resemble real road characteristics. On the Wuzhen dataset, DBGAN outperforms Pix2Pix++ with a 2.29% increase in FWIoU and a 1.63% increase in OA. Conversely, LPIPS decreases by 0.0186, and FID decreases by 23.72. Figure 8(d) and Figure 8(c) show that DBGAN enhances the generation of colors and contours for small-scale buildings in the Wuzhen dataset. The above illustrates that the use of a dual-branch structure, along with the introduction of class-specific generators, can effectively enhance the model’s ability to generate objects for underrepresented land cover classes
However, DBGAN exhibits certain shortcomings, as evidenced by the generated images depicted in Figure 6. Specifically, the red dashed box in Figure 6(a) highlights a texture replication issue in the Chongzhou generated image, while the white dashed box in Figure 6(b) indicates the presence of noise in the Wuzhen generated image. These problems primarily arise from the challenges in maintaining a balance between the global generator and the land-cover class generator during the training process.
With the introduction of the shared parameter encoder, DBGAN++ successfully addresses the issues present in DBGAN. As indicated by the metrics in Table 2, DBGAN++ shows improvements in LPIPS and FID by 0.0178 and 30.85 on the Chongzhou dataset, and by 0.0290 and 57.58 on the Wuzhen dataset, respectively. Visual comparisons in Figure 7(d) and Figure 8(d) demonstrate that DBGAN++ effectively mitigates the pattern collapse and noise issues found in DBGAN, resulting in images that closely resemble real ones. However, there is a slight decrease in FWIoU and OA metrics with the introduction of the shared parameter encoder. Specifically, on the Chongzhou dataset, FWIoU and OA decreased by 0.36% and 0.1%, while on the Wuzhen dataset, they decreased by 2% and 0.73%. This reduction can be attributed to the interference introduced during the convolution process of the shared parameter encoder, which complicates the class-specific generator's ability to generate specific categories.
MTGAN leverages the spatial decoder to balance the influences among the class-specific generators. This approach significantly enhances the performance of the land-cover class generator. As shown in Table 2, MTGAN achieves the best metrics overall. On the Chongzhou dataset, compared to DBGAN++, MTGAN's FWIoU and OA increase by 5.29% and 6.3%, respectively; LPIPS increases by 0.0178; and FID improves by 30.85. When compared to the baseline model Pix2Pix, MTGAN demonstrates increases of 10.38% and 11.15% in FWIoU and OA, respectively; LPIPS increases by 0.0297; and FID improves by 52.86. On the Wuzhen dataset, MTGAN outperforms DBGAN++ with increases of 6.35% and 3.88% in FWIoU and OA, respectively; LPIPS increases by 0.0432; and FID improves by 41.26. Compared to the baseline model Pix2Pix, MTGAN shows increases of 8.76% and 6.17% in FWIoU and OA, respectively; LPIPS increases by 0.0719; and FID improves by 87.29.
Figure 7.
Figure 7. The ablation experiment on the Chongzhou dataset.
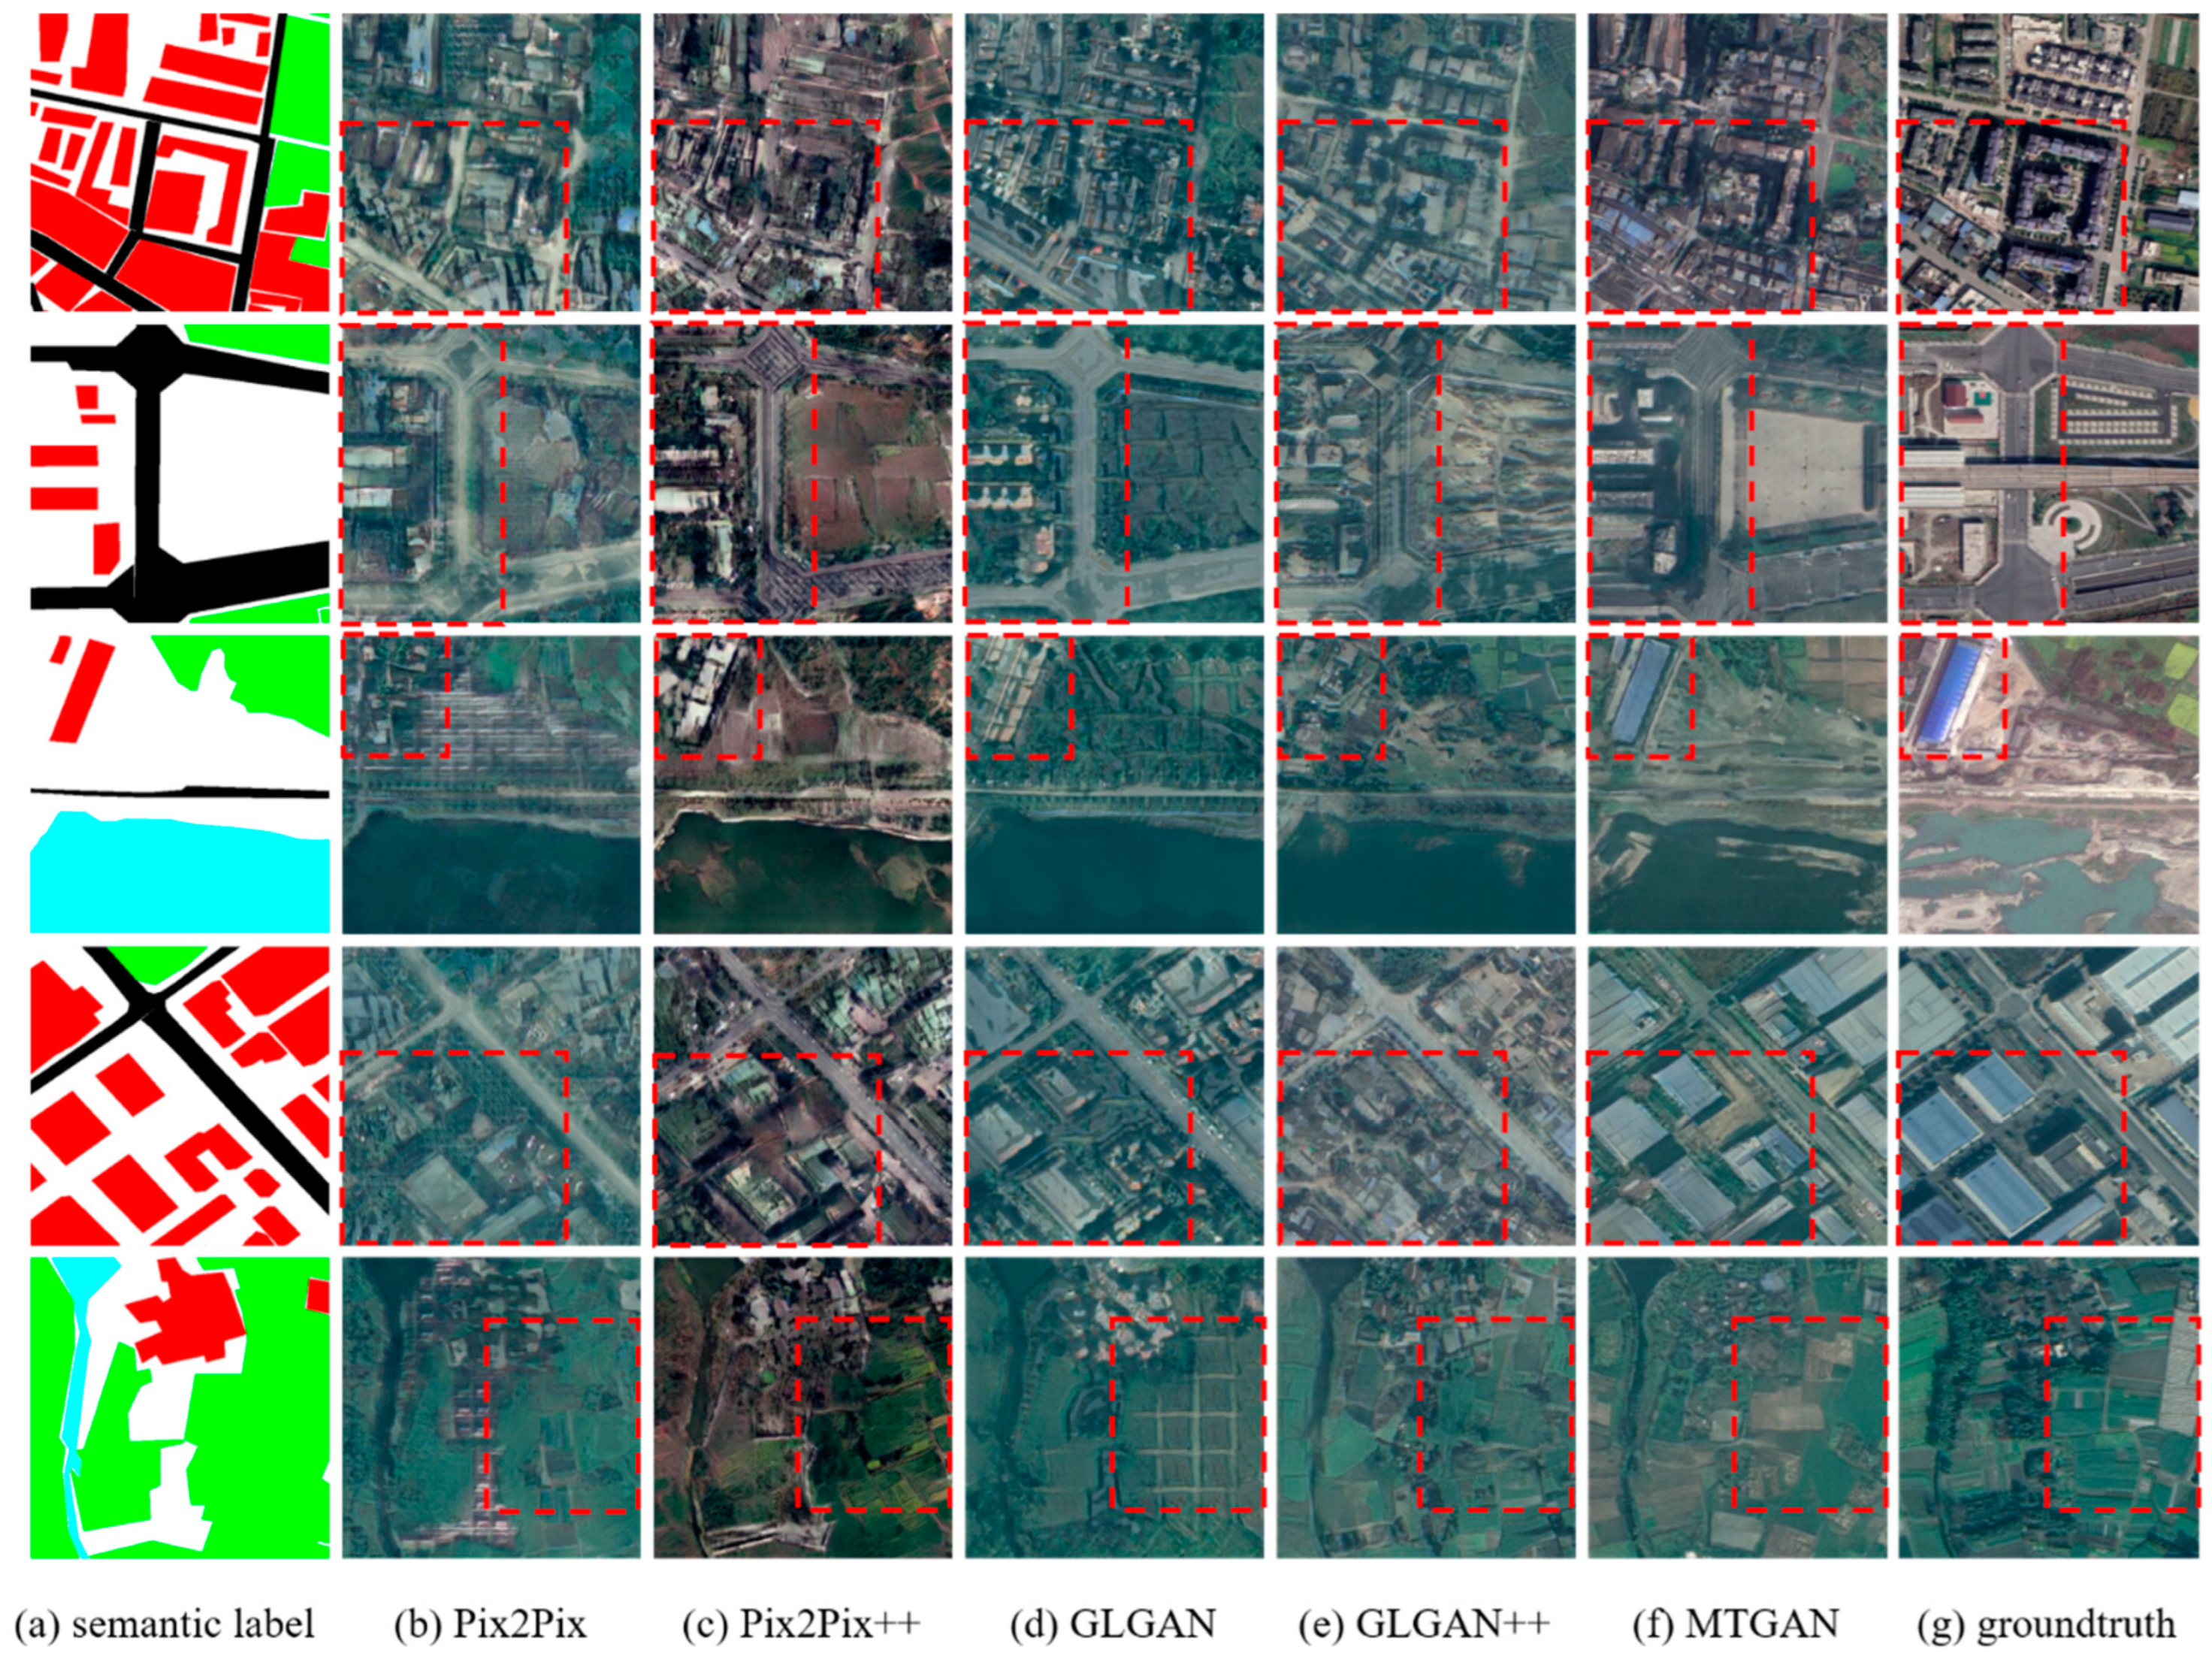
Visually, MTGAN demonstrates significant enhancements in generating building outlines on the Chongzhou dataset. As illustrated in the first row of Figure 7, the model produces more realistic representations of complex residential buildings, while the fourth row shows improved generation of factory buildings. Additionally, MTGAN effectively captures vegetation textures and rural buildings that closely resemble real remote sensing images, as seen in the fifth row of Figure 7. The model also excels in generating roads and complex backgrounds, aligning better with the inherent characteristics of these features, highlighted in the second and third rows of Figure 7.
In summary, the improvements provided by MTGAN not only ensure network stability but also enhance the generation of fine details across various land cover categories. This results in a higher quality of generated samples for underrepresented land cover classes. Moreover, MTGAN strengthens the depiction of complex features like building outlines, leading to samples that more closely match real remote sensing images.
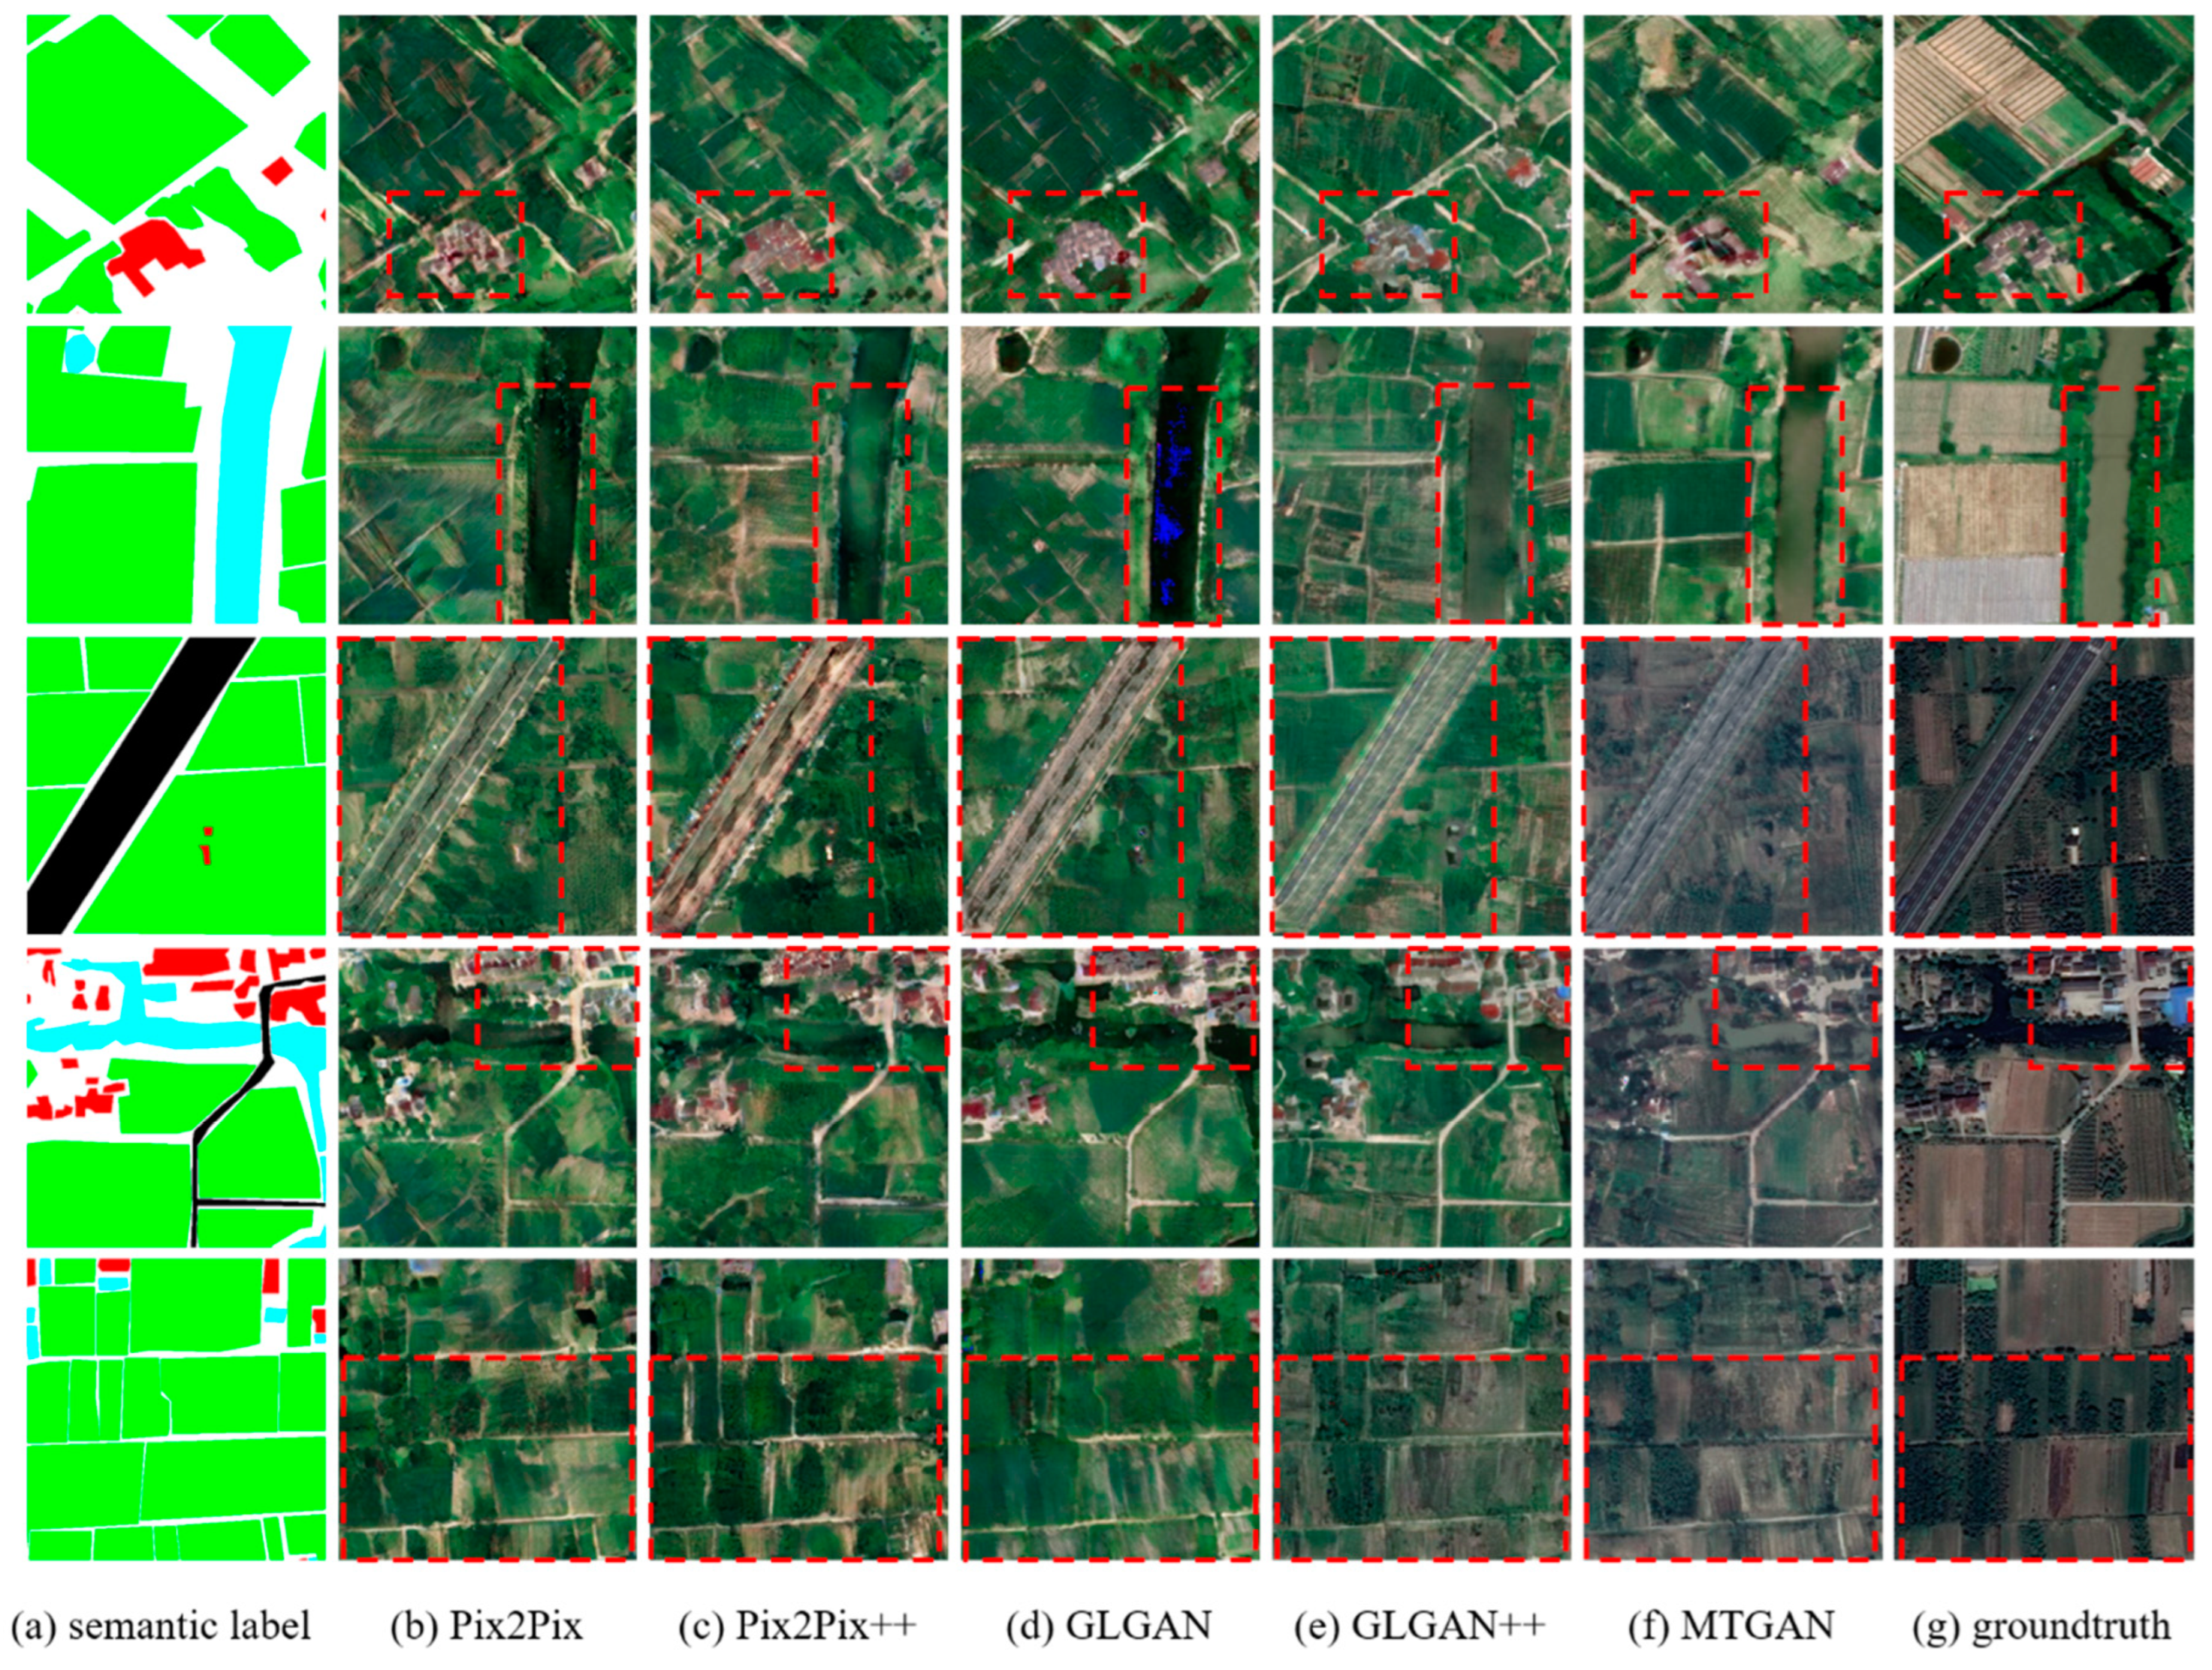
On the Wuzhen dataset, MTGAN's superior understanding of global context enables it to generate diverse remote sensing images, reflecting both lush spring/summer scenes and darker autumn/winter tones based on the layout features of the semantic image.
Figure 8.
The ablation experiment on the Wuzhen dataset.
3.5. Comparison Experiments
In order to further verify the effectiveness of MTGAN model, we respectively compare Pix2Pix [26], Pix2PixHD [28], GauGAN [29], DAGAN [30], DPGAN [31] and Lab2Pix-V2 [44] on the dataset of Chongzhou and Wuzhen. The evaluation indexes of the experimental results are shown in Table 3. To visualize the generating effect of different models, some of the experimental result images are given in this paper, as shown in Figure 9 and Figure 10.
The experimental results demonstrate that MTGAN achieves the highest accuracy on the Chongzhou dataset, with FWIoU and PA metrics consistently outperforming those of existing models. This suggests that MTGAN's generated images are more realistic and reliable, contributing to enhanced segmentation performance. Additionally, the FID and LPIPS scores for MTGAN-generated images show significant improvements, indicating that these images align more closely with real remote sensing data in both overall distribution and individual characteristics.
As shown in Figure 10, MTGAN produces images with clearer, more defined contours compared to other models, and maintains greater consistency in intra-class information for the same semantic label. Furthermore, MTGAN excels in generating realistic textures for less common features, such as water bodies and roads. In terms of background and vegetation, MTGAN offers richer color and texture details, resulting in generated images that are both more realistic and trustworthy.
For the Wuzhen dataset, Table 3 indicates that MTGAN-generated images significantly surpass existing methods across various metrics. The FID and LPIPS scores reveal that MTGAN images closely mimic real data in style and distribution. Moreover, the superior FWIoU and ACC metrics suggest that the generated images offer more relevant information for the U-Net segmentation network. MTGAN's advantage lies in its ability to produce vegetation with rich color and texture details, while also excelling in generating features with smaller sample sizes, such as buildings (6.50% of the sample) and roads (2.51% of the sample).
4. Discussion
4.1. Analysis of the Interpretability of Generated Images in Segmentation Models
Class Activation Mapping (CAM) [45] is a visualization method that generates a heatmap to visualize the contribution distribution of the original image to the predicted output by applying linear weighting to the feature maps. The CAM method proposed by Zhou et al. involves performing Global Average Pooling (GAP) on convolutional feature maps before the final output layer (softmax layer), using the pooled features as input to a fully connected layer to obtain classification results. By projecting the weights of the output layer back onto the convolutional feature maps, the importance of different image regions can be determined. Selvaraju et al. introduced Grad-CAM [46] as an improvement to the CAM method, using the gradient information of the class output at the last convolutional layer as an importance assessment of the activation units, facilitating understandable visualizations of the model output. Grad-CAM can be applied to multi-class classification problems, allowing each class to have independent explanations, while traditional CAM is limited to binary classification. Additionally, SEG-GRAD-CAM [47], proposed by Vinogradova et al., extends Grad-CAM for use in the semantic segmentation domain.
We utilize the principles of SEG-GRAD-CAM to visualize the CAM for five land cover types: vegetation, water, buildings, roads, and background, across multiple feature layers of the U-Net segmentation network. The feature layers examined include the output features of the second downsampling module, the bottleneck layer between the encoder and decoder, and the output features of the last upsampling module. The second downsampling module of the U-Net segmentation network is the initial convolutional layer, which primarily extracts low-level features such as edges and textures. Consequently, the generated heatmap highlights some edge-like structures in the image as shown in Figure 11. As the convolutional network deepens, it learns higher-level features, such as the shapes of objects, their components, and more abstract and complex spatial relationships. Thus, the heatmaps from the bottleneck layer and the final layer increasingly resemble the output segmentation masks.
We first input the real images into the segmentation network, as shown in Figure 11. Rows one to three of Figure 11 visualize the building class, with the first row representing factory buildings, the second row representing complex residential buildings, and the third row representing rural buildings. From the visualization results, it is evident that the segmentation contours of factory and residential buildings play a decisive role. Regardless of whether the heatmaps are generated from the initial convolutional features, the bottleneck layer, or the final layer, the contour areas of the buildings are highlighted. This indicates that the U-Net segmentation network focuses on the contour information of the buildings. Therefore, to improve the segmentation accuracy of the generated images, enhancing the generation of building contours is essential. For rural buildings, the contour information is relatively weak. The heatmaps generated from the second downsampling module and the bottleneck layer show that the segmentation of rural buildings is significantly influenced by the surrounding environment. Thus, the generated images should enhance the color differentiation between buildings and vegetation to improve the segmentation accuracy of rural buildings.
The fourth row of Figure 11 presents the visualization results for the background, where the heatmaps generated from the bottleneck layer and the final layer primarily highlight pixels that differ significantly from vegetation. Based on the background distribution in the dataset, some background data exhibit similarities to vegetation features. Therefore, to ensure high segmentation accuracy for the background, the generated physical characteristics of the background should maintain a difference from vegetation, minimizing confusion.
Rows five and six of Figure 11 show the visualization results for water and roads, respectively. The results indicate that the textural features of these land cover types are the main factors affecting their segmentation. These two classes have relatively low representation in the dataset, particularly water bodies, which are easily influenced by vegetation during the generation process, leading to artifacts that can impact the segmentation accuracy of U-Net. The seventh row displays the visualization results for vegetation, where the main factors affecting the segmentation accuracy are similarly the color and texture of the vegetation.
MTGAN's generated results achieved high FWIoU and OA overall, primarily due to its network model design principle of assigning a corresponding class-specific generator for each type of land cover. During the generation process, MTGAN is able to focus on the details of each land cover type while also considering global contextual information, thereby enhancing the generation quality for each category. Specifically, MTGAN improved the contour details of buildings, reduced artifacts caused by interference from other samples during water body generation, and enhanced the generation quality of roads, which occupy a smaller proportion of the samples, thus improving the overall quality of the generated remote sensing images.
Figure 12 shows some CAM visualization results of the generated images and the final segmentation results. The first to third rows in the figure display the segmentation results represented by factory buildings, complex residential buildings, and rural buildings. Since MTGAN can generate images with well-defined contours, the buildings exhibit good segmentation performance. The fourth row of Figure 12 shows the segmentation results of the generated image background, where the color and texture features of the background are more aligned with actual ground features, reducing confusion with vegetation characteristics. Furthermore, the segmentation results and visualization of water bodies, roads, and vegetation from the fifth to seventh rows of the generated images demonstrate that MTGAN not only ensures the quality of generation for land covers with a large sample proportion but also enhances the generation quality of those with a smaller sample proportion.
4.2. The Effect of Adding Generated Samples on Segmentation Accuracy
The primary objective of this paper is to augment the sample dataset to enhance semantic segmentation tasks in typical land cover remote sensing images. We propose the MTGAN generative model, which demonstrates superior results compared to existing models.
To determine the optimal dataset size and the number of generated images for maximizing segmentation accuracy, we designed the following experiment. First, we created datasets of different sizes by randomly selecting images from the original Chongzhou dataset at 80%, 60%, and 40% sizes, and from the Wuzhen dataset at 90%, 70%, and 50% sizes. This resulted in datasets of varying sizes, as detailed in Table 4. Next, synthetic samples were generated using the trained MTGAN on these datasets of different sizes and added to the corresponding real datasets for training the U-Net network. Segmentation accuracy, assessed by FWIoU and OA, was then measured to evaluate improvements in these metrics.
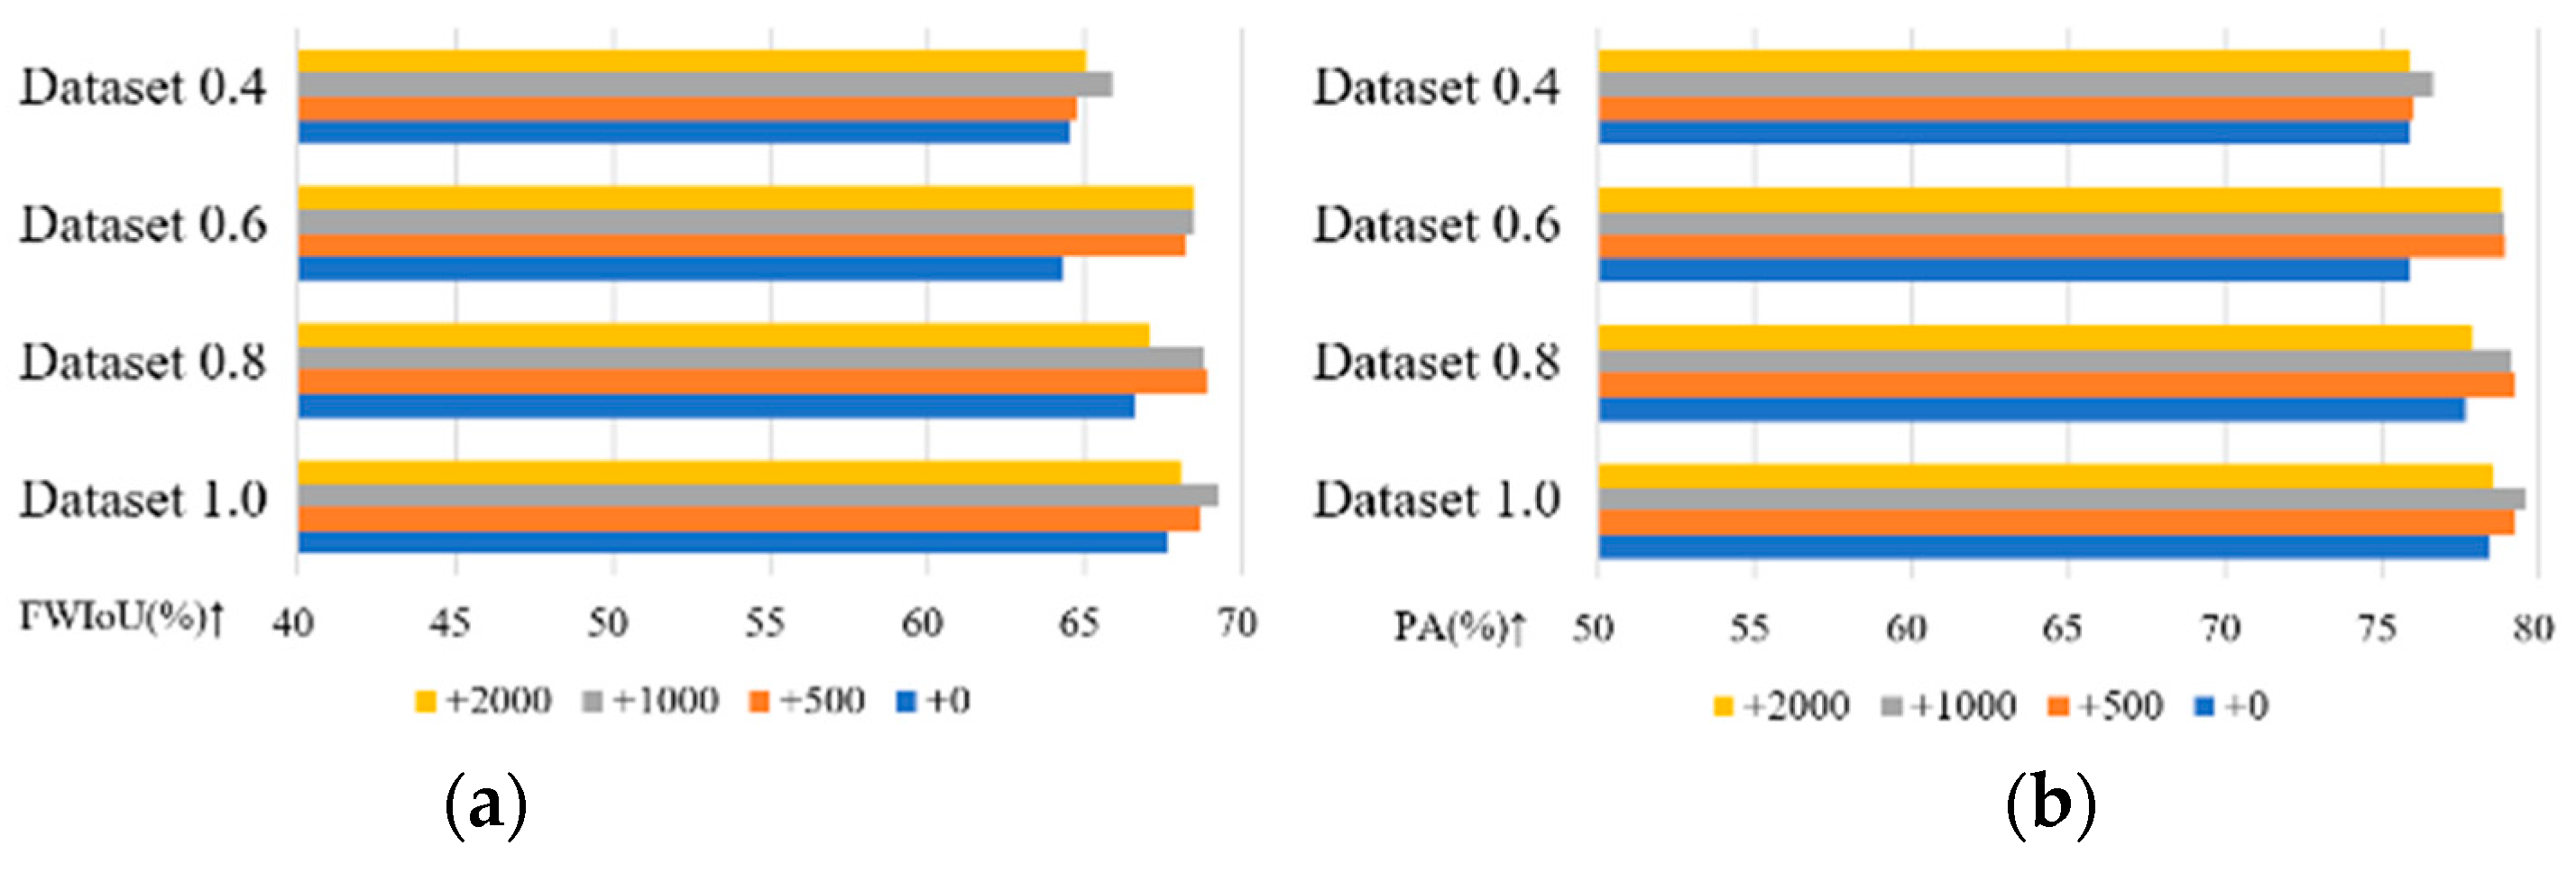
For the Chongzhou dataset, 2000 semantic images were created. Samples generated by the MTGAN model were progressively added to the original training sets, with increments of 500, 500, and 1000 samples, resulting in a total of 500, 1000, and 2000 generated samples. The U-Net segmentation network was then retrained with these augmented datasets. In the case of the Wuzhen dataset, a similar approach was applied. However, due to its simpler image distribution, only 500 samples were incrementally added, totaling 500, 1000, and 1500 generated samples in the training set. The U-Net segmentation network was retrained accordingly. In summary, the training processes were consistent across all datasets. After training, the segmentation performance (FWIoU and OA) of U-Net on the respective test sets was assessed to analyze the impact of the different amounts of generated samples on segmentation accuracy. Table 5 summarizes the FWIoU and OA metrics for the different-sized Chongzhou datasets, both before and after the incremental addition of generated samples.
Incorporating generated samples into the training set improves the metrics on the test sets across various-sized Chongzhou datasets. The most significant enhancement in segmentation metrics occurs with the addition of 500 generated samples. However, as more samples are included, the improvement becomes less pronounced and may even decline in some cases. For example, in the datasets 1.0 and 0.6, a substantial increase in segmentation metrics is observed after adding 500 generated samples, but the improvement diminishes with the addition of 1000 samples, and the metrics decrease when 2000 samples are added. Specifically, dataset 0.6, which has a training set of 507 and a test set of 127, shows the most notable improvement after incorporating generated samples.
Figure 13.
The impact of different-sized datasets on the accuracy of U-Net in generating images with MTGAN in Chongzhou. (a) The impact on FWIoU; (b) The impact on OA.
Figure 13.
The impact of different-sized datasets on the accuracy of U-Net in generating images with MTGAN in Chongzhou. (a) The impact on FWIoU; (b) The impact on OA.
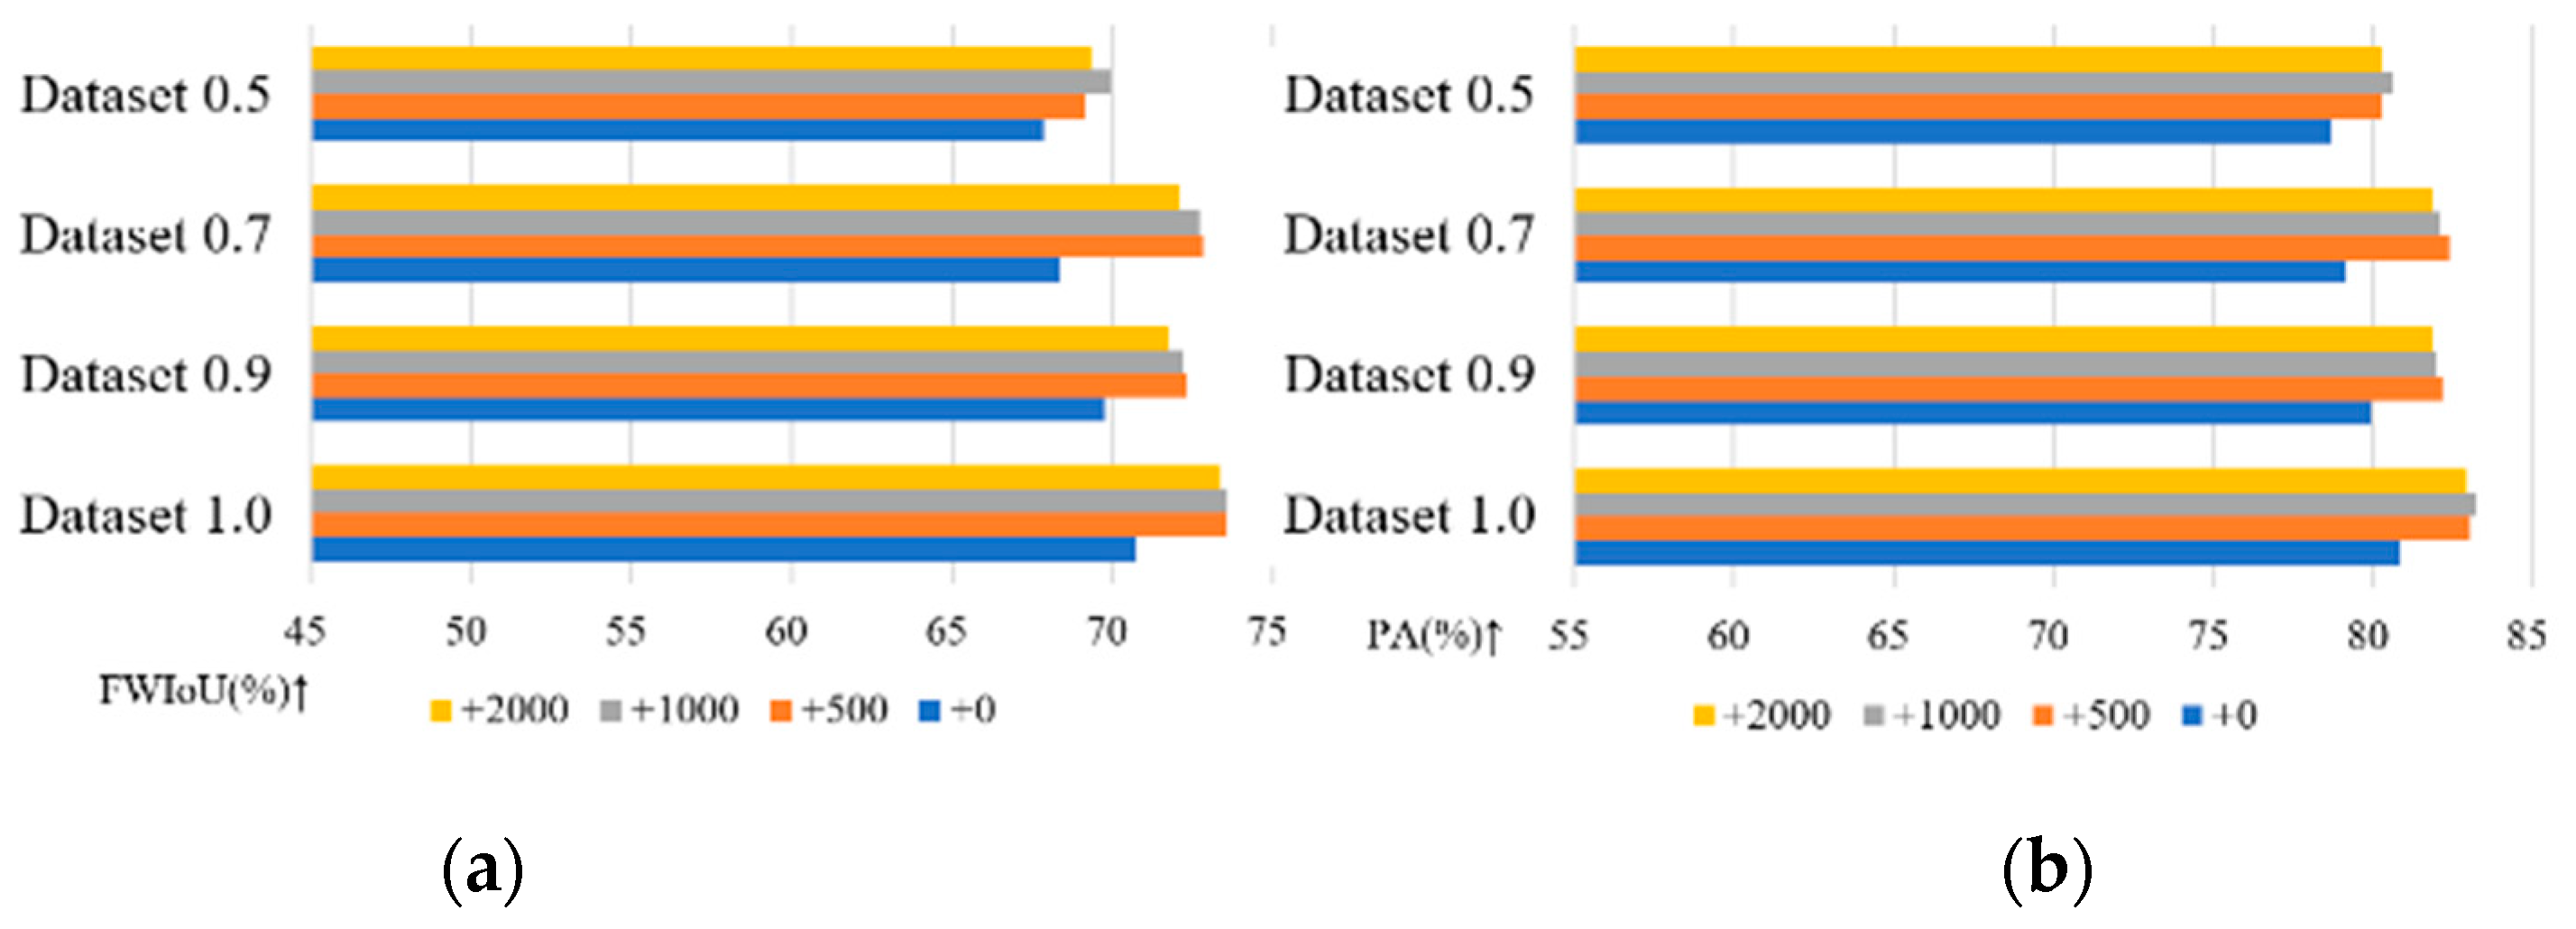
The statistics of segmentation metrics, including FWIoU and OA, on the test set for different-sized Wuzhen datasets are summarized in Table 6. This table includes results both before and after the addition of 500, 1000, and 1500 generated samples.
Similar to the Chongzhou dataset, the trend for the different-sized Wuzhen datasets indicates that adding generated samples improves segmentation metrics on the test set. Specifically, the addition of 500 samples yields the most significant improvement, while larger additions tend to decrease accuracy, except for dataset 0.4. Notably, dataset 0.7, with 493 training samples and 123 test samples, shows the greatest enhancement after incorporating generated samples.
Figure 14.
The impact of different-sized datasets on the accuracy of U-Net in generating images with MTGAN in Wuzhen. (a) The impact on FWIoU; (b) The impact on OA.
Figure 14.
The impact of different-sized datasets on the accuracy of U-Net in generating images with MTGAN in Wuzhen. (a) The impact on FWIoU; (b) The impact on OA.
Overall, including MTGAN-generated images enhances U-Net's effectiveness in analyzing remote sensing images, improving segmentation metrics. However, excessive generated samples can introduce noise and reduce performance, highlighting the need for an optimal balance. The results suggest that for U-Net training, adding around 500 generated samples achieves a good balance between enhancing segmentation accuracy and maintaining a manageable training process, especially when the training set contains approximately 500 samples.
5. Conclusions
In this paper, we propose a Generative Adversarial Network (GAN)-based model to enhance semantic segmentation of remote sensing images by addressing the need for diverse samples. We tackle key challenges in existing models, such as insufficient texture details for underrepresented land cover classes and the presence of unrealistic textures within certain land cover types. Our approach focuses on two main aspects:
We design MTGAN to generate remote sensing images from semantic labels. The model features a dual-branch architecture, with a global generator capturing the overall image structure and land cover class-specific generators improving the quality and differentiation of land cover types. We evaluate the image generation quality on the Chongzhou and Wuzhen datasets, where our model outperforms others in terms of both FID and LPIPS scores.
We train both MTGAN and U-Net on datasets of varying sizes from Chongzhou and Wuzhen. Adding generated samples to the original datasets significantly boosts U-Net performance. For instance, on the Chongzhou dataset, adding 500 generated samples to a training set of around 500 images improves FWIoU and OA by 3.89% and 3.07%, respectively. Similarly, on the Wuzhen dataset, this addition results in improvements of 4.47% and 3.23%.
In summary, in the task of generating remote sensing images through semantic image synthesis based on GANs, we have made various targeted improvements to the generative model, yielding promising research outcomes. However, there is still room for improvement in this paper. The generative model presented is a supervised one-to-one generation mode, where one semantic label generates one style of image. One of the future research directions is to construct a multimodal remote sensing image generation network that enables a single semantic label to generate multiple styles of images.
Author Contributions
Conceptualization, Y.G. and Y.L.; methodology, Z.N. and Y.G.; software, Y.G. and Y.X.; validation, Z.N., Y.G. and J.Z.; resources, L.H.; writing—original draft preparation, Z.N.; writing—review and editing, Y.L. and Y.G.; visualization, J.Z. and L.H.; supervision, Y.L.; project administration, L.H. and Y.L.; funding acquisition, L.H. All authors have read and agreed to the published version of the manuscript.
Funding
This work was supported by the Science and Technology Support Project of Sichuan Province under Grant 2023YFS0366 and 2024YFFK0414,in part by the Key Projects of Global Change and Response of Ministry of Science and Technology of China under Grant 2020YFA0608203.
Data Availability Statement
For more information on the Chongzhou and Wuzhen datasets, please contact the authors.
Acknowledgments
We sincerely thank the editors and reviewers for their insightful comments and suggestions, which have significantly enhanced the quality of our manuscript.
Conflicts of Interest
The authors declare no conflicts of interest.
References
- Zhao, C.; Ogawa, Y.; Chen, S.; Yang, Z.; Sekimoto, Y. Label Freedom: Stable Diffusion for Remote Sensing Image Semantic Segmentation Data Generation. In Proceedings of the 2023 IEEE International Conference on Big Data (BigData); IEEE: 2023; pp. 1022–1030.
- Khanna, S.; Liu, P.; Zhou, L.; Meng, C.; Rombach, R.; Burke, M.; Ermon, S. DiffusionSat: A Generative Foundation Model for Satellite Imagery. arXiv 2023, arXiv:2312.03606.
- Dao, T.; Gu, A.; Ratner, A.; Smith, V.; DeSa, C.; Ré, C. A Kernel Theory of Modern Data Augmentation. In Proceedings of the International Conference on Machine Learning; 2019; pp. 1528–1537.
- Mumuni, A.; Mumuni, F. Data Augmentation: A Comprehensive Survey of Modern Approaches. Array 2022, 16, 100258. [CrossRef]
- Perez, L.; Wang, J. The Effectiveness of Data Augmentation in Image Classification Using Deep Learning. arXiv 2017, arXiv:1712.04621.
- Zhang, H.; Cisse, M.; Dauphin, Y. N.; Lopez-Paz, D. Mixup: Beyond Empirical Risk Minimization. arXiv 2017, arXiv:1710.09412.
- Yun, S.; Han, D.; Oh, S. J.; Chun, S.; Choe, J.; Yoo, Y. CutMix: Regularization Strategy to Train Strong Classifiers with Localizable Features. In Proceedings of the IEEE/CVF International Conference on Computer Vision; 2019; pp. 6023–6032.
- Shi, J.; Ghazzai, H.; Massoud, Y. Differentiable Image Data Augmentation and Its Applications: A Survey. IEEE Transactions on Pattern Analysis and Machine Intelligence 2024, 46(2), 1148–1164. [CrossRef]
- Ma, D.; Tang, P.; Zhao, L.; Zhang, Z. A Review of Deep Learning Image Data Augmentation Methods. Journal of Image and Graphics 2021, 26(3), 487–502.
- Goodfellow, I.; Pouget-Abadie, J.; Mirza, M.; et al. Generative Adversarial Nets. In Proceedings of the Neural Information Processing Systems; MIT Press: 2014.
- Wang, C.; Chen, B.; Zou, Z.; Shi, Z. Remote Sensing Image Synthesis via Semantic Embedding Generative Adversarial Networks. IEEE Transactions on Geoscience and Remote Sensing 2023, 61, 1–11. [CrossRef]
- Kuang, Y.; Ma, F.; Li, F.; Liu, Y.; Zhang, F. Semantic-Layout-Guided Image Synthesis for High-Quality Synthetic-Aperature Radar Detection Sample Generation. Remote Sens. 2023, 15, 5654. [CrossRef]
- Remusati, H.; Le Caillec, J.-M.; Schneider, J.-Y.; Petit-Frère, J.; Merlet, T. Generative Adversarial Networks for SAR Automatic Target Recognition and Classification Models Enhanced Explainability: Perspectives and Challenges. Remote Sens. 2024, 16, 2569. [CrossRef]
- Fu, Q.; Xia, S.; Kang, Y.; Sun, M.; Tan, K. Satellite Remote Sensing Grayscale Image Colorization Based on Denoising Generative Adversarial Network. Remote Sens. 2024, 16, 3644. [CrossRef]
- Rui, X.; Cao, Y.; Yuan, X.; Kang, Y.; Song, W. DisasterGAN: Generative Adversarial Networks for Remote Sensing Disaster Image Generation. Remote Sens. 2021, 13, 4284. [CrossRef]
- Arjovsky, M.; Chintala, S.; Bottou, L. Wasserstein Generative Adversarial Networks. In Proceedings of the International Conference on Machine Learning; 2017; pp. 214–223.
- Simonyan, K.; Zisserman, A. Very Deep Convolutional Networks for Large-Scale Image Recognition. Computer Science 2014. [CrossRef]
- Kong, X.; Shen, Z.; Chen, S. A GAN-Based Algorithm for Generating Samples of Pedestrians in High-Speed Railway Perimeter Environment. Railway Perimeter Environment 2019, 55(7), 57–61.
- Isola, P.; Zhu, J. Y.; Zhou, T.; et al. Image-to-Image Translation with Conditional Adversarial Networks. In Proceedings of the IEEE Conference on Computer Vision and Pattern Recognition; 2017; pp. 1125–1134. [CrossRef]
- Ouyang, X.; Cheng, Y.; Jiang, Y.; et al. Pedestrian-Synthesis-GAN: Generating Pedestrian Data in Real Scene and Beyond. arXiv 2018. [CrossRef]
- Yang, S. Research on Image Generation and Velocity Estimation Based on Generative Adversarial Networks. Master’s Thesis, Zhejiang University of Technology, 2019.
- Wang, Y.; Wang, H.; Xu, T. Aircraft Recognition of Remote Sensing Image Based on Samples Generated by CGAN. Journal of Image and Graphics 2021, 26(3), 663–673. [CrossRef]
- Jiang, Y.; Zhu, B. Data Augmentation for Remote Sensing Image Based on Generative Adversarial Networks under Condition of Few Samples. Journal Name 2021, 58(8), 238–244.
- Karras, T.; Laine, S.; Aittala, M.; et al. Analyzing and Improving the Image Quality of StyleGAN. In Proceedings of the IEEE/CVF Conference on Computer Vision and Pattern Recognition; 2020; pp. 8110–8119. [CrossRef]
- Redmon, J.; Farhadi, A. YOLOv3: An Incremental Improvement. arXiv 2018. [CrossRef]
- Isola, P.; Zhu, J. Y.; Zhou, T.; et al. Image-to-Image Translation with Conditional Adversarial Networks. In Proceedings of the IEEE Conference on Computer Vision and Pattern Recognition; 2017; pp. 1125–1134.
- Ronneberger, O.; Fischer, P.; Brox, T. U-Net: Convolutional Networks for Biomedical Image Segmentation. In Medical Image Computing and Computer-Assisted Intervention—MICCAI 2015: 18th International Conference, Munich, Germany, October 5–9, Proceedings, Part III; 2015; pp. 234–241.
- Wang, T. C.; Liu, M. Y.; Zhu, J. Y.; et al. High-Resolution Image Synthesis and Semantic Manipulation with Conditional GANs. In Proceedings of the IEEE Conference on Computer Vision and Pattern Recognition; 2018; pp. 8798–8807. [CrossRef]
- Park, T.; Liu, M. Y.; Wang, T. C.; et al. Semantic Image Synthesis with Spatially-Adaptive Normalization. In Proceedings of the IEEE/CVF Conference on Computer Vision and Pattern Recognition; 2019; pp. 2337–2346.
- Tang, H.; Bai, S.; Sebe, N. Dual Attention GANs for Semantic Image Synthesis. In Proceedings of the 28th ACM International Conference on Multimedia; 2020; pp. 1994–2002. [CrossRef]
- Tang, H.; Sebe, N. Layout-to-Image Translation with Double Pooling Generative Adversarial Networks. IEEE Transactions on Image Processing 2021, 30, 7903–7913. [CrossRef]
- Tang, H.; Xu, D.; Yan, Y.; et al. Local Class-Specific and Global Image-Level Generative Adversarial Networks for Semantic-Guided Scene Generation. In Proceedings of the IEEE/CVF Conference on Computer Vision and Pattern Recognition; 2020; pp. 7870–7879. [CrossRef]
- Li, Y.; Li, Y.; Lu, J.; et al. Collaging Class-Specific GANs for Semantic Image Synthesis. In Proceedings of the IEEE/CVF International Conference on Computer Vision; 2021; pp. 14418–14427. [CrossRef]
- Zhu, P.; Abdal, R.; Qin, Y.; et al. SEAN: Image Synthesis with Semantic Region-Adaptive Normalization. In Proceedings of the IEEE/CVF Conference on Computer Vision and Pattern Recognition; 2020; pp. 5104–5113.
- Tan, Z.; Chen, D.; Chu, Q.; et al. Efficient Semantic Image Synthesis via Class-Adaptive Normalization. IEEE Transactions on Pattern Analysis and Machine Intelligence 2021, 44(9), 4852–4866. [CrossRef]
- Berrada, T.; Verbeek, J.; Couprie, C.; Alahari, K. Unlocking Pre-Trained Image Backbones for Semantic Image Synthesis. In Proceedings of the 2024 IEEE/CVF Conference on Computer Vision and Pattern Recognition (CVPR); Seattle, WA, USA, 2024; pp. 7840–7849. [CrossRef]
- Caesar, H.; Uijlings, J.; Ferrari, V. COCO-Stuff: Thing and Stuff Classes in Context. In Proceedings of the IEEE Conference on Computer Vision and Pattern Recognition; 2018; pp. 1209–1218.
- Cordts, M.; Omran, M.; Ramos, S.; Rehfeld, T.; Enzweiler, M.; Benenson, R.; Schiele, B. The Cityscapes Dataset for Semantic Urban Scene Understanding. In Proceedings of the IEEE Conference on Computer Vision and Pattern Recognition; 2016; pp. 3213–3223.
- Zhou, B.; Zhao, H.; Puig, X.; Fidler, S.; Barriuso, A.; Torralba, A. Scene Parsing through ADE20K Dataset. In Proceedings of the IEEE Conference on Computer Vision and Pattern Recognition; 2017; pp. 633–641.
- Simonyan, K.; Zisserman, A. Very Deep Convolutional Networks for Large-Scale Image Recognition. arXiv 2014. [CrossRef]
- Heusel, M.; Ramsauer, H.; Unterthiner, T.; Nessler, B.; Hochreiter, S. GANs Trained by a Two Time-Scale Update Rule Converge to a Local Nash Equilibrium. In Proceedings of the Advances in Neural Information Processing Systems; 2017; vol. 30, pp. 1–12.
- Tong, X.-Y.; et al. Land-Cover Classification with High-Resolution Remote Sensing Images Using Transferable Deep Models. Remote Sensing of Environment 2020, 237, Art. no. 111322. [CrossRef]
- Zhang, R.; Isola, P.; Efros, A. A.; Shechtman, E.; Wang, O. The Unreasonable Effectiveness of Deep Features as a Perceptual Metric. In Proceedings of the IEEE/CVF Conference on Computer Vision and Pattern Recognition; Jun. 2018; pp. 586–595.
- Zhu, J.; et al. Label-Guided Generative Adversarial Network for Realistic Image Synthesis. IEEE Transactions on Pattern Analysis and Machine Intelligence 2023, 45(3), 3311–3328. [CrossRef]
- Zhou, B.; Khosla, A.; Lapedriza, A.; et al. Learning Deep Features for Discriminative Localization. In Proceedings of the IEEE Conference on Computer Vision and Pattern Recognition; 2016; pp. 2921–2929.
- Selvaraju, R. R.; Cogswell, M.; Das, A.; et al. Grad-CAM: Visual Explanations from Deep Networks via Gradient-Based Localization. In Proceedings of the IEEE International Conference on Computer Vision; 2017; pp. 618–626.
- Vinogradova, K.; Dibrov, A.; Myers, G. Towards Interpretable Semantic Segmentation via Gradient Weighted Class Activation Mapping (Student Abstract). In Proceedings of the AAAI Conference on Artificial Intelligence; 2020; pp. 13943–13944.
Figure 1.
The network structure of MTGAN.
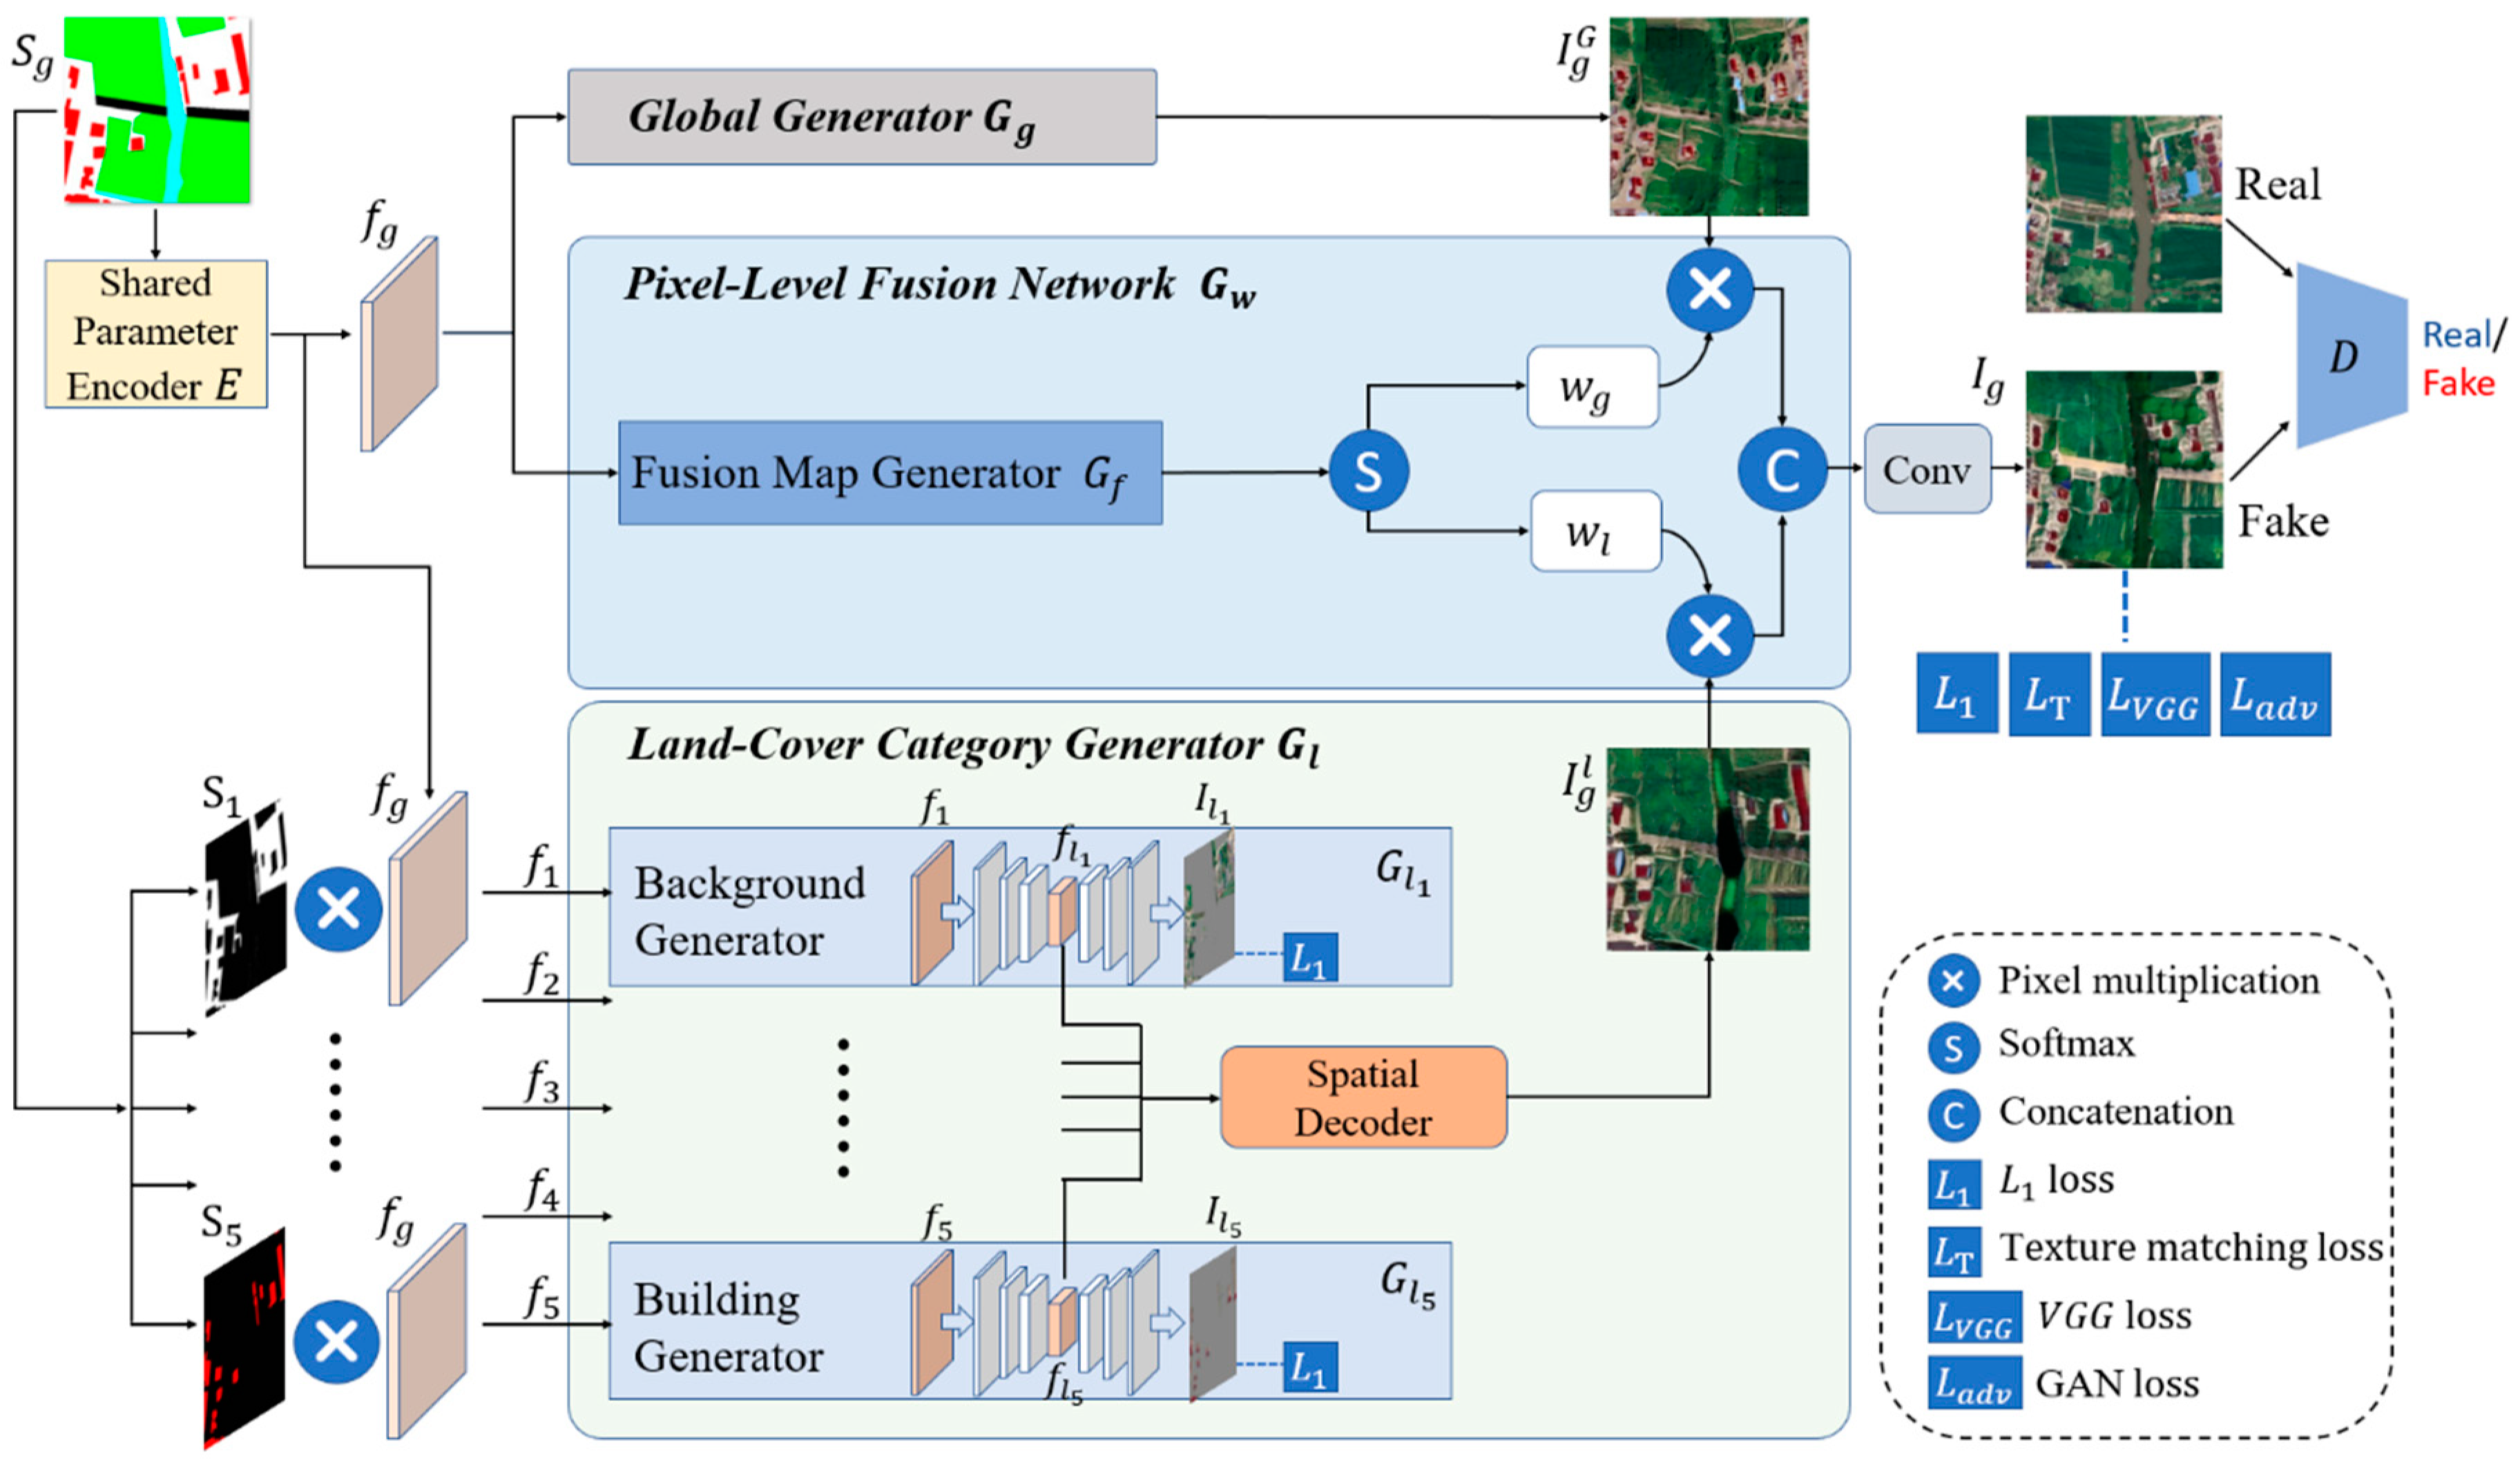
Figure 2.
The structure of shared parameter encoder.
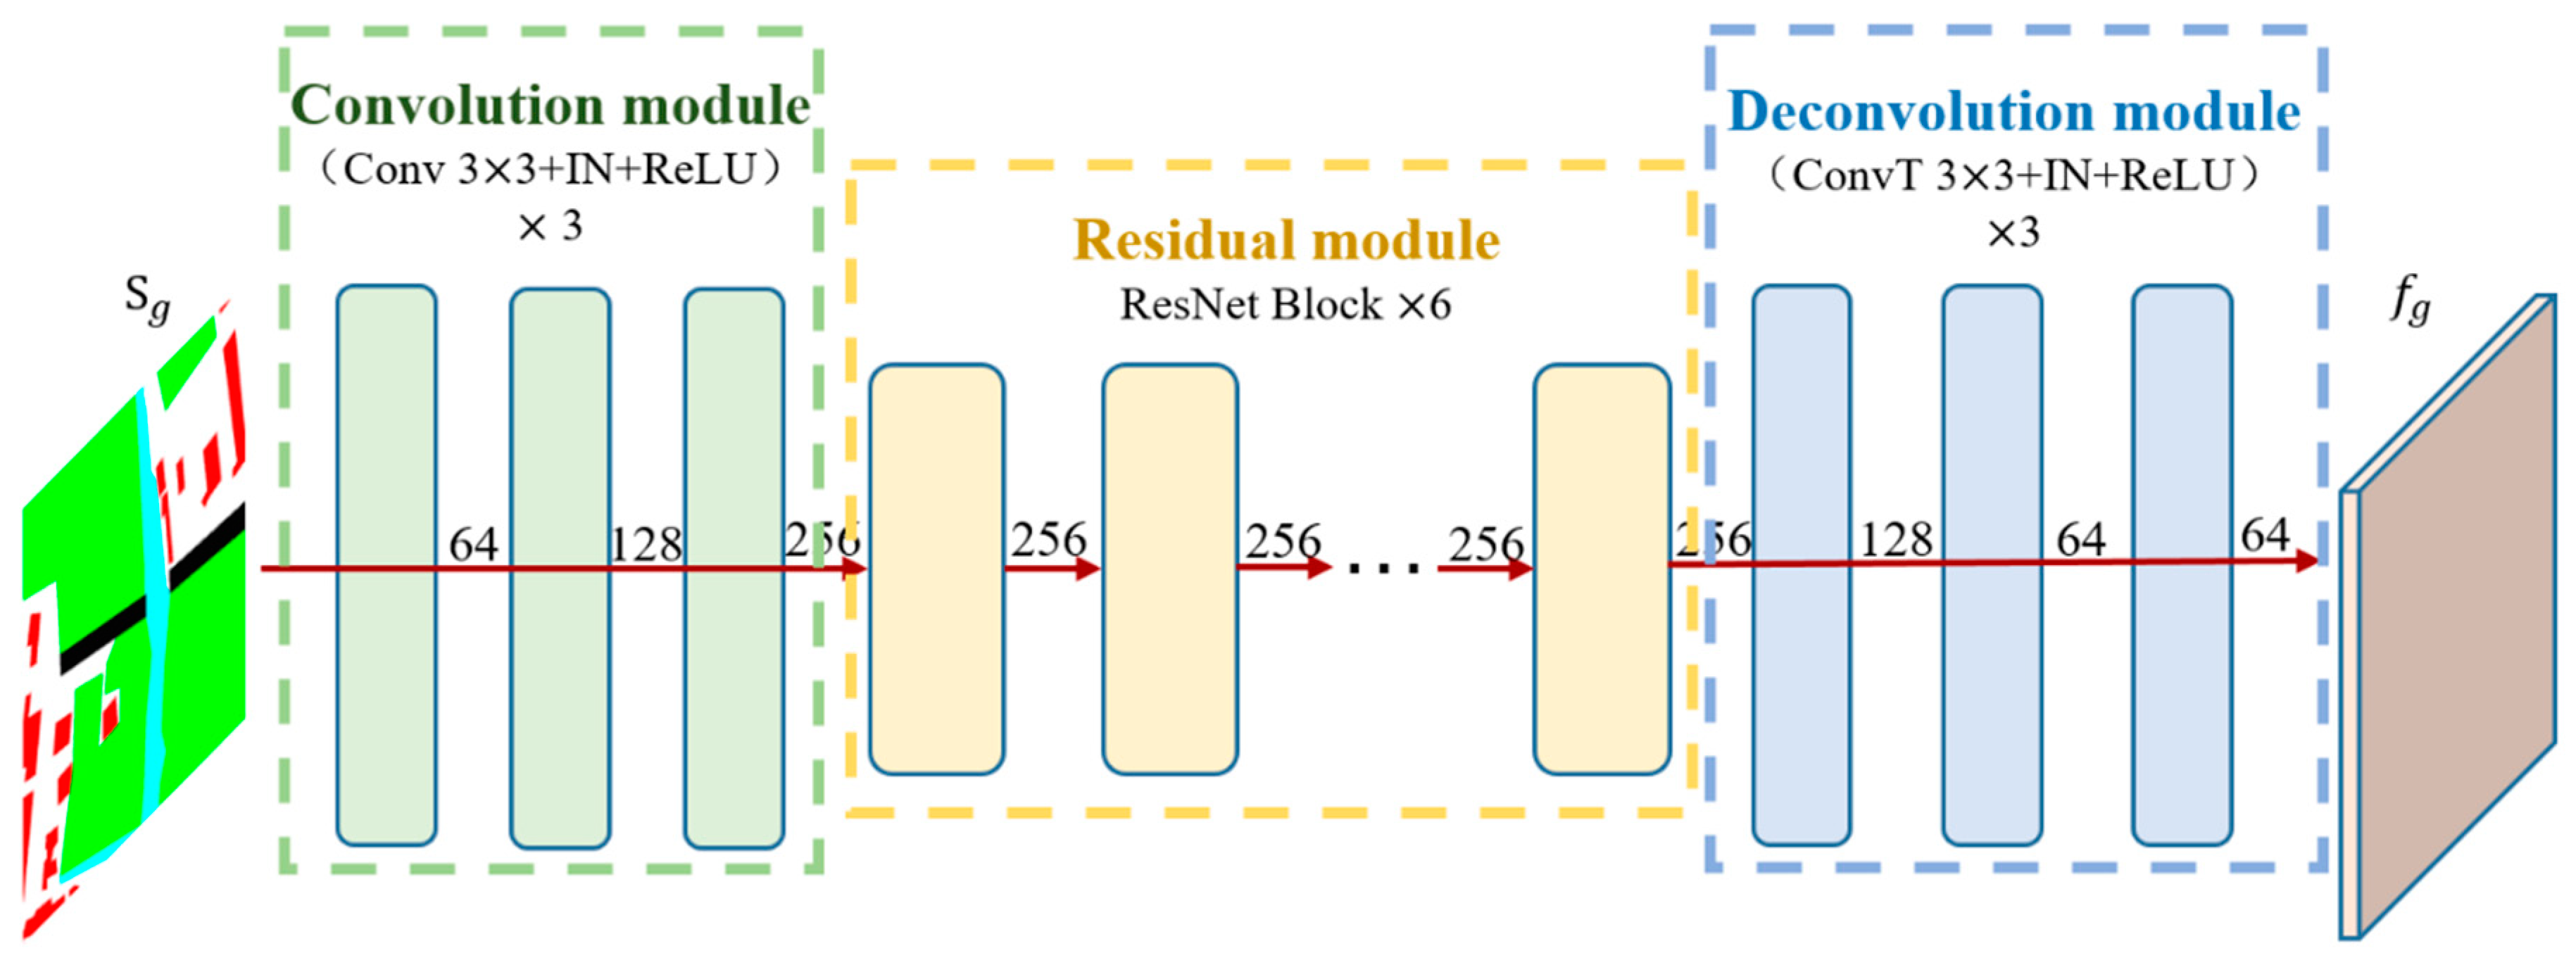
Figure 4.
(a) The proportion of geographic features on the Chongzhou dataset; (b) The proportion of geographic features on the Wuzhen dataset.
Figure 4.
(a) The proportion of geographic features on the Chongzhou dataset; (b) The proportion of geographic features on the Wuzhen dataset.
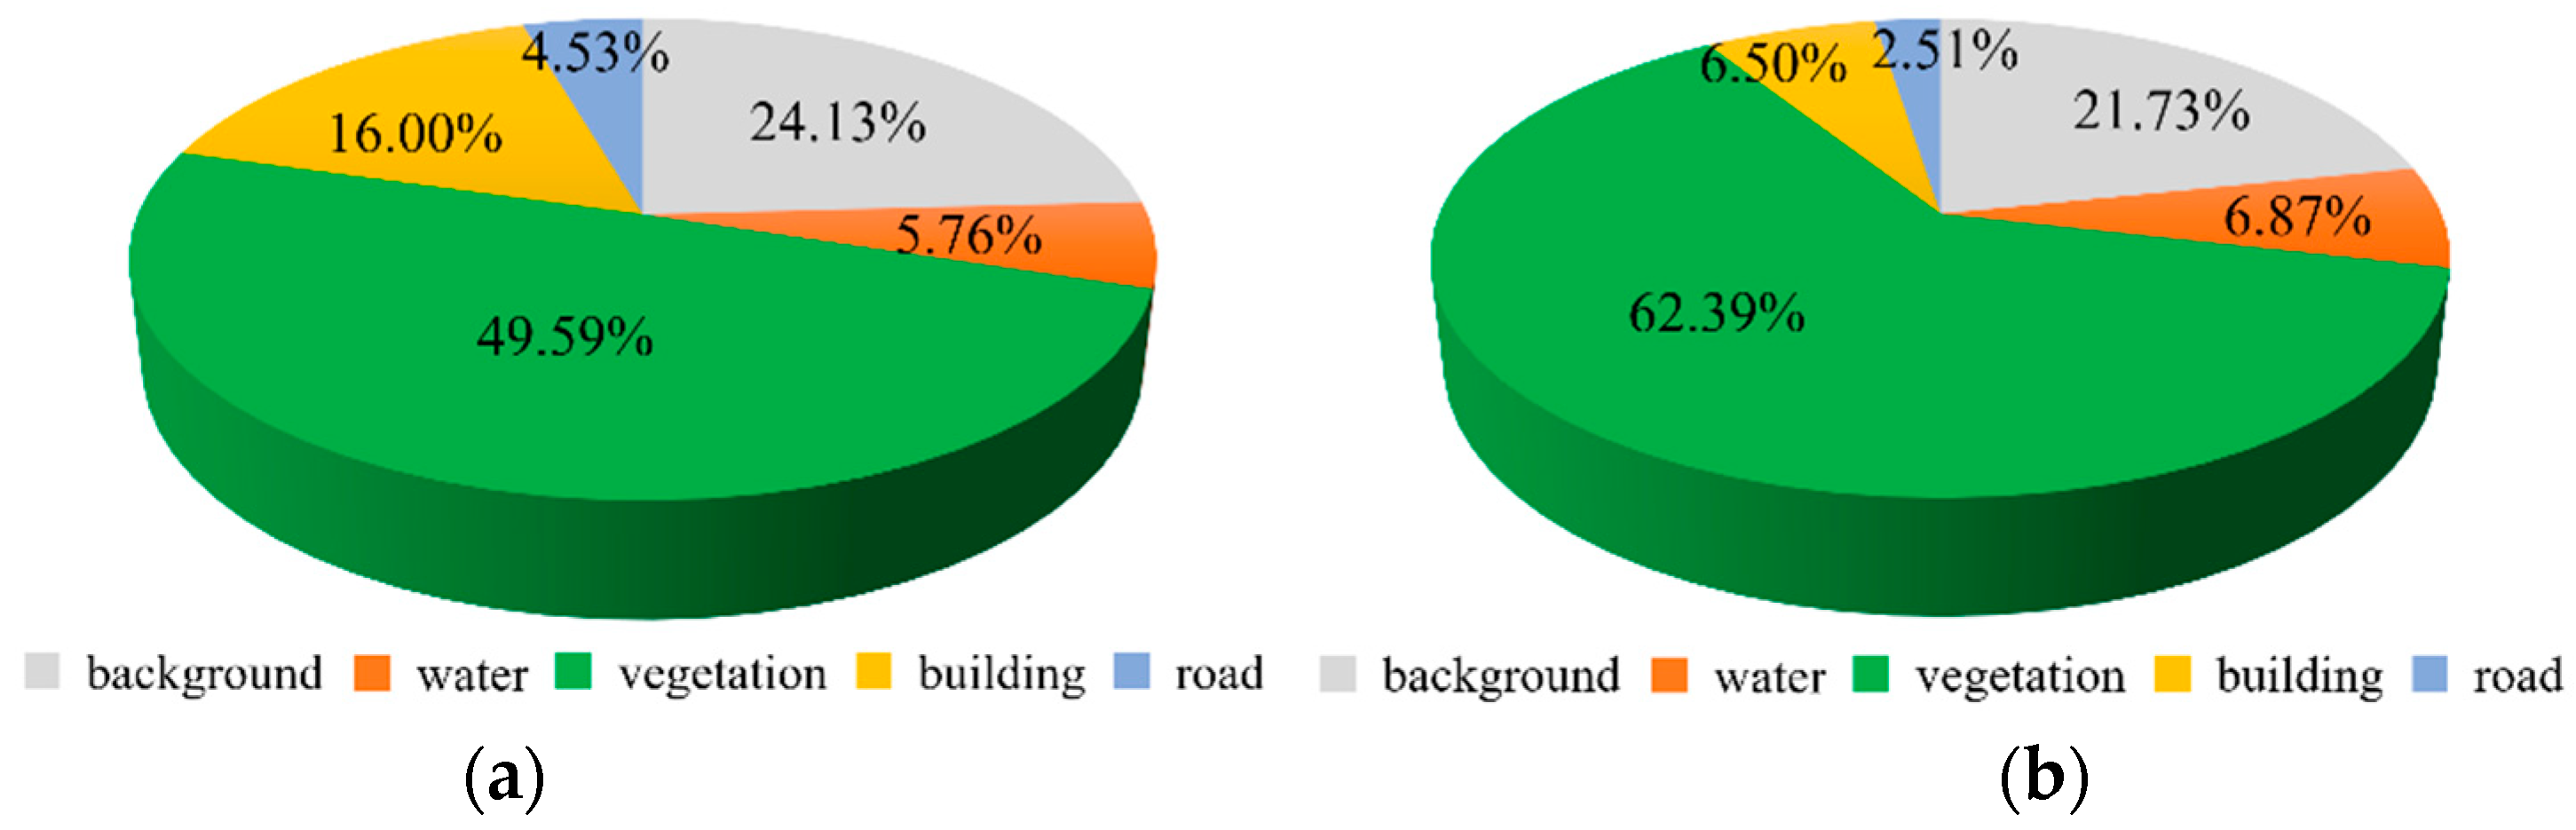
Figure 6.
The partial DBGAN generated images. left: semantic label; middle: generated image; right: real image. (a) Chongzhou; (b) Wuzhen.
Figure 6.
The partial DBGAN generated images. left: semantic label; middle: generated image; right: real image. (a) Chongzhou; (b) Wuzhen.
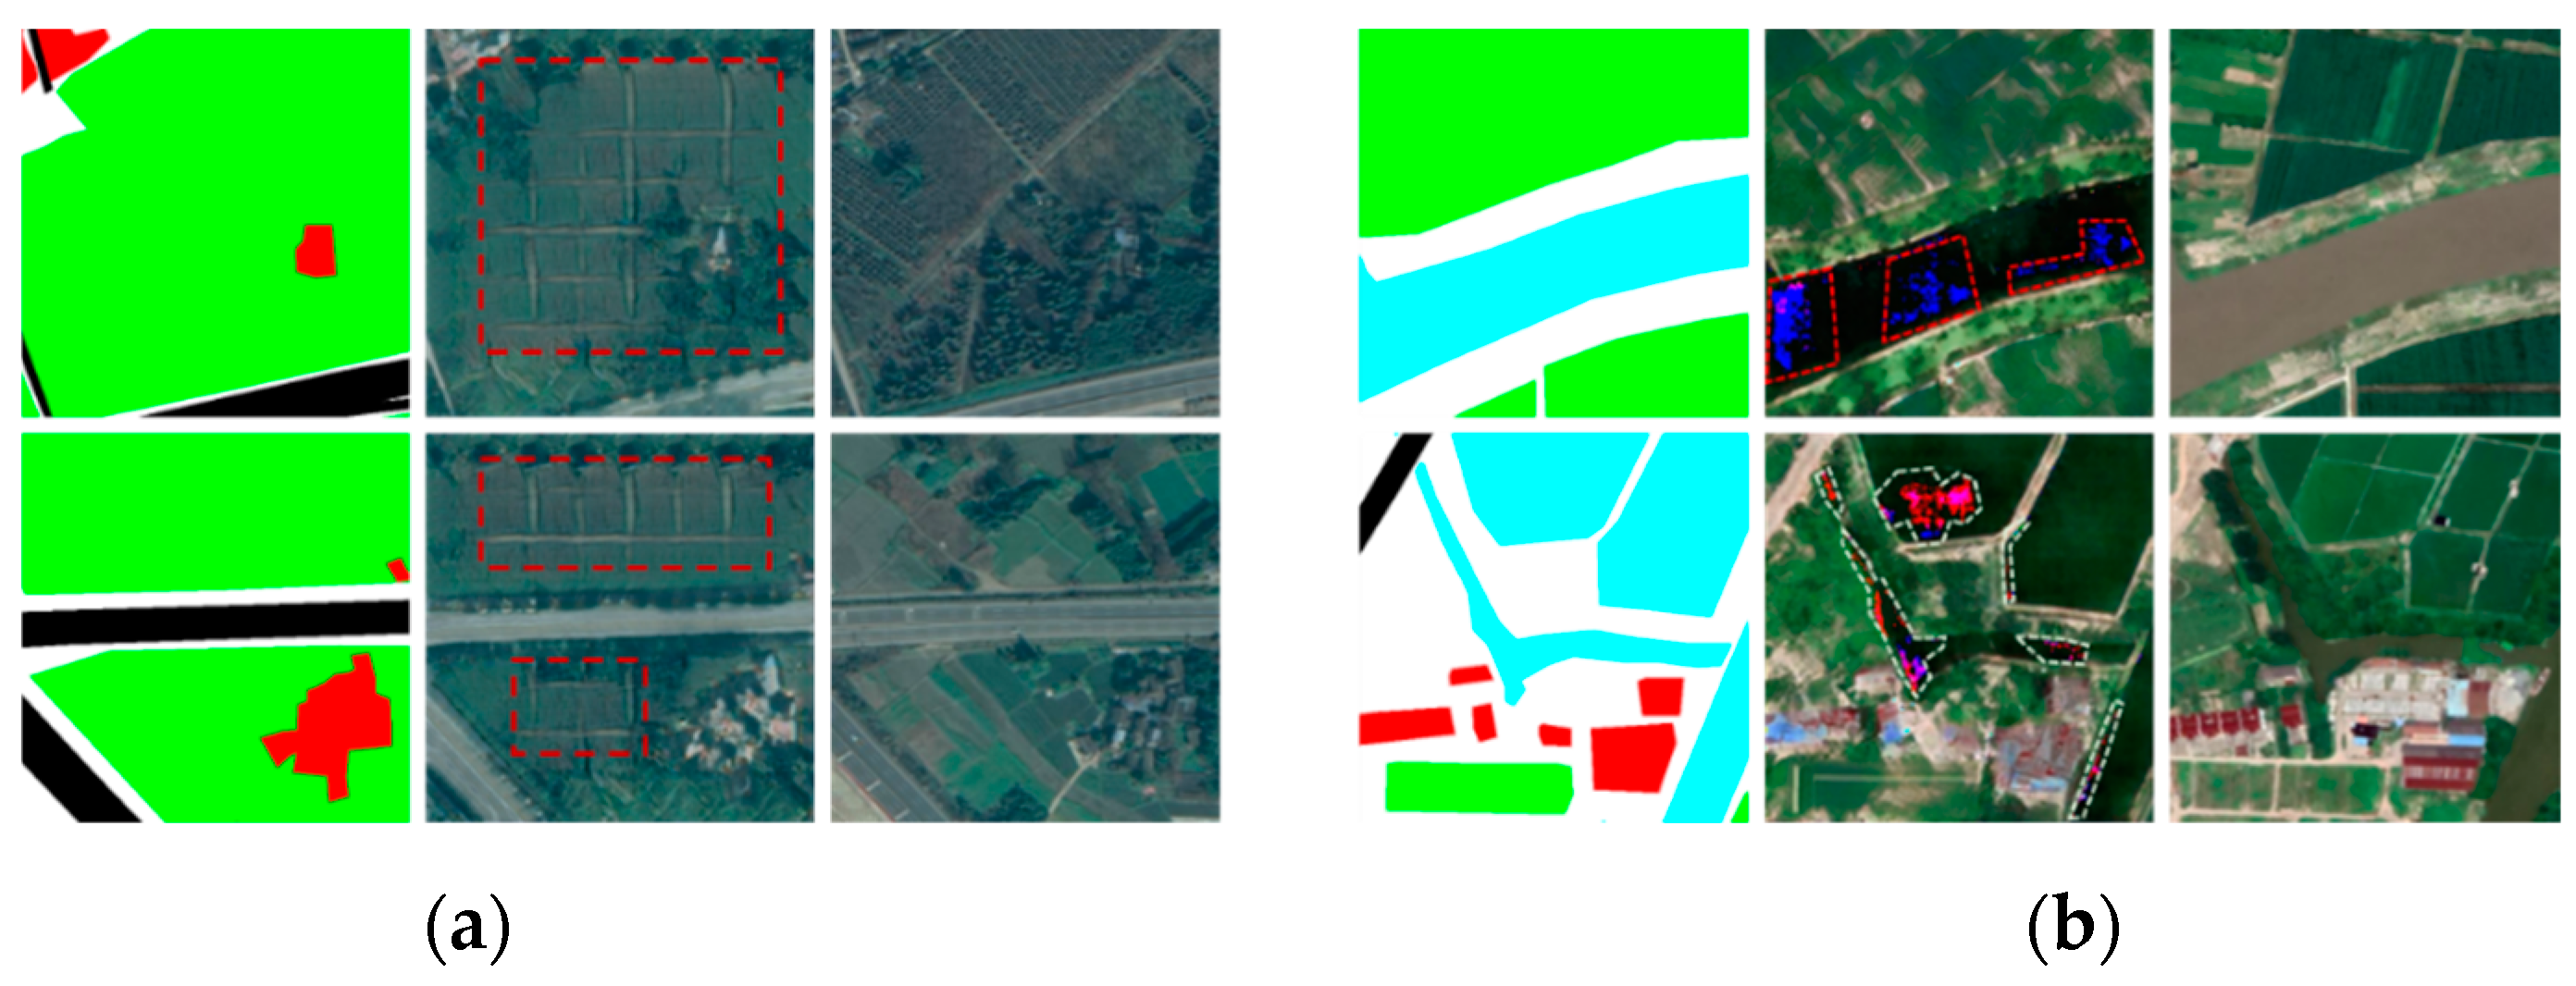
Figure 9.
The generated results on the Chongzhou dataset.
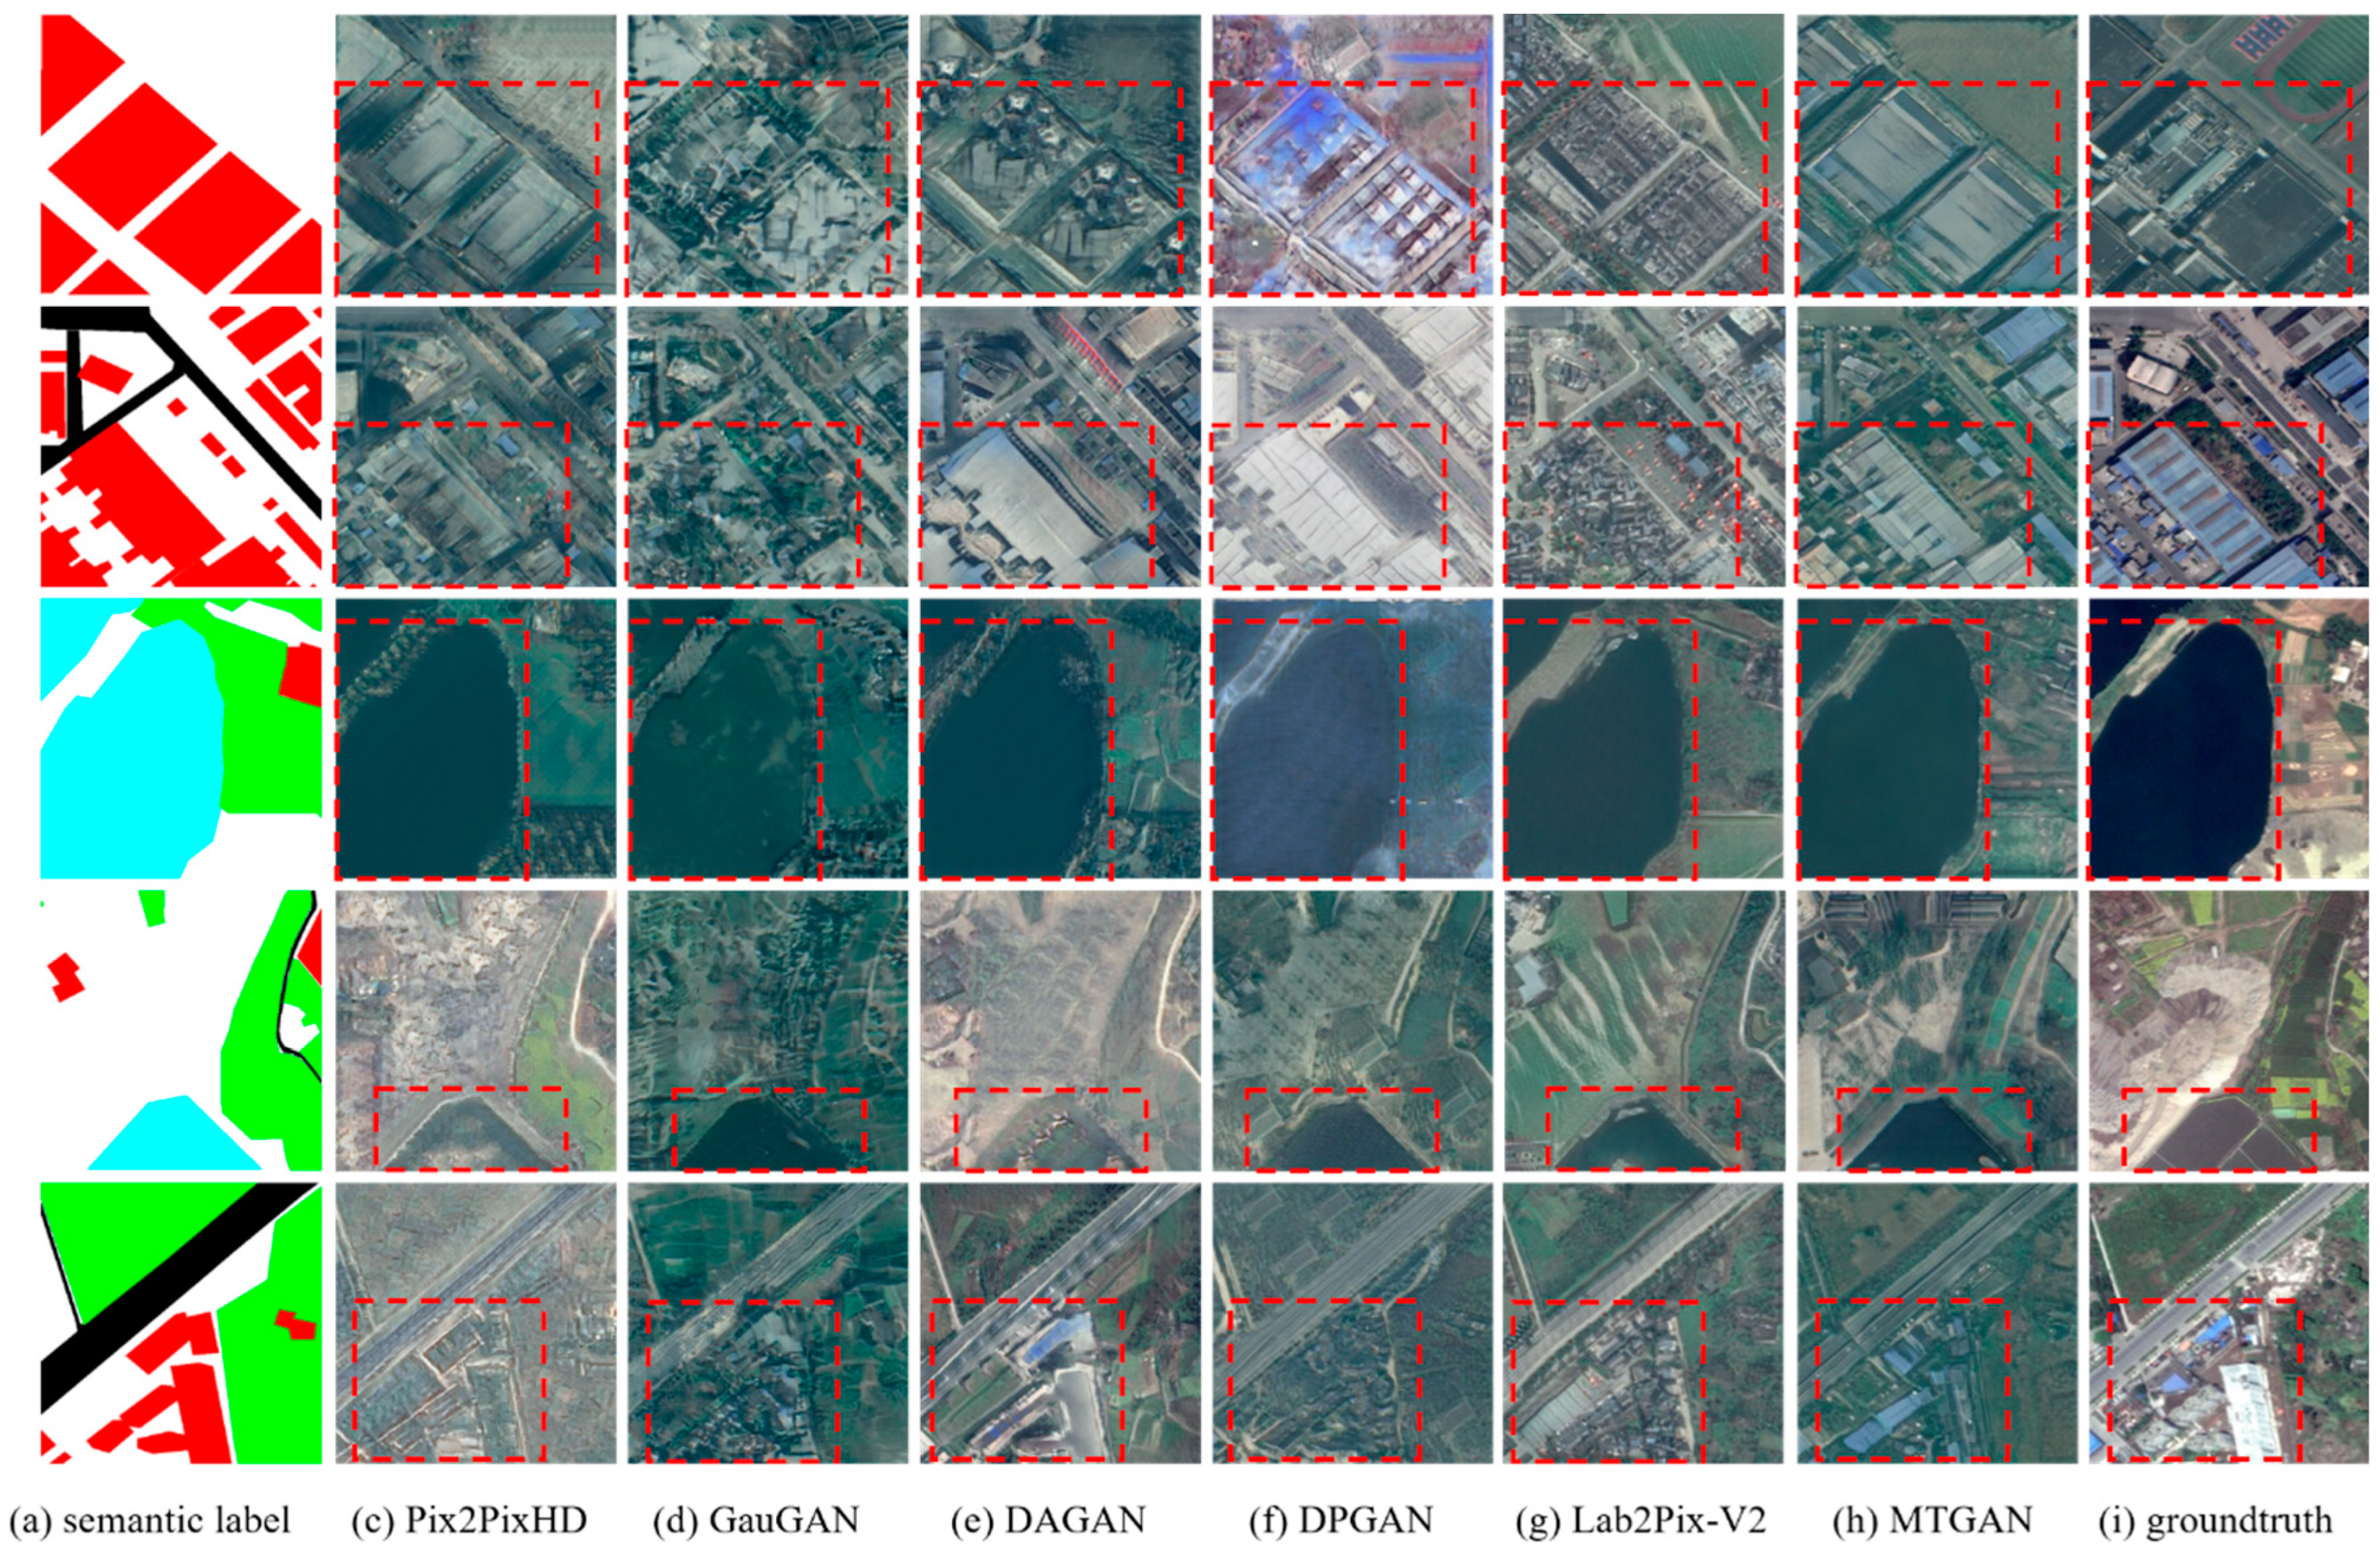
Figure 10.
The generated results on the Wuzhen dataset.
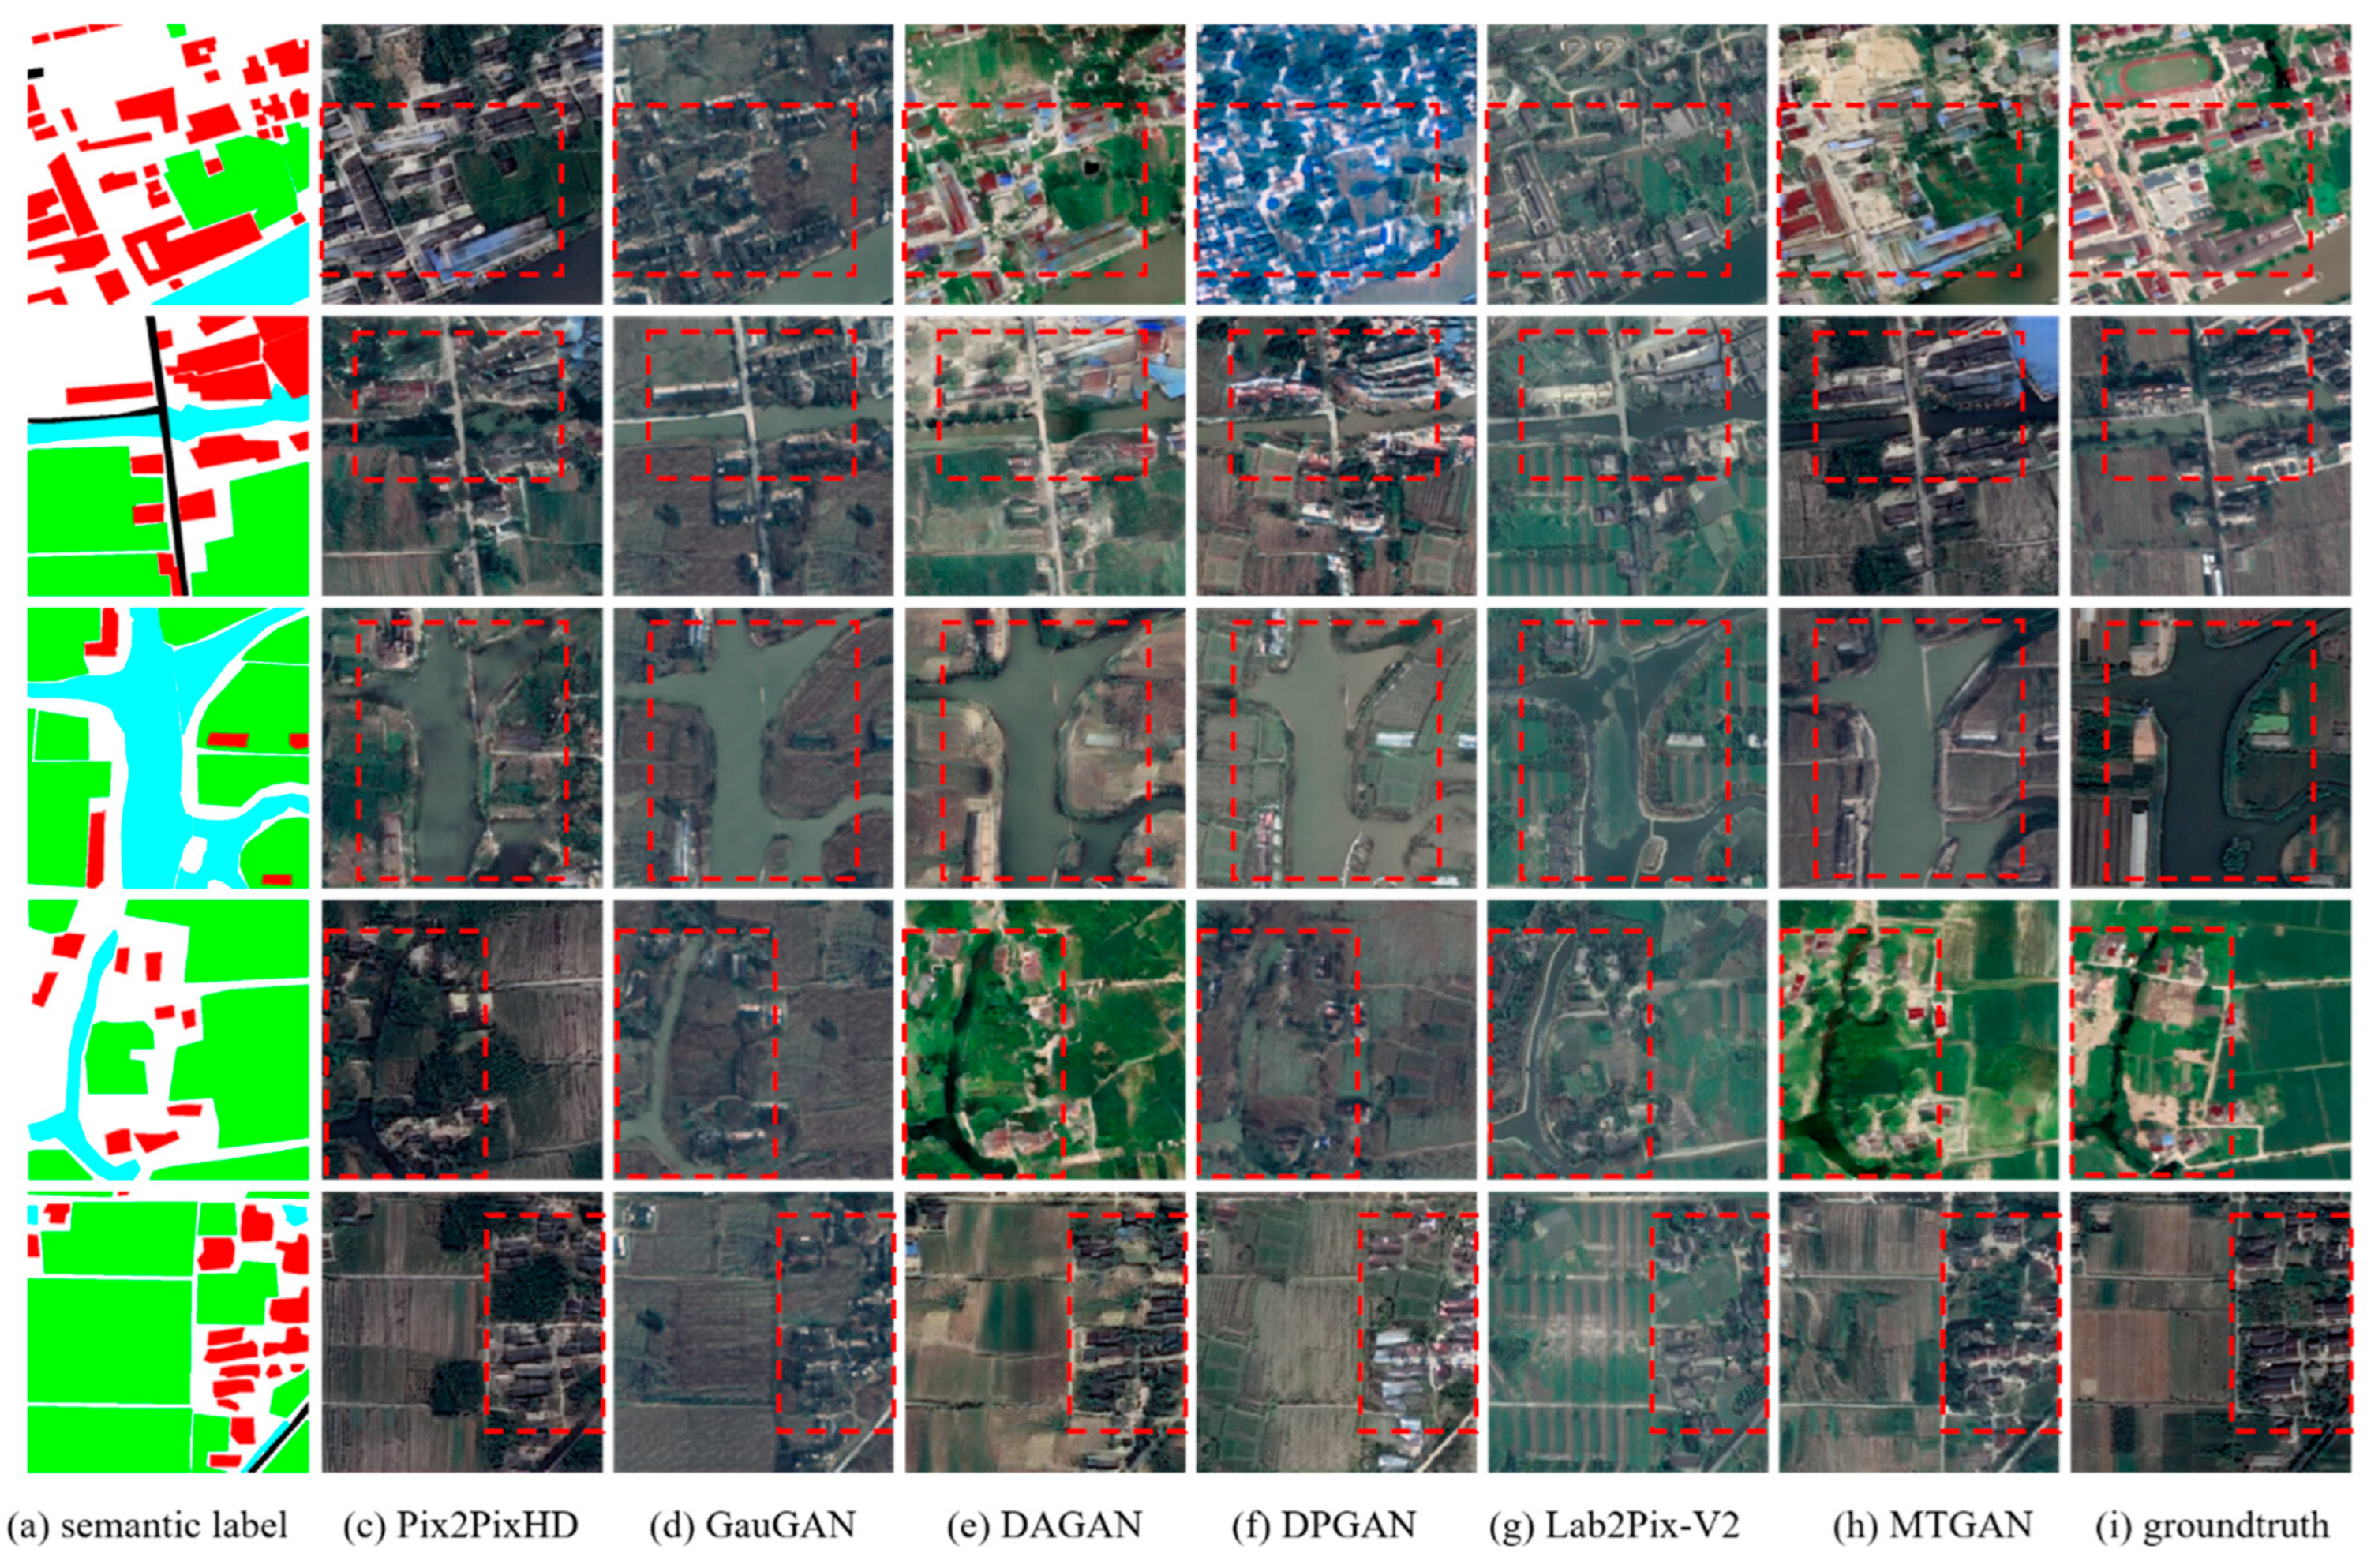
Figure 11.
Figure 11. CAM visualization results of different U-Net layers in real remote sensing images. I, II and III respectively represent the visual results of the second downsampling module, the bottleneck layer between the encoder and decoder, and the output features of the last upsampling module.
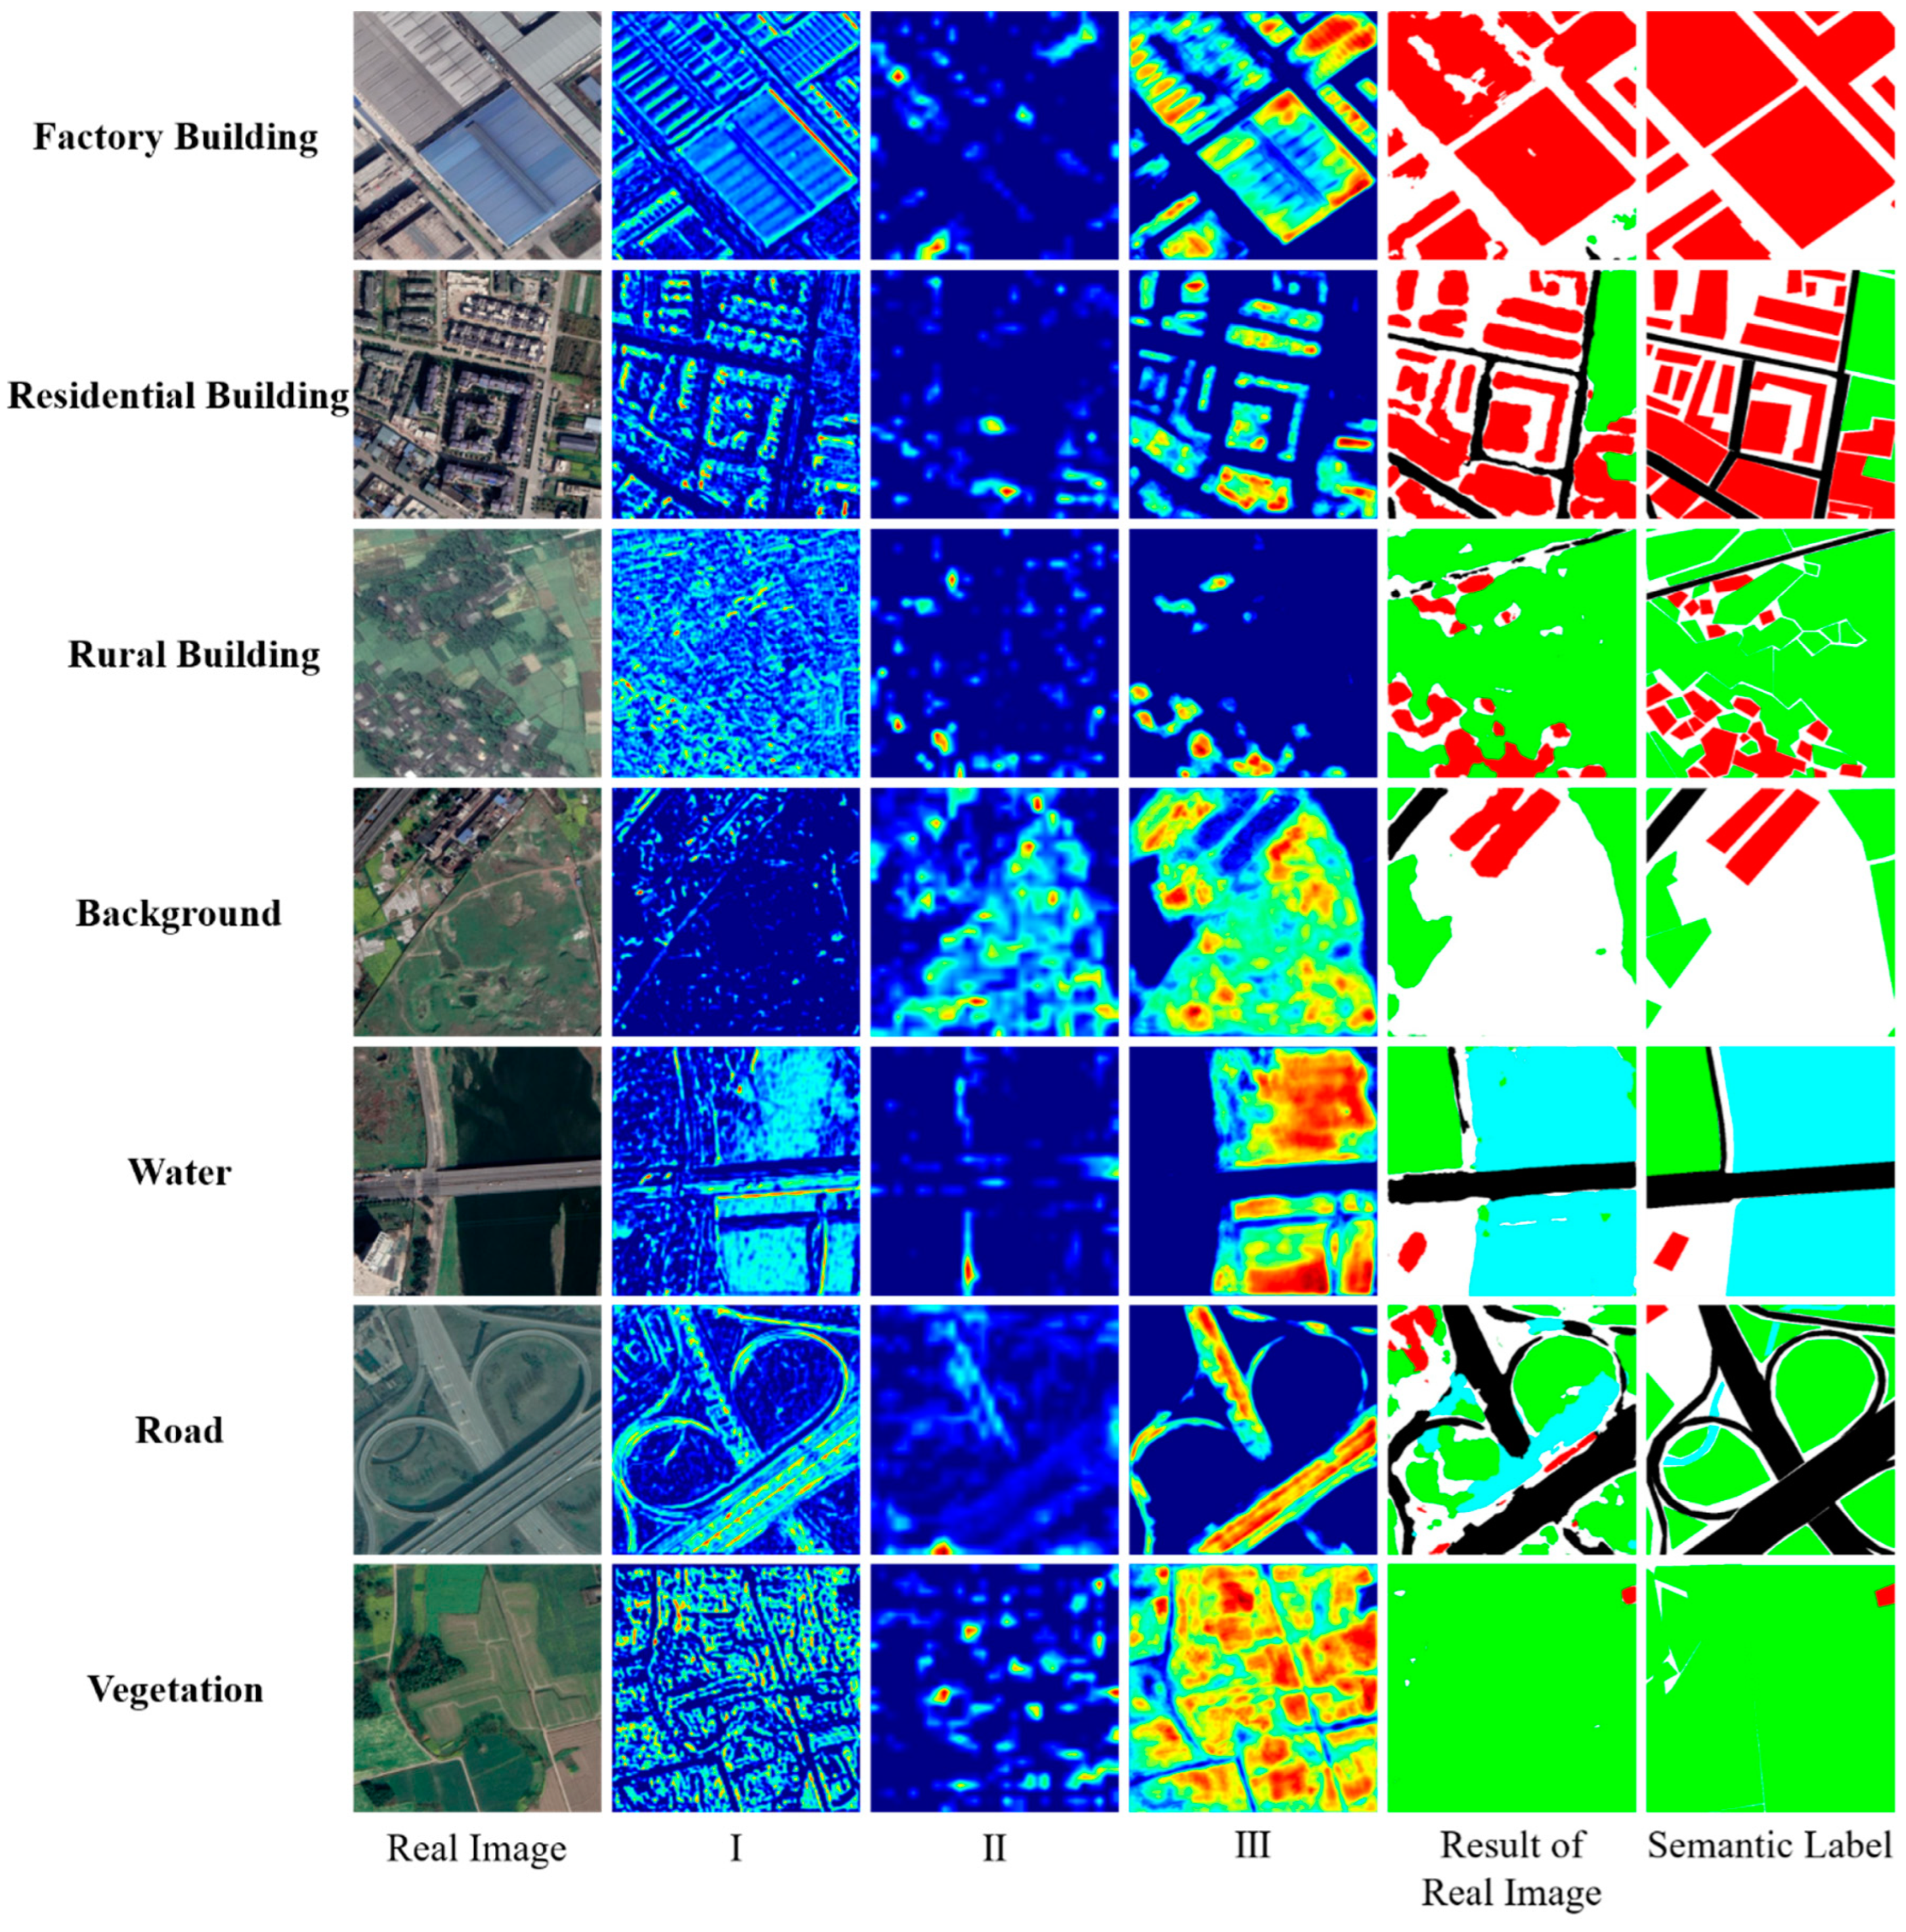
Figure 12.
CAM visualization results of different U-Net layers in generated images. I, II and III respectively represent the visual results of the second downsampling module, the bottleneck layer between the encoder and decoder, and the output features of the last upsampling module.
Figure 12.
CAM visualization results of different U-Net layers in generated images. I, II and III respectively represent the visual results of the second downsampling module, the bottleneck layer between the encoder and decoder, and the output features of the last upsampling module.
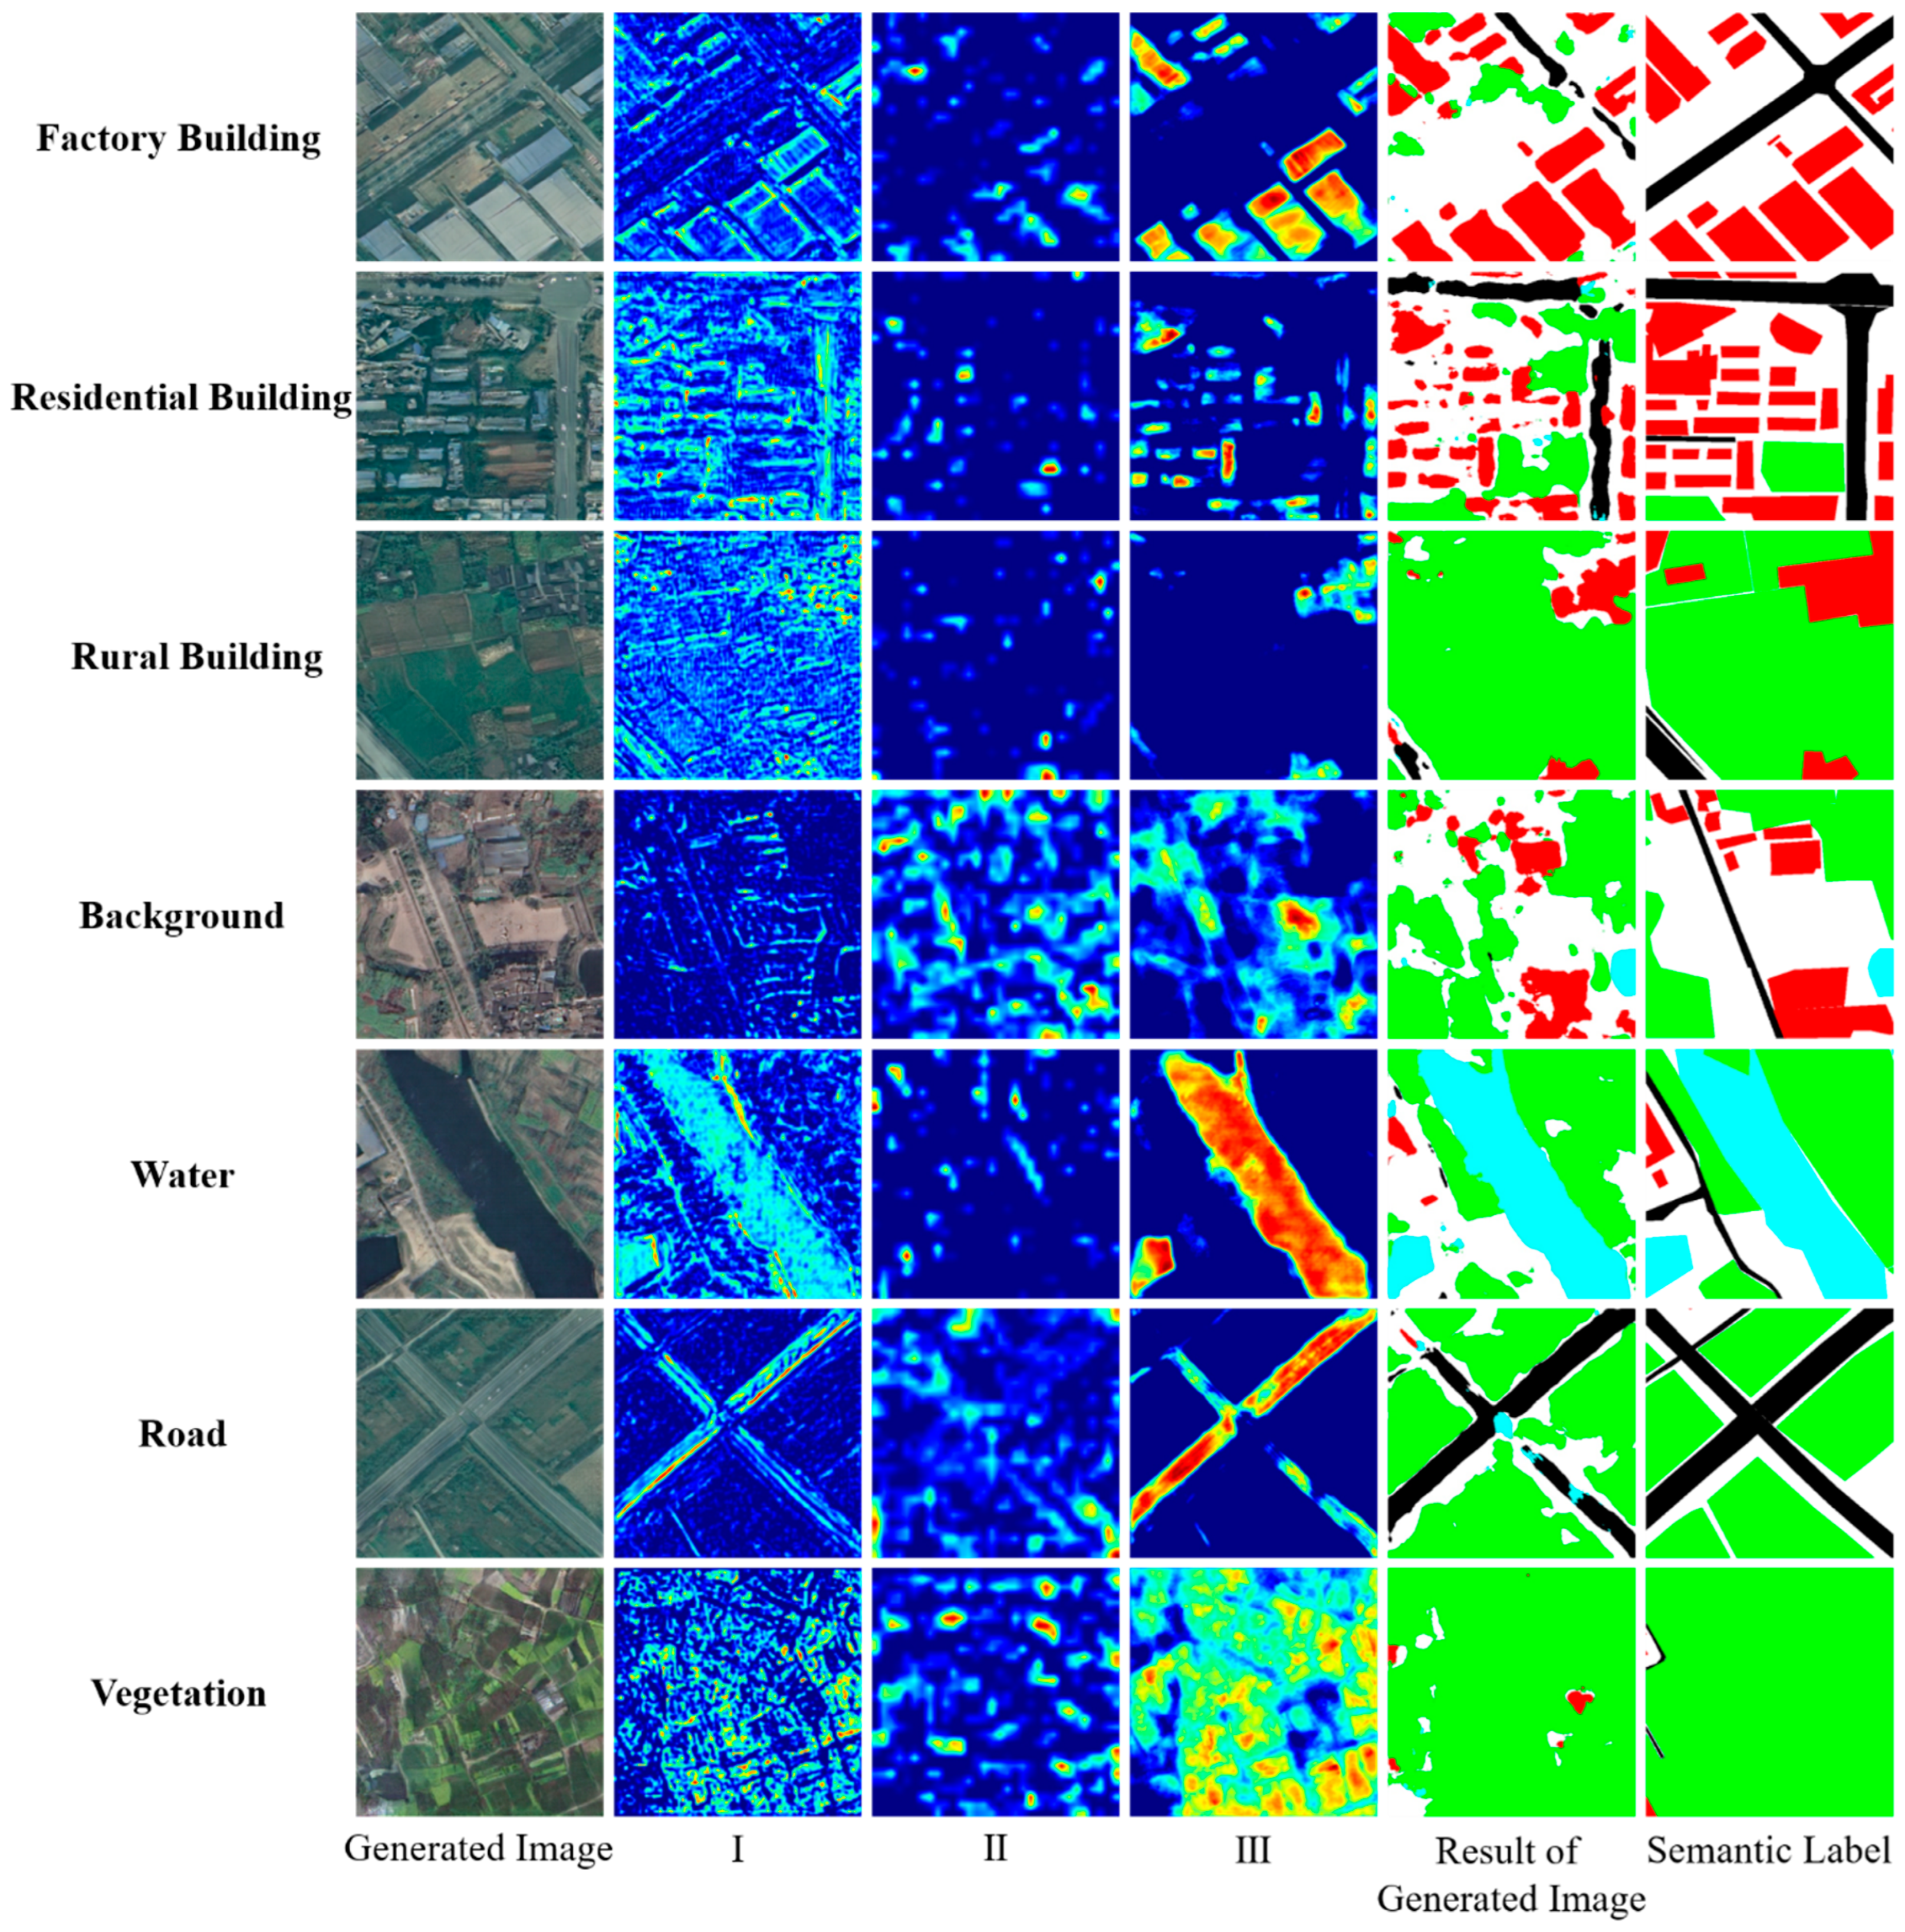
Table 2.
The results of ablation experiment on the Chongzhou and Wuzhen dataset.
| Methods | Chongzhou | Wuzhen | ||||||
| LPIPS↓ | FID↓ | FWIoU(%)↑ | OA(%)↑ | LPIPS↓ | FID↓ | FWIoU(%)↑ | OA(%)↑ | |
| Pix2Pix | 0.6080 | 176.28 | 49.56 | 62.50 | 0.6270 | 225.25 | 57.22 | 71.18 |
| Pix2Pix++ | 0.6008 | 159.23 | 53.26 | 66.02 | 0.6087 | 213.08 | 59.34 | 72.57 |
| GLGAN | 0.6132 | 169.66 | 54.86 | 67.69 | 0.6273 | 236.80 | 61.63 | 74.20 |
| GLGAN++ | 0.5961 | 154.27 | 54.50 | 67.59 | 0.5983 | 179.22 | 59.63 | 73.47 |
| MTGAN | 0.5783 | 123.42 | 60.80 | 72.88 | 0.5551 | 137.96 | 65.98 | 77.35 |
Table 3.
The comparison of experimental results of six models on the Chongzhou and Wuzhen dataset.
| Methods | Chongzhou | Wuzhen | ||||||
| LPIPS↓ | FID↓ | FWIoU(%)↑ | PA(%)↑ | LPIPS↓ | FID↓ | FWIoU(%)↑ | PA(%)↑ | |
| Pix2PixHD | 0.6007 | 145.44 | 57.60 | 69.10 | 0.5707 | 173.17 | 62.03 | 74.55 |
| GauGAN | 0.6008 | 192.04 | 53.26 | 66.02 | 0.5964 | 166.33 | 61.52 | 74.33 |
| DAGAN | 0.5901 | 170.19 | 57.85 | 69.52 | 0.5670 | 150.34 | 62.29 | 74.75 |
| DPGAN | 0.6147 | 167.84 | 56.12 | 69.50 | 0.5917 | 153.51 | 57.60 | 70.72 |
| Lab2Pix-V2 | 0.5844 | 137.88 | 57.51 | 69.90 | 0.5590 | 148.15 | 63.43 | 75.91 |
| MTGAN[ours] | 0.5783 | 123.42 | 60.80 | 72.88 | 0.5551 | 137.96 | 65.98 | 77.35 |
Table 4.
The size of the experimental dataset divided proportionally.
| Dataset | Training set | Test set | |
|---|---|---|---|
| Dataset 1.0 | 845 | 211 | |
| Chongzhou | Dataset 0.8 | 676 | 169 |
| Dataset 0.6 | 507 | 127 | |
| Dataset 0.4 | 338 | 84 | |
| Dataset 1.0 | 706 | 176 | |
| Wuzhen | Dataset 0.9 | 634 | 158 |
| Dataset 0.7 | 483 | 123 | |
| Dataset 0.5 | 352 | 88 |
Table 5.
The analysis of the impact of Chongzhou's generated images on the accuracy of the U-Net Network.
Table 5.
The analysis of the impact of Chongzhou's generated images on the accuracy of the U-Net Network.
| Dataset | +0 | +500 | +1000 | +2000 | ||||
| FWIoU(%) | OA(%) | FWIoU(%) | OA(%) | FWIoU(%) | OA(%) | FWIoU(%) | OA(%) | |
| Dataset 1.0 | 67.64 | 78.44 | 68.66 | 79.22 | 69.22 | 79.59 | 68.03 | 78.53 |
| Dataset 0.8 | 66.64 | 77.67 | 68.87 | 79.23 | 68.73 | 79.12 | 67.05 | 77.91 |
| Dataset 0.6 | 64.33 | 75.84 | 68.22 | 78.91 | 68.49 | 78.86 | 68.46 | 78.82 |
| Dataset 0.4 | 64.50 | 76.04 | 64.78 | 75.56 | 65.85 | 76.61 | 65.04 | 75.84 |
Table 6.
The analysis of the impact of Wuzhen's generated images on the accuracy of the U-Net Network.
Table 6.
The analysis of the impact of Wuzhen's generated images on the accuracy of the U-Net Network.
| Dataset | +0 | +500 | +1000 | +1500 | ||||
| FWIoU(%) | OA(%) | FWIoU(%) | OA(%) | FWIoU(%) | OA(%) | FWIoU(%) | OA(%) | |
| Dataset 1.0 | 70.76 | 80.84 | 73.57 | 83.05 | 73.60 | 83.23 | 73.36 | 82.91 |
| Dataset 0.9 | 69.78 | 79.93 | 72.32 | 82.17 | 72.26 | 81.94 | 71.75 | 81.93 |
| Dataset 0.7 | 68.38 | 79.15 | 72.85 | 82.38 | 72.72 | 82.14 | 72.13 | 81.90 |
| Dataset 0.5 | 67.87 | 78.72 | 69.17 | 80.32 | 69.17 | 80.63 | 69.35 | 80.24 |
Disclaimer/Publisher’s Note: The statements, opinions and data contained in all publications are solely those of the individual author(s) and contributor(s) and not of MDPI and/or the editor(s). MDPI and/or the editor(s) disclaim responsibility for any injury to people or property resulting from any ideas, methods, instructions or products referred to in the content. |
© 2024 by the authors. Licensee MDPI, Basel, Switzerland. This article is an open access article distributed under the terms and conditions of the Creative Commons Attribution (CC BY) license (http://creativecommons.org/licenses/by/4.0/).
Copyright: This open access article is published under a Creative Commons CC BY 4.0 license, which permit the free download, distribution, and reuse, provided that the author and preprint are cited in any reuse.


