Submitted:
17 November 2024
Posted:
19 November 2024
You are already at the latest version
Abstract
This study leverages machine learning models, including Logistic Regression, XGBoost, and Random Forest, to predict diabetes using BRFSS data. XGBoost emerged as the top-performing model, achieving an AUC of 0.83. Feature importance was analyzed using SHAP values, highlighting general health, high blood pressure, and BMI as key predictors. This research demonstrates the potential of machine learning models in identifying individuals at risk of diabetes, aiding in early intervention and improved public health outcomes.
Keywords:
Diabetes
; Public Health
; XGBoost
; Logistic Regression
; Feature Importance
; SHAP Analysis
; SMOTE
1. Introduction
Diabetes is a major public health problem in US, affecting millions of people and placing a significant strain on the healthcare system. The chronic condition arises when the body cannot effectively manage blood glucose levels, either due to insufficient insulin production or the inability to use insulin properly[1]. If left unchecked, diabetes can lead to severe complications, including heart disease, vision loss [2], lower-limb amputations, and kidney disease.
As of 2024, the CDC reports that 37.3 million Americans have diabetes, while prediabetes affects around 96 million U.S. adults—a significant rise[3]. However, over 84% of those with prediabetes are unaware of their condition, underscoring the urgent need for early identification methods.
Machine learning models provide a promising approach for early diabetes diagnosis and identifying risk factors[4]. Numerous studies have utilized models like Decision Trees[5], Random Forest, SVMs[6], Gradient Boosting[7], GNNs[8][9], RNNs[10], CNN[11][12], and LSTM[13][14], with strong results in accuracy and predictive performance. Predictive models help healthcare providers identify at-risk individuals and guide lifestyle changes to prevent diabetes[15][16], improving public health.
2. Methods
2.1. Data Source
The final dataset used in this research is cleaned and processed using source data from Behavioral Risk Factor Surveillance System (BRFSS) in 2015[17], a yearly telephone survey focused on health issues, carried out by CDC. The BRFSS collects extensive data on health-related risk behaviors[18][19], conditions of chronic health, and the use of preventive services[20]. For this project, the dataset contains 253,680 cleaned and processed survey records and 21 variables. 7 features are continuous and 14 of them as category variables. The target variable (Diabetes Binary), divides participants into two categories: 0 for those without diabetes and 1 for individuals with either prediabetes or diabetes. It is of importance to stress that the dataset is imbalanced, with a higher proportion of respondents classified as non-diabetic, with the ratio of respondents with class 1 to those with class 0 being 0.16. Necessitating the use of techniques like SMOTE to address this imbalance issue[21].
2.2. SMOTE Oversampling
Using SMOTE, new synthetic sample is generated along the line segment between and one of its neighbors :
This creates a new data point that lies between and , effectively increasing the number of minority class samples[22][23]. In this study, SMOTE was used to oversample the minority class (class 1) such that the ratio of class 1 to class 0 was increased to 3:1. By balancing the dataset, SMOTE helps machine learning models learn from both classes more effectively[24], reducing bias towards the majority class and improving predictive performance in imbalanced datasets.
2.3. Logistic Regression with L1 Regularization
The Logistic Regression model with L1 regularization is defined as:
where is the predicted probability, represents the input features, and are the coefficients.
L1 regularization introduces a penalty term to the cost function:
To determine the optimal , 5-fold cross-validation is performed, selecting the value that maximizes the AUC. This process ensures the model is tuned for optimal performance on the validation sets[25].
2.4. XGBoost
XGBoost (Extreme Gradient Boosting) builds an ensemble of decision trees sequentially to optimize predictive performance[26]. It is ideal for classification tasks due to its efficiency, scalability, and ability to handle imbalanced datasets[27][28]. In this study, XGBoost was trained with an adjusted class weight of 3 for class 1 to address the imbalance and focus on the minority class. Key hyperparameters, including learning rate, max depth, n estimators, and alpha, were tuned using 5-fold cross-validation to optimize the Area Under the Curve (AUC) and balance predictive accuracy with overfitting prevention. The combination achieving the highest AUC was selected for the final model, ensuring optimal performance.
2.5. Random Forest
Random Forest is an ensemble learning approach generating multiple decision trees that vote for the final prediction. [29]. Every tree is trained on a randomly chosen subset of features, which can help reduce overfitting and improve the generalization of the model capability[30][31].In this research, the Random Forest model was trained, and crucial hyperparameters such as n estimators, max depth, and min samples split were optimized using 5-fold cross-validation to enhance the Area Under the Curve (AUC).
2.6. SHAP Model Interpretation
SHAP (Shapley Additive Explanations) is an effective approach for explaining machine learning model predictions by quantifying the individual impact of each feature on the final outcome [32]. To be more specific, the Shapley value concept, which fairly distributes the model’s prediction among all features, considering their contribution to the model’s output[33].
3. Results
3.1. Model Training
For model training, three machine learning algorithms Logistic Regression, Random Forest, and XGBoost were selected based on their complementary strengths in classification tasks and interpretation. The models were trained on a comparatively balanced dataset, where class imbalance was addressed by applying the Synthetic Minority Over-sampling Technique (SMOTE).[34]. 5-fold cross-validation approach was employed to guarantee the models’ robustness and generalizability [35].
3.2. Model Performance Metrics
We split 20% of the data as a test set, and the metrics presented are based on this test set. Among the models evaluated, XGBoost consistently outperformed Logistic Regression and Random Forest, making it the most effective for diabetes prediction.
Based on the metrics shown in Table 1. XGBoost achieved the highest AUC of 0.83, indicating superior discrimination between diabetic and non-diabetic cases. It also led with precision score with 0.87, both higher than those of Logistic Regression (0.83) and Random Forest (0.83). While its recall is slightly lower, XGBoost still relatively outperformed the other models in these metrics, confirming its robustness. Overall, XGBoost’s combination of high AUC and precison makes it the most reliable model on the test set.
3.3. Model Interpretation
To gain insights into the model training process, We interpreted the model using SHAP values, XGBoost feature importance, and Logistic Regression with Lasso significant coefficients to gain a comprehensive understanding of feature importance[36].
Based on the SHAP analysis plot in Figure 1, the model identifies GenHlth (General Health), HighBP (High Blood Pressure), Age, BMI, and HighChol (High Cholesterol) as the most significant risk factors for diabetes [37] [38], with higher values in these features pushing the prediction toward diabetes. Higher income has a protective effect, decreasing the likelihood of being classified as diabetic. Education and PhysActivity show a spread of SHAP values indicating that both low and high values can have varying impacts on diabetes prediction [39], suggesting potential interaction effects with other features.
The XGBoost feature importance plot in Figure 2 emphasizes HighBP (High Blood Pressure) (High Blood Pressure) and GenHlth (General Health) as the most critical predictors of diabetes in the model [40]. While other factors like Heavy Alcohol Consumption, Physical Activity, and Age also play significant roles.
Additionally, from Logistic Regression model Figure 3. HvyAlcoholConsump 1 (Heavy Alcohol Consumption), CholCheck 0 (No Cholesterol Check), HighBP 0 (No High Blood Pressure), and NoDocbcCost 1 (No Doctor Visit due to Cost) have negative coefficients. Heavy alcohol consumption are less likely to be predicted as diabetic in this model, which indicates a more complex relationship or confounding variables. This finding suggests that individuals without a diagnosis of high cholesterol or high blood pressure are less likely to be predicted as diabetic, which is consistent with established medical understanding, thus validating the model’s alignment with real-world medical insights.
4. Discussion
Despite its strengths, this study has some limitations. One key limitation is the its inability to establish a causal relationship between the identified risk factors and the onset of diabetes due to cross-sectional nature of the BRFSS data.
Furthermore, the dataset’s significant class imbalance required the use of SMOTE oversampling to enhance model performance. However, this method can introduce biases and does not fully mimic the conditions of a naturally balanced dataset.
5. Conclusion
Our study shows the effectiveness of machine learning models in predicting diabetes and identifying key risk factors for public health strategies and individual behavior changes. Among the models, XGBoost outperformed Random Forest and Logistic Regression in AUC and precision, making it the most reliable model for diabetes prediction. [41].
The SHAP analysis and XGBoost feature importance provided valuable insights into the most influential features driving the model’s predictions[42]. Key factors such as general health, high blood pressure, age, BMI, and high cholesterol levels were identified as significant risk factors for diabetes. These findings align with existing medical knowledge, reinforcing the validity of the model’s predictions.
Logistic Regression highlighted additional factors, like heavy alcohol consumption, lack of cholesterol checks, and skipping doctor visits due to cost, which were less prominent in SHAP and XGBoost analyses but still remain important in understanding diabetes risk[43].
References
- Y. Xie and et al, “Learning domain semantics and cross-domain correlations for paper recommendation,” in Proceedings of the 44th International ACM SIGIR Conference on Research and Development in Information Retrieval, ser. SIGIR ’21. Association for Computing Machinery, 2021, p. 706–715.
- Yukun Song, “Deep Learning Applications in the Medical Image Recognition,” American Journal of Computer Science and Technology, vol. 2, no. 2, p. 22, 2019.
- H. Ni, S. Meng, X. Geng, P. Li, Z. Li, X. Chen, X. Wang, and S. Zhang, “Time series modeling for heart rate prediction: From arima to transformers,” arXiv preprint arXiv:2406.12199, 2024.
- Y. Sun, Y. Duan, H. Gong, and M. Wang, “Learning low-dimensional state embeddings and metastable clusters from time series data,” in Advances in Neural Information Processing Systems, H. Wallach, H. Larochelle, A. Beygelzimer, F. d’Alché-Buc, E. Fox, and R. Garnett, Eds., vol. 32. Curran Associates, Inc., 2019.
- L. Wang, W. Xiao, and S. Ye, “Dynamic multi-label learning with multiple new labels,” Lecture Notes in Computer Science, vol. 11903, pp. 399–409, 2019.
- J. Yang, J. Liu, Z. Yao, and C. Ma, “Measuring digitalization capabilities using machine learning,” Research in International Business and Finance, vol. 70, p. 102380, 2024. [CrossRef]
- Q. Z. Huili Zheng and et al, “Identification of prognostic biomarkers for stage iii non-small cell lung carcinoma in female nonsmokers using machine learning,” 2024.
- Z. Wang, Y. Zhu, Z. Li, Z. Wang, H. Qin, and X. Liu, “Graph neural network recommendation system for football formation,” Applied Science and Biotechnology Journal for Advanced Research, vol. 3, no. 3, pp. 33–39, 2024.
- Q. Z. e. a. Yiru Gong, “Graphical Structural Learning of rs-fMRI data in Heavy Smokers,” arXiv preprint arXiv:2409.08395, 2024.
- Z. Lin, C. Wang, Z. Li, Z. Wang, X. Liu, and Y. Zhu, “Neural radiance fields convert 2d to 3d texture,” Applied Science and Biotechnology Journal for Advanced Research, vol. 3, no. 3, pp. 40–44, 2024.
- H. Peng, R. Ran, Luo, and et al, “Lingcn: Structural linearized graph convolutional network for homomorphically encrypted inference,” in Thirty-seventh Conference on Neural Information Processing Systems.
- Y. Zhong, Y. Liu, E. Gao, C. Wei, Z. Wang, and C. Yan, “Deep learning solutions for pneumonia detection: Performance comparison of custom and transfer learning models,” medRxiv, pp. 2024–06, 2024.
- X. Fan, C. Tao, and J. Zhao, “Advanced stock price prediction with xlstm-based models: Improving long-term forecasting,” Preprints, 2024.
- X. Li and S. Liu, “Predicting 30-day hospital readmission in medicare patients: Insights from an lstm deep learning model,” medRxiv, 2024.
- C. Mao, S. Huang, M. Sui, H. Yang, and X. Wang, “Analysis and design of a personalized recommendation system based on a dynamic user interest model,” Advances in Computer, Signals and Systems, vol. 8, pp. 109–118, 2024. [CrossRef]
- W. Zhu and T. Hu, “Twitter sentiment analysis of covid vaccines,” in 2021 5th International Conference on Artificial Intelligence and Virtual Reality (AIVR), 2021, pp. 118–122.
- Z. Xie, O. Nikolayeva, J. Luo, and D. Li, “Building risk prediction models for type 2 diabetes using machine learning techniques,” Preventing Chronic Disease, vol. 16, p. 190109, 2019. [CrossRef]
- Y. Song, P. Arora, S. T. Varadharajan, R. Singh, M. Haynes, and T. Starner, “Looking from a different angle: Placing head-worn displays near the nose,” in Proceedings of the Augmented Humans International Conference 2024, ser. AHs ’24. Association for Computing Machinery, 2024, p. 28–45.
- M. B. Mock, S. Zhang, and R. M. Summers, “Whole-cell rieske non-heme iron biocatalysts,” ser. Methods in Enzymology. Academic Press, 2024.
- Z. Wu, X. Wang, S. Huang, H. Yang, D. Ma et al., “Research on prediction recommendation system based on improved markov model,” Advances in Computer, Signals and Systems, vol. 8, no. 5, pp. 87–97, 2024. [CrossRef]
- T. Hu and et al, “Artificial intelligence aspect of transportation analysis using large scale systems,” in Proceedings of the 2023 6th Artificial Intelligence and Cloud Computing Conference, 2023, pp. 54–59.
- L. Wang, “Low-latency, high-throughput load balancing algorithms,” Journal of Computer Technology and Applied Mathematics, vol. 1, no. 2, pp. 1–9, 2024.
- W. Q. Qimin Zhang and et al, “Cu-net: a u-net architecture for efficient brain-tumor segmentation on brats 2019 dataset,” 2024.
- Y. Tao and et al, “Nevlp: Noise-robust framework for efficient vision-language pre-training,” arXiv preprint arXiv:2409.09582, 2024.
- W. Zhu, “Optimizing distributed networking with big data scheduling and cloud computing,” in International Conference on Cloud Computing, Internet of Things, and Computer Applications (CICA 2022), vol. 12303. SPIE, 2022, pp. 23–28.
- Q. Z. Xinyu Shen and et al, “Harnessing XGBoost for robust biomarker selection of obsessive-compulsive disorder (OCD) from adolescent brain cognitive development (ABCD) data,” in Fourth International Conference on Biomedicine and Bioinformatics Engineering (ICBBE 2024), P. P. Piccaluga, A. El-Hashash, and X. Guo, Eds., vol. 13252, International Society for Optics and Photonics. SPIE, 2024, p. 132520U.
- M. Wang and S. Liu, “Machine learning-based research on the adaptability of adolescents to online education,” arXiv preprint arXiv:2408.16849, 2024.
- X. Fan and C. Tao, “Towards resilient and efficient llms: A comparative study of efficiency, performance, and adversarial robustness,” arXiv preprint arXiv:2408.04585, 2024.
- Z. Ding, P. Li, Q. Yang, S. Li, and Q. Gong, “Regional style and color transfer,” in 2024 5th International Conference on Computer Vision, Image and Deep Learning (CVIDL). IEEE, 2024, pp. 593–597.
- Q. Yang, Z. Wang, S. Liu, and Z. Li, “Research on improved u-net based remote sensing image segmentation algorithm,” arXiv preprint arXiv:2408.12672, 2024.
- Z. Wang, H. Yan, C. Wei, J. Wang, S. Bo, and M. Xiao, “Research on autonomous driving decision-making strategies based deep reinforcement learning,” arXiv preprint arXiv:2408.03084, 2024.
- H. Gao, H. Wang, Z. Feng, M. Fu, C. Ma, H. Pan, B. Xu, and N. Li, “A novel texture extraction method for the sedimentary structures’ classification of petroleum imaging logging,” in Pattern Recognition: 7th Chinese Conference, CCPR 2016, Chengdu, China, November 5-7, 2016, Proceedings, Part II 7. Springer, 2016, pp. 161–172.
- C. Tao and et al, “Harnessing llms for api interactions: A framework for classification and synthetic data generation,” arXiv preprint arXiv:2409.11703, 2024.
- Y. Gu, D. Wang, and et al, “Green building material with superior thermal insulation and energy storage properties fabricated by paraffin and foam cement composite,” Construction and Building Materials, 2024. [CrossRef]
- J. Yang, C. Ma, D. Li, and J. Liu, “Mapping the knowledge onblockchain technology in the fieldof business and management: A bibliometric analysis,” IEEE Access, vol. 10, pp. 60 585–60 596, 2022.
- Y. Gu, Y. Li, Ju, and et al, “Pcm microcapsules applicable foam to improve the properties of thermal insulation and energy storage for cement-based material,” Construction and Building Materials, 2023. [CrossRef]
- X. Yang and et al, “Retargeting destinations of passive props for enhancing haptic feedback in virtual reality,” in 2022 IEEE Conference on Virtual Reality and 3D User Interfaces Abstracts and Workshops (VRW). IEEE, 2022, pp. 618–619.
- Y. Kang, Z. Zhang, M. Zhao, X. Yang, and X. Yang, “Tie memories to e-souvenirs: Hybrid tangible ar souvenirs in the museum,” in Adjunct Proceedings of the 35th Annual ACM Symposium on User Interface Software and Technology, 2022, pp. 1–3.
- Y. Zhu, C. Honnet, Y. Kang, J. Zhu, A. J. Zheng, K. Heinz, G. Tang, L. Musk, M. Wessely, and S. Mueller, “Demonstration of chromocloth: Re-programmable multi-color textures through flexible and portable light source,” in Adjunct Proceedings of the 36th Annual ACM Symposium on User Interface Software and Technology, 2023, pp. 1–3.
- Y. Kang, Y. Xu, C. P. Chen, G. Li, and Z. Cheng, “6: Simultaneous tracking, tagging and mapping for augmented reality,” in SID Symposium Digest of Technical Papers, vol. 52. Wiley Online Library, 2021, pp. 31–33.
- S. H. Jinglan Yang, Chaoqun Ma and J. Liu, “Blockchain governance: a bibliometric study and content analysis,” Technology Analysis & Strategic Management, vol. 0, no. 0, pp. 1–15, 2024. [CrossRef]
- H. Gong and M. Wang, “A duality approach for regret minimization in average-award ergodic markov decision processes,” in Proceedings of the 2nd Conference on Learning for Dynamics and Control, ser. Proceedings of Machine Learning Research, A. M. Bayen, A. Jadbabaie, G. Pappas, P. A. Parrilo, B. Recht, C. Tomlin, and M. Zeilinger, Eds., vol. 120. PMLR, 2020, pp. 862–883.
- Y. Song, P. Arora, R. Singh, S. T. Varadharajan, M. Haynes, and T. Starner, “Going Blank Comfortably: Positioning Monocular Head-Worn Displays When They are Inactive,” in Proceedings of the 2023 International Symposium on Wearable Computers. ACM, 2023, pp. 114–118.
Figure 1.
SHAP Analysis Plot
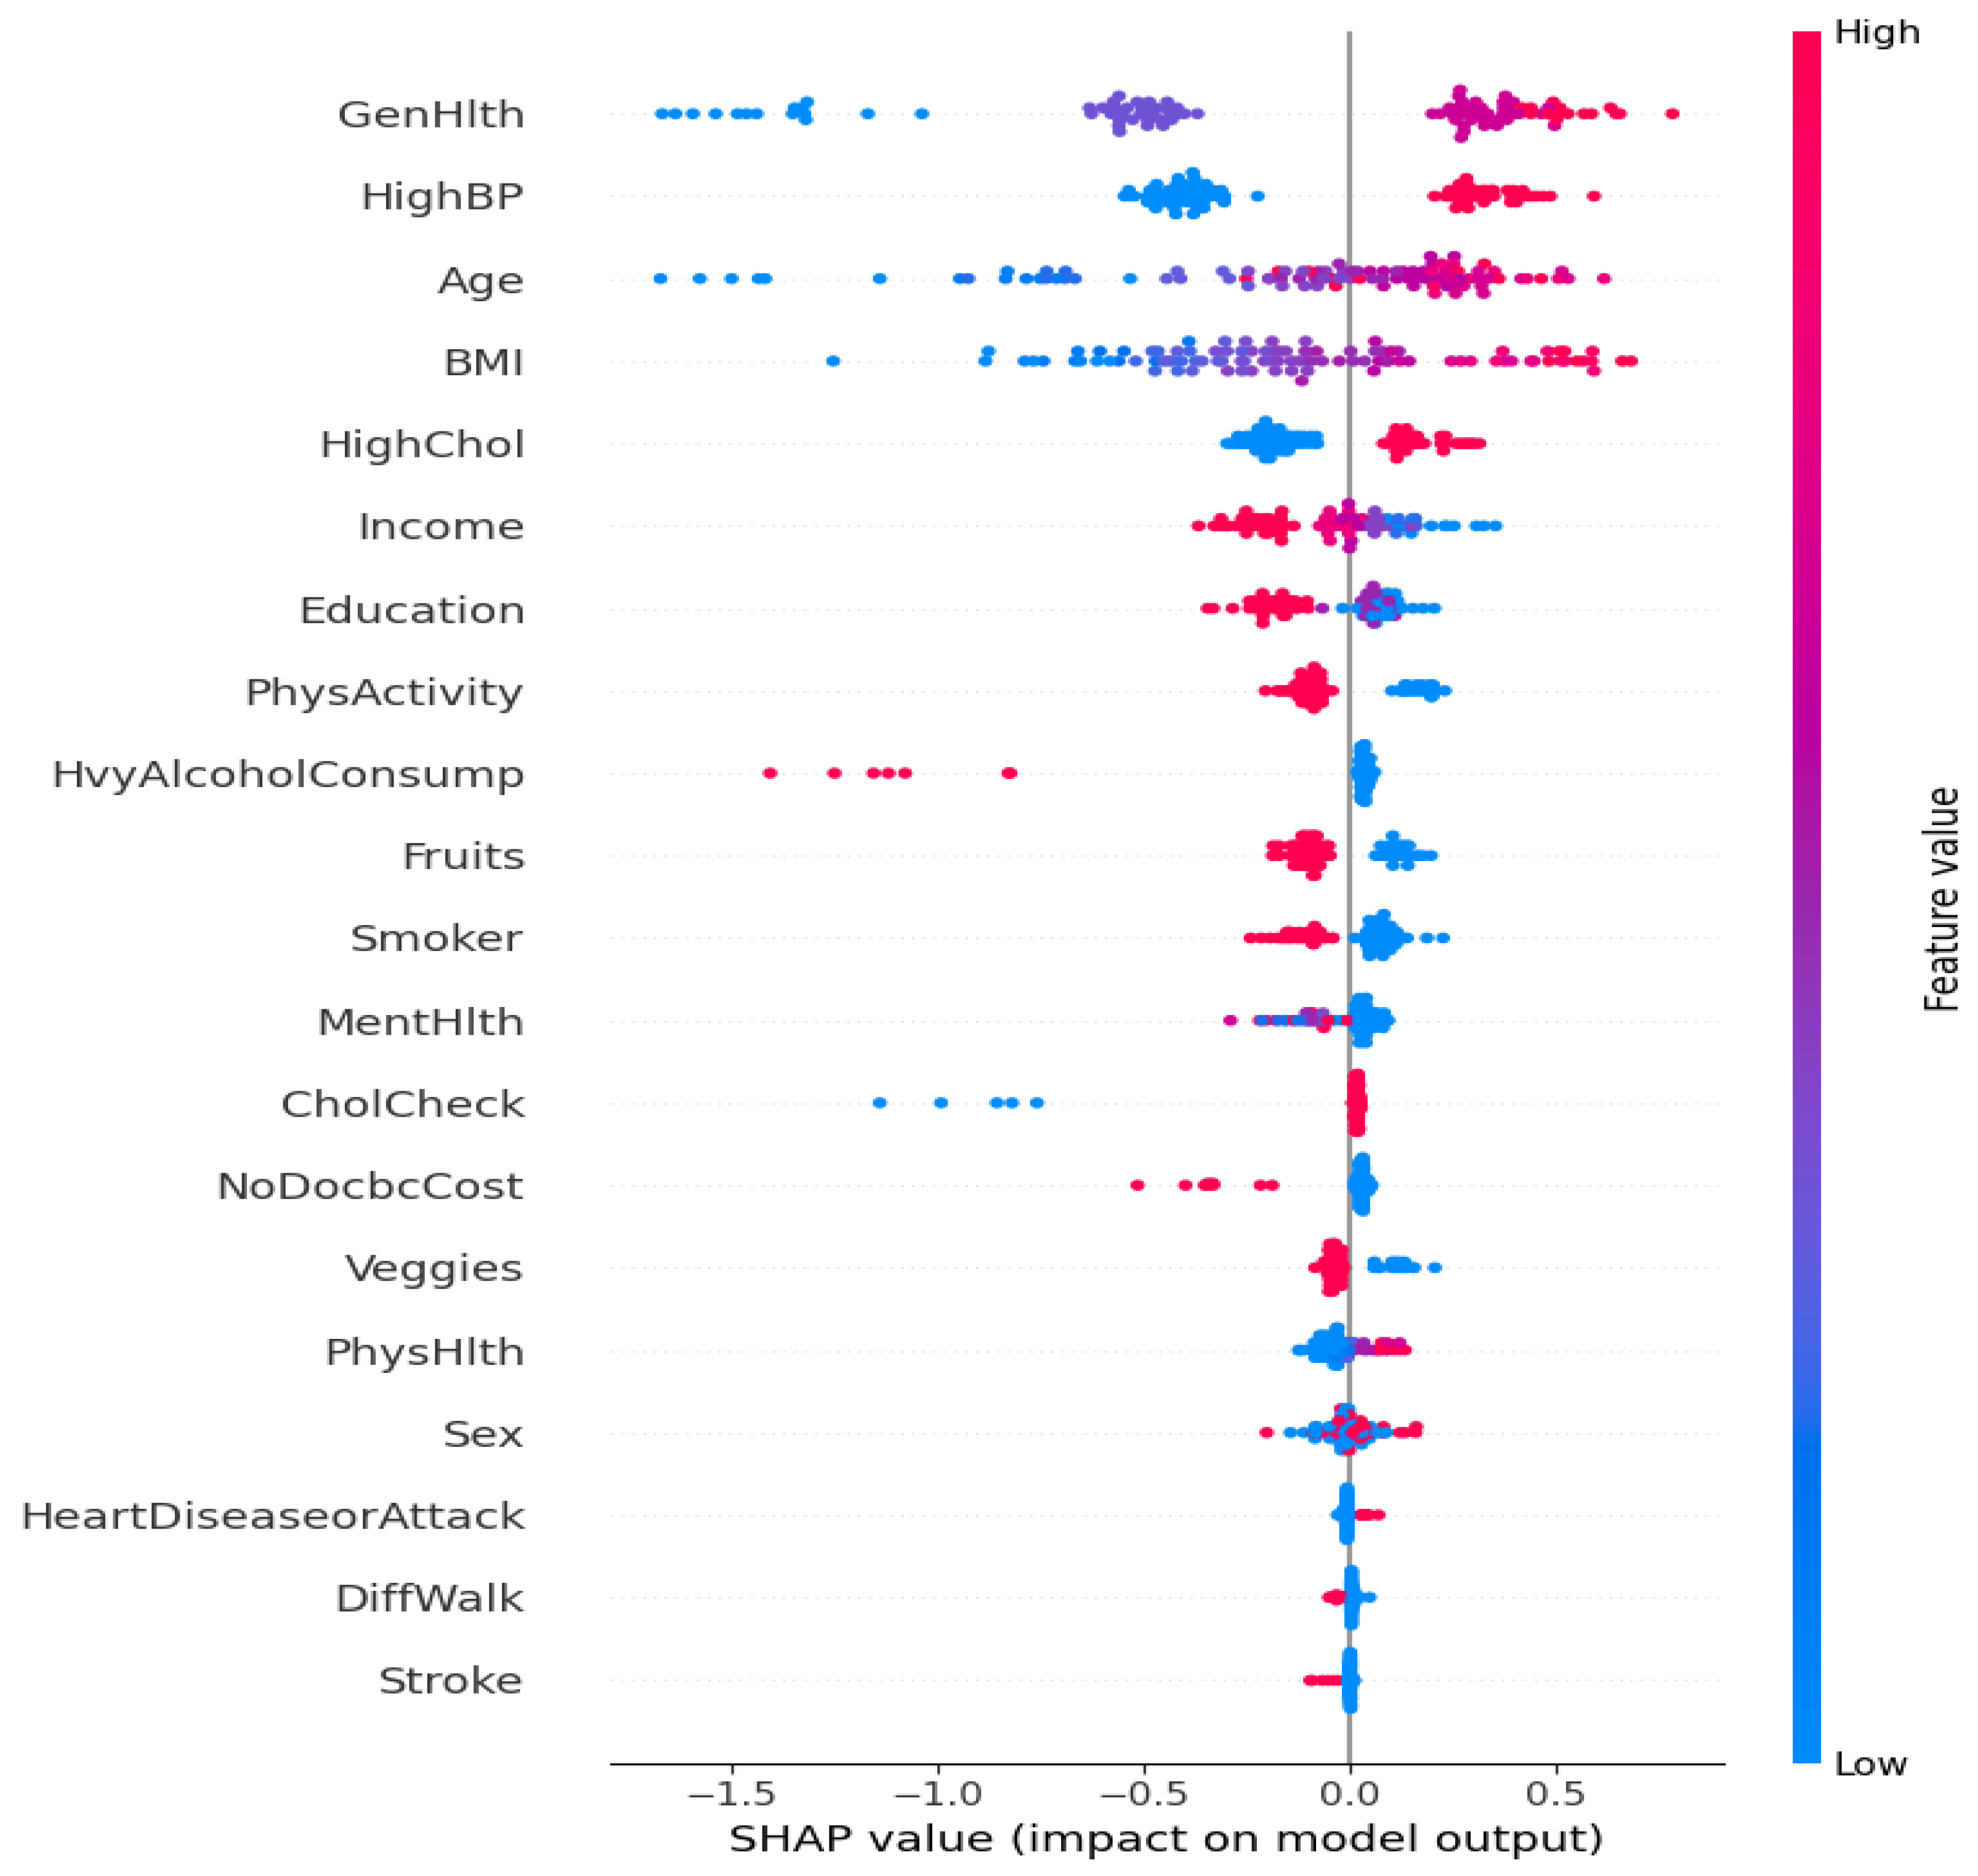
Figure 2.
XGBoost Feature Importance
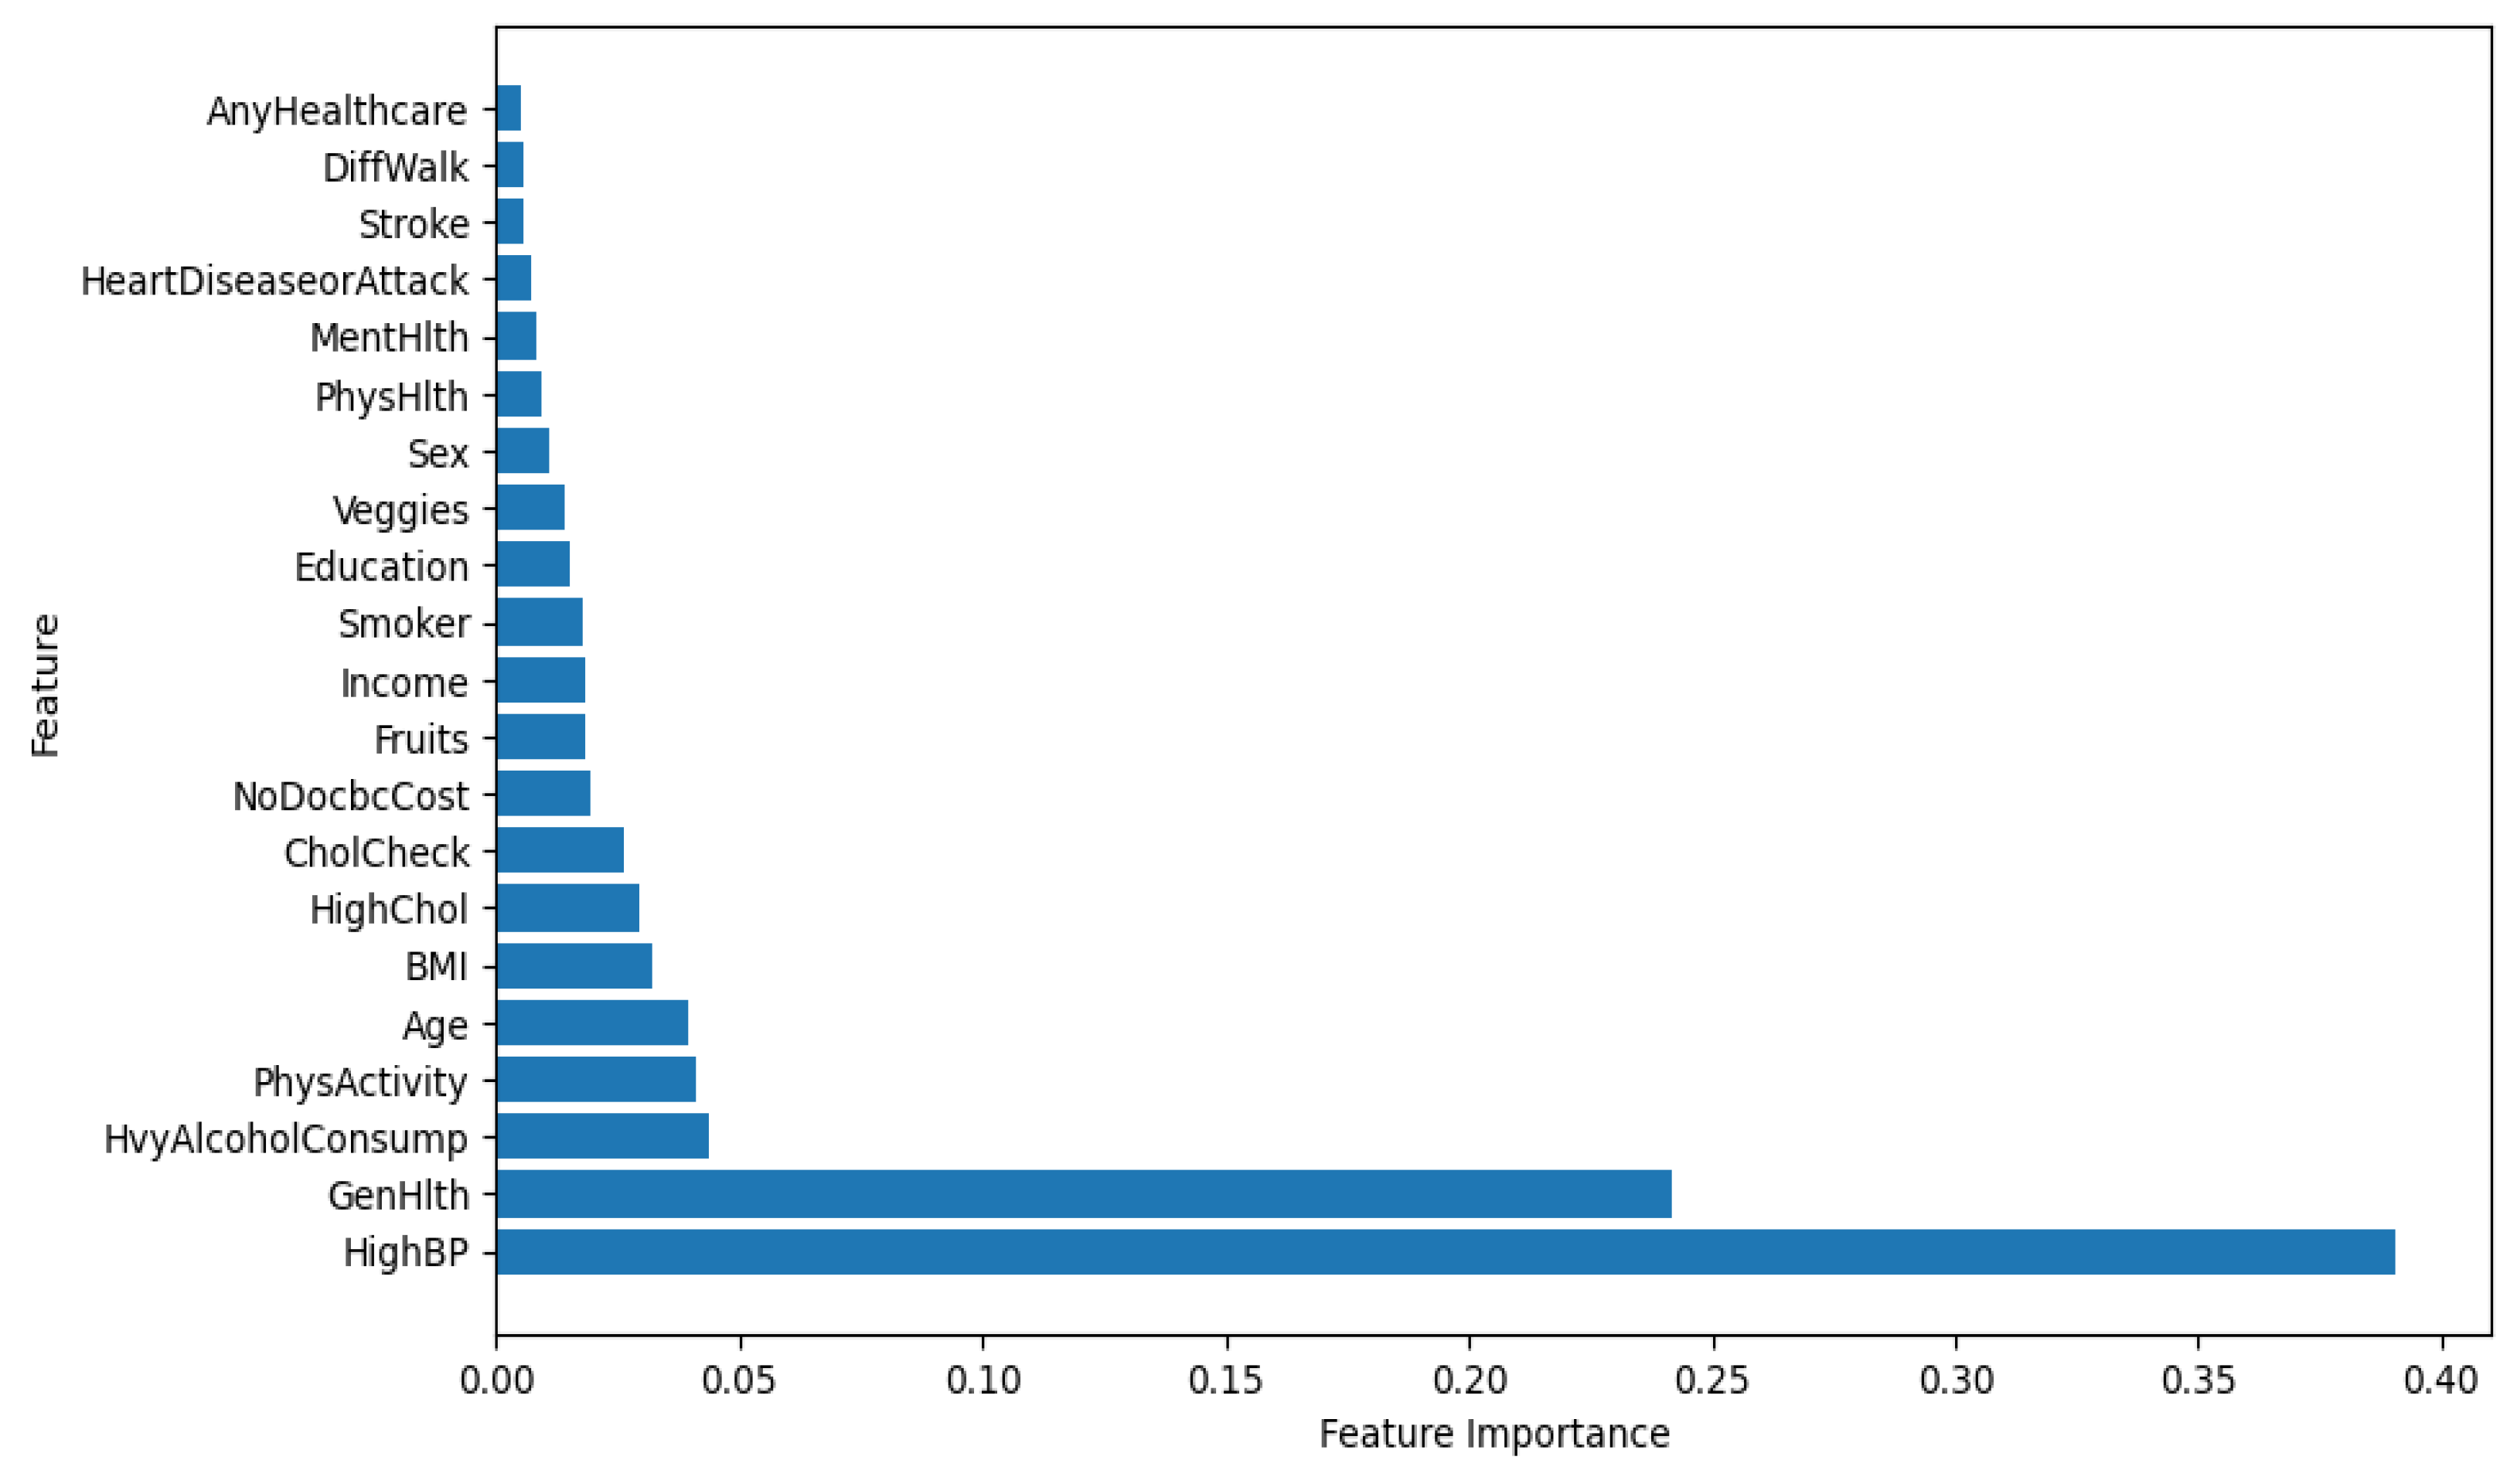
Figure 3.
Significant Logistic Regression Coefficients
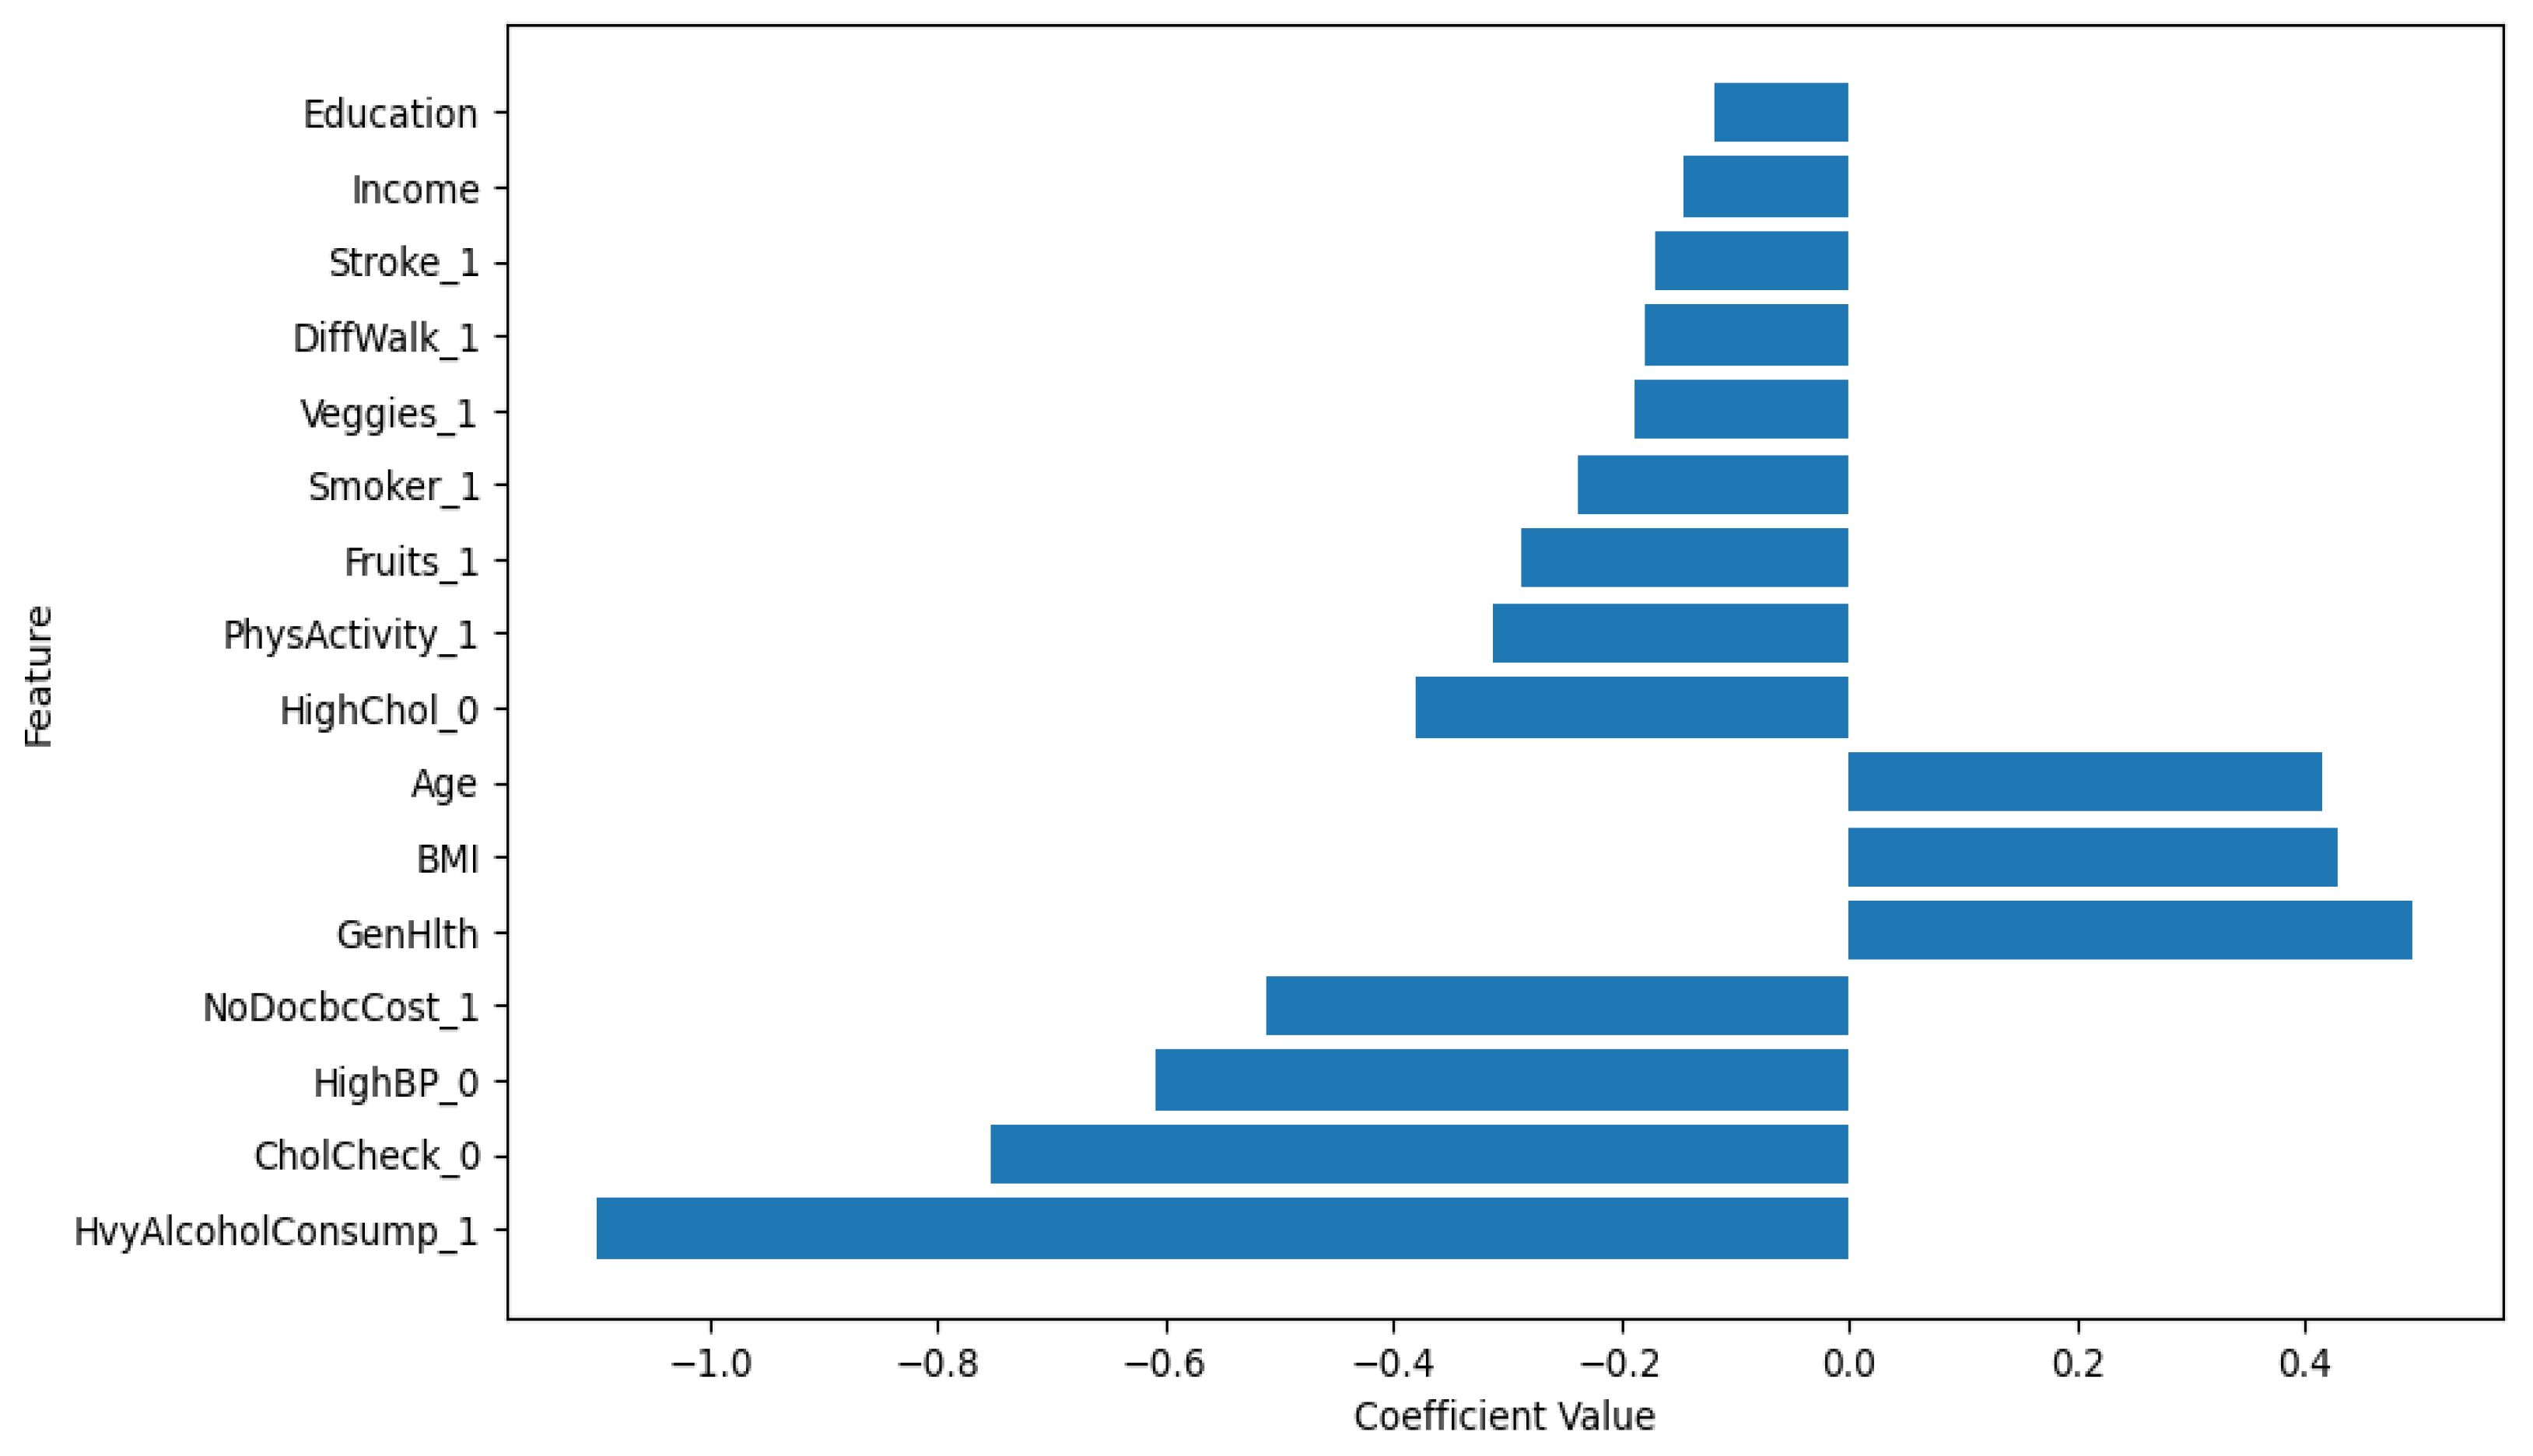

Table 1.
Performance metrics of the models
| Model | AUC | F1-score | Accuracy | Precision | Recall |
|---|---|---|---|---|---|
| Logistic Regression | 0.81 | 0.84 | 86% | 0.83 | 0.86 |
| XGBoost | 0.83 | 0.76 | 80% | 0.87 | 0.72 |
| Random Forest | 0.80 | 0.83 | 86% | 0.83 | 0.86 |
Disclaimer/Publisher’s Note: The statements, opinions and data contained in all publications are solely those of the individual author(s) and contributor(s) and not of MDPI and/or the editor(s). MDPI and/or the editor(s) disclaim responsibility for any injury to people or property resulting from any ideas, methods, instructions or products referred to in the content. |
© 2024 by the authors. Licensee MDPI, Basel, Switzerland. This article is an open access article distributed under the terms and conditions of the Creative Commons Attribution (CC BY) license (http://creativecommons.org/licenses/by/4.0/).
Copyright: This open access article is published under a Creative Commons CC BY 4.0 license, which permit the free download, distribution, and reuse, provided that the author and preprint are cited in any reuse.


