Submitted:
15 November 2024
Posted:
19 November 2024
You are already at the latest version
Abstract
In countries such as Italy, there is a notable skewing of the population pyramid toward older age groups and individuals with chronic health conditions. This demographic shift is anticipated to result in increased social costs. It would be advantageous to enhance the physiological conditions and socialization opportunities for the elderly, as this may lead to improved overall well-being and a reduction in healthcare expenditures. It can be reasonably argued that there is a substantial potential for the ecosystem services provided by forest and woodland ecosystems to benefit this particularly vulnerable population. Due to its distinctive territorial configuration, Italy presents a multitude of opportunities for implementing restoration policies. A crucial step is to evaluate the actual welfare benefits that natural areas can offer. To this end, an experimental campaign was conducted in the Parma area of northern Italy, which aimed to assess the positive impact of ecosystem services in comparison to urban environments. The results of this study lend support to the notion that policies which encourage the temporary residency of the elderly in forested and wooded areas may facilitate physiological recovery.
Keywords:
forest system
; Ecosystem services
; meteo-climate analysis
; population’s well-being
; multi sensor device
1. Introduction
Since 2004, the Emilia-Romagna Region (Italy) has established guidelines to mitigate the potential consequences of heat waves through a series of supportive interventions, with a particular focus on vulnerable populations. Indeed, the elderly, those with chronic diseases, individuals residing alone, and those in economically disadvantaged circumstances are particularly vulnerable to the adverse effects of heat. In accordance with the regional guidelines, local health authorities and municipalities, in collaboration with voluntary and third sector organizations, develop local "anti-hot" action plans. A bioclimatic discomfort forecasting system, managed by ARPAE Emilia-Romagna, has been available throughout the region for several years. It can be accessed via the internet at the following address: Heat Risk - Arpae Emilia-Romagna [1]. This website also contains other useful information on risk groups, practical advice for coping with the heat emergency, and health effects. At the local level, situations in which individuals are at risk, particularly those who are not known to the relevant services, are identified through a structured collaboration between family physicians, hospital presidiums, and municipal social services. Additionally, a toll-free number for the Regional Health Service has been established, which is equipped to address citizens' inquiries pertaining to the matter and can, at no additional cost to the caller, transfer the call to the URP of the pertinent Health Authority for the requisite follow-up [2]. Municipalities that have ratified the Covenant of Mayors and have formulated their respective Sustainable Energy and Climate Action Plans (SECAPs) are cognizant of the necessity for adaptation measures to be implemented in their jurisdictions to mitigate the urban heat island effect, which is particularly pernicious during the increasingly frequent and intense heat waves. They are aware of the significance of the ecosystem services that trees provide and are implementing policies to incorporate green infrastructure in metropolitan areas [4,5]. The territory under study, which falls within the province of Parma, encompasses a portion of the Tuscan-Emilian Apennines National Park and the entire Cedra and Parma Valleys Regional Park. There is considerable interest in the forest heritage present in the area, with a focus on optimizing and strengthening existing sectors while also exploring potential avenues for diversification. The primary interests and expectations, both direct and indirect, that can be derived from the forestry sector, or its various components, are as follows:
- The treatment of refuges;
- Social responsibility in the management of the Cedra and Parma Valleys Regional Park;
- The seasonalization of tourist flows and enhancement of the area;
- The preparation of the General Urban Plan (PUG) and the Plan for Transport and sustainable logistics (PULS);
- The ecosystem value;
- Medium and long-term policy to prevent the abandonment of forest areas;
- interest in funding;
- Contact with federations for the use of forests, for the enhancement of sports → getting young people to migrate to the forests, reconnecting them with forest therapy;
- Parks policies and the preservation of existing economic activities (prevention of abandonment of the area);
- Places of study and learning (equipping the park so that it can accommodate students who need to write their theses in peace), also related to sports activities;
- Electrical mobility linked to the sustainability of the park in terms of air quality, and the need to make activities inside the parks and within the filiera increasingly independent of fossil fuels.
1.1. Climate Setting
The city of Parma is situated in the Po River Basin, in the administrative region of Emilia-Romagna in Italy. It is surrounded by the pre-Alps to the north and the Emiliano Apennine to the south. The historical meteorological observatory of the University of Parma was established in the eighteenth century by the Bourbon dynasty, which succeeded the extinct Farnese dynasty. From 1864 onward, meteorological observations were conducted without interruption. Since 1878, the observatory has been situated at the center of the city, in close proximity to one of the architectural complexes of the University of Parma. Specifically, it is located at the summit of the Specola (western tower of the University building), at an elevation of 30 meters above ground level, or 79 meters in total, with the geographical coordinates 44°48′14″N 10°19′06″E. (Figure 4). Over the course of this extensive period, the annual average temperature (AAT) has been observed to be approximately 13.3 degrees Celsius, with the temperature of the coldest month, January, reaching 1.7 degrees Celsius. The highest temperature recorded was 24.3 °C in July. Consequently, the annual temperature range is 22.6 °C, which is typical of semi-continental areas such as the Plain of Po. The trend demonstrates a pronounced and unambiguous rise in annual values, quantifiable as 0.012 °C per year and reaching approximately 2 °C (1.93 °C) for the homogeneous series of approximately 160 years available (Figure 1).
Furthermore, the data confirm the increase in high temperatures, which is more pronounced during the winter months. The average temperature in January, relative to the current reference CLINO 1991-2020, is 3.9 °C, while the AAT is approximately 14.2 °C. The lowest temperature recorded was -18.8 °C in January 1985, while the highest temperature was 40.4 °C in August 2023.
The accumulated precipitation (AR) is relatively low, at approximately 755 mm over the 1833-2023 timespan, distributed in 97 days (Figure 2). The regime is of the "sublittoral Adriatic" type [11], exhibiting bimodal characteristics with a seasonal and absolute maximum in autumn, a second maximum in spring, and two minimums, the latter of which is the most pronounced and occurs in summer.
With regard to the most recent CLINO, the average annual rainfall is approximately 775 mm, distributed over 87 days. Thus, there is a discernible increase in precipitation, accompanied by a notable reduction in the number of days with rainfall. Consequently, a notable rise in daily precipitation is discernible. In conclusion, the climate is classified as subcontinental temperate with a very hot summer (Cfa according to Pinna's 1970 classification), and is predominantly influenced by the morphology of the Po Valley. The FAO aridity index is approximately 0.81, exhibiting a slight but discernible decline in the most recent CLINO (0.72) [12].
2. Materials and Methods
So far, the instances reported and related to the forest system concern closely related macro-themes:
- Well-being, which includes forestry therapy, exercise science, and the protection of the weaker segments of the population;
- Sustainable mobility and air quality, which also relates to the theme of well-being and introduces the theme of air pollution;
- Slow and sustainable tourism/tourism, which is connected with choices on mobility and has the potential to become a new driver for local economies at the regional level;
- The local economy, in all its forms, is a significant concern for public administrations, particularly in light of the disruptive impact of extreme events on the territory. This is further compounded by the ongoing challenges posed by the previous pandemic situation and the dynamics of international politics, which inevitably have a bearing on local dynamics;
- The issue of land saving and adapting to climate change also emerges as a key concern, with a particular focus on urban and forest management and maintenance.
In accordance with the World Meteorological Organization (WMO), a heatwave can be defined as "statistically unusual hot weather persisting for a number of days and nights" (WMO, 2022) [13]. Nevertheless, as this definition is not universally accepted and lacks global validity, numerous alternatives are presented in the literature, primarily based on the following criteria: (i) Intensity, defined as the maximum air temperature reached during a heatwave event, (ii) temporal extension, defined as the number of consecutive days that meet the chosen definition of a heatwave, and (iii) frequency, defined as the occurrence of excessive warming episodes per year or season (Figure 3). Furthermore, it is crucial to take into account the geographical and climatic characteristics of the region under investigation. Although heat waves are exceptional events, recent studies have indicated that, in the near future, these phenomena will become more frequent, intense, and prolonged. A definitive definition of a heat wave does not exist in Europe. Ultimately, Italy adheres to the HWF index (heatwave day frequency) definition, which characterizes a heat wave as a period of at least five consecutive days with a maximum daily temperature exceeding the 90th percentile, calculated over the 1993-2020 interval with a moving window centered on 31 days [14].
The issue of heat waves sweeping across the country, coupled with the phenomenon of heat islands in urban agglomerations, has become increasingly significant over time. The significance of this issue is not distributed uniformly across the entire population; rather, it is currently a particularly pressing concern for vulnerable segments, including younger individuals, the elderly, and those with underlying health conditions. In addition to the social implications, it is imperative to consider the significant impact of avoiding adverse effects on the population, which subsequently contribute to overall government health expenditures. The current projections of climate change serve to reinforce this concern, underscoring the necessity for the implementation of protective measures at the territorial level for the purposes of adaptation and mitigation, as well as for the direct protection of vulnerable individuals. One potential course of action would be to relocate vulnerable individuals to areas with greater capacity to safeguard their physiological well-being during the specified time frame. The current situation and projected climate change impacts for Parma Province up to 2060 are illustrated in Figure 4.
The LIFE UrbanProof toolkit (designed and implemented as part of the LIFE UrbanProof project, "Climate Proofing Urban Municipalities," co-funded by the LIFE Programme for the Environment and Climate Action (2014-2020)) is a decision support system designed to facilitate a more informed decision-making process for climate change adaptation planning [17]. The assessment of climate change impacts is limited to those relevant to the urban context. The impact assessment methodology is based on the conceptual framework presented in the Intergovernmental Panel on Climate Change's Fifth Assessment Report (AR5) (2014). The impacts are considered to result from the interaction of hazard and vulnerability, where the latter is understood to be a function of exposure, sensitivity, and adaptive capacity of the population and infrastructure. The assessment was conducted on a spatial basis, utilising maps, with the objective of providing stakeholders with information regarding the locations where the most significant impacts are anticipated to occur and to inform the allocation of resources to facilitate the implementation of adaptation measures (USAID, 2014). The results of the impact assessment can provide an indication of the intensity of expected impacts and the areas that will be most affected. However, more detailed field research and stakeholder consultations are necessary to determine the specific requirements for adaptation planning and local resilience development.
An extensive evaluation of the results of four state-of-the-art regional climate models (RCMs) developed within the EURO-CORDEX initiative was conducted. The results of the RCMs were evaluated against E-OBS gridded observational datasets (v17) for the period 1971-2000, as well as against observational data. The results of the model with the lowest biases were used in the Urban Proof toolkit, specifically MPIESM-LR/RCA4 RCA4, developed by the Swedish Meteorological and Hydrological Institute (SMHI) [18] and driven by the Max Planck Institute for Meteorology (MPI-ESM-LR) model [19]. The hazard indicators for all urban municipalities were calculated using daily adjusted temperatures and precipitation. Trends for the indicator were calculated for the continuous period 1971-2100 based on two scenarios for greenhouse gas (GHG) emissions (Representative Concentration Pathways, RCP), namely RCP4.5 and RCP8.5, which are used in simulations after 2005. The stabilization of GHG levels with the implementation of mitigation policies (RCP4.5) is predicated on the assumption that annual global GHG emissions will reach a peak around 2040 and subsequently decline, resulting in a radiative forcing of 4.5 W/m² in 2100. This scenario, designated as RCP4.5, represents a stabilization scenario wherein annual global GHG emissions are assumed to peak around 2040 and subsequently decline, leading to a radiative forcing of 4.5 W/m² in 2100. This scenario posits the implementation of policies designed to mitigate emissions. The period between 1971 and 2000 was selected as the baseline for comparison with future projections for the time span between 2031 and 2060. The following section presents the impacts and related indicators, as identified by the Urban Proof toolkit, which are particularly pertinent to the study area. These include the Extreme Physical Discomfort index, which is specific to the impact of heat waves. The italicized sections are taken from the Urban Proof toolkit and provide a detailed explanation of the methodology used to obtain the indicator and its composition. The impact of heat waves on human health is contingent upon the extent of climate change-related risk and the degree of vulnerability among the exposed population. The Humidex (HX) climate indicator, which reflects the impact of temperature and humidity on human discomfort, was employed to represent the danger. The Humidex is a relatively simple index that depends only on temperature and relative humidity. It is therefore easier to calculate than other indices that are more complex (e.g., the Universal Thermal Climate Index and the Wet-Bulb Globe Temperature). HX is an empirical heat-stress index that was introduced by Masterton and Richardson (1979). It relates outdoor thermal discomfort experienced by the general population with air temperature and humidity [20,21]. HX is expressed as a linear combination of air temperature Ta (°C) and the vapour pressure of water ρ (hPa).
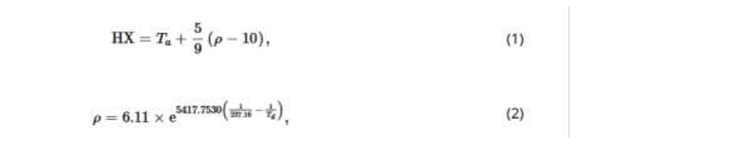
In this context, Td is dew point temperature (K). However, the outputs of ρ and Td are typically not archived from climate models. Alternatively, approximations are employed to express ρ in terms of relative humidity RH (%) or specific humidity, q and surface air pressure Ps (Pa).
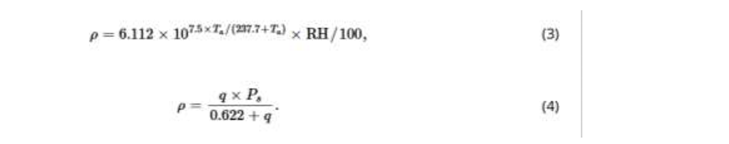
In particular, the number of days with HUMIDEX above 38 °C, which indicates a high level of discomfort, was selected as the hazard indicator. The vulnerability of the exposed population was estimated on the basis of the composite index of social vulnerability and population density. The social vulnerability indicators are aggregated to form a composite social vulnerability index, which reflects the population groups most susceptible to the impacts of climate change and the adaptive capacity of the health system and the economy. The impact indicator is normalized on a scale of 0 to 5, with 0 representing a low level of impact and 5 representing a high level of impact.
In regard to the air quality measurements conducted over the course of a one-month interval, the values of several variables were calculated in accordance with the stipulations set forth in Legislative Decree 155/2010. These values were then compared with those previously recorded in the city of Parma, with all comparisons made in relation to the established limit values and alarm thresholds (Table 1).
3. Results and Discussion
The results and subsequent discussion demonstrate that the month of July 2023 was one of the hottest on record, with temperatures in Parma exceeding typical norms throughout the entire month (Figure 6). The selection of the measurement date was therefore appropriate for the purpose of comparing the city with the wooded areas, with a view to assessing the positive impact of the latter on the well-being of the population, given the intensity of the heat wave that occurred. The results obtained are therefore of particular significance, as they facilitate a comparison between urban data and that of a forest area situated at a medium-to-high elevation in the Emilian Apennines during a period of intense heat.
To evaluate the efficacy of the selected monitoring model, the data from the day of July 11th, the hottest day of the intense heat wave that characterized the entire month of July 2023, were analyzed. The maximum temperature reached approximately 38.2 °C, while the minimum was 23.7 °C (Figure 6). A route was selected that traversed the medium-high altitude wooded areas in proximity to the city of Parma, with the objective of directly assessing the beneficial effects of these ecosystems on the reduction of heat wave intensity and the potential reduction of the impact of pollutants (Figure 7). The route, designated "100 Laghi Bike," extends between the Lagdei refuge, situated at an elevation of 1,250 meters above sea level, and the Prato Spilla refuge, located at an elevation of 1,350 meters above sea level. The survey was conducted using the Meteotracker mobile station, which is equipped with the pollution module and installed on an E-Bike MTB MeteoTracker X Standalone. This is a solution developed by IoTopon srl for the monitoring of micrometeorological and microclimatic conditions in areas of interest. It comprises two principal components: a hardware element, namely the multi-sensor device, which is equipped with a magnetic base, and a software infrastructure for the collection and management of data. Additionally, the MeteoTracker X Standalone solution comprises a data service for the real-time transfer and visualization of data on third-party platforms (API service and interactive map) and for advanced processing functionalities. The MeteoTracker X Standalone system enables the collection of extensive, high-quality meteorological data at a high spatial resolution, including temperature, relative humidity, pressure, vertical temperature gradient, dew point, humidex thermal comfort index, solar radiation intensity indicator, potential temperature, and medium velocity. Additionally, it allows for the measurement of air quality with a spatial resolution of a few meters, facilitating the creation of comprehensive datasets for training AI/machine learning models [24].
The maximum temperature recorded along the route was 27.9 °C at an altitude of 955 m.asl, occurring at approximately 1 p.m. (Figure 8). It is evident that there is a significant temperature differential between the mid-upper mountain area and the Parma airport (Figure 9). This is the result of a combination of environmental variables, in addition to the variation in elevation (from 900 to 1550 meters above sea level). In the four hours of common measurements, the average vertical thermal gradient was never less than approximately seven degrees per 1,000 m, which is a considerable value in the presence of a baric configuration dictated by a robust subtropical dynamic anticyclone. This phenomenon may be attributed to the heat island effect, which is prevalent throughout the entire metropolitan area of Parma, which has an estimated population of 300,000.
However, even along the route, which exhibited a maximum altitude difference of approximately 700 meters, notable thermal variations were observed at relatively short distances and at comparable elevations. These variations were evidently attributable to the presence of a forest canopy with varying degrees of density, interspersed with grassy glades.
3.1. Night-Time Bioclimatic Discomfort
Figure 6 illustrates the persistence of elevated temperatures throughout the month, occurring concurrently with sporadic thunderstorms. As illustrated in the graph, nighttime temperatures are exceedingly high, resulting in significant physiological discomfort. Notably, there were as many as 26 consecutive tropical nights that persisted throughout the entire first ten days of August. Night discomfort represents a significant factor that has a detrimental impact on the overall well-being of vulnerable populations, particularly the elderly. The elderly population is particularly susceptible to the adverse effects of heat waves, which can exacerbate existing health conditions. For instance, individuals with diabetes may experience a significant decline in their well-being when exposed to extreme heat. The analysis revealed that conditions of strong bioclimatic discomfort at night are typical of the flat and hilly areas of the region under study. Figure 10 presents a comparative analysis of the dew point temperature in the forested mountainous region under study. This is the temperature at which, at constant pressure, the air becomes saturated with water vapor, thus reaching 100% relative humidity. If the value remains at approximately 17-18 °C, the degree of muggy conditions should be considered minimal. However, if it exceeds 20-21 °C, the level of muggy conditions may be classified as moderate. Furthermore, physical discomfort is significantly heightened when temperatures exceed 22-23 °C. At mountain altitudes, this is also attributable to the presence of the forest, despite the occurrence of one of the most pronounced heat waves since the commencement of this study. The mean dew point value is approximately 19 °C, indicating a relatively low level of mugginess. Moderate muggy conditions are only observed in localized and transient instances.
Figure 11 provides immediate evidence of the elevated well-being conditions observed in the wooded mountain route when compared to the urban ones. The well-being values along the majority of the route, although not optimal, indicate a physiological condition of good discomfort tolerance during an intense heat wave. The maximum Humidex value attained during the excursion was no higher than 36, which indicates minimal discomfort. In contrast, the Parma weather station registered between 40 and 46 during the same period, indicating a level of discomfort that is potentially dangerous.
3.2. Air Quality Analysis
It is important to note that the mobile station utilized is not classified as Class 1 according to WMO standards. Consequently, a direct comparison with the measurements obtained by ARPAE is not feasible. In the absence of alternative Class 1 in situ measurements, the data collected along the route can provide valuable insights into the air quality of the wooded area in comparison to the urban environment. Table 1 presents the reference limit values as outlined in Legislative Decree 155/2010, which allows for an assessment to be made between the conditions of residing in the wooded area and the city, although this assessment is limited by the aforementioned considerations.
The United States Environmental Protection Agency (EPA) employs the U.S. Air Quality Index (AQI) as a tool for communicating about outdoor air quality and health. The AQI comprises six color-coded categories, each corresponding to a specific range of index values. As the AQI value increases, so too does the level of air pollution, which consequently raises the level of concern regarding public health. For example, an AQI value of 50 or below is indicative of good air quality, while an AQI value exceeding 300 is indicative of hazardous air quality. For each pollutant, an AQI value of 100 is generally considered to correspond to an ambient air concentration that equals the level of the short-term national ambient air quality standard for the protection of public health. AQI values at or below 100 are typically regarded as satisfactory. When AQI values exceed 100, the air quality is deemed to be unhealthy. Initially, this is the case for specific vulnerable groups, but as AQI values increase, the condition affects the general population as well (https://www.airnow.gov/aqi/aqi-basics/) [26]. Figure 12, Figure 13, Figure 14 and Figure 15, as well as Table 1 and Table 2, illustrate the concentrations of the primary air pollutants along the specified trajectory, thereby providing a comprehensive index of the area's overall air quality. The aforementioned indices, in conjunction with the EPA Air Quality Index and the Fast Air Quality Index (Figure 15 and Figure 16), collectively indicate that the prevailing air quality conditions are favorable. It is important to note that during periods of elevated temperatures, the quality of the air is often compromised, rendering it unsuitable for optimal conditions. In the wooded area, the respective values are 60 and 75, which can be considered "good."
A comparison between the ARPAE data and those of the analyzed wooded area reveals interesting insights. It is evident that, even in the case of pollutants, the presence of more or less dense vegetation has resulted in a notable reduction in environmental impact. The urban monitoring station of Parma-Cittadella recorded ozone concentrations above the target value, indicating a potential health concern. However, these levels remain within the acceptable range for health protection purposes. The remaining reference parameters exhibited relatively low values, which nonetheless merit attention. As illustrated in Figure 12 and Figure 13, the concentrations of PM10 and Ozone in the woods are notably lower than those observed in urban areas.
4. Conclusions
The monitoring data and subsequent comparative analysis of environmental weather data between the urban area of Parma and the medium-high woods of the Apennines demonstrate the effectiveness of woods and broadleaf forests in mitigating the negative effects of pollution and heat waves. Those most vulnerable to these risks, particularly children and the elderly, can be protected through the implementation of appropriate social or welfare policies that facilitate their prolonged residence in wooded areas, thereby enabling their physiological recuperation during these intense atmospheric events. Those with disabilities and chronic illnesses also benefit from reduced exposure to risks. Furthermore, more pronounced conditions of well-being allow for intellectual activities, such as education, to be conducted with greater agility and benefit. The woodland heritage of this area thus represents a valuable asset, both in terms of its ecological significance and its social and health benefits.
The findings are of particular significance for countries in the Mediterranean basin, where the Intergovernmental Panel on Climate Change (IPCC) indicates that the impact of heat waves on populations will soon be significant. It is not only anticipated that the intensity of individual heat events will increase; it is also probable that their frequency will rise considerably. These events predominantly occur during the summer months, and in urban areas, the implementation of nature-based solutions, such as urban reforestation, may not always be a viable option. Consequently, the sole viable adaptation strategy in such contexts is the conditioning of buildings. Nevertheless, this strategy may exacerbate fuel poverty for elderly individuals with limited financial resources.
Furthermore, it is challenging to envision public administration or social services directly addressing energy consumption costs. It is therefore more cost-effective and efficient to implement rehabilitative policies for the most vulnerable groups by relocating them to areas that offer strong ecosystem services. Furthermore, the benefits of these policies could be shared throughout the Mediterranean basin. At the supranational level, agreements could be established to facilitate the relocation of vulnerable individuals, ensuring their physiological protection and enhancing their opportunities for travel and exploration even in older age.
Author Contributions
For research articles with several authors, a short paragraph specifying their individual contributions must be provided. The following statements should be used “Conceptualization, T.G., L.C. and M.F.; methodology, T.G. and M.F.; software, A.R. and L.C..; validation, M.F., T.G. and A.R.; formal analysis, T.G. and M.F.; investigation, M.F.; resources, L.C. and A.R.; data curation, A.R, M.F..; writing—original draft preparation, T.G. and M.F.; writing—review and editing, L.C.; visualization, L.C.; supervision, T.G.; project administration, A.R.; funding acquisition, A.R. All authors have read and agreed to the published version of the manuscript.
Funding
The study was conducted and funded by the project “OptForEU-OPTimising FORest management decisions for a low-carbon climate resilient future in Europe” Horizon Europe research and innovation program under grant agreement No. 101060554, European Research Executive Agency (REA.B – Green Europe), B.2- Farm to fork, Communities Development and Climate Action. Website: https://optforeu.eu/, accessed on 10 November 2024. This research was also partially funded by Progetto Parma Indice di Benessere 100 Laghi Bike.
Data Availability Statement
The original contributions presented in the study are included in the article, further inquiries can be directed to the corresponding author. No new data were created or analyzed in this study. Data sharing is not applicable to this article.
References
- ARPAE. Temi Ambientali, Previsione Rischio Calore. Available online: https://www.arpae.it/it/temi-ambientali/rischio-calore (accessed on 14 October 2024). (In Italian).
- Emilia-Romagna Region, Ondate di calore – come proteggersi? Available online: https://salute.regione.emilia-romagna.it/notizie/regione/2022/giugno/ondate-di-calore-come-proteggersi (accessed on 14 October 2024). (In Italian).
- Covenant of Mayors—Europe. EU Cities Save Energy. Available online: https://eu-mayors.ec.europa.eu/en/home (accessed on 4 August 2023).
- Ouyang, X.; Luo, X. Models for assessing Urban Ecosystem Services: Status and outlooks (2022). Sustainability, 14, 4725. Available online: https://www.mdpi.com/2071-1050/14/8/4725/htm (accessed on 27 September 2022).
- Colavitti, A.M.; Floris, A.; Serra, S. Urban Standards and Ecosystem Services: The Evolution of the Services Planning in Italy from Theory to Practice (2020). Sustainabilty, 12, 2434.
- Mazzoleni, E.; Donelli, D.; Zabini, F.; Meneguzzo, F.; Antonelli, M. Forest Therapy Research in Europe: A Scoping Review of the Scientific Literature. Forests 2024, 15, 848. [Google Scholar] [CrossRef]
- Meneguzzo, F.; Albanese, L.; Antonelli, M.; Baraldi, R.; Becheri, F. R.; Centritto, F.; Donelli, D.; Finelli, F.; Firenzuoli, F.; Margheritini, G.; Maggini, V.; Nardini, S.; Regina, M.; Zabini, F.; Neri, L. (2021). Short-Term Effects of Forest Therapy on Mood States: A Pilot Study. Int. J. Environ. Res. Public Health, 18, 9509. [CrossRef]
- Lynch, H. , Moore, A., Edwards, C. and Horgan, L. (2019). Community parks and playgrounds: Intergenerational participation through Universal Design. Dublin: Centre for Excellence in Universal Design at the National Disability Authority.
- Friedman, S. , Noble, R., Archer, S., Gibson, J., Hughes, C., (2024). A: “It Helps Make the Fuzzy Go Away”. [CrossRef]
- ARPAE. Hydrometeorological Network. Available online: https://www.arpae.it/it/temi-ambientali/meteo/dati-e-osservazioni/rete-di-monitoraggio-idrometeorologica (accessed on 14 October 2024). (In Italian).
- Fazzini, M. , Giuffrida, A. (2005). Une nouvelle proposition quantitative des régimes pluviométriques dans le territoire de Italie: Premiers résultats. In Proceedings of the Climat Urbain, Ville et Architecture, pp. 7-11—Actes XVIII Colloque Internationale de Climatologie. Genova, Italy.
- Food and Agriculture Organization of the United Nations -FAO (2022). Map of aridity (Global - ~19km), Available online: https://data.apps.fao.org/map/catalog/static/search?keyword=aridity (accessed on 3 November 2024).
- WMO, WMO has no immediate plans to name heatwaves (2022). Available online: https://public.wmo.int/media/news/wmo-has-no-immediate-plans-name-heatwaves (accessed on 4 November 2024).
- Di Bernardino, A. , Falasca, S., Iannarelli, A.M., Casadio, S., Siani, A.M. (2023) Effect of heatwaves on urban sea breeze, heat island intensity, and outdoor thermo-hygrometric comfort in Rome (Italy), Urban Climate, Volume 52,101735, ISSN 2212-0955. [CrossRef]
- ISPRA, Clima – Onde di calore. Available online: https://indicatoriambientali.isprambiente.it/it/clima/onde-di-calore (accessed on 3 November 2024).
- Life Urban Proof Toolkit. Available online: https://tool.urbanproof.eu/sdiurbanareas/?lang=IT (accessed on 13 November 2024).
- Life Urban Proof Project. Available online: https://urbanproof.eu/en/ (accessed on 13 November 2024).
- Strandberg, G. , Bärring, L., Hansson, U., Jansson, C., Jones, C., Kjellström, E., Kolax, M., Kupiainen, M., Nikulin, G., Samuelsson, P., Ullerstig, A., Wang, S., (2014), CORDEX scenarios for Europe from the Rossby Centre regional climate model RCA4, SMHI, REPORT METEOROLOGY AND CLIMATOLOGY No. 116, ISSN: 0347-2116, Available online: online: https://www.smhi.se/polopoly_fs/1.90273!/Menu/general/extGroup/attachmentColHold/mainCol1/file/RMK_116.pdf (accessed on 14 November 2024).
- Popke, D., B. Stevens, and A. Voigt (2013), Climate and climate change in a radiative-convective equilibrium version of ECHAM6, J. Adv. Model. Earth Syst. 5, 1–14. [CrossRef]
- Sirangelo, B. , Caloiero, T., Coscarelli, R. et al. Combining stochastic models of air temperature and vapour pressure for the analysis of the bioclimatic comfort through the Humidex. Sci Rep 10, 11395 (2020). [CrossRef]
- Infusino, E. , Caloiero, T., Fusto, F., Calderaro, G., Brutto, A. and Tagarelli, G. (2021) Characterization of the 2017 summer heat waves and their effects on the population of an area of southern Italy. International Journal of Environmental Research and Public Health, 18, 970. [CrossRef]
- Legislative Decree 155/2010 - Attuazione della direttiva 2008/50/CE relativa alla qualita' dell'aria ambiente e per un'aria piu' pulita in Europa. (10G0177) (GU Serie Generale n.216 del 15-09-2010 - Suppl. Ordinario n. 217). Available online: https://www.gazzettaufficiale.it/eli/id/2010/09/15/010G0177/sg (accessed on 3 November 2024).
- 3B Meteo – Storico Parma. Alailable online: https://www.3bmeteo.com/meteo/parma/storico. (accessed on 6 November 2024).
- Meteotracker weather station. Available online: https://meteotracker.com/ (accessed on 6 November 2024).
- Aeronautica Militare - METAR meteo wmo e SYNOP.
Figure 1.
(a) Average monthly thermometric regime (MAT); (b) ultra-centuries-old trend (AAT) relating to the Parma meteorological station. Source: ARPAE [10].
Figure 1.
(a) Average monthly thermometric regime (MAT); (b) ultra-centuries-old trend (AAT) relating to the Parma meteorological station. Source: ARPAE [10].
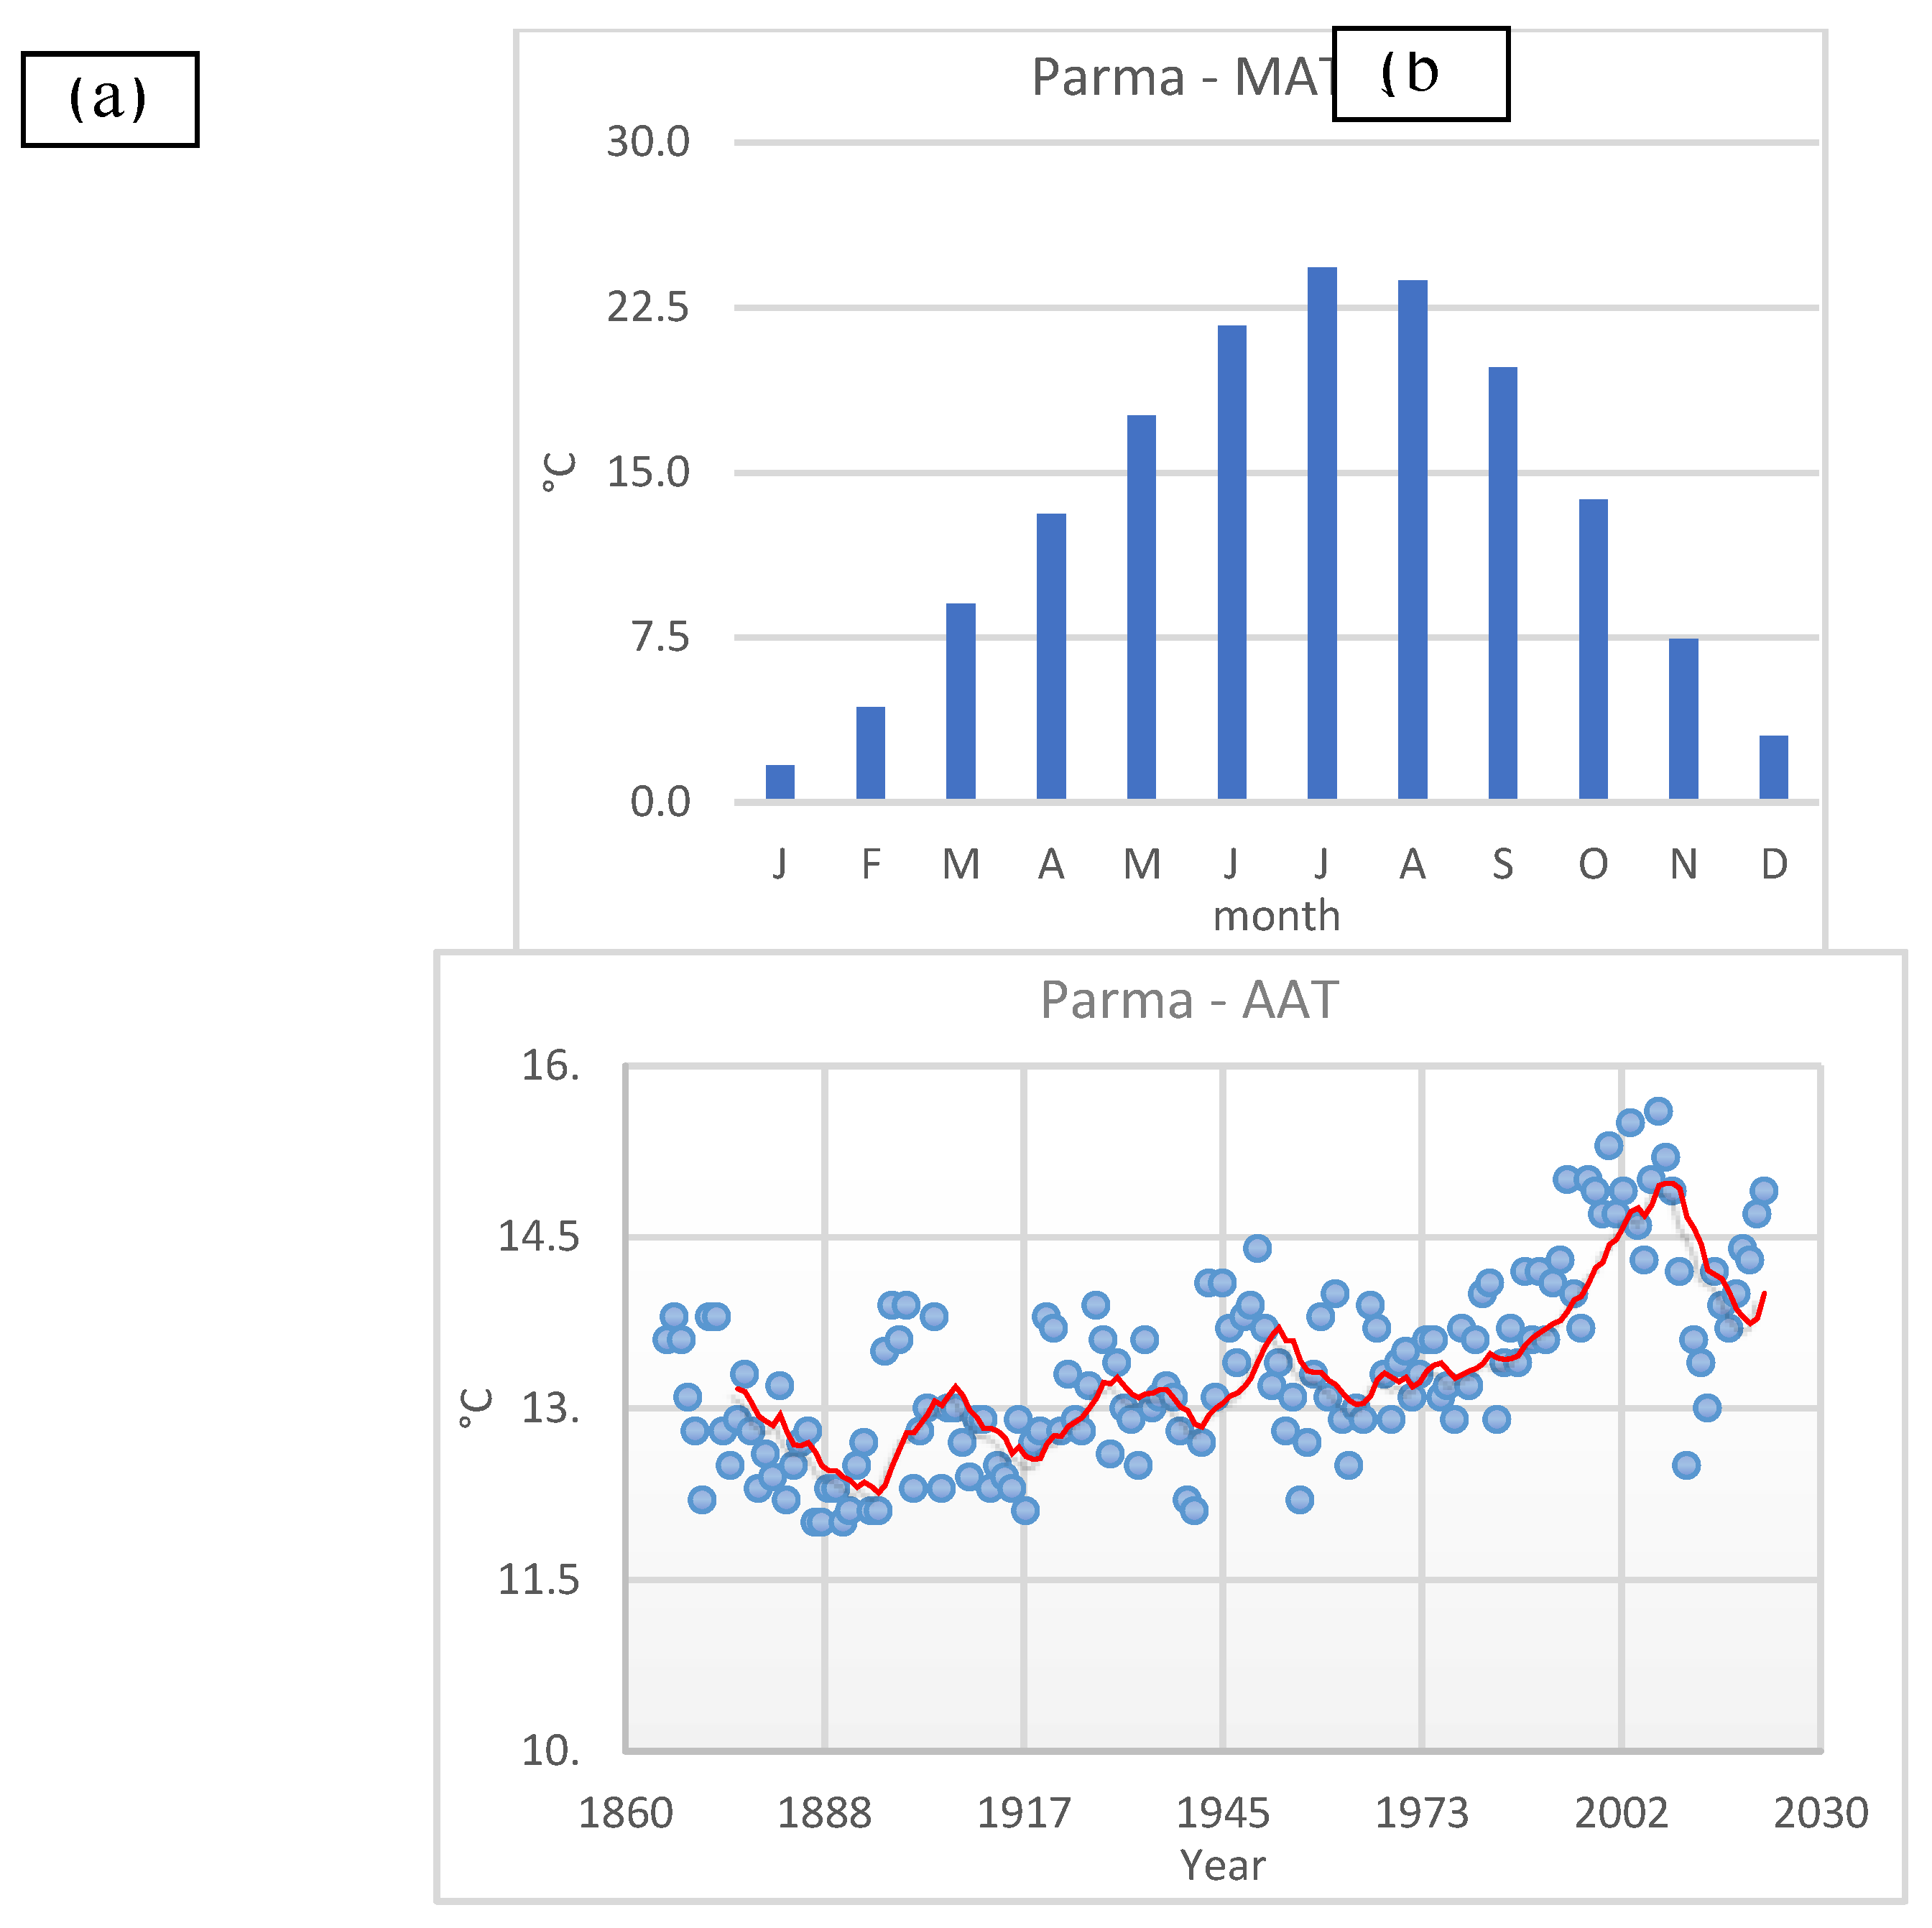
Figure 2.
(a) Average monthly rainfall regime; (b) almost bicentennial trend relating to the Parma meteorological station. Source: ARPAE [10].
Figure 2.
(a) Average monthly rainfall regime; (b) almost bicentennial trend relating to the Parma meteorological station. Source: ARPAE [10].
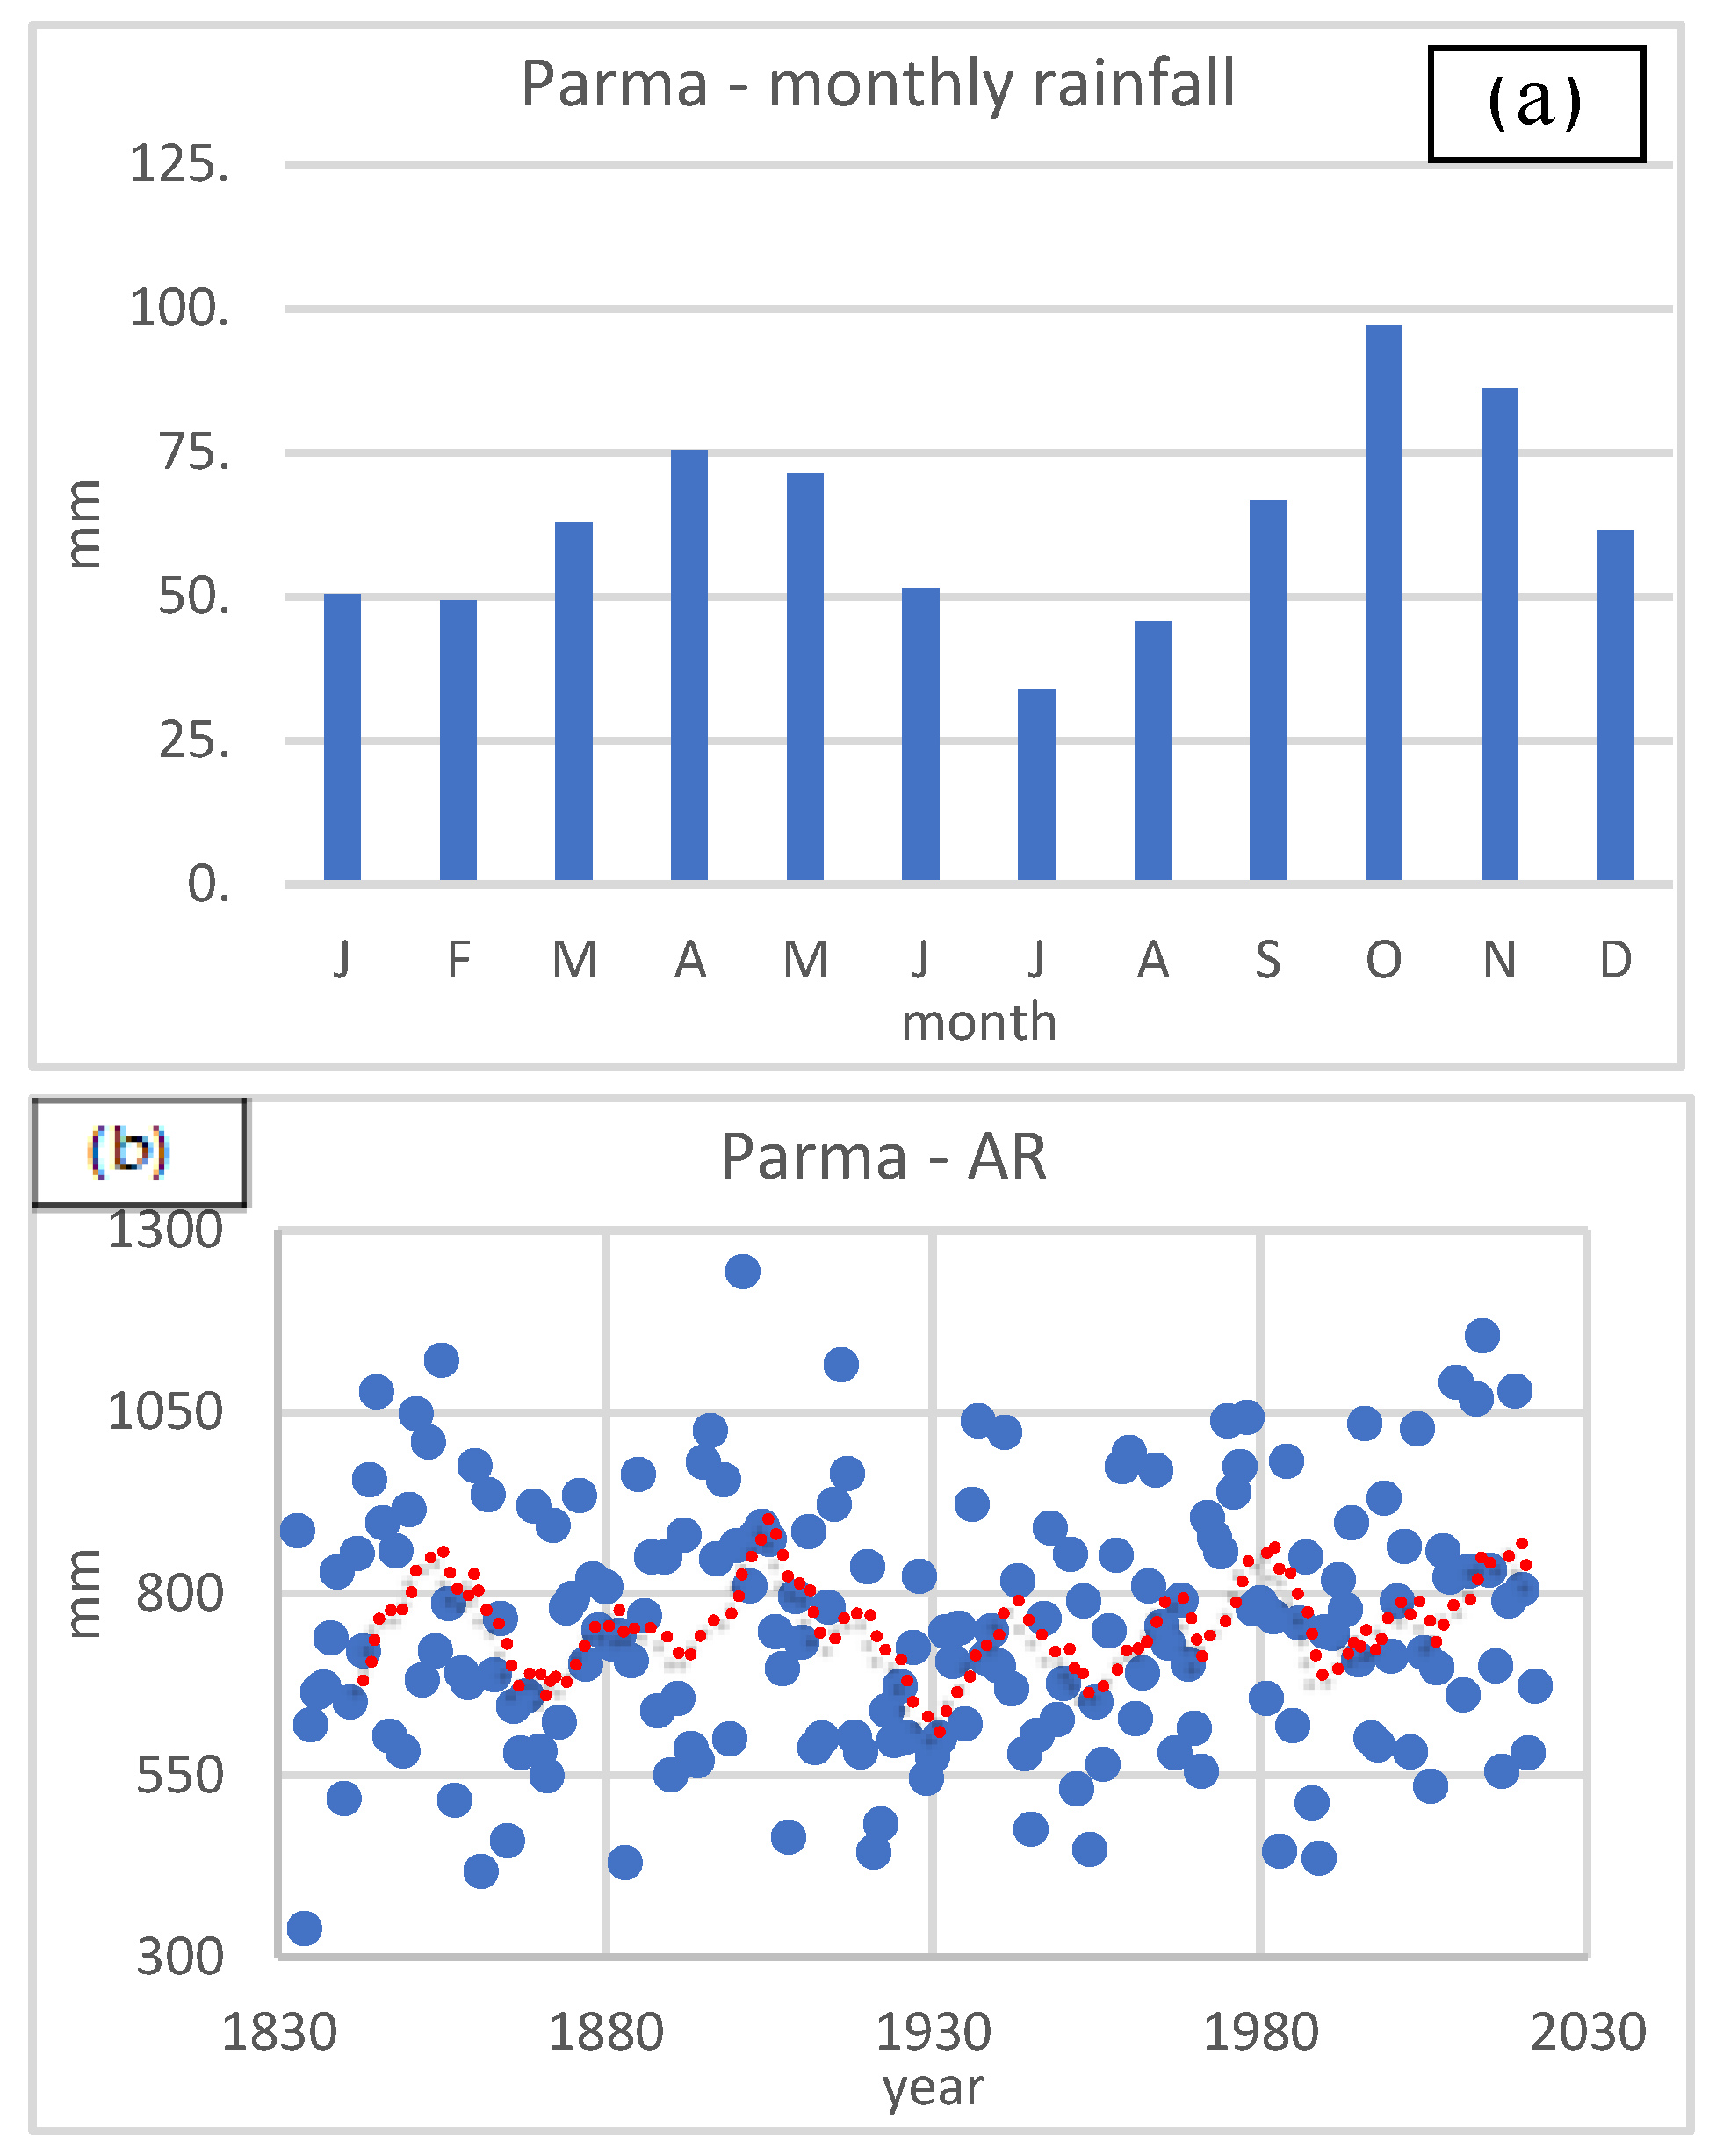
Figure 3.
Heatwaves in Italy from 1961 to 2023. Source: ISPRA [15].
Figure 3.
Heatwaves in Italy from 1961 to 2023. Source: ISPRA [15].
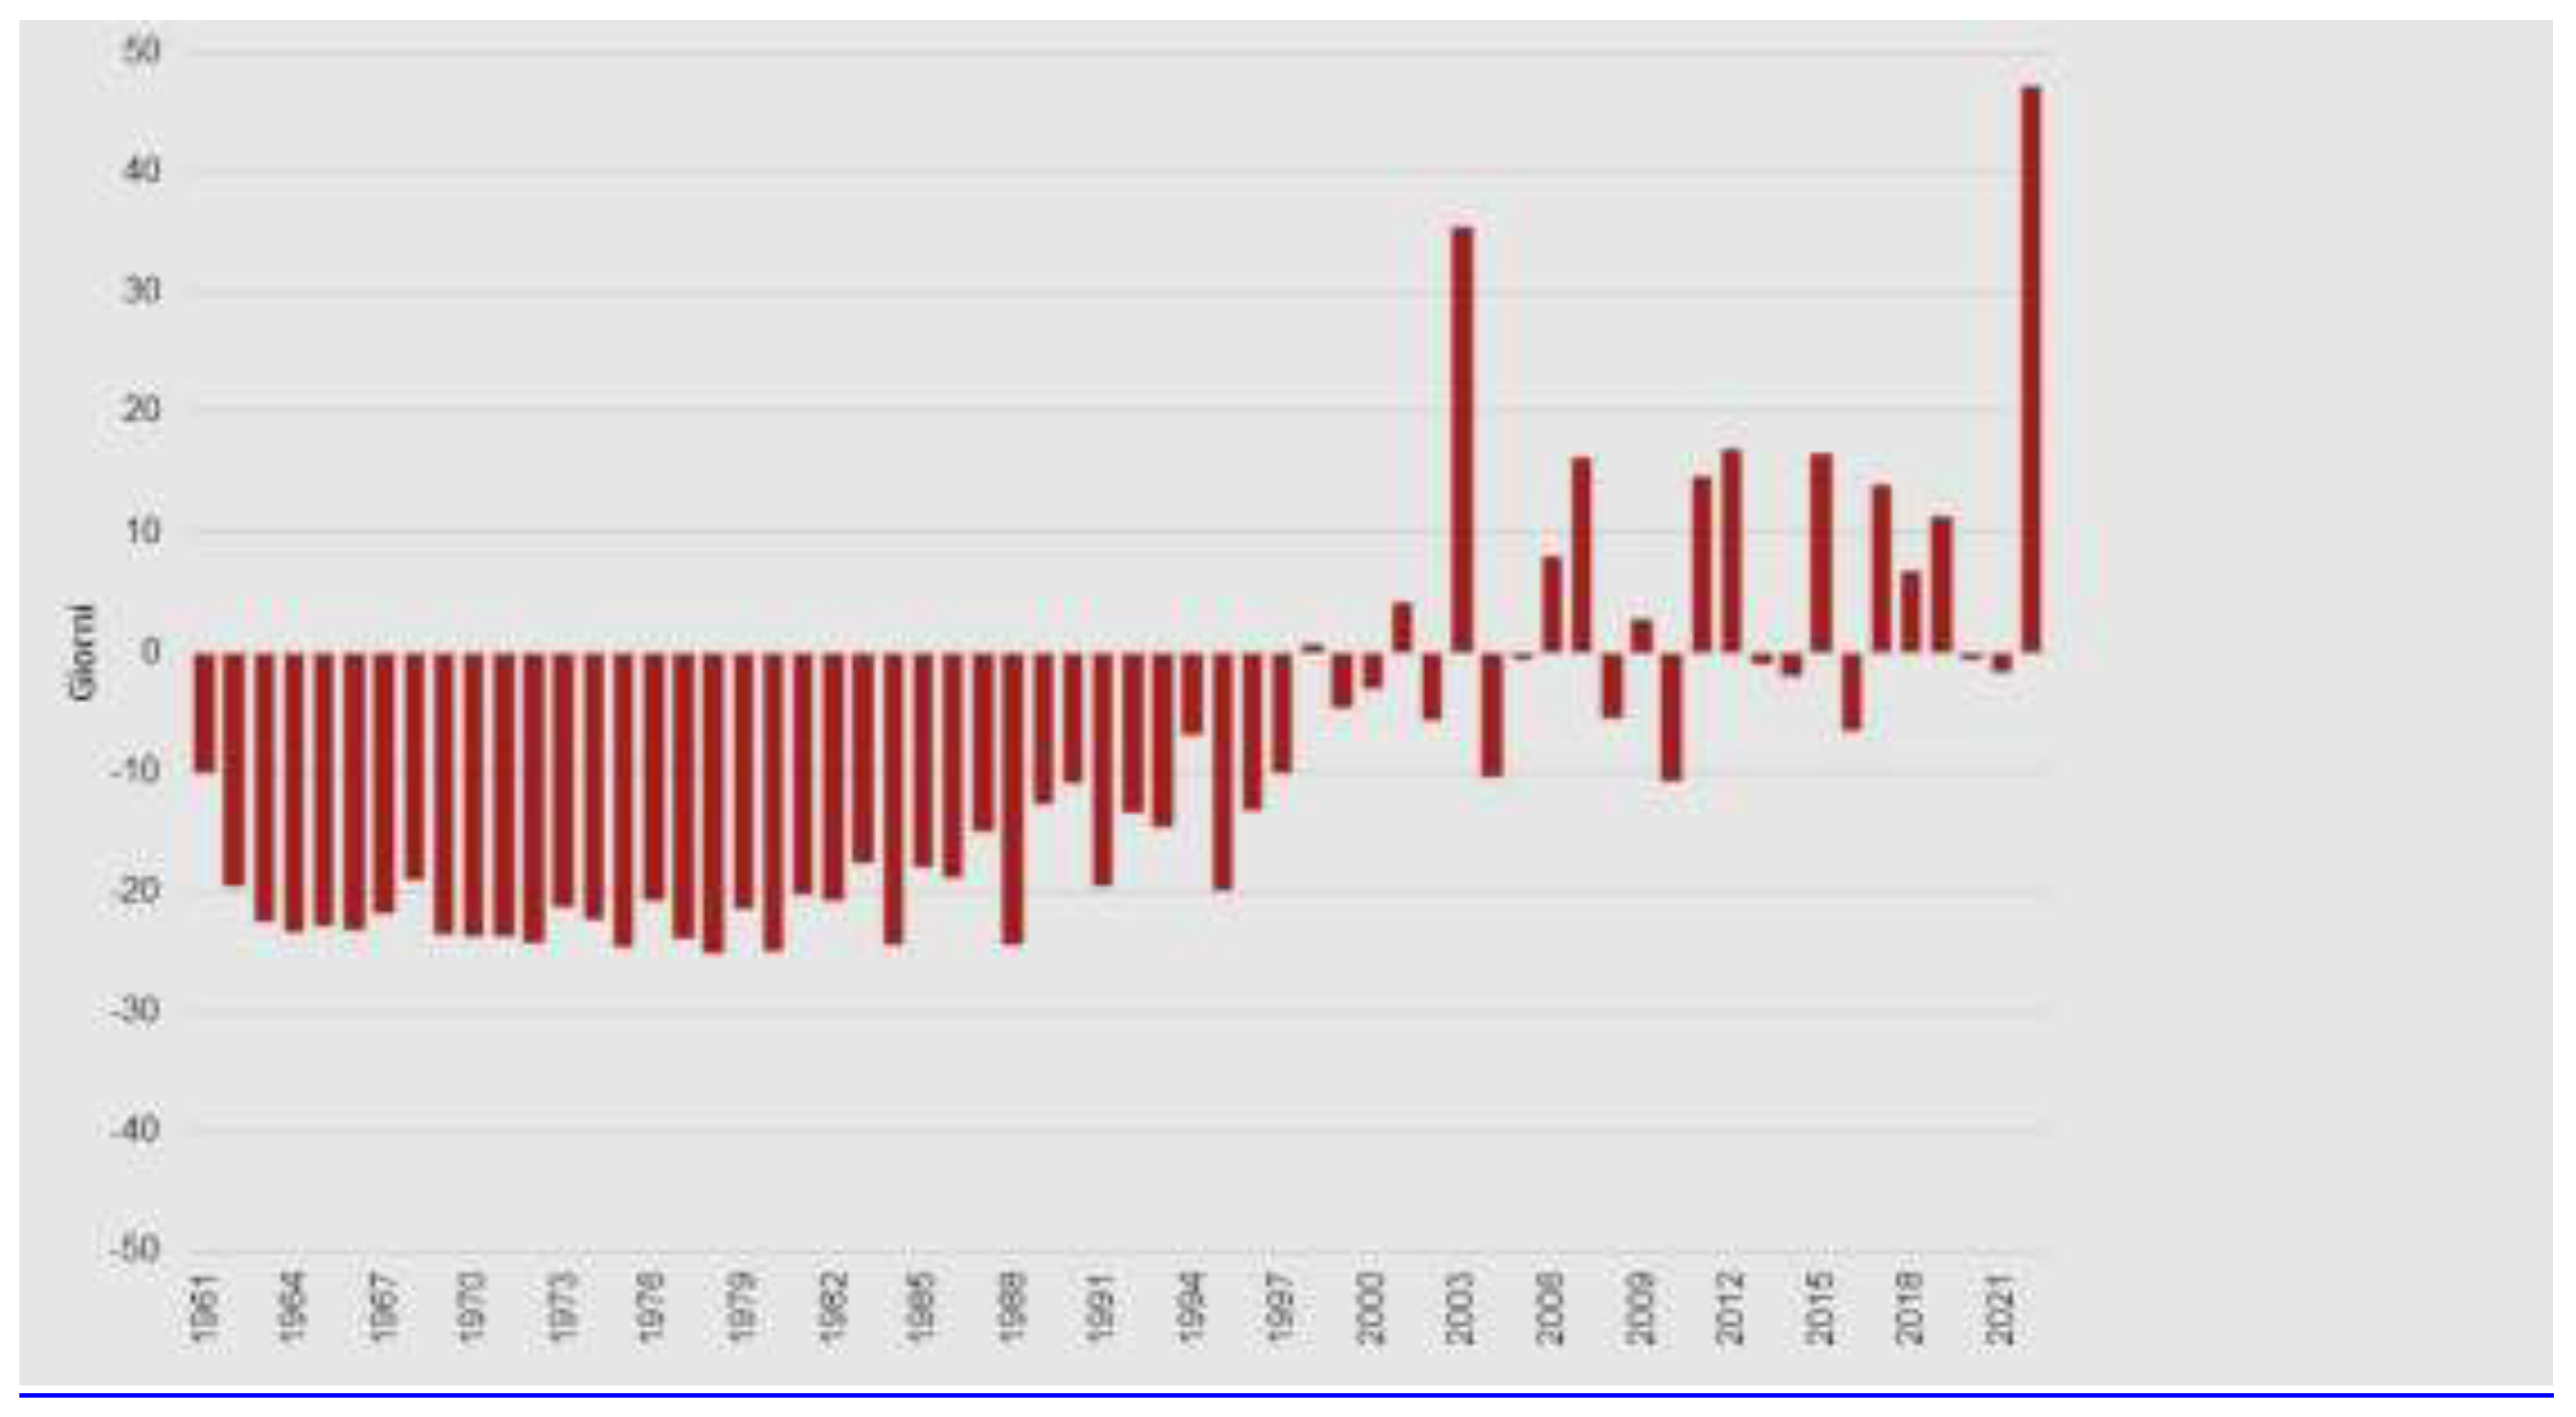
Figure 4.
(a) Current situation; (b) projection to 2060 of heat waves, for Parma Province according to pathway 4.5. Source: Life Urban Proof-Toolkit [16].
Figure 4.
(a) Current situation; (b) projection to 2060 of heat waves, for Parma Province according to pathway 4.5. Source: Life Urban Proof-Toolkit [16].
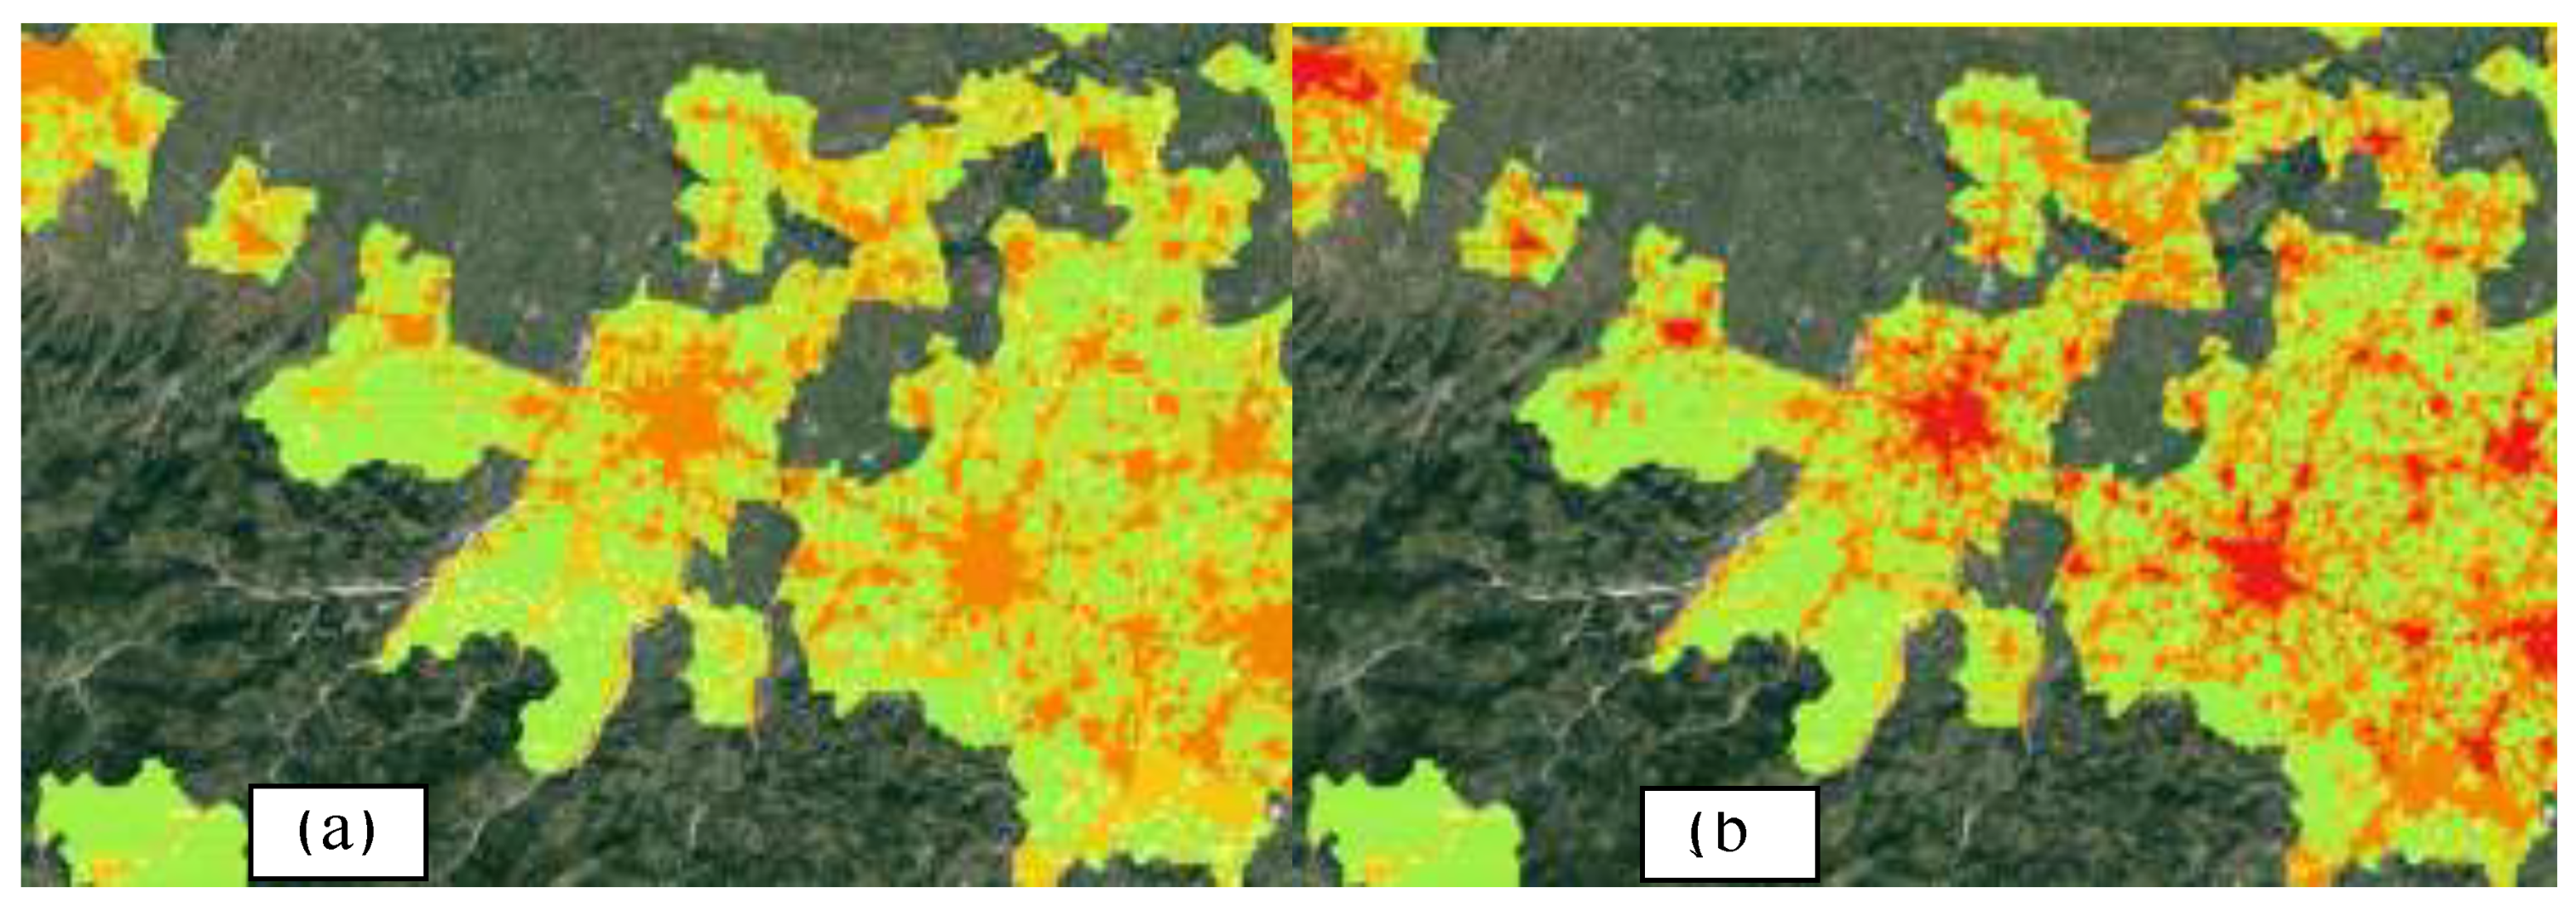
Figure 5.
Composition diagram of the Extreme Physical Discomfort Index – Source: Urban Proof Tool [17].
Figure 5.
Composition diagram of the Extreme Physical Discomfort Index – Source: Urban Proof Tool [17].
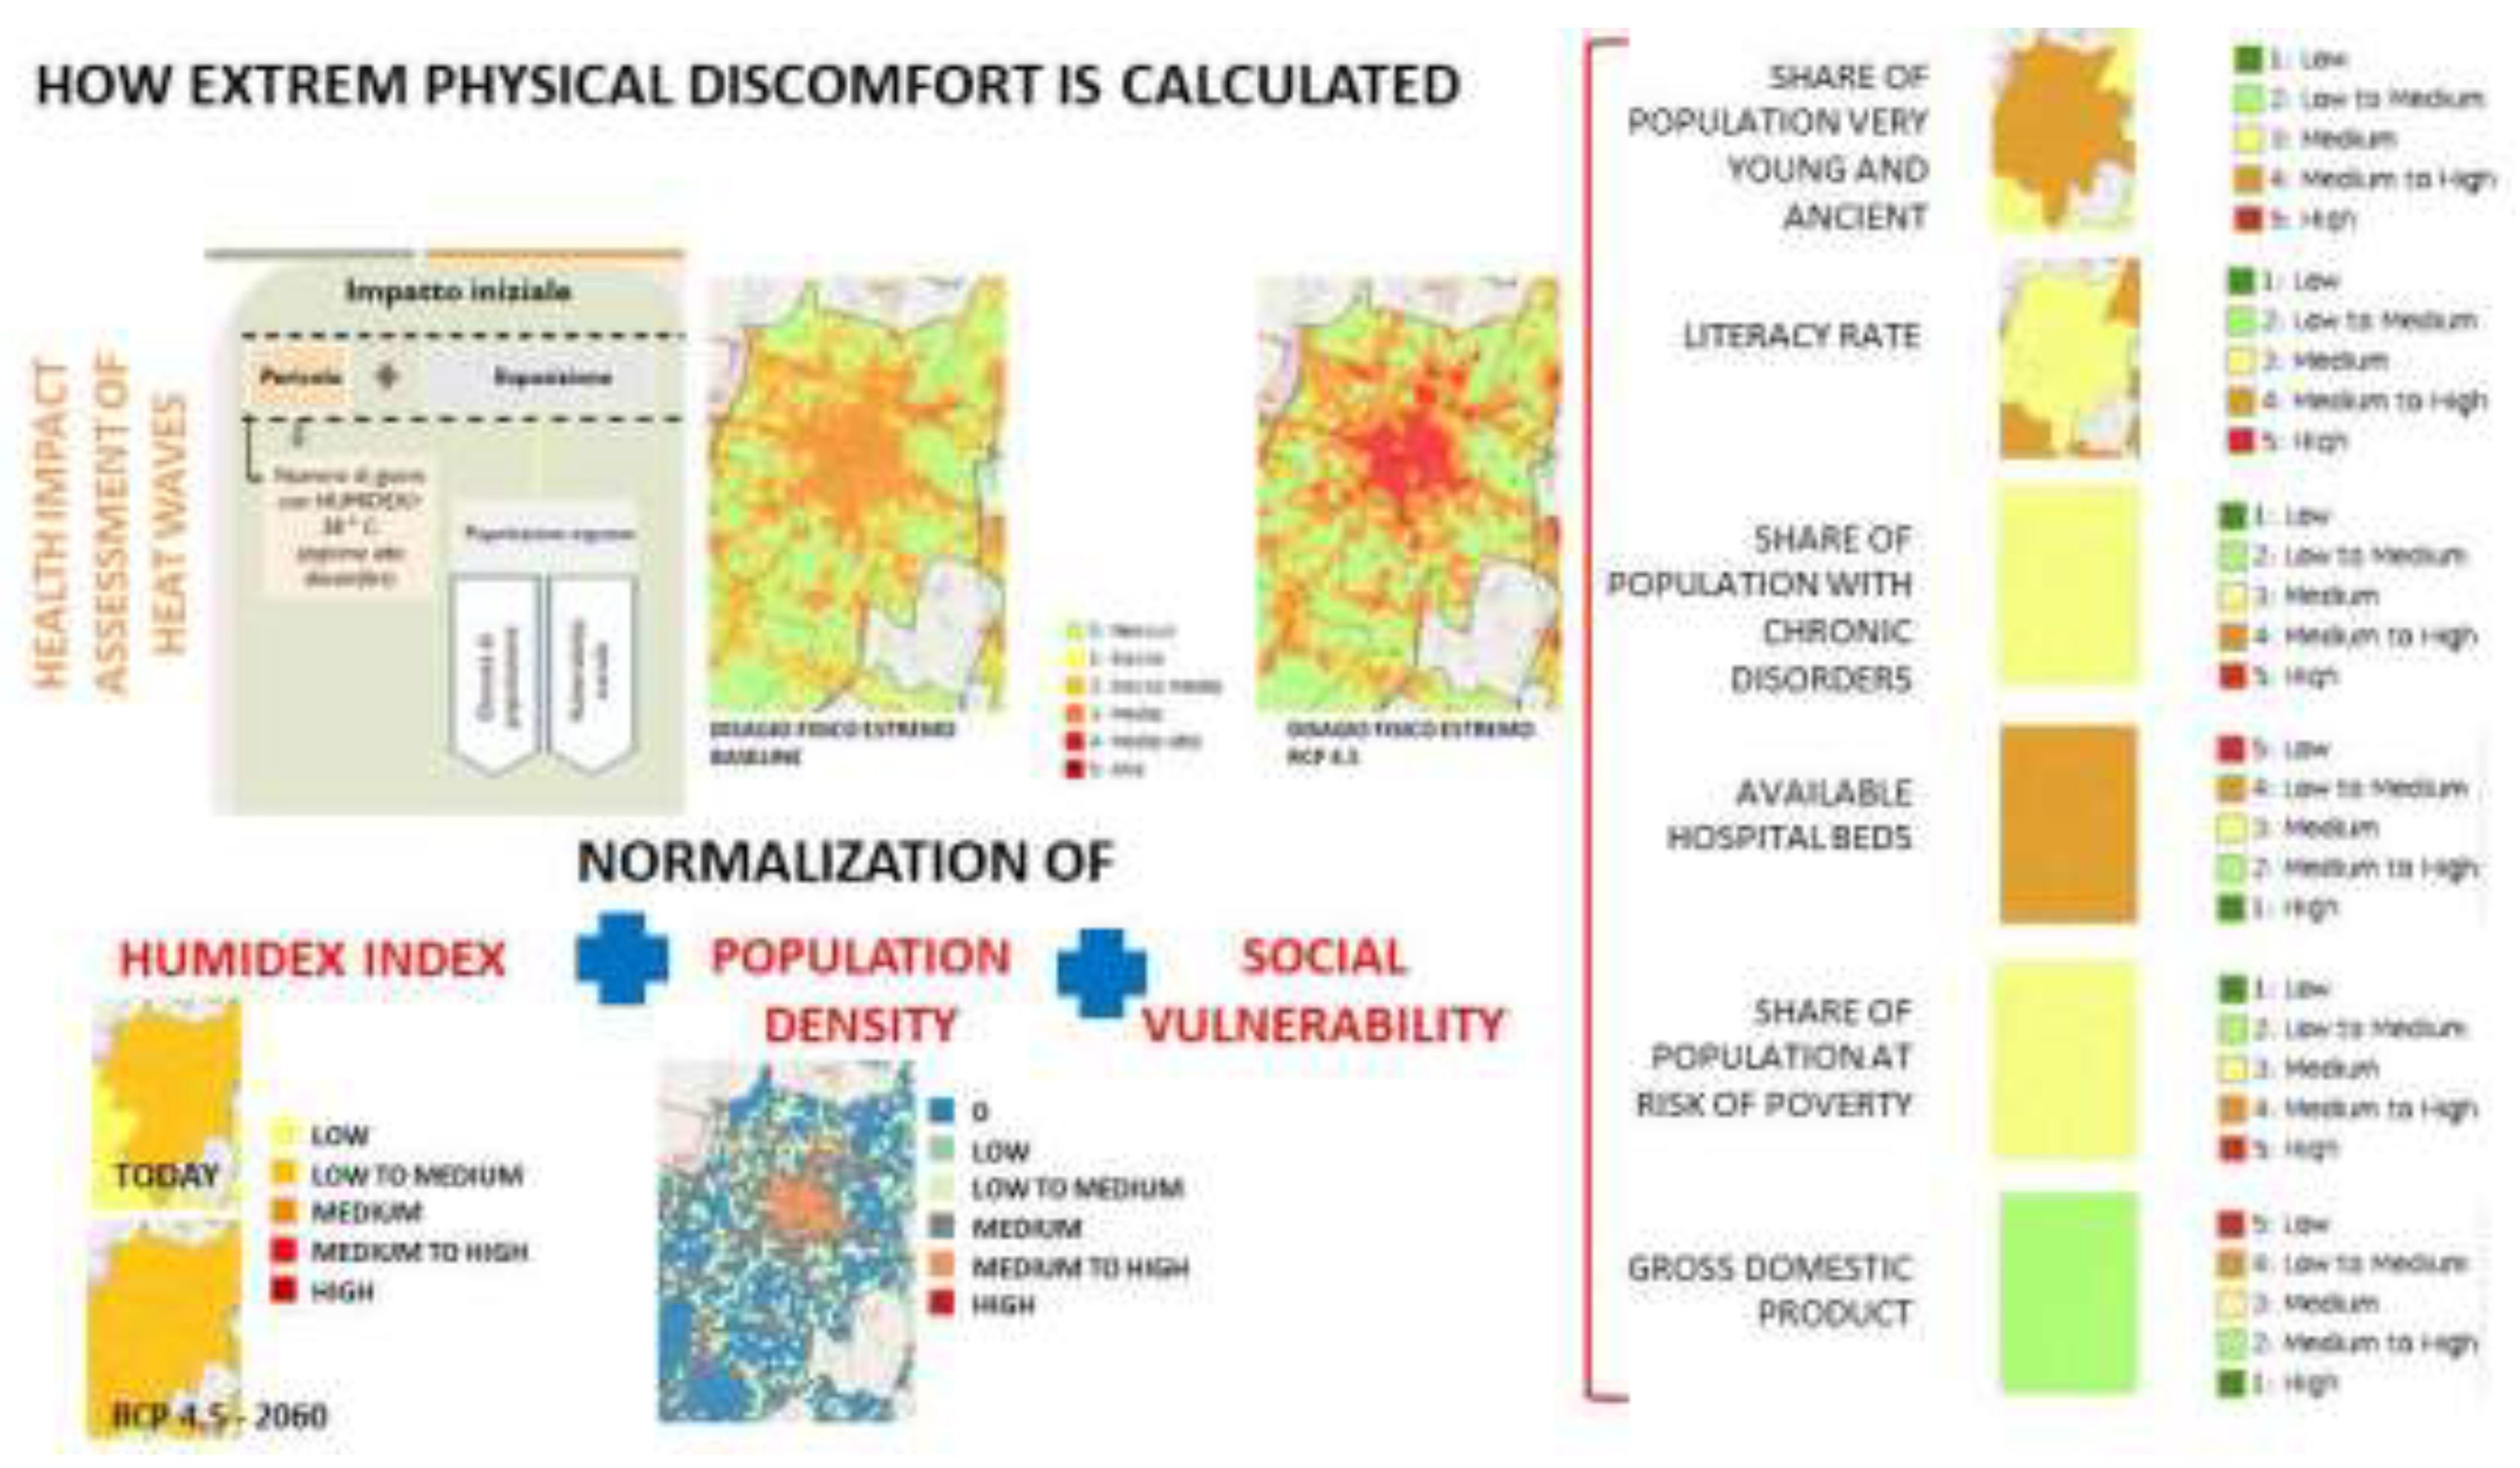
Figure 6.
Temperature development for the city of Parma during July 2023. Source: 3B Meteo [23].
Figure 6.
Temperature development for the city of Parma during July 2023. Source: 3B Meteo [23].
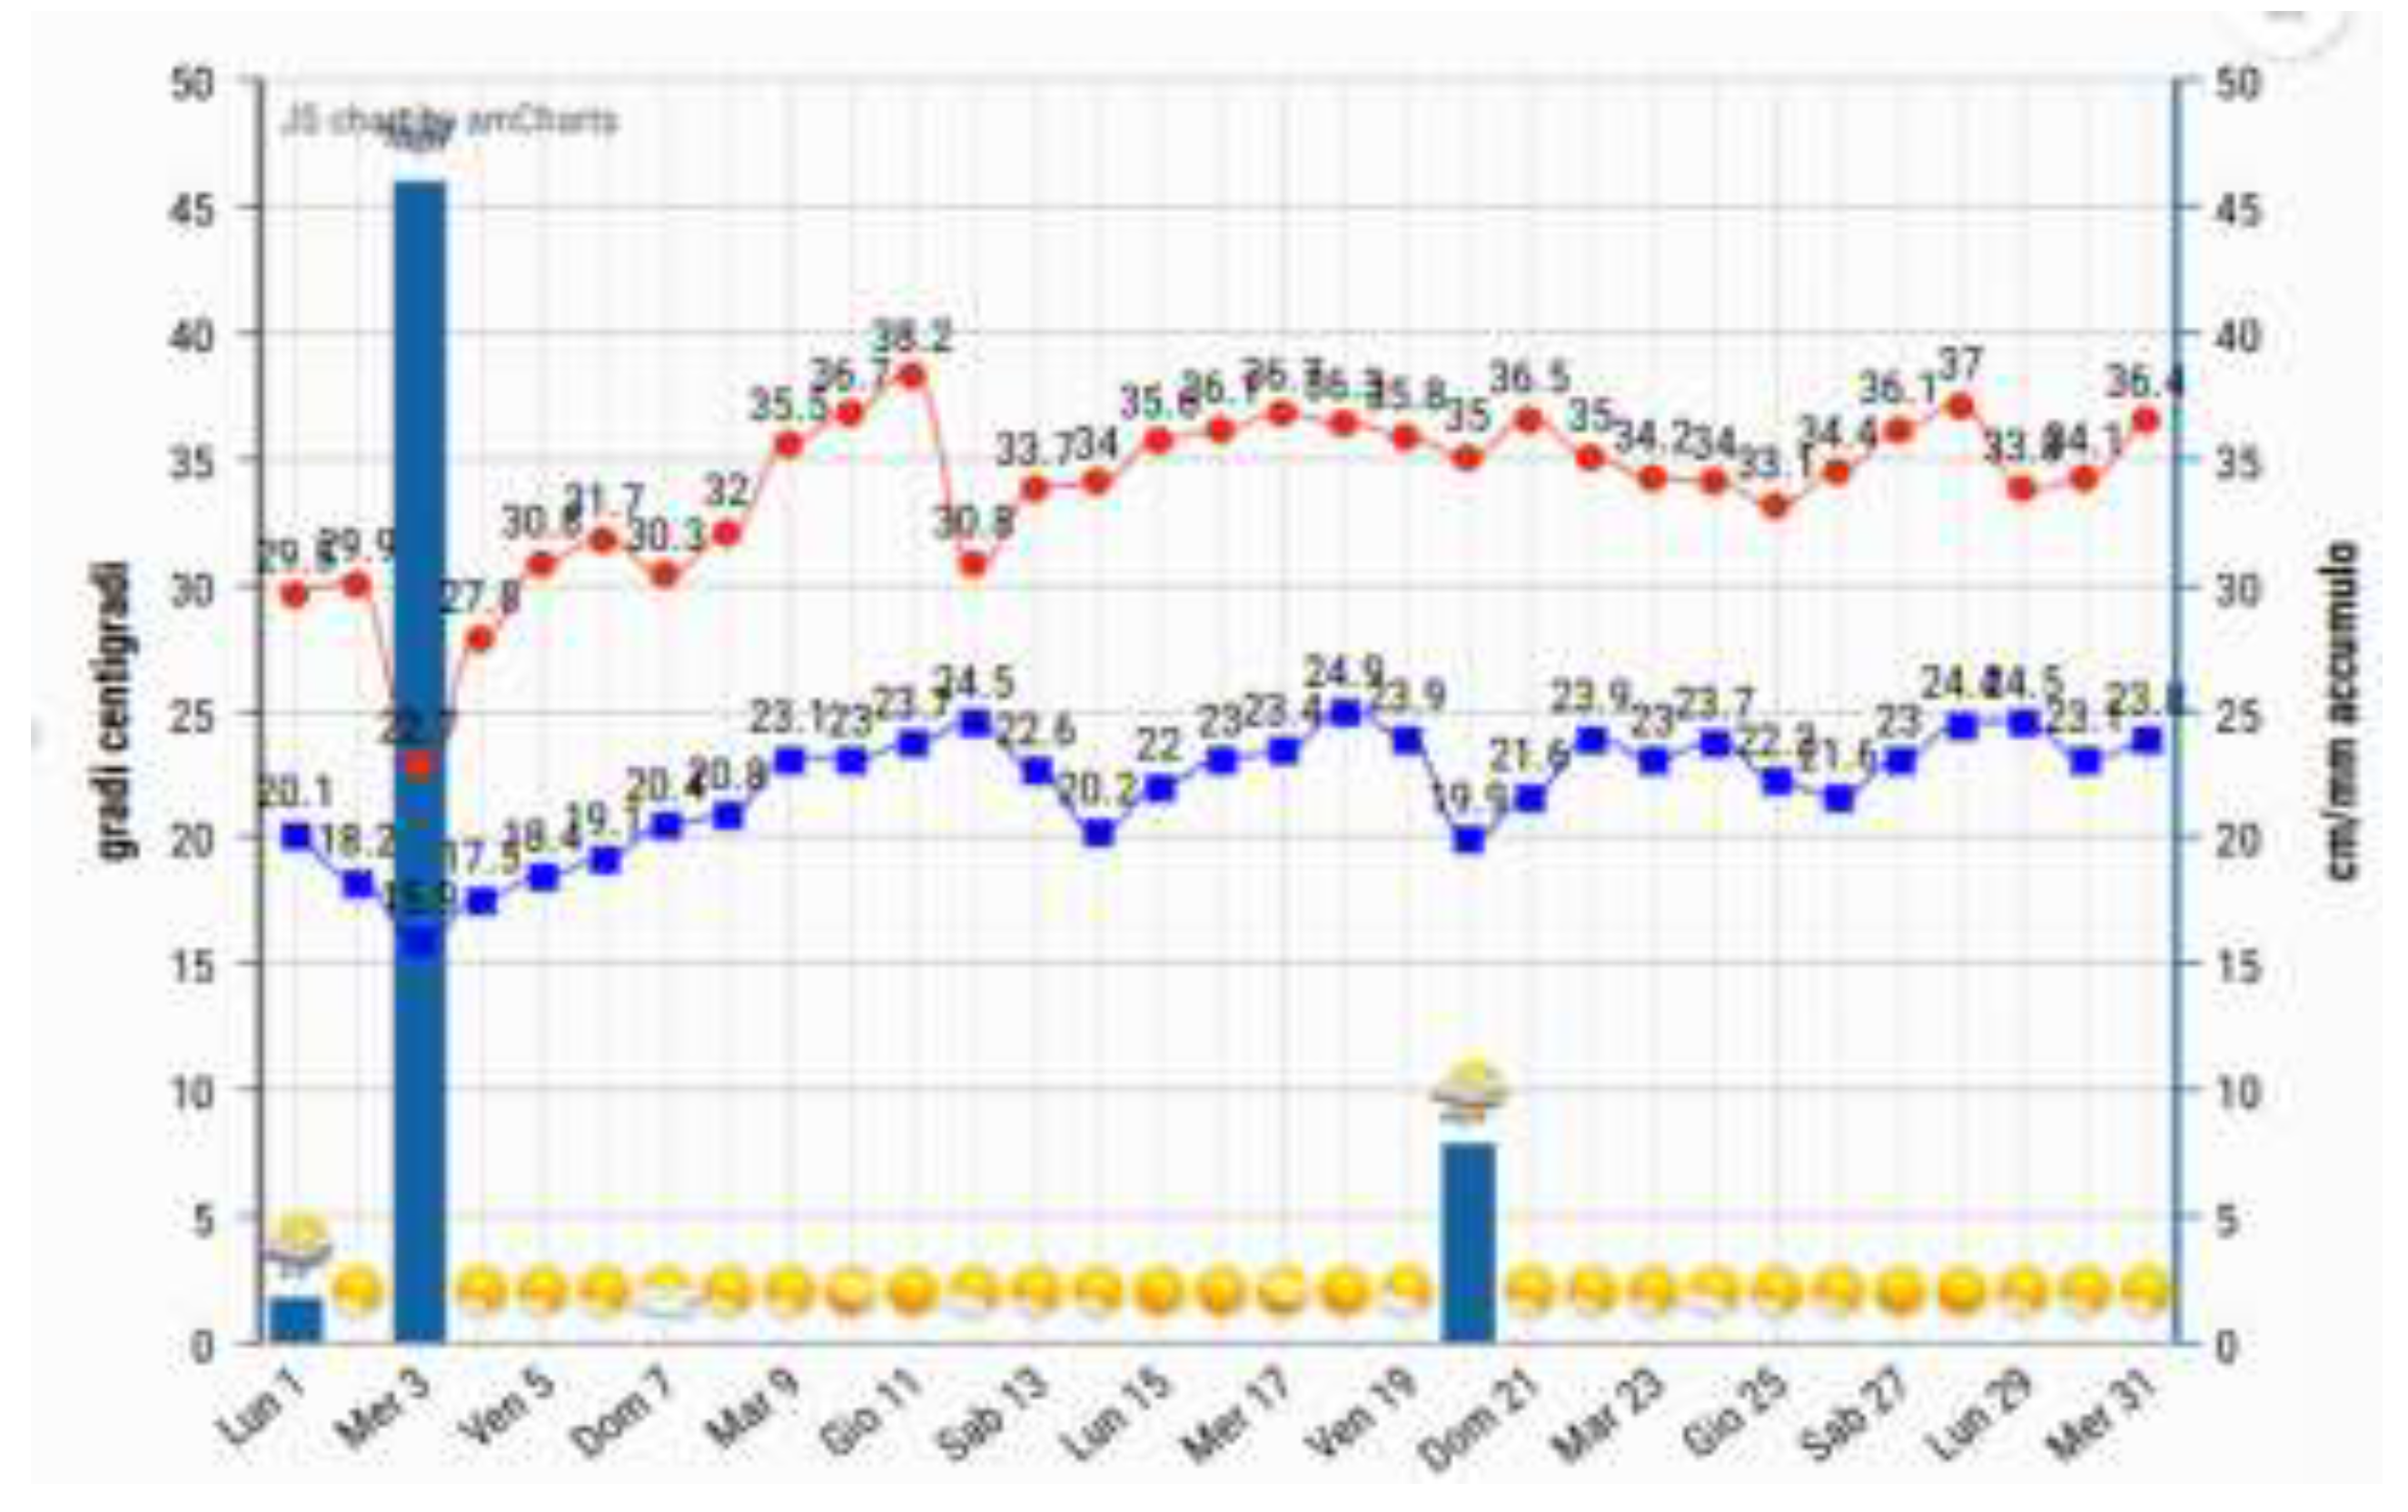
Figure 7.
Map of spatial development of the route taken with the Meteotracker mobile measurement station. The parameter analysed is temperature, the time graph of which is shown in Figure 8. Above is the graphical temperature scale. On the right: E-Bike MTB equipped with Meteotracker+air quality mobile environmental monitoring station at the side of Lagdei Lake (Rifugio Lagdei). Source: Meteotracker [24].
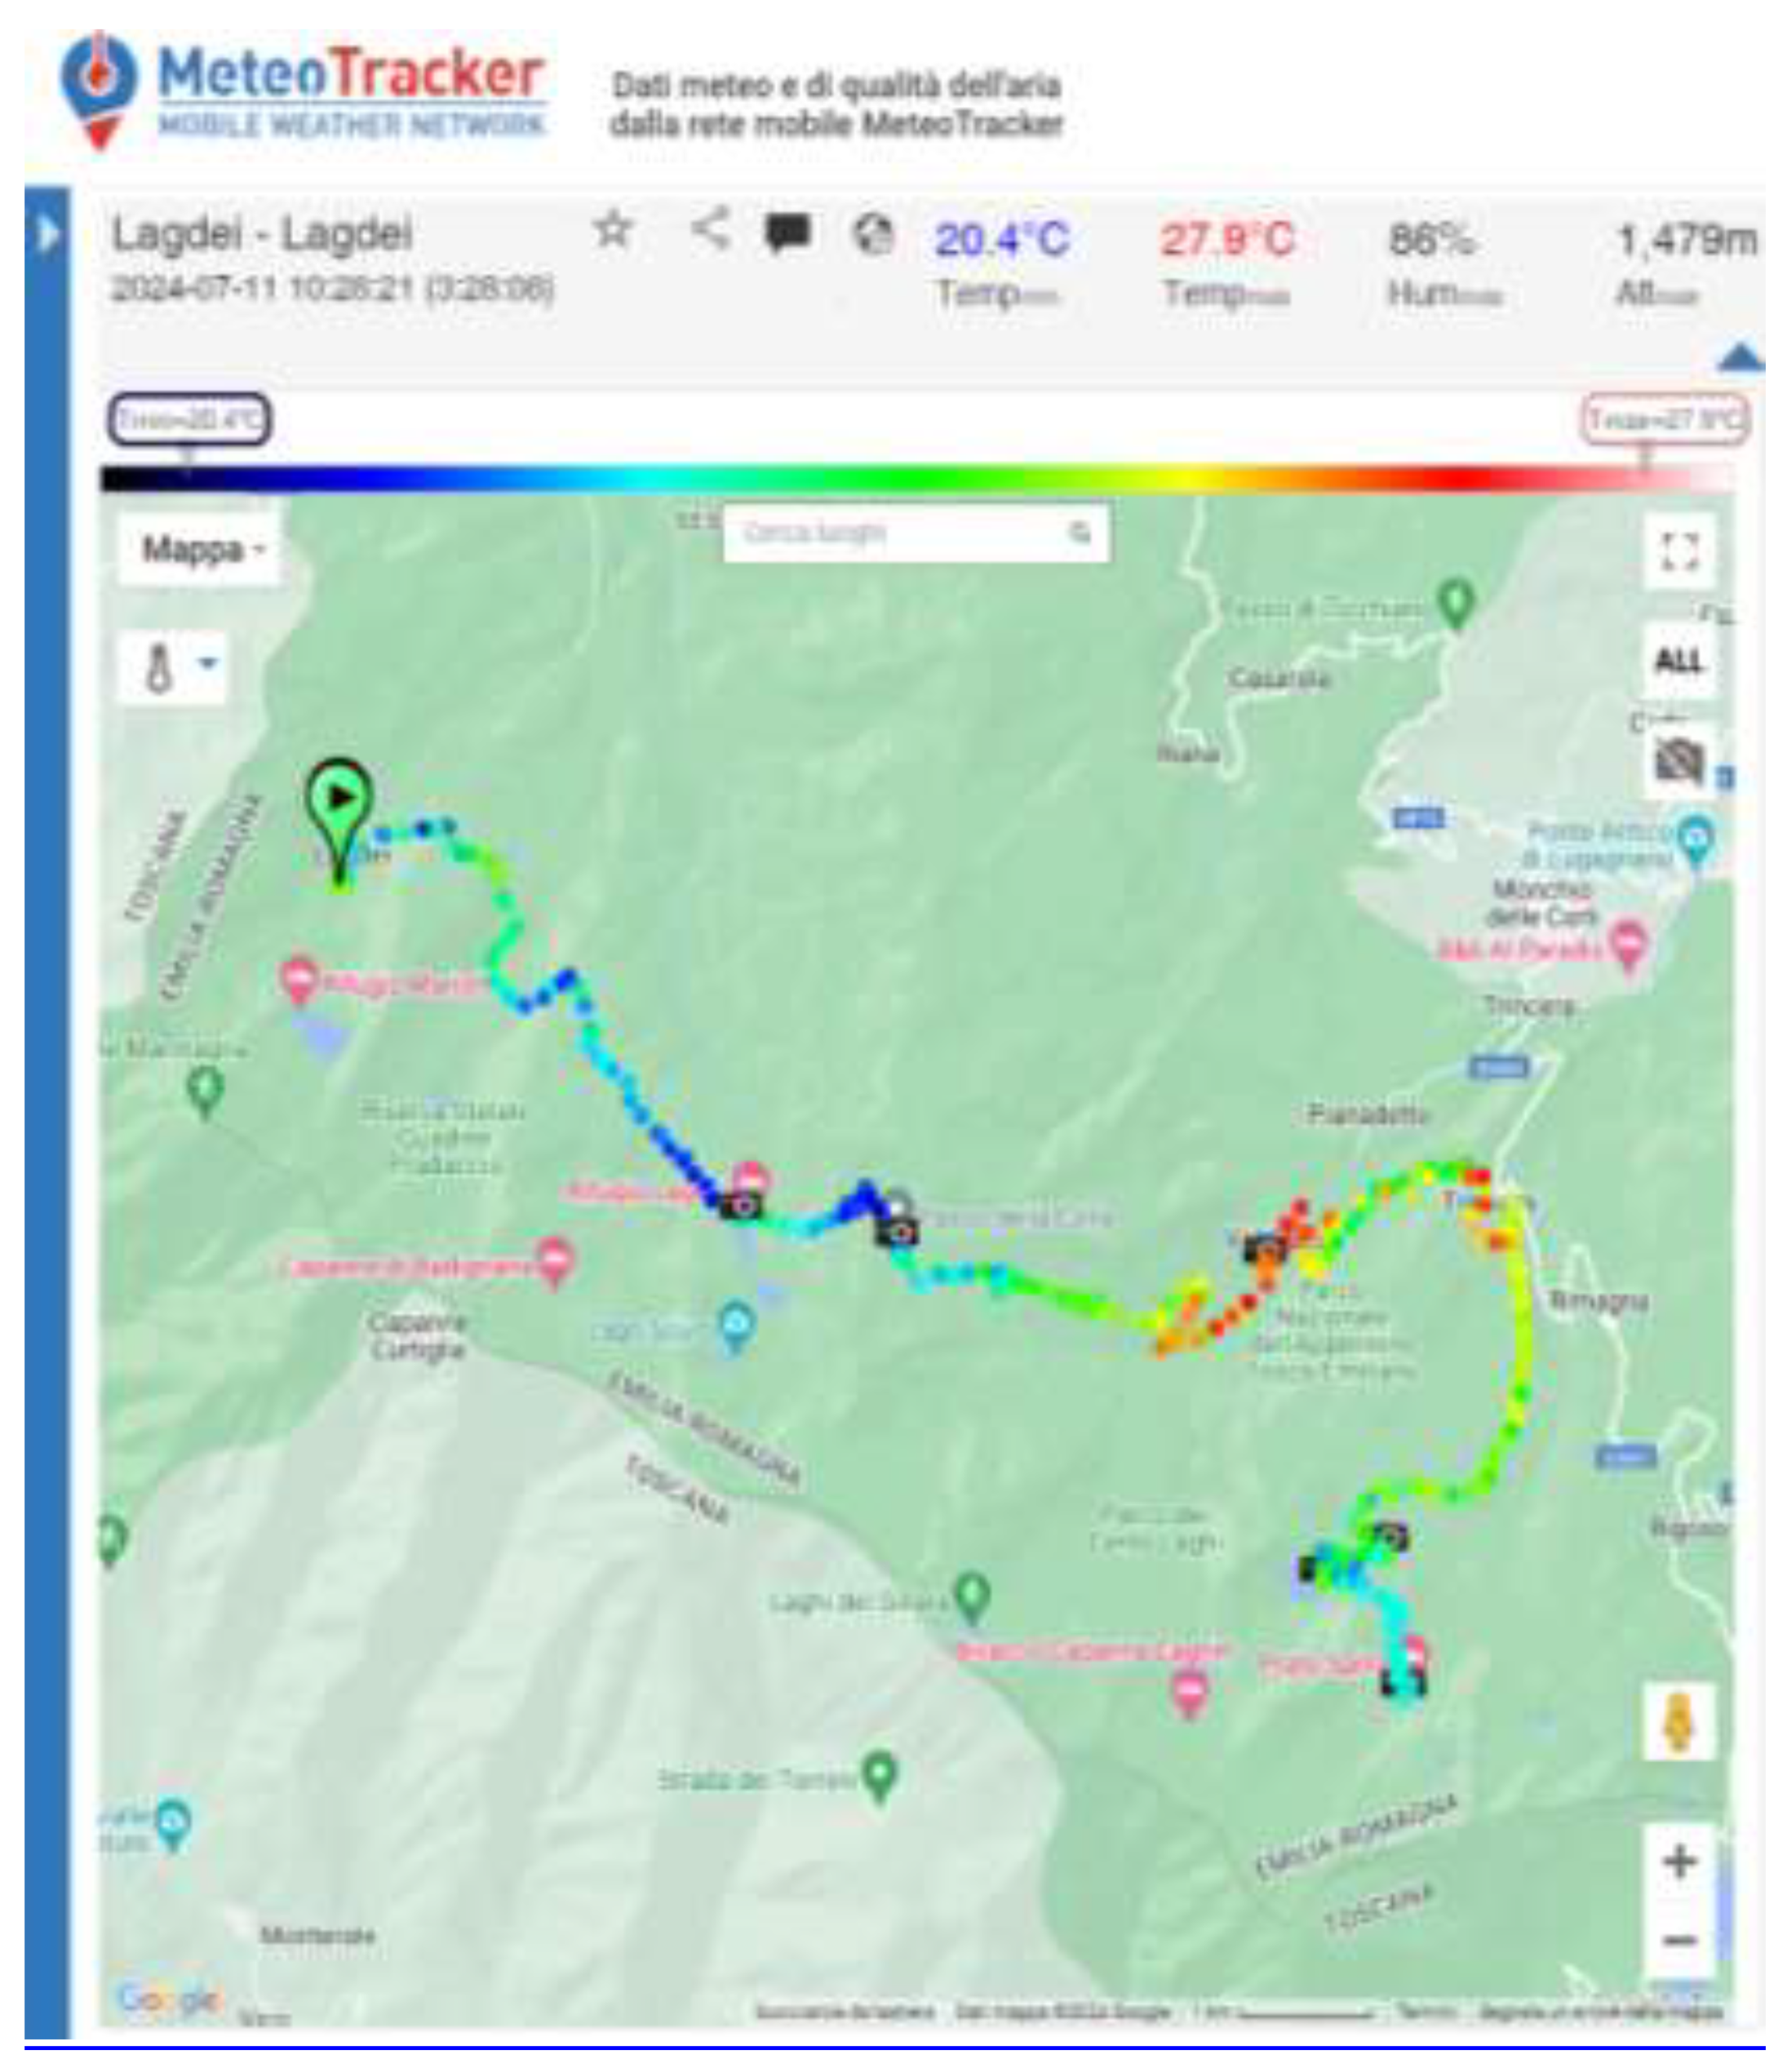
Figure 8.
(a) Graph of temperature trends (top); (b) respective altitudes (bottom). Source: Meteotracker [24].
Figure 8.
(a) Graph of temperature trends (top); (b) respective altitudes (bottom). Source: Meteotracker [24].
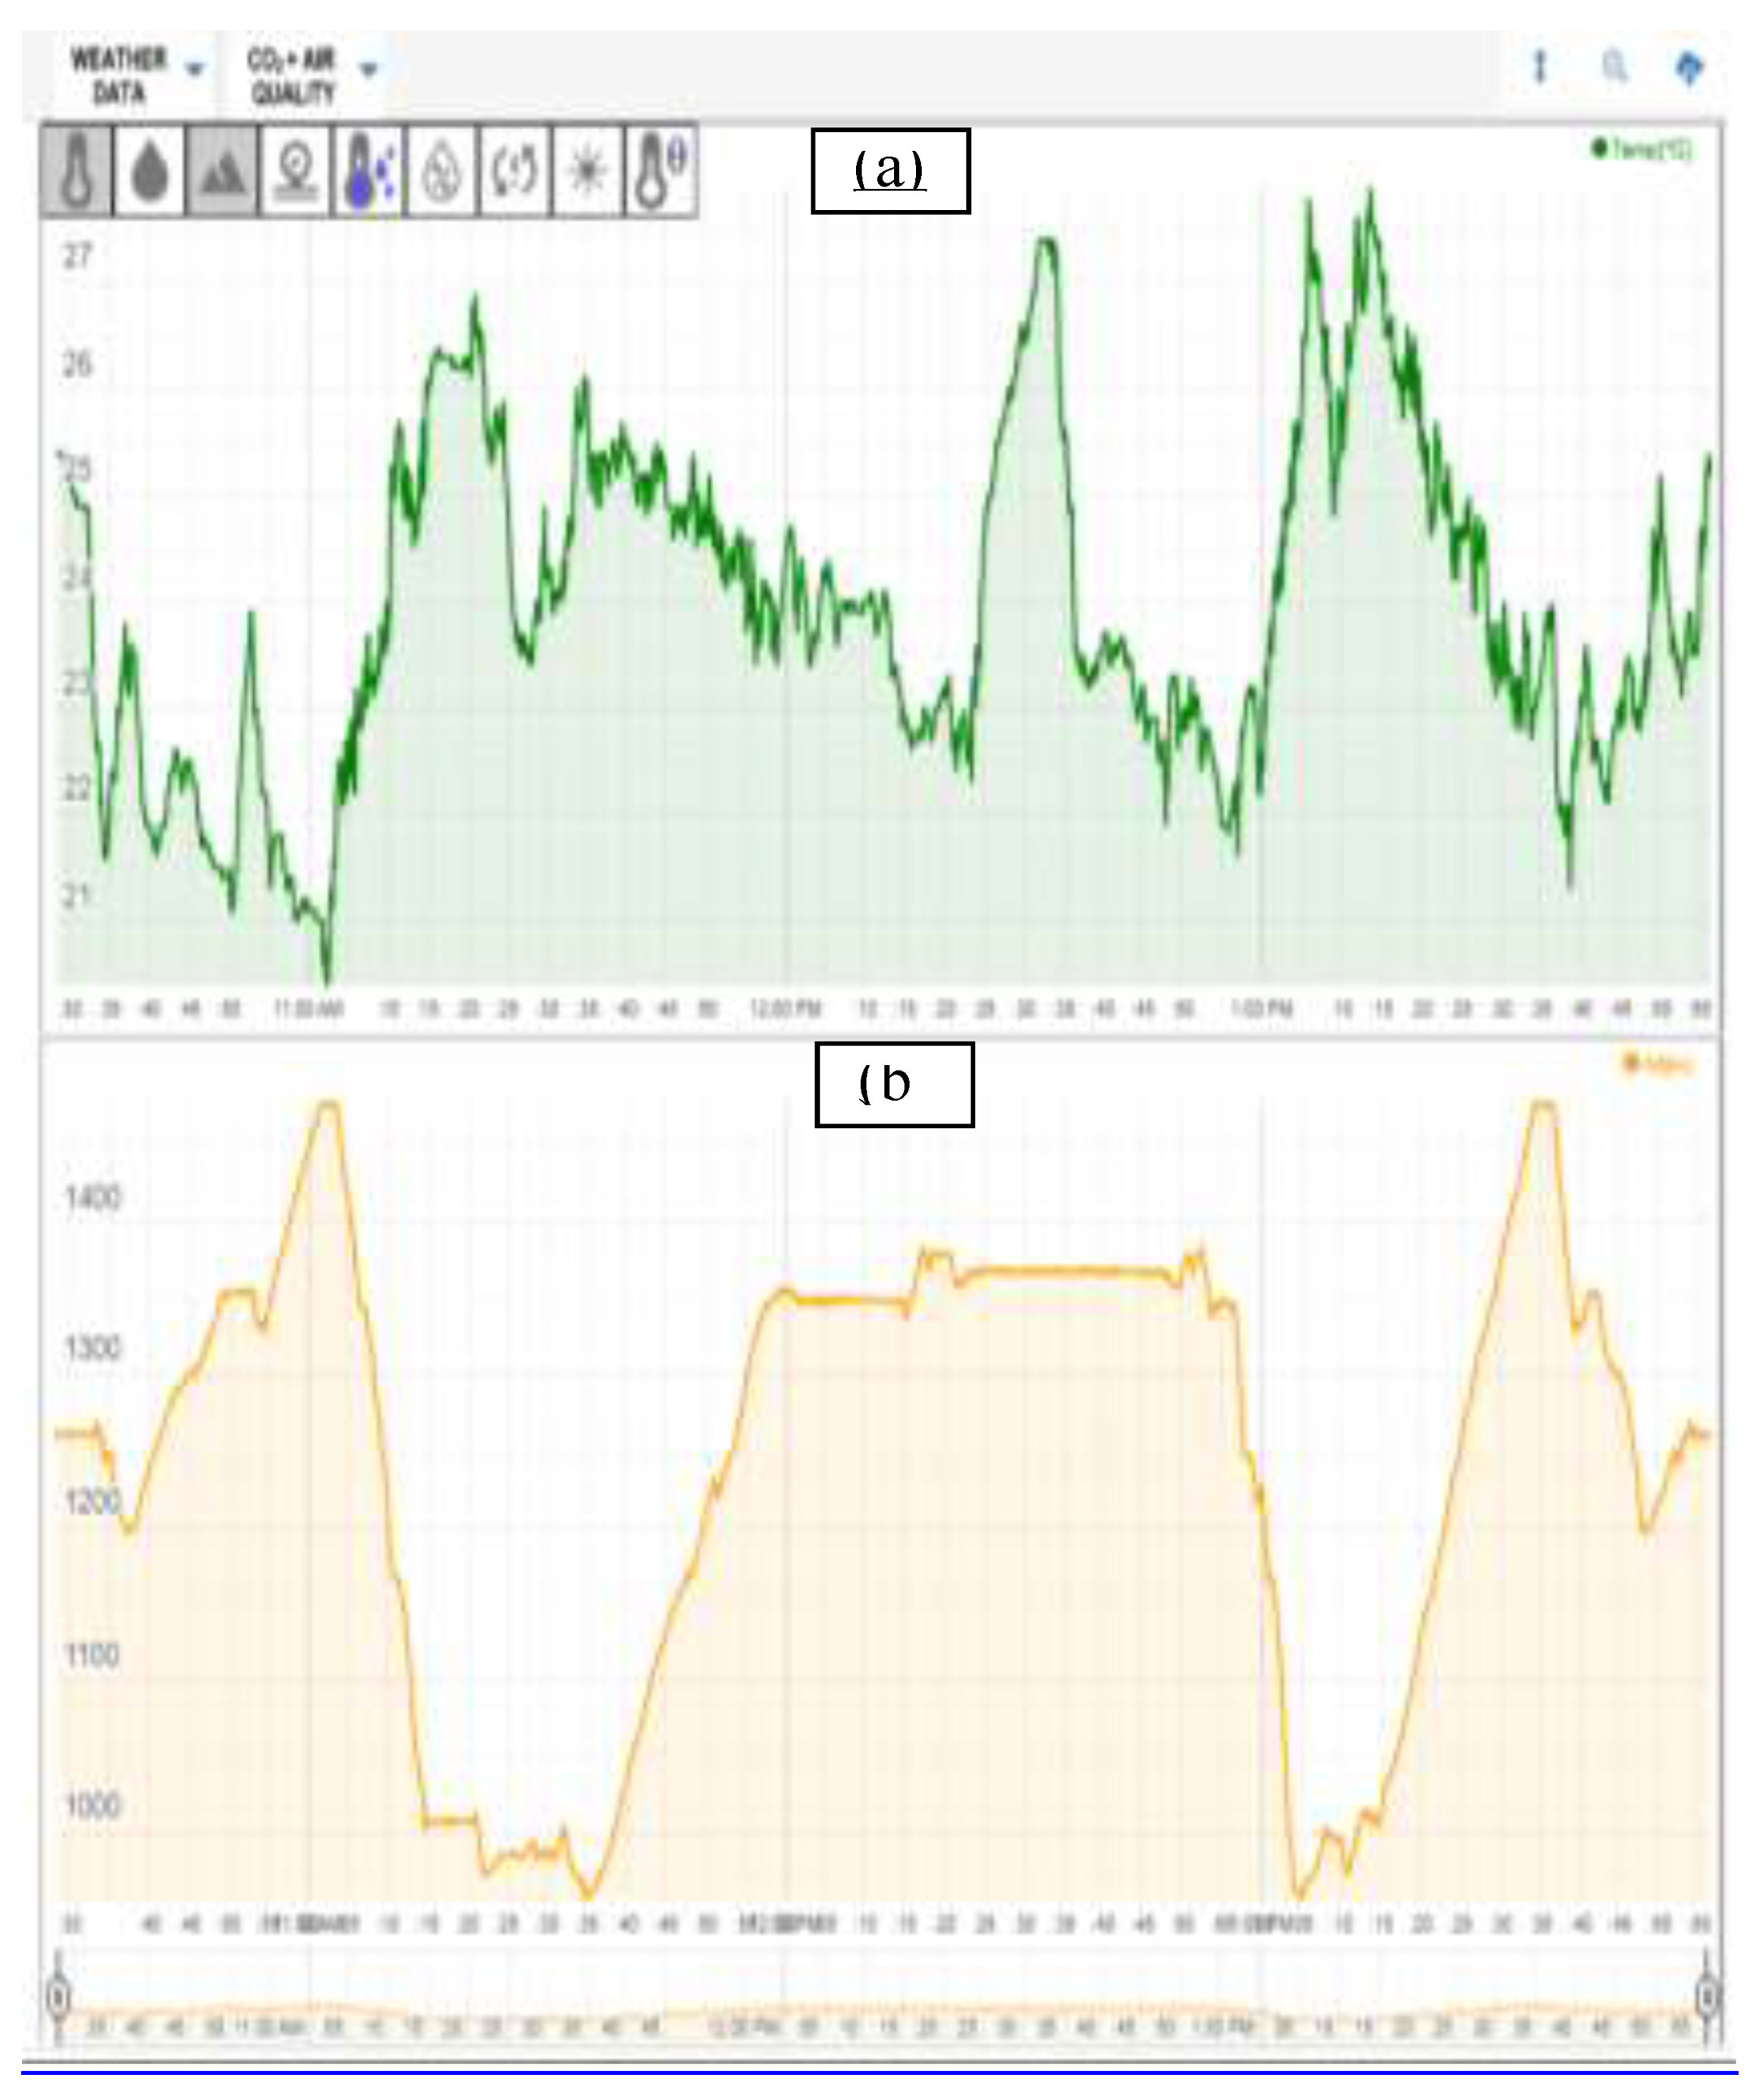
Figure 9.
Synop messages relating to the weather station at Parma airport LIMP. Source: Aeronautica Militare [25].
Figure 9.
Synop messages relating to the weather station at Parma airport LIMP. Source: Aeronautica Militare [25].
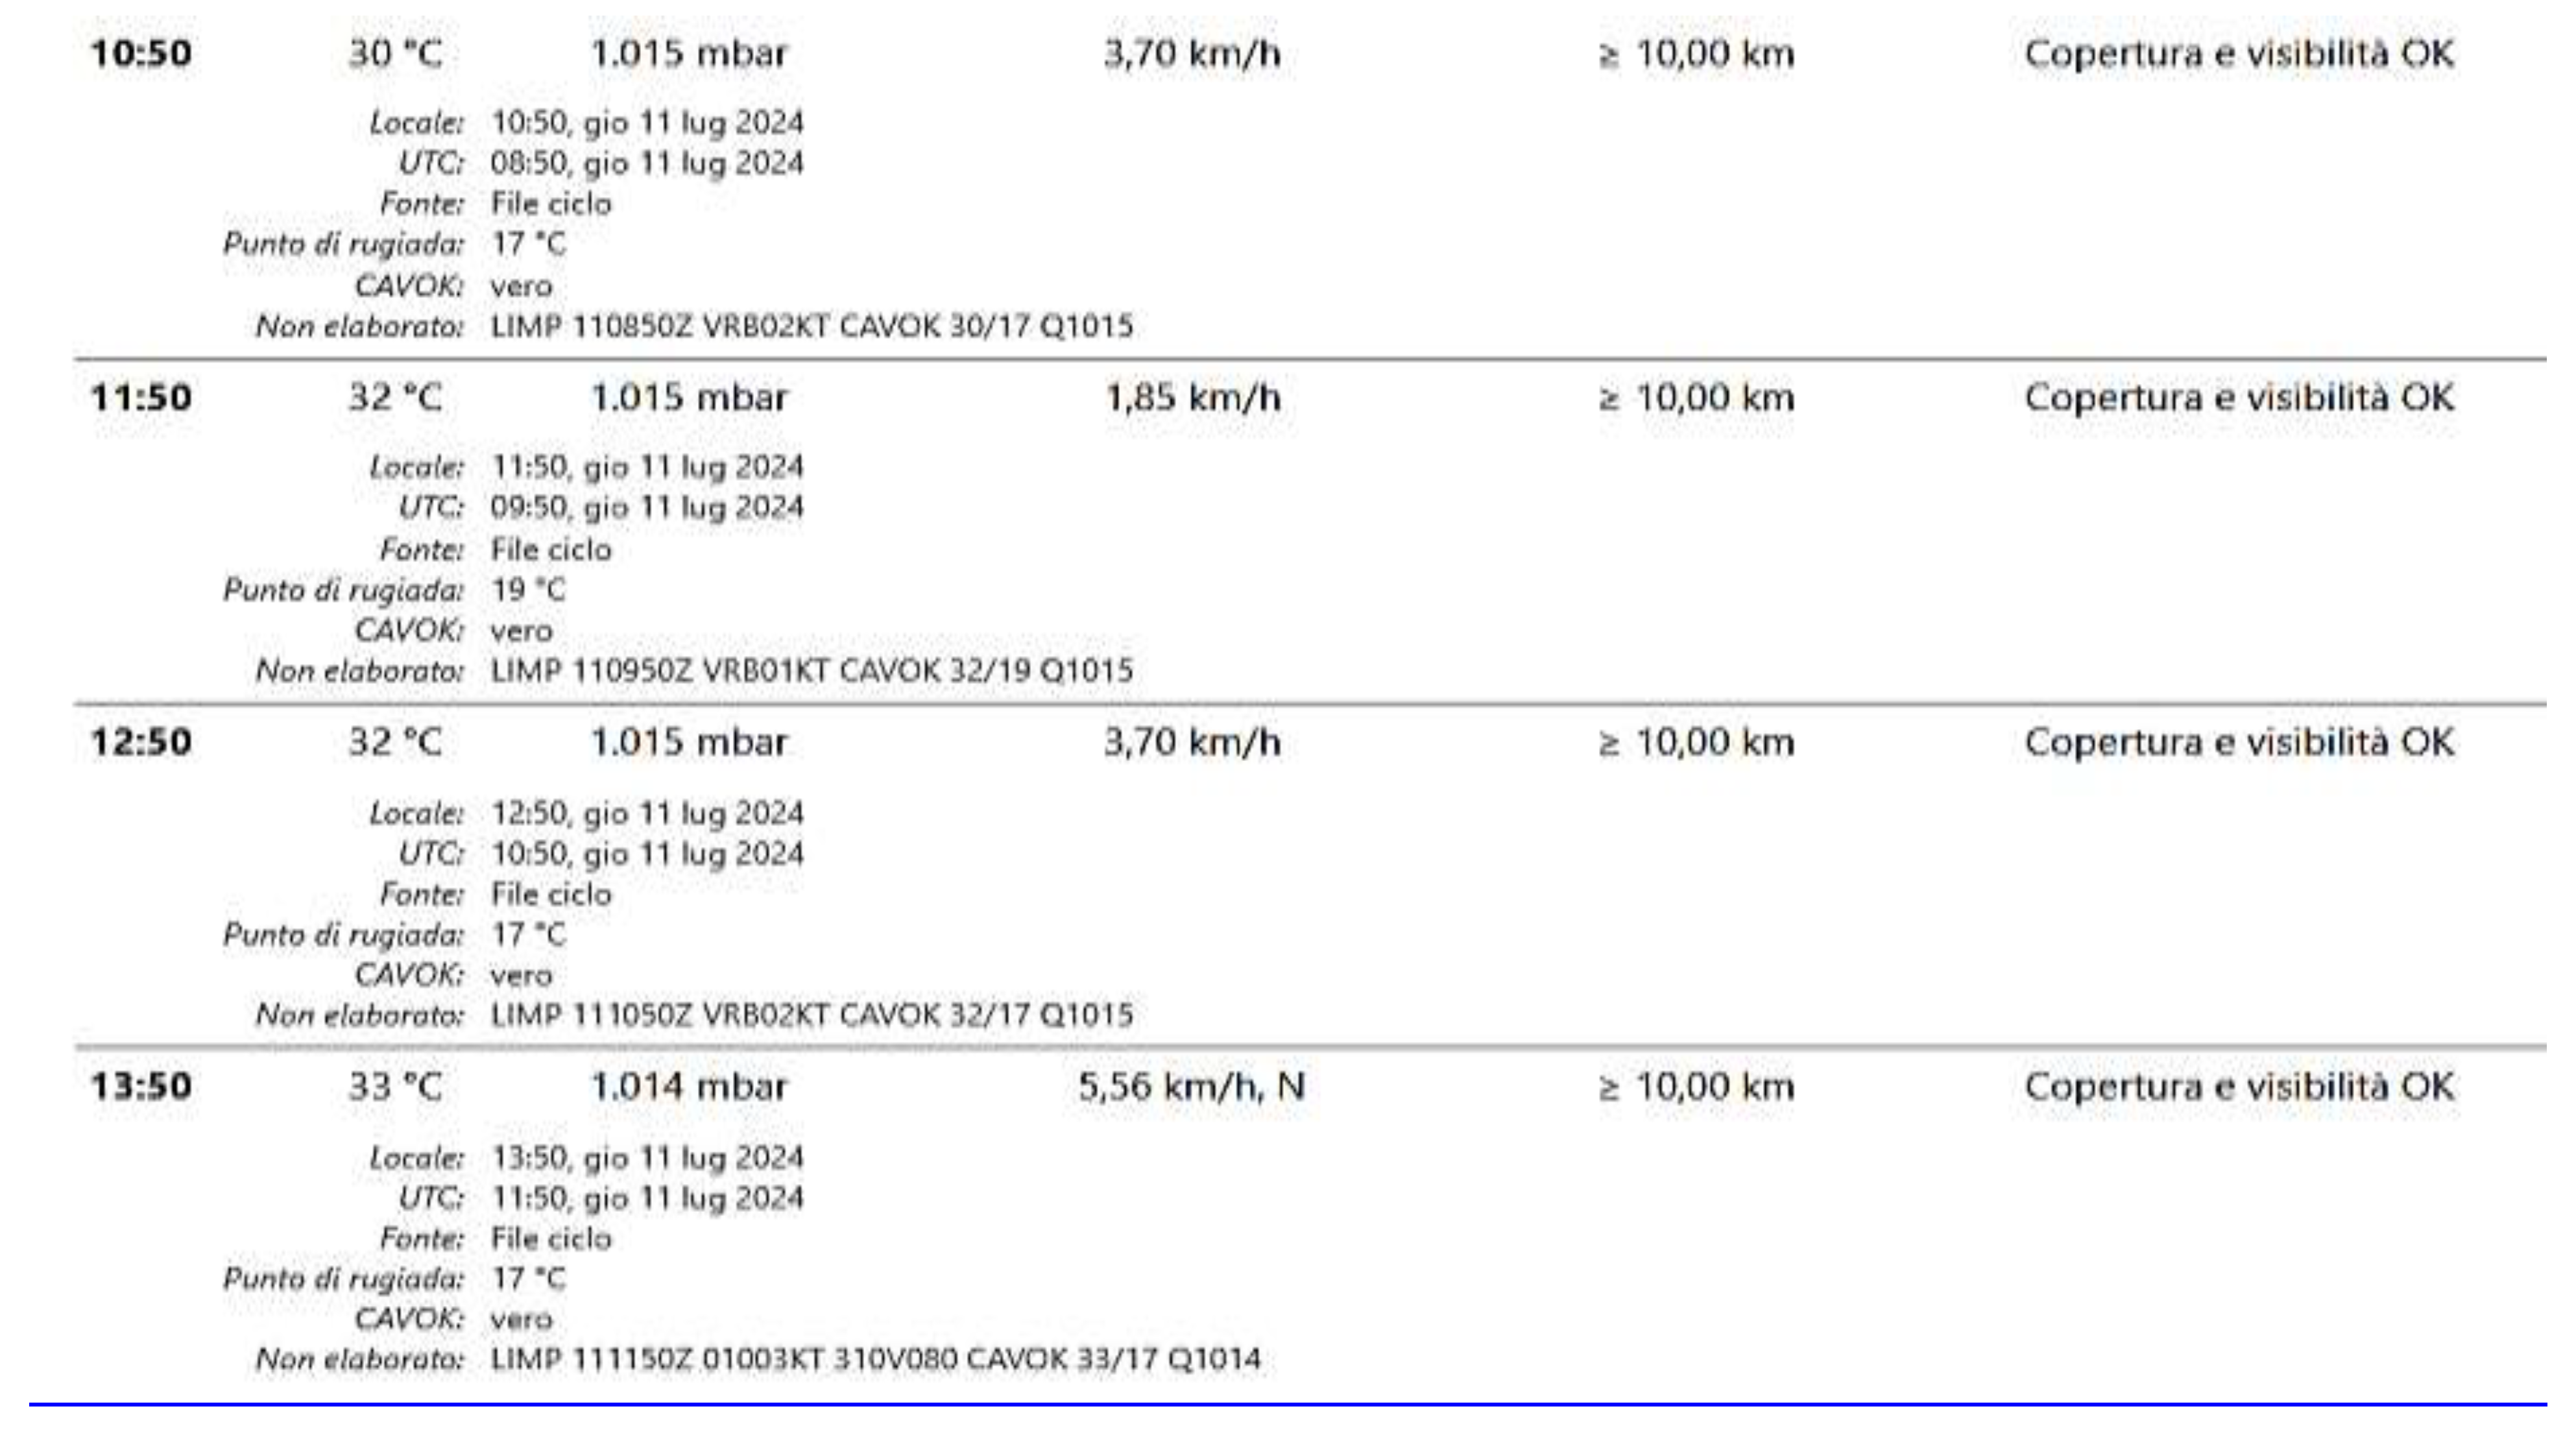
Figure 10.
Air temperature (green broken) and dew temperature (blue broken) values during mobile measurements on 11 July 2024. Source: Meteotracker [24].
Figure 10.
Air temperature (green broken) and dew temperature (blue broken) values during mobile measurements on 11 July 2024. Source: Meteotracker [24].
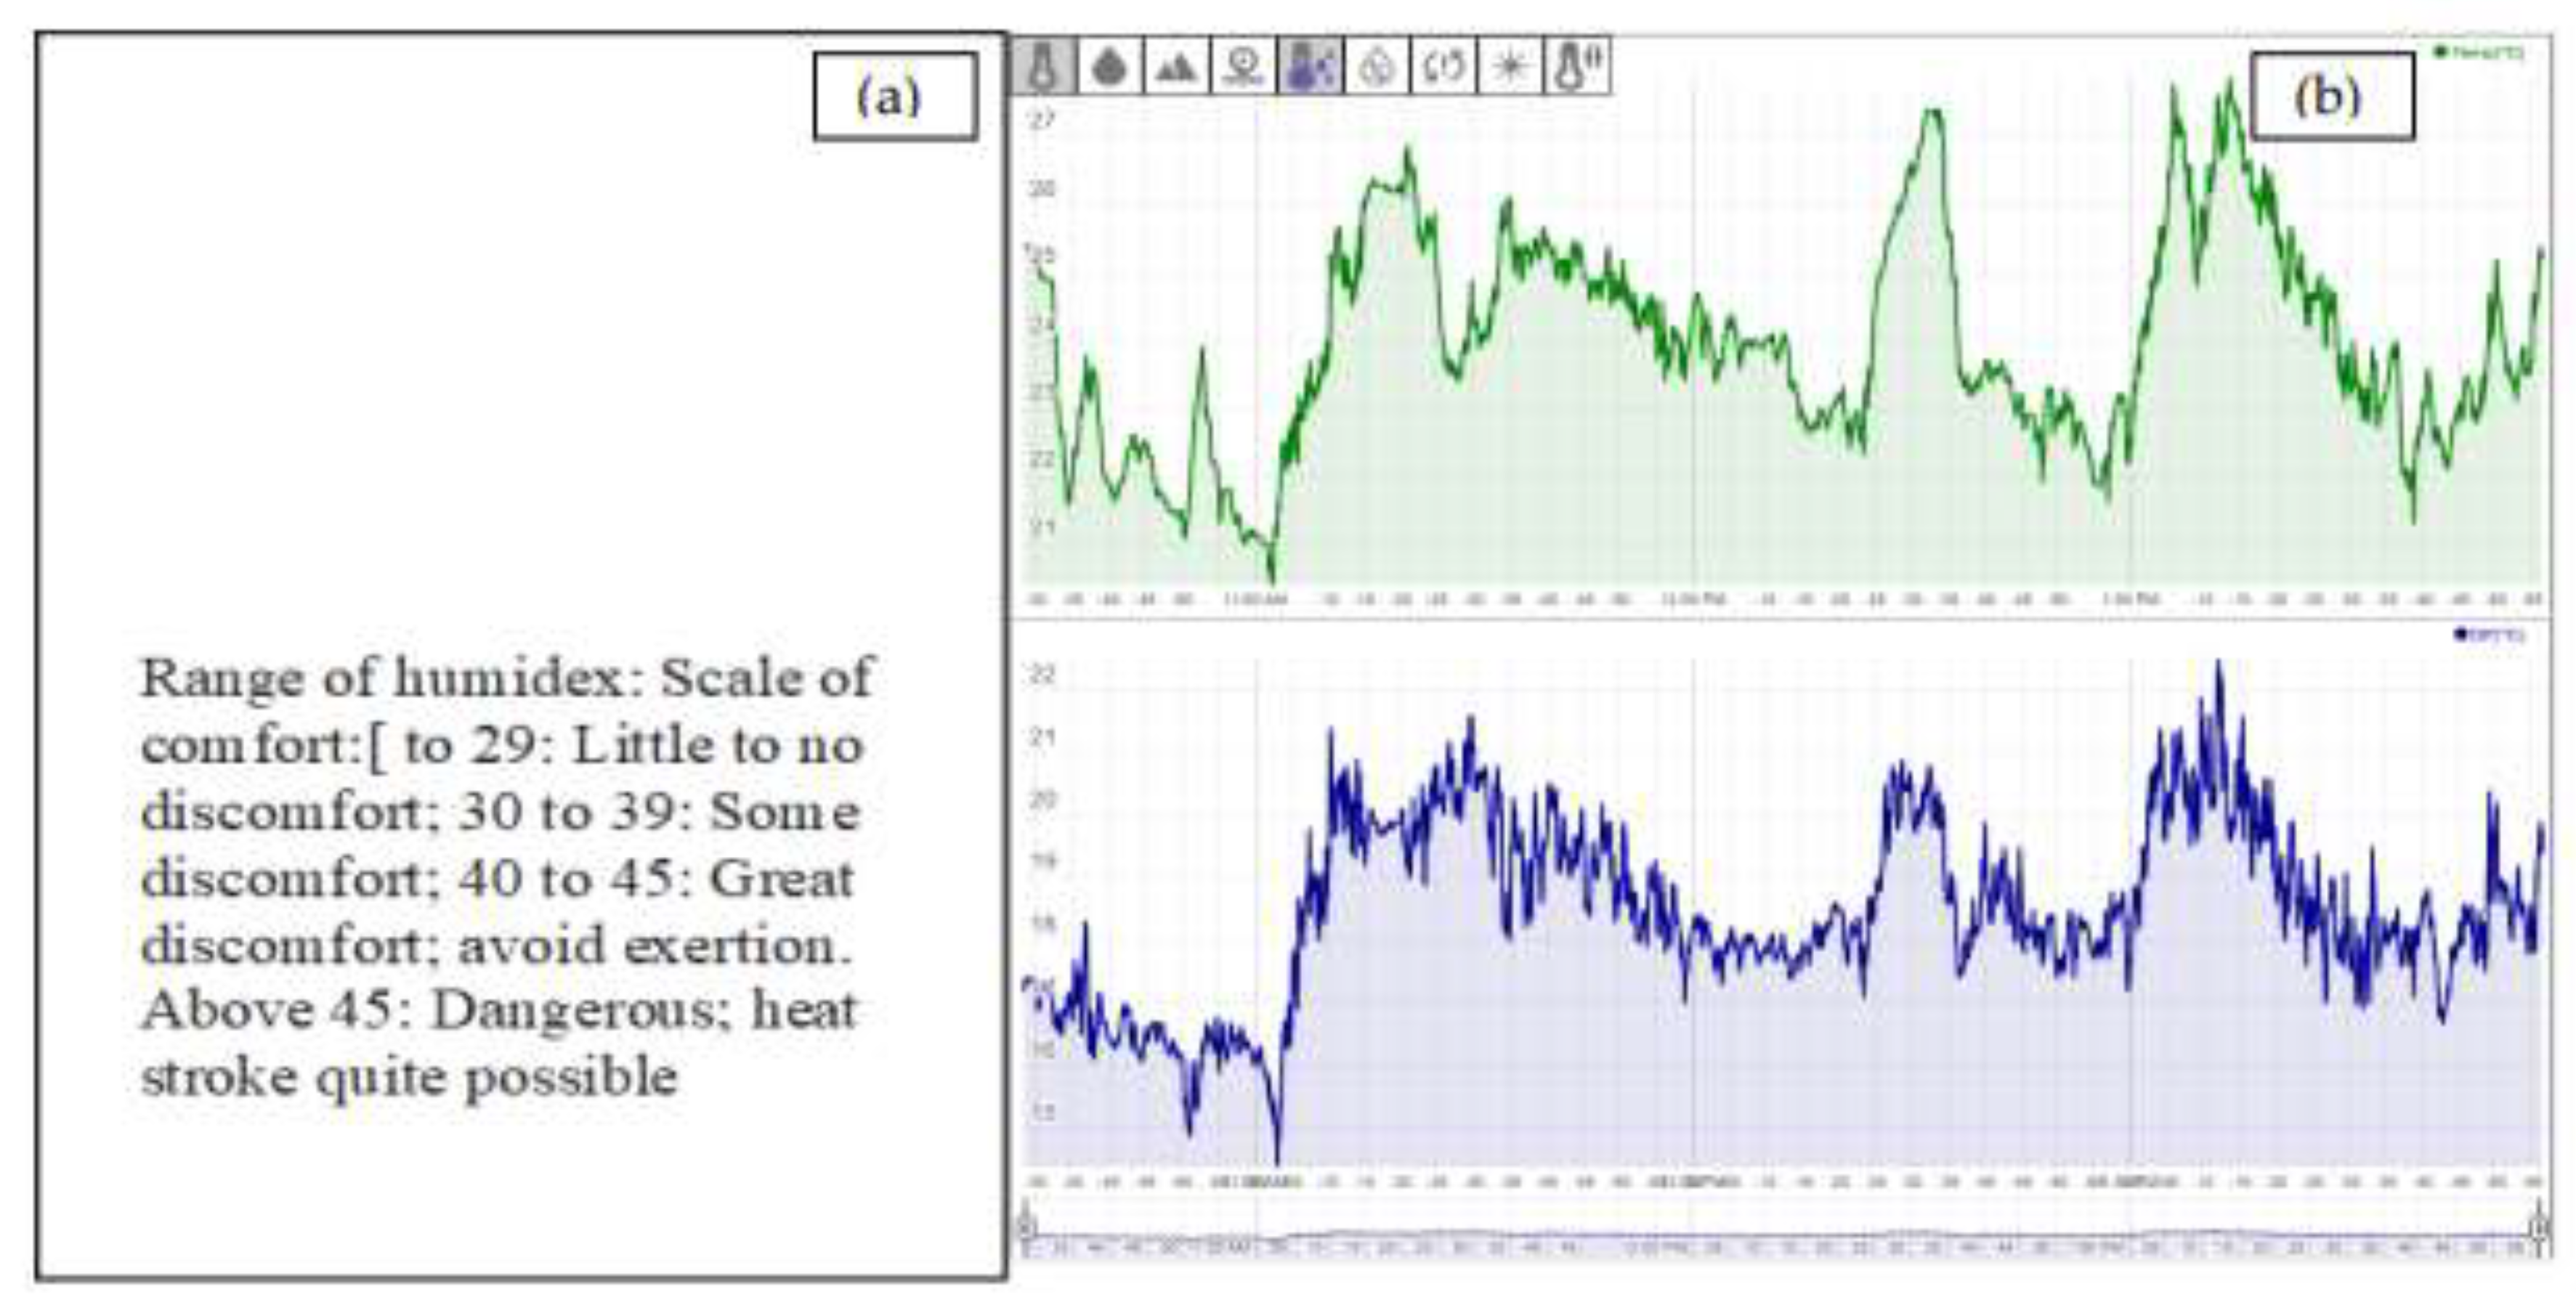
Figure 11.
(a) HUMIDEX index values along the measurement path; (b) Temperature (top) and Humidex graphs (bottom). Source: Meteotracker [24].
Figure 11.
(a) HUMIDEX index values along the measurement path; (b) Temperature (top) and Humidex graphs (bottom). Source: Meteotracker [24].
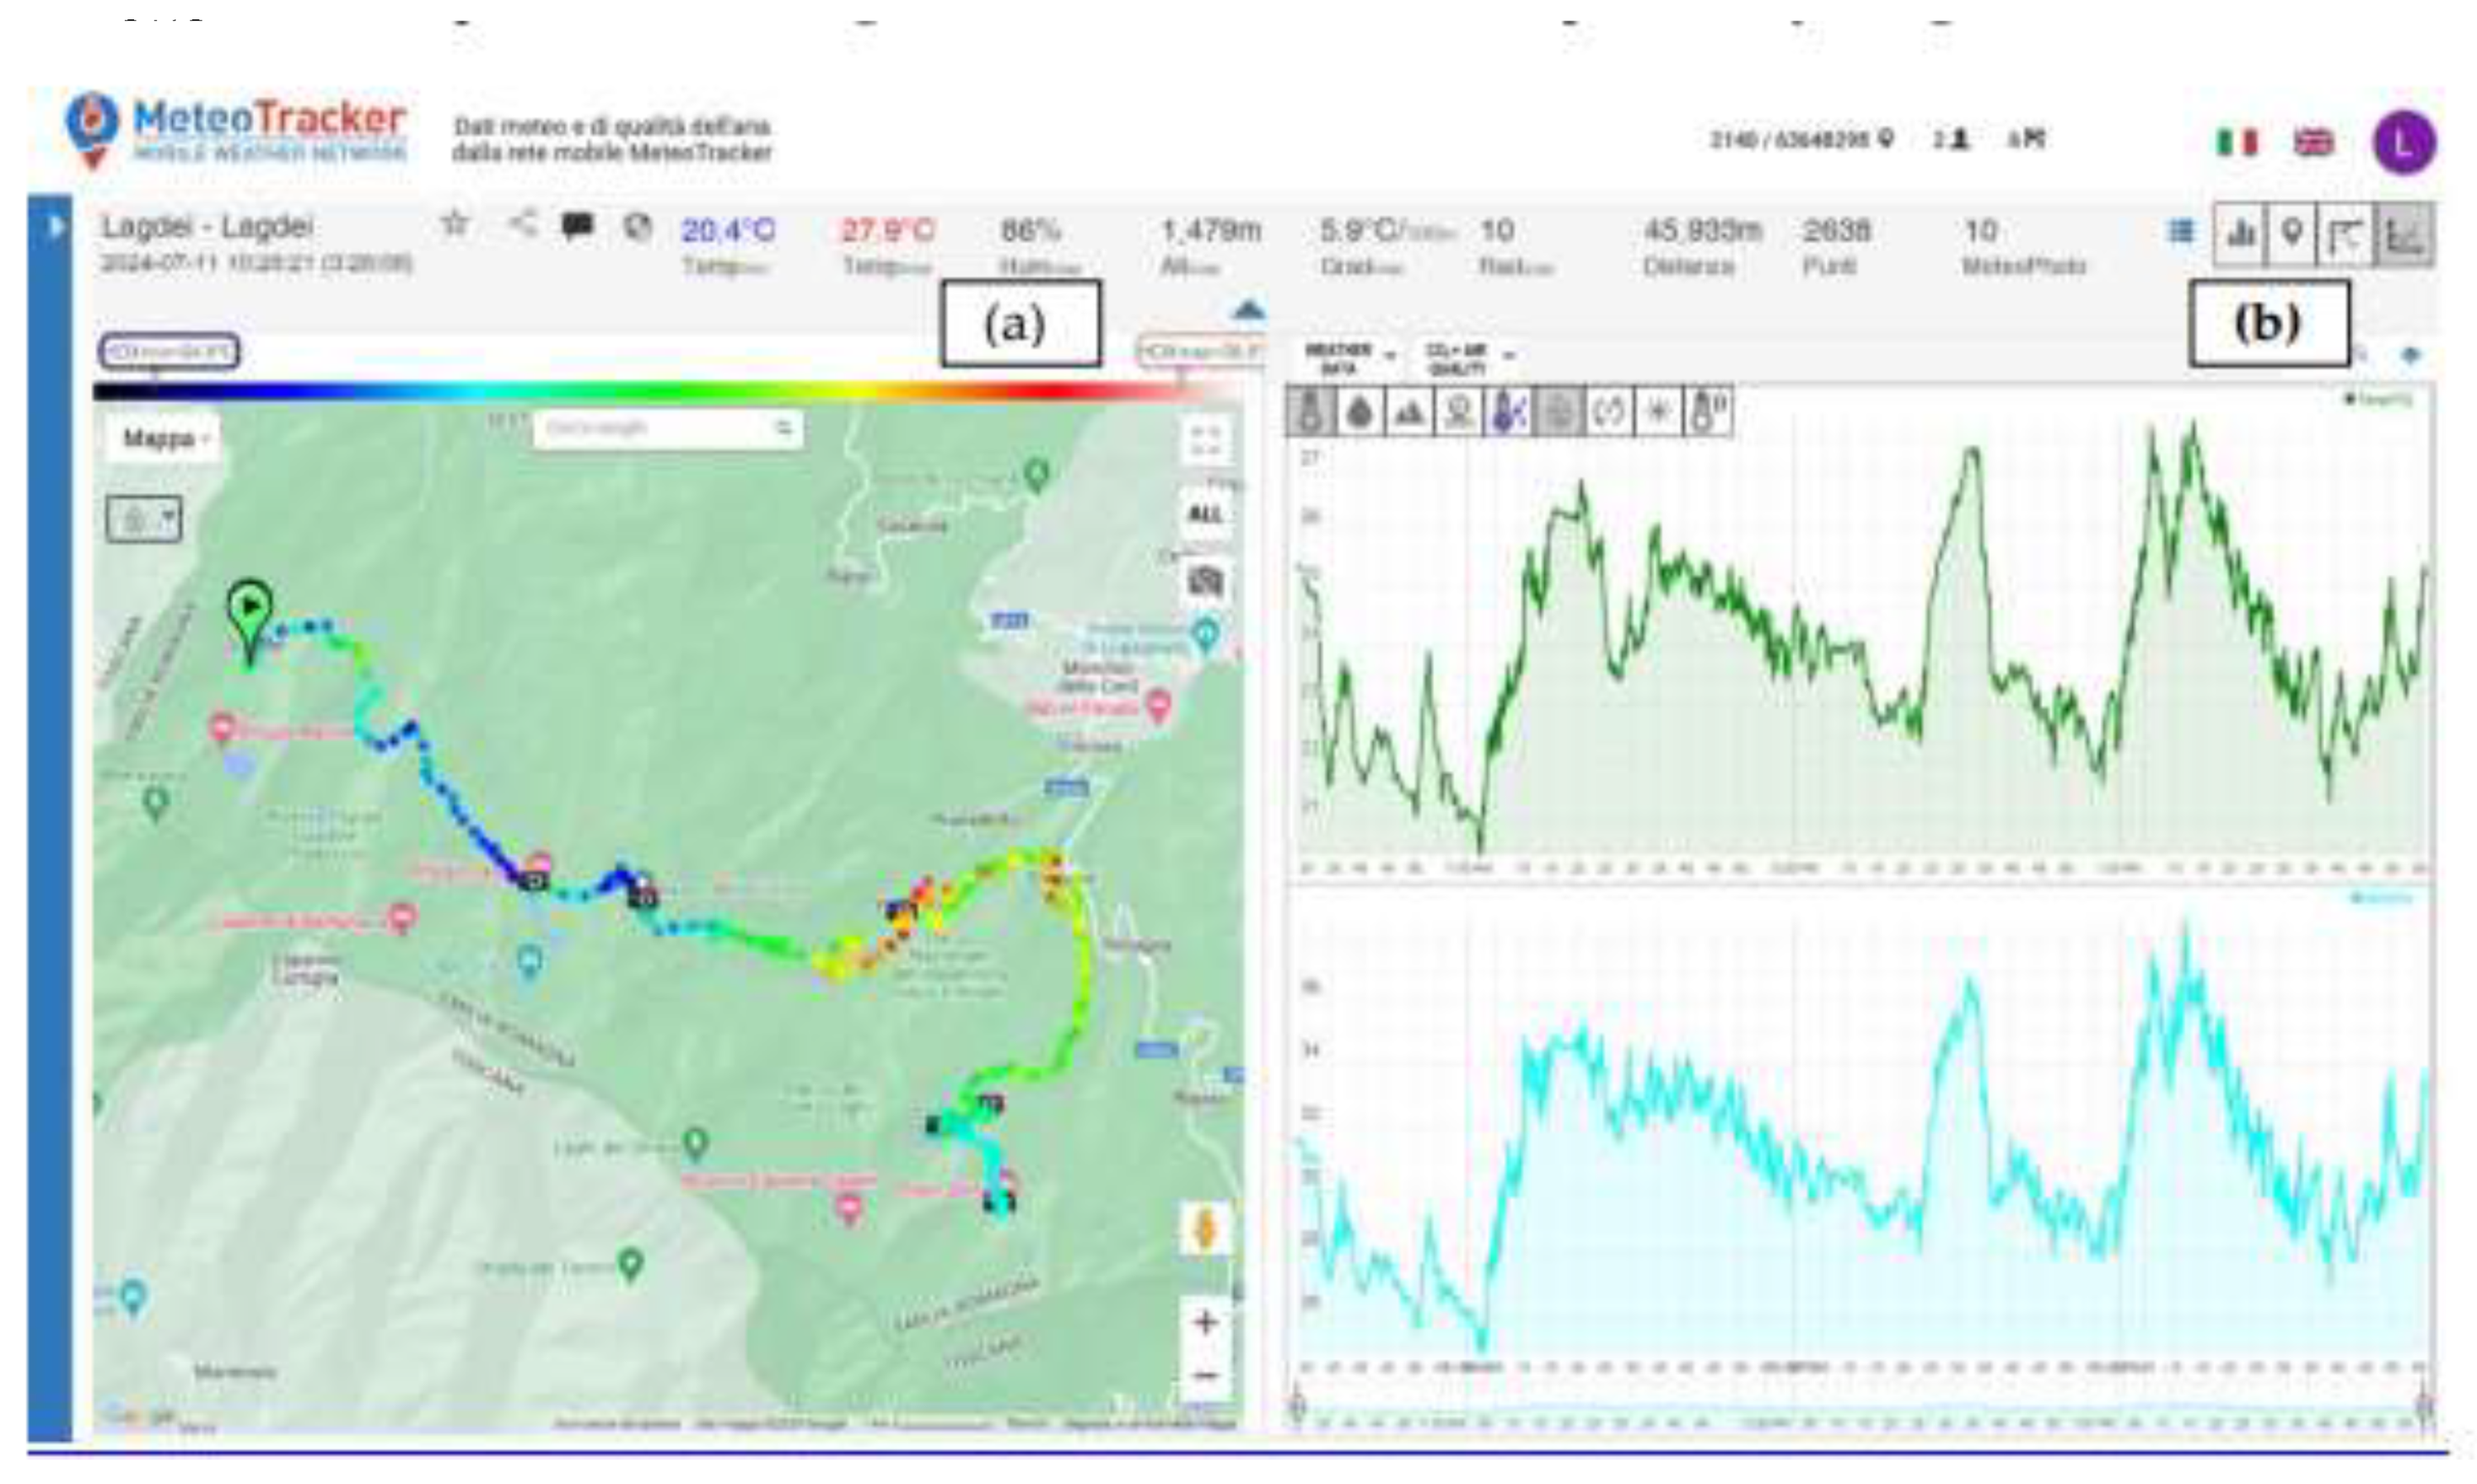
Figure 12.
(a) PM10 values along the measurement path; (b) Temperature (top) and PM10 (bottom) graphs. Source: Meteotracker [24].
Figure 12.
(a) PM10 values along the measurement path; (b) Temperature (top) and PM10 (bottom) graphs. Source: Meteotracker [24].
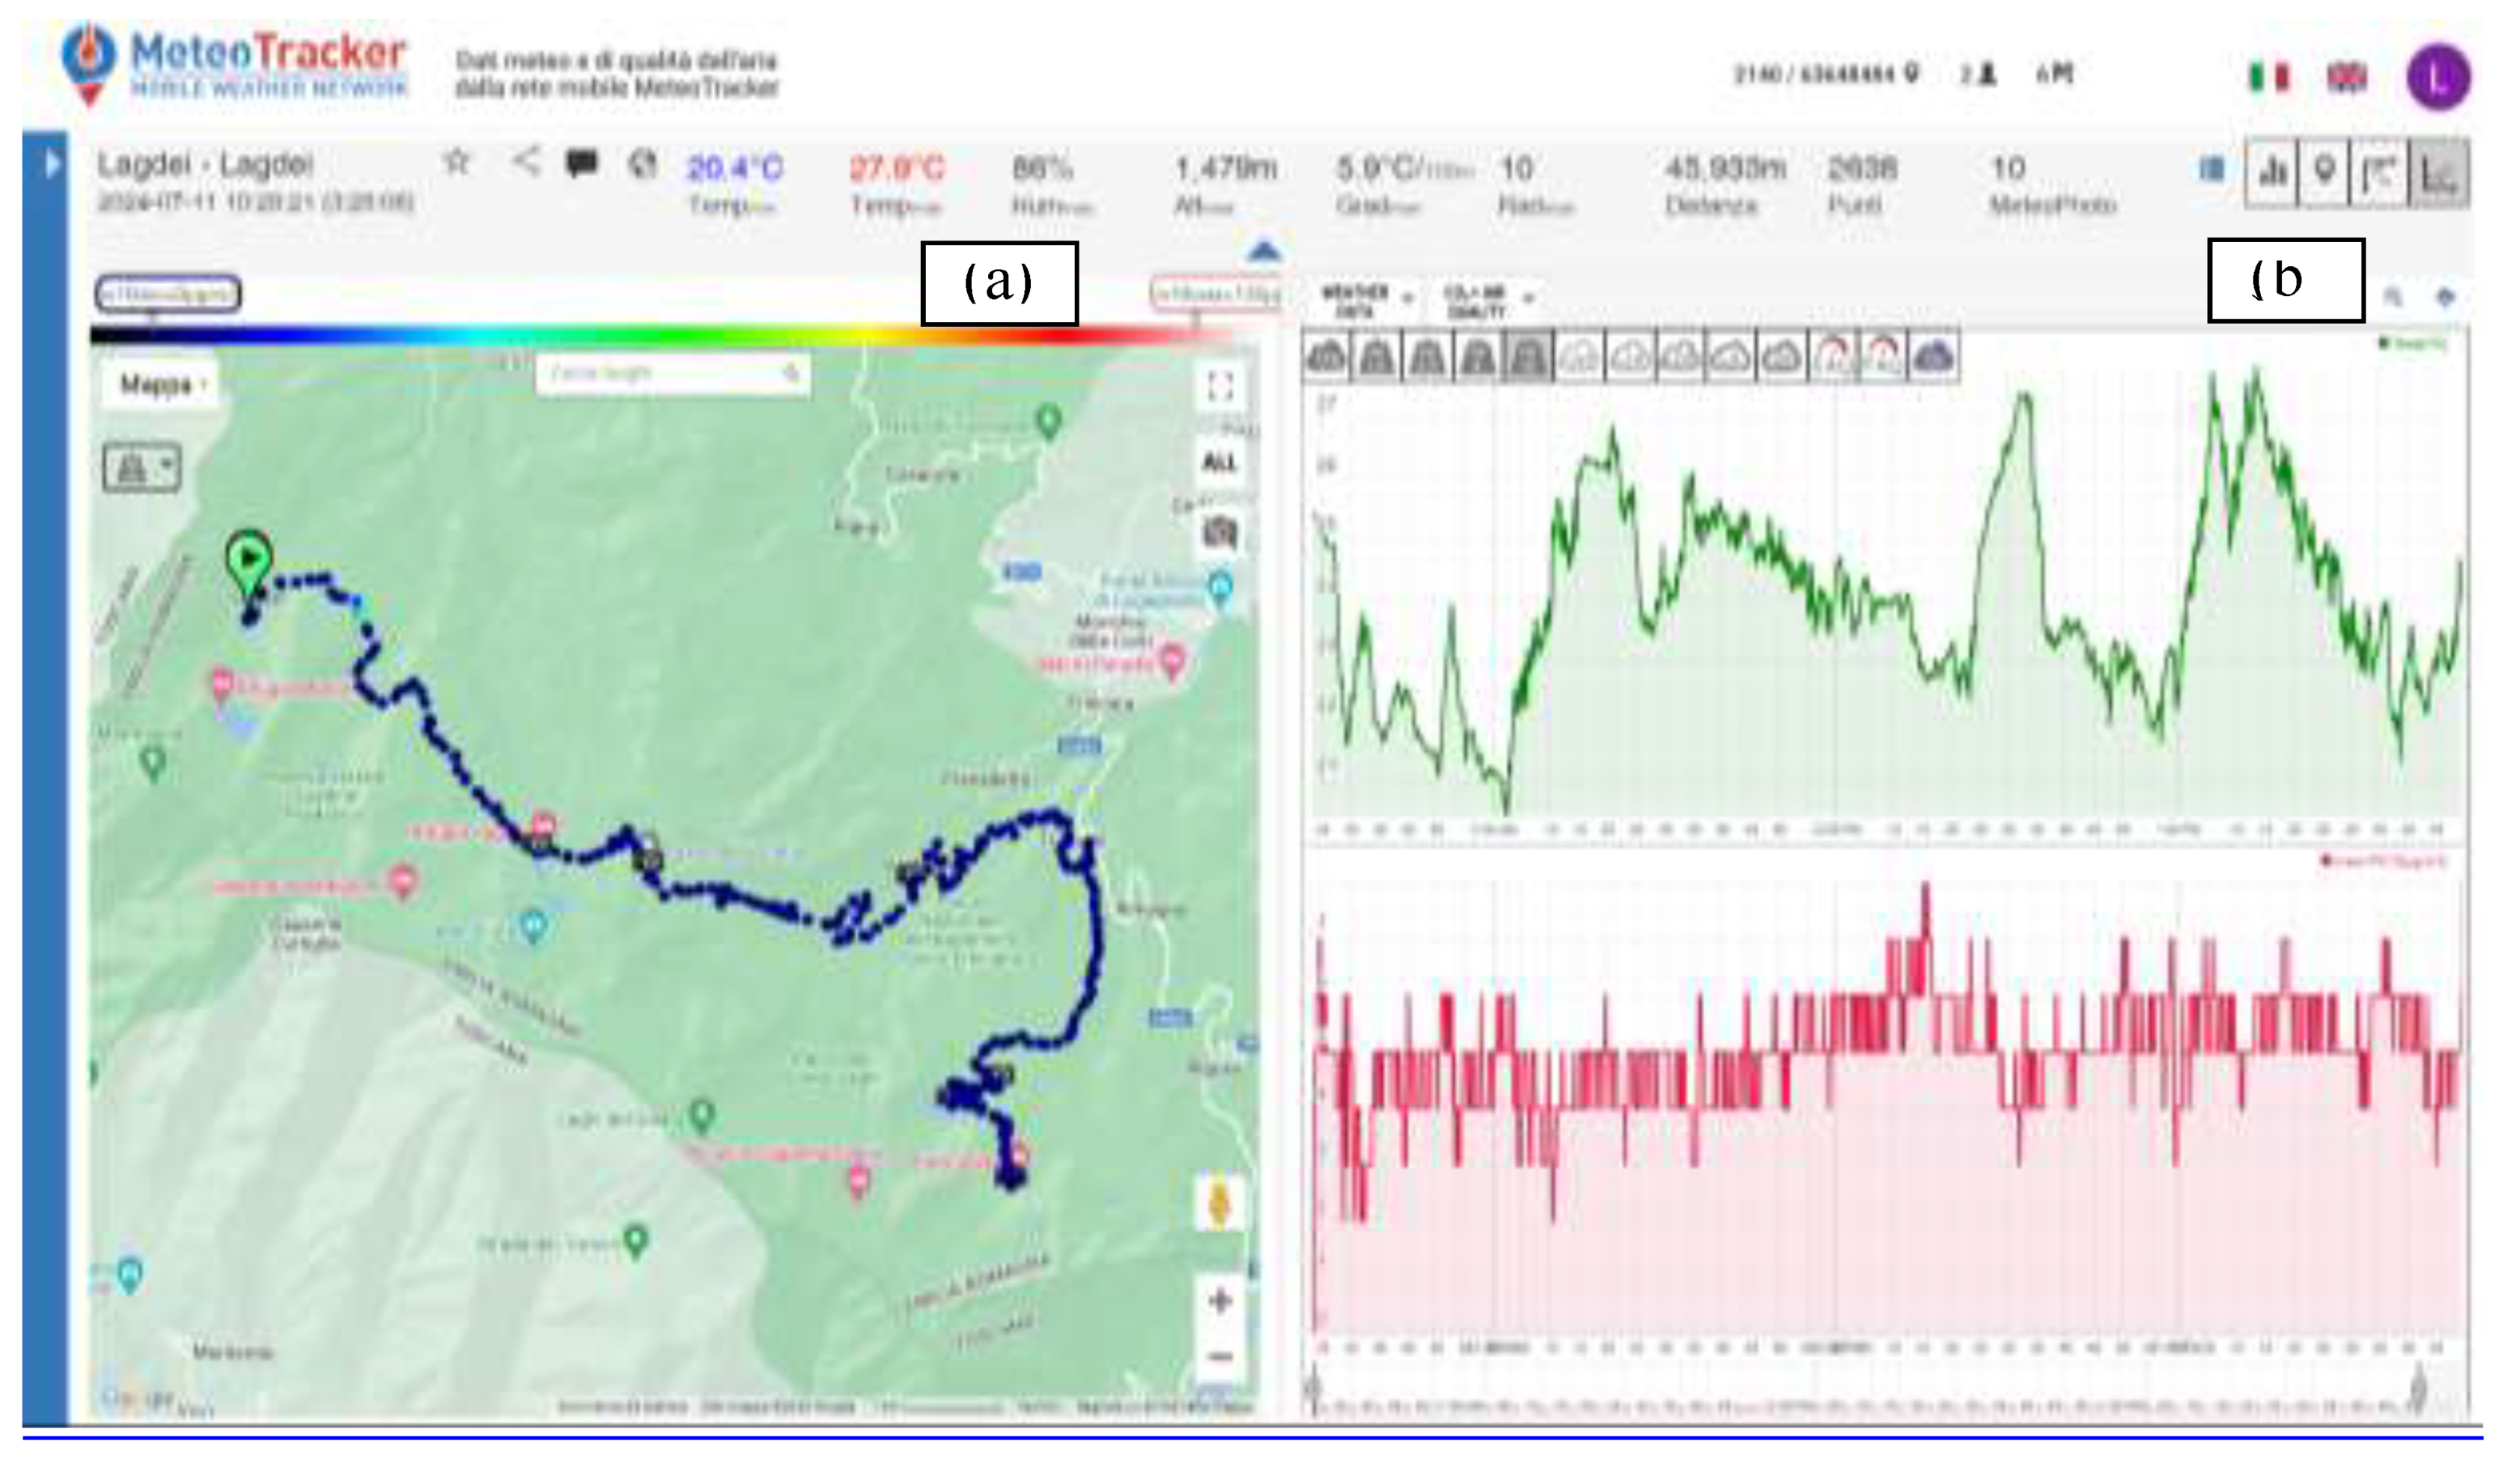
Figure 13.
(a) Ozone values along the measurement path; (b) Temperature (top) and Ozone (bottom) graphs. Source: Meteotracker [24].
Figure 13.
(a) Ozone values along the measurement path; (b) Temperature (top) and Ozone (bottom) graphs. Source: Meteotracker [24].
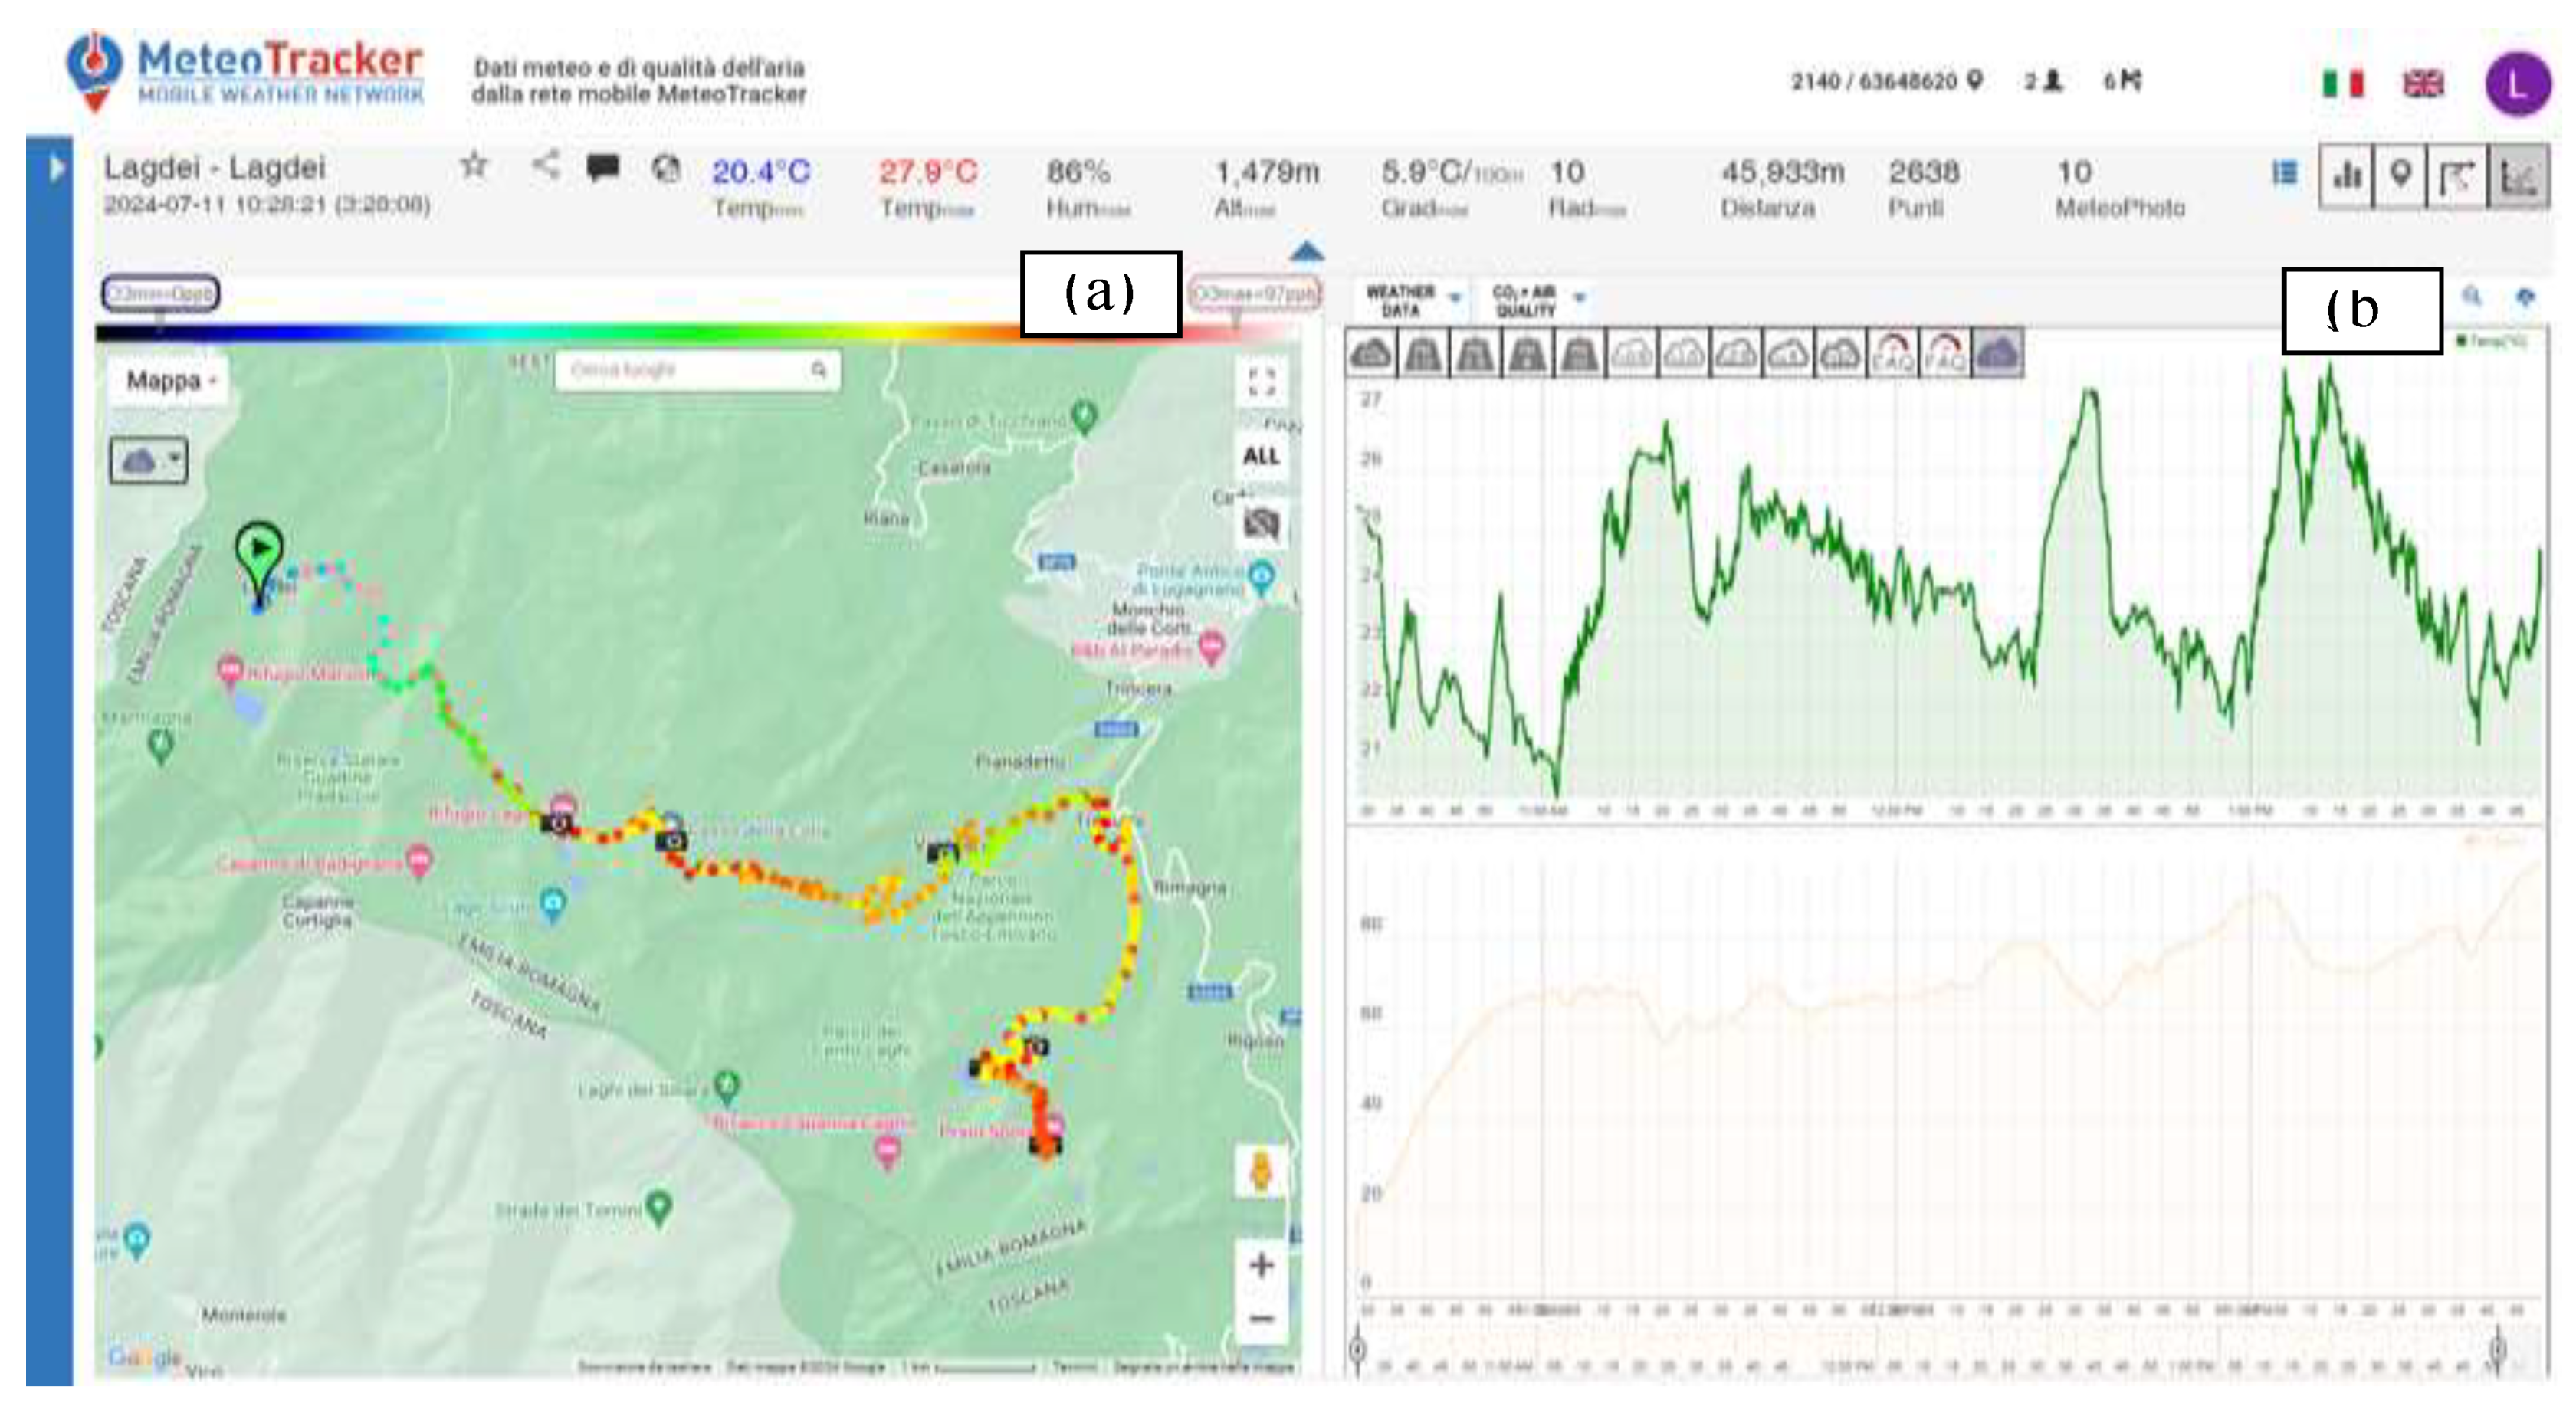
Figure 14.
(a) EPA Air Quality values along the measurement path; (b) Temperature (top) and EPA Air Quality (bottom) graphs. Source: Meteotracker [24].
Figure 14.
(a) EPA Air Quality values along the measurement path; (b) Temperature (top) and EPA Air Quality (bottom) graphs. Source: Meteotracker [24].
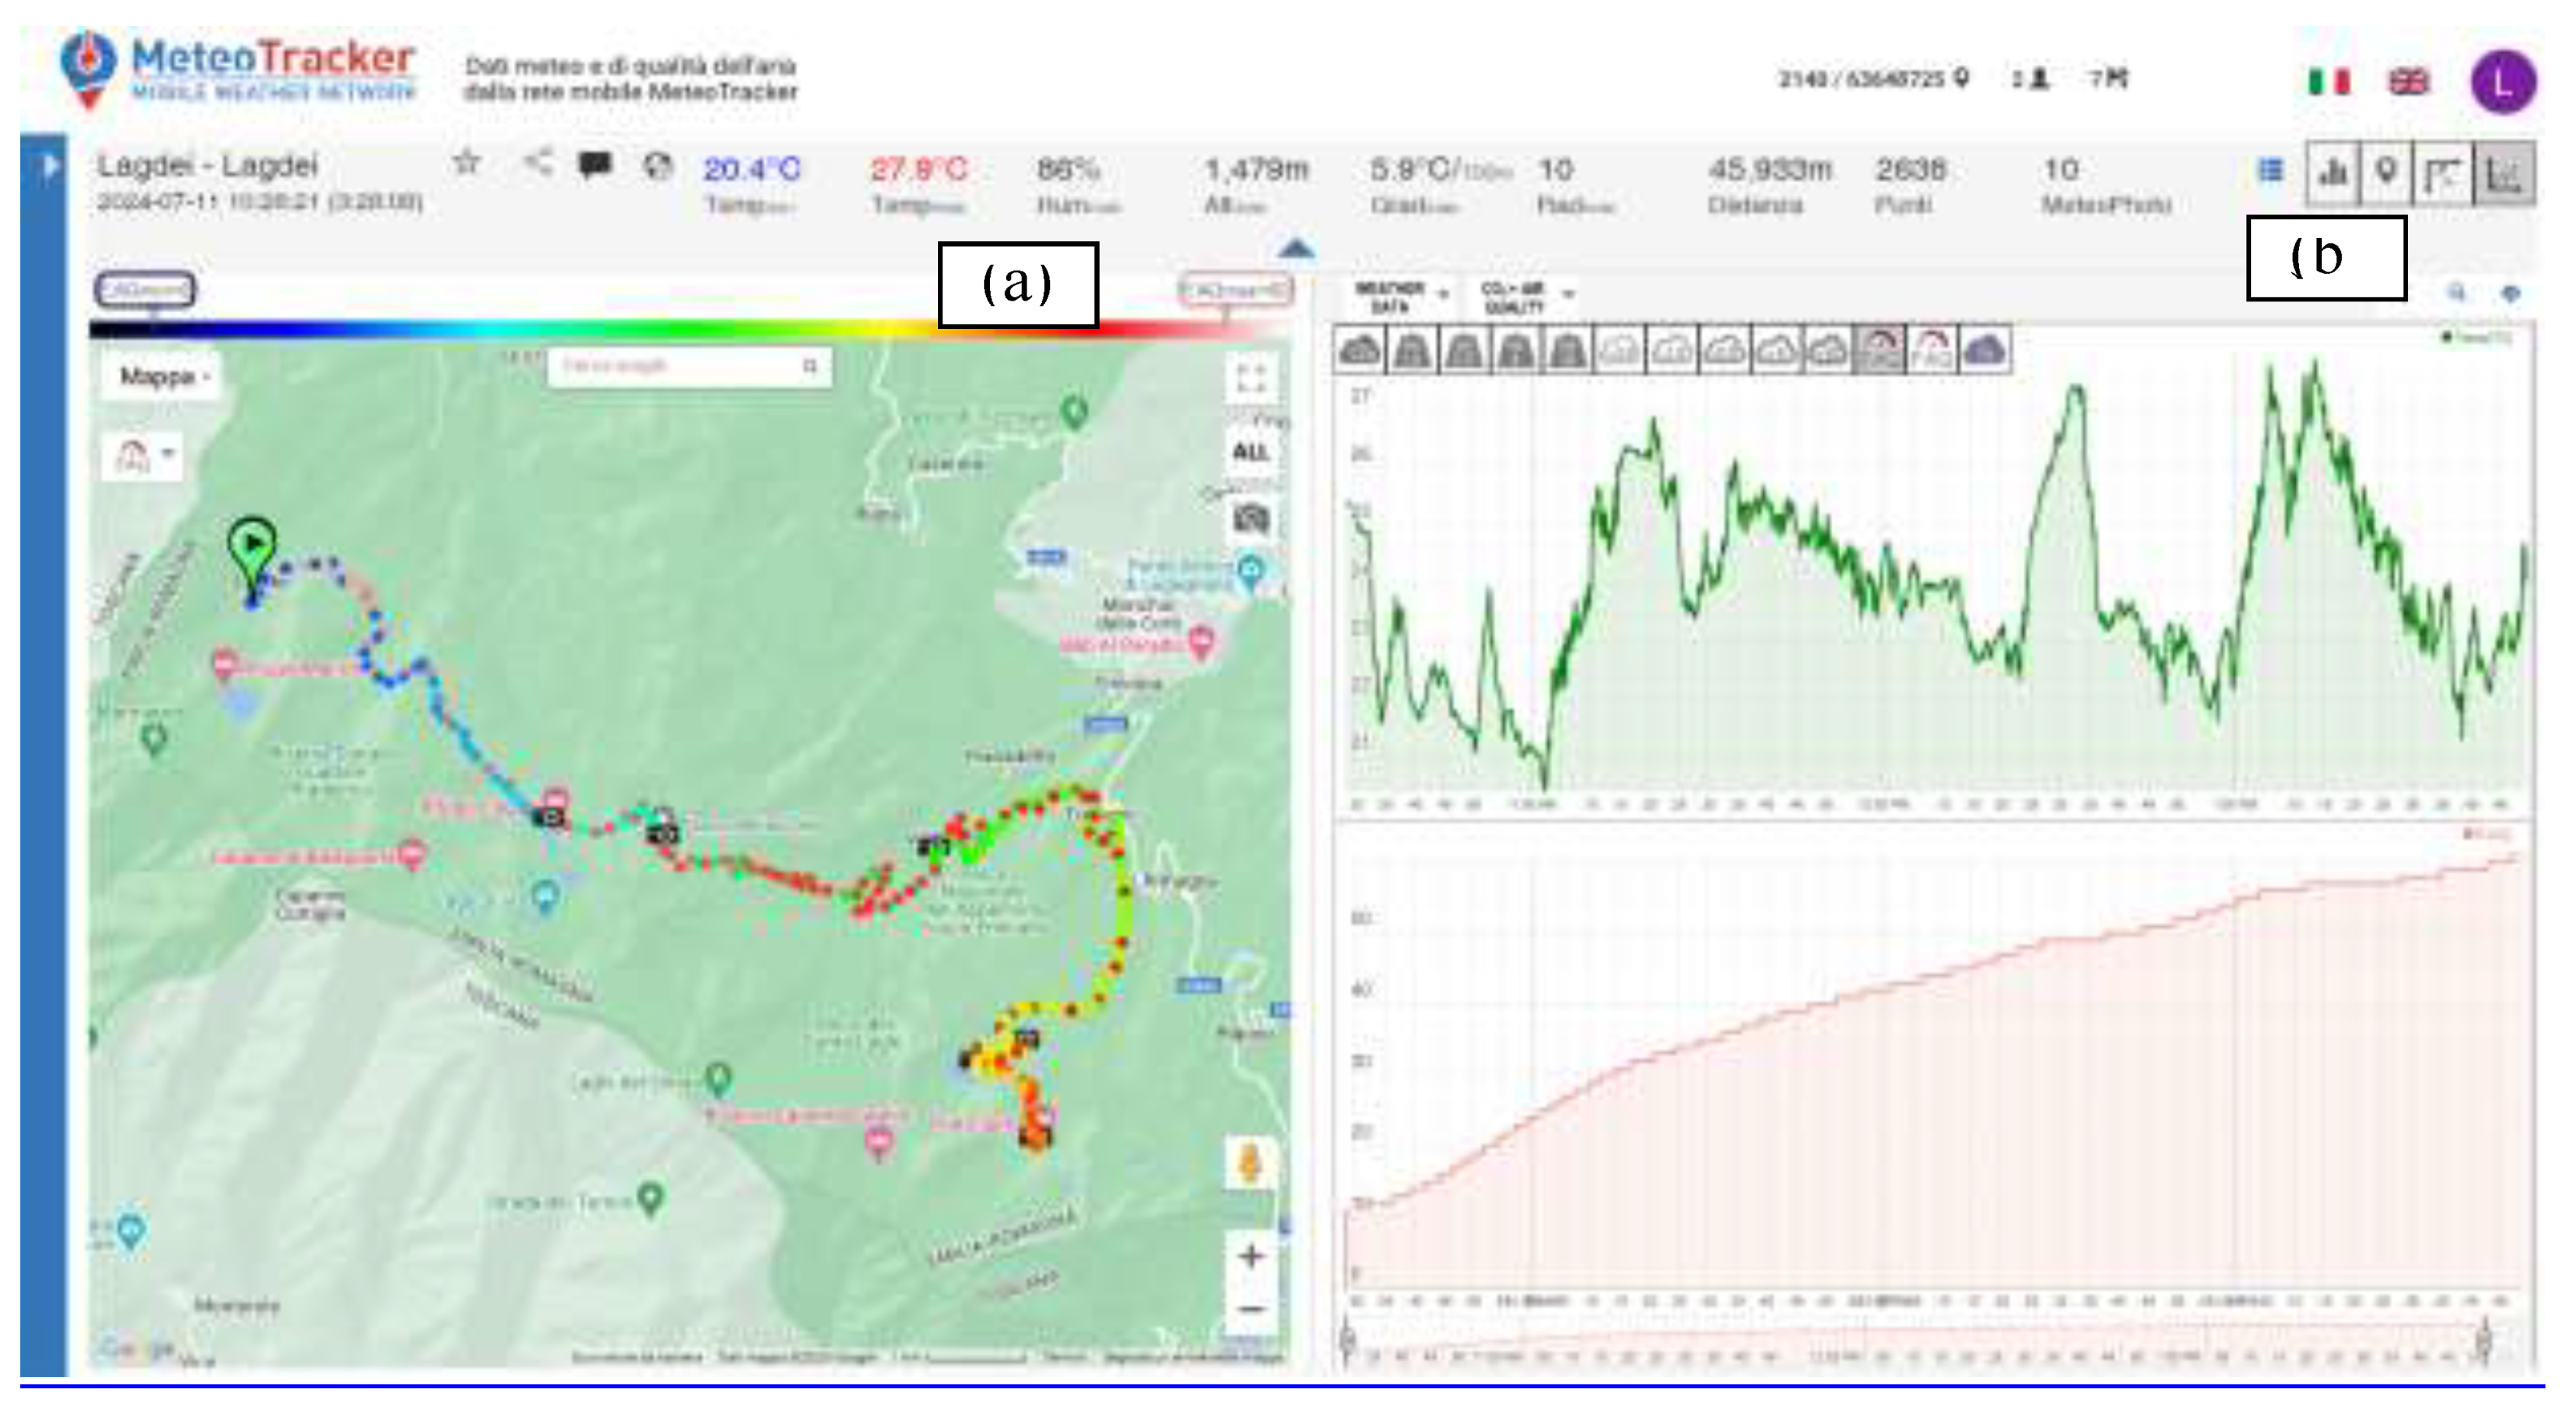

Table 1.
Reference limits for pollutants Legislative Decree 155/2010 [22].
Table 1.
Reference limits for pollutants Legislative Decree 155/2010 [22].
| Reference limits for pollutants monitored | |||||
| Pollutant | Limit | Mediation period | Limit | Overruns in a year | |
| PM10 (µg/m3) | daily limit value | daily average | 50 µg/m3 | maximum 35 | |
| NO2 (µg/m3) | hourly limit value | hourly average | 200 µg/m3 | maximum 18 | |
| O3 (µg/m3) | information threshold | hourly average | 180 µg/m3 | ||
| alarm threshold | hourly average | 240 µg/m3 | |||
| target value | maximum of 8-hour moving averages | 120 µg/m3 | No more than 25 times/year as average over 3 years | ||
| CO (mg/m3) | limit value | maximum of 8-hour moving averages | 10 mg/m3 | ||
| SO2 (µg/m3) | daily limit value | daily average | 125 µg/m3 | maximum 3 | |
| PM2.5 (µg/m3) | limit value on annual basis | daily average | 25 µg/m3 | ||
| Benzene (µg/m3) | limit value on annual basis | daily average | 5 µg/m3 | ||
Table 2.
Values of polluting parameters detected at the ARPAE measuring station in Parma province. An ozone value above the norm is highlighted in yellow. Source: ARPAE [10].
Table 2.
Values of polluting parameters detected at the ARPAE measuring station in Parma province. An ozone value above the norm is highlighted in yellow. Source: ARPAE [10].
| Data and statistical processing | |||||||||
| Prov | Station / station type | PM10 daily average (µg/m3) | PM2.5 daily average (µg/m3) | NO2 max hourly average (µg/m3) |
O3 max hourly average (µg/m3) |
O3 max 8-hour moving average (µg/m3) |
Benzene daily average (µg/m3) |
CO max 8-hour moving average (µg/m3) |
SO2 daily average (µg/m3) |
| PR | Langhirano – Badia / rural background | 19 | 7 | < 8 | 113 | 107 | |||
| PR | Colorno – Saragat / suburban background | 22 | 12 | 21 | 127 | 117 | |||
| PR | Parma –Citadella / urban background | 18 | 7 | 17 | 123 | 123 | |||
| PR | Parma – Montebello / urbana traffic | 22 | 34 | 0.3 | |||||
Disclaimer/Publisher’s Note: The statements, opinions and data contained in all publications are solely those of the individual author(s) and contributor(s) and not of MDPI and/or the editor(s). MDPI and/or the editor(s) disclaim responsibility for any injury to people or property resulting from any ideas, methods, instructions or products referred to in the content. |
© 2024 by the authors. Licensee MDPI, Basel, Switzerland. This article is an open access article distributed under the terms and conditions of the Creative Commons Attribution (CC BY) license (https://creativecommons.org/licenses/by/4.0/).
Copyright: This open access article is published under a Creative Commons CC BY 4.0 license, which permit the free download, distribution, and reuse, provided that the author and preprint are cited in any reuse.


